influence of turbulence on wind turbine power curves · 1 influence of turbulence on wind turbine...
TRANSCRIPT

1
Influence of turbulence on wind turbine
power curves
-Experimental evaluation of IEC 61400-12-1 CD1 Annex M
Lars Morten Bardal
Department of Energy and Process Engineering
Norwegian University of Science and Technology
24.01.2017

2
Outline
• Background
• Measurement site and methods
• Results
• Summary and conclusion

3
Turbulence influence on a power curve
• Time averaging of non-linear function
• Direct aerodynamic influence on rotor
performance

4

5
Standards for performance testing of wind turbines
• IEC 61400-12-1 1.ed (2005)
– Site dependent
• Wind shear
• Wind veer
• Turbulence intensity
– 10 minute averaging period
• IEC 61400-12-1 2.ed (exp. Feb 2017)
– Equivalent wind speed addresses wind shear and veer
– Remote sensing wind speed measurement
– Zero turbulence power curve normalization addresses turbulence and time averaging

6
Zero turbulence power curve

7
Valsneset wind turbine test site

8
Valsneset wind turbine test site

9
Valsneset wind turbine test site
10
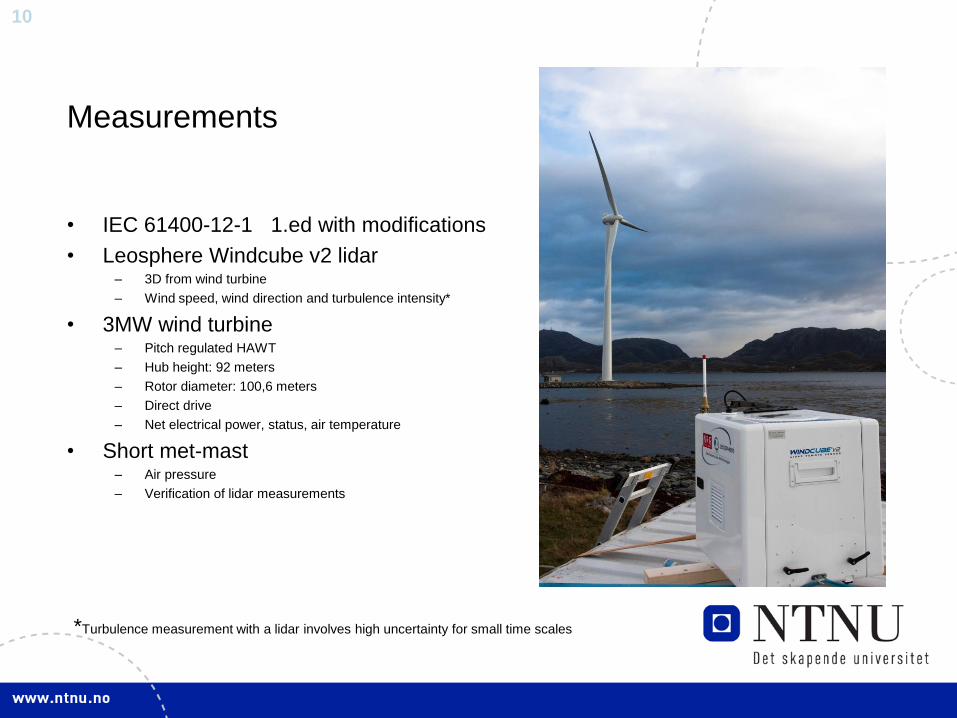
Measurements
• IEC 61400-12-1 1.ed with modifications
• Leosphere Windcube v2 lidar– 3D from wind turbine
– Wind speed, wind direction and turbulence intensity*
• 3MW wind turbine– Pitch regulated HAWT
– Hub height: 92 meters
– Rotor diameter: 100,6 meters
– Direct drive
– Net electrical power, status, air temperature
• Short met-mast– Air pressure
– Verification of lidar measurements
*Turbulence measurement with a lidar involves high uncertainty for small time scales

11
Valsneset wind turbine test site
12
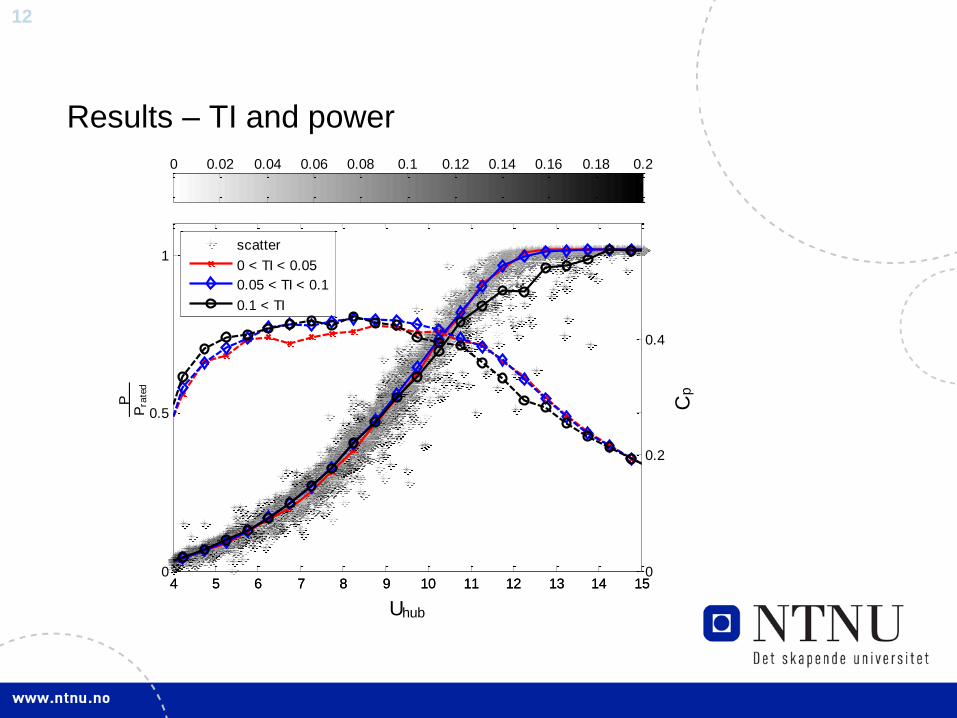
4 5 6 7 8 9 10 11 12 13 14 150
0.5
1
Uhub
PP
rate
d
0 0.02 0.04 0.06 0.08 0.1 0.12 0.14 0.16 0.18 0.2
scatter
0 < TI < 0.05
0.05 < TI < 0.1
0.1 < TI
4 5 6 7 8 9 10 11 12 13 14 150
0.2
0.4
Cp
Results – TI and power
13
4 6 8 10 12 140
0.2
0.4
0.6
0.8
1
Wind speed
PP
rate
d
training dataset
test dataset
simulated power
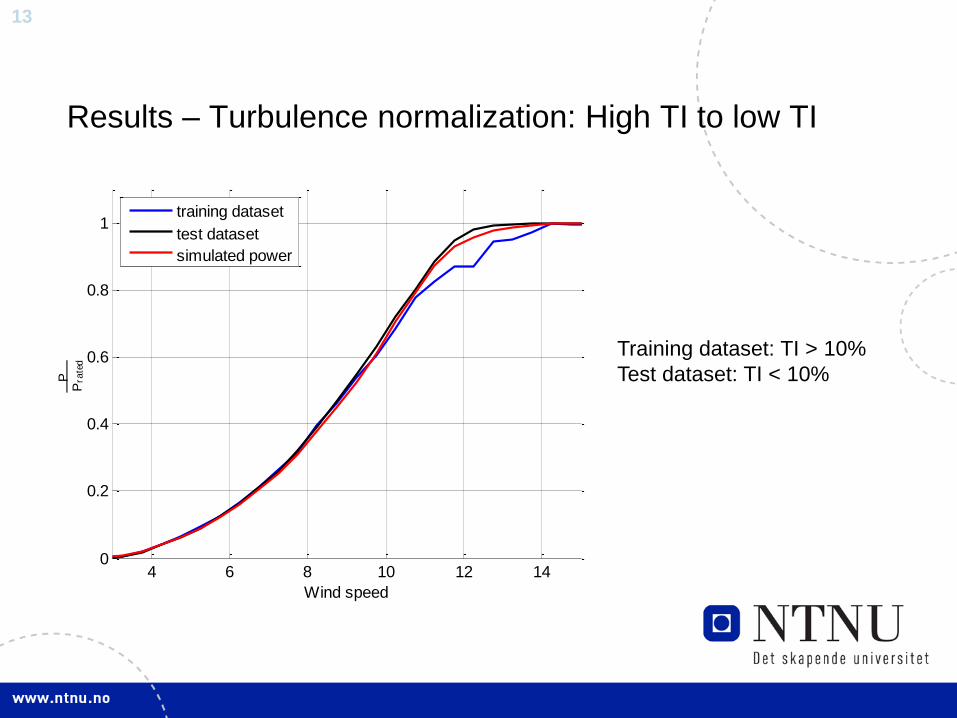
Results – Turbulence normalization: High TI to low TI
Training dataset: TI > 10%
Test dataset: TI < 10%
14
4 6 8 10 12 140
0.2
0.4
0.6
0.8
1
Wind speed
PP
rate
d
training dataset
test dataset
simulated power
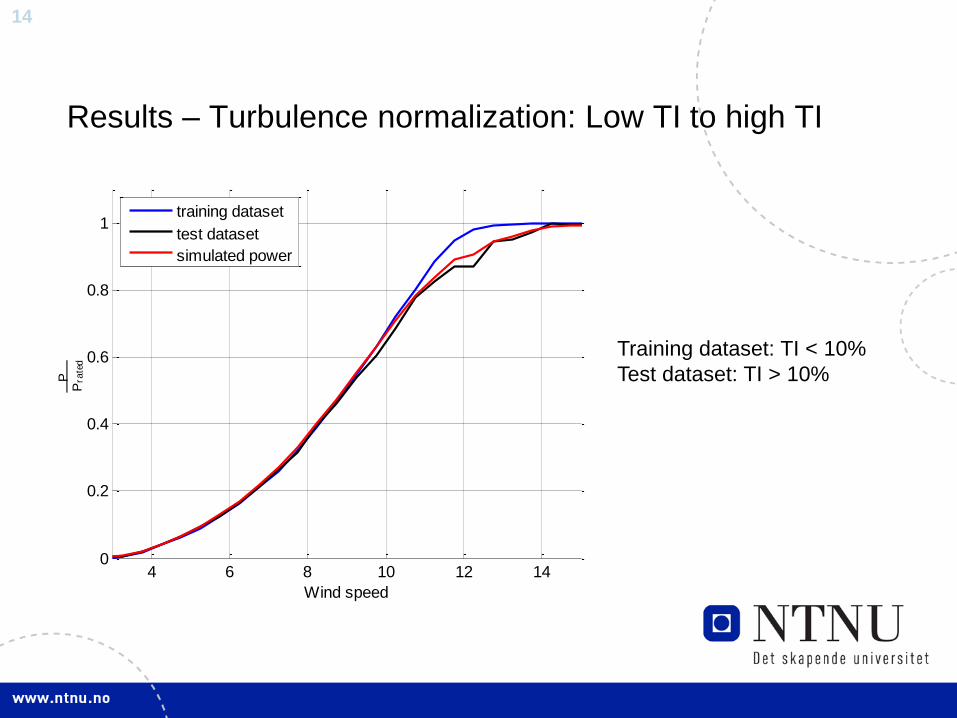
Results – Turbulence normalization: Low TI to high TI
Training dataset: TI < 10%
Test dataset: TI > 10%

15
Results – Influence on AEP
TI low->high TI high ->low
AEP training data [MWh] 11774 11490
AEP test data [MWh] 11490 11774
AEP simulated [MWh] 11652 11619
AEP difference reduced by ~ 50%ΔAEP ~ 2.5%

16
Summary & Conclusion
• Time averaging and turbulence causes a bias in the measured power curve
depending on the curvature of the power curve and wind speed variance
• Using the zero turbulence power curve AEP difference between different
datasets was reduced by ~50%. This in accordance to the estimate in the
IEC standard
• Ground based lidar turbulence measurements involves increased
uncertainty and scatter

17
Questions or
comments?