infographics for the social sector
TRANSCRIPT

Infographics for the Social Sector
ASAE MMC Conf.

Why Infographics?
http://neomam.com/interactive/13reasons/ a great source of info!

Benefits for Users

We are visually wired?
Almost 50% of your brain is involved in visual processing
70% of all your sensory receptors are in your eye
We get the sense of a visual scene in 1/10 of a second
Merieb, E. N. & Hoehn, K. (2007). Human Anatomy & Physiology 7th Edition, Pearson International Edition. Thorpe, S., Fize, D. & Marlot, C. (1996). Speed of processing in the human visual system, Nature, Vol 381
It only takes 150ms for a symbol to be processed + 100ms to attach a meaning to it

We are in an age of data overload

We receive 5x as much information today as we did in 1986
On average users only read 28% of words per visit.
Big Data = Big Distraction
Alleyne, R. (11 Feb 2011). Welcome to the information age – 174 newspapers a day. The Telegraph. Nielsen, J. (2008). How Little Do Users Read?

Infographics are a counterbalance to this data overload

Researchers found that color visuals increase the willingness to read by 80%.
More Engaging
Green, R. (1989). The Persuasive Properties of Color, Marketing Communications
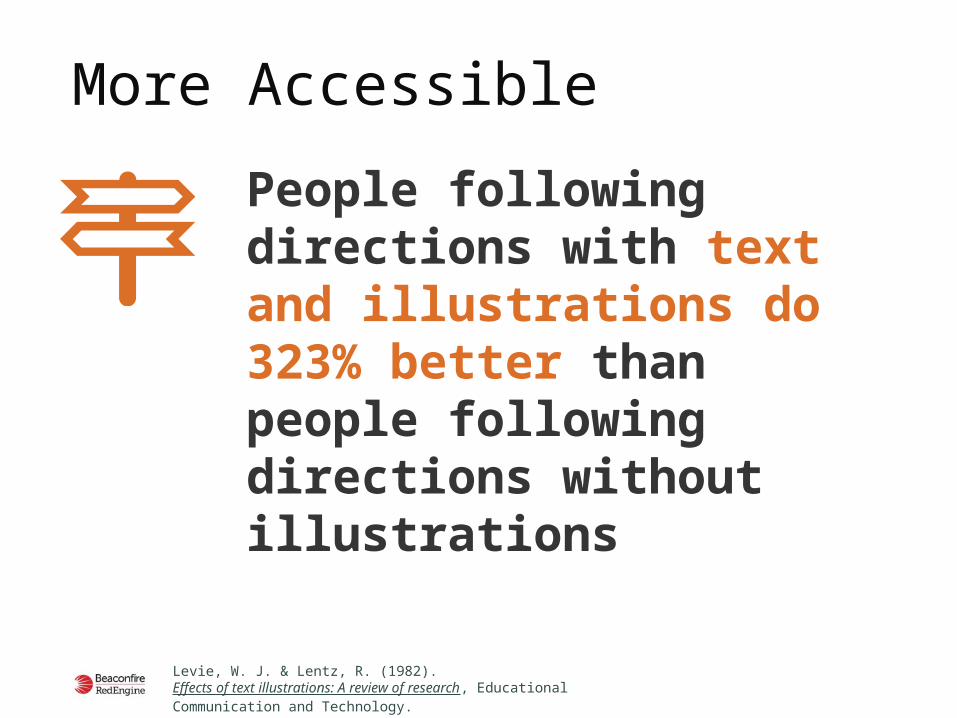
People following directions with text and illustrations do 323% better than people following directions without illustrations
More Accessible
Levie, W. J. & Lentz, R. (1982). Effects of text illustrations: A review of research, Educational Communication and Technology.

50% of an audience is persuaded by a purely verbal presentation
67% of an audience is persuaded by the verbal presentation that had accompanying visuals
More Persuasive
Wharton School of Business. ‘Effectiveness of Visual Language’

People remember
10% of what they hear,
20% of what they read and
80% of what they SEE and DO.
More Recall
Lester, P. M. (2006). Syntactic Theory of Visual Communication. - See more at: http://neomam.com/interactive/13reasons/#sthash.7BMWULpr.dpuf

Benefits for You Think SEO

An infographic benefits an SEO campaign because, when done well, it will be shared and build your link portfolio.
Its about inbound links

A few examples

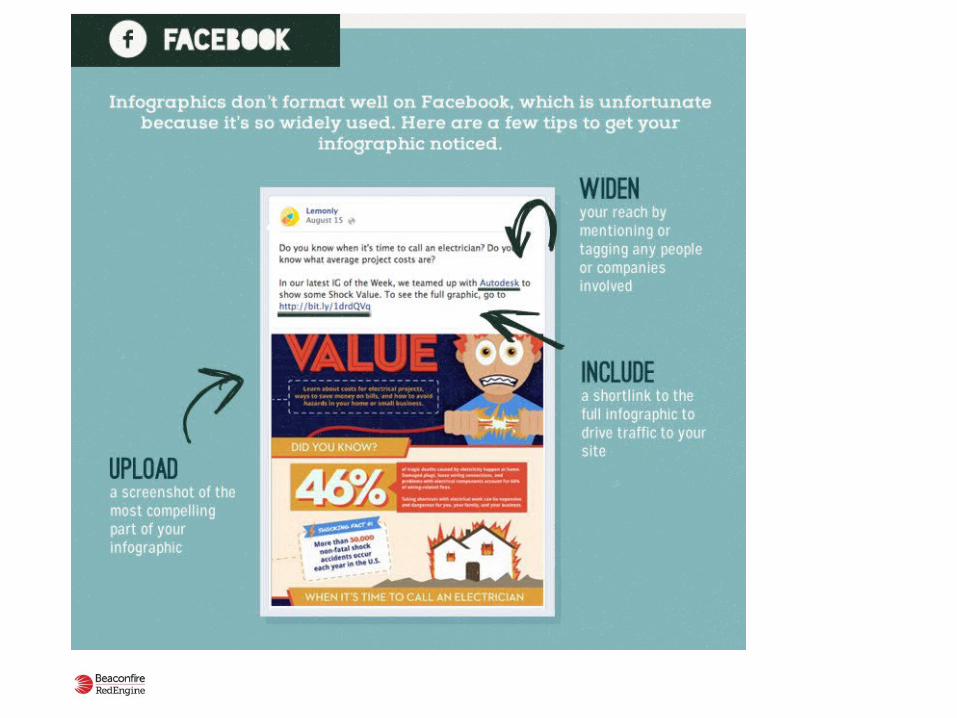
Social Media Best Practices for Sharing Infographics
http://lemonly.com/wp-content/uploads/2013/09/Sharing-Infographic-Online-Best-Practices-1.jpg

Your Brain on Beer vs. Coffee
http://en.ilovecoffee.jp/posts/view/79

Travel Hacks
http://www.besthospitalitydegrees.com/travel-hacks/

Some Great Tips
• Add a transcript of the infographic for SEO and accessibility
• Have a thumbnail for ease of sharing on various social media
• Give the user something “next” to do. Don’t let this page be a dead end

A simple approach
to infographics

Act I: SetupAct II: ConfrontationAct III: Resolution
The 3 Act Play

Lets make one…

Thank You Questions?