information and communication technology for agriculture ... · agriculture in the country. we hope...
TRANSCRIPT
ASIAN DEVELOPMENT BANK
ideal
INFORMATION AND COMMUNICATION TECHNOLOGY FOR AGRICULTURE IN THE PEOPLE’S REPUBLIC OF CHINA
NOVEMBER 2019

ASIAN DEVELOPMENT BANK
INFORMATION AND COMMUNICATION TECHNOLOGY FOR AGRICULTURE IN THE PEOPLE’S REPUBLIC OF CHINA
NOVEMBER 2019

Creative Commons Attribution 3.0 IGO license (CC BY 3.0 IGO)
© 2019 Asian Development Bank6 ADB Avenue, Mandaluyong City, 1550 Metro Manila, PhilippinesTel +63 2 632 4444; Fax +63 2 636 2444www.adb.org
Some rights reserved. Published in 2019.
ISBN 978-92-9261-826-1 (print), 978-92-9261-827-8 (electronic)Publication Stock No. TCS190500-2DOI: http://dx.doi.org/10.22617/TCS190500-2
The views expressed in this publication are those of the authors and do not necessarily reflect the views and policies of the Asian Development Bank (ADB) or its Board of Governors or the governments they represent.
ADB does not guarantee the accuracy of the data included in this publication and accepts no responsibility for any consequence of their use. The mention of specific companies or products of manufacturers does not imply that they are endorsed or recommended by ADB in preference to others of a similar nature that are not mentioned.
By making any designation of or reference to a particular territory or geographic area, or by using the term “country” in this document, ADB does not intend to make any judgments as to the legal or other status of any territory or area.
This work is available under the Creative Commons Attribution 3.0 IGO license (CC BY 3.0 IGO) https://creativecommons.org/licenses/by/3.0/igo/. By using the content of this publication, you agree to be bound by the terms of this license. For attribution, translations, adaptations, and permissions, please read the provisions and terms of use at https://www.adb.org/terms-use#openaccess.
This CC license does not apply to non-ADB copyright materials in this publication. If the material is attributed to another source, please contact the copyright owner or publisher of that source for permission to reproduce it. ADB cannot be held liable for any claims that arise as a result of your use of the material.
Please contact [email protected] if you have questions or comments with respect to content, or if you wish to obtain copyright permission for your intended use that does not fall within these terms, or for permission to use the ADB logo.
Corrigenda to ADB publications may be found at http://www.adb.org/publications/corrigenda.
Notes: In this publication, “$” refers to United States dollars.
ADB recognizes "China" as the People's Republic of China.
Cover design by Michelle Willa Ortiz.

iii
Contents
Tables, Figures, and Map v
Foreword vii
Acknowledgments ix
Executive Summary xii
Chapter 1. Introduction 1
Chapter 2. Applications and Policies of Information and Communication 3 Technology in the People's Republic of China 2.1. Application of Information and Communication Technology 32.2. Supporting Policies 6
Chapter 3. Major Applications of Information and Communication 9 Technology in Marketing and Agriculture in Rural Areas 3.1. Taobao Villages 93.2. Operating Modes of E-Commerce in Rural Areas 123.3. Application of Drones in Agriculture 13
Chapter 4. Access to Information and Communication Technology 15 Infrastructure Based on Survey Data 4.1. Sampling Approach and Data 154.2. Infrastructure at the Village Level 184.3. Access to and Use of Information and Communication Technology 19 by Individuals 4.4. The Use of Information and Communication Technologies by 27 Different Village Conditions 4.5. The Operation of E-Commerce in Selling Agricultural Products 40
Chapter 5. Uses of Information and Communication Technologies 43 in Agriculture and E-Commerce Based on Survey Data 5.1. Marketing Products 435.2. Purchasing Agricultural Inputs 445.3. Custom Services Related to Agricultural Production 46

Contentsiv
Chapter 6. Major Factors Affecting Applications of Information 48 and Communication Technology in Agriculture 6.1. Major Factors at Village Level 486.2. Major Factors at Household Level 496.3. Major Factors at Individual Level 526.4. The Barriers and Drivers of E-Commerce Development in 54 Rural Areas of the People’s Republic of China
Chapter 7. Likely Impacts of Applications of Information 57 and Communication Technology in Agriculture 7.1. Income and Employment 577.2. Differences in Selling Prices, Marketing Costs, and Price Margins 57
Chapter 8. Investment in Information and Communication Technology 61 in Agriculture and Rural E-Commerce 8.1. Investment by Households on Fixed Assets 618.2. Investment by Households for Variable Assets 63
Chapter 9. Conclusion and Policy Implications 649.1. Summary 649.2. Major Policy Recommendations 66

v
Tables2.1 Number of Internet Users and Share of Smartphone Users in the 4 People’s Republic of China, 2007–2017 2.2 Frequency of Key Words in National Policy Documents Issued by the State 6 Council of the People’s Republic of China, 2006–2017 3.1 Number of Taobao Villages and Agricultural Taobao Villages, 2009–2017 104.1 Shares of Households Selling Agricultural Products and Selling through 16 E-Commerce and the Willingness to Sell Online, 2016 4.2 Villages and Households Operating E-Commerce, 2016 and 2017 174.3 Samples and Percentage of Households Operating E-Commerce and Their 18 Willingness to Sell Online in Zhejiang and Shandong, 2016–2017 4.4 Share of Rural Residents Aged 16 or Above with Mobile Phones and 20 Smartphones, 2016–2017 4.5 Shares of Decision Makers on Agricultural Production and Sales with 21 Mobile Phones and Smartphones, 2016–2017 4.6 Reasons of Decision Makers of Agricultural Production and Sales for 22 Not Using Smartphones, 2016 4.7 Reasons for Not Using E-Commerce by Decision Makers of Agricultural 23 Production and Sales, 2017 4.8 Reasons for Using Smartphones, 2016 (%) 244.9 Internet Use by Type of Device, 2016 254.10 Share of Respondents Acquiring Information on Agricultural Production 27 and Marketing 4.11 Share of Mobile Phone Owners by Village Conditions, 2016 284.12 Share of Smartphone Owners by Village Conditions, 2016 304.13 Purpose for Using Smartphones by Village Condition, 2016 314.14 Reasons of Decision Makers on Agricultural Production and Sales for 33 Not Using Smartphones by Village Conditions, 2016 4.15 Reasons of Decision Makers on Agricultural Production and Sales for 35 Not Using E-Commerce, 2016 4.16 Share of Farmers Using Desktop and Laptop by Village Conditions, 2016 364.17 Share of Respondents Learning Information on Production and 38 Marketing through the Internet by Village Conditions, 2016 4.18 Percentage of Online Sales and Shares in Different Classes of Produce, 2015–2017 404.19 Percentage of Online Sales and the Platforms Used, 2013-2017 414.20 Percentage of Online Sales and the Types of Platforms Used, 2013–2017 425.1 Percentages of Rural Households Selling Their Products and Their 43 Attitudes Toward Operating E-Commerce, 2016 (%) 5.2 Reasons for Being Willing to Operate E-Commerce by 44 Agricultural Products, 2016
Tables, Figures, and Map

Tables, Figures, and Mapvi
5.3 Reasons for Being Unwilling to Operate E-Commerce by 44 Agricultural Products, 2016 5.4 Attitudes Toward Purchasing Agricultural Inputs by Households, 2016 (%) 455.5 Reasons for Being Willing to Buy Agricultural Inputs Online, 2016 (%) 455.6 Reasons for Being Unwilling to Buy Agricultural Inputs Online, 2016 465.7 Willingness to Buy Custom Services over the Internet for Agricultural 47 Production, 2016 (%) 6.1 Differences in Village Conditions between E-Commercial and 48 Non-E-Commercial Villages 6.2 Comparing Household Conditions between Households With and 49 Without Online Sales 6.3 Comparing the Information Awareness of Households With and 51 Without Online Sales 6.4 Comparing the Heads of Households With and Without Online Sales 526.5 Comparing Smartphone Usage Among Households With and 53 Without Online Sales 6.6 Major Barriers to Operating E-Commerce for E-Commercial 54 Households, 2017 6.7 Major Reasons for Not Operating E-Commerce, 2017 547.1 Comparison of Household Average per Capita Income and Labor 57 Employment between E-Commercial and Non-E-Commercial Villages 7.2 Online and Offline Selling Prices (CNY/kg) 587.3 Online and Offline Marketing Costs (CNY/kg) 597.4 Comparing Price Margins of Online and Offline Sales, 60 by Commodity (CNY/kg) 8.1 Percentage of Households that Invested in Fixed Assets, 61 by Different Provinces and E-Commercial Mode 8.2 Average Annual Fixed Costs per Household, by Province and 62 E-Commercial Mode (CNY ’000) 8.3 Fixed Assets on Internet and Transportation Owned by 62 E-Commercial Households 8.4 Average Annual Variable Costs per Household, by Province and 63 E-Commercial Mode (CNY ’000)
Figures2.1 Internet Adoption Rate in the People’s Republic of China, 2007-2017 (%) 32.2 Internet Penetration per Province in the People’s Republic of China, 4 2007–2016 (%) 2.3 Figure 2.3: Growth of Internet Adoption in the People’s Republic of China, 5 2007–2016 (%) 2.4 Main Content of National Policies and Official Documents on E-Commerce 7 Development in Rural Areas of the People’s Republic of China, 2006–2017 4.1 Development of Information and Communication Technology Infrastructure 18 in Rural Areas of the People’s Republic of China, 1990–2016 (%)
Map3.1 Spatial Distribution 11

vii
The People’s Republic of China (PRC) is the most populous country in the world. Therefore, developments in its agricultural sector can impact the global food security
situation. The PRC has succeeded in feeding about a fifth of the global population using less than 10% of the world’s arable land. In 2018, the PRC ranked 46th out of 113 countries in the Global Food Security Index survey published by The Economist Intelligence Unit. However, the low arable land per capita and other factors threaten global food security as well as that of the PRC. The PRC has to optimize its production per unit of land using modern technology. ADB and the International Food Policy Research Institute (IFPRI), under the ADB-funded knowledge sharing technical assistance project Investment Assessment and Application of High-Level Technology for Food Security in Asia and the Pacific (KSTA 9218), analyzed how to promote the use of technology and knowledge-intensive agriculture.
Use of information and communication technology (ICT) has increased rapidly in recent years, influencing business development in most countries in the world, including emerging economies. The PRC has been one of the fastest growing economies, exhibiting the rapid expansion of ICT applications over the last decade. E-commerce has particularly flourished in the PRC in recent years. The analysis presented in this report assessed the current situation, growth, and potential of ICT in agriculture in rural areas of the PRC. It also provides policy recommendations to realize the potential of e-commerce and ICT in agriculture in the country.
We hope that this publication provides insights to mobilize investments and undertake policy measures to promote the use of ICT in agriculture in rural areas of the PRC. The findings will also be useful to complement the ongoing initiatives for rural revitalization of the Government of the PRC and serve as a basis to forge effective partnerships and collaborations among stakeholders to ensure reliable supply of affordable and safe food for the PRC and the world.
Woochong UmDirector GeneralSustainable Development and Climate Change DepartmentAsian Development Bank
Foreword
Shenggen Fan Director GeneralInternational Food Policy Research Institute

viii
This report was prepared under the Asian Development Bank (ADB) knowledge support technical assistance project (KSTA 9218) Investment Assessment and Application
of High-Level Technology for Food Security in Asia and the Pacific, implemented by the Rural Development and Food Security Thematic Group, Sustainable Development and Climate Change Department (SDCC). Md. Abul Basher, Natural Resources and Agriculture Specialist, SDCC, led the implementation of the project, under the direction of Woochong Um, Director General, SDCC; Amy Leung, Director General, East Asia Department, in her former capacity as SDCC director general; and Chiara Bronchi, Chief Thematic Officer, SDCC, with the supervision of Akmal Siddiq, Chief, Rural Development and Food Security Thematic Group, SDCC, and Mahfuz Ahmed, former Technical Advisor, Rural Development and Food Security Thematic Group, SDCC (now retired). Other members of the implementation team include Leah P. Arboleda, Natural Resources and Agriculture Officer, SDCC; and Maria Angela Pilar M. Banaria, Senior Operation Assistant, SDCC.
The implementation team benefited from the comments and suggestions from several other ADB staff throughout the implementation of the project: Qingfeng Zhang, Director, Environment, Natural Resources and Agriculture Division, EARD; Jan Hinrichs, Senior Natural Resources Economist, EARD; and Xin Shen, Senior Project Officer (Natural Resources and Agriculture), People's Republic of China Resident Mission.
The report is an outcome of the collaboration among ADB, the International Food Policy Research Institute (IFPRI), and the China Center for Agricultural Policy (CCAP), Peking University. Jikun Huang, Director of CCAP and new rural development in Peking University, and vice-president, Jiangxi Agricultural University, led the production of this report. The following members of the country research team from CCAP provided additional research: Min Liu, postdoctoral fellow; Jinxia Wang, Professor; Huayong Zhi, senior research assistant; Song Gao, Master’s degree candidate; Huiming Wang, doctorate degree candidate; Shi Min, postdoctoral fellow; and Pengfei Shi, Doctor of Philosophy candidate. Technical assistance from Rowena A. Valmonte-Santos, Senior Research Analyst, and editorial assistance from Lorena Danessi, Administrative and Project Monitoring Coordinator, Environment and Production Technology Division (EPTD), IFPRI is acknowledged. Mark W. Rosegrant, then Director, EPTD, and currently Research Fellow Emeritus, IFPRI coordinated the study.
The research team benefited from an iterative consultation process that included comments regarding the draft final results that were presented in the policy forum Application of Information and Communication Technologies in the Agriculture Sector of Rural China in May 2019 in Beijing. Lubiao Zhang, Director General, Agricultural Trade
Acknowledgments

Acknowledgments ix
Promotion Center, Ministry of Agriculture and Rural Affairs (MARA); Wensheng Wang, Deputy Director General, MARA; Chongjun Tan, Deputy Dean, AliResearch Institute, Alibaba Group; and Kevin Chen, Head of East Asia and Central Asia Office, IFPRI, provided invaluable comments and technical advice on the draft report. Finally, we would like to express our sincere gratitude to the farmers who voluntarily participated in the survey and provided information on different aspects of use of ICT in agriculture in rural areas of People's Republic of China.

x
Executive Summary
Information and communication technology (ICT) has developed and been adopted rapidly in recent years, influencing business development in the People’s Republic of
China (PRC). Despite the rapid expansion in ICT application, there are few studies on the status of ICT application and its impacts on the rural economy. This study aims to fill part of the gap by documenting the trends in major applications of ICT, identifying the enabling factors and the major constraints in adopting ICT, examining their likely impacts, and generating policy implications for further development of ICT in the rural PRC. Because ICT application covers wide areas of the rural economy, this study focuses on rural e-commerce and its impacts on farmers.
A review of ICT application in the PRC shows its most rapid expansion occurred in the past decade, beginning 2007. The number of internet users increased from 210 million (a 16% adoption rate) in 2007 to 772 million (56%) in 2017. Mobile phone subscriptions also increased from 50 million in 2007 to 753 million in 2017. The more rapid growth is occurring in e-commerce. The value of online sales in the PRC (1,885 billion yuan) surpassed that of the United States in 2013. By 2016, online sales reached 5,328.8 billion yuan, accounting for about 15% of the country’s total retail value for that year. The PRC is now the largest market for e-commerce in the world.
However, internet penetration and e-commerce are not evenly distributed throughout the country. The coastal and more developed provinces have higher rates of internet penetration than other provinces. Expectedly, e-commerce is more developed in the urban rather than rural areas.
To facilitate ICT application in general and e-commerce development in particular in the rural PRC, the government has invested significantly in ICT infrastructure in the rural areas, and provided financial and capacity building support to local people and enterprises to develop rural e-commerce. Taobao villages, one type of e-commerce village, is an interesting case worth mentioning. Although it still accounts for only a small part of the PRC’s 672,000 villages, taobao villages have increased rapidly from 3 in 2009 to 2,118 in 2017. Like other e-commerce businesses, most taobao villages are located in the coastal provinces.
The study assessed the uses of ICT and development of e-commerce in the rural PRC using data from two survey rounds conducted by the China Center for Agricultural Policy (CCAP) covering 1,128 households. The CCAP survey is a nationally representative survey in seven provinces across the PRC. In the first-round survey, face-to-face interviews were

Executive Summary xi
conducted in early 2017. The second-round survey was conducted in January 2018 through telephone interviews.
The survey data confirm the significant improvement in rural ICT infrastructure, logistic services, and uses of mobile phones by farmers. In 2017, all villages had access to mobile phone services and about 70% also had access to the internet. More than half of the villages are within 5 kilometers (km) of a national highway. The average distances to the nearest provincial highway and county paved road are 7.5 km and 3.4 km, respectively. In addition to the public postal services, more than one-fourth of villages have package delivery services by private firms. For other villages, the average distance to a package collection or distribution point is 4.5 km. Many farmers have a smartphone and use it extensively. Nearly 90% of adults had a cellphone, with 71% having a smartphone. The major functions of smartphones are for social networking, news, video watching, shopping, and payments.
The surveys also show that agricultural e-commerce is still a new business for farmers, but many farmers are willing to engage in online selling. The proportion of surveyed villages with some farmers engaged in agricultural e-commerce increased from 41% in 2016 to 63% in 2017. However, only 3% of the farmers in the surveyed villages in 2016 were actually engaged in e-commerce, although more than 25% of the farmers were willing to sell their agricultural products through e-commerce. For those not willing to sell online, their main reason was the lack of computer knowledge and skills, storage and preservation facilities, high logistical costs, and required marketing skills.
For agricultural inputs, while online buying rarely occurred, nearly one-fifth of farmers are also willing to buy inputs through the internet. The two major advantages farmers perceived from online purchasing are greater convenience and lower prices. Their main reasons for reluctance include lack of knowledge and skills, poor trust in online transactions, and high uncertainty about quality.
To better understand the impacts of rural e-commerce, this study also conducted an intensive household e-commerce survey in Shandong and Zhejiang, two booming provinces in rural e-commerce. This survey covered 250 households from 20 villages that had nearly 60% of surveyed households involved in e-commerce during 2016–2017. The results show that e-commerce raised farmer’s income and self-employment. The price of agricultural commodities sold online is much higher than products sold offline. Although the selling price of products online is generally higher compared to offline selling, farmers gain net profits through online sales. E-commerce also increased farmers’ self-employment as online selling is more labor-intensive.
Although the PRC made a significant progress in promoting use of ICTs in rural areas, the agricultural e-commerce made limited progress. Its expansion also faces several challenges. The most frequently mentioned challenge by farmers engaged in e-commerce is the storage and transportation of fresh agricultural products. Due to the limited availability of appropriate equipment, it is difficult to deliver agricultural products across long distances while preserving freshness. As a result, the products suitable for online sale are limited, and so is the range of potential buyers. The second biggest difficulty lies in marketing. Because of information asymmetry associated with

Executive Summaryxii
online transactions, which is more severe in agricultural products, the trust of buyers and hence their willingness to buy agricultural products online is still not high. The required investment at the beginning is also high, and usually prohibitive for small farms without external support. Even after successful start-up, meeting standards of customers is still challenging.
Based on the results of this study, several policies are recommended to facilitate application of rural ICT and e-commerce in the rural PRC. These include (i) investing in storage and transportation to support agricultural e-commerce; (ii) investing in farmers’ capacity building through practical training on how to undertake e-commerce; (iii) providing financial and credit support to farmers, particularly small farmers, who are engaged in the e-commerce business; (iv) facilitating farmer cooperation so farmers could work together in e-commerce ventures; (v) improving market regulations to provide a favorable market environment for the development of agricultural e-commerce; and (vi) promoting more inclusive e-commerce development in rural areas.
The development of e-commerce is not automatic, nor does it impact different people equally. Regions with better infrastructure and locations are more likely to benefit from e-commerce. Farmers with advanced and relevant knowledge and skills and other resources will benefit more from e-commerce. The government should pay attention to those who may not benefit that much from, or even be hurt by, the development of agricultural e-commerce. Only in this way can the government foster inclusive development in agricultural e-commerce.

1
Chapter 1Introduction
Information and communication technology (ICT) has been developing rapidly in recent years, affecting business development in most countries in the world, including emerging
economies. According to the International Telecommunication Union (ITU), there has been brisk growth in ICT uptake worldwide over the past decade, with an increase in all indicators (e.g., mobile phone subscriptions, internet access, mobile and fixed broadband subscriptions, etc.).1 Mobile phone subscriptions reached 6.8 billion by 2013—almost as many as the total global population. Nearly 70% of those in the bottom fifth of the population in developing countries had mobile phones by the end of 2015.2
Additionally, more than 40% of the global population has access to the internet. There are major initiatives under way to connect those still unconnected, mostly in rural areas in developing countries.3 The fast move from using mobile to broadband has also enabled the rapid development of numerous new information and communication channels, such as social media, portable cloud computing, big data, and smart terminals, which are undoubtedly shaping human life.4 Mobile phone subscriptions are not only changing people’s livelihood, transforming how data and information are collected, stored, analyzed, and shared, but also enabling new avenues of doing business online and offline in terms of buying, selling, marketing, and financial transactions.
ICT is expected to play a key role in rural development. In 1984, ITU proposed to eradicate poverty by developing a telecommunications infrastructure. In 2003, in the international congress of information and communication technology and poverty reduction, ICT was used to develop the concept of poverty alleviation. The two World Summit on the Infomation Society conferences held in 2003 and 2005 confirmed that information technology is the means to implement the Millennium Development Goals. A 2009 article argued that the application of ICT had greater effects on education, poverty reduction, and employment opportunities.5 E-commerce poverty alleviation can improve health, education and human capital, poverty reduction, gender equality, employment opportunity, and community information acquisition conditions. It is widely accepted that
1 ITU. 2013. Measuring the Information Society: International Telecommunication Union Annual Report. Geneva. https://www.itu.int/en/ITU-D/Statistics/Documents/publications/mis2013/MIS2013_without_Annex_4.pdf.
2 World Bank. 2016. World Development Report 2016: Digital Dividends. Washington, DC. https://www.worldbank.org/en/publication/wdr2016.
3 U. Deichmann, G. Aparajita, and M. Deepak. 2016. Will Digital Technologies Transform Agriculture in Developing Countries. World Bank Policy Research Working Paper. No. 7669. Washington, DC: World Bank. https://openknowledge.worldbank.org/handle/10986/24507?locale-attribute=fr.
4 Y. Luo, and J. Bu. 2016. How Valuable is Information and Communication Technology? A Study of Emerging Economy Enterprises. Journal of World Business. 51 (2). pp. 200–211.
5 Sumanjeet. 2009. Social Implications of Electronic Commerce. Journal of Social Sciences. 21 (2). pp. 91–97. November.

Application of Information and Communication Technology in the Agriculture Sector of Rural China2
the development of rural e-commerce is changing the rural economy and household livelihoods in rural areas of the People’s Republic of China (PRC), especially providing an economic advancement opportunity for the people who live in these remote areas.6 Poverty alleviation through the development of rural e-commerce has been supported by the government, many nongovernment organizations (NGOs), and international development agents.7
The PRC has been one of the fastest growing economies in the world, experiencing a rapid expansion of ICT applications over the last decade. The development of e-commerce has also flourished during this time. However, there are few if any quantitative studies on the status and trend of ICT applications in rural areas of the PRC. Based on both secondary and primary survey data, this research study presents the applications of ICT, especially the development of e-commerce in rural areas of the PRC during the last decade. It is noted that there are also emerging cases of online rural financing for agricultural production and agriculture extension services via mobile apps in the PRC, but this study does not cover these topics for the following reasons: (i) these topics were not identified as the focus of this project when the project started; (ii) based on the information collected from about 1,500 rural households in seven provinces in this study, any evidence of farmers using the apps for financing agricultural production have not been found; and (iii) most agriculture extension services via mobile apps are still under the pilot stage and none of these pilot projects were mentioned in the survey samples. Since online financing agriculture and agricultural extension services via mobile apps are interesting areas and may have potential important roles in agricultural production in the future, they merit further study.
6 G. Lin, X. Xie, and Z. Lv. 2016. Taobao Practices, Everyday Life and Emerging Hybrid Rurality in Contemporary China. Journal of Rural Studies. 47 (B). pp. 514–523.
7 X. Xiong et al. 2017. The Research on the Path of Poverty Alleviation of E-Commerce: A Case Study of Jing Dong. Journal of Simulation. 5 (2). pp. 73–79. http://www.journalofsimulation.com/archive/upload/Vol%205,%20No%202%20(2017)/Vol.5,%20No.2,%2073-80,%202017.pdf.

3
2.1. Application of Information and Communication TechnologyThe internet has been widely applied in the People’s Republic of China (PRC) in the past decade. The rate of internet adoption in the PRC increased from 16% in 2007 to 55.8% in 2017 (Figure 2.1). Figure 2.1 further shows that although the internet adoption rate in urban areas (71%) is higher than the rate in rural areas (35%) in 2017, both rose steadily in the past decade. With this significant increase in the internet penetration, e-commerce is booming in both the urban and rural areas of the PRC.
Figure 2.1: Internet Adoption Rate in the People’s Republic of China, 2007–2017 (%)
Urban
National
Rural
100
90
80
70
60
50
40
30
20
10
0
2007 2008 2009 2010 2011 2012 2013 2014 2015 2016 2017
Inte
rnet
pen
etra
tion
(%)
Source: Authors’ compilation based on annual reports of the China Internet Network Information Center..
Table 2.1 presents the trends of internet and smartphone users in the PRC. The number of internet users in the PRC almost quadrupled within a decade, from 210 million in 2007 to 772 million in 2017. The table further shows that while rural areas in the PRC started from a lower number of internet users, its growth rate has been higher than the rate in urban areas in the past decade. Compared with the estimated 72% increase of mobile phone subscriptions globally from 2009 to 2016, the PRC’s mobile phone subscriptions rose from 50.4 million in 2007 to 753 million in 2017. Mobile phone subscribers almost equaled the total number of internet users in the PRC in 2017.
Chapter 2 Applications and Policies of Informationand Communication Technologyin People's Republic of China
Information and Communication Technology for Agriculture in the People's Republic of China4
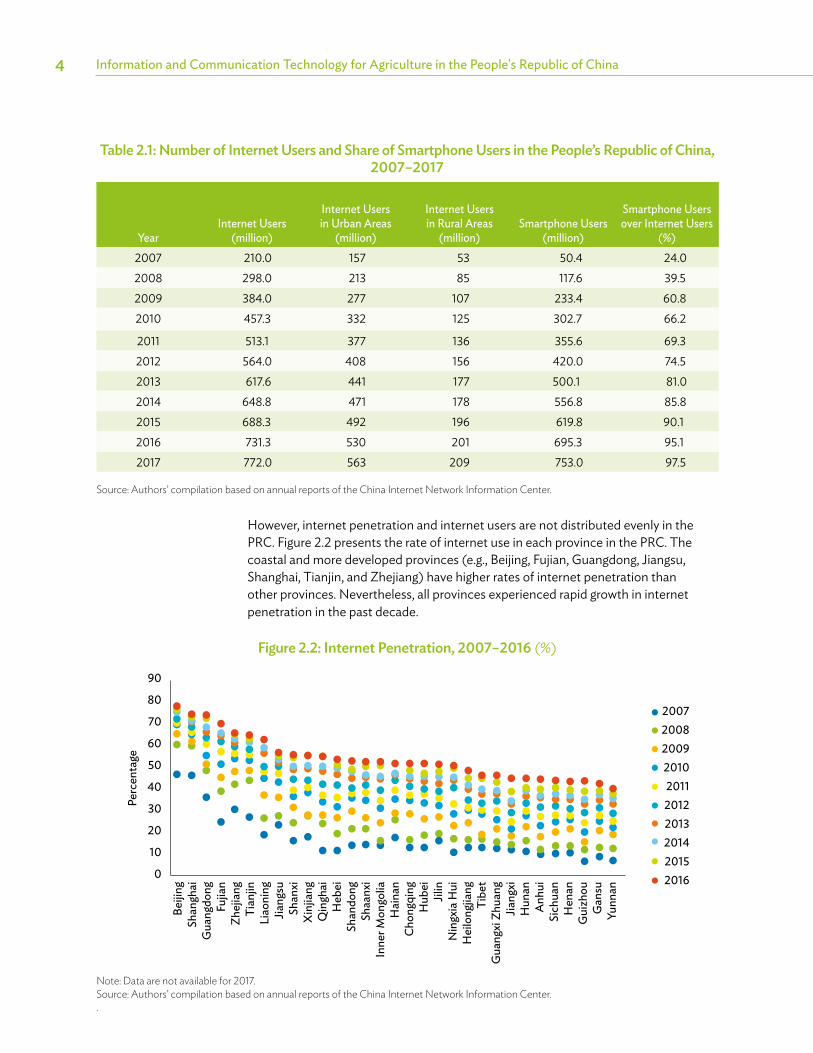
Table 2.1: Number of Internet Users and Share of Smartphone Users in the People’s Republic of China, 2007–2017
YearInternet Users
(million)
Internet Users in Urban Areas
(million)
Internet Users in Rural Areas
(million)Smartphone Users
(million)
Smartphone Users over Internet Users
(%)2007 210.0 157 53 50.4 24.02008 298.0 213 85 117.6 39.52009 384.0 277 107 233.4 60.82010 457.3 332 125 302.7 66.2
2011 513.1 377 136 355.6 69.32012 564.0 408 156 420.0 74.52013 617.6 441 177 500.1 81.02014 648.8 471 178 556.8 85.82015 688.3 492 196 619.8 90.12016 731.3 530 201 695.3 95.12017 772.0 563 209 753.0 97.5
Source: Authors’ compilation based on annual reports of the China Internet Network Information Center.
However, internet penetration and internet users are not distributed evenly in the PRC. Figure 2.2 presents the rate of internet use in each province in the PRC. The coastal and more developed provinces (e.g., Beijing, Fujian, Guangdong, Jiangsu, Shanghai, Tianjin, and Zhejiang) have higher rates of internet penetration than other provinces. Nevertheless, all provinces experienced rapid growth in internet penetration in the past decade.
Figure 2.2: Internet Penetration, 2007–2016 (%)
Note: Data are not available for 2017.Source: Authors’ compilation based on annual reports of the China Internet Network Information Center..
Beiji
ngSh
angh
aiG
uang
dong
Fujia
nZh
ejia
ngTi
anjin
Liao
ning
Jiang
suSh
anxi
Xin
jiang
Qin
ghai
Heb
eiSh
ando
ngSh
aanx
iIn
ner M
ongo
liaH
aina
nCh
ongq
ing
Hub
eiJil
inN
ingx
ia H
uiH
eilo
ngjia
ngTi
bet
Gua
ngxi
Zhua
ngJia
ngxi
Hun
anAn
hui
Sich
uan
Hen
anG
uizh
ouG
ansu
Yunn
an
2007200820092010201120122013201420152016
90
80
70
60
50
40
30
20
10
0
Perc
enta
ge

Applications and Policies of Information and Communication Technology in the People’s Republic of China 5
Figure 2.3 presents the growth of internet adoption in the PRC from 2007 to 2016. The eastern region leads the other regions in the PRC in rate of internet access. The high rate of internet penetration in the northeast region is consistent with the country average, while internet penetration in the central and western regions is lower than the average.
Figure 2.3: Growth of Internet Adoption in the People’s Republic of China, 2007–2016 (%)
PRC = People’s Republic of China.Source: Authors’ compilation based on annual reports of the China Internet Network Information Center.
E-commerce has also developed rapidly in the PRC in recent years. While the first online transaction was recorded in April 1998, its expansion was slow before 2007.8 By 2008, the total value of online sales was 130 billion yuan (CNY), which accounted for only 1.3% of total retail sales in the PRC. However, e-commerce in the PRC has demonstrated very rapid growth since 2008. Based on the annual monitoring report of its online retail sales, the total value of online sales increased from CNY130.0 billion in 2008 to CNY5,328.8 billion in 2016. The share of online sales over the total retail sales increased from 1.3% to 14.9% over the same period.9 In 2013, the total value of online sales in the PRC reached CNY1,885 billion, which surpassed total online sales of the United States. The PRC has become the largest market for e-commerce in the world thereafter. The number of online shopping members increased from 7.9 million in 2008 to 50 million in 2016.
While online sales occur mainly in urban areas, it has also emerged in rural areas. The value of online sales in the rural PRC rose from CNY353.0 million in 2015 to CNY482.3 million in 2016, accounting for about 9% of online sales of the country in 2016. After the successful development of the online market in urban areas, many e-commercial enterprises have started to explore market expansion in rural areas. For farmers, e-commerce includes buying goods and selling their products through the internet. The development of rural e-commerce is expected to change the economy
8 L. Cao, and Z. Zhang. 2009. Research Report of the Twelve Years of China’s E-Commerce:1997–2009. http.//tech.qq.com/2009921e/ebaogao.doc.
9 China E-commerce Research Centre. 2016. The Annual Monitoring Report of Online Retail Sales of China.
Eastern PRC
Central PRC
Western PRC
Northeast PRC
PRC
70
60
50
40
30
20
10
02007 2008 2009 2010 2011 2012 2013 2014 2015 2016
Inte
rnet
pen
etra
tion

Information and Communication Technology for Agriculture in the People's Republic of China6
and household livelihoods in the rural PRC, providing an economic advancement opportunity for the people who live in these remote areas (footnote 6). E-commerce has also been incorporated into rural poverty alleviation programs by the government and many nongovernment organizations (footnote 7).
2.2. Supporting PoliciesTable 2.2 presents the PRC government’s support to ICT application in rural areas. Using various key words,10 this study sought to find all of the related policies and official documents that have been released by the State Council on its public website. The results show that the government has paid increasing attention to developing internet penetration and adoption in rural areas of the PRC since 2006, especially in recent years. The government has also made efforts toward the development of e-commerce and e-commerce application in rural areas of the PRC since 2012. The same is true for Internet of Things agriculture-related applications since 2010.
Table 2.2: Frequency of Key Words Used in National Policy Documents Issued by the State Council of the People’s Republic of China, 2006–2017
Year InternetRural
Internet E-CommerceRural
E-Commerce
Internet of Things
in Agriculture
2006 12 8 2 2 02007 15 8 2 2 02008 8 2 2 2 02009 10 8 4 4 02010 13 5 4 4 22011 23 18 6 3 92012 20 14 14 10 122013 22 9 8 6 122014 31 15 23 13 92015 75 38 51 24 242016 90 50 40 25 222017 81 42 30 16 19
Source: Authors’ compilation based on Government of the People’s Republic of China. www.gov.cn.
There have been many policies and official documents on ICT application in the rural PRC released by the national and local governments. Considering the development of e-commerce as a major part of ICT application in the PRC, this study focused on the policies and official documents that support the development of e-commerce in the rural PRC from 2006 onward. Figure 2.4 presents the main
10 The key words used were: “Internet,” “Internet in the rural PRC,” “e-commerce,” “e-commerce in the rural PRC,” and “Internet of Things application in agriculture.”

Applications and Policies of Information and Communication Technology in the People’s Republic of China 7
concerns of the government on promoting rural e-commerce year from 2006 to 2017. The development of rural e-commerce in agriculture has notably been given more emphasis in recent years.
Figure 2.4: Main Content of National Policies and Official Documents on E-Commerce Development in Rural Areas of the People’s Republic of China, 2006–2017
Sources: Authors’ compilation based on websites of the State Council of China, Ministry of Agriculture and Rural, Ministry of Commerce, and Ministry of Industry and Information Technology.
INITIAL STAGE DEVELOPING STAGE
2006 2007 2008 2009 2010 2011 2012 2013 2014 2015 2016 2017
2011To improve e-commercialenvironment and develop e-commercial service industry
2010To promotetraditional enterprises to join online market
2006To build agricultural information networks
2013To implement the broadband strategy in the PRC, and to improve e-commercial credit system and organize research and trainings on e-commerce
2007To facilitate agriculturaldevelopment withinformatization
2016To conduct pilot projects of e-commerce of agricultural products
2017To acceleratedevelopment of rurale-commerce
2008To improve rural circulation network and facilitate rural consumption
2009To improve the development of modern logistics industry
2012To build modern agricultural demonstration zones
2014To reduce the costof logistics
2015To improve rurallogistics system
Government support thus focuses on the following areas related to the infrastructure and building of the soft environment:
(i) Infrastructure. The government announced its “Strategy of Broadband” in 2013. It aims to update the broadband internet and increase the internet access all over the country, especially in rural areas. Local governments have included network construction in their local developing plans and correspondingly provided financial support. The government has focused on improving the infrastructure for collecting agricultural products, storing, processing, shipping, and marketing, to provide the necessary environment for developing e-commerce.
(ii) Soft environment. Building the soft environment focuses on providing local people and enterprises with training and platforms for developing
Information and Communication Technology for Agriculture in the People's Republic of China8
e-commerce. For example, migrant workers who were working in big cities are encouraged by local governments to return to their hometowns to start e-commercial businesses by providing them with funding and loans with low interests. Similar financial support is provided to agricultural enterprises and farmer cooperatives. Trainings on how to start and operate e-commerce has been organized by different bureaus of local governments. In addition, e-commercial parks for clustering of local e-commercial entrepreneurs are being developed. They are used for helping the new enterprises to run e-commerce. Specifically, the local government builds e-commercial parks and the new enterprises get the opportunities to rent office space in these e-commercial parks at a low rate or for free. At the village level, the project of “one product for one village” has been implemented. This aims to develop typical product(s) for each village, which would also help to reach a critical mass of products from villages for selling through the internet.
Based on the changes in e-commerce and the level of government support in the rural PRC, the development of rural e-commerce can be divided into two stages. Before 2014, the PRC’s rural e-commerce was at the initial stage. While many e-commercial enterprises started to explore the rural e-commercial market, little investment had been made. As e-commerce is mainly experienced in urban areas, support for e-commerce in agriculture and rural areas from governments was initiated only recently. After 2014, e-commerce in the rural PRC started to emerge. Both national and local governments increased their efforts to develop rural e-commerce. These include investments in infrastructure such as transportation, internet, and logistics. After 2014, enterprises also invested significantly in the rural e-commerce market.

9
3.1. Taobao VillagesOver the past decade, e-commerce has spread throughout the PRC and provided new opportunities for rural development. The taobao village is a typical example of this development. An initiative of Alibaba Group Holding Limited, taobao villages can potentially play a key role in rural development in the future (footnote 6).
3.1.1. Expansion of Taobao VillagesTaobao business started in the urban areas due to internet access and availability. With the rapid expansion of internet access in rural areas in recent years and significantly lower costs of labor and renting fees of office building and storages, Taobao sellers have expanded their business from urban to rural areas.11
According to AliResearch, Alibaba’s research institute, taobao villages have to meet the following requirements: (i) the village should be located in a rural area; (ii) the total annual turnover on the Taobao platform should exceed CNY10 million; and (iii) there should be more than 100 active online stores, or at least 10% of the households in the village are operating online stores.12 To have a better understanding the roles of taobao villages in agriculture, in this report, taobao villages are divided into the following two categories: (i) agricultural taobao villages that primarily sell agricultural commodities and/or processed agricultural and food products; and (ii) nonagricultural taobao villages that primarily sell industrial products, such as electric appliances, clothes, shoes, etc.
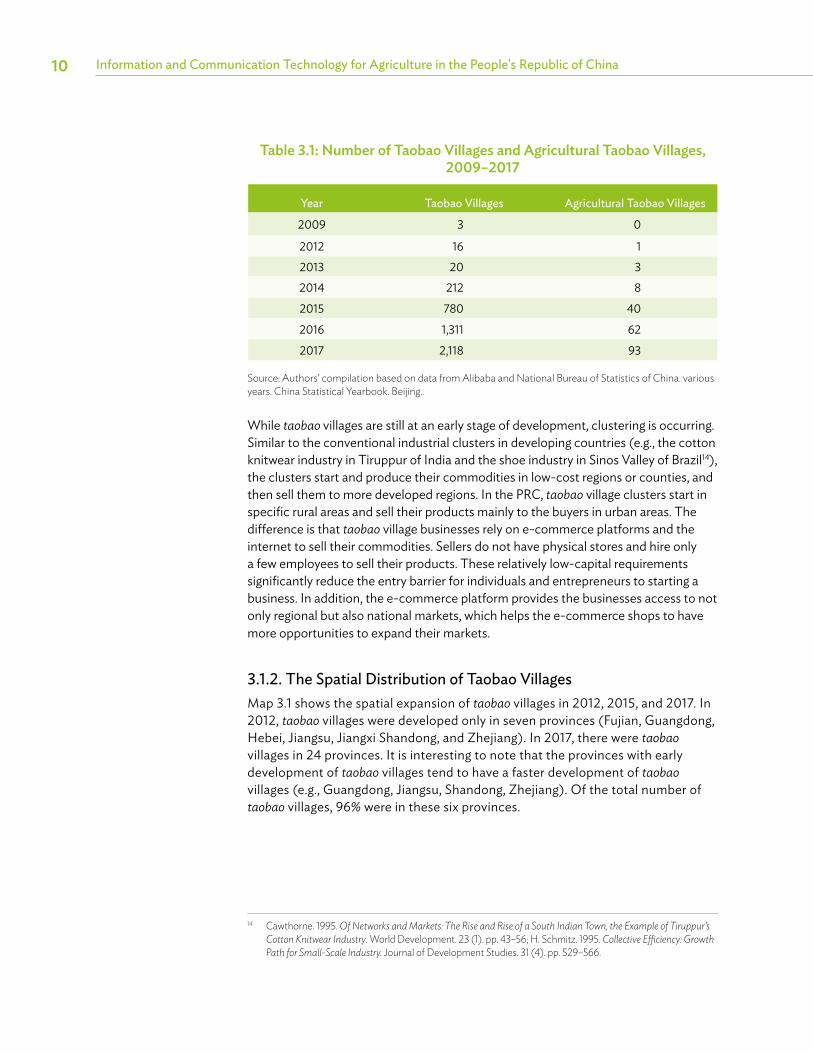
Table 3.1 presents the number of taobao villages in 2009–2017. Although taobao villages accounted for a small part of the PRC’s villages, they have expanded rapidly and increased from 3 in 2009 to 2,118 in 2017.13 There had been no agricultural taobao village until 2012, but by 2017, there were 93 agricultural taobao villages. Table 3.1 also shows that the significant rise in the numbers of total and agricultural taobao villages is consistent with the overall trend of rural e-commerce development in the PRC.
11 X. Chen, L. Zhang, and W. Li. 2014. A Network Evolution Model for Chinese Traditional Acquaintance Networks. IEEE Intelligent Systems. 29 (5). pp. 5–13.
12 Aliresearch. 2016. Research Report on China’s Taobao Villages. http://www.aliresearch.com/en/news/detail/id/21298.html.
13 There were 671,729 administrative villages (or villages) in the PRC in 2016. By 2017, taobao villages accounted for about 0.3% of total villages.
Chapter 3 Major Applications of Information and Communication Technology in Marketing and Agriculture in Rural Areas
Information and Communication Technology for Agriculture in the People's Republic of China10
Table 3.1: Number of Taobao Villages and Agricultural Taobao Villages, 2009–2017
Year Taobao Villages Agricultural Taobao Villages
2009 3 0
2012 16 1 2013 20 3 2014 212 8 2015 780 40 2016 1,311 62 2017 2,118 93
Source: Authors’ compilation based on data from Alibaba and National Bureau of Statistics of China. various years. China Statistical Yearbook. Beijing..
While taobao villages are still at an early stage of development, clustering is occurring. Similar to the conventional industrial clusters in developing countries (e.g., the cotton knitwear industry in Tiruppur of India and the shoe industry in Sinos Valley of Brazil14), the clusters start and produce their commodities in low-cost regions or counties, and then sell them to more developed regions. In the PRC, taobao village clusters start in specific rural areas and sell their products mainly to the buyers in urban areas. The difference is that taobao village businesses rely on e-commerce platforms and the internet to sell their commodities. Sellers do not have physical stores and hire only a few employees to sell their products. These relatively low-capital requirements significantly reduce the entry barrier for individuals and entrepreneurs to starting a business. In addition, the e-commerce platform provides the businesses access to not only regional but also national markets, which helps the e-commerce shops to have more opportunities to expand their markets.
3.1.2. The Spatial Distribution of Taobao VillagesMap 3.1 shows the spatial expansion of taobao villages in 2012, 2015, and 2017. In 2012, taobao villages were developed only in seven provinces (Fujian, Guangdong, Hebei, Jiangsu, Jiangxi Shandong, and Zhejiang). In 2017, there were taobao villages in 24 provinces. It is interesting to note that the provinces with early development of taobao villages tend to have a faster development of taobao villages (e.g., Guangdong, Jiangsu, Shandong, Zhejiang). Of the total number of taobao villages, 96% were in these six provinces.
14 Cawthorne. 1995. Of Networks and Markets: The Rise and Rise of a South Indian Town, the Example of Tiruppur’s Cotton Knitwear Industry. World Development. 23 (1). pp. 43–56; H. Schmitz. 1995. Collective Efficiency: Growth Path for Small-Scale Industry. Journal of Development Studies. 31 (4). pp. 529–566.

Major Applications of Information and Communication Technology in Marketing and Agriculture in Rural Areas 11
Map 3.1: Spatial Distribution
Taobao villages in 2012Province boundary
2012
Number of Taobao villages in 2012Province boundary
3
2012
Taobao villages in 2015Province boundary
2015
2015
Taobao villages in 2017Province boundary
2017
2017
Panel A: Locations of Taobao Villages Panel B: Number of Taobao Villages by Province
Source: Authors’ compilation based on data from Alibaba.
11050
100
1000
Number of Taobao villages in 2017Province boundary
11050
100
Number of Taobao villages in 2017Province boundary

Information and Communication Technology for Agriculture in the People's Republic of China12
3.2. Operating Modes of E-Commerce in Rural Areas The development of taobao villages is only one typical example of e-commerce development in the rural PRC. This subsection describes the other modes of e-commerce based on surveys in three counties (Jiaxiang, Longkou, Qixia) in Shandong and two counties (Linan and Yiwu) in Zhejiang in 2017 and 2018. The survey aimed to understand the current status of ICT applications in the rural PRC. The survey focused on e-commerce since this is where ICT is primarily used in business in rural areas. This subsection briefly summarizes the types or modes of e-commerce in the rural PRC. Detailed discussions on the survey data are presented in the succeeding sections. The use of drones in agriculture, a recent development, is briefly discussed at the end of this section.
Based on the surveys, the current rural e-commerce in agriculture is mainly operated in the following ways:
(i) Farmers sell their own products or the products they collected from others. The products farmers sell are the local dominant commercial crops, such as apples in Qixia and pecans in Linan. Farmers also sell agricultural products that are processed by local factories. During the field survey in taobao villages, some online sellers also collected the products from other farmers and sold them online. The farmgate prices received from online sellers were similar to those sold to wholesalers at the same local village. Farmers who sold their products to online sellers did not have information on marketing costs and online selling prices. Thus, this market channel could not be examined in the marketing cost and price analysis presented later.
(ii) Food enterprises and farmer cooperatives sell the agricultural products and/or the processed products. There are two types of e-commerce enterprises and cooperatives. The first is the traditional enterprises and cooperatives that sell their products mainly through their physical channels but have also started to use online selling as an alternative way to expand their sales. The second type is the e-commerce enterprises and cooperatives whose main business is to operate online selling.
Farmers, enterprises, and cooperatives sell their agricultural products mainly through the following modes:
(i) Sell agricultural products through popular e-commerce platforms such as Taobao, Tmall, Jindong, WeChat, etc. This mode is often used by food enterprises and farmer cooperatives. They also sell wholesale through Alibaba and other wholesale platforms. However, individual farmers rarely sell their products through the above platforms because of the high thresholds, such as the official documents and investment to run online stores.

Major Applications of Information and Communication Technology in Marketing and Agriculture in Rural Areas 13
(ii) Sell agricultural products through WeChat. This is becoming more popular for small farmers to sell their products because this platform has a lower threshold and entails low costs to operate; however, the potential buyers are limited by the nature of the WeChat network.
(iii) Sell agricultural products through their own platforms. This is mainly used by the large marketing enterprises and the enterprises specializing in e-commerce. For example, China Post and Supply and Marketing Cooperatives, a state-owned enterprise, which has the largest logistics system and is able to reach almost all villages in the PRC, has developed Ule since 2012.15 Ule cooperates with the physical groceries in the villages and sets their platforms in the groceries. It helps the villagers to purchase the goods from the Ule website, withdraw small cash from grocery owners, and pick up packages from groceries. Food enterprises and farmer cooperatives are required to have legal certificates to be able to sell their products on the Ule website. Moreover, Ule also collects some special agricultural products from the farmers or farmer cooperatives and lets them sell personally on their platform.
(iv) Sell agricultural products through the regional platforms that serve the local residents. This is mainly operated by the private companies. They purchase agricultural products from the local wholesale market or farmer cooperatives and send the products to their consumers who order from their online platform. Regional platforms develop well and quickly because of the perishability of agricultural products and inconvenience in the long-distance delivery.
3.3. Application of Drones in AgricultureThe survey about the application of drones in agriculture was conducted in Jiaxiang county in Shandong province. The county has about 84,000 hectares (ha) of crop land. The dominant crops are wheat and soybean, and most are planted by small farms. In 2016, drones were used to spray insecticide to around 6,600 hectares of crop areas. This land area is considered to have expanded since.
Based on interviews with local officials, companies, and farmers, the survey found that local retailers of pesticides play an important role in the adoption of drone technology in crop pest control. The companies or drone owners who provide drone services find the customers (farmers) through local pesticide retailers, and retailers sell their pesticides to the farmers or cooperatives who receive the drone services. In this case, the spread of drone custom service reduces the searching costs for finding the targeted farmers.
15 P. Zhu. 2016. A Study on the Dilemma and Solution of the Development of E-Commerce in Rural China.

Information and Communication Technology for Agriculture in the People's Republic of China14
Although the cost of using drones to spray insecticide is double that of the manual method, the speed and effectiveness of pest control are improved. Because of the speed in which it is able to apply agricultural inputs, drone use in agriculture can help prevent the spread of acute plant diseases and pests. Drones use less pesticides and only use a tenth of the water that is traditionally required by manual spraying, reducing ecological and economic losses. In soybean production, ripe soybeans would be damaged when pesticides are manually sprayed. This does not occur when using drones to spread pesticides during the late stage of soybean growing season.
However, drones work best at a larger scale, so expanding its use for small farmers is still a challenge. Realizing this issue, local governments in many provinces (e.g., Fujian, Henan, Jiangxi, Shangdong, etc.) have initiated supporting policies to expand drone application in agriculture. For example, Henan province first started to provide a subsidy to farmers who buy drones for crop plant protection in 2014. Fujian, Hunan, Jiangxi, and other provinces followed later. At the national level, the Ministry of Agriculture and Rural Affairs has also recently proposed to subsidize farmers for purchasing crop protection drones. A national subsidy policy for crop protection drones will likely be initiated soon.

15
4.1. Sampling Approach and DataTo assess the uses of ICT and development of e-commerce in the rural PRC, the China Center for Agricultural Policy (CCAP) conducted three survey rounds on rural labor and labor. The first round was conducted in February 2017 in seven provinces. These seven provinces belonged to two CCAP province categories: the first was covered by a rural labor and land survey started in 2000, and the second was covered by a rural farm size and productivity survey. There were five provinces from the first type: Zhejiang (east), Hubei (central), Guangdong (south), Shaanxi (northwest), and Sichuan (southwest). The other two provinces are from Henan and Shandong, representing the northern region.
The CCAP used the stratified random sampling approach to select the survey samples in the rural labor and labor survey. During sampling, all counties in each province were arranged in descending order of gross value of industrial output (GVIO) per capita, and then divided evenly into five groups. One county was randomly selected from each group. Within each sample county, the same procedure was applied to select two townships based on GVIO per capita. In each township, one administrative village was randomly selected. Within each village, 20 households were randomly selected. In these 5 provinces, there were 25 counties, 50 townships, and 50 villages in the sample. In Henan and Shandong, CCAP also used the stratified random sampling approach but based on the area of cultivated land per capita. CCAP ranked all counties in descending order of area of cultivated land per capita in each county within a province, and then all counties were divided evenly into three groups. One county was randomly selected from each group. In each county, two townships were selected using the same procedure, which was also applied to select two villages from each township. With each village, 10 households were randomly selected. While the sampling approach of Henan and Shandong differs from the other five provinces, data from each province does represent the population.
Table 4.1 briefly presents the situation of rural e-commerce development in the seven surveyed provinces. It indicates that 3% of the households selling agricultural products used online sales in 2016. Among these provinces, Zhejiang has the highest (10%). The survey also shows that 18% of farmers were willing to sell their products through online sales.
Chapter 4 Access to Information and Communication Technology Infrastructure Based on Survey Data

Information and Communication Technology for Agriculture in the People's Republic of China16
Table 4.1: Shares of Households Selling Agricultural Products and Selling through E-Commerce and the Willingness to Sell Online, 2016
ProvinceNumber of
Observations
Households Selling Agricultural Products
(%)
Households Selling
Agricultural Products Online
(%)
Not Selling Online
Willing to Sell Online
(%)
Unwilling to Sell Online
(%)
Total 1,128 73 3 18 52
Shaanxi 178 84 2 27 55
Zhejiang 159 56 10 4 42
Sichuan 189 57 3 17 37
Hubei 193 83 1 23 59
Guangdong 193 56 1 9 46
Shandong 105 97 0 30 67
Henan 111 99 4 30 65
Source: Authors’ compilation based on data from the first-round survey on e-commerce of the China Center for Agricultural Policy.
Face-to-face interviews were conducted for each village and household. The survey collected information on demographics, access to internet, possession and use of smartphones, agricultural production, and sales. In addition to household surveys, officials at county and township levels were interviewed to discuss the policy issues on e-commerce. The survey team also visited some e-commerce enterprises and learned their views on the development of e-commerce, including its advantages and disadvantages; the challenges they face and opportunities they see; the support they need, etc.
The second-round survey was conducted in January 2018 through telephone interviews. Village leaders who were surveyed in our first-round survey were interviewed over the phone to learn the changes in the development of local e-commerce since the last survey in 2017. Table 4.2 presents the findings of these interviews. The results show that the villages that operate e-commerce increased from 41.1% in 2016 to 62.9% in 2017. About two-fifths of these villages (26.6% versus 62.9%) had online sales of agricultural products in 2017. It is worth noting that based on the village leaders’ personal assessment, the percentage of households that had e-commerce operation in our sample was only 0.54% in 2016 and 1.81% in 2017 (Table 4.2). However, the household sampling survey data showed that this was 3% in 2016 (Table 4.1). This difference may be due to a lack of awareness of local leaders about individual farmers who sold a small quantity of their products through WeChat.

Access to Information and Communication Technology Infrastructure Based on Survey Data 17
Table 4.2: Villages and Households Operating E-Commerce, 2016 and 2017
ProvinceNumber of
Villages
Villages OperatingE-Commerce
(%)
Villages Selling Agricultural
Products Online (%)
Households Operating E-Commerce
(%)
2016 2017 2017 2016 2017
Total 124 41.1 62.9 26.6 0.54 1.81
Shandong 12 41.7 58.3 0.0 0.64 0.83
Henan 12 25.0 75.0 50.0 0.26 1.06
Shaanxi 20 55.0 80.0 30.0 0.77 2.66
Zhejiang 20 70.0 75.0 25.0 0.96 5.61
Sichuan 20 25.0 65.0 40.0 0.44 1.40
Hubei 20 35.0 50.0 20.0 0.21 0.44
Guangdong 20 30.0 40.0 20.0 0.49 0.69
Source: Authors’ compilation based on data from the second-round survey on e-commerce of the China Center for Agricultural Policy.
The third-round survey was conducted in March 2018. To better understand the development of rural e-commerce in the PRC, Shandong and Zhejiang were selected. These two are typical and booming areas for developing rural e-commerce based on secondary data on taobao villages and online business. According to the extent of rural e-commerce development and the main products, Qixia and Feicheng counties were selected as sample counties in Shandong province; and Linan, Suichang, and Jiangshan counties as sample counties in Zhejiang province. At the village level, two e-commerce villages and two villages without e-commerce were selected for matching in each county if these villages sell the same kind of agricultural products, and comparing the levels of economic development. E-commercial villages are the villages where e-commerce has been developed well, like taobao villages. Eight villages (four e-commerce villages and four non-e-commerce villages) were selected in Linan county because agricultural e-commerce was more developed in these counties. At the household level, 15 households were selected in each e-commerce village, and of these, 10 households have operated e-commerce (called e-commercial households) and 5 households have not (called non-e-commercial households). Meanwhile, 10 households were randomly selected from each non-e-commerce village. As a result, the survey selected five counties, 20 villages, and 250 households from Shandong and Zhejiang. Table 4.3 shows that 58.8% of the households were operating e-commerce during 2016–2017, and 79.2% of households were willing to sell their products through the internet.
Information and Communication Technology for Agriculture in the People's Republic of China18
Table 4.3: Samples and Percentage of Households Operating E-Commerce and Their Willingness to Sell Online in Zhejiang and Shandong, 2016–2017
Province ObservationsSell Online
(%)Willing to Sell Online
(%)
Unwilling to Sell Online
(%)No Opinion
(%)Total 250 58.8 79.2 18.4 2.4
Zhejiang 150 60.7 71.3 24.7 4.0
Shandong 100 56.0 91.0 9.0 0.0
Source: Authors’ compilation based on data from the third-round survey on e-commerce of the China Center for Agricultural Policy.
Based on the nature of the three datasets, the first-round survey is used to present the general situation of e-commerce development in the PRC, and the second-round is used to present the changes in the development of rural e-commerce from 2016 to 2017. The third-round case study and survey specifically present the development of rural e-commerce in a typical area, which is used for a more detailed study of the e-commerce in more developed e-commerce regions.
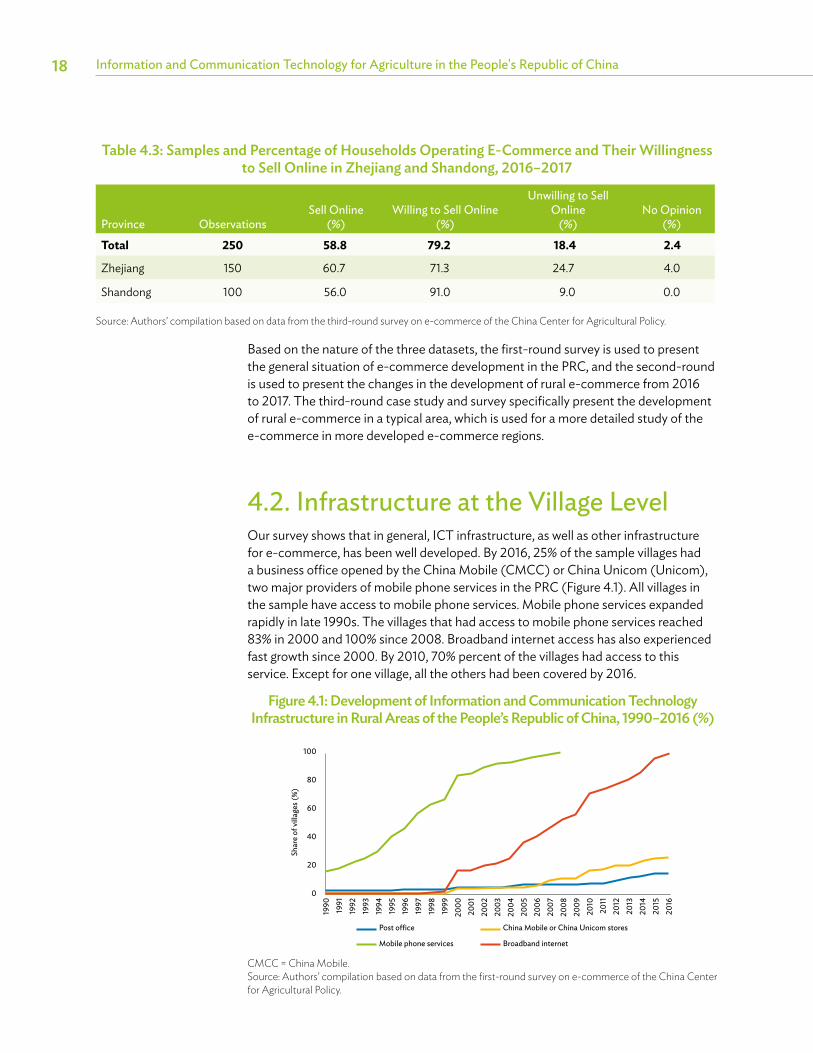
4.2. Infrastructure at the Village LevelOur survey shows that in general, ICT infrastructure, as well as other infrastructure for e-commerce, has been well developed. By 2016, 25% of the sample villages had a business office opened by the China Mobile (CMCC) or China Unicom (Unicom), two major providers of mobile phone services in the PRC (Figure 4.1). All villages in the sample have access to mobile phone services. Mobile phone services expanded rapidly in late 1990s. The villages that had access to mobile phone services reached 83% in 2000 and 100% since 2008. Broadband internet access has also experienced fast growth since 2000. By 2010, 70% percent of the villages had access to this service. Except for one village, all the others had been covered by 2016.
Figure 4.1: Development of Information and Communication Technology Infrastructure in Rural Areas of the People’s Republic of China, 1990–2016 (%)
CMCC = China Mobile.Source: Authors’ compilation based on data from the first-round survey on e-commerce of the China Center for Agricultural Policy.
1990
1991
1992
1993
1994
1995
1996
1997
1998
1999
2000
2001
2002
2003
2004
2005
2006
2007
2008
2009
2010
2011
2012
2013
2014
2015
2016
100
80
60
40
20
0
Post office China Mobile or China Unicom stores
China Unicom storeMobile phone services Broadband internet
Shar
e of
villa
ges (
%)

Access to Information and Communication Technology Infrastructure Based on Survey Data 19
Transportation infrastructure is important for e-commerce development and is also being rapidly developed in rural areas of the PRC. National highways pass by 13 villages in this study’s sample. More than half of the villages (66 out of 126 villages) are within 5 kilometers (km) of a national highway. An additional 25 villages are within 10 km. Only 13 villages are farther than 20 km from a national highway. The average distance to the nearest national highway is 10 km in the sample villages. The distances to the nearest provincial highway is 7.5 km and 3.4 km to a county paved road.
Logistics services are also available in some of the sample villages. The share of villages with a post office increased from 2% in 1990 to 15% in 2016 (Figure 4.1). About 60% of the sample villages are within 5 km of a post office. Only 6% are farther than 10 km from a post office. The average distance to the nearest post office is 4.7 km. Among the villages without a post office, 44% (or 47 villages) have one or more postal workers who deliver mail and packages for villagers. Private providers of package delivery were also found in the sample villages—26% of them (33 villages) have package delivery services by private firms. In addition, 51% of them (64 villages) are within 5 km of a package collection and distribution point. The average distance to the package collection and distribution point is 4.5 km.
4.3. Access to and Use of Information and Communication Technology by IndividualsAccording to the data from CCAP’s first-round survey, 89% of rural residents have mobile phones in 2017. The share of women with mobile phones is 84%, lower than the share for men (93%), but still high. Only 69% of people aged 60 or above have a mobile phone. The share of mobile phone owners who received elementary education or fewer (0–6 years of schooling) is 77%, about 20% lower than the share for people who received more than 6 years of schooling. At the household level, 99% households have at least one mobile phone. The average number of mobile phones per household is 3.4. About 70% households have two to four smartphones. Smartphones are popular among rural people too (Table 4.4). For people aged 16 or above, 71% have a smartphone. This share is similar between men and women. By age, the share is very high for people aged 16–45 (higher than 95%). This share drops sharply for people aged above 45. For people aged 46–60, the share of smartphone owners falls to 58%, and further drops to 14% for people aged above 60. The ownership of smartphones also varies with education level. For people who received elementary education or less, only 42% have a smartphone. This share jumps to 81% for those who received junior middle school (7–9 years of schooling), and 92% for those who received more than 9 years of schooling. When measured at the household level, 87% of them have at least one smartphone. The average number of smart phones per household is 2.4. About 70% households have two to four smartphones. As the data show, in 2017 in two provinces, nearly all the indicators are slightly higher than the average of seven provinces in 2016, which is in line with the survey team’s expectations, since the development of e-commerce in Shandong and Zhejiang is relatively faster than other provinces.

Information and Communication Technology for Agriculture in the People's Republic of China20
Description
2016a 2017b
Number of Observations
With Mobile Phone
With Smartphone Observation
With Smartphone
Total 4,833 89 71 906 76
By gender
Male 2,500 93 72 447 79
Female 2,333 84 70 459 72
By age
16–30 1,214 95 98 186 93
31–45 1,225 98 95 249 99
46–60 1,253 92 58 290 79
Above 60 1,141 69 14 181 20
By education
Elementary school or lower 1,800 77 42 231 38
Junior middle school 1,784 97 81 305 82
High school or higher 1,249 95 92 370 94
a For seven provinces: Guangdong, Henan, Hubei, Shaanxi, Shandong, Sichuan, and Zhejiang.b For two provinces: Shandong and Zhejiang.Source: Authors’ compilation based on data from the first- and third-round surveys on e-commerce of the China Center for Agricultural Policy.
If we focus on the decision makers on agricultural production and sales, the ownership of mobile phones exhibits similar patterns to that of all the persons aged above 16. But the story of smartphones differs by age. Only 47% of decision makers had a smartphone in 2016 in the seven provinces, compared to 82% of all the persons surveyed in 2017 in two provinces (Table 4.5). Both men and women decision makers own fewer smartphones than people in general. The share of smartphone owners in decision makers aged 45 or below is lower than their counterparts. This share stays low for decision makers aged 45 above and is similar for all the persons in the same group. Although lower than the entire sample, the share of smartphone owners increases as the number of years of schooling increase. For decision makers who received elementary education or less, only 30% have a smartphone. This share increases to 59% for those who received junior middle school (7–9 years of schooling), and 68% for those who received more than 9 years of schooling. These numbers suggest that the lower share of smartphone owners in decision makers on agricultural production and sales is because they are older and received fewer years of schooling than the entire sample.
Table 4.4: Share of Rural Residents Aged 16 or Above with Mobile Phones and Smartphones, 2016–2017

Access to Information and Communication Technology Infrastructure Based on Survey Data 21
Table 4.5: Shares of Decision Makers on Agricultural Production and Sales with Mobile Phones and Smartphones, 2016–2017
DescriptionNumber of
Observations
2016a
Observation
2017b With Mobile
Phone With SmartphoneWith
Smartphone
Total 1,503 92 47 391 82
By gender
Male 1,067 94 48 262 80
Female 436 86 45 129 87
By age
16–30 9 100 89 39 100
31–45 196 97 87 115 100
46–60 717 95 58 172 87
Above 60 581 84 15 65 28
By education
Elementary school or lower 732 86 30 88 53
Junior middle school 584 97 59 155 85
High school or higher 187 97 68 148 97
a For seven provinces: Guangdong, Henan, Hubei, Shaanxi, Shandong, Sichuan, and Zhejiang.b For two provinces: Shandong and Zhejiang.Source: Authors’ compilation based on data from the first- and third-round surveys on e-commerce of the China Center for Agricultural Policy.
This result can be confirmed by the reasons why they do not use smartphones. The primary reason is “Don’t know how to use a smartphone”—the answer of 62% of the decision makers who do not use a smartphone, followed by “No need to use it,” chosen by 22% of non-users. Some 11% thought smartphones are too expensive, and 6% do not use it for other reasons such as poor physical conditions (Table 4.6). The answers were similar between men and women. As for the findings based on age, non-users are mainly aged above 45. The 38% of non-users aged below 45 that do not use smartphones said that they found no need to do so. This share is higher than non-users aged above 45, which is 22%. On the other hand, the share answering “Don’t know how to use a smartphone” increases as the age increases. Of those aged below 45, 38% do not use a smartphone because they don’t know how. This share jumps to 53% for non-users aged 46–60, and 68% for those above 60. The findings based on different education levels is that as the years of schooling increases, the share of answering “Don’t know how” decreases, from 68% for elementary school or below, to 54% for junior middle school, and 41% for high school or higher. The share

Information and Communication Technology for Agriculture in the People's Republic of China22
Table 4.6: Reasons of Decision Makers of Agricultural Production and Sales for Not Using Smartphones, 2016
DescriptionNumber of
Observations
Do not Know How to Use
Smartphone(%)No Need to Use Smartphone(%)
Smartphone is Expensive
(%)Others
(%)
Total 679 62 22 11 6
By gender
Male 484 62 22 10 6
Female 195 60 22 13 6
By age
16–30 1 0 0 100 0
31–45 21 38 38 24 0
46–60 258 53 22 16 8
Above 60 399 68 21 6 5
By education
Elementary school or lower 420 68 18 11 3
Junior middle school 203 54 24 11 10
High school or higher 56 41 43 5 11
Source: Authors’ compilation based on data from the first-round survey on e-commerce of the China Center for Agricultural Policy.
In February 2017, this survey also examined the reason why decisionmakers do not sell their products through e-commerce. “Time consuming” (49%) and “Don’t know how to use it” (45%) are the major reasons (Table 4.7). Other reasons such as difficulties in in transporting and earning money account for 6%. The answers are quite different by gender. More than half of the men do not use e-commerce because they do not know how to use it, compared to only 22% of women decision makers. However, 67% of women decision makers think e-commerce is a waste of time, about 25% higher than men decision makers. One explanation is that women spend more time in caring for their children or grandchildren.
of answering “No need to use it” increases from 18% for elementary school or below, to 24% for junior middle school, and 43% for high school or higher.

Access to Information and Communication Technology Infrastructure Based on Survey Data 23
Table 4.7: Reasons for Not Using E-Commerce by Decision Makers of Agricultural Production and Sales, 2017
DescriptionNumber of
ObservationsDo Not Know
How to Use (%)Time- Consuming
(%)Othersa
(%)
Total 66 45 49 6
By gender
Male 48 54 42 4
Female 18 22 67 11
By age
16–30 3 0 100 0
31–45 15 20 53 27
46–60 27 41 59 0
Above 60 21 76 24 0
By education
Elementary school or lower 23 65 31 4
Junior middle school 24 42 50 8
High school or higher 19 27 68 5
a Other reasons given were difficulties in transporting and earning money.Source: Authors’ compilation based on data from the third-round survey on e-commerce of the China Center for Agricultural Policy.
The most popular function of smartphones is social networking, as reported by 84% of respondents. Following this is the use of smartphones for news (68%), watching videos (67%), and other entertainment (64%). Around half of the smartphone users use it for shopping (49%) and making payments (52%). Only 5% sell products and services on smartphones (Table 4.8). These data show that smartphones have become an important channel for information acquisition and transactions, and still have room for these applications.

Information and Communication Technology for Agriculture in the People's Republic of China24
Table 4.8: Reasons for Using Smartphones, 2016 (%)
Description Social News Shopping Sales Entertainment Video Learning Payment
Total 84 69 50 5 64 68 21 52
By gender
Male 84 71 46 5 64 67 22 50
Female 86 66 54 6 64 69 21 55
By age
16–30 92 74 73 6 81 82 34 73
31–45 88 73 54 7 69 72 19 57
46–60 75 60 14 2 36 47 9 20
Above 60 37 34 2 1 18 23 4 6
By educationElementary school or lower 70 51 21 1 46 45 7 26
Junior middle school 85 69 46 5 62 69 17 48
High school or higher 92 77 69 8 75 78 35 71
Decision maker on agriculture?
Yes 73 64 15 3 39 48 10 23
No 88 70 60 6 72 74 25 61
Source: Authors’ compilation based on data from the first-round survey on e-commerce of the China Center for Agricultural Policy.
The purpose of using smartphones varies among different groups of people. Men and women use smartphones in similar ways except for some differences in news and shopping. More men use smartphones to browse the news while more women do shopping using a smartphone. The differences are more apparent among different age groups. The share of users of every function listed in the survey declines as the age increases. For example, 92% of the people aged 16–30 use smartphones for social networking, while 88% of the people aged 31–45 do so. This share declines to 75% for people aged 46–60 and drops to 37% for people above 60 years old. The sharpest drop occurs in shopping and payment. While 73% people aged 16 to 30 do shopping with a smartphone, only 2% percent of the people aged above 60 do so. The share of people who use smartphones to make payments is 73% among people aged 16 to 30, and only 6% among people aged above 60.

Access to Information and Communication Technology Infrastructure Based on Survey Data 25
Educational attainment is another factor in which the use of smartphones varies. As years of schooling increase, the use of all eight functions increase as well. The use of smartphones by decision makers is different from other family members. Of all eight functions listed in Table 4.8, the share of decision makers using them is constantly lower than other family members. Except for sales and news, the gap between decision makers and other family members exceed 10% in all other six functions. The largest gap exists in shopping. Only 15% of the decision makers shop with their smartphones, while 60% of other family members do. This huge difference is mainly due to the age disparity between decisionmakers on agriculture and other family members.
In addition to smartphones, this survey also investigated other access to the internet of decision makers. In all of the 1,273 households surveyed, 411 respondents have heard of the internet and have used it. Among them, 385 accessed the internet through smartphones, 124 through desktop computers, 21 through laptops, and 4 through other devices. Smartphones are mainly used to access internet for social networking (90%) and reading the news (81%), followed by entertainment (60%). The order is reversed for respondents who used desktop computers. Desktop computer users access the internet primarily for entertainment (72%), reading the news (65%), and social networking (32%). Laptop users access the internet on their device for entertainment (86%), social networking (71%), and reading the news (76%).
Table 4.9: Internet Use by Type of Device, 2016
DevicesNumber of
ObservationsEntertainment
(%)Social
(%)News(%)
Purchasing Products and Services
Acquiring Information on Production and/or Sales
of Products
Agriculture(%)
NonAgriculture(%)
Agriculture(%)
NonAgriculture(%)
RespondentsSmartphones 395 60 90 81 6 18 24 14Desktops 124 72 32 65 11 22 24 19Laptops 21 86 71 76 10 48 10 24Others 4 75 25 50 0 0 25 0
Total 411 64 87 81 7 19 26 15
Other family membersSmartphones 61 84 93 59 30 56 26 15Desktops 21 76 67 67 29 62 52 24Laptops 16 81 63 50 44 88 13 0Total 64 84 92 59 34 55 27 16
Source: Authors’ compilation based on data from the first-round survey on e-commerce of the China Center for Agricultural Policy.

Information and Communication Technology for Agriculture in the People's Republic of China26
Of note is that 26% of internet users acquire information on agricultural production and sales. Some 19% use the internet to buy nonagricultural products or services, 15% learn information about nonagricultural production and sales, and 7% bought agricultural products or services online. This means that among all 1,273 households nearly 10% are using the internet for transactions or production-related information. This shows great potential for ICT to penetrate into rural areas and the production and sales of agricultural products and services.
The survey team also asked about the access to and use of the internet by family members who had purchased agricultural products or services online and found 64 individuals who have done this. The main devices they use for internet access are smartphones. These people use the internet more frequently for entertainment and social networking than other respondents, and less for reading the news. One big difference between these people and respondents exists in online shopping: 34% of them listed shopping for agricultural products and services among the major uses of the internet, while only 7% of the respondents did so. More family members (55%) listed purchasing nonagricultural products and services than respondents (19%). These two groups of people do not differ much in information acquisition through the internet. This reflects the important role of the internet in information acquisition by rural people in the PRC—roughly a quarter use the internet to gather information on agricultural production and marketing, and less than a fifth do so for nonagricultural production and marketing.
To further explore the role of the internet in information acquisition on agricultural production and marketing, respondents were asked about their internet use in these areas. Among the 1,273 respondents, 5% use the internet to acquire information on agricultural production and 9% on agricultural marketing (Table 4.9). Men use the internet slightly more than women. The share of using internet to acquire information on agricultural production declines as age increases. The share is 19% for people aged 16–30, 11% for people aged 31–45, 7% for people aged 46–60, and 1% for people aged above 60. As for agricultural marketing, although the share of using the internet to acquire information declines as age increases in general, it peaks at ages 31 to 45. The share of using the internet for information acquisition monotonically increases with years of schooling, both for production and for marketing. Although negligible in people with 6 years of schooling or less (elementary school), the shares for people with a high school or higher education are almost double those for people with junior-middle-school education. Decision makers are different from those who are not only in acquiring information on marketing, with a small margin. Simple tabulations show that the information they care the most about is prices, either of agricultural products or of agricultural inputs.

Access to Information and Communication Technology Infrastructure Based on Survey Data 27
4.4. The Use of Information and Communication Technologies by Different Village ConditionsIn addition to analyzing the access to and use of ICTs at the individual level, the survey also looked at their relations with the conditions at the village level (such as infrastructure). However, as shown in Table 4.10, the results did not indicate very significant differences among different groups. This was because the major differences between users and non-users of phones are from the characteristics of farmers and households, or the weak correlations between village conditions and the use of phones, or due to the relatively high penetration rate of phones.
Table 4.10: Share of Respondents Acquiring Information on Agricultural Production and Marketing
DescriptionNumber of
ObservationsProduction
(%)Marketing
(%)
Total 1,273 5 9
By gender
Male 957 5 10
Female 316 4 6
By age
16–30 16 19 19
31–45 176 11 23
46–60 553 7 12
Above 60 528 1 1
By education
Elementary school 580 1 1
Junior middle school 507 7 13
High school or higher 186 12 25
Decision maker on agriculture?
Yes 1,004 5 10
No 269 5 8
Source: Authors’ compilation based on data from the first-round survey on e-commerce of the China Center for Agricultural Policy.

Information and Communication Technology for Agriculture in the People's Republic of China28
Table 4.11: Share of Mobile Phone Owners by Village Conditions, 2016
Categories
All Members Decision Makers
Number of Observations
Mobile(%)
Smart(%)
Number of Observations
Mobile(%)
Smart(%)
With a package distribution or collection point
No 3,548 89 71 1,134 92 47
Yes 1,296 89 71 379 89 48
Distance to the nearest package distribution or collection point
Within 1 km 1,296 89 71 379 89 48
<3 km 1,090 87 71 350 92 48
3–5 km 1,147 91 71 349 94 45 >=5 km 1,311 88 71 435 91 47
With a post office No 4,106 89 71 1,293 92 47 Yes 738 90 73 220 90 50
Distance to the nearest post office Within 1 km 738 90 73 220 90 50 <3 km 1,334 88 72 417 90 47 3–5 km 1,368 89 68 442 93 43 >=5 km 1,404 89 72 434 92 43
Year the post office was established <=2000 221 87 73 66 86 58 2000–2012 191 87 77 63 90 61 >2012 321 93 73 89 91 41 Without a post office 4,111 89 71 1,295 92 46
The minor differences among groups may also provide an interesting insight into the impacts of village infrastructure on farmers’ uses of phones to some extent. For example, it seems that there is a relatively high number of farmers using phones if the village has a CMCC or Unicom business office. Particularly, for the decision makers, who have both higher proportions of using mobile and smartphones if they are in a village with a CMCC or Unicom business office, the distance to the nearest national road seems positively correlated with the use of phones, suggesting the necessity of mobile phones for farmers in relatively remote regions (Table 4.11). On the contrary, due to the substitution of mobile phones for smartphones, there are fewer farmers who use smartphones who are located in remote regions (Table 4.12). The univariate comparison suggests that although the conditions and infrastructures of village are not the major factors determining farmers’ decision to use phones, they do play a secondary role.
continued on next page

Access to Information and Communication Technology Infrastructure Based on Survey Data 29
Categories
All Members Decision Makers
Number of Observations
Mobile(%)
Smart(%)
Number of Observations
Mobile(%)
Smart(%)
With a CMCC or Unicom business office No 3,605 88 71 1,122 91 46 Yes 1,239 91 71 391 93 50
Distance to the nearest CMCC or Unicom business office Within 1 km 1,239 91 71 391 93 50 <=2 km 1,311 89 73 404 91 50 2–4 km 1,119 89 70 350 92 45 >4 km 1,175 87 71 368 90 44
Year CMCC or Unicom business office was established <=2007 473 89 72 149 91 53 2007–2011 369 91 72 120 93 52 >2011 397 93 69 122 97 44 No CMCC or Unicom office 3,605 88 71 1,122 91 46
Initial year of mobile phone services <=1995 1,891 89 71 598 93 47 1995–2000 2,139 89 72 659 91 50 >2000 814 87 69 256 91 41
Initial year of broadband internet access <=2005 1,712 89 71 527 91 49 2005–2010 1,703 89 70 533 93 48 >2010 1,429 88 73 453 91 45
Distance to the nearest national highway <3 km 1,466 87 72 488 89 49 3–10 km 1,664 89 72 513 92 49 >=10 km 1,714 90 71 512 94 43
Distance to township <=2.5 km 1,640 88 73 510 91 52 2.5–5.0 km 1,578 89 69 491 92 41 >5.0 km 1,626 89 71 512 92 48
Distance to county <=12.5 km 1,801 89 72 558 91 50 12.5–25.0 km 1,616 89 70 500 91 42 >25.0 km 1,427 90 71 455 93 48
CMCC = China Mobile, km = kilometer, Unicom = China Unicom.Source: Authors’ compilation based on data from the first-round survey on e-commerce of the China Center for Agricultural Policy.
Table 4.11 continued

Information and Communication Technology for Agriculture in the People's Republic of China30
Table 4.12: Share of Smartphone Owners by Village Conditions, 2016
Categories
All Members Decision Makers
Number of Observations
SmartphoneOwners
(%)Number of
Observations
Smartphone Owners
(%)With a post office
No 882 64 841 62Yes 194 66 180 64
Distance to the nearest post office Within 1 km 194 66 180 64<3 km 209 67 205 673–5 km 382 63 358 60>=5 km 291 63 278 62
With a CMCC or Unicom business officeNo 1076 64 1021 63Yes 0 n.a 0 n.a
Distance to the nearest CMCC or Unicom business office Within 1 km 0 n.a 0 n.a<=2 km 120 69 113 672–4 km 335 62 312 59>4 km 621 65 596 64
Initial year of mobile phone services <=1995 352 62 330 601995–2000 349 66 338 65>2000 375 65 353 63
Initial year of broadband internet access <=2005 491 65 467 632005–2010 388 63 367 61>2010 197 66 187 65
Distance to the nearest township road or higher-level road <3 km 966 65 919 633–10 km 72 58 64 53>=10 km 38 74 38 74
Distance to the township <=2.5 km 277 68 264 672.5–5.0 km 388 64 370 62>5.0 km 411 63 387 60
continued on next page

Access to Information and Communication Technology Infrastructure Based on Survey Data 31
Table 4.13 summarizes the uses of smartphones by the conditions and infrastructure existing in the villages. Interestingly, although there is a significantly higher proportion of shopping using smartphones if the village has an express delivery point, the distance to the nearest express delivery point is not correlated to the proportion of shopping using smartphones. Also, farmers are more likely to shop with their smartphones if they are located in a village that has or is near a post office. It is interesting to note that if the post office or the CMCC or Unicom business office was established earlier, the proportion of smartphone users who shop online is lower. This implies that the recent expansion of post offices, and CMCC or Unicom business offices, is likely to encourage farmers to go shop using their smartphones; and that developing ICT infrastructure is essential in promoting the development of e-commerce.
Categories
All Members Decision Makers
Number of Observations
SmartphoneOwners
(%)Number of
Observations
Smartphone Owners
(%)Distance to county
<=12.5 km 255 61 242 5912.5–25.0 km 211 66 207 65>25.0 km 610 65 572 63
CMCC = China Mobile, km = kilometer, Unicom = China Unicom.Source: Authors’ compilation based on data from the third-round survey on e-commerce of the China Center for Agricultural Policy.
Table 4.13: Purpose for Using Smartphones by Village Condition, 2016
Description Social News Shopping Sales Entertainment Video Learning PaymentWith a package distribution/collection point
No 84 67 47 5 63 66 20 50Yes 86 74 56 7 66 72 25 58
Distance to the nearest package distribution or collection point Within 1 km 86 74 56 7 66 72 25 58<3 km 88 74 47 5 64 71 19 523–5 km 80 63 47 5 61 67 20 49>=5 km 84 65 47 5 64 62 22 49
With a post office No 84 68 49 5 64 68 21 51Yes 86 71 54 5 63 69 22 57
Distance to the nearest post office Within 1 km 86 71 54 5 63 69 22 57<3 km 88 73 53 7 67 71 21 573–5 km 81 65 47 5 60 65 20 49>=5 km 83 66 47 5 65 67 22 49
continued on next page
Table 4.12 continued

Information and Communication Technology for Agriculture in the People's Republic of China32
Description Social News Shopping Sales Entertainment Video Learning PaymentYear post office established
<=2000 87 68 48 0 63 65 18 502000–2012 86 67 50 8 57 62 18 56>2012 84 72 59 6 69 73 25 58No post office 84 69 49 5 64 68 22 52
With a CMCC or Unicom business office No 84 69 50 6 66 68 21 53Yes 85 69 48 4 58 66 22 52
Distance to the nearest CMCC or Unicom business office Within 1 km 85 69 48 4 58 66 22 52<=2 km 87 73 55 8 69 74 22 572–4 km 82 68 47 5 63 67 19 50>4 km 83 64 47 4 66 63 22 50
Year a CMCC or Unicom business office was established in area <=2007 83 67 43 1 56 64 19 442007–2011 86 71 46 3 58 66 24 54>2011 86 70 58 8 62 69 25 58Without one 84 69 50 6 66 68 21 53
Initial year of mobile phone services <=1995 86 70 51 6 63 66 22 531995–2000 84 68 50 4 64 69 22 52>2000 83 68 46 6 67 70 19 51
Initial year of broadband internet access <=2005 85 72 54 7 63 67 24 562005–2010 84 68 49 4 64 69 22 53>2010 85 66 45 5 65 68 18 47
Distance to the nearest national highway <3 km 83 68 47 6 66 67 17 513–10 km 85 69 50 7 61 67 25 52>=10 km 85 70 51 4 65 70 21 53
Distance to township <=2.5 km 85 72 49 5 62 69 22 542.5–50 km 84 67 49 5 65 68 20 50>5 km 85 67 50 6 66 66 22 53
Distance to county <=12.5 km 83 70 52 6 64 67 24 5512.5–25.0 km 87 70 48 4 63 69 21 51>25 km 83 66 49 6 65 67 19 50
CMCC = China Mobile, km = kilometer, Unicom = China Unicom.Source: Authors’ compilation based on data from the first-round survey on e-commerce of the China Center for Agricultural Policy.
Table 4.13 continued
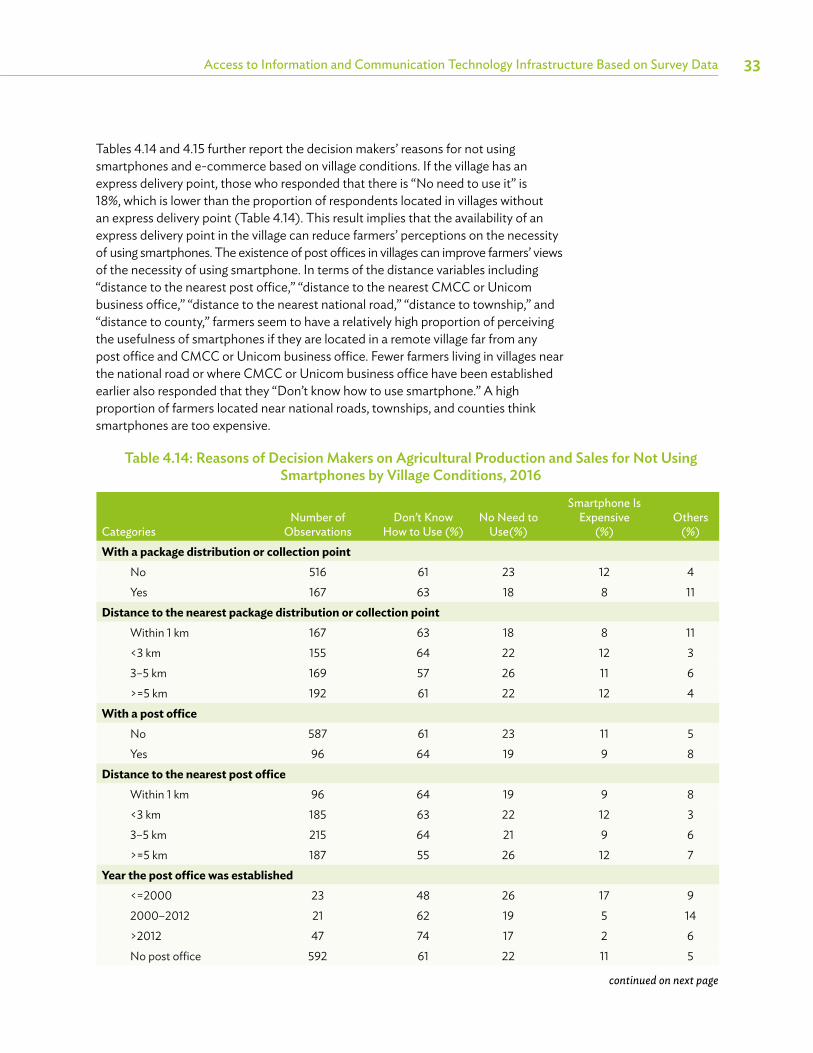
Access to Information and Communication Technology Infrastructure Based on Survey Data 33
Tables 4.14 and 4.15 further report the decision makers’ reasons for not using smartphones and e-commerce based on village conditions. If the village has an express delivery point, those who responded that there is “No need to use it” is 18%, which is lower than the proportion of respondents located in villages without an express delivery point (Table 4.14). This result implies that the availability of an express delivery point in the village can reduce farmers’ perceptions on the necessity of using smartphones. The existence of post offices in villages can improve farmers’ views of the necessity of using smartphone. In terms of the distance variables including “distance to the nearest post office,” “distance to the nearest CMCC or Unicom business office,” “distance to the nearest national road,” “distance to township,” and “distance to county,” farmers seem to have a relatively high proportion of perceiving the usefulness of smartphones if they are located in a remote village far from any post office and CMCC or Unicom business office. Fewer farmers living in villages near the national road or where CMCC or Unicom business office have been established earlier also responded that they “Don’t know how to use smartphone.” A high proportion of farmers located near national roads, townships, and counties think smartphones are too expensive.
Table 4.14: Reasons of Decision Makers on Agricultural Production and Sales for Not Using Smartphones by Village Conditions, 2016
CategoriesNumber of
ObservationsDon’t Know
How to Use (%)No Need to
Use(%)
Smartphone Is Expensive
(%)Others
(%)With a package distribution or collection point
No 516 61 23 12 4Yes 167 63 18 8 11
Distance to the nearest package distribution or collection point Within 1 km 167 63 18 8 11<3 km 155 64 22 12 33–5 km 169 57 26 11 6>=5 km 192 61 22 12 4
With a post office No 587 61 23 11 5Yes 96 64 19 9 8
Distance to the nearest post office Within 1 km 96 64 19 9 8<3 km 185 63 22 12 33–5 km 215 64 21 9 6>=5 km 187 55 26 12 7
Year the post office was established <=2000 23 48 26 17 92000–2012 21 62 19 5 14>2012 47 74 17 2 6No post office 592 61 22 11 5
continued on next page

Information and Communication Technology for Agriculture in the People's Republic of China34
CategoriesNumber of
ObservationsDon’t Know
How to Use (%)No Need to
Use(%)
Smartphone Is Expensive
(%)Others
(%)With a CMCC or Unicom business office
No 515 61 22 12 5Yes 168 61 23 8 8
Distance to the nearest CMCC or Unicom business office Within 1 km 168 61 23 8 8<=2 km 173 68 16 13 32–4 km 167 61 24 10 5>4 km 175 55 26 13 6
Year the CMCC or Unicom business office was established <=2007 59 49 31 8 122007–2011 52 60 21 13 6>2011 57 74 16 4 7No CMCC or Unicom office 515 61 22 12 5
Initial year of mobile phone services <=1995 268 65 21 8 61995–2000 286 58 23 12 6>2000 129 60 21 14 5
Initial year of broadband internet access <=2005 232 66 21 8 52005–2010 243 54 27 10 9>2010 208 63 17 15 4
Distance to the nearest national highway <3 km 212 57 22 15 73–10 km 219 61 22 9 8>=10 km 252 65 23 9 4
Distance to township <=2.5 km 215 64 15 15 62.5–5.0 km 249 63 25 8 5>5.0 km 219 57 26 11 7
Distance to county <=12.5 km 234 66 18 12 512.5–25.0 km 246 65 20 8 7>25.0 km 203 51 30 13 6
CMCC = China Mobile, km = kilometer, Unicom = China Unicom..Source: Authors’ compilation based on data from the first-round survey on e-commerce of the China Center for Agricultural Policy.
Table 4.14 continued

Access to Information and Communication Technology Infrastructure Based on Survey Data 35
Table 4.15: Reasons of Decision Makers on Agricultural Production and Sales for Not Using E-Commerce, 2016
DescriptionNumber of
ObservationsDon’t Know
How to Use (%)
Time-consuming
(%)Othersa
(%)Total 66 44 50 6With a post office
No 46 48 43 9Yes 20 35 65 0
Distance to the nearest post office With one 20 35 65 0
<3 km 10 60 20 203–5 km 15 40 47 13>=5 km 21 48 52 0
With a CMCC or Unicom business office No 66 44 50 6Yes 0 n.a n.a n.a
Distance to the nearest CMCC or Unicom business office Within 1 km 0 n.a n.a n.a<=2 km 11 64 18 18
2–4 km 9 22 56 22
>4 km 46 43 57 0Initial year of mobile phone services
<=1995 25 48 52 01995–2000 26 42 50 8>2000 15 40 47 13
Initial year of broadband internet access <=2005 34 44 56 02005–2010 17 52 24 24>2010 15 33 67 0
Distance to the nearest township road or higher-level road <3 km 60 43 50 73–10 km 0 n.a n.a n.a>=10 km 6 50 50 0
Distance to township <=2.5 km 21 48 43 92.5–5.0 km 22 36 64 0>5.0 km 23 48 43 9
continued on next page

Information and Communication Technology for Agriculture in the People's Republic of China36
The differences in the shares of farmers using computers among the groups by village conditions are presented in Table 4.16. The results show that in the villages with an express delivery point, post office, or CMCC or Unicom business office, significantly more farmers use computers, both desktop and laptops. Meanwhile, the distance to the express delivery point, post office, CMCC or Unicom business office seems negatively correlated with the share of farmers using computers. Also, recently established post offices or CMCC and Unicom business offices can better promote farmers’ use of computers, compared with the earlier established post offices or CMCC or Unicom business offices. Hence, the provision of express delivery points, post offices, or CMCC or Unicom business offices in the village could further facilitate farmers’ use of computers in rural areas of the PRC.
Table 4.16: Share of Farmers Using Desktop and Laptop by Village Conditions, 2016
CategoriesNumber of
ObservationsComputer Use
(%)With a package distribution or collection point
No 935 41Yes 338 54
Distance to the nearest package distribution or collection point Within 1 km 338 54<3 km 295 483–5 km 290 43>=5 km 350 34
With a post office No 1,082 43Yes 191 54
Distance to the nearest post office Within 1 km 191 54<3 km 358 513–5 km 360 42>=5 km 364 36
DescriptionNumber of
ObservationsDon’t Know
How to Use (%)
Time-consuming
(%)Othersa
(%)Distance to county
<=12.5 km 5 60 40 012.5–25.0 km 18 61 39 0>25.0 km 43 35 60 5
CMCC = China Mobile, km = kilometer, Unicom = China Unicom..a Other reasons refer to difficulties in transporting and earning money.Source: Authors’ compilation based on data from the third-round survey on e-commerce of the China Center for Agricultural Policy.
continued on next page
Table 4.15 continued

Access to Information and Communication Technology Infrastructure Based on Survey Data 37
CategoriesNumber of
ObservationsComputer Use
(%)Year established of the post office
<=2000 61 512000–2012 50 46>2012 80 55No post office 1,082 44
With a CMCC or Unicom business office No 952 43Yes 321 51
Distance to the nearest CMCC or Unicom business office Within 1 km 321 51<=2 km 351 552–4 km 301 43>4 km 300 29
Year established of the CMCC or Unicom business office<=2007 120 482007–2011 100 50>2011 101 56No CMCC or Unicom office 952 43
Initial year of mobile phone services <=1995 513 491995–2000 550 49>2000 210 26
Initial year of broadband internet access <=2005 468 552005–2010 435 47>2010 370 29
Distance to the nearest national highway <3 km 393 413–10 km 427 46>=10 km 453 47
Distance to township <=2.5 km 438 452.5–5.0 km 422 49>5.0 km 413 41
Distance to county <=12.5 km 465 5112.5–25.0 km 431 44>25.0 km 377 38
CMCC = China Mobile, km = kilometer, Unicom = China Unicom.Source: Authors’ compilation based on data from the first-round survey on e-commerce of the China Center for Agricultural Policy.
Table 4.16 continued

Information and Communication Technology for Agriculture in the People's Republic of China38
Table 4.17: Share of Respondents Learning Information on Production and Marketing through the Internet by Village Conditions, 2016
Categories ObservationProduction
(%)Marketing
(%)Total 1,273 5 9 With a package distribution or collection point
No 935 5 10 Yes 338 5 9
Distance to the nearest package distribution or collection pointWithin 1 km 338 5 9 <3 km 295 5 9 3–5 km 290 6 9 >=5 km 350 5 10
With a post office No 1,082 5 9 Yes 191 3 11
Distance to the nearest post office Within 1 km 191 3 11 <3 km 358 6 8 3–5 km 360 7 9 >=5 km 364 4 10
The initial year of use of mobile phone services and internet access are also correlated with the farmers’ use of computers. As shown in Table 4.16, in areas where mobile phone services or internet access were established earlier, the proportion of farmers using computers is higher. This result indicates that the establishment of ICT infrastructure and services are an important precondition for promoting farmers’ uses of computers. Moreover, the distance to county is negatively associated with the share of farmers using computers, suggesting that the farmers located in remote regions are less likely to use computers. Thus, the promotion of the use of computer should be prioritized among farmers in remote regions.
Table 4.17 further compares the share of respondents who learn information on production and marketing through the internet among different groups. Unfortunately, due to the relatively low proportion of farmers learning production and marketing formation online, the differences among groups are insignificant. An exception is with regard to the status of CMCC and/or Unicom business offices. Respondents have a slightly higher proportion of learning production and marketing information through the internet in villages that have a CMCC and/or Unicom business office, or are near a CMCC and/or Unicom business office.
continued on next page

Access to Information and Communication Technology Infrastructure Based on Survey Data 39
Categories ObservationProduction
(%)Marketing
(%)Year post office was established
<=2000 61 3 5 2000–2012 50 2 18 >2012 80 1 10
Without 1 year 1,082 6 9
With a CMCC or Unicom business office No 952 5 8 Yes 321 6 14
Distance to the nearest CMCC or Unicom business office Within 1 km 321 6 14 <=2 km 351 6 9 2–4 km 301 5 7 >4 km 300 3 7
Year established of the CMCC or Unicom business office <=2007 120 4 13 2007–2011 100 7 13 >2011 101 6 16 Within 1 year 952 5 8
Initial year of mobile phone services <=1995 513 5 9 1995–2000 550 5 11 >2000 210 4 5
Initial year of broadband internet access <=2005 468 5 12 2005–2010 435 6 9 >2010 370 4 6
Distance to the nearest national highway<3 km 393 4 6 3–10 km 427 7 13 >=10 km 453 4 9
Distance to township <=2.5 km 438 7 9 2.5–5.0 km 422 4 8 >5 km 413 5 11
Distance to county<=12.5 km 465 6 9 12.5–25 km 431 5 10 >25 km 377 4 9
CMCC = China Mobile, km = kilometer, Unicom = China Unicom..Source: Authors’ compilation based on data from the first-round survey on e-commerce of the China Center for Agricultural Policy.
Table 4.17 continued

Information and Communication Technology for Agriculture in the People's Republic of China40
4.5. The Operation of E-Commerce in Selling Agricultural ProductsBased on the data from the typical survey in Shandong and Zhejiang provinces, this subsection describes the operation of e-commerce in selling agricultural products by farmers, including apples, peaches, pecans, sweet potatoes, and kiwifruits. Results are presented in Tables 4.18 to 4.20. It is worth noting that the results presented here are based on the 250 household surveys from 20 villages in five counties, of which 100 households with e-commerce and 50 households without e-commerce are from e-commerce villages, and 100 households are from non-e-commerce villages but some households are also engaged in e-commerce. Therefore, there should be careful interpretation of the results presented in this subsection due to the nature of the sampling approach. The most useful information is the change over time and the difference in the percentage of products sold through e-commerce by different classes (grades) of the product.
Table 4.18 presents the percentages of online sales and its shares by different grades of apple. The results show that while there is not much difference in the percentage of online sales of apples (about 35%) from 2015 to 2017, there is large difference in the share of online sales by apple grade. Second-class apples have a higher share of online sales. However, in total, 67.2% of the online sales were for first-class apples despite only 33.1% of them were sold online in 2017 (Table 4.18).
Table 4.18: Percentage of Online Sales and Shares in Different Classes of Produce, 2015–2017
DescriptionOnline Sales Shares per Class
2015 2016 2017 2015 2016 2017Apples 35.4 35.8 35.4 100.0 100.0 100.0
First class 33.5 33.9 33.1 67.6 68.1 67.2Second class 43.2 43.4 43.5 32.3 31.8 32.7Third class 2.3 3.2 3.6 0.1 0.1 0.1
Peaches 13.5 32.7 37.4 100.0 100.0 100.0First class 10.9 39 48.9 32.6 54.2 64.1Second class 13.4 26.2 24.8 34.7 24.9 21.7Third class 20.7 32.2 32.8 32.7 20.9 14.2
Pecans 66.4 67.6 61.4 100.0 100.0 100.0 Highly processed pecans 86.2 85.8 76.3 51.8 50.5 44.1 Processed pecans 55.6 59.3 55.5 47.9 49.5 55.9 Roughly processed pecans 8.0 0 0 0.3 0 0Kiwifruits 50.7 50.1 46.4 100.0 100.0 100.0
First class 47.8 47.3 44.9 49.1 57 56.9Second class 59.0 56.0 54.9 33.6 30.9 31.1Third class 54.2 52.6 46.1 15.6 10.6 10.3Fourth class 0 0 0.3 0 0 0.02
continued on next page

Access to Information and Communication Technology Infrastructure Based on Survey Data 41
DescriptionOnline Sales Shares per Class
2015 2016 2017 2015 2016 2017Red kiwifruit 0 63.1 39.1 1.8 1.5 1.7Sweet potatoes 31.4 44.1 50.5 100.0 100.0 100.0
First class 32.3 43.4 49.1 82.4 78.5 72.6Second class 33.5 46.7 56.1 16 15.9 21.4Third class 10.5 46 49.3 1.6 5.5 5.9
Dried sweet potatoes 0 100.0 100.0 0 0.1 0.1
Source: Authors’ compilation based on data from the third-round survey on e-commerce of the China Center for Agricultural Policy.
Peaches are also among the major products sold online in the study areas. The percentage of online sales of peaches increased from 13.5% in 2015 to 37.4% in 2017, and although first-class peaches accounted for the most online sales in 2016 and 2017, less than 50% of them were sold online. As for pecans, 61.4% of those produced were sold online in 2017; 44.1% of online sales were of the highly processed type, which accounts for 76.3% of highly processed pecans sold.
The percentage of online sales of kiwifruits decreased slightly from 50.7% in 2015 to 46.4% in 2017. This is because the total output of kiwifruits increased rapidly in the surveyed villages. The percentage of online sales of sweet potatoes increased from 31.4% in 2015 to 50.5% in 2017, and more than 70% of them were of the first-class type.
Table 4.19 shows the percentage of online sales and number of platforms used in online sales for the commodities surveyed in the sample villages. In general, the percentages of online sales increased significantly over time, rising from 9.9% in 2013 to 45.0% in 2017. However, the structure on the number of e-commercial platforms used by farmers did not change. Nearly two-thirds of the respondents used one platform while about a third used two.
Table 4.18 continued
Table 4.19: Percentage of Online Sales and the Platforms Used, 2013-2017
YearShare of
Online Sales
Online SalesOne
PlatformTwo
PlatformsThree
Platforms2013 9.9 65 33 22014 18.3 62 36 32015 25.0 62 35 32016 37.5 64 34 22017 45.0 65 32 3
Source: Authors’ compilation based on data from the third-round survey on e-commerce of the China Center for Agricultural Policy.
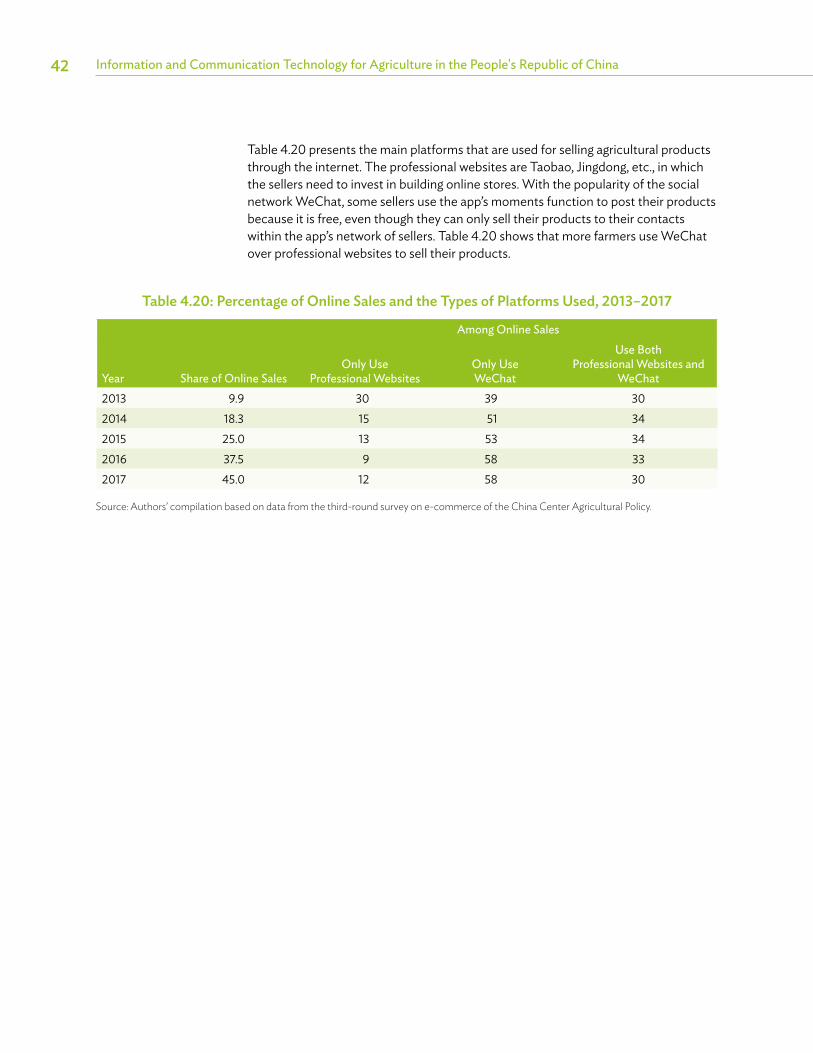
Information and Communication Technology for Agriculture in the People's Republic of China42
Table 4.20 presents the main platforms that are used for selling agricultural products through the internet. The professional websites are Taobao, Jingdong, etc., in which the sellers need to invest in building online stores. With the popularity of the social network WeChat, some sellers use the app’s moments function to post their products because it is free, even though they can only sell their products to their contacts within the app’s network of sellers. Table 4.20 shows that more farmers use WeChat over professional websites to sell their products.
Table 4.20: Percentage of Online Sales and the Types of Platforms Used, 2013–2017
Year Share of Online Sales
Among Online Sales
Only Use Professional Websites
Only Use WeChat
Use Both Professional Websites and
WeChat2013 9.9 30 39 302014 18.3 15 51 342015 25.0 13 53 342016 37.5 9 58 332017 45.0 12 58 30
Source: Authors’ compilation based on data from the third-round survey on e-commerce of the China Center Agricultural Policy.

43
5.1. Marketing ProductsTable 5.1 presents the marketing of products by 1,273 rural households and their willingness to sell online in 2016. The products surveyed included grain, cash crops, vegetables, fruit, animal products, and others. Among rural households surveyed, 45% sold their grain. Fruit (11%) and animal (12%) were the second most agricultural products that were sold by rural households. These were followed by other cash crops (9%) and vegetables (8%). For this national representative sample, there were barely households that had sold their products online by 2016. In total, there was only about 2% of household that sold their products online.
Chapter 5 Uses of Information and CommunicationTechnologies in Agriculture and E-Commerce Based on Survey Data
Table 5.1: Percentages of Rural Households Selling Their Products and Their Attitudes Toward Operating E-Commerce, 2016 (%)
Products Sells Product Sells Product OnlineWilling to Sell Their
Product OnlineUnwilling to Sell Their
Product Online
Grain 45.0 0.0 11.0 34.0
Fruit 11.0 0.8 4.4 6.3Vegetables 9.0 0.1 2.0 7.0Other crops 9.0 0.0 2.0 7.0Animal 12.0 0.0 3.0 9.0Others 7.0 0.0 2.0 5.0
Source: Authors’ compilation based on data from the first-round survey on e-commerce of the China Center for Agricultural Policy.
However, there are a large number of rural households that are willing to sell their products online. For example, among those selling grain, 24% (11/45) of them said they are willing to sell their products online (Table 5.1). The percentage is even higher for those selling fruits (about 40%), while those selling other produce range from 22% to 29%.
Table 5.2 presents the reasons for their willingness to sell online by commodity. Those who are willing to sell online said that this is mainly because they believe they could sell their products at higher prices online and because they think selling online is more convenient. There are also some farmers, particularly those who produce and sell vegetables, who believe that they can find more buyers online.

Information and Communication Technologies for Agriculture in the People's Republic of China44
Table 5.2: Reasons for Being Willing to Operate E-Commerce by Agricultural Products, 2016
CropsNumber of
Observations
ResponsesConvenience
(%)More Buyers
(%)Higher Prices
(%)Grain 143 45 7 48Fruit 51 35 6 59Vegetables 29 45 34 21Other crops 23 57 9 35Animal 38 37 18 45Others 24 42 17 42
Source: Authors’ compilation based on data from the first-round survey on e-commerce of the China Center for Agricultural Policy.
Table 5.3 presents the respondents’ reasons for being unwilling to sell online in 2016. The main reason for most households was their lack of knowledge and skills with respect to agricultural products, followed by a perception that online selling is inconvenient, and the lack of trust in online transactions.
Table 5.3: Reasons for Being Unwilling to Operate E-Commerce by Agricultural Products, 2016
ProductsNumber of
Observations
Responses
Lack of Knowledge and
Skills(%)
Inconvenience(%)
Poor Trust(%)
No Need
(%)
Lower Prices
(%)
Poor Storage and
Transportation Conditions
(%)Grain 428 41 18 17 12 5 1
Cash crops 88 47 17 14 12 2 0Vegetables 83 52 8 17 7 7 4Fruit 80 41 13 16 8 8 4Animal 111 45 21 13 11 4 0Others 60 60 13 11 3 5 5
Source: Authors’ compilation based on data from the first-round survey on e-commerce of the China Center for Agricultural Policy.
5.2. Purchasing Agricultural Inputs Table 5.4 presents the attitude toward purchasing agricultural inputs by 1,273 rural households in 2016, including seeds, pesticides, herbicides, fertilizers, agricultural machinery, veterinary medicine, feeds, and others. Of the respondent households, 84.0% bought fertilizer, but only 0.1% of households bought fertilizers online. Similarly, over 80.0% of the households bought pesticides, herbicides, and seeds, but less than 0.5% bought online. Around 20.0% of households purchased agricultural

Use of Information and Communication Technologies in Agriculture and E-Commerce Based on Survey Data 45
machinery, veterinary medicine, and feeds, but only around 0.2% shopped online. Of the respondent households that bought agricultural inputs not from online sources, less than 15% of the households were willing to buy seeds, pesticides, herbicides, and fertilizers online, while around 70% were not. Only 3% of the households surveyed were willing to buy agricultural machinery, veterinary medicine, and feeds online, and more than 10% were not.
Table 5.4: Attitudes Toward Purchasing Agricultural Inputs by Households, 2016 (%)
Inputs Bought the Product Bought Online Willing to Buy Online Unwilling to Buy OnlineSeed 79.0 0.2 12 66Pesticide 83.0 0.2 14 69Herbicide 79.0 0.3 13 66Fertilizer 84.0 0.1 14 70Agricultural machinery 15.0 0.2 3 11Veterinary medicine 14.0 0.2 3 10Feed 17.0 0.1 3 14
Note: The total sample is 1,273 households.Source: Authors’ compilation based on data from the first-round survey on e-commerce of the China Center for Agricultural Policy.
Table 5.5 presents the reasons for the households’ willingness to buy agricultural inputs online according to the 2016 survey, the most common of which is convenience. The second most significant reason is the lower prices online, while the rest of the households are willing to buy agricultural inputs online because of product diversity and better quality.
Table 5.5: Reasons for Being Willing to Buy Agricultural Inputs Online, 2016 (%)
InputsNumber of
Observations
ResponsesConvenience
(%)Lower Prices
(%)Product Diversity
(%)Better Quality
(%)Seed 151 46 41 8 5Pesticide 172 47 41 7 5Herbicide 168 47 42 7 4Fertilizer 172 47 42 8 3Agricultural machinery 43 49 40 12 0Veterinary medicine 37 54 38 8 0Feed 36 56 33 11 0
Source: Authors’ compilation based on data from the first-round survey on e-commerce of the China Center for Agricultural Policy.

Information and Communication Technologies for Agriculture in the People's Republic of China46
Table 5.6 presents the reasons that households were willing or unwilling to buy agricultural inputs online. Most households said that they lacked the necessary knowledge and skills to buy products online while many did not trust online transactions. Some households felt that buying products online meant they would have little control over quality, while others thought online shopping was inconvenient. A small percentage of the surveyed households believed that there was no need to buy online or agricultural inputs cost higher if bought online.
Table 5.6: Reasons for Being Unwilling to Buy Agricultural Inputs Online, 2016
InputNumber of
Observations
Responses
Lack of Knowledge and Skills
(%)
Poor Trust(%)
Weak Control
over Quality(%)
Inconvenience(%)
NoNeed(%)
Higher Prices
(%)Seed 846 38 21 16 14 7 1Pesticide 877 40 20 15 14 8 1Herbicide 835 39 20 14 14 8 1Fertilizer 894 40 20 15 13 8 1Agricultural machinery 145 36 21 15 14 9 1Veterinary medicine 133 44 18 14 14 8 1Feed 178 39 22 12 18 6 1Others 8 75 0 13 13 0 0
Source: Authors’ compilation based on data from the first-round survey on e-commerce of the China Center for Agricultural Policy.
5.3. Custom Services Related to Agricultural Production The survey found that about half of the respondent households bought custom services for their agricultural production in 2016, although none of them bought these services through the internet. Table 5.7 presents the willingness of farmers to buy custom services in agricultural production online. In general, more than 78% of rural households were not willing to buy custom services for their agricultural production online in 2016. This is especially true for ploughing, seeding, spraying pesticides, irrigating, weeding, harvesting and others, where more than 80% of the rural households surveyed said that they are not willing to buy custom services for their agricultural production over the internet.
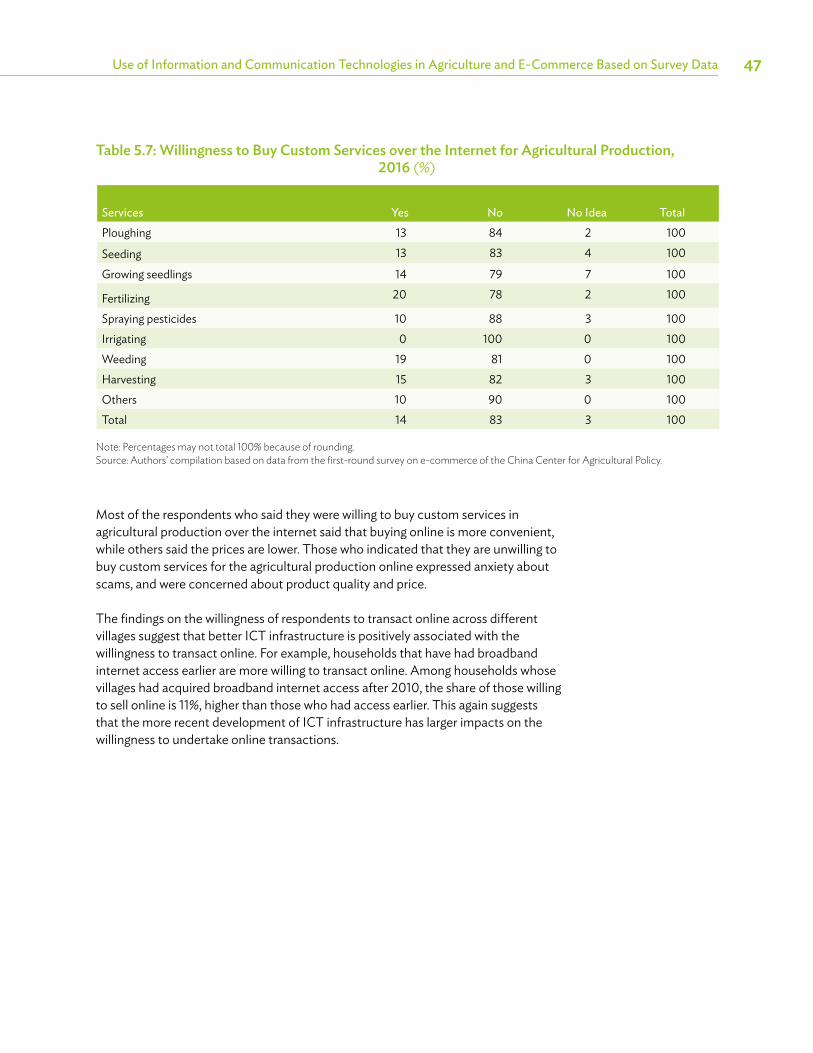
Use of Information and Communication Technologies in Agriculture and E-Commerce Based on Survey Data 47
Table 5.7: Willingness to Buy Custom Services over the Internet for Agricultural Production, 2016 (%)
Services Yes No No Idea TotalPloughing 13 84 2 100Seeding 13 83 4 100Growing seedlings 14 79 7 100
Fertilizing 20 78 2 100
Spraying pesticides 10 88 3 100Irrigating 0 100 0 100Weeding 19 81 0 100Harvesting 15 82 3 100Others 10 90 0 100Total 14 83 3 100
Note: Percentages may not total 100% because of rounding.Source: Authors’ compilation based on data from the first-round survey on e-commerce of the China Center for Agricultural Policy.
Most of the respondents who said they were willing to buy custom services in agricultural production over the internet said that buying online is more convenient, while others said the prices are lower. Those who indicated that they are unwilling to buy custom services for the agricultural production online expressed anxiety about scams, and were concerned about product quality and price.
The findings on the willingness of respondents to transact online across different villages suggest that better ICT infrastructure is positively associated with the willingness to transact online. For example, households that have had broadband internet access earlier are more willing to transact online. Among households whose villages had acquired broadband internet access after 2010, the share of those willing to sell online is 11%, higher than those who had access earlier. This again suggests that the more recent development of ICT infrastructure has larger impacts on the willingness to undertake online transactions.

48
Chapter 6 Major Factors Affecting Applications of Information and Communication Technology in Agriculture
This chapter explores the factors that may affect the adoption of e-commerce by farmers based on data from the case study survey in Shandong and Zhejiang provinces.
6.1. Major Factors at Village LevelTable 6.1 presents the differences in village conditions between villages that operate e-commerce enterprises and those that do not. The results show that the e-commercial villages are slightly closer to the local townships and counties than the non-e-commercial villages. The distance of e-commercial villages to the nearest farmers’ market, road, and other e-commercial villages are shorter than that for non-e-commercial villages. Mobile phone services and broadband internet access were established earlier in e-commercial villages. More e-commercial villages have post offices, online shopping stores, and local mail carrier and/or courier.
Table 6.1: Differences in Village Conditions between E-Commercial and Non-E-Commercial Villages
DescriptionE-Commercial
VillagesNon-E-Commercial
VillagesDistance to local township (km) 7.4 7.5Distance to local county (km) 35.9 39.2Distance to the nearest farmers’ market (km) 4.7 10.7Distance to the nearest road (km) 0.4 2.5Distance to the nearest e-commercial village 4.3 8.2Initial year of mobile phone services 1998 2001Initial year of broadband internet access 2005 2009With post office (yes=1, otherwise =0) 0.2 0.1With online shopping store (yes=1, otherwise =0) 0.4 0.2With local postal worker or delivery worker (yes=1, otherwise =0) 0.8 0.6With local company (yes=1, otherwise =0) 0.5 0.4
km = kilometer.Source: Authors’ compilation based on data from the third-round survey on e-commerce of the China Center for Agricultural Policy.

Major Factors Affecting Applications of Information and Communication Technology in Agriculture 49
6.2. Major Factors at Household LevelTable 6.2 compares household conditions of those with and without online sales. In the sample, 59% of households interviewed in 2018 experienced online sales, and the remaining 41% did not . Among 250 households, 224 households are less than 2 km away from their village committees, and 60% of them had online sales. Out of the 250 households, 10 households are more than 5 km away from their village committees, and only 30% of them had online sales. This suggests that households have a higher possibility to adopt online sales if they are closer to their village committees. The distance of the households to townships, counties, the nearest motor roads, package distribution and/or collection points, and neighbors also matter. If the services of a courier picking up goods from the home were available, the percentage of households that would be selling online would be higher. Households that sell online have more relatives who sell agricultural products through the internet. Most of the households do not have e-commerce subsidies, and only 13 households who have had online sales have been subsidized.
Table 6.2: Comparing Household Conditions between Households With and Without Online Sales
Description Number of ObservationsWith Online Sales
(%)Without
Online Sales (%)Total 250 59 41Distance to village committee
<=2 km 224 60 402–5 km 16 63 38>5 km 10 30 70
Distance to township<=5 km 157 64 365–10 km 44 55 45>10 km 49 45 55
Distance to county<=25 km 113 63 3725–60 km 99 63 37>60 km 38 37 63
Distance to the nearest motor road<=1 km 222 58 421–10 km 26 65 35>10 km 2 100 0
Distance to the nearest neighbor<=20 m 240 59 41>20 m 10 50 50
continued on next page

Information and Communication Technologies for Agriculture in the People's Republic of China50
Description Number of ObservationsWith Online Sales
(%)Without
Online Sales (%)Distance to the nearest package distribution or collection point
<=2 km 109 65 352–10 km 128 52 48>10 km 13 77 23
Distance to the nearest CMCC or Unicom business<=5 km 173 64 365–15 km 56 43 57>15 km 21 57 43
Can the courier pick up from home? Yes 119 78 22No 131 41 59
With internet access?Yes 217 63 37No 33 30 70
With 2G/3G/4G network?Yes 226 62 38No 24 25 75
With computer?Yes 198 66 34No 52 31 69
Initial year to buy the first computer<=2005 28 89 112006–2010 83 71 292011–2015 81 52 48>2015 6 83 17
With online shopping experiences?Yes 168 77 23No 82 22 78
With relatives who sell agricultural products through the internet?Yes 183 68 32No 67 34 66
Member of a cooperative?Yes 81 70 30No 169 53 47
With e-commercial subsidy?Yes 13 100 0No 237 57 43
CMCC = China Mobile, km = kilometer, m = meter, Unicom = China Unicom.Source: Authors’ compilation based on data from the third-round survey on e-commerce of the China Center for Agricultural Policy.
Table 6.2 continued

Major Factors Affecting Applications of Information and Communication Technology in Agriculture 51
Table 6.3 shows that the households with online sales are more aware of internet development, making payments over the internet, online shopping, and development of rural e-commerce than the households without online sales. A significant proportion of those surveyed do not have information about the internet, and the households without online sales account for most of these.
Table 6.3: Comparing the Information Awareness of Households With and Without Online Sales
Description Number of ObservationsWith Online Sales
(%)Without Online Sales
(%)Total 250 59 41Internet development
Not aware 107 36 64Below the average 30 50 50Average 38 68 32Above the average 54 89 11Know it very well 21 90 10
Internet paymentsNot aware 87 31 69Below the average 29 55 45Average 30 50 50Above the average 64 86 14Know it very well 40 85 15
Online shoppingNot aware 95 32 68Below the average 28 64 36Average 33 52 48Above the average 58 81 19Know it very well 36 97 3
Development of rural e-commerceNot aware 107 35 65Below the average 37 62 38Average 38 66 34Above the average 41 90 10Know it very well 27 93 7
Source: Authors’ compilation based on data from the third-round survey on e-commerce of the China Center for Agricultural Policy.
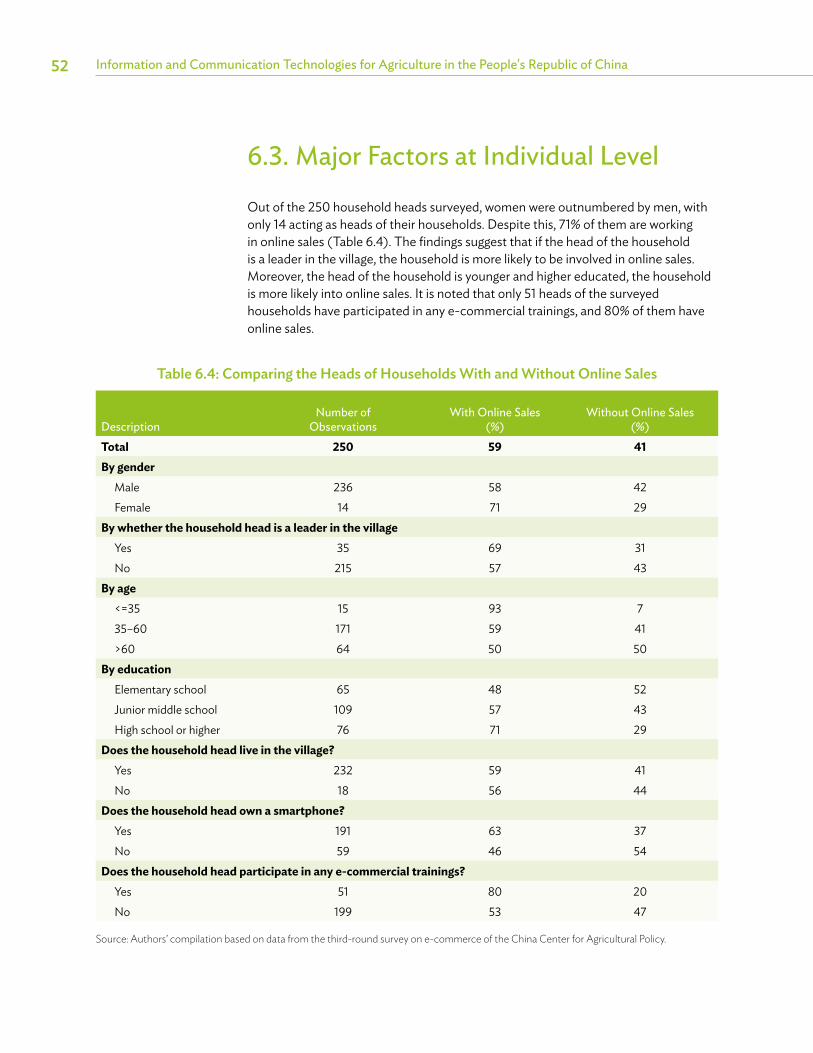
Information and Communication Technologies for Agriculture in the People's Republic of China52
6.3. Major Factors at Individual LevelOut of the 250 household heads surveyed, women were outnumbered by men, with only 14 acting as heads of their households. Despite this, 71% of them are working in online sales (Table 6.4). The findings suggest that if the head of the household is a leader in the village, the household is more likely to be involved in online sales. Moreover, the head of the household is younger and higher educated, the household is more likely into online sales. It is noted that only 51 heads of the surveyed households have participated in any e-commercial trainings, and 80% of them have online sales.
Table 6.4: Comparing the Heads of Households With and Without Online Sales
DescriptionNumber of
ObservationsWith Online Sales
(%)Without Online Sales
(%)Total 250 59 41By gender
Male 236 58 42Female 14 71 29
By whether the household head is a leader in the villageYes 35 69 31No 215 57 43
By age<=35 15 93 735–60 171 59 41>60 64 50 50
By educationElementary school 65 48 52Junior middle school 109 57 43High school or higher 76 71 29
Does the household head live in the village? Yes 232 59 41No 18 56 44
Does the household head own a smartphone?Yes 191 63 37No 59 46 54
Does the household head participate in any e-commercial trainings? Yes 51 80 20No 199 53 47
Source: Authors’ compilation based on data from the third-round survey on e-commerce of the China Center for Agricultural Policy.

Major Factors Affecting Applications of Information and Communication Technology in Agriculture 53
Table 6.5 shows that respondents from the households selling goods online have more contacts in their phones. For example, 109 respondents have more than 200 contacts in their phone directories, and 81% of them are from the households with online sales. The respondents from the households that sell online have more phone calls on average per day and use their phones for longer hours than households that are not involved in online sales. The findings also indicate how WeChat plays a significant role in online sales.
Table 6.5: Comparing Smartphone Usage Among Households With and Without Online Sales
DescriptionNumber of
ObservationsWith Online Sales
(%)Without Online Sales
(%)Total 250 59 41Number of contacts in phone directory
<=50 58 26 7450–200 83 53 47>200 109 81 19
Average number of phone calls per day<=5 120 43 585–20 107 70 30>20 23 91 9
Number of hours of phone use per day<=2 123 36 642–5 79 77 23>5 48 38 13
Using WeChat?Yes 209 67 33No 41 17 83
Number of contacts in WeChat directory<=50 34 24 7650–200 73 56 44>200 102 89 11
Using WeChat moments?Yes 195 70 30No 14 21 79
Frequency of use of Alipay or WeChat PayVery few 77 21 79Sometimes 34 35 65Once a week 17 71 29Three times a week 49 82 18Every day 73 92 8
Source: Authors’ compilation based on data from the third-round survey on e-commerce of the China Center for Agricultural Policy.

Information and Communication Technologies for Agriculture in the People's Republic of China54
6.4. The Barriers and Drivers of E-Commerce Development in Rural Areas of the People’s Republic of ChinaThe analysis of the barriers and drivers of e-commerce development gives some clues for investment in the strategy of developing the rural PRC. Table 6.6 presents the main barriers of operating e-commerce for the households that have had online selling experiences (i.e., e-commercial households). There are some differences in the extent of these barriers between e-commercial and non-e-commercial villages, but the biggest barriers for both is the lack of fresh-keeping and storing facilities, the high cost of logistics, a lack of operating e-commerce skills, and a lack of packing and marketing skills.
Table 6.6: Major Barriers to Operating E-Commerce for E-Commercial Households, 2017
Major Barriers E-Commercial Village Non-E-Commercial VillageLack of operating e-commerce skills 27.5 28.9High costs of logistics 33.0 34.2Lack of fresh-keeping and storing facilities 48.6 36.8Lack of packing and marketing skills 22.0 15.8
Source: Authors’ compilation based on data from the third-round survey on e-commerce of the China Center for Agricultural Policy.
Table 6.7 shows the main reasons for not operating e-commerce for the households with no online selling experiences yet (i.e., non-e-commercial households). For e-commercial and non-e-commercial villages, the main reason is the lack of operating e-commerce skills, lack of fresh-keeping and storing facilities, lack of packing and marketing skills, as well as the high costs of logistics.
Table 6.7: Major Reasons for Not Operating E-Commerce, 2017
Major Reasons E-Commercial Village Non-E-Commercial Village Lack of operating e-commerce skills 68.3 69.4High costs of logistics 9.8 12.9Lack of fresh-keeping and storing facilities 46.3 29.0Lack of packing material and marketing skills 19.5 17.7
Source: Authors’ compilation based on data from the third-round survey on e-commerce of the China Center for Agricultural Policy.

Major Factors Affecting Applications of Information and Communication Technology in Agriculture 55
Based on interviews with farmers, local officials, and traders, the survey found the following major barriers to rural e-commerce development that are also consistent with the results presented in the preceding tables.
(i) Logistics. The cost of shipping agricultural products, especially from the farm gate to consumers are quite high. Most logistics companies establish their smallest offices in towns, rather than reach the villages directly, because of the high costs. In this case, farmers who sell their products through e-commerce would have to send their goods to the post offices in the town. This is inconvenient for the farmers and may also cause losses of agricultural products because of poor shipping and packing.
(ii) Storage. Small farmers do not have their own professional-quality storage. For example, apple farmers store their apples in the shared cold storages that are operated by local businessmen. This constrains the farmers from selling their apples online because the rented storages are not allowed to be opened casually. As such, farmers could not supply goods to consumers in time. Typically commercial orders are small, which leads to high labor costs.
(iii) Characteristics of agricultural products. Most agricultural products are fresh and seasonal. Ensuring the produce’s freshness increases the costs of packing and shipping. Because crops are seasonal, supplies are unstable and requires spending on storage costs. Stocking goods also causes financial pressure considering that agricultural products are purchased during the harvest time and stored to be sold over the whole year.
(iv) Human capital. Operating online stores requires knowledge about computers and the internet, especially on the big e-commercial platforms like Taobao, etc. Farmers in the PRC are aging. Most of them are in their 50s and 60s, who are not familiar with using computers and smartphones. As such, many of them are not capable of running the online stores by themselves. Although some farmers use WeChat to sell their products, their potential consumers are very limited because the WeChat selling platform is limited to the available contacts. However, the social network of most farmers include local people who are not potential buyers of the farmers’ agricultural products. Although local governments and organizations conduct trainings on e-commerce, these are often too theoretical and delivered in a way that is not easily understood by farmers. In addition, not all farmers have access to training opportunities.
(v) Thresholds to start e-commerce. Big e-commercial platforms typically require farmers to submit official certificates and documents for them to be able to sell food and related goods through their network. This means that small landholders who do not have the means to acquire these documents are automatically disqualified from selling their goods in these vast network.

Information and Communication Technologies for Agriculture in the People's Republic of China56
Apart from the good condition of infrastructure, such as roads and internet, the other main factors driving e-commerce development in rural areas of the PRC include the following.
(i) Well-founded agricultural industry. There are many more possibilities to start e-commerce in regions where the agricultural industry is well founded. For example, Qixia city is famous for producing apples for years. The apple industry is its major agricultural industry and local farmers mostly plant apple trees. Before the advent of e-commerce, all of the apples had been sold by middlemen and local companies. More and more people have tried to sell their apples through e-commerce in recent years.
(ii) Existence of large e-commercial retailers. The successful cases of e-commercial retailers can stimulate local farmers to start their own e-commerce career, especially in the case of large e-commercial retailers who engage in selling local agricultural products.
(iii) Social capital of farmers. Farmers may start to engage in e-commerce if their friends, neighbors, or relatives are doing it. Farmers can learn about e-commerce from these contacts.
(iv) Guidance of local government. The local government plays an important role in developing local e-commerce. For example, more trainings targeted at farmers and advertisements on developing e-commerce in rural areas can raise the farmers’ awareness on developing e-commerce. If local governments invest more on improving the infrastructure and connectivity in rural areas, such as internet connectivity and roads, this would enable farmers to engage in e-commerce.
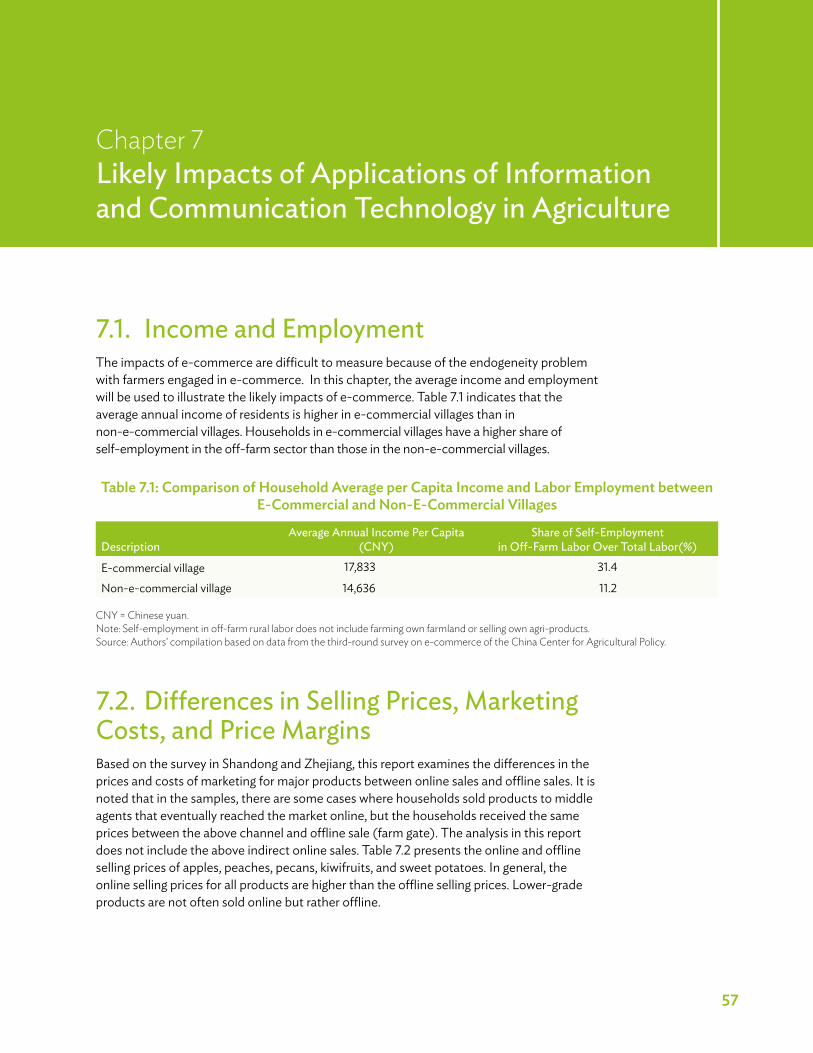
57
Chapter 7Likely Impacts of Applications of Information and Communication Technology in Agriculture
7.1. Income and EmploymentThe impacts of e-commerce are difficult to measure because of the endogeneity problem with farmers engaged in e-commerce. In this chapter, the average income and employment will be used to illustrate the likely impacts of e-commerce. Table 7.1 indicates that the average annual income of residents is higher in e-commercial villages than in non-e-commercial villages. Households in e-commercial villages have a higher share of self-employment in the off-farm sector than those in the non-e-commercial villages.
Table 7.1: Comparison of Household Average per Capita Income and Labor Employment between E-Commercial and Non-E-Commercial Villages
DescriptionAverage Annual Income Per Capita
(CNY)Share of Self-Employment
in Off-Farm Labor Over Total Labor(%)E-commercial village 17,833 31.4Non-e-commercial village 14,636 11.2
CNY = Chinese yuan.Note: Self-employment in off-farm rural labor does not include farming own farmland or selling own agri-products.Source: Authors’ compilation based on data from the third-round survey on e-commerce of the China Center for Agricultural Policy.
7.2. Differences in Selling Prices, Marketing Costs, and Price MarginsBased on the survey in Shandong and Zhejiang, this report examines the differences in the prices and costs of marketing for major products between online sales and offline sales. It is noted that in the samples, there are some cases where households sold products to middle agents that eventually reached the market online, but the households received the same prices between the above channel and offline sale (farm gate). The analysis in this report does not include the above indirect online sales. Table 7.2 presents the online and offline selling prices of apples, peaches, pecans, kiwifruits, and sweet potatoes. In general, the online selling prices for all products are higher than the offline selling prices. Lower-grade products are not often sold online but rather offline.

Information and Communication Technologies for Agriculture in the People's Republic of China58
Table 7.2: Online and Offline Selling Prices
DescriptionOnline Sales Offline Sales
2015 2016 2017 2015 2016 2017
Apple
First class 12.2 11.9 12.0 7.6 6.9 7.1
Second class 9.1 9.0 9.0 4.9 4.3 4.5
Peach
First class 15.0 15.0 15.1 7.3 7.7 7.7
Second class 10.2 9.9 10.1 4.5 5.0 5.0
Third class 9.7 9.1 8.5 3.2 2.9 3.2
Pecan
Highly processed 164.8 175.2 177.8 154.4 161.2 170.2
Processed 111.4 108.8 113.8 97.8 98.6 98.4
Roughly processed 94.0 101.3 99.9 58.6 59.8 56.0
Kiwifruit
First class 35.2 33.4 34.4 18.0 20.0 21.4
Second class 25.3 29.8 25.4 13.0 15.4 14.6
Third class 19.7 23.0 18.0 8.5 8.7 8.9
Sweet potato
First class 13.3 12.8 12.2 7.0 8.3 6.3
Second class 11.2 8.2 11.6 6.4 5.1 6.0
Third class 8.5 6.5 6.5 3.8 3.6 3.5
Mixed 9.5 10.5 11.4 6.1 7.4 6.1
CNY = Chinese yuan, kg = kilogram.Source: Authors’ compilation based on data from the third-round survey on e-commerce of the China Center for Agricultural Policy.
Table 7.3 presents the online and offline marketing costs. The results show that online selling costs for all products are much higher than those of offli ne selling. For example, the online selling cost of first-class apples was four times higher than the offline cost in 2017. Similar results were found for all the other products.

Likely Impacts of Applications of Information and Communication Technology in Agriculture 59
Table 7.3: Online and Offline Marketing Costs
DescriptionOnline Sales Offline Sales
2015 2016 2017 2015 2016 2017
Apple
First class 3.5 3.8 3.9 0.8 0.8 0.8
Second class 3.6 3.8 3.8 0.8 0.8 0.7
Peach
First class 4.7 4.5 4.4 0.7 0.8 0.8
Second class 4.5 4.9 4.8 0.7 0.7 0.8
Third class 5.2 5.2 4.9 0.7 0.7 0.6
Pecan
Highly processed 16.8 17.6 17.2 14.6 16.4 16.0
Processed 12.1 12.8 13.6 6.6 6.6 6.8
Roughly processed 13.7 15.3 16.4 1.0 0.8 1.2
Kiwifruit
First class 4.8 4.6 4.8 0.6 0.6 0.7
Second class 4.4 4.4 4.6 0.8 0.6 0.7
Third class 4.8 5.5 5.1 0.8 0.7 0.6Sweet potato
First class 2.8 2.9 3.2 0.3 0.3 0.3
Second class 2.4 3.1 3.1 0.3 0.2 0.3
Third class 2.5 2.6 2.8 0.5 0.5 0.4
Mixed 3.2 2.6 2.4 0.3 0.3 0.3
CNY = Chinese yuan, kg = kilogram.Source: Authors’ compilation based on data from the third-round survey on e-commerce of the China Center for Agricultural Policy.
Table 7.4 presents the difference of price margins (selling price minus marketing cost) between online and offline selling. Notably, selling costs do not include any fixed cost and salary for self-employment. The price margin of apples through online sales is slightly higher than that of offline sales. The price margin of peaches through online sales for all grades is higher than offline sales. Although processed pecans sold online have a lower price margin, the highly processed and roughly processed pecan sold online has higher price margins. The price margin of kiwifruits sold online for all grades are higher than those sold offline. Similarly, the price margin of sweet potatoes sold online for all classes are higher than those sold offline. The results presented in Table 7.4 suggest that the price margin for goods sold through the internet is generally

Information and Communication Technologies for Agriculture in the People's Republic of China60
higher than those for products sold offline. However, online sales also entail a higher fixed cost through investment and more self-employment that have not been taken account in the above analyses.
Table 7.4: Comparing Price Margins of Online and Offline Sales, by Commodity (CNY/kg)
DescriptionOnline versus Offline Sales
2015 2016 2017
AppleFirst class 1.9 2.1 1.8Second class 1.5 1.7 1.4
PeachFirst class 4.2 3.7 3.8Second class 2.0 0.8 1.1Third class 2.1 1.8 1.2
PecanHighly processed 8.2 12.8 6.4Processed 8.1 4.0 8.6Roughly processed 22.7 27.0 28.7
KiwifruitFirst class 13.0 9.4 8.9Second class 8.7 10.6 6.9Third class 7.3 9.5 4.6
Sweet potatoFirst class 1.9 1.9 3.0Second class 2.6 0.2 2.8Third class 2.7 0.8 0.6Mixed 0.5 0.8 3.1
CNY = Chinese yuan, kg = kilogram.Note: Cost excludes fixed cost and salary for self-employment.Source: Authors’ compilation based on data from the third-round survey on e-commerce of the China Center for Agricultural Policy.

61
Chapter 8Investment in Information and Communication Technology in Agriculture and Rural E-Commerce
8.1. Investment by Households on Fixed AssetsTable 8.1 documents major investments in fixed assets by e-commercial households, including office sites, internet facilities, transporting vehicles, warehouses, and processing facilities. In general, almost half of the households surveyed have invested in office sites and internet facilities (computer, printers, etc.). About 25% of the surveyed households have invested in transportation vehicles and warehouses while 14% invested in processing their own products. Compared with Shandong province, there is a higher percentage of households in Zhejiang that have invested in these fixed assets for undertaking e-commerce. For different e-commercial modes, the households that only use WeChat to sell agricultural products invested much less in fixed assets for operating e-commerce.
Table 8.1: Percentage of Households that Invested in Fixed Assets, by Different Provinces and E-Commercial Mode
DescriptionNumber of
ObservationsOffice Sites
(%)Internet Facilities
(%)
Transporting Facilities
(%)
Storing Facilities
(%)
Processing Facilities
(%)Province
Zhejiang 91 44.0 54.0 31.7 33.7 18.7Shandong 56 39.3 43.0 21.4 14.3 5.4
E-commercial modeWeChat 66 15.2 21.2 21.2 9.1 6.1Online store 22 54.6 27.3 27.3 13.6 9.1Informal cooperation
3 100.0 66.7 66.7 100.0 0
Cooperative 11 54.6 18.2 18.2 45.5 18.2Total 147 42.2 50.0 27.8 25.9 14.0
Source: Authors’ compilation based on data from the third-round survey on e-commerce of the China Center for Agricultural Policy.
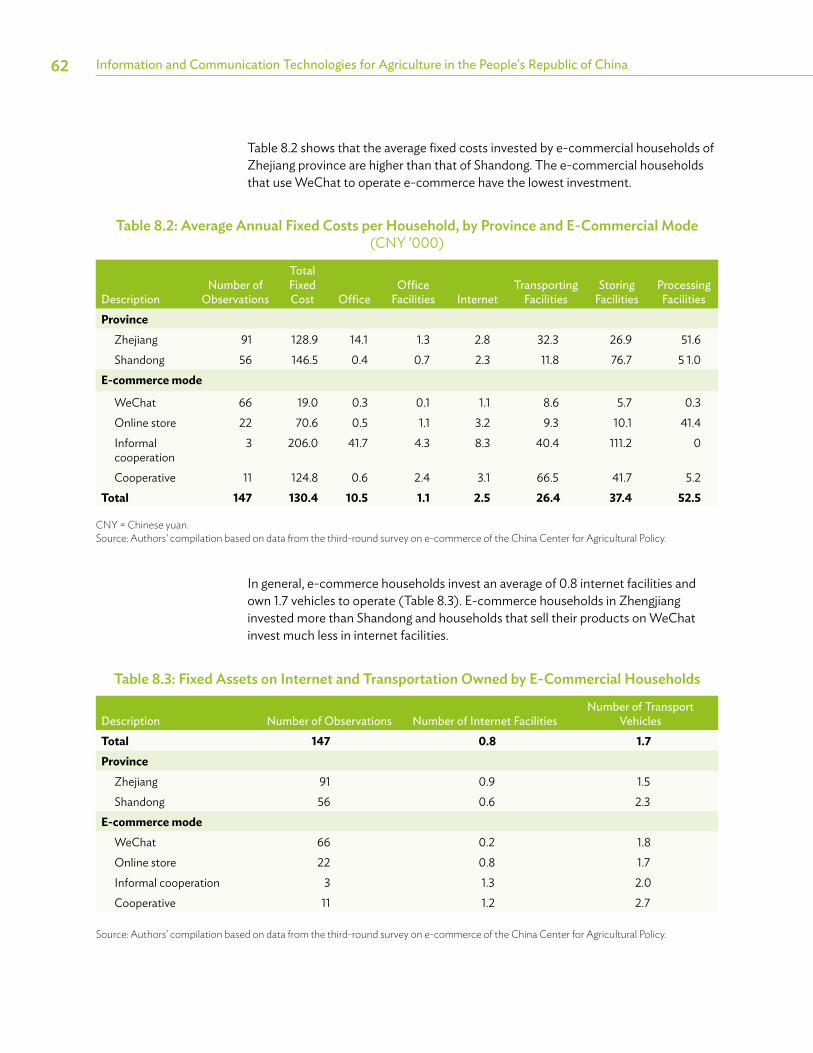
Information and Communication Technologies for Agriculture in the People's Republic of China62
Table 8.2 shows that the average fixed costs invested by e-commercial households of Zhejiang province are higher than that of Shandong. The e-commercial households that use WeChat to operate e-commerce have the lowest investment.
Table 8.2: Average Annual Fixed Costs per Household, by Province and E-Commercial Mode (CNY ’000)
DescriptionNumber of
Observations
Total Fixed Cost Office
Office Facilities Internet
Transporting Facilities
Storing Facilities
Processing Facilities
ProvinceZhejiang 91 128.9 14.1 1.3 2.8 32.3 26.9 51.6Shandong 56 146.5 0.4 0.7 2.3 11.8 76.7 5 1.0
E-commerce mode
WeChat 66 19.0 0.3 0.1 1.1 8.6 5.7 0.3Online store 22 70.6 0.5 1.1 3.2 9.3 10.1 41.4Informalcooperation
3 206.0 41.7 4.3 8.3 40.4 111.2 0
Cooperative 11 124.8 0.6 2.4 3.1 66.5 41.7 5.2Total 147 130.4 10.5 1.1 2.5 26.4 37.4 52.5
CNY = Chinese yuan.Source: Authors’ compilation based on data from the third-round survey on e-commerce of the China Center for Agricultural Policy.
In general, e-commerce households invest an average of 0.8 internet facilities and own 1.7 vehicles to operate (Table 8.3). E-commerce households in Zhengjiang invested more than Shandong and households that sell their products on WeChat invest much less in internet facilities.
Table 8.3: Fixed Assets on Internet and Transportation Owned by E-Commercial Households
Description Number of Observations Number of Internet FacilitiesNumber of Transport
VehiclesTotal 147 0.8 1.7Province
Zhejiang 91 0.9 1.5Shandong 56 0.6 2.3
E-commerce modeWeChat 66 0.2 1.8Online store 22 0.8 1.7Informal cooperation 3 1.3 2.0Cooperative 11 1.2 2.7
Source: Authors’ compilation based on data from the third-round survey on e-commerce of the China Center for Agricultural Policy.

Investment in Information and Communication Technology in Agriculture and Rural E-Commerce 63
8.2. Investment by Households for Variable AssetsTable 8.4 presents the variable costs for operating e-commerce, including the costs for e-commercial platforms, platform advertisements, platform services, and labor. The results show that labor accounts for the largest cost. Households in Zhejiang spent more on variable costs mainly because Zhejiang had higher local wages than Shandong. Using e-commercial platforms, advertisements, and employment cost almost nothing for online sales done through WeChat.
Table 8.4: Average Annual Variable Costs per Household, by Province and E-Commercial Mode (CNY ’000)
DescriptionNumber of Observations
Total Variable Cost
E-Commercial Platform Platform Ads
Platform Services
Labor Cost
ProvinceZhejiang 91 70.9 5.6 13.1 0.2 50.0Shandong 56 38.9 0.5 3.3 4.2 30.9
E-commerce modeWeChat 66 0.3 0.2 0.1 0.03 0Online store 22 54.8 0.4 7.9 10.4 36.0Informal cooperation
3 73.3 16.7 20.0 11.7 25.0
Cooperative 11 70.9 8.5 4.1 5.3 53.0Total 147 58.7 3.6 9.4 2.9 42.8
CNY = Chinese yuan.Source: Authors’ compilation based on data from the third-round survey on e-commerce of the China Center for Agricultural Policy.

64
Chapter 9Conclusion and Policy Implications
9.1. SummaryIn general, the development of information and communication technology infrastructure in rural villages has been impressive. Currently, all villages have access to mobile phone services, and about 70% of them also have access to the internet. One-fourth of the villages have business offices opened by at least one of the major telecommunications companies. Transportation infrastructure has also developed rapidly in rural areas of the People’s Republic of China (PRC). More than half of the surveyed villages are within 5 kilometers (km) of a national highway. The average distance to the nearest provincial highway is 7.5 km and 3.4 km to the nearest county paved road.
Logistics services have started to become available in some rural villages. Among this study’s 126 sample villages, 26% have access to package delivery services by private firms within their villages. For other villages, the average distance to a package collection and/or distribution point is 4.5 km. The public postal services have a similar coverage. Some 15% of villages have a post office, and nearly 40% have one or more mail carrier serving their villages. For the remaining villages, the average distance to the nearest post office is 5.2 km.
Many farmers have a smartphone and use it extensively. Among 4,833 individuals aged 16 or above in the survey sample, 89% have a mobile phone, 71% of whom own a smartphone. Mobile internet is becoming more important in internet access. No fewer than 87% of the smartphone owners surveyed use their device as their major channel to access the internet, with the others using desktop computers. The most popular function of smartphones is social networking, used by 84% of smartphone owners. Smartphone owners also access the news (68%), watch videos (67%), and other entertainment (64%). Around half of the surveyed smartphone users use it for shopping (49%) and payment (52%). Only 5% sell products and services on smartphones.
Government support for e-commerce focuses on the construction of industrial parks. More than half of the sample counties had introduced policies to enhance the development of e-commerce by 2017. Most public investment has been made in infrastructure, more specifically, the construction of e-commerce parks. To attract more firms to these parks, governments also offer preferential rent and utility pries to firms operating there. Such e-commerce parks are mostly located in the county sit or township. It is worth noting that this support is for e-commerce at large, not particular to agricultural e-commerce.

Conclusion and Policy Implications 65
Currently, while the e-commerce is emerging in rural areas of the PRC, the penetration of e-commerce into rural areas is still limited. Among the 1,273 households in this survey, only about 2% sold agricultural products on the internet in 2016. These products are mainly vegetables and fruits. The shares of online sales in total sales vary among these households and concentrate on two ends. Four households sell all their products online while others sell less than a third of their products online. These two ends are examples of different penetration. Even fewer households (13 out of 1,273, or 1%) purchased agricultural inputs on internet. The inputs purchased on the internet are mainly pesticides and herbicides. With regard to mechanical services, only five (0.4%) households purchased the service through the internet in 2016. The services they purchased online are tillage, sowing, and harvesting—the main services purchased by all farmers both online and offline. Other services such as application of pesticide and fertilizer are purchased through channels other than the internet.
Over a quarter of farmers are willing to sell their agricultural products through e-commerce. In the sample, 27% of the households expressed their willingness to sell their agricultural products online because they believe that selling online could net them higher prices, offer greater convenience, and give them access to a larger group of potential buyers. There are fewer households that are willing to purchase agricultural inputs online but those who are think that online purchases are more convenient and can give them lower prices.
Many farmers are facing capacity, investment, and logistics constraints to engage in e-commerce. Of households surveyed 69% said that they are not willing to sell online because they do not have the necessary knowledge and skills to operate, are not equipped with storage and preservation facilities, not encouraged by the high logistic costs, and do not have the ability for marketing expansion. The respondents who said that they are not willing to buy agricultural inputs online said that it is because they find it hard to trust the quality of the products.
Nearly one-fifth of the farmers surveyed are willing to buy agricultural inputs through e-commerce. The major advantages they perceive in buying agricultural products online are the convenience it offers as well as the potential lower prices. The farmers who said that they are unwilling to purchase inputs online cited their lack of knowledge and skills, poor trust in online transactions, and high uncertainty on the quality of the products as major reasons.
E-commerce is likely to raise farmers’ income and self-employment. Agricultural commodities sold online cost higher than those sold offline. Although the marketing cost of selling products online is generally also higher, farmers can gain more net profits through online sales. E-commerce is also expected to increase farmers’ self-employment as online selling is more labor-intensive than offline selling.
While the potential is high, the expansion of agricultural e-commerce is also facing several challenges. The most frequently mentioned challenge is the storage and transportation of fresh agricultural products. Due to the limited availability of appropriate equipment, it is difficult to transport agricultural products over a long distance while preserving their freshness. As a result, the products suitable for
Information and Communication Technologies for Agriculture in the People's Republic of China66
online sales are limited and so is the range of potential buyers. The second biggest difficulty lies in marketing. Because of information asymmetry associated with online transactions, which is more severe in agricultural products, the trust of buyers and hence their willingness to buy agricultural products online is still not high. The required investment at the beginning is also high, and usually prohibitive for small farms without external support. Even after a successful startup, sustaining the business is still challenging.
9.2. Major Policy RecommendationsInvest in storage and transportation for the development of e-commerce in agriculture. As revealed by the interviews, the biggest challenge faced by agricultural e-commerce is the storage and transportation of fresh agricultural products. Improvement of storage and transportation conditions make it possible for more agricultural products to be sold online across longer distances and larger areas, and hence more consumers. This will enhance the development of agricultural e-commerce significantly.
Invest in farmers’ capacity building through practical training on how to operate e-commerce. To address the problem of the lack of knowledge and skills in operating e-commerce enterprises cited by a majority of households, rural residents should be provided with more practical training on how to operate and manage e-commerce businesses.
Provide financial and credit support for farmers, particularly to small farmers, in e-commerce business. E-commerce requires major investments in fixed assets, particularly transporting vehicles, office and internet facilities, warehouses, and processing facilities.
Diversify e-commercial modes. Considering that the social capital of individual households is often limited and that they lack skills in marketing and operating e-commerce enterprises, it would be helpful to promote linkages between farmers and professional companies and agents.
Improve market regulations and favorable market environment for the development of agricultural e-commerce. The perishable nature of agricultural products makes it difficult to trust online transactions. Efforts should be made to tighten regulations and develop dispute settlement mechanisms to build the trust of consumers in purchasing agricultural products online. This can facilitate the development of agricultural e-commerce.
Pay attention to the impact of e-commerce on income inequality. The development of e-commerce is not unconditional, nor does it impact different people equally. Regions with better infrastructure and locations are more likely to benefit from e-commerce. Farmers with relevant knowledge and skills and other resources may benefit more from e-commerce. At the same time as promoting

Conclusion and Policy Implications 67
agricultural e-commerce, the government should pay attention to those who may not benefit that much from, or even be hurt by the development of agricultural e-commerce. Only in this way can the government foster the inclusive development of agricultural e-commerce.

ASIAN DEVELOPMENT BANK6 ADB Avenue, Mandaluyong City1550 Metro Manila, Philippineswww.adb.org
Application of Information and Communication Technology for Agriculture in the People’s Republic of China
This report presents the findings of an assessment on the use of information and communication technology (ICT) to improve food production and distribution in the People’s Republic of China. The analysis focuses on e-commerce in rural areas of the country and provides policy recommendations to promote the use of ICT in the agricultural supply chain. The report documents the trends in ICT application by farmers and its impact on income and livelihood. It also identifies the major constraints to and enabling factors for such ICT applications.
About the Asian Development Bank
ADB is committed to achieving a prosperous, inclusive, resilient, and sustainable Asia and the Pacific, while sustaining its efforts to eradicate extreme poverty. Established in 1966, it is owned by 68 members —49 from the region. Its main instruments for helping its developing member countries are policy dialogue, loans, equity investments, guarantees, grants, and technical assistance.