information society development in bulgaria...the first part of the book concerns benchmarking...
TRANSCRIPT

1
Information Society Development in Bulgaria
Rossitsa Chobanova
Institute of Economics Bulgarian Academy of Sciences
Sofia – 2003

2
© Rossitsa Chobanova, 2003 All rights reserved. No reproduction, copy or transmission of this publication may be made without written permission from the author. No paragraph of this publication may be reproduced, copied or transmitted save with written permission or in accordance with the provisions of the Copyright Act, 1993, Bulgaria. The author has asserted her rights to be identified as the author of this work in accordance with the Copyright Act. First published in 2003 by the Publishing House of the Union of Scientists in Bulgaria 35 Madrid Str., 1505, Sofia A catalogue record of this book is available from the National Library “St.St. Cyril and Methodi”, Sofia Chobanova, Rossitsa Information Society Development in Bulgaria ISBN 954-8329-47-6 The rapidly changing nature of modern societies needs to enable the benchmarking of progress through statistical indicators. The book is taking up the challenge of using newly developed innovative information society indicators, tested and piloted in a representative survey held in all EU Member States, Switzerland and the United States in 2002 and in ten new associated states in 2003. The first part of the book concerns benchmarking Information society development in Bulgaria. The topics presented and analysed are: ICT infrastructure and access; e-society and social inclusion; e-education and life – long learning; e-economy and e-commerce; e-work; e-government. The first topic contains analysis of relevant indicators on Telecommunications, Access and Usage of ICT (use of e-mail, Internet access and use, methods of Internet access, effects of Internet use, barriers to using the Internet, access to mobile phone, effects of mobile phone use, Internet prices/affordability (OECD statistics), network access (telephone lines, ISPs, bandwidth) as well as analysis of indicators such as security concerns, reporting of security violations and security-related awareness and behaviour. Second topic focuses on analysis of all relevant results on social inclusion and some cross-analysis, such as combining results on Internet users by socio-economic characteristics like Internet use by place of access is carried out. The third topic, e-Education and Life-long-learning, focuses on relevant indicators on Education and Skills. It contains analysis of indicators like computers at schools and universities (data from national/other sources), company-provided training, training provided by other organisations, self-directed learning, modes of training (use of e-learning). The e-economy and e-Commerce chapter contains analysis of all relevant indicators like on-line activities and barriers to buying online. E-work and Employment part of the report presents analysis of indicators like home-based telework, intensity of home-based teleworking, interest in telework, perceived feasibility, mobile work (Intensity), mobile telework, co-operation with external contacts using ICTs, etc. The e-Government part contains analysis of indicators like preference for e-Government services, e-Government experience and barriers to e-Government. The second part of the book concerns methodological issues of benchmarking Information society development: methodology of the European 2002 survey, and methodology of the new associated states 2003 survey. A special accent has been put on the Information society development indicator overview and descriptions by domains and topics. Since the target audiences are policy makers and National Statistical Institutes, this book seeks to have an impact on both, the making of policies and the development of official information society statistics.

3
To Dobromira and Dessislava

4

5
Contents
Content of Tables............................................................................................ 7 Abbreviations ................................................................................................ 11 Acknowledgments......................................................................................... 13 Executive Summary ...................................................................................... 15 Introduction ................................................................................................... 25
PART I. BENCHMARKING INFORMATION SOCIETY DEVELOPMENT IN BULGARIA
Chapter 1. General Information about the Country .................................... 33 Chapter 2. ICT Infrastructure and Security ................................................ 39 Chapter 3. e-Society and Social Inclusion ................................................. 51 Chapter 4. e-Education and Life-long-learning .......................................... 59 Chapter 5. e-Economy and e-Commerce .................................................. 67 Chapter 6. e-Work...................................................................................... 77 Chapter 7. e-Government .......................................................................... 87 Chapter 8. Conclusions.............................................................................. 97
PART II. METHODOLOGICAL ASPECTS OF BENCHMARKING INFORMATION SOCIETY DEVELOPMENT
Chapter 9. Methodology........................................................................... 105 Chapter 10. Telecommunications .............................................................. 115 Chapter 11. Education ............................................................................... 134 Chapter 12. Work/ Skills/ Employment....................................................... 153 Chapter 13. e-Society and Social Inclusion ............................................... 209 Chapter 14. e-Government ........................................................................ 229 Chapter 15. e-Health.................................................................................. 253 Chapter 16. Conclusions............................................................................ 263 References.................................................................................................. 266

6

7
Content of Tables
PART I. BENCHMARKING INFORMATION SOCIETY DEVELOPMENT IN BULGARIA
Table 1. General information for Bulgaria ..................................................... 33
Table 2. Ratings of IS development in Bulgaria ............................................ 36
Table 3. At home Internet connections according to age groups in NAS – 10.......................................................................................... 44
Table 4. At home access to Telephone and Fax, ownership of mobile phone and PC usage last 4 weeks in NAS ...................................... 45
Table 5. Internet usage ................................................................................. 47
Table 6. Concerns regarding on-line security ............................................... 49
Table 7. Barriers to Internet usage: It requires advanced computer skills .... 52
Table 8. Barriers to Internet usage: is too expensive to use ......................... 53
Table 9. Barriers to Internet usage: lacks of useful or interesting information ....................................................................................... 54
Table 10. Internet usage drop-outs............................................................... 54
Table 11-a. Digital divide index - selected indicators, definitions, and weight ............................................................................................ 55
Table 11-b. Digital divide index – independent variables, definition of the risk group and percentage of population in EU (2000) .................. 56
Table 12. Digital Divide Indices for EU and NAS -10 .................................... 57
Table 13. Participation in lifelong learning .................................................... 63
Table 14. Life-long learning and Internet usage............................................ 64
Table 15. Skills at communicating via the Internet........................................ 65
Table 16. Education Divide Index ................................................................. 66

8
Table 17. S&E in R&D per million ................................................................. 68
Table 18. On-line Interactive buyer by country ............................................. 73
Table 19. E-commerce users: people who have ordered a product or a service ........................................................................................ 74
Table 20. Online e-Commerce usage and experience.................................. 75
Table 21. Home-based teleworking .............................................................. 78
Table 22. Home-based teleworking and Internet usage ............................... 79
Table 23. Interest in telework – incl. current teleworker................................ 80
Table 24. Feasibility of teleworking and Internet usage ................................ 81
Table 25. Mobile teleworking and PC usage................................................. 82
Table 26. Self-employed teleworkers in SOHO and Internet usage ............. 83
Table 27. Work situation: can adapt starting and finishing times to personal preferences ..................................................................... 85
Table 28. Tax declaration/filling the income tax return.................................. 89
Table 29. Job Search Services ..................................................................... 90
Table 30. Request for passport, driver’s license, birth certificates or other documents ..................................................................................... 91
Table 31. Car registration ............................................................................. 91
Table 32. Declaration to the police ............................................................... 92
Table 33. Searches for books in public libraries ........................................... 92
Table 34. Announcement of change of address ........................................... 93
Table 35. Preferred way of interacting with government services................. 94
Table 36. Search of health-related information on-line ................................. 95

9
PART II. METHODOLOGICAL ASPECTS OF BENCHMARKING INFORMATION SOCIETY
Table 37. Sample characteristics GPS 2002 .............................................. 107
Table 38. Sample characteristics GPS-NAS 2003...................................... 110
Table 39. Number of indicators by Information society topics..................... 113
Table 40. e-Europe topics covered by indicators for Telecommunications and access................................................................................... 115
Table 41. Indicators for telecommunication and access by domain, availability and source ................................................................. 116
Table 42. Description of indicators for telecommunication and access ...... 119
Table 43. Domains of Topic Education ....................................................... 134
Table 44. Indicators for Information society topic Education, grouped by domains ....................................................................................... 135
Table 45. Description of in relation to policy and strategy of education indicators ..................................................................................... 138
Table 46. Description of in relation to economy and infrastructure of education indicators..................................................................... 142
Table 47. Description of in relation to ICT use and access indicators ........ 145
Table 48. Indicators in relation to competencies description ...................... 146
Table 49. Domains for work/skills/employment indicators .......................... 154
Table 50. Overview of skill acquisition indicators........................................ 155
Table 51. Description of skill acquisition indicators..................................... 157
Table 52. Overview of skill provision indicators .......................................... 161
Table 53. Description of skill provision indicators ....................................... 162
Table 54. Overview of skill requirements indicators.................................... 164
Table 55. Overview of work content/ applied skill indicators....................... 165
Table 56. Description of work content/ applied skill indicators.................... 166
Table 57. Overview of time of work indicators ............................................ 169

10
Table 58. Description of time of work indicators ......................................... 169
Table 59. Overview of place of work indicators........................................... 173
Table 60. Description of place of work indicators........................................ 174
Table 61. Overview of work contract indicators .......................................... 177
Table 62. Description of work contract indicators ....................................... 178
Table 63. Overview of benefit from employment indicators ........................ 183
Table 64. Description of benefit from employment indicators ..................... 184
Table 65. Overview of level and structure of employment indicators.......... 188
Table 66. Description of level and structure of employment indicators....... 189
Table 67. Overview of output of employment indicators ............................. 197
Table 68. Description of output of employment indicators .......................... 197
Table 69. Description of employment indicators under development ......... 199
Table 70. Overview e-Society and Social Inclusion indicators.................... 209
Table 71. Description of Identifying the vulnerable – Continuity vs. change indicators ..................................................................................... 213
Table 72. Description of Access to ICT-s and accessibility indicators ........ 222
Table 73. Description of Rationale for participation in the IS indicators...... 225
Table 74. Content of e-relevance of IS indicators ....................................... 229
Table 75. Overview of e-Government IS indicators .................................... 229
Table 76. Description of e-Government indicators...................................... 232
Table 77. Policy concern about e-Health in Bulgaria .................................. 253
Table 78. Overview of e-Health indicators .................................................. 254
Table 79. Description of system quality development e-Health indicators.. 255
Table 80. Description of system usage e-Health indicators ........................ 259

11
Abbreviations A – Austria ADSL – Asymmetric Digital Subscriber Line B – Belgium B2B – Business to Business BAIT – Bulgarian Association for Information Technologies BG – Bulgaria CZ – Czech Republic D – Germany DG INFSO – Information Society Directorate-General DIDIX – Digital Divide Index DK – Denmark DMS – Decision Maker Survey E – Spain EE – Estonia EL - Greece EU – European Union EU-15 – average of all 15 European countries Eurostat – European Statistical Office F – France FIN – Finland G2B – Government to Business G2C – Government to Citizen GDP – Gross Domestic Product GPS – General Population Survey HU – Hungary I - Italy ICT – Information and Communication Technology IRL – Ireland IS – Information Society ISDN – Integrated Services Digital Network
12
ISP – Internet Service Provider IST – Information Society Technologies L – Luxemburg LT – Lithuania LV – Latvia MA – Ministry of State Administration MES – Ministry of Education and Science MF – Ministry of Finance MLSP – Ministry of Labour and Social Policy MTC – Ministry of Transport and Communications NAS – Newly Associated States NAS countries - Estonia, Lithuania, Latvia, Bulgaria, Check Republic, Poland, Romania, Hungary, Slovakia and Slovenia NAS-10 - average of all 10 NAS countries NL – Nederland NSI – National Statistical Institute OECD – Organisation for Economic Co-Operation and Development P – Portugal PC – personal computer PL – Poland R&D – research and development RO - Romania S – Sweden SI – Slovenia SIBIS – Statistical Indicators Benchmarking the Information Society SIBIS+ - geographically expansion of the SIBIS activities from the EU Member States to the Newly Associated States SK – Slovakia SOHO – small office, home office T&A – telecommunication and access UK – United Kingdom xDSL – any Digital Subscriber Line SMS – short massage service

13
Acknowledgments I would like to express my thanks to Prof., Dr. econ. Sc. Alexander Dimitrov, Head of High Statistical Board, Bulgaria (reviewer) and Dr. Werner Korte, Empirica GmbH, Germany (reviewer), as well as to colleagues from Empirica GmbH (Germany), RAND Europe, Databank Consulting (Italy), Work Research Centre Ltd. (Ireland), Danish Technological Institute (Denmark) for providing invaluable feedback and suggestions for my work. Dr. Rossitsa Chobanova Senior research fellow

14

Information society development in Bulgaria
15
Executive summary
The rapidly changing nature of modern societies needs to enable benchmarking of the progress. There is no doubt that in order to understand the socio-economic impacts as well as changes and developments in the domains of the Information society, indicators on ● supply and availability
● penetration and
● patterns of usage
particularly by users, i.e. households and establishments / enterprises, are needed. In many cases these are not readily available from official statistical sources but need to be collected by special user surveys. In addition, these statistics need to be internationally comparable, and therefore based on a common set of definitions and a common measurement framework. Such a framework is provided in the European project on Statistical Indicators for Benchmarking Information Society Development, some of which results are used here. Also, and as outlined by the OECD Working Party on Indicators for the Information Society, it could be meaningful to develop metrics related to the areas of the S-shaped path for the diffusion of new technologies. Accordingly the three broad areas to be covered by indicators are:
● readiness;
● intensity;
● impact.
The results of the surveys serve various purposes:
● Firstly, they document the current state of European society with regard to a range of important and politically relevant Information Society indicators. The issues dealt with in the surveys reflect current objectives of EU initiatives regarding Information Society development, like the e-Europe initiative and other policy frameworks.

Information society development in Bulgaria
16
● Secondly, in some instances they provide time-series of indicator values, thereby enabling inferences to be drawn about the rate of change of these indicators. They will pilot a number of new indicators, which take account of the rapidly changing nature of e-Europe.
● Thirdly, the survey results provide an unrivalled, unique and representative single source of reliable data on the current and medium term supply and demand aspects in the Information Society domains across the EU Member and Newly Associated States.
● Fourthly, the work contributes to the development of policy in the area and helps the European Commission as well as national governments in EU Member States to set RTD and investment priorities and informs policy and strategy development at all policy levels. Private companies for strategy development can also use it.
This book is taking up the challenge of using newly developed innovative information society indicators, tested and piloted in a representative survey held in all EU Member States, Switzerland and the United States in 2002 and in ten new associated states in 2003. It attempts to contribute to understanding of socio-economic impacts as well as changes and developments in the domains of the Information society in Bulgaria in the three broad areas: readiness, intensity, and impact. The state of the art in the country is compared with other countries, considering specific national framework for information society development.
1. Specific framework for Information Society development in Bulgaria
The performance of information society development is nationally specific. It is defined besides of the information and communication technologies (ICT) development and diffusion, by many factors like historical background, success in the transition to market economy, levels of macro and micro economic performance indicators, policy impact, traditions, etc.

Information society development in Bulgaria
17
Historical background
Until 1990, under the Council for Mutual Economic Assistance (CMEA) Bulgaria was the only country in Eastern Europe that specialised in high technologies. Three generations of Bulgarian professionals gained recognition in Western countries in the field of mainframes of 5th generation, high-speed matrix processors and parallel systems. In the established research and development institutes a number of groups were organized to work in the area of software development, firmware, system hardware, digital and analogue PC design, etc. In the past Bulgaria was called “the Silicon Valley of Eastern Europe” because of its strategic specialisation in high-tech and ICT products. After the political and economic changes in 1990, the powerful Bulgarian electronic industry lost many of its traditional markets and the production was dynamically restructured. The big state-owned electronic enterprises collapsed and at the same time a great number of small and flexible private companies appeared on the Bulgarian market. There are a large number of scientists in the business sector in Bulgaria, which are skilled in electronics and communications, as well as mechanical engineering1.
Political framework for Information Society development in Bulgaria In 2002 we can consider the first phase of transition process in Bulgaria as over, with the most important political and economic institutions re-established. Indeed, in its 2002 Opinion the Commission concluded that Bulgaria is a functioning market economy2. The main challenges now are to cope with the competitive pressure and market forces within European Union (EU) in the medium term. Innovation has to play a major role in meeting these challenges. This premise is supported by the fact that Bulgarian economy is going into its sixth year of stable conditions, having established a satisfactory track record of macroeconomic performance. Despite being the leading in the past and still keeping high level in education of specialists in Information and Communication Technologies (ICT), the position of Bulgaria generally moved bellow of EU -15 and NAS – 10 average
1 Statistical Yearbook, Bulgaria, 2001 2 See: Report of the European Commission on the progress towards accession by each of candidate countries, Brussels, 09.10.2002, SEC/2002/1400-1412

Information society development in Bulgaria
18
of IST benchmark. There are too many reasons for this state of the art. The majour among them are defined by the lack of demand (and connected investments), specific to previous periods, and leading to high levels of brain drain of ICT specialists. The development of communications and high technologies is one of the pillars for sustainable economic growth in the country. The strategic objectives in this respect are: ● Promote investments in the ICT sector and development of R&D
networks; ● Create a competitive, export-oriented software industry; ● Capitalize on Bulgarian strong educational traditions; ● Encourage the small and medium enterprises in the ICT sector; ● Encourage young graduates to start their own businesses in Bulgaria. But, as the key findings of analysis suggest, the achievements of IS development objectives in the country are not sufficient on its early stage.
2. Key findings of the analysis of Information society development in Bulgaria
Applying the methodology developed by a large European consortium for Statistical Indicators Benchmarking the Information Society in January 2003 a General population survey (GPS) was conducted. It confirmed a general lag in Information society development in Bulgaria, and helped to identify some potential for catching-up in the future. Key findings are defined in five topics: ─ telecommunications and access; ─ Citizens’ inclusion into IS development (access to and use of Internet); ─ e-economy and e-commerce; ─ e-Work; ─ e-Government.

Information society development in Bulgaria
19
2.1.Telecommunications and access
This is a topic area, which underpinned the advancement in the In-formation society. The country is approxima-tely well performed in Internet usage compa-ratively to other Newly Associated States (NAS), but still lag from EU. The low level of PC penetrations is among the major constraints to faster Internet growth. New computers cannot compensate the depreciation of older machines. The high-bandwith, multi platform ideal access environment is still very far away in Bulgaria. Information and communication technologies uptake is still unevenly distributed across various subgroups of population. The approximately well developed fixed network and high rate of mobile subscribers are a solid precondition for the development of Internet services and wireless applications. According to the GPS survey results the basic access to telecommunication networks is well performed in Bulgaria in fixed telephones and faxes. But the level of access and usage of mobile phones is approximately low comparatively to the levels of NAS -10. Internet users in Bulgaria are 26.7%, which number is higher than in Hungary, Poland, and Romania. Some positive expectations may take place, as this level is twice higher than a year ago (taking into account results of Vitosha research survey in January, 2002 which says that 12.2% of population aged 18+ are Internet users, which is tripled since early 2000). The country’s level is lower than the best-performed newly associated states (NAS) according to this indicator such as Estonia 59.1%, or Slovenia. But the rate of increasing Internet users in Bulgaria is fast and it will be accelerated as mostly young people use the Internet. Age structure of Internet users is: half of those having access to a PC and the Internet are aged 18 to 30, and about ¼ falls in the 31-40 age groups. There is a very large group of Internet users in the
Internet Usage in NAS and EU-15(in % of population)
0
10
20
30
40
50
60
70
80
90
100
EE
EU-1
5 SI CZ LV LT SK
NAS
-10
BG PL HU
RO
regular (last 4 weeks) occasional (last 12 months)

Information society development in Bulgaria
20
country, who are younger then the age group of 18. The number of PC users is expected to grow substantially over the next few years due to the wider Internet penetration among young people.
2.2. Citizens’ inclusion into IS development (access to and use of Internet)
The citizens’ inclusion into information society (IS) development is the main social policy concern of e-society development policy. Bulgaria has a potential, which is not effectively used in this respect. The potential is connected with long – term traditions in specialisation and hi-quality of ICT education. Almost half of the 47 Universities, located in 26 cities and towns, have computer specialties. Over 6,000 Bulgarian students are currently majoring in Computer Science; another 5,000 have chosen electric engineering, mathematics, physics and biotechnology. The external evaluation of quality of the education in Bulgaria would be summarised as follow: the secondary education is among the best in the world: 5th in the world in sciences, 11th in mathematics (World Bank and The Economist ranking); Bulgarians rank second in international IQ tests (MENSA International); they are among the top university students worldwide (2nd in the world in SAT scores). Developed by education potential for citizen’s inclusion in IS development is realised mainly in IT branch. The Global IT IQ Report of March 2002 of Brainbench Inc. ranks Bulgaria (with 8,844 Certified Professionals) at eight place among the top 10 countries as to the number of certified IT professionals. According to the same report, in Europe, Bulgaria places a strong third with over 6,800 certifications. Romania takes a surprising lead over its continental countries, earning more than 16,000 certifications in 2001, which outpaces the United Kingdom in the number-two spot, while Germany and Latvia are in a virtual dead heat for fourth3. The ICT Development Agency is committed to stimulate and actively establish Bulgaria as a leading European ICT Research and Development centre. In spite of potential, availability of professionals and political efforts, the citizen’s inclusion in IS development in Bulgaria is low. In January 2003 the level of participation in lifelong learning in % of labour force is 5.06%, which is
3 Source: Global IT IQ Report of March 2002 of Brainbench, Inc.

Information society development in Bulgaria
21
higher than Romania only. In comparison the leaders (Finland and the US) have levels of over 37%. The participation in any learning during the four weeks previous to the survey, in % of labour force is the lowest in Europe – 7.56%, and far away from the leader – Finland with 59.86%. The level of self-directed learning in % of labour force is the lowest among countries – 5.51%, which is about 8 - 9 times less then leaders such as Germany - 51.73%, Austria – 47.6%, and Finland – 44.45%. The total online and offline usage of e-Learning as a percentage of labour force is lowest among countries – 3.17%, included in the General Population Survey. But the level of on-line usage of e-learning in Bulgaria is higher then in Greece and Poland. This picture is corresponding to the level of penetration of computers at schools and training provided by companies in Bulgaria. A lack of necessary financial resources is the main reason not to be launched plans for education according to 45.7% of managers in the companies.
2.3. e-economy and e-commerce
The state of the art of e-economy and e-commerce implementation in the country has sharply changed for the last year, but its level is still low. Compared to all surveyed countries Bulgaria is positioned in the middle in percentage of e-commerce users among NAS-10. According to the Information Society Index, which rates 55 countries, comprising 96% of World GDP and 99% of World’s expenditure, Bulgaria falls in the Sprinter Group (where investments surge and retreat on the whims of social, political, and economic change), together with countries like the Czech Republic, Poland and Hungary. The potential for e-economy and e-commerce implementation in Bulgaria is connected with traditions and experience in the information technology (IT) sector and well-structured private companies, which cover almost the whole spectrum of IT applications. According to research of the IDG group, the yearly growth of the IT sector in Bulgaria is about 35%. IT spending for 2001 is about USD 188.4 million and estimated total revenues will be around USD 270 million. There are more than one thousand IT small and medium sized enterprises in Bulgaria now. The software companies cover almost the whole spectrum of software applications from Enterprise Resource Planning

Information society development in Bulgaria
22
to CAD/CAM/CAE. Working for a number of big corporate clients in Western Europe and the US have proved that Bulgarians are able to develop design work, maintenance and testing as well as fully integrated systems and solutions. Customers of Bulgarian firms include Canadian government agencies such as the Department of Transport, Department of Environment and others, as well as global blue chip firms such as: BMW, Boeing, Ford, Lockheed Martin, Nortel, Hasbro, Siemens, Pricewaterhouse Coopers, Xerox and Telesis Technologies. More than 7 000 IT professionals are working in small ICT companies. The forthcoming challenge is how to use effectively such potential for e-economy and e-commerce implementation.
2.4. e-Work.
The recent use of ICT leads to possibilities for ‘multi-locational eWork’ – that is, working from more than one location while staying connected to the company and work colleagues. In January 2003 the interest in telework (current teleworkers in % of employed population) is high in Bulgaria. It is higher than EU-15 average and NAS-10 average. This interest could be explained with relatively high share of ICT specialists4, but it is not directly connected with the ICT skills requirements for jobs in national companies. The feasibility of teleworking is estimated as less than 10%. In comparison with other countries – the feasibility of teleworking in NAS – 10 is almost 15% and for EU-15 – more then 30%. It may be concluded that the existing working places in Bulgaria do not suggest enough opportunities to meet interest of employees in and potential for teleworking.
2.5. e-Government.
According to ‘Global e-Government survey 2001’, World Market Research Centre, Bulgaria occupies 40th position in 169 countries. This is a good staring position for implementation of e-government strategy in the country as an integrated part of e-Europe 2005. According to the action plan proposed more then ½ of the population 18+ to use e-government services in 5 years period. Several times the costs and the time needed for e-government services have to be reduced. The main achievements in e-government
4Chobanova R., Innovation policy profile. Bulgaria. March, 2003, DG Enterprise, www.cordis.lu

Information society development in Bulgaria
23
introduction are connected with services Government to Citizen (G2C) and Government to Business (G2B).5 Over 90% of central government agencies and public institutions have websites. The number of websites is of about 150 in 2002. In the beginning of 2002 on average6 20% of computers in public administration have access to the Internet. There is a differentiation in levels of access to computers with Internet connection between central and local Government administration bodies. More concretely 80-100% of computers in regional administrations, 70-80% of ministries, and less then 20% of local administrations are connected to the Internet. Most government websites are not yet interactive and do not allow for e-payments or electronic submissions of forms. But, as GPS has said, the level of preference, availability, and usage of e-government in Bulgaria is low in tax declaration, requests for personal documents, car registration, declaration to the police, search for books in public libraries, and announcement of the change of address. Job search service is rather popular for on-line usage. In general, citizens are not very willing to use Internet, but for those citizens who prefer to use the Internet, the awareness of availability and usage of the on-line services are relatively high.
3. Conclusions
The added value of the research to the state-of-the-art in Bulgaria is the implementation of the new methodology, including new statistical indicators for monitoring IS development. The new unique data confirms the specific pattern of the IST development in the country. With the rapid developments in 80s Bulgaria slowed down in 90s. The GPS confirmed a general lag in Information society development in Bulgaria. The country strengths now are defined by traditionally high interest for ICT services and developments. They result from the level of supply of educated and skilled personnel, and developed competencies of small and medium sized IT companies covering almost the whole spectrum of software applications from Enterprise resource planning to CAD/CAM/CAE.
5 Information society, 2002, ½, p. 03 6 See: Bulgaria. E-Readiness Assessment 2001, www.arc.online.bg
Information society development in Bulgaria
24
But the interests/potentials are not sufficient for better performance in information society development in the country. The constraints are connected with low level of on-line preference of interacting with government services, low level of e-learning, low level of searching of heath-related information online. This can be observed through the disintegrated governmental web presence, limited offer of G2C services, insufficient support for information and communication technologies in schools and the absence of additional stimulating measures (restricted domain registration, lack of tax support for household PC purchase). At the end we may conclude, that fulfilment of ambitious political goals connected with effective usage of available potentials for Information society development in Bulgaria is real if coordinated efforts with EU and other European countries take place. Developing of measures, based on reliable data is a precondition for developing efficient policy.
Information society development in Bulgaria
25
Introduction
1. Background
The preliminary work for this book began during the period January 2002 to September 2003 of a project on Statistical Indicators Benchmarking the Information Society (SIBIS), funded under the ’Information Society Programme‘ of the European Commission (IST-2000-26276). SIBIS has taken up the challenge of developing innovative information society indicators to take account of the rapidly changing nature of modern societies and to enable the benchmarking of progress in European Union (EU) Member States. The indicators have been tested and piloted in a representative survey held in 2002 in all EU Member States, Switzerland and the United States. As a result, nine Topic Reports assessing the current state of the European information society and benchmarking individual countries have been published in 2003. The topics covered by SIBIS include: telecommunications and access, Internet for research and development, security and trust, education, work- employment and skills, social inclusion, e-Commerce, e-Government and e-Health. In 2003 the SIBIS project has been extended with the SIBIS+ initiative. The objective of SIBIS+ is to geographically expand the SIBIS activities from the EU Member States to the following Newly Associated States (NAS): Bulgaria, Czech Republic, Hungary, Estonia, Lithuania, Latvia Poland, Romania, Slovakia, and Slovenia. This parallels the extension of e-Europe to e-Europe+, an Action Plan by and for the candidate countries. This book analyses the results of the surveys conducted in Bulgaria and the ten NAS countries in 2003. In order to produce comparable results, the survey questions have been extracted from the surveys conducted in the EU member states in 2002.
2. Country and Topic Areas Definition and Coverage
This work presents an overview of contemporary and most comprehensive indicators of Information Society (IS) for all EU countries and Newly

Information society development in Bulgaria
26
Associated States (NAS). The results of the analysis may contribute to the positioning of Bulgaria in EU and NAS with regard to the IS. Accordingly, since the main target audiences are policy makers and NSI’s (National Statistical Institutes), this book seeks to have an impact on both, the making of policies and the development of official IS statistics. Five key topics are covered here: telecommunication and access; e-education; e-work/ skills/ employment; social inclusion, and e-Government. The main reasons for selecting these topics include their high level topical relevance for the NAS, high ranking on the political agenda in the EU and the countries themselves, and the good coverage of indicators for these topics in the General Population Survey (GPS). Beside that the topic of e-economy and e-work are analysed as interesting for Bulgaria.
Telecommunication and Access
The topic of telecommunication and access is a physical core stone of the information society and is both wide range and ‘horizontal’ in nature. In many ways the topic can be considered as the fundamental ‘enabler’ – it allows the other e-Europe domains to ‘happen’. ‘Access’ is another loose defined topic. It can be defined formally as ‘the ability to retrieve data, graphics, sound, text etc. while on-line’. Translated into the context of e-Europe, this topic covers wide range of devices by which users access electronic ‘information’ – e.g. computers, telephones, multimedia kiosks, televisions and other hybrid devices. In Bulgaria the National Statistical Institute provides some indicators. Agencies like Vitosha research, Information Society Project Office and others produce indicators as well. The results of their surveys are published in ‘Information Society’ and on-line regularly since 2000. Some leaflets (mainly for the purposes of Internet and Information technologies exhibitions) are produced regularly as well.
Education
In the SIBIS context education is understood as a formally institutionalised process of knowledge transfer and knowledge development, as opposed to informal learning arrangements taking place through various communities of practice arrangements, on-the-job training and peer learning.
Information society development in Bulgaria
27
At present stage Bulgaria is performing continuous measurements of the development of information and communication technology (ICT) infrastructure in educational system by the Ministry of education and science.
Work/skills/employment
For the third topic, skills are defined as the ‘learned power of doing something competently’. Work is defined here as aimed productive activity, and the structure of employment refers in particular to the sectoral and occupational distribution of employment, as well as unemployment and labour force participation. This topic has some coverage in the Statistical Yearbook of Bulgaria. Some indicators are available from survey agencies.
e-Society and social inclusion
Social inclusion is inextricably linked to the issues of (accessing and maintaining) employment, education, housing and healthcare. At the same time, these issues / phenomena provide the basis for more tangible indicators for measuring inclusion. Against this background there has been a predisposition to view divisions in relation to the Information society as being just an extension of divisions from ‘pre-Information Society’. This requires a multi-perspective view that includes attention to differential levels of access (to the ICTs) across various subgroups of population whilst also looking at issues such as ‘unpacking’ of the very concept of access. The measurement of social inclusion in though included within other areas, which is true also for Bulgaria. Most data can be found in the reports of surveys, provided by different sociological agencies in Bulgaria, mainly Vitosha research on this stage, and some NGOs, like Centre for economic development.
e-Government
E-government designates any transaction that involves the government and that is carried out, even partly, using electronic means. E-government plays an important role in mediating government actions, which will continue to grow as communication technologies become widespread. Already, communication technologies change the way that government operates by facilitating information dissemination, communications and transactions. As e-government in Bulgaria is slowly evolving, the indicator coverage is limited.

Information society development in Bulgaria
28
The most focused research in e-government has been done by agencies, like Vitosha research, and publicised by ‘Information society’ magazine. The coverage of IS indicators in Bulgaria is good and in many cases comparable to EU. With recent policy efforts, which bring impetuses for the acceleration of all areas of IS, Bulgaria is in its best way to re-change the Bulgarian position once again. However, since the ICT phenomena, consequently IS itself, are changing rapidly, it is of great importance to asses those changes. On the other hand it brings the challenge for researchers to determine the gaps in present indicator coverage. In this account the issues are scientific and place emphasis on the methodology of the research and on the validity of the data. On the other hand, it brings challenge to policy makers, as the policies have to embrace all the phenomena of contemporary society. The results address both the scientific and policy challenges. Indicators presented here serve as benchmarks of IS and pilots for further methodological elaboration. Further more, since Information society benchmarks are high on policy agenda due to their comparison value, presented indicators will provide added value by enabling Information society in Bulgaria to be compared with EU / NAS countries.
3. Overview of the Book
The book is based mainly on surveys conducted in 2002 (SIBIS) and 2003 (SIBIS+). The following topic related to IS issues are presented and analysed: ICT infrastructure and access; e-society and social inclusion; e-education and life – long learning; e-economy and e-commerce; e-work; e-government. The first topic contains analysis of relevant indicators on Telecommu-nications, Access and Usage of ICT (use of e-mail, Internet access and use, methods of Internet access, effects of Internet use, barriers to using the Internet, access to mobile phone, effects of mobile phone use, Internet prices/affordability (OECD statistics), network access (telephone lines, ISPs, bandwidth) as well as analysis of indicators such as security concerns, reporting of security violations and security-related awareness and behaviour. Second topic focuses on analysis of all relevant results on social inclusion and some cross-analysis, such as combining results on Internet users by

Information society development in Bulgaria
29
socio-economic characteristics like Internet use by place of access. The third topic, e-Education and Life-long-learning, focuses on relevant indicators on Education and Skills. It contains analysis of indicators like computers at schools and universities (data from national/other sources), company-provided training, training provided by other organisations, self-directed learning, modes of training (use of e-Learning). The e-economy and e-Commerce topic contains analysis of all relevant indicators like on-line activities and barriers to buying online. E-work and Employment topic presents analysis of indicators like home-based telework, intensity of home-based teleworking, interest in telework, perceived feasibility, mobile work (Intensity), mobile telework, co-operation with external contacts using ICTs, etc. The e-Government topic focuses on indicators like preference for e-Government services, e-Government experience and barriers to e-Government.
The book is divided into two parts. The first one contents benchmarking of Information society development in Bulgaria by topics. The second part concerns methodological issues: methodology of GPS 2002 survey, methodology of the GPS – NAS – 2003 survey, and indicators overview, which provides their description divided by topics and by domains of information society development.

Information society development in Bulgaria
30
Information society development in Bulgaria
31
PART I.
BENCHMARKING INFORMATION SOCIETY DEVELOPMENT IN
BULGARIA

Information society development in Bulgaria
32
Information society development in Bulgaria
33
Chapter 1. General Information about the Country
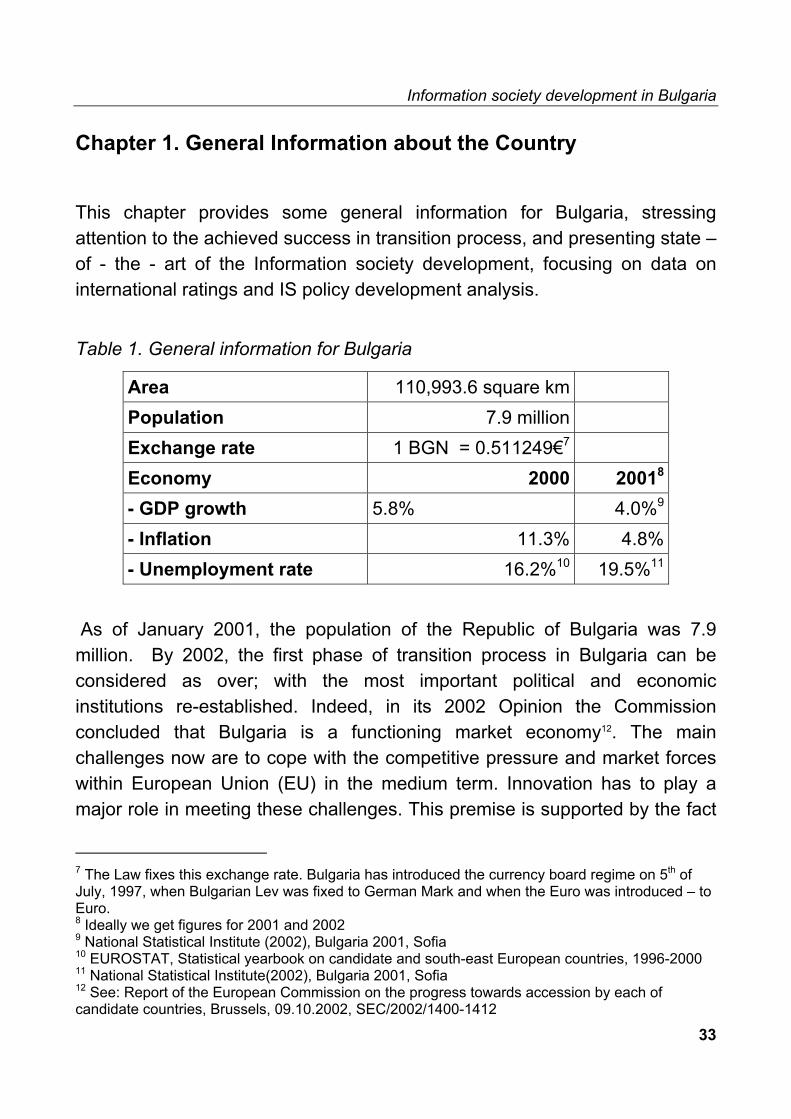
This chapter provides some general information for Bulgaria, stressing attention to the achieved success in transition process, and presenting state –of - the - art of the Information society development, focusing on data on international ratings and IS policy development analysis. Table 1. General information for Bulgaria
Area 110,993.6 square km Population 7.9 million Exchange rate 1 BGN = 0.511249€7 Economy 2000 20018
- GDP growth 5.8% 4.0%9
- Inflation 11.3% 4.8%- Unemployment rate 16.2%10 19.5%11
As of January 2001, the population of the Republic of Bulgaria was 7.9 million. By 2002, the first phase of transition process in Bulgaria can be considered as over; with the most important political and economic institutions re-established. Indeed, in its 2002 Opinion the Commission concluded that Bulgaria is a functioning market economy12. The main challenges now are to cope with the competitive pressure and market forces within European Union (EU) in the medium term. Innovation has to play a major role in meeting these challenges. This premise is supported by the fact
7 The Law fixes this exchange rate. Bulgaria has introduced the currency board regime on 5th of July, 1997, when Bulgarian Lev was fixed to German Mark and when the Euro was introduced – to Euro. 8 Ideally we get figures for 2001 and 2002 9 National Statistical Institute (2002), Bulgaria 2001, Sofia 10 EUROSTAT, Statistical yearbook on candidate and south-east European countries, 1996-2000 11 National Statistical Institute(2002), Bulgaria 2001, Sofia 12 See: Report of the European Commission on the progress towards accession by each of candidate countries, Brussels, 09.10.2002, SEC/2002/1400-1412
Information society development in Bulgaria
34
that Bulgarian economy is going into its sixth year of stable conditions, having established a satisfactory track record of macroeconomic performance. Overall, the recent progress of economic transition in Bulgaria13 is characterised by the following: ● Functioning market economy; ● High level of macroeconomic stability; ● Sufficiently working market mechanisms, which allow for a better
allocation of resources; ● Good progress in structural reforms, especially as regards procedures
for market entry, the restructuring of the financial sector and privatisation, thus setting the microeconomic basis for a process of sustained growth.
For the period after 1990 this is the sixth year when the GDP has a positive growth rate. According to the EC estimations the real growth of GDP for 2003 will be 4.5% and 5% for 2004. 14 But GDP per capita remains among the lowest in the Candidate Countries at only 24% of EU average in 2000, limiting significantly the potential demand for new innovative products and services at national level. The inflation in the country is not high and is a positive factor for development of the national economy. Partly it is due to the introduction of the currency board in July 1997 (see footnote 7). But the hyperinflation shock at the beginning of 1997 has affected negatively innovation activities in the country. More specifically, business R&D expenditures, for the period 1995 –1999 decreased from approximately half to one fifth total R&D expenditures. Decreasing inflation since 2000 provides new opportunities, but the level is still relatively high comparatively to the level of inflation in1998. The average inflation rate for the period 1997-2001 was 9.8 %, which is very high; however Hungary with 12.4 %, Poland with 9.9%, Romania with 46.3% and Turkey with 69.9% are all worse placed. According to the EU expectations the inflation will be 4.5% at the end of 2003 and 4.0% at the end of 2004 in Bulgaria15.
13 See: previous source, and Report of the European Commission on the progress towards accession by each of candidate countries” (Brussels, 13.11.2001, SEC/2001/1744-1753). 14 EC, http://europa.eu.int/comm/economy_finance/index_en.htm 15 as above.

Information society development in Bulgaria
35
The general government budget balance stood at 1.7% % of GDP in 2001 and was the only positive one among the NAS. This is a positive characteristic of macroeconomic performance however government budget restriction may be at the expense of being able to develop a more pro-active government policy. Unemployment is a major concern with Bulgaria having the highest rate amongst the NAS countries in 2001 at 19.7% of labour force. The unemployment rate was 3.7% higher compared to June 1995. The unemployment rates were considerably lower for groups with higher education level – 7.9% for ‘Bachelor’, ‘Master’ and ‘Doctor’ degrees. Such high levels of unemployment are a drag on productivity and suggest a significant waste in terms of the human capital potential. According to EU the growth of employment will be 1.5% in 2003 and 2.0% in 2004.16
State of the art of Information society development in Bulgaria
The state of the art of IS development would be assessed by some publicly available indexes.17 According to available data the recent state of the art of information society (IS) development in the country would be summarised as good. The country best performance is in IT IQ ranking – 8th of 100.
16 as above 17 For example: Technology achievement index (TAI) measures achievements, not potential, effort or inputs. It is not a measure of which the country is leading in global technological development, but focuses on how well the country as whole is participating in creating and using technology. The TAI focuses on four dimensions of technology capacity that are important for reaping the benefits from the network age: – Creation of technology refers to the number of patents granted per capita, and receipts of royalty and license fees from abroad per capita; – Diffusion of recent innovations refers to the diffusion of the Internet and to the exports of high-tech and medium –technology products as share of all exports – Diffusion of old innovations refer to penetration of telephones and electricity. Both indicators are expressed as logarithms and capped at the average OECD level – Human skills refers to a mean years of schooling and gross enrolment ratio of tertiary students enrolled in science, mathematics and engineering (for more info. On TAI see http://www.undp.org/hdr2001/techindex.pdf) The Network readiness Index (NRI) is defined as the degree to which a community is prepared to participate in the Networked World as well as community potential to participate in the Networked World in the future (see http://cid.harvard.edu/cr/pdf/gitrr2002ch02.pdf)

Information society development in Bulgaria
36
Table 2. Ratings of IS development in Bulgaria Index Rank Source Information Society Index 2000 34 of 55 countries IDC Information and Communication Index 2001 50 of 75 countries WEF Technological Achievement Index (TAI) 2001 28 of 72 countries UNDP Global IT IQ ranking 2002 8 of 100 countries Brainbench E-readiness ranking 2001 48 of 60
countries; (score: 3.38 out of 10)
Economist Intelligence Unit and Pyramid Research
Network Readiness Index (NRI) 2001-2002 53 of 75 countries (score: 3.38 out of 10)
Center for International Development, Harvard University
Index WWW Source Information Society Index 2000 or later
Http://www.worldpaper.com/2002/feb02/isi.jpg IDC
Networked Readiness Index 2002-2003
Http://www.weforum.org/pdf/Global_Competitiveness_Reports/Reports/GITR_2002_2003/GITR_Rankings.pdf Http://www.cid.harvard.edu/cr/profiles.html Http://www.cid.harvard.edu/cr/pdf/gitrr2002_ch02.pdf
World Economic Forum
Technological Achievement Index 2001 or later
Http://www.undp.org/hdr2001/techindex.pdf http://www.undp.org/hdr2001/popupmap.html
UNDP
Global IT IQ ranking 2002
\\NTSERVER_DAT\Projekte\Sibis\Literatur\Brainbench_globalitiq-report_2002.pdf
Brainbench
E-readiness ranking 2001 or later
Http://www-1.ibm.com/services/strategy/files/IBM_Consulting_The_2002_e_readiness_rankings.pdf
Economist Intelligence Unit and Pyramid Research

Information society development in Bulgaria
37
State of the art of IS policy development in Bulgaria
The adopted in 1999 Strategy for Information Society development in the Republic of Bulgaria18 defines the national priorities for the transition to the IS at legislative, technological, economical and social levels, and outlines the basic related activities. The target is to develop a more democratic, accountable and inclusive information society using information and communication technologies. Some of the initiatives aimed at improving the level of diffusion and uptake of ICTs in the economy chronologically are as follow: 1. National strategy for education in ICT. (1998). Programme (1999). Objective: Improving education in ICT. In May, 2000 all requirements to the teaching programmes have been published. 2. National strategy for Information society development. Objectives to be achieved are: open IS infrastructure; implementation of new ICT in management, economy, education, culture and healthcare, national security and ecology; development of ICT sector as a leading sector in Bulgarian economy; improving quality of ICT human resources. (September, 1999). 3. National strategy for hi-tech development in Bulgaria. Tasks: to develop dynamic hi-tech sector, which will improve the competitiveness of Bulgarian economy (December, 1999). 4. Project for a Law for hi-tech parks and hi-tech activities. Passed the first reading in the Parliament in 2000.
18 National Strategy for Information Society Development, adopted by the Government in 1999, updated in 2002. Source: www.mtc.government.bg

Information society development in Bulgaria
38
5. National strategy for e-Government. 6. Establishment of 2 new agencies to coordinate IS development in Bulgaria – Agency ‘Development of ICT’19 and Coordination centre on information, communication and management technologies in 200220. 7. The initiative e-Europe+. The plan for 2005 intends every pupil in secondary school in Bulgaria to posses ’electronic literacy’ and 100% of schools, universities and institutes to have good access to Internet. During the period 2002-2003 for both - educational programme and network development programme - a budget of between €25 and €45 million (minimum and optimum) is required. The period 2003 - 2005 requires between €29 million (minimum) and €44 million (optimum - including replacement of depreciated computers in the schools) 21. The above policy for information society development is on its early stage of its implementation, as the results of our analysis suggest.
19 www.ict.bg 20 www.ccit.government.bg 21 www.arc.online.bg

Information society development in Bulgaria
39
Chapter 2. ICT Infrastructure and Security The topic of telecommunications is a physical cornerstone of the information society and is both wide-ranging and ‘horizontal’ in nature. In many ways the topic can be considered as the fundamental ‘enabler’ – it allows the other e-Europe domains to ‘happen’. Telecommunications and access does not stop with infrastructure, there are already great changes and innovations taking place in accessing Internet technologies, mobile telephony, multimedia and other emerging technologies, all of which contribute to the current state-of-play in Europe. For the purposes of indicator development here the term ‘telecommuni-cations’ has been interpreted very broadly. It includes all the networks - cable, data, sound, image. So, although the main focus is on telephony networks computer networks and Internet, the cable (TV as well as telephony), and wireless forms of transmission are also included. Overall, a more accurate descriptor in these circumstances would be ‘communication networks’. ‘Access’ is another loose defined topic. It can be defined formally as ‘the ability to retrieve data, graphics, sound, text etc. whether on-line’. Translated into e-Europe, this topic covers the wide range of devices by which users access electronic ‘information’ – e.g. computers, telephones, multimedia kiosks, televisions, and other hybrid devices. Only few of these types of access are subjects of the recent analysis. The investigation and indicator development here focuses mainly on issues of access and usage, which at their most basic can be described in a binary form. Firstly, users either have access to a particular service or not. Secondary, there are also a potentially limited number of ways in which services can be used. The study does not expand to examine the technical quality or perceived value of such services. For example, it does not attempt to analyse the percentage of time a connection to the Internet working at 100% of its capacity, which is a very important characteristic, affecting productivity in different countries. A large number of innovative telecommunications and access indicators were identified within the work of

Information society development in Bulgaria
40
the SIBIS project, but only few of them – more basic, were piloted in the SIBIS+ survey of NAS – 10 (Bulgaria, Czech republic, Estonia, Hungary, Lithuania, Latvia, Poland, Romania, Slovakia, and Slovenia ) in order to provide a better context for the latter. This part of the book is aimed to describe the national context of ICT development and access to information society as policy and sate – of – the - art, according to existing statistical data, and GPS.
2.1. Telecommunications and Access
The national policy context of telecommunications and access has been presented by an analysis of the policy documents. After that analyses are focused on relevant indicators on use of computers, use of e-mail, Internet access and use, methods of Internet access, effects of Internet use, access to mobile phone and effects of mobile phone use. Besides the latest figures from SIBIS GPS – NAS survey (module A), here some of the time series data from other sources identified in Bulgaria are also presented. Policy aspects of Information Society Development in Bulgaria ICT is a priority sector and development of communications and high technologies is one of the pillars for sustainable economic growth according to the Bulgarian policy documents. The strategic objectives are as follow: ● Promote investments in the ICT sector and the development of R&D
networks; ● Create a competitive, export-oriented software industry; ● Capitalize on Bulgarian strong educational traditions; ● Encourage the small and medium enterprises in the ICT sector; ● Encourage young graduates to start their own businesses in Bulgaria.
By setting up research and development centres in the country, capable of working from a distance on large corporate projects around the globe, the emigration will be reduced. To facilitate the implementation of the Program the ICT Development Agency was established to support the investments in communications and information technology projects, as well as scientific

Information society development in Bulgaria
41
research studies, university research and development programs and marketing the Bulgarian ICT sector. In 2002 the agency invested up to 2m EUR in ICT projects. Among its priority areas lay the implementation of ICT in higher education and research areas, liberalisation of radio spectrum for civil needs, promotion of Bulgarian ICT human potential and innovation efforts worldwide as well as encouraging ICT penetration in every aspect of social and economic life.
Internet and Services
The support of the Government for the development of the Internet is focused in three directions: ● Establishment of appropriate legal and regulatory environment of
the Internet and services; To be in line with the new technologies and market requirements, a Law on electronic document and electronic signature was adopted in March 2001. It sets the framework for the use of electronic documents and electronic signatures, as well as the procedures and conditions for providing certification services. A Law on Personal Data Protection is prepared to provide a general framework for protection of individuals with regard to personal data processing. In order to stimulate the development of high technologies in the country and the flow of foreign investment in the high tech productions and services, a High Tech Parks Act was submitted to the National Assembly. Currently the Internet is not formally regulated and does not require licensing, nor registration. The free regime for Internet services has led to a dynamic expansion of Internet Service Providers (ISPs) and great reduction of prices. Around a dozen big and more than 200 small ISPs are currently operating in the country. ● Supporting the development of the telecommunications
infrastructure and building up of ATM backbone network; A highly reliable high-speed backbone, based on ATM technologies, has been established for exchange of information between the administrations in view of the e-Government targets and the ongoing initiative for complete on-

Information society development in Bulgaria
42
line transfer of the administrative management through ICT implementation on a national level. The Bulgarian Telecommunication Company has started the building up of high-speed backbone for Internet and multimedia. The well developed fixed network (telephone density 36%) and the high rate of growth of the mobile subscribers (more than 1,600,000 for a period of 9 years) are a solid precondition for the future development of Internet services and wireless applications. The building of a new telecommunication infrastructure on the basis of advanced digital technologies is one of the main priorities for the incumbent operator. The Bulgarian Telecom plans to invest intensively and to reach a 60% digitalisation by 2005. The market of mobile telephone services is undergoing a rapid development. There are three mobile operators on the market - one analogue NMT-450i (Mobikom) and two GSM operators (Mobiltel and Globul) using frequencies in the 900 MHz and 1800 MHz range. The market shares of the operators (in number of subscribers) as of the end of 2001 amount to 78% for Mobiltel and 12% of Mobikom. The second GSM operator (Globul) has been in operation since September 2001 and its market share is 10%. The frequency bands for the Universal Mobile Telecommunication System (UMTS) (a total of 230 MHz) are not yet released in Bulgaria. A time-schedule for a phased release of frequency bands for UMTS is currently in preparation. As a first priority, frequency blocks of a minimum of 2х10 MHz in the frequency bands 1920-1980 MHz and 2110-2170 MHz should be available by mid-2003. Thereafter, the issues of the licensing method (tender or contest) and the number of 3G operators (two or three) will be resolved, so that the licenses to be awarded by the middle of 2004. ● Supporting the investment process.
The state is currently one of the most important investors in this area. At the same time it plays a leading role in the process of attracting foreign investors and the establishment of venture capital funds. As a result, a modern digital transit and international telecommunication infrastructure, in addition to the traditionally high level of skilled personnel in ICT, has been constructed in order to create conditions for the stable Internet Industry growth. However, the insufficient level of investments – both – private and public ones, at

Information society development in Bulgaria
43
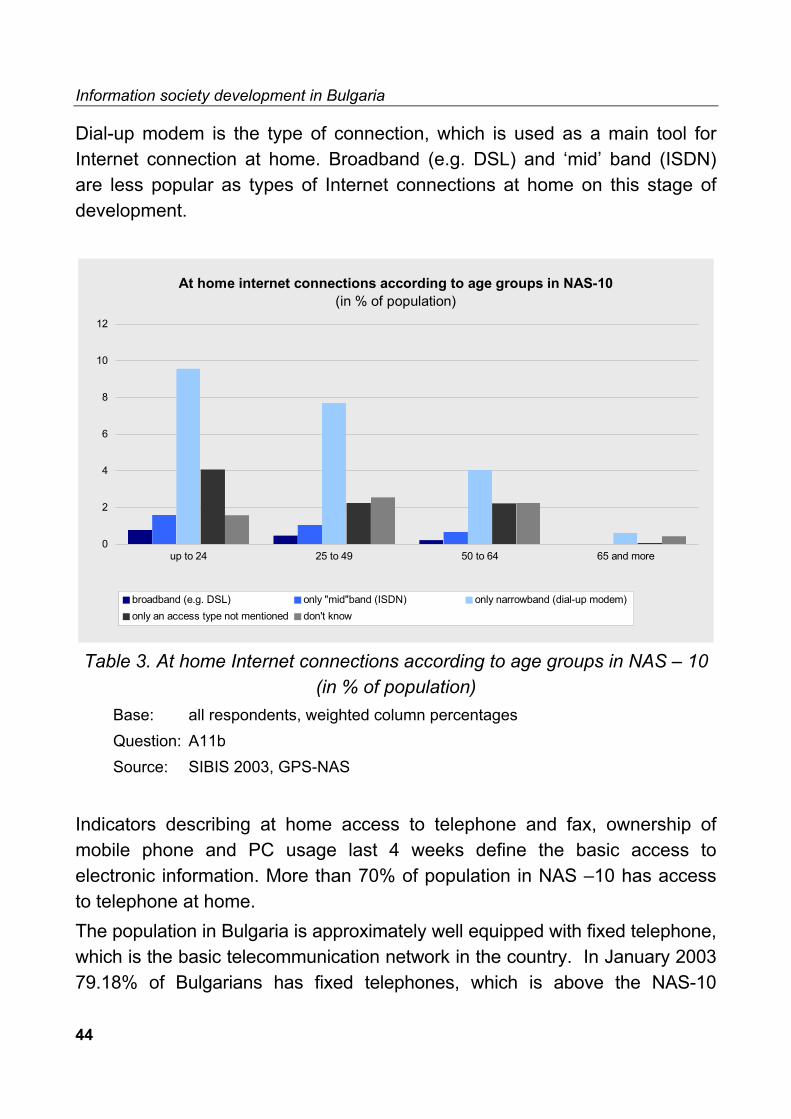
present is still a restraining factor to the creation of competitive IT products and there is a potential for all foreign investors willing to take substantial share of the future European IT market. Having in mind the overall development of Bulgaria’s EU accession process, it is now the time to invest in ICT R&D innovation facilities in order to create a critical mass of competitive products and advanced information services till year 2006. Bulgaria’s long-term ICT strategy is not focused on the current market development and nearest reality, but rather on the advanced technologies and products that will be market leaders in 5-6 years. Educating the most perspective human potential to catch up with the cutting-edge technologies and predict the future trends requires more or less massive and coordinated efforts on behalf of the universities, companies and Bulgarian institutions. In the e-commerce area Internet accessible virtual shops have been established. The number of on-line transactions, however, is still small, with consumers still preferring cash payments according to the GPS. Although, the opportunity to make business transactions on the Internet is available through the ePay.bg electronic environment and its use increases with stable rates. A second e-payment system - BGPay.bg - was launched in mid-2000. Another new service of on-line payments by prepaid cards, called Net-Card, is rapidly gaining popularity. About 3,000 users have registered for this service in just 3-4 months. Nevertheless the above political efforts in the country are not sufficient for better access to electronic information. Basic access to electronic information in Bulgaria The level of basic access to electronic information has defined the level and potential for information society development in any country. One of the main indicators describing the level of basic access to electronic information is at home Internet connection according to age groups in % of population. The connections monitored are broadband (e.g. DSL), ‘mid’ band (ISDN), and narrowband (dial-up modem). Generally, younger population is using Internet more intensively in NAS -10.
Information society development in Bulgaria
44
Dial-up modem is the type of connection, which is used as a main tool for Internet connection at home. Broadband (e.g. DSL) and ‘mid’ band (ISDN) are less popular as types of Internet connections at home on this stage of development.
At home internet connections according to age groups in NAS-10(in % of population)
0
2
4
6
8
10
12
up to 24 25 to 49 50 to 64 65 and more
broadband (e.g. DSL) only "mid"band (ISDN) only narrowband (dial-up modem)only an access type not mentioned don't know
Table 3. At home Internet connections according to age groups in NAS – 10
(in % of population) Base: all respondents, weighted column percentages Question: A11b Source: SIBIS 2003, GPS-NAS
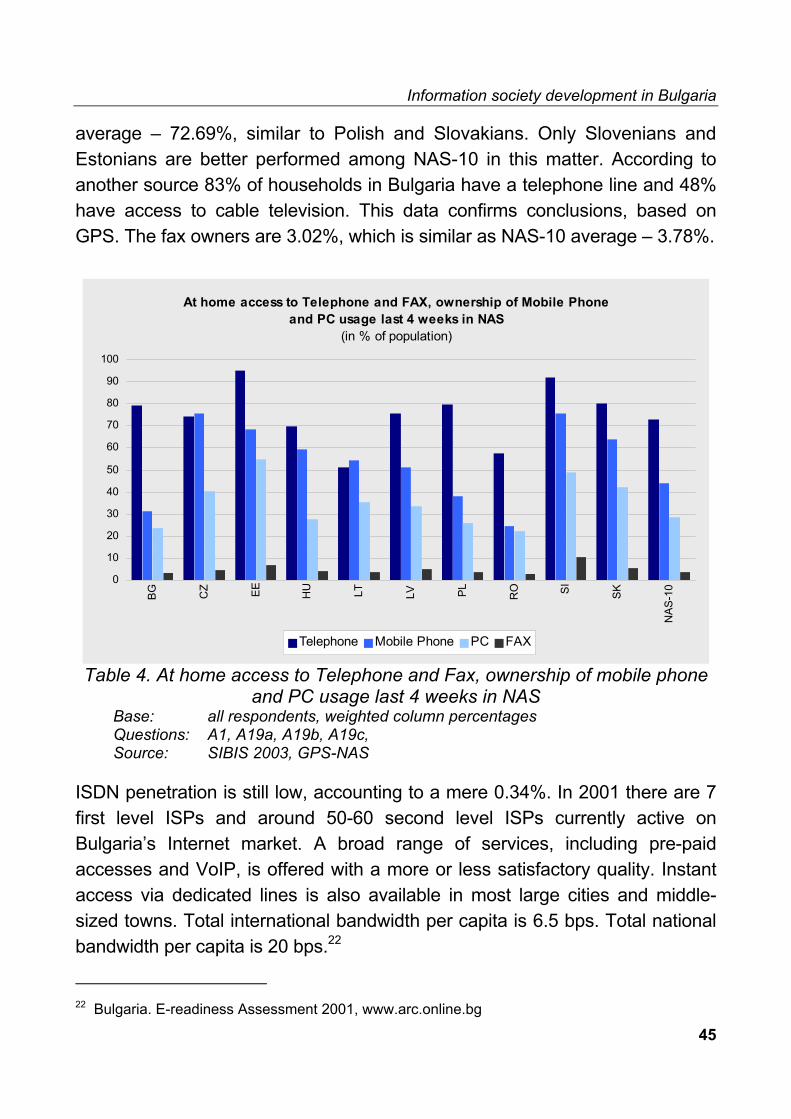
Indicators describing at home access to telephone and fax, ownership of mobile phone and PC usage last 4 weeks define the basic access to electronic information. More than 70% of population in NAS –10 has access to telephone at home. The population in Bulgaria is approximately well equipped with fixed telephone, which is the basic telecommunication network in the country. In January 2003 79.18% of Bulgarians has fixed telephones, which is above the NAS-10
Information society development in Bulgaria
45
average – 72.69%, similar to Polish and Slovakians. Only Slovenians and Estonians are better performed among NAS-10 in this matter. According to another source 83% of households in Bulgaria have a telephone line and 48% have access to cable television. This data confirms conclusions, based on GPS. The fax owners are 3.02%, which is similar as NAS-10 average – 3.78%.
At home access to Telephone and FAX, ownership of Mobile Phoneand PC usage last 4 weeks in NAS
(in % of population)
0
10
20
30
40
50
60
70
80
90
100
BG CZ EE HU LT LV PL RO SI SK
NAS
-10
Telephone Mobile Phone PC FAX
Table 4. At home access to Telephone and Fax, ownership of mobile phone and PC usage last 4 weeks in NAS
Base: all respondents, weighted column percentages Questions: A1, A19a, A19b, A19c, Source: SIBIS 2003, GPS-NAS
ISDN penetration is still low, accounting to a mere 0.34%. In 2001 there are 7 first level ISPs and around 50-60 second level ISPs currently active on Bulgaria’s Internet market. A broad range of services, including pre-paid accesses and VoIP, is offered with a more or less satisfactory quality. Instant access via dedicated lines is also available in most large cities and middle-sized towns. Total international bandwidth per capita is 6.5 bps. Total national bandwidth per capita is 20 bps.22
22 Bulgaria. E-readiness Assessment 2001, www.arc.online.bg

Information society development in Bulgaria
46
The country is characterised by the lowest levels of equipment with mobile telephony. In January 2003 the level of mobile phone owners are 316 among 1000 (313.85 – weighted). Only Romania is performed worse in this indicator with 257.52 –w. among NAS –10. In % – 31.13% of Bulgarians own mobile phones, when for the NAS – 10 the average is 43.68%. For comparison, no nation in Europe has a mobile phone penetration level less then 50%. The variations are from those of France - 54% to Finland- 82%. The trend of fast penetration of mobile phones may cover the gap in the future. The current level is in 50% higher then a year ago. In February, 2002 mobile users were around 20 % (19.6%)23. Mobile Internet is still rather expensive (6 to 10 times the cost of a regular dial-up connection) and somewhat poorer in quality. With the increased competition among mobile operators and the digitalisation of conventional telephone lines, the gap between the prices of fixed and mobile Internet will be closed to a reasonable level in two to tree years.
Usage of telecommunication networks – the Internet usage
As might be expected there is a clear positive association between PC usage and home access to the Internet and regular Internet users in Bulgaria. PC users for last 4 weeks before the period 6-17th of January 2003 are 237.43 per thousand of population. Only Romania is worse performed. But the level of usage is similar to that one of Poland (258.75) and Hungary (275.82) and is almost the same like NAS 10 average. In comparison with the results, obtained by Vitosha research in October 2001, the access to personal computers is almost twice higher (14.4% in Oct., 2001). Internet users in Bulgaria are 26.7% of the population, which is higher than in Hungary, Poland, and Romania (but less than Estonia and Slovenia) and is twice the percentage of the previous. This level is twice higher then a year ago: according to Vitosha research 2002 in January 2002 12.2% of population aged 18+ are Internet users, which is
23 Source: ISPO, ITU, Vitosha research, mobile operators

Information society development in Bulgaria
47
tripled since early 2000. According to estimates in the beginning of 200224, some 16,2 % of the population is computer literate. It allows assuming that the rate of increasing Internet users in the country is very fast. It does not strongly depend on the job requirements, since as of the beginning of 2002 only around 15% of jobs require ICT skills in Bulgaria. One of the factors, affecting this state is that end-user price of access to the Internet dropped down 3 times for the period 2000-2002 and 10 times for the period 1997 - 2002. Still telephone costs represent a large relative share in total access costs.
Internet usage(in % of population)
0
10
20
30
40
50
60
70
80
90
100
US
DK S NL
FIN UK
CH
IRL D A EE
L
EU-1
5 B SI I E F
CZ LV LT EL P SK
NAS
-10
BG PL HU
RO
regular (last 4 weeks) occasional (last 12 months)
Table 5. Internet usage Base: all respondents, weighted column percentages Questions: A7, A8 Sources: SIBIS 2002, GPS, SIBIS 2003, GPS-NAS
According to the GPS regular Internet users (i.e. persons who used the Internet in the last 4 weeks) in Bulgaria are 20.77% of the population. The
24 See: Bulgaria. E-Readiness Assessment 2001, www.arc.online.bg

Information society development in Bulgaria
48
place of the country among 10 NAS is similar to the above indicator, but it is slightly bettered by levels. It would be summarized that the prevailing part of Internet users in Bulgaria is regular ones and this share is increasing. Only 55 are occasional users for last 12 months. 20.77% of Internet users in Bulgaria are regular ones; occasional users are 5.43 and non-users – 73.8%. The total % of Internet users is 26% of the population, which is higher than in Poland, Romania, and Hungary and is close to the NAS average – 27%. 9.5% of the population has Internet access at home. This level is higher than in Romania and Lithuania, similar to the level in Hungary, Slovakia, Latvia and Poland, but less than in Slovenia and Estonia. The non-Internet users (off-liner) are 7.4%. The higher numbers are in Romania, Slovakia, Hungary and Poland. In January 2002, the Internet is typically used in the workplace and specialised locations25. Public access is essential to making the Internet available to greater numbers of individuals and companies in Bulgaria. Computer games rooms, telecentres, cyber cafes and community information centres have acquired great importance in making the Internet available to those who cannot afford personal access at home, in school, at the workplace or elsewhere. The Internet usage by place of access is as follow: public places – 46%, work – 41.7%, home – 30.2%, friends – 19.8%, school – 16.6%. Mostly young people use the Internet. Half of those having access to a PC and Internet are aged 18 to 30, and about one-fourth fall in 31-40 age group. The majority of Internet users live in larger cities, and fewer then 3% are residents of small towns. Internet access is very limited in rural areas. This point is substantial regional disparities and a growing ‘digital divide’. Cost, availability and local conditions limit the use of Internet for electronic banking, electronic commerce, or personal activity planning. Barely 3 percent of Internet users in Bulgaria shop online, and 10% plan their vacations on the net. Internet is most commonly used for information gathering purposes, entertainment, alternative sources of international news, and for personal communication (e-mail and chat).
25 Ibid.

Information society development in Bulgaria
49
2.2 Security
The level of regular Internet users, who are concerned regarding on-line security, both about privacy and about data security is an important barrier for Internet penetration. The respondents from the country are less concerned than NAS, EU and US average (See: Table 6.). It would be explained with the purposes of Internet access in the country. The respondents use Internet mainly as a source of information, for entertainment purposes, and for business and education purposes. Financial transactions operations and on-line shopping, which rise concern regarding security, are still used rarely.
Concerns regarding online security(people feeling very and somewhat concerned ... ; in % of regular internet users)
0
10
20
30
40
50
60
70
80
90
100
PL UK
IRL EL D LV
I E
EU-1
5
DK
FIN L
RO B P
NAS
-10
NL F SI A SK S CZ
EE LT BG HU
CH US
... about privacy and confidentiality ... about data security
Table 6. Concerns regarding on-line security Bases: all respondents, weighted column percentages Questions: J1a, J1b Source: SIBIS 2002, GPS, SIBIS 2003, GPS-NAS

Information society development in Bulgaria
50

Information society development in Bulgaria
51
Chapter 3. E-Society and Social Inclusion
The citizen’s inclusion in ICT usage and development is the main social policy concern of e-society development. It is inextricably linked to the issues of accessing and maintaining employment, education, housing and healthcare. Against this background there has been a predisposition to view divisions in relation to the Information society as being just an extension of divisions from ‘pre-Information Society’. This requires a multi-perspective view that includes attention to differential levels of access to the ICTs across various subgroups of population whilst also looking at issues such as ‘unpacking’ of the very concept of access. This chapter focuses firstly on indicators, presenting the levels of citizen’s inclusion in ICT usage, providing some socio-economic analysis of the results. After that the focus is on GPS data of the patterns of barrier perception development in relation to the intensity of Internet usage. Internet users, majority of which are regular ones, are 26.4% of the population and the rate of increasing Internet users in the country is fast and it will be accelerated. This is resulting from the fact that mostly young people use the Internet. Half of those having access to a PC and the Internet are aged 18 to 30, and about ¼ falls in the 31-40 age groups. There is a very large group of Internet users in the country, who are younger than the age group of 18. Another factor, affecting this state is that end-user price of access to the Internet dropped down 3 times for the period 2000-2002 and 10 times for the period 1997 - 2002. Still telephone costs represent a large relative share in total access costs. The majority of Internet users live in larger cities, and fewer than 3% are residents of small towns. Internet access is very limited in rural areas. This point is to substantial regional disparities and a growing ‘digital divide’. Cost, availability and local conditions limit the use of Internet for electronic banking, electronic commerce, or personal activity planning. Barely 3 percent of Internet users in Bulgaria shop on-line, and 10% plan their vacations on the net. Internet is most commonly used for information gathering purposes, entertainment, alternative sources of international news, and for personal communication (e-mail and chat).

Information society development in Bulgaria
52
Barriers to Internet usage
The percentage of population who at least somewhat agree that the Internet requires advanced computer skills is the highest among all measured barriers (See: Table 7.). In almost all countries the population percentage is above 50%. Although the figure does not represent the accurate comparison due to different populations for EU (only occasional and non-Internet users) and NAS (regular, occasional Internet users and all who have ever heard of the Internet), a clear picture of Bulgarian position can be grasped. Bulgarians are positioned higher compared to NAS and EU average.
Barriers to Internet usage: requirement for advanced computer skills(in % of occasional and non-Internet users (EU); in % of
respondents who ever have heard of the Internet incl. DK (NAS))
0
10
20
30
40
50
60
70
80
90
100
LT LV SK CZ
RO
EE
BG A L
HU
NA
S-1
0 D NL F
FIN EL P E
EU
-15 SI B
UK S PL
IRL
DK I
CH
US
agree completely agree somew hat
Table 7. Barriers to Internet usage: It requires advanced computer skills Bases: EU-15 countries: occasional and non Internet users, NAS-10 countries: respondents who ever have heard of the Internet (inc. don’t know), weighted column percentages Questions: A5a, A7, A8, A18a Sources: SIBIS 2002, GPS, SIBIS 2003, GPS-NAS
It seems that the prejudice of too expensive usage of the Internet prevents the proliferation of the usage among occasional / non – Internet users. This can be clearly observed in the countries with lower Internet penetration such as Bulgaria, which are more likely to perceive the costs as a barrier, and vice versa (See: Table 8.). But this barrier is not so important for the country comparatively to NAS –10 average.

Information society development in Bulgaria
53
Barriers to Internet usage: is too expensive to use (in % of non-Internet users resp. respondents who ever have heard of Internet incl.
DK) and Internet usage (in % of population)
B
CZ
DKE
ELI
NAS-10RO
S
SK
A
BG
D
EE
EU-15FFIN
HU
IRLL
LT LV
NL
P
PL
SI UK
20
30
40
50
60
70
80
90
100
0 10 20 30 40 50 60 70 80 90Internet usage (%)
too
expe
nsive
to u
se (i
n %
of n
on-
Inte
rnet
use
rs re
sp. r
espo
nden
ts wh
o ev
er h
ave
hear
d of
Inte
rnet
incl.
DK)
Table 8. Barriers to Internet usage: is too expensive to use Bases: EU-15 countries: occasional and non Internet users resp. all respondents, NAS-10 countries: respondents who ever have heard of the Internet (inc. don’t know) resp. all respondents, weighted column percentages Questions: A5a, A8, A18d Sources: SIBIS 2002, GPS, SIBIS 2003, GPS-NAS
Here some outliers might be observed, e.g. Estonia, Slovakia, Czech Republic, Lithuania and Latvia, where the costs are very important barrier. The percentage of occasional Internet users who agree with the statement ‘Internet lacks useful or interesting information’ is higher in countries with higher Internet usage. In NAS countries this is thus a smaller barrier compared to EU – 15 with higher Internet penetration. Bulgaria is the country with the lowest level of agreement that the lack of useful or interesting information is a barrier to Internet usage among occasional users (See: Table 9.).

Information society development in Bulgaria
54
Barriers to Internet usage: lacks useful or interesting information (in % of occasional Internet users) and Internet usage (in % of
population)
B
CZ
DK
E
EL
INAS-10
RO
S
SKA
BG
D
EE
EU-15
F
FINHU
IRL
LLT LV
NLP
PL
SI
UK
0
5
10
15
20
25
30
35
40
0 10 20 30 40 50 60 70 80 90Internet usage (%)
lack
s us
eful
or i
nter
estin
g in
form
atio
n (in
%
of o
ccas
iona
l Int
erne
t use
rs)
Table 9. Barriers to Internet usage: lacks of useful or interesting information
Bases: EU-15 countries: occasional and non Internet users resp. all respondents, NAS-10 countries: respondents who ever have heard of the Internet (inc. don’t know) resp. all respondents, weighted column percentages Questions: A5a, A8, A18e Sources: SIBIS 2002, GPS, SIBIS 2003, GPS-NAS
Internet usage drop-outs(in % of population)
0
1
2
3
4
5
6
7
8
UK S A
EE
B
DK SI IRL E EL LT
EU-1
5 P
FIN F
NL
HU LV RO D L
NAS
-10
PL
I
SK BG CZ
CH
USA
real internet usage drop-outs former internet at home users but still internet users
Table 10. Internet usage drop-outs
Base: all respondents, weighted column percentages Questions: A5a, A5b, A6 Sources: SIBIS 2002, GPS, SIBIS 2003, GPS-NAS
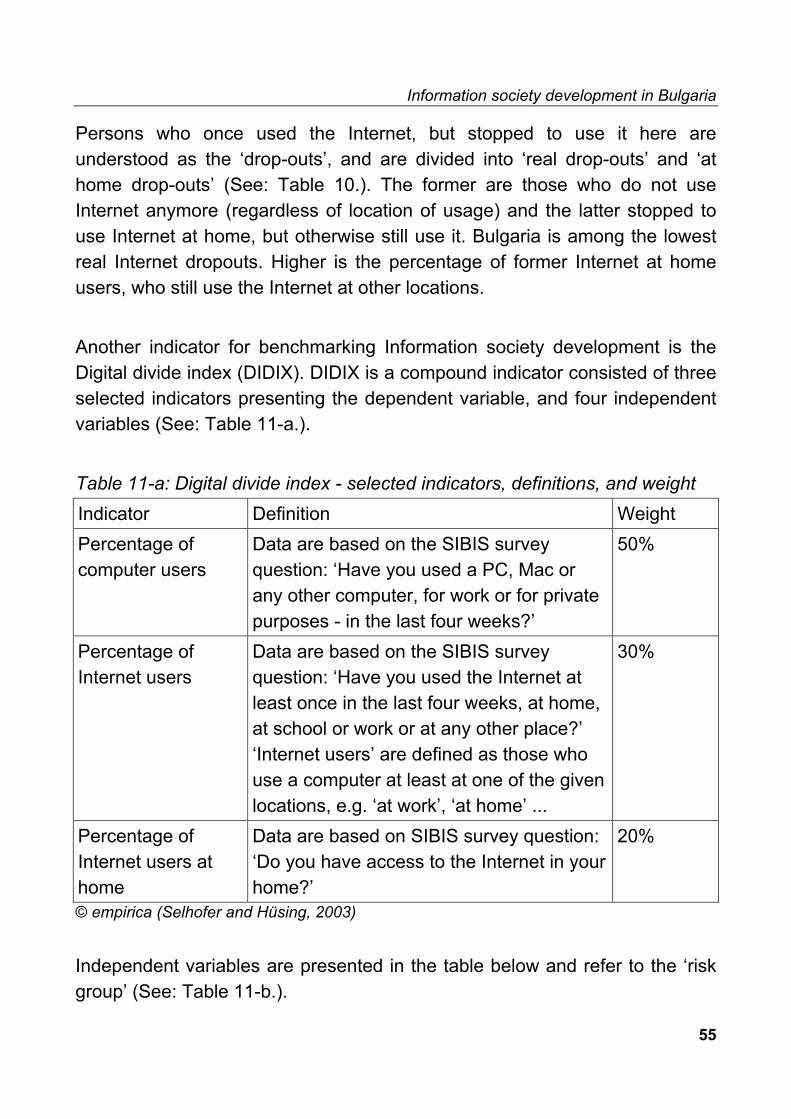
Information society development in Bulgaria
55
Persons who once used the Internet, but stopped to use it here are understood as the ‘drop-outs’, and are divided into ‘real drop-outs’ and ‘at home drop-outs’ (See: Table 10.). The former are those who do not use Internet anymore (regardless of location of usage) and the latter stopped to use Internet at home, but otherwise still use it. Bulgaria is among the lowest real Internet dropouts. Higher is the percentage of former Internet at home users, who still use the Internet at other locations. Another indicator for benchmarking Information society development is the Digital divide index (DIDIX). DIDIX is a compound indicator consisted of three selected indicators presenting the dependent variable, and four independent variables (See: Table 11-a.). Table 11-a: Digital divide index - selected indicators, definitions, and weight Indicator Definition Weight Percentage of computer users
Data are based on the SIBIS survey question: ‘Have you used a PC, Mac or any other computer, for work or for private purposes - in the last four weeks?’
50%
Percentage of Internet users
Data are based on the SIBIS survey question: ‘Have you used the Internet at least once in the last four weeks, at home, at school or work or at any other place?’ ‘Internet users’ are defined as those who use a computer at least at one of the given locations, e.g. ‘at work’, ‘at home’ ...
30%
Percentage of Internet users at home
Data are based on SIBIS survey question: ‘Do you have access to the Internet in your home?’
20%
© empirica (Selhofer and Hüsing, 2003) Independent variables are presented in the table below and refer to the ‘risk group’ (See: Table 11-b.).

Information society development in Bulgaria
56
Table 11-b: Digital divide index – independent variables, definition of the risk
group and percentage of population in EU (2000)
Independent variable Definition of the disadvantaged group (‘risk group’)
Percentage of population in EU (2000)
Gender Women ~ 52% Age people aged 50 years or older
("50+") ~ 40%
Education low education group (= people who finished formal school education at an age of 15 years or below)
~ 30%
Income low income group (= the lowest quartile of the survey respondents)
~ 25%
© empirica (Selhofer and Hüsing, 2003)26. It presents the ratio between average population percentage and the percentage of the risk group. The larger the gap (100% means no gap) the lower is the likelihood of the risk group to use computer/Internet compared to population average. NAS countries are measured the first time for DIDIX in the SIBIS 2003 survey, whereas the measurement of DIDIX for EU was already conducted in 1997 and 2000. In EU countries the risk groups are on average 53% as likely to use PC/Internet as the average population. In NAS countries the risk groups are on average 41.9% as likely to use them. In EU countries the risk groups are on average 53% as likely to use PC/Internet as the average population. In NAS countries the risk groups are on average 41.9% as likely to use them.
26 For further considerations on DIDIX see the paper ‘The Digital Divide Index – A Measure of social inequalities in the Adoption of ICT’ (Selhofer and Hüsing, 2003).

Information society development in Bulgaria
57
Digital Divide Indices for EU and NAS
0
10
20
30
40
50
60
70
S A DK
UK NL
IRL
FIN
EU-1
5 D L EE CZ PL F SI SK
NAS
10 B E
LV
I
HU LT BG RO EL P
2002/2003 2000 1997
Table 12. Digital Divide Indices for EU and NAS -10 Base: 1997, 2000: N=15,900, weighted by standard Eurobarometer country and EU-15 weights; 2002, 2003: all respondents, weighted percentages Questions: 2002, 2003: IN1, IN3, Z19, Z21 Sources: 1997: Eurobarometer 47.0, Jan-Feb 1997; 2000: Eurobarometer 54, Oct-Nov 2000; 2002: SIBIS 2002, GPS; 2003: SIBIS 2003, GPS – NAS
Bulgarian DIDIX (33%) is below the NAS-10 average and far below EU-15 average (52.9%). Compared to other NAS and EU countries Bulgaria DIDIX is higher only than Romania, Greece and Portugal. The educational gap is very big for Bulgaria. In our terms: 5% vs. 27% EU-15. This gap is even larger compared to NAS-10 age gap, and could be explained with the second largest gap, observed by age: 35% vs. 53% EU-15.

Information society development in Bulgaria
58

Information society development in Bulgaria
59
Chapter 4. e-Education and Life-long-learning
This chapter provides an overview of the traditions and policy aspects of education and learning and their e-aspect taking into account the results of the GPS. The first part of the analysis uses mainly data obtained before GPS. In the second one the context of the education, defined above is fully implemented. It is understood as a formally institutionalised process of knowledge transfer and knowledge development, as opposed to informal learning arrangements taking place through various communities of practice arrangements, on-the-job training and peer learning. The indicators of lifelong learning, usage of e-learning, and ICT skills are presented. Some analyses of Internet penetration in relation to lifelong learning are carried out as well.
4.1. Traditions in education and policy aspects in Bulgaria
There are 47 Universities in Bulgaria, located in 26 cities and towns. Around 50% of them have computer specialties. Over 6,000 Bulgarian students are currently majoring in Computer Science; another 5,000 have chosen electric engineering, mathematics, physics and biotechnology. The research and development in the area of ICT is concentrated in the Schools of higher education and the scientific laboratories of the Bulgarian Academy of Sciences. The quality of human potential, produced by educational system is recognised by external evaluation. It would be summarised as follow: the secondary education in the country is among the best in the world: 5th in the world in sciences, 11th in mathematics (World Bank and The Economist ranking). Bulgarian team in mathematics obtains first place in 2003 world competition. Bulgarians are among the top university students worldwide (2nd in the world in SAT scores). Higher supply of human IT resources is defined by the higher interest of young people in ICT education. It is resulted from traditions of favouring education, fast developing IT markets in EU and USA, and that the Bulgarian experts have combination of skills in hardware and software.27 The number of students in the area of Information and
27 Data is for 2002. Source: www.minedu.government.bg

Information society development in Bulgaria
60
Communication technologies is currently 6 485 (about 3 % of total number of students). Young people, who apply to study at the Technical University - Sofia prefer on the first place following specialties: Computer systems and technologies – 3836 of applicants; Communication equipment and technologies –1784 of applicants. There are between 12 and 530 applications for the remaining 32 specialties. Existing foreign demand and lack of enough internal one for skilled human resources in ICT sector has led to brain drain from the country28. According to some analysis the ICT demand in EU is for 1.7 million, and in USA – for 1.6 million specialists in 2003. Additional reasons for this process is weak practical knowledge of young people to develop own business in IT sector, weak collaboration between universities, business and research institutes.29 The concern of ‘Education’ in Bulgaria is changing along with the changes from the formal and pre-defined curriculum in industrial society to education as life-long learning in the information society. The focus is changing from learning to do (or know) towards learning to learn. In this context, education is understood as a formally institutionalised process of knowledge transfer and knowledge development. It is crucial in the new economy, where the innovation cycles are getting shorter30. This concern reflects several policy documents like: ─ Action plan of the Government ‘People are the wealth of Bulgaria’31, ─ Strategy for training the state administration etc.
The measures of the Ministry of education and science in Bulgaria to improve human resources in information technology sector include: ─ National strategy for education in ICT (1998); ─ Programme (1999) in order to improve the level of education in ICT; ─ Order of 30.08.1999 to include informatics and IT as obligatory for all
pupils in Bulgarian schools.
28 Enterprise Directorate – General. Innovation policy profile: Bulgaria, Final report, March 2003, www.cordis.lu 29 Enterprise Directorate – General. Innovation policy profile: Bulgaria, Final report, March 2003, www.cordis.lu ) 30 IPTS (2000),: The New Economy 31 www.government.bg

Information society development in Bulgaria
61
The education started on 1st of Sept. 1999. In May 2000 all requirements to the teaching programmes have been published. Nevertheless in January 2003 the level of participation in lifelong learning in % of labour force is 5.06%, which is higher from Romania only (3.51%). In comparison the leaders’ have level of 37% (Finland – 37.32% and USA – 37.34%). The participation in any learning in the last 4 weeks before the GPS in January 2003 in % of labour force is the lowest in Europe – 7.56%, and far away from the leader – Finland with 59.86%. The level of self-directed learning in % of labour force in the lowest among countries – 5.51%, which is about 8 -9 times less then leaders like Germany - 51.73%, Austria – 47.6%, and Finland – 44.45%. The total (online and offline) usage of e-learning as an percentage of labour force is lowest among countries – 3.17%, included in SIBIS+ General Population Survey. But the level of on-line usage of e-learning in Bulgaria is higher then in Greece and Poland. This picture is corresponding to the level of penetration of computers at schools and training provided by companies in Bulgaria. The number of computers at schools and universities is insufficient32. Penetration of ICT in Bulgarian schools is still at a relatively low level but is growing - the number of PCs at secondary schools doubled in 2001. There are 5 643 computers and 989 computer labs in a total of 1016 schools. About 20 000 computers are available at 48 universities nation-wide. Most universities are connected to the Internet but this capacity is limited and Internet resources are not yet integrated into learning process. Bulgaria has drafted an ambitious programme to introduce Internet education in schools, including free Internet access and ICT training at all educational levels by the end of 2005. Teaching training will be critical to the success of this initiative. Another reason for the low level of life – long learning is connected with insufficient training provided by companies33. Most of the managers of enterprises in Bulgaria (72.5%) believe that it is necessary to improve the employed persons’ qualification. At the same time the activities for continuous vocational training are not their main priority. 12.6% of enterprises only have previously drawn plan for education, as 6.6% of them – budget of financial providing for continuous vocational training activities. A lack of necessary 32 Bulgaria E-Readiness Assessment 2001, www.arc.online.bg 33 National Statistical Institute (2002), Bulgaria 2001, Socio-economic development, Sofia

Information society development in Bulgaria
62
financial resources is the main reason not to be launched plans for education according to 45.7% of managers. During the period 2000 – first half of 2001 36.4% of the organised activities for education of the employed person are courses for continuous vocational training. Among them predominant are the courses, organised by external organisations – 62.7%. Besides courses, different other activities for continuous vocational training have been organised. The most frequently carried out activities are: instructions at workshops, lectures and seminars – 40.4% of all activities. The activities for continuous vocational training are provided in less then ¼ of the total number of enterprises. The coverage of continuous vocational training is higher in the public sector – 58.2% of all carried out courses for professional qualification and 55% of other activities for continuing vocational training. The participants in courses for continuous vocational training in the public sector are more than participants of the private sector – the proportion in 2000 is 59.1% as against 40.9% in the first half of 2001 – respectively 58.8% and 41.2%. The bigger parts of participants in all forms of continuous vocational training are men – 64.3%. Most of the employed have attended the activities for training on technology and production, including operation and maintenance of automated systems, quality control and elaboration of new materials and products – 39.0% of the all participants in courses. The average time spent for education is 20 hours per participant in 2000 and 21 hours – in the first half of 2001. Self-directed learning is not well performed in Bulgaria. Only 7% of the labour force is included in this activity in January 2003, which is far behind EU average – which is more than 30%. It would be connected with the level of access to PCs and Internet in the business34. Only 1/3 of Bulgarian companies have used computers in their daily work. Only 7.3% of workplaces have PCs installed. Only 20% of companies with computers have built their own intranets. Around 12% of the companies are connected to the Internet. In the majority of companies, computers are used for document processing, accounting and legal information systems. Fax machines and telephone, as well as personal contacts, are still perceived as key to doing business. Signed paper documents are required almost everywhere.
34 See: Bulgaria. E-Readiness Assessment 2001, www.arc.online.bg

Information society development in Bulgaria
63
4.2. Life-long learning and e-Education according to GPS survey results
The level of e-Education and Life-long-learning in Bulgaria is low.
Participation in lifelong learning(in % of labour force)
0
5
10
15
20
25
30
35
40
FIN S NL
DK
UK A D
EU-1
5 B L E I
IRL SI SK
F
CZ EE EL LV
P LT PL
NAS
-10
HU
BG RO CH
US
Table 13. Participation in lifelong learning
Bases: labour force, weighted column percentages Questions: C2 Source: SIBIS 2002, GPS, SIBIS 2003, GPS-NAS
In Information Society the importance of the knowledge is constantly increasing. The shortening of innovation cycle rapidly produces new knowledge, and to stay competitive on the market these knowledge has to be applied. It is of great importance that the labour force assesses new knowledge through permanent education. This improves the chances for job applicants as well as the productivity of employed. The differences in participation in lifelong learning between EU and NAS countries are larger compared to T&A indicators. In EU 23% of labour force participate in this kind of learning, while for the NAS this is the case for 10% of population. In the SIBIS context the education is understood as a formally institutionalised process of knowledge transfer and knowledge development, as opposed to informal learning arrangements taking place through various communities of practice arrangements, on-the-job training and peer learning. Here indicators

Information society development in Bulgaria
64
of lifelong learning, usage of e-learning, and ICT skills are presented. In Bulgaria the level of participation in lifelong learning in % of labour force is 5.06%, which is higher than Romania only (3.51%). In comparison the leaders’ have level of 37% (Finland – 37.32% and USA – 37.34%). The participation in any learning last 4 weeks in % of labour force is the lowest in Europe – 7.56%, and far away from the leader – Finland with 59.86%. The level of self-directed learning in % of labour force in the lowest among countries – 5.51%, which is about 8 -9 times less then leaders like Germany - 51.73%, Austria – 47.6%, and Finland – 44.45%. The total (online and offline) usage of e-learning as an percentage of labour force is lowest among countries – 3.17%, included in SIBIS+ General Population Survey. But the level of on-line usage of e-learning in Bulgaria is higher then in Greece and Poland. This picture is corresponding to the level of penetration of computers at schools and training provided by companies in Bulgaria. A lack of necessary financial resources is the main reason not to be launched plans for education according to 45.7% of managers in the companies.
L ife-lo n g le arn in g ( in % of la bo u r fo rce) a n d Inte rne t u s a g e ( in % of p o p u latio n )
D K S
F IN
U K
IR L
D
E E
LE U -15
S II
FC Z
LVLT
P
S K
N A S -10
B G H U
R O
N L A
BE
E L
P L
0
5
10
15
20
25
30
35
40
0 10 20 30 4 0 50 6 0 7 0 8 0 90In te rne t us age (% )
life-long learning (in % of labour force)
Table 14. Life-long learning and Internet usage
Bases: labour force resp. all respondents, weighted column percentages Questions: A7, A8, A18e Source: SIBIS 2002, GPS, SIBIS 2003, GPS-NAS

Information society development in Bulgaria
65
The above figure clearly displays the strong correlation between low Internet usage and participation in lifelong learning. Instead of causality, here perhaps the common general IST development factor is strongly correlated with both variables. The usage of e-learning in Bulgaria is low as well. On-line usage is higher than those of offline in opposite of the case of Poland.
Skills at communicating via the Internet(E-Mail, Internet chats, personal web page; in % of population)
0
10
20
30
40
50
60
70
80
DK S NL
UK
FIN
IRL A L D
EU-1
5
EE B E SI I F
CZ
LV LT EL SK
P
BG
NAS
-10 PL HU
RO CH
USA
very confident on at least one media fairly confident on at least one media (excl.)
Table 15. Skills at communicating via the Internet Base: all respondents, weighted column percentages Questions: D1c, D1d, D1f Sources: SIBIS 2002, GPS, SIBIS 2003, GPS-NAS
The Internet is build to communicate. The ability to communicate with others via the Internet (e-mail, Internet chats, and personal web page) is a basic skill in Europe as an Information Society. Half of the EU population regard themselves as very or fairly confident in communicate with others via the Internet: being confident in using at least e-mail, chat rooms or personal web pages. A general North-South divide within EU can be found in regard confidence in communicate digitally. Bulgaria is positioned above NAS-10 average, but
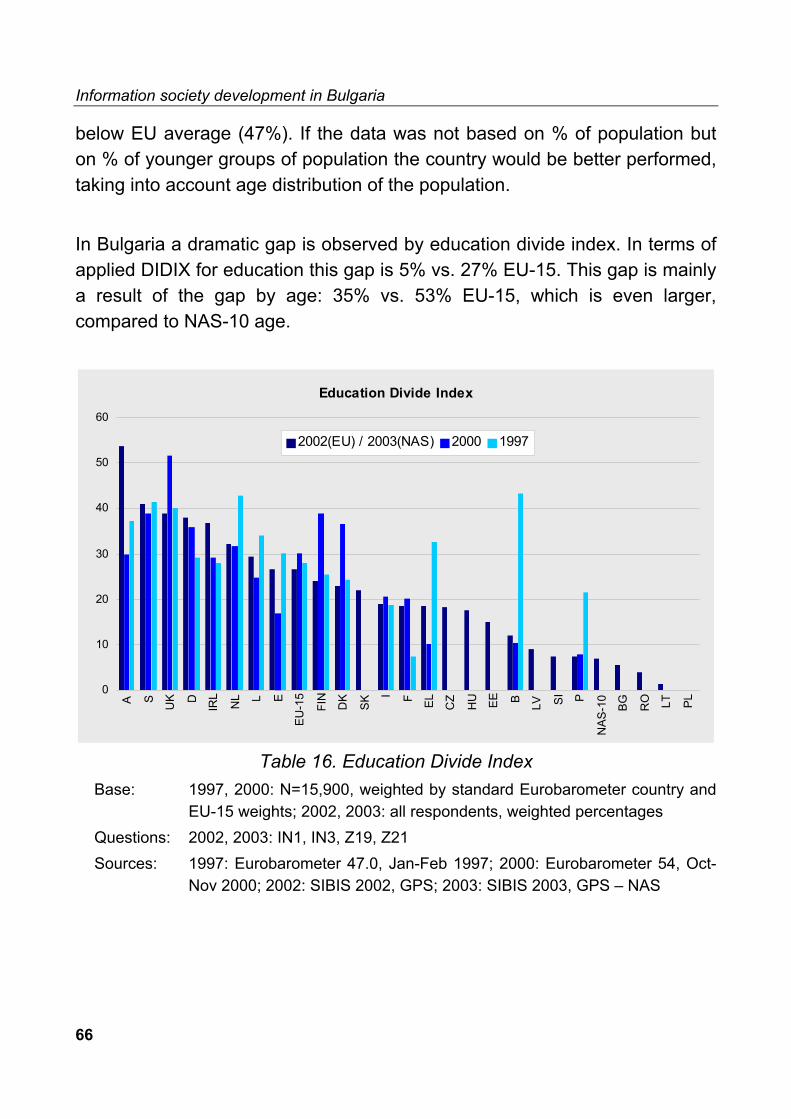
Information society development in Bulgaria
66
below EU average (47%). If the data was not based on % of population but on % of younger groups of population the country would be better performed, taking into account age distribution of the population. In Bulgaria a dramatic gap is observed by education divide index. In terms of applied DIDIX for education this gap is 5% vs. 27% EU-15. This gap is mainly a result of the gap by age: 35% vs. 53% EU-15, which is even larger, compared to NAS-10 age.
Education Divide Index
0
10
20
30
40
50
60
A S UK D
IRL
NL L E
EU-1
5
FIN
DK
SK
I F EL CZ
HU EE B LV SI P
NAS
-10
BG RO LT PL
2002(EU) / 2003(NAS) 2000 1997
Table 16. Education Divide Index
Base: 1997, 2000: N=15,900, weighted by standard Eurobarometer country and EU-15 weights; 2002, 2003: all respondents, weighted percentages Questions: 2002, 2003: IN1, IN3, Z19, Z21 Sources: 1997: Eurobarometer 47.0, Jan-Feb 1997; 2000: Eurobarometer 54, Oct- Nov 2000; 2002: SIBIS 2002, GPS; 2003: SIBIS 2003, GPS – NAS

Information society development in Bulgaria
67
Chapter 5. e-Economy and e-Commerce This chapter provides analysis of data concerning traditions and the state of the art of e-Economy and e-Commerce area, taking into policy development aspects. After that analysis of GPS results is provided.
5.1. Traditions in the IT sector in Bulgaria (The Silicon Valley of the former communist block) There are more than one thousand IT small and medium sized enterprises in Bulgaria now. This is exclusively due to the established traditions (35 years of experience) in this area, and very well developed educational system in electronics, engineering sciences and computer sciences. Until 1990, under the Council for Mutual Economic Assistance (CMEA) Bulgaria was the only country in Eastern Europe that specialised in high technologies. Three generations of Bulgarian professionals gained recognition in Western countries in the field of mainframes of 5th generation, high-speed matrix processors and parallel systems. In the established research and development institutes a number of groups were organized to work in the area of software development, firmware, system hardware, digital and analog PC design, etc. In the past Bulgaria was called “the Silicon Valley of Eastern Europe” because of its strategic specialisation in high-tech and ICT products. After the political and economic changes in 1990, the powerful Bulgarian electronic industry lost many of its traditional markets and the production was dynamically restructured. The big state-owned electronic enterprises collapsed and at the same time a great number of small and flexible private companies appeared on the Bulgarian market. There is a large number of scientists in the business sector in Bulgaria are skilled in electronics and communications, as well as mechanical engineering35. This means that the human resources for ICT development
35 Statistical Yearbook, Bulgaria, 2001

Information society development in Bulgaria
68
took a large share among all human potential, which is good precondition for e-economy and e-commerce development.
IT companies profile in Bulgaria
The high potential of Bulgarian IT resources (well-educated professionals and relatively good basis for development) was the reason for the designation of electrical engineering and electronics industry as a strategic sector and giving this sector priority in long-term development programs. These priorities are also due to the efficient export record of the sector. In 2000 this sector’s production accounted for 3.1% of the total industrial output. The relatively small size of the domestic IT market is the reason for the growing number of IT companies, which are working on assignments entirely for foreign markets. Among the major sources for optimism are the strong traditions of Bulgarian R&D sector. According to official surveys (carried out at the end of 2000) Bulgaria is very close to Slovakia in percent of scientists and engineers per capita.
Table 17. S&E in R&D per million Country Bulgaria Czech Republic Hungary Poland Romania Slovakia
Scientists and Engineers in R&D per million
7.47 7.11 7 7.21 7.24 7.53
Source: World Bank Knowledge Assessment Methodology The IT companies in Bulgaria cover almost the whole spectrum of IT development activities and services. Few specific areas could be mentioned, regardless of the fact that some of the IT companies work in more than one area: ● Software - computer system software, networking software and web-
design, CAD/CAM/CAE software, telecommunications and wireless development software, application software, firmware;
● Hardware - computer and systems assembling, digital and analogue printed circuits design, PCB manufacture, analogue mixed engineering;
● Microelectronics - design ASIC’s, front-end and back-end microelectronic activities;
● Automation - systems for industrial automation.

Information society development in Bulgaria
69
Working for a number of big corporate clients in Western Europe and US has proved that Bulgarians are able not only to develop design work, maintenance and testing but also fully integrated systems and solutions. Customers of Bulgarian firms include Canadian government agencies such as the Department of Transport, Department of Environment and others, as well as global blue chip firms such as: BMW, Boeing, Ford, Lockheed Martin, Nortel, Hasbro, Siemens, PricewaterhouseCoopers, Xerox and Telesis Technologies. 98% of the IT companies are private. Most of them are very flexible and innovative and are part of the SME-segment of the industry (with up to 100-120 employees). There are several IT associations incorporating the major IT players - Bulgarian Association for Information Technologies (BAIT), Bulgarian Association of Software Companies (BASSCOM), and the Bulgarian Internet Association (BAI). The UN 2001 global Human Development Report has introduced a Technology Achievement Index (TAI) based on eight indicators in four dimensions; technology creation, diffusion of recent innovations, diffusion of old innovations and human skills. This index shows how well a country is creating and diffusing technology and building a human skills base, reflecting a given society’s ability to participate in the network age. The TAI ranking is led by Finland, followed by the United States and Sweden. On this index Bulgaria ranks 28 ahead of economies, such as Poland and Malaysia, and is also considered being among the potential leaders in the field of information and communication technologies.
IT Market development
According to the Information Society Index, which rates 55 countries, comprising 96% of World GDP and 99% of World’s expenditure, Bulgaria falls in the Sprinter Group (where investments surge and retreat on the whims of social, political, and economic change), together with countries like Czech Republic, Poland and Hungary. However, Bulgaria has the advantage of established traditions and experience in the IT sector and well-structured private companies, which cover almost the whole spectrum of IT applications.

Information society development in Bulgaria
70
According to research of the IDG group, the yearly growth of the IT sector in Bulgaria is about 35%. IT spending for 2001 is about USD 188.4 million and estimated total revenues will be around USD 270 million. For the period 1997-2001 the hardware part of IT sector shows a tendency to decrease and the software share increases each year. Software development is considered as one of the main forces driving the growth of the Bulgarian IT market. The really fast development of the companies, which include in their portfolio complex Internet/Intranet solutions, mobile applications, telecommunication software, dynamic database driven web sites, interactive communication environment solutions, development of CD and Web-based interactive and non-interactive multimedia solutions, should be underlined.
IT Market by segments
Like it is pointed out above, the software companies cover almost the whole spectrum of software applications from Enterprise Resource Planning to CAD/CAM/CAE. The constant and stable penetration of PCs and especially of mobile telephones (around 1,5M subscribers of the existing three mobile operators in 2001) in Bulgaria is a huge stimulating factor for such development.
Competitive advantages of the Bulgarian IT environment and companies ● Very high quality personnel. Combination of software and hardware
skills; ● Very competitive pricing for IT expert manpower - 1: 4 difference in
salary level; ● Long traditions in IT development; ● Third place in Europe and eight position worldwide according to the
absolute number of certified IT professionals (third place worldwide according to percentage of certificates!);
● Strategic geographic location - a one hour time difference from Continental Europe;
● Integral part of the EU common market;

Information society development in Bulgaria
71
● Macroeconomic Stability; ● Expected full NATO membership by 2004; ● Expected full European Union membership by 2006. ● More than 6,000 students majoring in computer science. More than
5,000 graduating in engineering sciences. More than 7,000 IT professionals working in small ICT companies.
● Excellent Education: ■ Bulgaria’s secondary education is among the best in the world: 5th in
the world in sciences, 11th in mathematics (World Bank and The Economist ranking)
■ Bulgarians rank second in international IQ tests (MENSA International) ■ Bulgarians are among the top university students worldwide (2nd in
the world in SAT scores) ● Excellent labour quality/labour cost ratio (average monthly salary of
approximately 264 Levs or USD120); ● Some of the lowest direct taxes in the region; ● Stable and predictable business environment; ● Sharply decreasing corruption, transparent privatisation; ● Effective free trade agreements with most countries in the region;
liberalised access to a regional market of over 550 million consumers; ● 55 Agreements on Mutual Protection and Promotion of Investments, 45
are effective; ● 53 Double Taxation Avoidance Agreements, 48 are effective; ● WTO membership from 1996; ● Free Trade Area with Turkey from 01/01/1999; ● Free Trade Agreement with Macedonia from 01/01/2000 ● Free trade agreements signed with Lithuania (08/05/2001), Israel
(08/06/2001), Croatia (04/12/2001) and Estonia (11/12/2001), completed negotiations with Latvia
● EFTA Agreement from 01/07/1993 ● CEFTA member from 01/01/1999
Nevertheless the recent state of the art of e-economy and e-commerce penetration in the country is not sufficient.

Information society development in Bulgaria
72
The level of access to PCs and Internet in the business in Bulgaria36 is low. A year ago only 30 % of Bulgarian companies use computers in their daily work. Only 7.3% of workplaces have PCs installed. Only 20% of companies with computers have built their own intranets. Around 12% of the companies are connected to the Internet. In the majority of companies, computers are used for document processing, accounting and legal information systems. Fax machines and telephone, as well as personal contacts, are still perceived as key to doing business. Signed paper documents are required almost everywhere. E-payment instruments are available on the Bulgarian market, but e-commerce is still in its early stage in the beginning of 2002. Around 10% of the population use electronic cards but only 1.4% of debit cardholders is registered in e-Pay.bg – Bulgaria’s most popular system for on-line payments. It was established in 1999 and now it has more then 20 000 registered consumers. The transactions for the period 7-13.06.2003 are more then 15 000. The electronic signature guarantees their security. on-line transactions are increasing but small and amount to about BGN 780 000 for the first quarter 0f 2003. Internet is predominantly used for processing orders and payment is done in the conventional manner upon delivery. All state administration uses electronic cards for receiving salaries at the end of 2002. New Real Rime Interbank Gross-Settlement is introduced as of 2nd of June 2003. At the end of the first week of its usage is 6% of total interbank payments in the country.
5.2. e-Economy in Bulgaria according to GPS survey
In this part two basic e-economy indicators according to GPS survey are presented: e-commerce usage and e-banking usage. Some e-economy snapshots are also presented in relation to Internet usage.
36 See: Bulgaria. E-Readiness Assessment 2001, www.arc.online.bg

Information society development in Bulgaria
73
Online Interactive buyer by country: People who have ordered a product or a service, or have conducted online banking or bought financial
products(in % of population)
0
10
20
30
40
50
60
DK
FIN S UK EE NL A D
IRL L
EU-1
5 B F I SI LVE P
CZ LT EL SK
NAS
-10 PL HU
BG RO CH
US
Table 18. On-line Interactive buyer by country
Base: all respondents, weighted column percentages Questions: B1b, B1c Sources: SIBIS 2002, GPS, SIBIS 2003, GPS-NAS
Usage of the Internet is growing in Europe, with Nordic countries surpassing the US benchmark. With 25% of the EU’s population being an interactive user, it is making headway to becoming a mass market service, but not quite. This is because a socio-demographic feature between Internet users is displaying considerable divides, especially across age, income, and education. In Bulgaria 5% of population are interactive buyers, while this is true for 6% of NAS population. Buyers tend to display a more interactive use on the PC, suggesting a more sophisticated and pioneer Internet users procure on-line. Even so, occasional users are representing an increasing portion of e-commerce users, especially in those countries with increasing on-line tenure.
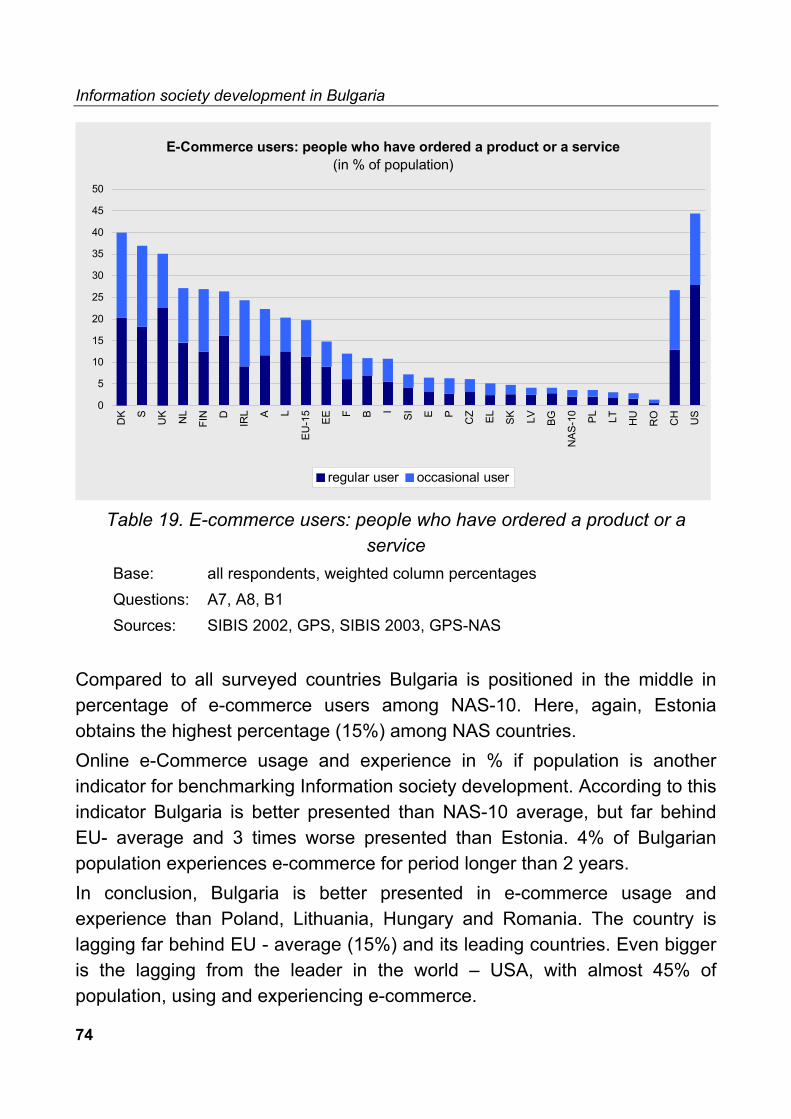
Information society development in Bulgaria
74
E-Commerce users: people who have ordered a product or a service(in % of population)
0
5
10
15
20
25
30
35
40
45
50
DK S
UK NL
FIN D
IRL A L
EU-1
5
EE
F B I SI E P CZ EL SK LV BG
NAS
-10 PL LT HU
RO CH US
regular user occasional user
Table 19. E-commerce users: people who have ordered a product or a service
Base: all respondents, weighted column percentages Questions: A7, A8, B1 Sources: SIBIS 2002, GPS, SIBIS 2003, GPS-NAS
Compared to all surveyed countries Bulgaria is positioned in the middle in percentage of e-commerce users among NAS-10. Here, again, Estonia obtains the highest percentage (15%) among NAS countries. Online e-Commerce usage and experience in % if population is another indicator for benchmarking Information society development. According to this indicator Bulgaria is better presented than NAS-10 average, but far behind EU- average and 3 times worse presented than Estonia. 4% of Bulgarian population experiences e-commerce for period longer than 2 years. In conclusion, Bulgaria is better presented in e-commerce usage and experience than Poland, Lithuania, Hungary and Romania. The country is lagging far behind EU - average (15%) and its leading countries. Even bigger is the lagging from the leader in the world – USA, with almost 45% of population, using and experiencing e-commerce.

Information society development in Bulgaria
75
Online E-Commerce usage and experience(in % of population)
05
101520253035404550
DK S
UK NL
FIN D
IRL A L
EU-1
5
EE
F B I SI E P CZ EL SK LV BG PL
NAS
-10 LT HU
RO CH US
2 years + 1 year - 2 years 6-12 months < 6 months don't know
Table 20. Online e-Commerce usage and experience Bases: all respondents, weighted column percentages Questions: B1, A10 Sources: SIBIS 2002, GPS, SIBIS 2003, GPS-NAS

Information society development in Bulgaria
76
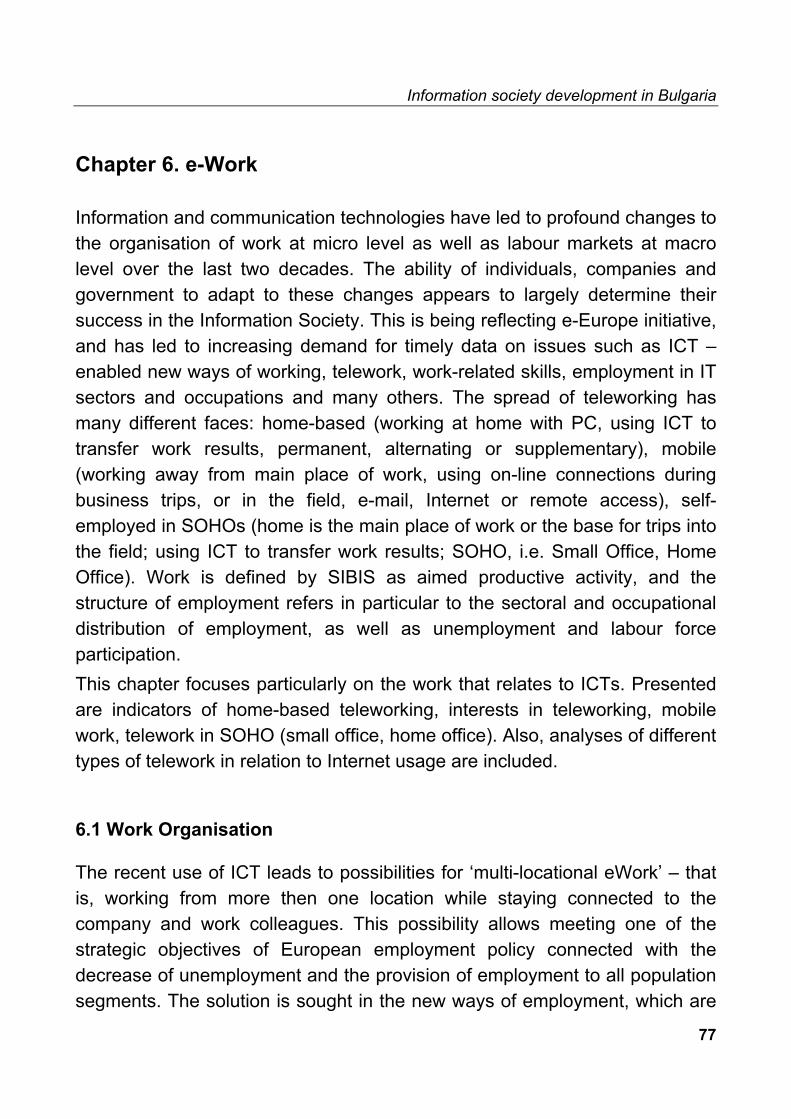
Information society development in Bulgaria
77
Chapter 6. e-Work Information and communication technologies have led to profound changes to the organisation of work at micro level as well as labour markets at macro level over the last two decades. The ability of individuals, companies and government to adapt to these changes appears to largely determine their success in the Information Society. This is being reflecting e-Europe initiative, and has led to increasing demand for timely data on issues such as ICT – enabled new ways of working, telework, work-related skills, employment in IT sectors and occupations and many others. The spread of teleworking has many different faces: home-based (working at home with PC, using ICT to transfer work results, permanent, alternating or supplementary), mobile (working away from main place of work, using on-line connections during business trips, or in the field, e-mail, Internet or remote access), self-employed in SOHOs (home is the main place of work or the base for trips into the field; using ICT to transfer work results; SOHO, i.e. Small Office, Home Office). Work is defined by SIBIS as aimed productive activity, and the structure of employment refers in particular to the sectoral and occupational distribution of employment, as well as unemployment and labour force participation. This chapter focuses particularly on the work that relates to ICTs. Presented are indicators of home-based teleworking, interests in teleworking, mobile work, telework in SOHO (small office, home office). Also, analyses of different types of telework in relation to Internet usage are included.
6.1 Work Organisation
The recent use of ICT leads to possibilities for ‘multi-locational eWork’ – that is, working from more then one location while staying connected to the company and work colleagues. This possibility allows meeting one of the strategic objectives of European employment policy connected with the decrease of unemployment and the provision of employment to all population segments. The solution is sought in the new ways of employment, which are

Information society development in Bulgaria
78
in close connection with the shortening of working time and the implementation of ICTs. Telework is one of them. Although the measuring of telework in complex, significant developments in measuring methodology have been made, accounting also the SIBIS surveys. Telework (or teleworking) has become increasingly popular in the end of 90’s, particularly in EU countries.
Home-based teleworking(% of employed population)
0
5
10
15
20
25
NL S
FIN EE DK
UK LT B F
EU-1
5 EL A D SI BG LV PL L
NAS
-10 I
HU
IRL P SK RO E CZ
CH US
Teleworking >= 1 full day Teleworking supplementary
Table 21. Home-based teleworking Base: all persons employed, weighted column percentages Questions: E1, E4 Sources: SIBIS 2002, GPS, SIBIS 2003, GPS-NAS
By the time of SIBIS survey in the Netherlands there is 9% of employed population regularly teleworking (persons who telework 1 day or more in a typical week). In Bulgaria there is 1.4% of regular teleworkers among employed population, which is below EU average (2%), but close to the EU countries such as Germany and Austria. Overall, there is 4% of employed population, teleworking from home in Bulgaria (EU-15 7.3%).

Information society development in Bulgaria
79
Home-based teleworking (in % of employed population) and Internet usage (in % of population)
A
CZ
D
DK
EL
FIN
HU
IRL
LLVNAS-10
NL
PL
S
SI
UK
B
BG
E
EE
EU-15F
I
LT
PRO SK0
5
10
15
20
25
0 10 20 30 40 50 60 70 80 90Internet usage (%)
hom
e-ba
sed
tele
wor
king
(in
% o
f em
ploy
ed
popu
latio
n)
Table 22. Home-based teleworking and Internet usage
Base: all persons employed resp. all respondents, weighted column percentages Questions: A7, A8, E4 Sources: SIBIS 2002, GPS, SIBIS 2003, GPS-NAS
Again, there is a clear connection between Internet usage and the use of home-based telework (See: Table 22.). Countries with high individual Internet penetration have larger percentage of home-based teleworkers. Somewhat steeper increase of home-based teleworkers is found in countries with 60%+ Internet users. Bulgaria is better performed in Internet usage than Poland, Romania and Hungary. It is better performed in home-based teleworking than Romania, Hungary, Slovakia, Portugal, Lithuania, Czech Republic, Spain, and NAS-10 average.

Information society development in Bulgaria
80
Interest in telework - incl. current teleworkers(in % of employed population)
0
10
20
30
40
50
60
70
80
90
100
DK B SK D
FIN SI L
NL
BG EE A I
IRL
CZ S
EU-1
5
RO UK
NAS
-10 LV E
HU LT PL F EL P
CH US
interested in at least one type of telework not interested in any type don't know
Table 23. Interest in telework – incl. current teleworkers Base: all persons employed, weighted column percentages Questions: E8 Sources: SIBIS 2002, GPS, SIBIS 2003, GPS-NAS
As the results of the General Population Survey show, in January 2003 the interest in telework, including current teleworkers in % of employed population, is high in Bulgaria (See: Table 23.). It is higher then EU-15 and NAS-10. This interest could be explained with relatively high share of ICT specialists and traditions in good quality of ICT education in higher schools in the country.37 This state of the art is not directly connected with the ICT skills requirements for jobs in the companies in the country, as the feasibility of teleworking is estimated as less then 10%. In comparison with other countries – the feasibility of teleworking in NAS – 10 is almost 15% and for EU-15 – more then 30%. The most important effect of telework seems to be making workers more effective by granting them greater flexibility in how to organise their work. Home-based teleworking in % of employed population is relatively high in 37DG Enterprise. Innovation policy profile. Bulgaria. March, 2003, www.cordis.lu

Information society development in Bulgaria
81
Bulgaria (higher then in NAS- 10). The full day teleworking at home is almost the same as the supplementary teleworking at home, which is something specific for the country, comparatively to all other European countries, where the supplementary teleworking at home is predominant. The home becomes a touchdown office, which is equipped for giving whenever needed to on-line access to company resources.
Feasibility of teleworking (in % of employed population) and Internet usage (in % of population)
A
BGCZ
D
DK
EELF
FIN
HU
I
IRLL
NL
PL
RO
S
SI
UKB
EE
EU-15
LT
LV
NAS-10P
SK
0
5
10
15
20
25
30
35
40
45
0 10 20 30 40 50 60 70 80 90Internet usage (%)
feas
ibilit
y of
tele
wor
king
(in
% o
f em
ploy
ed
popu
latio
n)
Table 24. Feasibility of teleworking and Internet usage
Bases: all persons employed reps. all respondents, weighted column percentages Questions: A7, A8, E9a Sources: SIBIS 2002, GPS, SIBIS 2003, GPS-NAS
The feasibility of teleworking depends on the access and usage of basic ICTs (PC, Internet access at home) and ICT skills, so the distribution of countries correlates with the individual Internet penetration – with the higher penetration the feasibility of teleworking also increases. Typically, Bulgaria is positioned in the lower level, with 10% of employed population feasible for teleworking (EU-15 32%). The tele-cooperation with external contacts in Bulgaria is practiced by 15.37% of all persons employed (which is almost the same as NAS – 10 average – 15.83%).

Information society development in Bulgaria
82
Mobile teleworking (in % of employed population) and PC usage (in % of population)
D
DK
E
EL
F
I
IRL
PRO
SI
A
B
BG
CZ
EEEU-15
FIN
HU
L
LV
NAS-9
NL
PL
S
0
1
2
3
4
5
6
7
0 10 20 30 40 50 60 70 80PC usage in last 4 weeks (%)
mob
ile te
lew
orki
ng (i
n %
of e
mpl
oyed
po
pula
tion)
Table 25. Mobile teleworking and PC usage
Bases: all persons employed reps. all respondents, weighted column percentages Questions: A1, F1 Sources: SIBIS 2002, GPS, SIBIS 2003, GPS-NAS
In general, the percentage of mobile teleworkers38 is low (See: table 25). The correlation between PC usage and mobile telework is observed, though it is not as obvious as the correlation between the feasibility and Internet usage. The largest percentage of mobile teleworkers is obtained in Finland (6%), while in Bulgaria 1% of employed population use it, making the country one of the worst performed in this comparison. The EU-15 average percentage of mobile teleworkers is 4%.
38 Workers who spent any of their working time away from home and from main place of work, e.g. on business trips, in the field, travelling or on customer’s premises
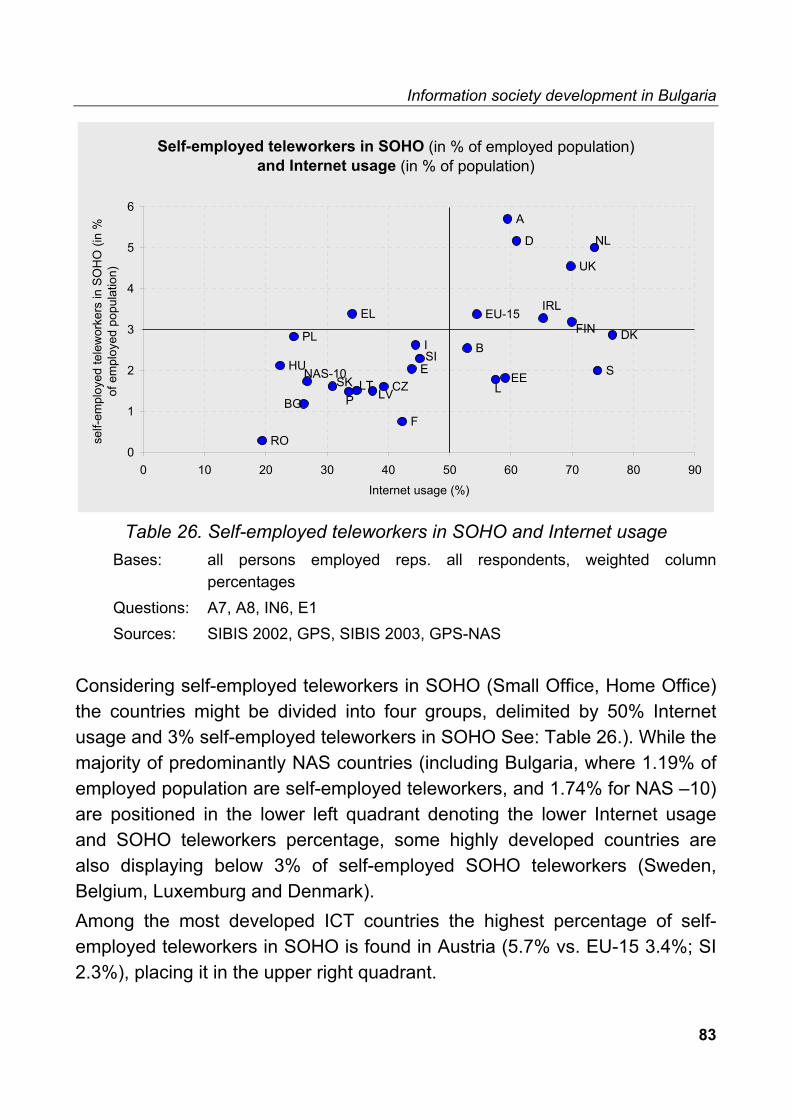
Information society development in Bulgaria
83
Self-employed teleworkers in SOHO (in % of employed population) and Internet usage (in % of population)
A
B
CZ
D
DK
E
EL EU-15
F
HUI
PL
RO
S
UK
BG
EE
FIN
IRL
LLTLV
NAS-10
NL
P
SI
SK
0
1
2
3
4
5
6
0 10 20 30 40 50 60 70 80 90Internet usage (%)
self-
empl
oyed
tele
wor
kers
in S
OH
O (i
n %
of
em
ploy
ed p
opul
atio
n)
Table 26. Self-employed teleworkers in SOHO and Internet usage
Bases: all persons employed reps. all respondents, weighted column percentages Questions: A7, A8, IN6, E1 Sources: SIBIS 2002, GPS, SIBIS 2003, GPS-NAS
Considering self-employed teleworkers in SOHO (Small Office, Home Office) the countries might be divided into four groups, delimited by 50% Internet usage and 3% self-employed teleworkers in SOHO See: Table 26.). While the majority of predominantly NAS countries (including Bulgaria, where 1.19% of employed population are self-employed teleworkers, and 1.74% for NAS –10) are positioned in the lower left quadrant denoting the lower Internet usage and SOHO teleworkers percentage, some highly developed countries are also displaying below 3% of self-employed SOHO teleworkers (Sweden, Belgium, Luxemburg and Denmark). Among the most developed ICT countries the highest percentage of self-employed teleworkers in SOHO is found in Austria (5.7% vs. EU-15 3.4%; SI 2.3%), placing it in the upper right quadrant.

Information society development in Bulgaria
84
6.2 Structure and Outcomes of Employment
Information and communication technologies have played a significant role in forming a new structure of the employment. The majour tendencies are described by the post-Fordist model, influenced by ICT as Kondratiev type base technology. Apart from them there are some specifics of using this model for analysing structure and outcome of employment in economies, like Bulgarian one. They are connected with following characteristics: � traditions in ICT education and production; � small-scaled and very opened economy.
These specifics define higher supply of skilled and educated people, than those of the demand in the country. The opportunity to work abroad has allowed these specialists to find jobs in other countries in Europe, mostly Germany and last years – predominantly by USA, where the demand is higher, than the supply. The structure of employment, demanding ICT education and skills in the country depends on a large extend on demand of nationally based hi-tech companies from EU and other advanced regions in addition to the structure of supply, developed by the structure of education. The recent state-of the-art has shown that the demand of nationally based foreign hi-tech companies, performed in the country, is not sufficient according to the supply of ICT specialists. Here we may conclude that approximately worse presentation of branches of international hi-tech companies in the country has negative impact on the e-work situation. This conclusion is confirmed by another indicator for e-work benchmarking, which describes work situation. This indicator concerns possibility to adapt starting and finishing times to personal preferences in % of employed population, excluding self-employed. Bulgarians are among those, which are less satisfied with work situation (See: Table 27.). Improvement of the performance of e-work in the country is strongly connected with the integration of the efforts to locate branches of higher number of advanced European and world companies in Bulgaria.

Information society development in Bulgaria
85
Work situation: adaptation to starrting & finishing times to personal preferences
(in % of employed population excl. self-employed)
0
10
20
30
40
50
60
70
80
90
100
NL D B I
EU-1
5 L
FIN A UK
DK S
IRL F EL E P
RO SI EE
NAS
-10
CZ LT PL LV BG SK HU
CH
US
strongly agree somewhat agree disagree don't know
Table 27. Work situation: can adapt starting and finishing times to personal
preferences (in % of employed population, excluding self-employed) Bases: all persons employed excluding self-employed, weighted column percentages Questions: H2e Sources: SIBIS 2002, GPS, SIBIS 2003, GPS-NAS

Information society development in Bulgaria
86

Information society development in Bulgaria
87
Chapter 7. e-Government
The presence of e-Government in Bulgaria is growing as on-line activities become more wide spread. Generally, e-government designates any transaction that involves the government and that is carried out, even partially, using electronic means. E-government plays important function in mediating government actions ant its role will continue to grow as communication technologies become more wide spread. Already, communications technologies change the way that government operates by facilitating information dissemination, communications and transactions. Government operates on several different levels: Government to citizen (G2C) Government to business (G2B), and Government to government (G2G). This chapter focuses firstly, on policy aspects and then – on analysis of the GPS survey results.
7.1 Policy aspects
The project for the National Strategy for e-government has been announced in 2002. But it has to be taken into account that the basis for functioning the e-government in Bulgaria already exists: the Law on electronic signature and the Law on protection of personal data are adopted; it is allowed to ask for public information electronically in the Law on access to public information; it is possible to use e-document as book-keeping document according to the Law on book-keeping; it is possible to declare electronically the required by the Law on duties and taxes, etc. The realisation of e-government depends on two complementary aspects. First, the vision of e-government dictates the types of services that must be available on-line and the level of sophistication they must achieve. Second, the adoption of e-government by its intended users requires careful preparation, although this is not always possible, as the development of e-government may seem to just happen at times.

Information society development in Bulgaria
88
The main success in e-government introduction in Bulgaria is G2C and G2B.39 Over 90% of central government agencies and public institutions have websites. They are of about 150 in 2002. In the beginning of 2002 on average40 20% of computers in public administration have access to the Internet. More concretely 80-100% of computers in regional administrations, 70-80% of ministries, and less then 20% of local administrations are connected to the Internet. Most government websites are not yet interactive and do not allow for e-payments or electronic submissions of forms. According to ‘Global e-government survey 2001’, World Market Research Centre, Bulgaria occupies 40th position in 169 countries. This is a good staring position for implementation of e-government strategy in the country as an integrated part of e-Europe 2005. According to the action plan proposed more then ½ of the population 18+ to use e-government services in 5 years period. Several times the costs and the time needed for e-government services have to be reduced.
7.2 GPS indicators for e-government
This SIBIS GPS module focuses on one of the most exposed topic of Information Society. Due to its importance we included all measured indicators according to preference, availability, and usage of e-government. Included are following indicators: ‘tax declaration’, ‘use of job search services’, ‘requests for personal documents’, ‘car registration’, ‘declaration to the police’, ‘search for books in public libraries’, and ‘announcement of the change of address’. Generally, e-government designates any transaction that involves the government and that is carried out, even partially, using electronic means. E-government plays an important function in mediating government actions and its role will continue to grow as communications technologies become more widespread. Already, communications technologies change the way that government operates by facilitating information dissemination, communications and transactions.
39 Information society, 2002, ½, p. 03 40 See: Bulgaria. E-Readiness Assessment 2001, www.arc.online.bg

Information society development in Bulgaria
89
The procedure for collecting data for e-government indicator tax declaration / filling the income tax return is as follow: citizens are asked whether they prefer to use the Internet to file their tax declaration; those who prefer to use the Internet for this service are asked whether this service is available on-line in the region where they live (as far as they know); if they believe that the service is available online, they are asked if they have ever tried to use this on-line tax declaration service. The same logic is used on other e-government indicators. In general, citizens are not very willing to use Internet, but for those citizens who prefer to use the Internet the awareness of availability and usage of the on-line services are relatively high. According to the data from Table 28 Bulgarians are not very interested in on-line tax declaration. There is no difference between EU and NAS average.
Tax declaration/ filling the income tax return(in % of regular/all internet users)
0
10
20
30
40
50
60
70
80
90
100
DK
RO EL NL
EE SI
FIN A E P B L S
EU-1
5
NAS
-10
HU I
UK LV F SK D CZ PL IRL
BG LT CH US
would prefer to use the Internet ...and is aware of possibility ...and tried using it
Table 28. Tax declaration/filling the income tax return Bases: EU-15 countries: regular Internet users, NAS-10 countries: all Internet users, weighted column percentages Question: K1a Sources: SIBIS 2002, GPS, SIBIS 2003, GPS-NAS
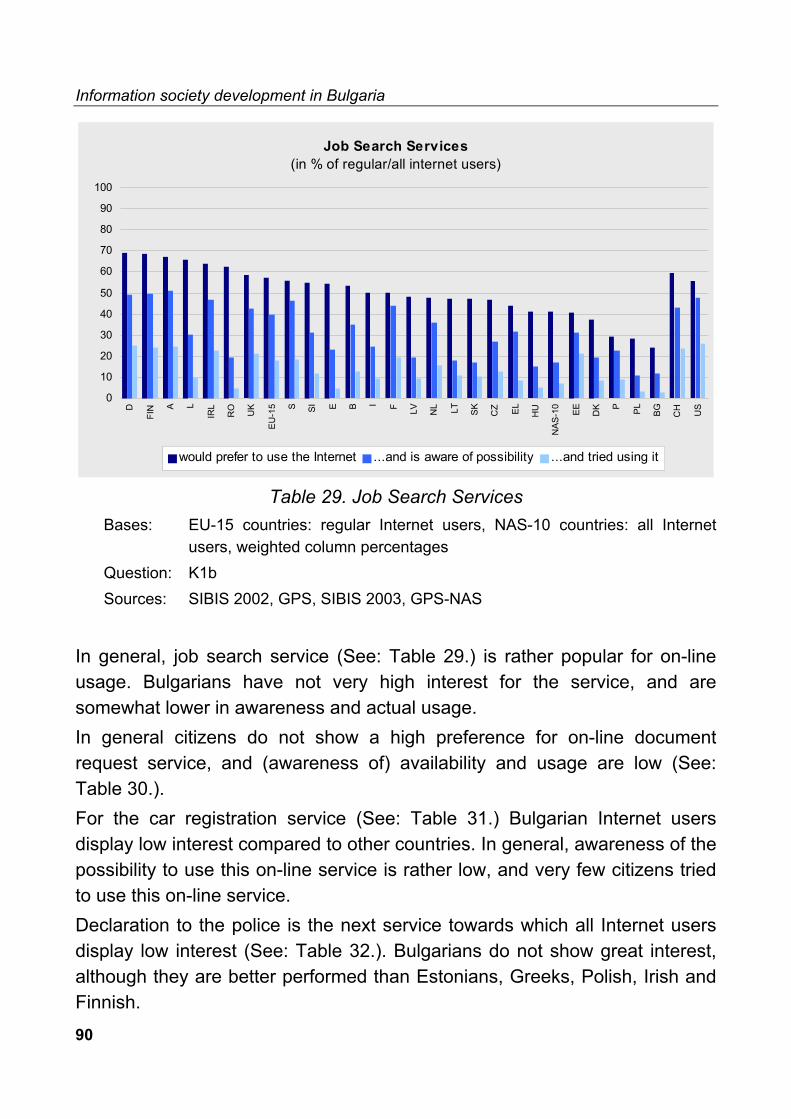
Information society development in Bulgaria
90
Job Search Services(in % of regular/all internet users)
0
10
20
30
40
50
60
70
80
90
100
D
FIN A L
IRL
RO UK
EU-1
5 S SI E B I F LV NL LT SK CZ EL HU
NAS
-10
EE DK P PL BG CH US
would prefer to use the Internet ...and is aware of possibility ...and tried using it
Table 29. Job Search Services Bases: EU-15 countries: regular Internet users, NAS-10 countries: all Internet users, weighted column percentages Question: K1b Sources: SIBIS 2002, GPS, SIBIS 2003, GPS-NAS
In general, job search service (See: Table 29.) is rather popular for on-line usage. Bulgarians have not very high interest for the service, and are somewhat lower in awareness and actual usage. In general citizens do not show a high preference for on-line document request service, and (awareness of) availability and usage are low (See: Table 30.). For the car registration service (See: Table 31.) Bulgarian Internet users display low interest compared to other countries. In general, awareness of the possibility to use this on-line service is rather low, and very few citizens tried to use this on-line service. Declaration to the police is the next service towards which all Internet users display low interest (See: Table 32.). Bulgarians do not show great interest, although they are better performed than Estonians, Greeks, Polish, Irish and Finnish.

Information society development in Bulgaria
91
Request for passport, drivers license, birth certificates or other documents
(in % of regular/all internet users)
0102030405060708090
100
RO SI I
DK
UK A L E EL S
EU-1
5 B
FIN D
HU F NL
SK
NAS
-10
IRL
CZ PL EE BG LT P LV CH US
would prefer to use the Internet ...and is aware of possibility ...and tried using it
Table 30. Request for passport, drivers license, birth certificates or other documents
Bases: EU-15 countries: regular Internet users, NAS-10 countries: all Internet users, weighted column percentages Question: K1c Sources: SIBIS 2002, GPS, SIBIS 2003, GPS-NAS
Car registration(in % of regular/all internet users)
0102030405060708090
100
RO S
FIN L D DK SI UK A
EU-1
5 B E I
HU SK CZ EL NL
IRL
NAS
-10 F LV LT PL BG
P EE CH US
would prefer to use the Internet ...and is aware of possibility ...and tried using it
Table 31. Car registration Bases:EU-15 countries: regular Internet users, NAS-10 countries: all Internet users, weighted column percentages Question: K1d Sources: SIBIS 2002, GPS, SIBIS 2003, GPS-NAS

Information society development in Bulgaria
92
Declaration to the police(in % of regular/all internet users)
0
10
20
30
40
50
60
70
80
90
100
RO
FIN SI
HU I
SK NL D A CZ E
NA
S-1
0 S LV
EU
-15 L
DK P B
UK LT BG EE PL
EL F
IRL
CH
US
would prefer to use the Internet ...and is aware of possibility ...and tried using it
Table 32. Declaration to the police Bases: EU-15 countries: regular Internet users, NAS-10 countries: all Internet users, weighted column percentages Question: K1e Sources: SIBIS 2002, GPS, SIBIS 2003, GPS-NAS
Searches for books in public libraries(in % of regular/all internet users)
0102030405060708090
100
L D A SI
FIN DK E
EU-1
5
UK I
EL IRL
RO S NL B F
HU CZ P SK LT LV
NAS
-10 PL BG EE CH US
would prefer to use the Internet ...and is aware of possibility ...and tried using it
Table 33. Searches for books in public libraries Bases: EU-15 countries: regular Internet users, NAS-10 countries: all Internet users, weighted column percentages Question: K1f Sources: SIBIS 2002, GPS, SIBIS 2003, GPS-NAS

Information society development in Bulgaria
93
The search for book in public libraries service (See: Table 33.) shows a very high preference for on-line use and a considerable number of citizens who have the possibility to use this service on-line have tried to use it. Bulgaria is on the lower position with regard to the interest, in awareness of this service, as well as in actual usage High interest and awareness (possibility) of the service most likely provides high usage, while the existence of the service alone does not provide the actual usage.
Announcement of change of address(in % of regular/all internet users)
0
10
20
30
40
50
60
70
80
90
100
FIN S
DK A
RO NL D SI L
EU-1
5 I E
HU SK LV UK LT
NAS
-10 B F
CZ
IRL EL PL P EE BG CH US
would prefer to use the Internet ...and is aware of possibility ...and tried using it
Table 34. Announcement of change of address Bases: EU-15 countries: regular Internet users, NAS-10 countries: all Internet users, weighted column percentages Question: K1g Sources: SIBIS 2002, GPS, SIBIS 2003, GPS-NAS
Bulgarian Internet users are also not very much interested in for the announcement of the change of address via Internet in comparison to the EU population (See: Table 34.). The usage of this on-line service is rather low in general, either because people are not aware that this service is available on-line or because it is not available yet.
Information society development in Bulgaria
94
Preferred way of interacting with government services(Average number out of 7 services)
0,0
0,5
1,0
1,5
2,0
2,5
3,0
3,5
4,0
4,5
5,0
RO
FIN SI A L D DK S NL
EU-1
5 I E
UK
HU B EL SK CZ
IRL
NAS
-10 F
LV LT EE P PL BG CH
US
Internet traditional way
Table 35. Preferred way of interacting with government services Bases: EU-15 countries: regular Internet users, NAS-10 countries: all Internet users, weighted column percentages Question: K1 Sources: SIBIS 2002, GPS, SIBIS 2003, GPS-NAS
Many externalities that vary from one EU Member State to the next may influence the preference of respondents for e-government, so differences in the preferred way of interacting with government that are seen across the EU cannot be analysed immediately. Generally, respondents from the northern countries of Europe show a greater preference for interacting with government using Internet than the EU as a whole (See: Table 35.). Together with Finland, Slovenia is the only European country with sizeable Internet penetration where the interest of on line communication with the government surpasses the classical options of communication. Another indicator for benchmarking information society development is % of Internet users, who search health-related information on-line (See: Table 36.). This service is more popular in USA (almost 60% of all Internet users), than in

Information society development in Bulgaria
95
Europe. In last 4 weeks 12% of Bulgarian Internet users searched health-related information, which is two times less then Americans. One of the reasons for this performance would be insufficient health-related information available in Bulgarian language.
Searching for health-related information online(in % of all Internet users)
0
10
20
30
40
50
60
70
IRL L
DK
UK NL
SK D B
EU-1
5 P EE A CZ S
FIN I E
HU
RO
NAS
-10 SI F PL BG LV EL LT CH
US
in last 4 weeks not in last 4 weeks, but in last 12 months
Table 36. Search of health-related information on-line (in % of all Internet users)
Bases: all Internet users, weighted column percentages Questions: A18f
Sources: SIBIS 2002, GPS, SIBIS 2003, GPS-NAS

Information society development in Bulgaria
96

Information society development in Bulgaria
97
Chapter 8. Conclusions
The analysis here confirmed a general lag in Information society development in Bulgaria, and helped to identify some potential for catching-up in the future. The low level of PC penetrations is among the major constraints to faster Internet growth. New computers cannot compensate the depreciation of older machines. Computer access is concentrated in bigger cities and mainly in Sofia. Bulgarian Internet users typically access the virtual space for three main purposes: as a source of information, for entertainment purposes, and for business and education purposes. Financial transaction operations and on-line shopping are still used rarely. The main reasons for this are the reliability of the connection, the low level of awareness of these technologies and the low level of trust in electronic banking (only three of commercial banks – United Bulgarian Bank, First Investment Bank, and Union bank – provide e-services). Internet users in Bulgaria are 267 out of 1000, which number is higher than in Hungary, Poland, and Romania. But the level of Internet usage in Bulgaria is twice lower than the best-performed NAS countries such as Estonia, or Slovenia. In % the Internet users are 26.7% of the population in Bulgaria in January 2003. This level is more then twice higher then a year ago. If the present tendency is preserved, the number of PC users is expected to grow substantially over the next few years due to the wider Internet penetration among young people. The low level of PC penetrations is among the major constraints to faster Internet growth in Bulgaria. New computers cannot compensate the depreciation of older machines. When looking at the GPS survey results in more detail it becomes apparent that the high-bandwith, multi platformideal access environment is still very far away in Bulgaria. Information and communication technologies uptake is still unevenly distributed across various subgroups of population. This statement is supported by the results from the GPS and previous surveys in Bulgaria, which concern the same topic.

Information society development in Bulgaria
98
The well-developed fixed network and high rate of mobile subscribers are a solid precondition for the development of Internet services and wireless applications. According to the GPS results the basic access to telecommunication networks is well performed in Bulgaria in fixed telephones and faxes. But the level of access and usage of mobile phones is approximately low comparatively to the levels of NAS-10. The citizens’ inclusion into IS development (access to and use of Internet) is the main social policy concern of e-society development. Advantage of the country in this respect is the long – term traditions in hi-quality education in ICT, which are a good precondition for developing needed knowledge for citizen’s inclusion into IS. There are 47 Universities in Bulgaria, located in 26 cities and towns. Around 50% of them have computer specialties. Over 6,000 Bulgarian students are currently majoring in Computer Science; another 5,000 have chosen electric engineering, mathematics, physics and biotechnology. Nevertheless in January 2003 the level of participation in lifelong learning in % of labour force is 5.06%, which is higher than Romania only (3.51%). In comparison the leaders (Finland and the US) have levels of over 37%. The participation in any learning during the four weeks previous to the survey, in % of labour force is the lowest in Europe – 7.56%, and far away from the leader – Finland with 59.86%. The level of self-directed learning in % of labour force in the lowest among countries – 5.51%, which is about 8 -9 times less then leaders such as Germany - 51.73%, Austria – 47.6%, and Finland – 44.45%. The total (online and offline) usage of e-Learning as a percentage of labour force is lowest among countries – 3.17%, included in SIBIS+ General Population Survey. But the level of on-line usage of e-learning in Bulgaria is higher then in Greece and Poland. This picture is corresponding to the level of penetration of computers at schools and training provided by companies in Bulgaria. A lack of necessary financial resources is the main reason not to be launched plans for education according to 45.7% of managers in the companies. This is the reason for the level of e-economy and e-commerce implementation in Bulgaria, in spite of the situation has sharply changed for the last year (2002). According to the Information Society Index, which rates 55 countries,

Information society development in Bulgaria
99
comprising 96% of World GDP and 99% of World’s expenditure, Bulgaria falls in the Sprinter Group (where investments surge and retreat on the whims of social, political, and economic change), together with countries like the Czech Republic, Poland and Hungary. Bulgaria has the advantage of established traditions and experience in the IT sector and well-structured private companies, which cover almost the whole spectrum of IT applications. According to research of the IDG group, the yearly growth of the IT sector in Bulgaria is about 35%. IT spending for 2001 is about USD 188.4 million and estimated total revenues will be around USD 270 million. There are more than one thousand IT small and medium sized enterprises in Bulgaria now .The software companies cover almost the whole spectrum of software applications from Enterprise Resource Planning to CAD/CAM/CAE. The constant and stable penetration of PCs and especially of mobile telephones (around 1,5M subscribers of the existing three mobile operators in 2001) in Bulgaria is a huge stimulating factor for such development. The fast growing e-economy and e-commerce and recent use of ICT leads to possibilities for ‘multi-locational e-Work’ – that is, working from more then one location while staying connected to the company and work colleagues. In January 2003 the interest in telework –current teleworkers in % of employed population is high in Bulgaria. It is higher than EU-15 average and NAS-10 average. This interest could be explained with relatively high share of ICT specialists and traditions in good quality of ICT education in higher schools in the country.41 The higher interest in telework in Bulgaria is not directly connected with the ICT skills requirements for jobs in national companies. The feasibility of teleworking is estimated as less than 10%. In comparison with other countries – the feasibility of teleworking in NAS – 10 is almost 15% and for EU-15 – more than 30%. Another characteristic of IS is e-Government development. According to ‘Global e-Government survey 2001’, World Market Research Centre, Bulgaria occupies 40th position in 169 countries. This is a good staring position for implementation of e-government strategy in the country as an integrated part
41 Chobanova, R., Innovation policy profile. Bulgaria. DG Enterprise. March, 2003, www.cordis.lu

Information society development in Bulgaria
100
of e-Europe 2005. According to the action plan proposed more than ½ of the population 18+ to use e-government services in 5 years period. Several times the costs and the time needed for e-government services have to be reduced. The main success in e-government introduction in Bulgaria is Government to Citizen (G2C) and Government to Business (G2B).42 Over 90% of central government agencies and public institutions have websites. The number of websites is of about 150 in 2002. In the beginning of 2002 on average43 20% of computers in public administration have access to the Internet. There is a differentiation in levels of access to computers with Internet connection between central and local Government administration bodies. More concretely 80-100% of computers in regional administrations, 70-80% of ministries, and less then 20% of local administrations are connected to the Internet. Most government websites are not yet interactive and do not allow for e-payments or electronic submissions of forms. Nevertheless the GPS results have said low level of preference, availability, and usage of e-government in the country. More concretely this conclusion concern tax declaration, requests for personal documents, car registration, declaration to the police, search for books in public libraries, and announcement of the change of address. In general, citizens are not very willing to use Internet, but for those citizens who prefer to use the Internet the awareness of availability and usage of the on-line services are relatively high. Only job search service is rather popular for on-line usage.
42 Information society, 2002, 1-2, p. 03 43 See: Bulgaria. E-Readiness Assessment 2001, www.arc.online.bg

Information society development in Bulgaria
101
The SWOT of Information society performance in Bulgaria: The country strengths for Information society development: ● Traditionally high interest for ICT services and developments ● Level of supply of educated and skilled personnel ● Developed competencies of small and medium sized IT companies
covering almost the whole spectrum of software applications from Enterprise resource Planning to CAD/CAM/CAE
The country weaknesses for Information society development: ● The low level of PC penetrations ● Low level of on-line preference of interacting with government services ● Low level of e-learning ● Low level of searching of heath-related information online ● Disintegrated governmental web presence ● Limited offer of G2C services ● Low level of mobile phone penetration
The opportunities for Information society development: ● Integration into EU structures ● National strategy for IS development ● Institutional and human potential ● 35% yearly growth of IT sector in the country ● Pace of the ICT penetration, and more specifically – Internet one
among young people ● Ability of the business sector to develop not only design work, but also
maintenance and testing fully integrated systems and solutions. The threats for Information society development: ● Insufficient demand for ICT sector products and services (in
comparison with their supply).

Information society development in Bulgaria
102

Information society development in Bulgaria
103
PART II.
METHODOLOGICAL ASPECTS OF BENCHMARKING INFORMATION
SOCIETY

Information society development in Bulgaria
104

Information society development in Bulgaria
105
The rapidly changing nature of modern societies needs to enable the benchmarking of progress through statistical indicators. The study is taking up the challenge of presenting newly developed innovative information society indicators, tested and piloted in a representative survey held in all EU Member States, Switzerland and the United States in 2002 and in ten new associated states in 2003. This part focuses on applied methodologies of GPS 2002 and 2003, as well on overview of indicators for Information society development by topics and domains. Each topic is presented as a policy concern and as statistics. The later includes indicators overview and indicators description (definition, sources, country coverage, time series available, e-Europe relevance, future value, and links to other indicators). Notes, sources and time series where available, concern Bulgarian content. The target audience is mainly organisations and persons who are interested in information society indicators development.
Chapter 9. Methodology
This chapter contains 3 parts, which concern methodology of GPS 2002 survey, methodology of GPS 2003 NAS survey, and indicators for Information society benchmarking.
9.1. Methodology of the GPS 2002 survey
The survey was conducted in April-May 2002 (interviews were carried out between 4th April and 18th May) in all 15 EU Member States plus Switzerland and the US, using computer-aided telephone interviews. The survey was co-ordinated and executed by INRA Deutschland GmbH, Mölln. The population for this study is all persons aged 15 and over living in private households in the respective countries and speaking the respective national language(s). 11,832 interviews were successfully completed. The average interview length per country varied between 10 (Greece) and 20 minutes (Sweden).

Information society development in Bulgaria
106
Sampling:
Target households were selected at random in all countries, either by random dialling techniques such as permutation of final digits or by drawing a random sample from official sources. Mostly a geographical stratification was implemented beforehand. For the selection of the target person common random keys were applied in all countries except for the UK where quota was used. In two cases (Spain, the US), screening had to be directed towards male respondents towards the very end of the field in order to gain gender representativeness.
There were three adjustments necessary in order to provide reliable data:
Transformation from household sample to person sample. As only one person per household is interviewed, the described sample procedure provides a household sample, i.e. each household of the base population has the same likelihood of being in the sample but not each person. With the weighting stage of the transformation the equal likelihood of households is replaced mathematically by the equal likelihood of the individuals. To this end, each data set is multiplied by the amount of people in the household aged 15 or over. This number is subsequently divided by the average household size in order to obtain the actual case number. Adjustment of unweighted sample structure to the official statistic.
Because random samples are not evenly distributed across all population strata, the distributions of unweighted samples regularly and systematically deviate from the population distribution from official statistics. Through the mathematical weighting the sample distribution was adjusted to the official statistics. The national weighting factor, which results from the iterative weighting, was included in the data material. Adjustment of weighted sample structure to the EU-15 Member States
population. This weighting factor was necessary to calculate total figures according to the whole population of the European Union Member States. Furthermore it is useful to compare the EU with the US. Population sizes of each Member
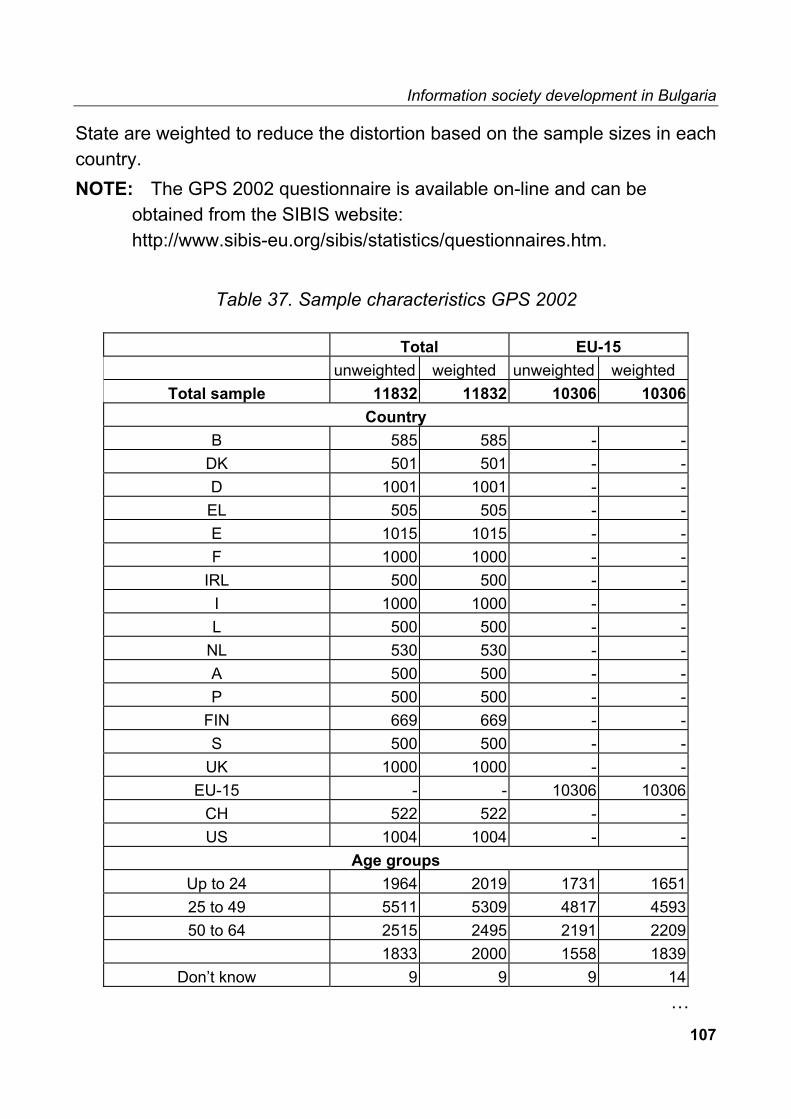
Information society development in Bulgaria
107
State are weighted to reduce the distortion based on the sample sizes in each country. NOTE: The GPS 2002 questionnaire is available on-line and can be obtained from the SIBIS website: http://www.sibis-eu.org/sibis/statistics/questionnaires.htm.
Table 37. Sample characteristics GPS 2002
Total EU-15 unweighted weighted unweighted weighted
Total sample 11832 11832 10306 10306Country
B 585 585 - -DK 501 501 - -D 1001 1001 - -EL 505 505 - -E 1015 1015 - -F 1000 1000 - -
IRL 500 500 - -I 1000 1000 - -L 500 500 - -
NL 530 530 - -A 500 500 - -P 500 500 - -
FIN 669 669 - -S 500 500 - -
UK 1000 1000 - -EU-15 - - 10306 10306
CH 522 522 - -US 1004 1004 - -
Age groups Up to 24 1964 2019 1731 165125 to 49 5511 5309 4817 459350 to 64 2515 2495 2191 2209
1833 2000 1558 1839Don’t know 9 9 9 14
…

Information society development in Bulgaria
108
… Table 37. Sample characteristics GPS 2002 Terminal education age
Up to 13 695 717 693 72814 715 742 701 881
15 to16 1794 1750 1641 182017 to 20 3587 3515 2997 2937
21 and more 3266 3275 2743 2495Still studying 1687 1751 1463 1372Don’t know 88 81 77 73
Internet usage Total Internet use 6905 6908 5828 5610
Regular use (last 4 weeks) 5944 5948 4985 4781Occasional use (last 12
months) 961 960 843 830
Non Internet use 5550 5643 4655 4548Employment status
Paid employment 4966 4853 4291 4133Self-employed 935 941 809 799
Unemployed/ temporarily not working 701 683 621 631
In education 1687 1751 1463 1372Retired or other not working 3441 3510 3034 3292
Don’t know 102 94 88 80Longstanding illness
Existence of health limiting conditions 1898 1885 1645 1610
No existence of health limiting conditions 9868 9858 8607 8606
Don’t know 66 90 54 90Mobile phone usage
Mobile phone owner 8202 8192 7301 7121Teleworking
Home based teleworkers 217 233 168 172e-Health usage
Searched for health-related info online 2712 2728 2149 2041
Searched and found health-related info online 2578 2592 2038 1916

Information society development in Bulgaria
109
9.2. Methodology of the GPS-NAS 2003 survey
The survey was conducted in January 2003 (interviews were carried out between 1st January and 31st January) in the 10 Newly Associated States Bulgaria, Czech Republic, Estonia, Hungary, Lithuania, Latvia, Poland, Romania, Slovenia and Slovakia, using personal aided personal interviews (PAPI). The survey was co-ordinated and executed by NFO AISA Czech Republic, Prague. The population for this study is all persons aged 15 and over living in private households in the respective countries and speaking the respective national language(s). 10,379 interviews were successfully completed. The average interview length per country varied between 20 (Romania) and 40 minutes (Lithuania). Sampling: Target households were selected at random in all countries, either by multistage stratified random-route sampling or by drawing a random sample from official sources. Mostly a geographical stratification was implemented beforehand. For the selection of the target person common random keys were applied in all countries, i.e. the next birthday method and the Kish method, except for Bulgaria where quota was used. There were three adjustments necessary in order to provide reliable data: Transformation from household sample to person sample in Poland and
Slovenia. As only one person per household is interviewed, the described sample procedure provides a household sample, i.e. each household of the base population has the same likelihood of being in the sample but not each person. With the weighting stage of the transformation the equal likelihood of households is replaced mathematically by the equal likelihood of the individuals. To this end, each data set is multiplied by the amount of people in the household aged 15 or over. This number is subsequently divided by the

Information society development in Bulgaria
110
average household size in order to obtain the actual case number. Adjustment of unweighted sample structure to the official statistic.
Because random samples are not evenly distributed across all population strata, the distribution of unweighted samples regularly and systematically deviates from the population distribution from official statistics. Through the mathematical weighting the sample distribution was adjusted to the official statistics. The national weighting factor, which results from the iterative weighting, was included in the data material. Adjustment of weighted sample structure to the NAS-10 countries
population. This weighting factor was necessary to calculate total figures according to the whole population of the Newly Associated States. Furthermore it is useful to compare the NAS with the EU. Population sizes of each of the ten states are weighted to reduce the distortion based on the sample sizes in each country. NOTE: The GPS-NAS 2003 questionnaire is available on-line and can be obtained from the SIBIS website: http://www.sibis-eu.org/sibis/statistics/questionnaires.htm.
Table 38. Sample characteristics GPS-NAS 2003
Total NAS-10 unweighted Weighted weighted
Total sample 10379 10371 10379Country
BG 104 1008 -CZ 1096 1096 -EE 1001 1001 -HU 1000 1000 -LT 1017 1017 -LV 1006 994 -PL 1000 1000 -
…
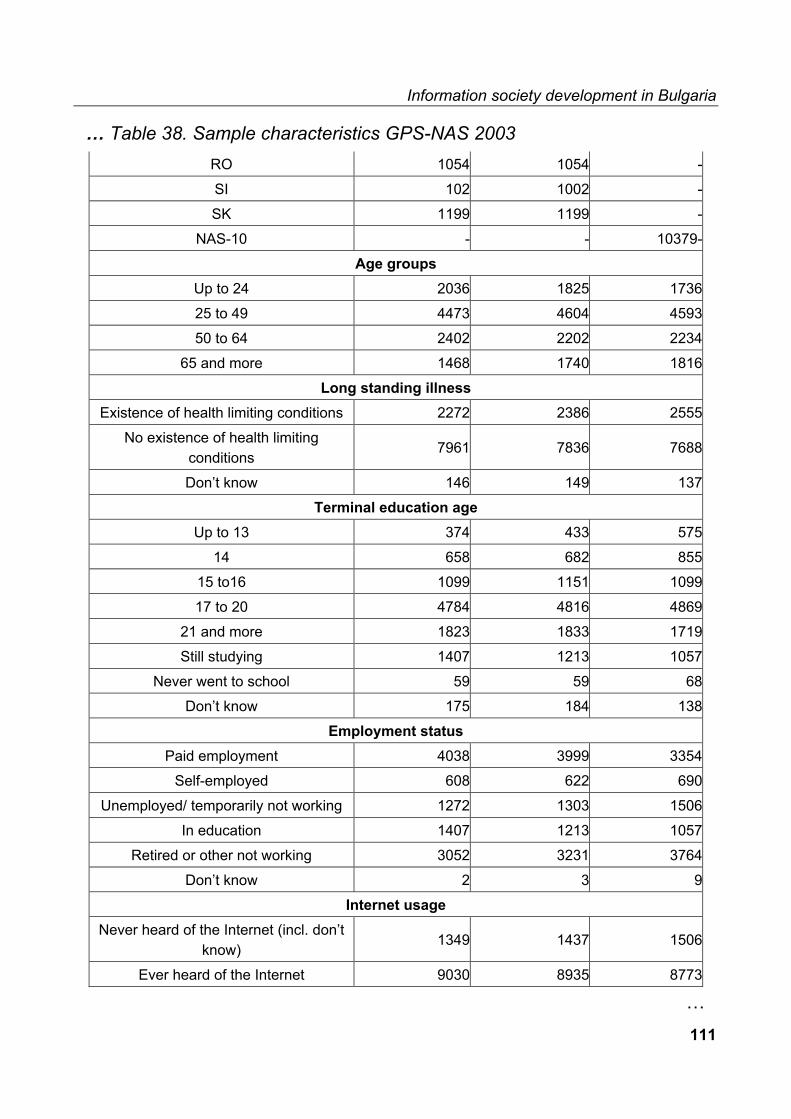
Information society development in Bulgaria
111
… Table 38. Sample characteristics GPS-NAS 2003 RO 1054 1054 -SI 102 1002 -SK 1199 1199 -
NAS-10 - - 10379-Age groups
Up to 24 2036 1825 173625 to 49 4473 4604 459350 to 64 2402 2202 2234
65 and more 1468 1740 1816Long standing illness
Existence of health limiting conditions 2272 2386 2555No existence of health limiting
conditions 7961 7836 7688
Don’t know 146 149 137Terminal education age
Up to 13 374 433 57514 658 682 855
15 to16 1099 1151 109917 to 20 4784 4816 4869
21 and more 1823 1833 1719Still studying 1407 1213 1057
Never went to school 59 59 68Don’t know 175 184 138
Employment status Paid employment 4038 3999 3354
Self-employed 608 622 690Unemployed/ temporarily not working 1272 1303 1506
In education 1407 1213 1057Retired or other not working 3052 3231 3764
Don’t know 2 3 9Internet usage
Never heard of the Internet (incl. don’t know)
1349 1437 1506
Ever heard of the Internet 9030 8935 8773
…

Information society development in Bulgaria
112
… Table 38. Sample characteristics GPS-NAS 2003 Total Internet use 3700 3507 2773
Regular use (last 4 weeks) 3025 2852 2215Occasional use (last 12 months) 675 655 559
Non Internet use 6679 6864 7606Mobile phone usage
Mobile phone owner 5763 5635 4534Telework
Home based teleworkers 162 162 120

Information society development in Bulgaria
113
9. 3. Indicators for Information society development
The indicators for information society are developed to serve specific topics of the development and their e-Europe relevance. The information society topics are as follow: - telecommunications and access - education - work / skills/ employment - e-society social inclusion - e-government - e-health. Each information society topic is presented as a policy concern and as an overview of statistics for benchmarking. The later includes indicators overview and indicators description: definition, sources, country coverage, time series available, e-Europe relevance, future value, and links to other indicators. Notes, sources and time series where available, concern Bulgarian content. The number of Indicators by topics and topic’s domains are presented in the table bellow: Table 39. Domains by Information society topics and number of indicators by
topics
N Topics and domains of indicators Total 1. Telecommunications & access 38 Technology Infrastructure Access (choice, quality, cost) Use Market
…

Information society development in Bulgaria
114
… Table 39. Domains by Information society topics and number of indicators by topics
2. Education 51 2A Policy & strategy 2B Economy & infrastructure 2C Indicators in relation to ICT use and access 2D Indicators in relation to competencies 3. Work / Skills / Employment 160 3A Skills 41 3A1 Formal education 3A2 Non-formal learning / education 3A3 Informal learning 3B Work 60 3B1 Work content /applied skills 3B2 Time of work 3B3 Place of work 3B4 Work contract 3C Employment 59 3C1 Benefits from employment 3C2 Level & structure of employment 3C3 Outputs of employment 4 e-society & social inclusion 32 4A1 Identifying the vulnerable – continuity vs. change 4A2 Access to ICT & accessibility 4A3 Rationale for participation in IS 5 E-government 47 6 E-health 22 6A1 System quality 6A2 System usage

Information society development in Bulgaria
115
Chapter 10. Telecommunications and Access
This chapter focuses on policy aspect of development indicators for benchmarking information society topic of Telecommunications and access, their overview and description.
10.1. Policy aspect
The indicators of the information society topic Telecommunications and access are constructed to serve e-Europe policy development.
Table 40. e-Europe topics covered by indicators for Telecommunications and access
e-Europe topic Achievement of significant reduces in Internet access tariffs by reinforcing competition. Adoption of directives for new framework for electronic communications and associated services44. Introduction of greater competition in local access networks and unbending of the local loop. Improvement of the coordination of the European frequency policy framework. Public financing instruments to support the development of information infrastructure and projects. Full conversion of Ipv6. Reduced prices for leased lines by increasing competition.
44 These directives concern the overall framework, access and interconnection, authorisation and license, universal service and data protection.
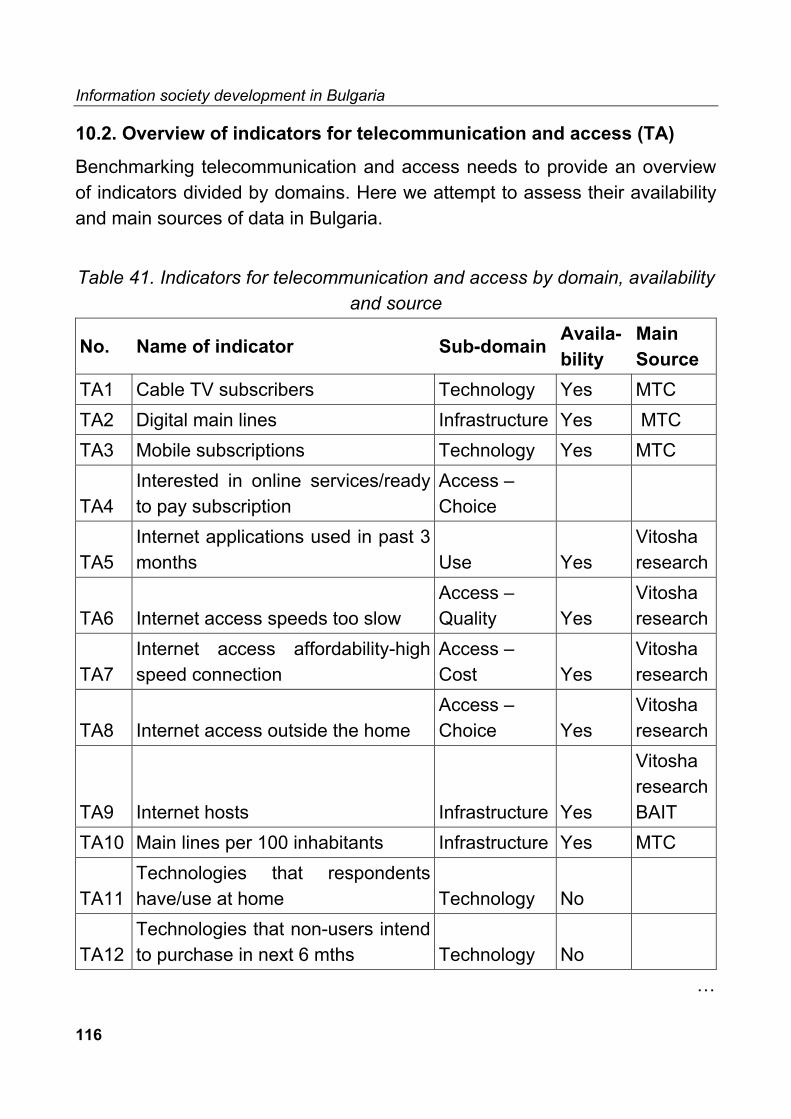
Information society development in Bulgaria
116
10.2. Overview of indicators for telecommunication and access (TA)
Benchmarking telecommunication and access needs to provide an overview of indicators divided by domains. Here we attempt to assess their availability and main sources of data in Bulgaria.
Table 41. Indicators for telecommunication and access by domain, availability
and source
No. Name of indicator Sub-domain Availa-bility
Main Source
TA1 Cable TV subscribers Technology Yes MTC TA2 Digital main lines Infrastructure Yes MTC TA3 Mobile subscriptions Technology Yes MTC
TA4 Interested in online services/ready to pay subscription
Access – Choice
TA5 Internet applications used in past 3 months Use Yes
Vitosha research
TA6 Internet access speeds too slow Access – Quality Yes
Vitosha research
TA7 Internet access affordability-high speed connection
Access – Cost Yes
Vitosha research
TA8 Internet access outside the home Access – Choice Yes
Vitosha research
TA9 Internet hosts Infrastructure Yes
Vitosha research BAIT
TA10 Main lines per 100 inhabitants Infrastructure Yes MTC
TA11 Technologies that respondents have/use at home Technology No
TA12 Technologies that non-users intend to purchase in next 6 mths Technology No
…

Information society development in Bulgaria
117
… Table 41. Indicators for telecommunication and access by domain, availability and source
TA13
Interconnection charges between fixed and mobile networks in OECD countries Access – Cost Yes PwC
TA14 Number of mobile operator equivalents Market No
TA15 Personal basket of digital cellular service Use – Cost No
TA16 Price of calls between fixed and mobile networks Use – Cost Yes MTC
TA17 International Internet bandwidth by country Infrastructure Yes
TA18 Costs for Internet access by DSL Technology Yes MTC
TA19
Costs for Internet access basket for 20 hours at peak times using discounted PSTN rates Use – Cost No
TA20 Price index for residential broadband services Use – Cost No
TA21 Households with home access to the Internet
Access – Choice Yes
Vitosha research
TA22 Internet connection by Industry Access – Choice No
TA23
Factors describing the reasons to adopt/ benefits from mobile technologies
Access – Choice No
TA24
The number of mobile phone subscribers in business and in personal communication Use - Yes NSI
TA25 Number of Telecoms License holders Market Yes MTC
…

Information society development in Bulgaria
118
… Table 41. Indicators for telecommunication and access by domain, availability and source TA26 Number of active pre-paid cards Access – Cost No
TA27 Telecom Italia’s interconnection 2000 rate for a local port Access – cost
TA28
Diversity of Internet access offers in UK, Denmark, Germany, The Netherlands, Italy, Spain and Belgium
Access – Choice
TA29 World Wide Web links between TLDs and gTLDs Use
TA30 Internet access by Cable in OECD Member countries Technology
TA31
Downstream bandwidth for residential and business broadband services Technology
TA32 Reasons for not using the Internet Access –Choice
TA33 Secure Web servers for electronic commerce per 1 million inhabitants Infrastructure Yes
MTC, BAIT
TA34 Revenue from leased lines Market Yes MTC
TA35 Survey of European Roaming Prices Access – cost
TA36 Business Satisfaction with Mobile Telephony Use No
TA37 Business Internet Access Methods and package used
Access – Choice Yes SOE
TA38 Business Satisfaction with Internet service Use No
Vitosha research

Information society development in Bulgaria
119
10.3. Telecommunication and Access Indicators’ description Further a description of indicators for telecommunication and access applied for GPS in EU and NAS is provided. It includes definition, notes, e-Europe relevance, future value and other characteristics, if any information for them has been available at the moment of investigation.
Table 42. Description of indicators for telecommunication and access Name of indicator TA1 Cable TV subscribers Definition Cable TV subscribers per HH (%) the indicator
describes the number of households with a connection to cable Television. Data are expressed in percentage.
Notes Cable –TV subscribers, thousands (data % of HH is calculated)
e-Europe relevance 1b-x – general indicator for topic `Telecommunications and access`
Future value The indicator will be important in the next future due to the increasing penetration of cable TV in Europe. Most relevant for 3-5 years.
Name of indicator TA2 Digital main lines Definition Digital main lines (expressed as a % of main lines). Notes Indicator describes penetration of digital lines per
main lines. Data are expressed in percentage. Sources 1) The household budget survey 1998-2002 by
Statistical Office. 2) 1st Report on Monitoring of EU Candidate Countries (Telecommunication Services Sector).
…

Information society development in Bulgaria
120
… Table 42. Description of indicators for telecommunication and access
e-Europe relevance 1b-x – general indicator for topic
`Telecommunications and access`. Future value The indicators will be valuable in relations to future
technology developments. Most relevant for next 3-5 years.
Name of indicator TA3 Mobile Subscriptions Definition Number of mobile subscriptions to mobile
operators. Notes The indicator refers to the number of subscribers to
mobile operators per year. Indicator can be calculated.
Sources The household budget survey. e-Europe relevance 1b-x – general indicator for topic
`Telecommunications and access`. Future value Mobile phones are increasing in Europe. Most
relevant for next 3-5 years. Links to other indicators
Correlation with indicators of other wireless technologies..
Name of indicator TA4 Interested in online services/ready to pay
subscription Definition Percentage of internet users interested in paying a
subscription for online services. Notes Interested in online connection (a question included
into the survey, data are not published). e-Europe relevance 1b-x – general indicator for topic
`Telecommunications and access` Future value Useful for e-commerce future developments.
…

Information society development in Bulgaria
121
… Table 42. Description of indicators for telecommunication and access Name of indicator TA5 Internet applications general data Definition Internet applications used in past 3 months (%). Notes The indicator shows the most used applications by
consumers from emails to online job hunting during 6 months (% of inhabitants aged 15-74) .
e-Europe relevance 1b-x – general indicator for topic `Telecommunications and access`.
Future value Useful for future developments in internet IPs development and speed of access. Most relevant for next 10 years.
Links to other indicators
Measurement on speed of access correlated to internet usage
Name of indicator TA5-1* Internet applications data by type Definition Internet applications used in past 3 months (%). Notes The indicator shows the most used applications by
consumers during 6 months by type of application (% of all applications)
eEurope relevance 1b-x – general indicator for topic `Telecommunications and access`
Future value Useful for future developments in internet IPs development and speed of access. Most relevant for next 10 years.
Links to other indicators
Measurement on speed of access correlated to internet usage
Name of indicator TA6 Internet access speeds too slow Definition Internet access speeds too slow Notes The indicator expresses the number of respondents
from the survey, who believe that the internet access speed is too slow.
e- Europe relevance 1b-6 – Full conversion of lpv6; 1b-x – general indicator for topic `Telecommunications and access`.
…

Information society development in Bulgaria
122
… Table 42. Description of indicators for telecommunication and access Future value Internet speed is a big issue for the future due to
the increase demand of image and data online transfers. Most relevant for next 10 years.
Links to other indicators
- Internet browsers penetration; - Internet penetration; - Internet access costs.
Name of indicator TA7 Internet access affordability – high speed
connection Definition The indicator describes the number of internet
users interviewed for the survey who have access to the internet through high speed connection.
Notes Number of clients using leased lines. e-Europe relevance 1b-1 – achieve significant reductions in internet
access tariffs by reinforcing competition. Future value Important for the next 3 years. Links to other indicators
Personal income Internet access cost and internet density, 1999.
Name of indicator TA8 Internet access outside the home Definition Internet access outside the home. Notes The indicators express the number of respondents
who have used the internet outside the home by locations, % of internet users.
e-Europe relevance 1b-x – general indicator for topic `Telecommunications and access`.
Future value Interesting for next 3-5 years. Links to other indicators
-Internet access costs; - adults who have accessed the internet at some time (by age); - locations adults have used to access the internet (for personal use).
…

Information society development in Bulgaria
123
… Table 42. Description of indicators for telecommunication and access Name of indicator TA9 Internet hosts Definition Internet hosts. Notes The indicator expresses the number of internet
hosts in Bulgaria. -Europe relevance 1b-x – general indicator for topic
`Telecommunications and access`. Future value Interesting for the next 3-5 years. Links to other indicators
- IPv6 penetration; - Internet hosts per 1000 inhabitants (OECD); - Web server sites per 1000 inhabitants; - Internet access costs and internet host density, 1999.
Name of indicator TA10 Main lines per 100 inhabitants Definition Main lines per 100 inhabitants. Notes The indicator expresses the number of telephone
main lines per 100 inhabitants. Sources The household budget survey by National
Statistical Institute www.nsi.bg e-Europe relevance 1b-x – general indicator for topic `TA`. Future value For next 3-5 years Links to other indicators
Penetration of IDSL and other high-speed connections Households with home access to the internet
Name of indicator TA11 Technologies that respondents have/use
at home Definition The indicator is based on survey results and
indicates the type of technologies that respondents have/use at home (expressed in % of respondents) across a range of technologies: Mobile, Digital TV, Desktop, Internet, ISDN, DVD, Fax, Cable TV, Games console, Laptop, Palmtop, Satellite, CD Rom.
…
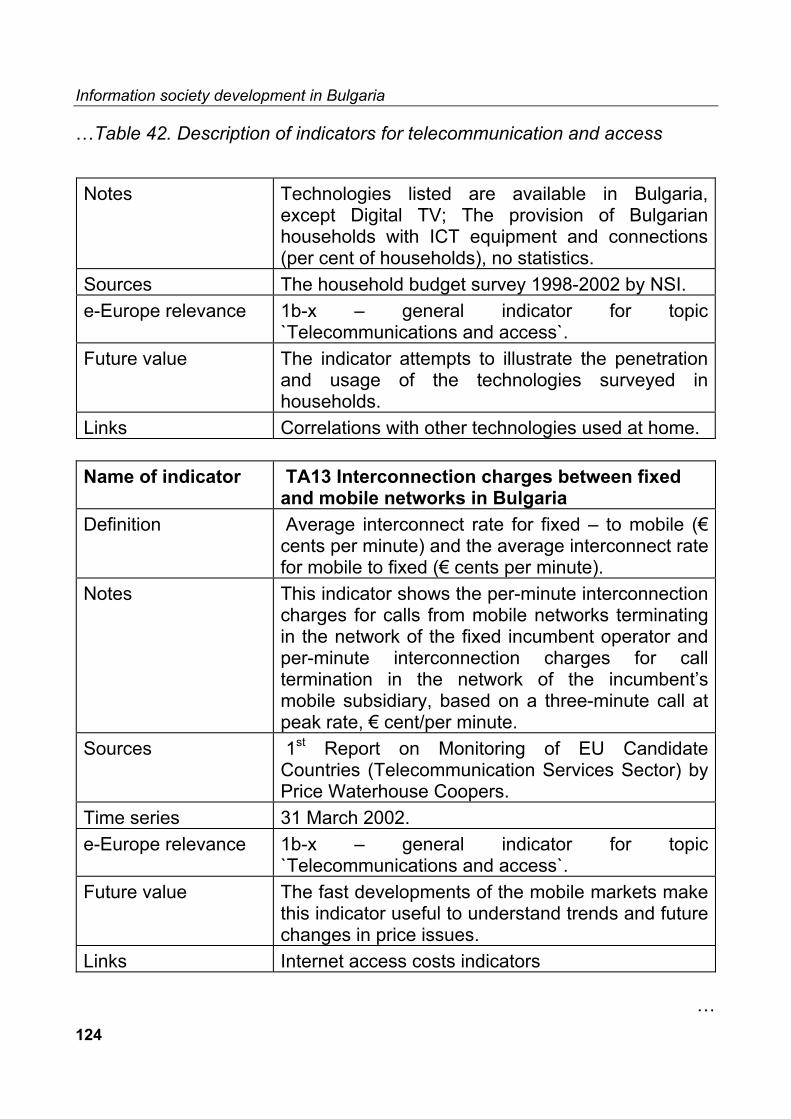
Information society development in Bulgaria
124
…Table 42. Description of indicators for telecommunication and access Notes Technologies listed are available in Bulgaria,
except Digital TV; The provision of Bulgarian households with ICT equipment and connections (per cent of households), no statistics.
Sources The household budget survey 1998-2002 by NSI. e-Europe relevance 1b-x – general indicator for topic
`Telecommunications and access`. Future value The indicator attempts to illustrate the penetration
and usage of the technologies surveyed in households.
Links Correlations with other technologies used at home. Name of indicator TA13 Interconnection charges between fixed
and mobile networks in Bulgaria Definition Average interconnect rate for fixed – to mobile (€
cents per minute) and the average interconnect rate for mobile to fixed (€ cents per minute).
Notes This indicator shows the per-minute interconnection charges for calls from mobile networks terminating in the network of the fixed incumbent operator and per-minute interconnection charges for call termination in the network of the incumbent’s mobile subsidiary, based on a three-minute call at peak rate, € cent/per minute.
Sources 1st Report on Monitoring of EU Candidate Countries (Telecommunication Services Sector) by Price Waterhouse Coopers.
Time series 31 March 2002. e-Europe relevance 1b-x – general indicator for topic
`Telecommunications and access`. Future value The fast developments of the mobile markets make
this indicator useful to understand trends and future changes in price issues.
Links Internet access costs indicators …
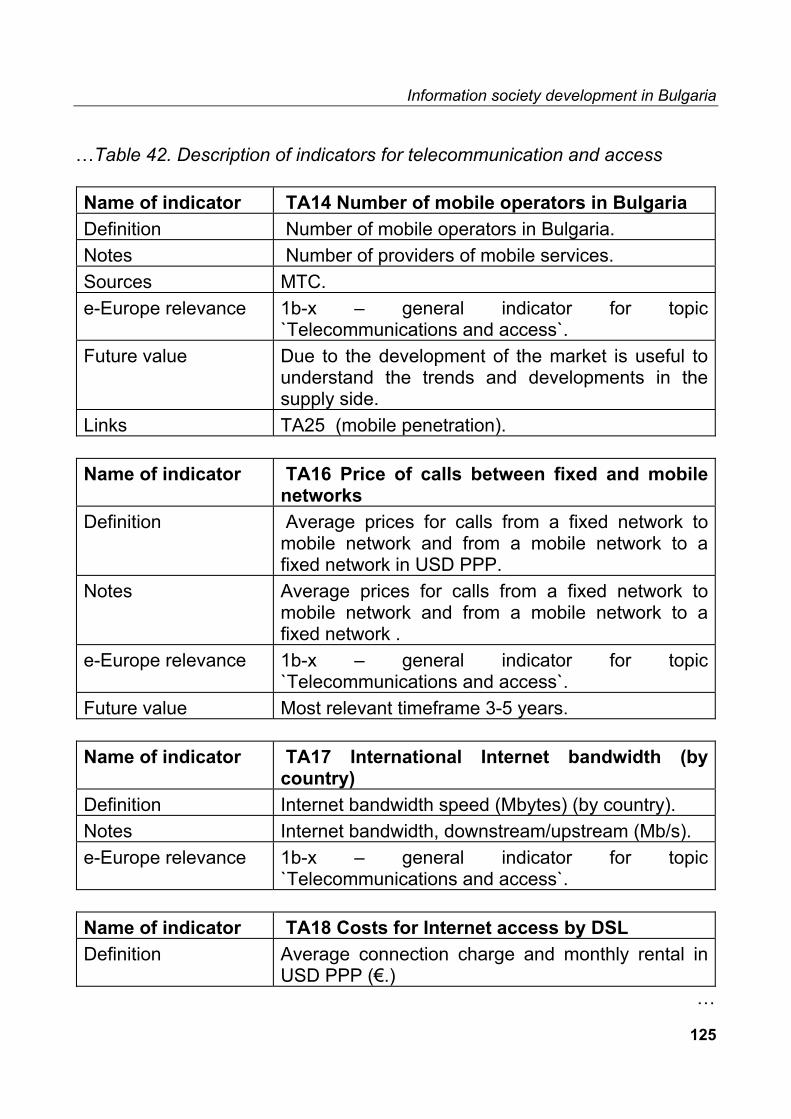
Information society development in Bulgaria
125
…Table 42. Description of indicators for telecommunication and access Name of indicator TA14 Number of mobile operators in Bulgaria Definition Number of mobile operators in Bulgaria. Notes Number of providers of mobile services. Sources MTC. e-Europe relevance 1b-x – general indicator for topic
`Telecommunications and access`. Future value Due to the development of the market is useful to
understand the trends and developments in the supply side.
Links TA25 (mobile penetration). Name of indicator TA16 Price of calls between fixed and mobile
networks Definition Average prices for calls from a fixed network to
mobile network and from a mobile network to a fixed network in USD PPP.
Notes Average prices for calls from a fixed network to mobile network and from a mobile network to a fixed network .
e-Europe relevance 1b-x – general indicator for topic `Telecommunications and access`.
Future value Most relevant timeframe 3-5 years. Name of indicator TA17 International Internet bandwidth (by
country) Definition Internet bandwidth speed (Mbytes) (by country). Notes Internet bandwidth, downstream/upstream (Mb/s). e-Europe relevance 1b-x – general indicator for topic
`Telecommunications and access`. Name of indicator TA18 Costs for Internet access by DSL Definition Average connection charge and monthly rental in
USD PPP (€.) …

Information society development in Bulgaria
126
…Table 42. Description of indicators for telecommunication and access Notes Average connection charge and the monthly rental e-Europe relevance
1b-1 – achieve significant reductions in internet access tariffs by reinforcing competitions; 1b-x – general indicator for topic `TA`.
Future value Speed and price indicators will play an important role in the next years to understand the developments of markets.
Links Telecommunication and access indicator 30. Name of indicator
TA19 Costs for Internet access basket for 20 hours at peak times using discounted PSTN rates
Definition Average ISP charges as a % of total PSTN fixed charges and PSTN usage charges, including VAT.
Notes Internet access costs – 20 hours, peak time (€). This indicator compares the cost of Internet usage for a residential user using a dial-up connection. The cost of Internet usage includes 3 parts: 1) PSTN fixed charge: the monthly rental of a fixed line for a residential user; 2) PSTN usage charge: the price of the local telephone calls to an ISP for residential users (the best available discount schemes or special access number pricing applied by the incumbent operator for Internet connection) is ccalculated as equivalent of 20 calls of one-hour duration at peak and off-peak time (similarly for 40 hours); 3) ISP charge: the price of internet access charged by the incumbent telecommunications operator acting as an ISP (the best available rate for the duration of service concerned).
Sources 1st Report on Monitoring of EU Candidate Countries (Telecommunication Services Sector), PWC.
Time series 31 March 2002. e-Europe relevance
1b-1 – achieve significant reductions in internet access tariffs by reinforcing competitions.
Future value Price indexes to access the internet will be of economic value to understand developments in the supply and demand side of the market.
…

Information society development in Bulgaria
127
…Table 42. Description of indicators for telecommunication and access Name of indicator
TA21 Households with home access to the Internet
Definition The indicator describes the number of households which have access to the internet
Notes The data are based on survey results Sources The household budget survey –NSI Time series 2000, 2001 e- Europe relevance
1b-x – general indicator for topic `Telecommunications and access`
Links to other indicators
To TA4, TA9 indicators.
Name of indicator
TA22 Internet connection by Industry
Definition The indicator describes the number of internet access by industry.
Notes 1) Percentage of companies having at least one computer 2) Employees using internet in their normal work routine by industries, %
e-Europe relevance
1b-x – general indicator for topic `Telecommunications and access`
Future value The indicator describe the internet access by “sector”, it will be useful to understand the development and implementation of access through different industries.
Name of indicator
TA24 The number of mobile phone subscribers in business and in personal communication
Definition The indicator describes the number of mobile phone subscribers both for residential and business users.
Sources 1) The household budget survey Time series 1999; 2000, 2001 e-Europe relevance
1b-x – general indicator for topic `TA`
…

Information society development in Bulgaria
128
…Table 42. Description of indicators for telecommunication and access Future value This would be useful in understanding different rates of
penetration of mobile technologies in business and personal communications. Above all under the light of the technological developments like G3. Most relevant timeframe 3-5 years.
Links to other indicators
TA3
Name of indicator
TA25 Number of Telecoms License holders
Definition Number of Telecoms License holders Notes Number of operators and service providers Sources MTC Time series available
2001
e-Europe relevance
1b-x – general indicator for topic `Telecommunications and access`
This indicator gives a view of the market share, therefore it will be useful to track the developments of the presence of incumbents and new players in Bulgaria
Links To TA14 indicator Name of indicator
TA26 Number of active pre-paid cards
Definition The indicator shows the number of pre-paid card. Notes The information on pre-paid subscribers is not
available. Sources 1st Report on Monitoring of EU Candidate Countries
(Telecommunication Services Sector), MTC Time series available
31 march 2002
e-Europe relevance
1b-x – general indicator for topic `Telecommunications and access`
…

Information society development in Bulgaria
129
…Table 42. Description of indicators for telecommunication and access Name of indicator
TA27 Telecom Bulgaria’s interconnection 2001 rate for a local port
Definition Average interconnection rate considering both peak and off-peak times.
Notes The data are determined in BTC/min in peak and off-peak times. Call set up charge is added.
Time series 2001. e-Europe relevance
1b-3 – introducing greater competition in local access networks and unbundling of the local loop.
Future value Interconnection rates for local ports will change due to development and implementation of broadband access.
Name of indicator
TA28 Diversity of Internet access offers in Bulgaria
Definition The indicator describes interconnections rate for internet access considering both peak and off-peak times.
Notes The indicator describes a number of internet access offers.
Time series 2002. e-Europe relevance
1b-1 – general indicator for topic `Telecommunications and Access`.
Links Comparison with other Internet accesses offers. Name of indicator
TA29 World Wide Web links between TLDs and gTLDs
Definition Percentage of the number of hyper-text links embedded in Websites between TLDs and gTLDs.
Time series Monthly, 2002. e-Europe relevance
1b-x – general indicator for topic `Telecommunications and access`
Future value The increased popularity of the WWW creates a growth in the number of browsers.
…

Information society development in Bulgaria
130
…Table 42. Description of indicators for telecommunication and access Name of indicator
TA30 Internet access by cable in Bulgaria
Definition The indicator presents the price of access to the Internet by cable.
Notes Data are expressed in MTC. Sources MTC. Time series 2002. e-Europe relevance
1b-1 – achieve significant reductions in internet access tariffs by reinforcing competitions.
Future value It will be interesting to understand in the future what will be the penetration of internet through cable lines and the rate of diffusion of this internet access. Most relevant timeframe 3-5 years.
Links To TA18 indicator. Name of indicator
TA31 Downstream bandwidth for residential and business broadband services.
Definition Downstream bandwidth penetration both for residential and business broadband technology.
Notes Different packages, not distributed by residents and businesses, but depend on the wishes of all clients (ADSL, Cable Internet, Gigabit Ethernet).
Time series 2002. e-Europe relevance
1b-x – general indicator for topic `Telecommunications and access`.
Future value Due to the development and implementation of Ipv6 and LLU, it will be interesting to understand the trends of downstream broadband. Most relevant timeframe 3-5 years.
Name of indicator
TA32 Reasons for not using the internet
Definition Number of respondents who do not have access to the internet and the reasons of not doing so.
…

Information society development in Bulgaria
131
…Table 42. Description of indicators for telecommunication and access e-Europe relevance
1b-x – general indicator for topic `Telecommunications and access`.
Future value It is only matter of time, when peoples capability to find access to internet will increase.
Links to other indicators
Internet penetration Reason for using the internet
Name of indicator
TA33 Secure Web servers for electronic commerce per 1 million inhabitants
Definition Number of secure servers per 1 million inhabitants. Notes Secure servers per million inhabitants Sources MTC Time series July 2001, 2002 e-Europe relevance
1b-x – general indicator for topic `Telecommunications and access`
Future value If people can be confident that their personal data, whish they enter when they form requests, and their credit card numbers are protected from fraudulent usage, they trust to utilize the services and buy goods.
Name of indicator
TA34 Revenue from leased lines
Definition Total revenue accruing to a number of operators from leased lines
Notes Indicator contains an overview of prices charged by incumbent operators for national and international leased lines. Prices refer to basic services provided by the incumbent operator. Prices are standard prices, excluding any discounts. Information on revenue is confidential (MTC)
Sources 1st Report on Monitoring of EU Candidate Countries (Telecommunication Services Sector).
Time series 31 March 2002. e-Europe relevance
1b-7 – reduced prices for leased lines by increasing competition.
…

Information society development in Bulgaria
132
…Table 42. Description of indicators for telecommunication and access Name of indicator TA35 Survey of Bulgarian Roaming Prices Definition The indicator compares the prices of the leading 2
operators. Notes There is no survey, but prices of the leading 2
operators of an international roaming call back to the home country.
Time series 2002. e-Europe relevance 1b-x – general indicator. Future value Most relevant time frame 3-5 years. Links Comparison of roaming costs.
Name of indicator TA36 Business Satisfaction with Mobile
Telephony Definition Expressed satisfaction with a number of service
elements on a Yes/No/Don`t. Notes No surveys. Sources 1st Report on Monitoring of EU Candidate Countries
(Telecommunication Services Sector). Time series 31 March 2002. e-Europe relevance 1b-x – general indicator. Future value Most relevant timeframe 3 years. Links To TA38 indicator.
Name of indicator TA37 Business Internet Access Methods and
package used Definition Share of SMEs that use certain Internet connection
methods; and the share that use certain Internet packages.
Notes Bulgaria: xDSL; modem, ISDN, other permanent connections in companies.
Sources Community Survey on ITC usage in enterprises (e-commerce in SMEs) – http://www.enlargenet.org
Time series 2001 …

Information society development in Bulgaria
133
…Table 42. Description of indicators for telecommunication and access e-Europe relevance 1b-x – general indicator Future value Most relevant timeframes 3 years. Links Consumer use of the Internet.
Name of indicator TA38 Business Satisfaction with Internet
service Definition Expressed business satisfaction with Internet
service. Notes No surveys about satisfaction!? Time series available
31 March 2002.
e-Europe relevance 1b-x – general indicator. Future value Most relevant timeframe 3 years. Links To TA36 and TA37 indicators.
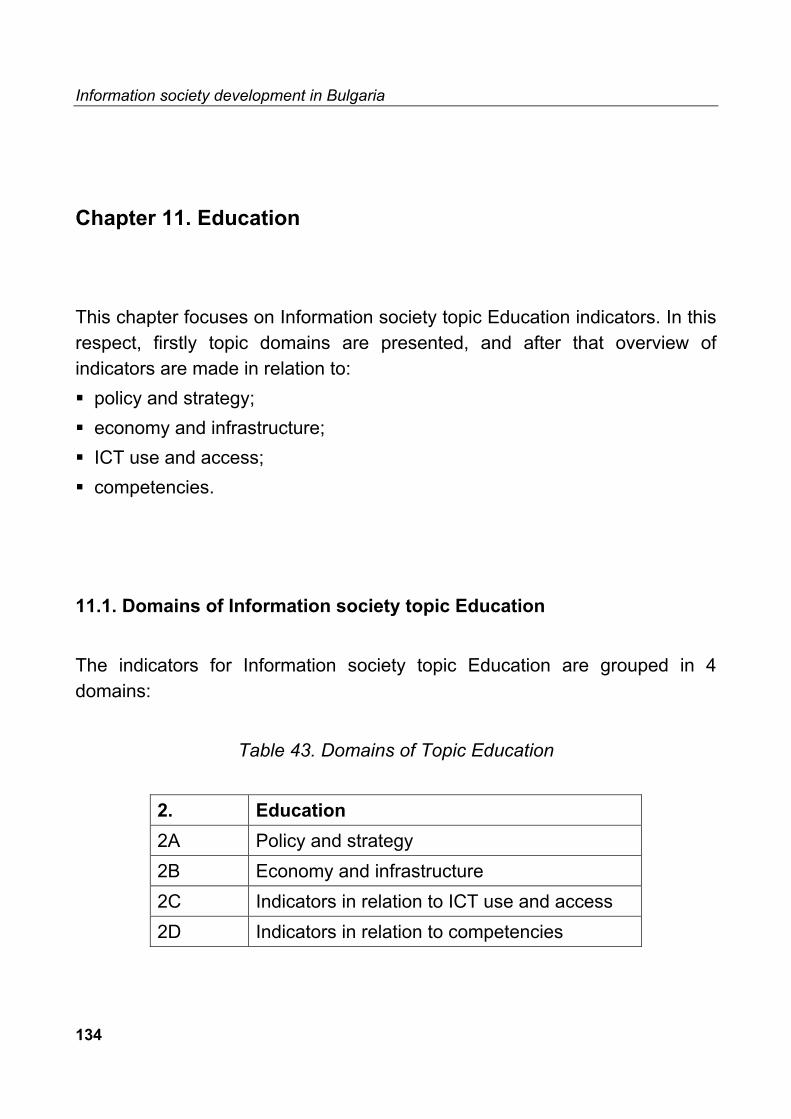
Information society development in Bulgaria
134
Chapter 11. Education
This chapter focuses on Information society topic Education indicators. In this respect, firstly topic domains are presented, and after that overview of indicators are made in relation to: policy and strategy; economy and infrastructure; ICT use and access; competencies.
11.1. Domains of Information society topic Education The indicators for Information society topic Education are grouped in 4 domains:
Table 43. Domains of Topic Education
2. Education 2A Policy and strategy 2B Economy and infrastructure 2C Indicators in relation to ICT use and access 2D Indicators in relation to competencies

Information society development in Bulgaria
135
11.2. Overview of Information society topic Education indicators The availability and sources for the Information society topic Education by domains are as follow:
Table 44. Indicators for Information society topic Education, grouped by domains
No. Name of indicator Availability
Main source
A P o l i c y a n d s t r a t e g y A1-1 Countries with an official policy on the use of ICT yes MTC
A1-2 Schedule for implementing national ICT education projects yes MES
A1-3 Responsibility for the purchase and maintenance of hardware yes MTC
A1-4 Objectives in national ICT projects yes MTC A1-5 Inclusion of ICT in the (national) curriculum yes MTC A1-6a Schools with ICT implementation plan (plan) A1-6b Schools with ICT implementation plan No
A1-7 Approaches of ICT defined in the curriculum Yes Register of Curricula
A1-8 Objectives defined in the curriculum for the teaching or the use of ICT no
A1-9 Schools with autonomous decision power no B E c o n o m y & I n f r a s t r u c t u r e B1-1 Average expenditure on ICT in schools no
B1-2 Sources of funding for ICT in schools by type of school no
B1-3 Sources of funding for ICT in schools by type of school no
B1-4 Total expenditure on ICT in schools no
B1-5 Distribution of the specific budget between the purchase of equipment and expenditure on human resources
no
…
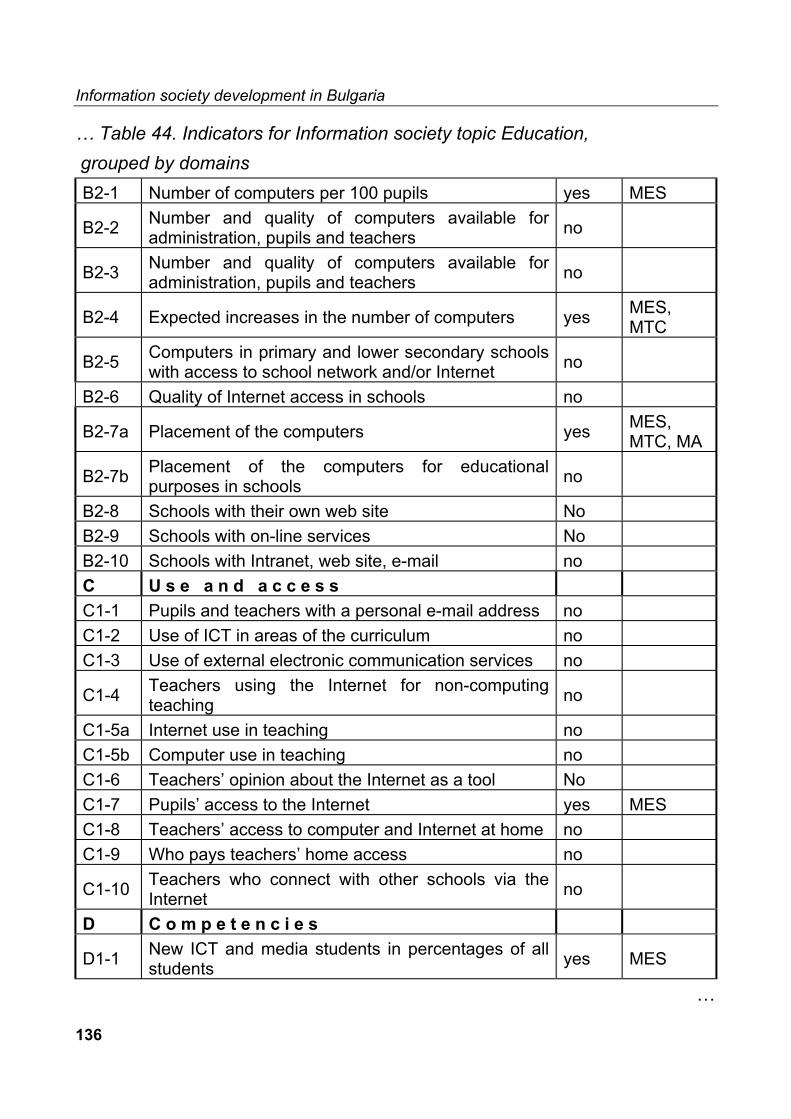
Information society development in Bulgaria
136
… Table 44. Indicators for Information society topic Education, grouped by domains B2-1 Number of computers per 100 pupils yes MES
B2-2 Number and quality of computers available for administration, pupils and teachers no
B2-3 Number and quality of computers available for administration, pupils and teachers no
B2-4 Expected increases in the number of computers yes MES, MTC
B2-5 Computers in primary and lower secondary schools with access to school network and/or Internet no
B2-6 Quality of Internet access in schools no
B2-7a Placement of the computers yes MES, MTC, MA
B2-7b Placement of the computers for educational purposes in schools no
B2-8 Schools with their own web site No B2-9 Schools with on-line services No B2-10 Schools with Intranet, web site, e-mail no C U s e a n d a c c e s s C1-1 Pupils and teachers with a personal e-mail address no C1-2 Use of ICT in areas of the curriculum no C1-3 Use of external electronic communication services no
C1-4 Teachers using the Internet for non-computing teaching no
C1-5a Internet use in teaching no C1-5b Computer use in teaching no C1-6 Teachers’ opinion about the Internet as a tool No C1-7 Pupils’ access to the Internet yes MES C1-8 Teachers’ access to computer and Internet at home no C1-9 Who pays teachers’ home access no
C1-10 Teachers who connect with other schools via the Internet no
D C o m p e t e n c i e s
D1-1 New ICT and media students in percentages of all students yes MES
…

Information society development in Bulgaria
137
… Table 44. Indicators for Information society topic Education, grouped by domains D1-2 New ICT and media students by level of education yes MES
D1-3 Qualifications and degrees in information technology and media studies yes MES
D1-4 Population with degree or qualifications in ICT and media studies no
D1-5 Hours/years spent on pedagogical IT-guidance in primary and lower secondary schools no
D1-6 Hours/years spend to technical IT-guidance in primary and lower secondary schools no
D1-7 Teachers’ confidence in the use of ICT No D1-8 Students and teachers knowledge regarding ICT no D1-9 Specialist ICT teachers no
D1-10 ICT courses during initial training of general class teachers yes MES
D1-11 ICT trained teachers yes MES D1-12 Change in teaching methods no D1-13 Pupils’ knowledge and skills of using computer Yes MES D1-14 ICT competence of pupils Yes MES D1-15 Teachers’ knowledge and skills of using computer Yes MES
Note
In all tables indicators, where a question is about broken down schools by type attention has to be paid to the fact, that typically different types of school (primary, basic and secondary schools) in Bulgaria are locating in one and the same building. All the schools are provided with ICT, so ICT is embracing all levels of general education in Bulgaria but the division by type of school is not possible to be evaluated.

Information society development in Bulgaria
138
11.3. Indicators in relation to policy and strategy Now-a-days developing of national education policy and strategy is connected with identification of appropriate Information society indicators, fining sources and their relevance to the general strategy for e-Europe development. The next Table 45 has proposed description of those indicators:
Table 45. Description of in relation to policy and strategy of education indicators
Name of indicator A1 – 1: Countries with an official policy on the use of ICT
Definition Is there an official policy on use of information and communication technologies at the national level? Schools broken down by type of school: primary and secondary; primary, secondary and tertiary; secondary and tertiary.
Notes Bulgarian policy on the use of ICT embraces general education as a single pool and is separately for higher education: Programs for educational development and National Strategy for IS development.
Sources Programs for educational development and National Strategy for IS development.
e-Europe relevance
2A-5 Adapt school curricula to enable new ways of learning using information technologies.
Future value Limited. In near future all EU Member States will have some kind of ICT education policy.
Links to other indicators
To TA1-2 indicators.
Table is continuing …
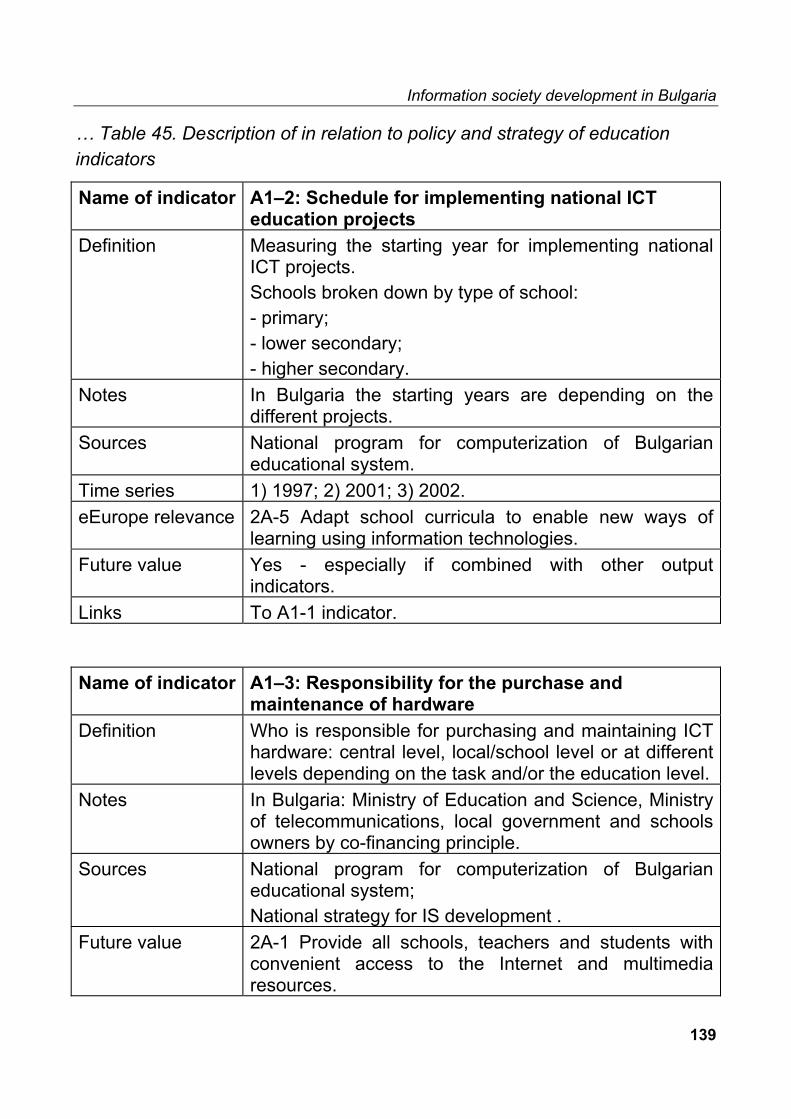
Information society development in Bulgaria
139
… Table 45. Description of in relation to policy and strategy of education indicators
Name of indicator A1–2: Schedule for implementing national ICT education projects
Definition Measuring the starting year for implementing national ICT projects. Schools broken down by type of school: - primary; - lower secondary; - higher secondary.
Notes In Bulgaria the starting years are depending on the different projects.
Sources National program for computerization of Bulgarian educational system.
Time series 1) 1997; 2) 2001; 3) 2002. eEurope relevance 2A-5 Adapt school curricula to enable new ways of
learning using information technologies. Future value Yes - especially if combined with other output
indicators. Links To A1-1 indicator. Name of indicator A1–3: Responsibility for the purchase and
maintenance of hardware Definition Who is responsible for purchasing and maintaining ICT
hardware: central level, local/school level or at different levels depending on the task and/or the education level.
Notes In Bulgaria: Ministry of Education and Science, Ministry of telecommunications, local government and schools owners by co-financing principle.
Sources National program for computerization of Bulgarian educational system; National strategy for IS development .
Future value 2A-1 Provide all schools, teachers and students with convenient access to the Internet and multimedia resources.

Information society development in Bulgaria
140
… Table 45. Description of in relation to policy and strategy of education indicators
Name of indicator A1 – 4: Objectives in national ICT projects Definition What are the objectives in the national ICT projects
(dichotomous scale: yes/ no) Objectives differentiated as follows: - Equipment; - Acquisition and/or distribution of software; - Development of teachers skills; - Development of pupils skills; - Help in development of software/educational software; - Use of the Internet. Schools broken down by type of school: primary; lower secondary; higher secondary .
Notes
In Bulgaria the priorities include the following: - ICT competence; - virtual learning; - sustainable development of infrastructure; - collaboration of all parties involved. 2) Priorities of the Bulgarian National IS Action Plan for Higher Education are: support for the development of the ICT infrastructure at higher educational establishments and of the academic staff and degree courses’ infrastructure.
Sources National IS action plan. Time series 2000, 2001. eEurope relevance 2A-1 Provide all schools, teachers and students with
convenient access to the Internet and multimedia resources; 2A-6 Ensure that all pupils have the possibility to be digitally literate by the time they leave school.
Future value Future value may depend on whether or not the list of objectives will be extended.
Links to other indicators
To A1-8 indicators.
…

Information society development in Bulgaria
141
… Table 45. Description of in relation to policy and strategy of education indicators
Name of indicator A1–5: Inclusion of ICT in the (national) curriculum Definition Is ICT included in the (national) curriculum) or not?
Schools broken down by type of school: primary; lower secondary; higher secondary.
Notes In Bulgaria: informatics is in the national curriculum as an optional subject in the general education and obligatory in the curriculum of vocational secondary and higher education. ICT is obligatory subject and pupils use this knowledge in learning different subjects.
Sources Register of the National Curricula. Ministry of Education and Science.
Time series 2002. e-Europe relevance
2A-5 Adapt school curricula to enable new ways of learning using information technologies.
Future value Limited – in the near future ICT is likely to be included in all national curricula.
Links to other indicators
To A1-1; A1-2 indicators.
Name of indicator A1–7: Approaches of ICT defined in the curriculum Definition Is ICT approached as a separate subject or as a tool for
other subjects (or both) in the curriculum? Schools broken down by type of school: 1) primary and secondary; 2) primary, secondary and tertiary; 3) secondary and tertiary.
Notes In Bulgaria: as a tool for other subjects. Sources Ministry of Education and Science. Register of the
National Curricula. 2002. Time series 2002. e-Europe relevance
2A-5 Adapt school curricula to enable new ways of learning using information technologies.
Future value Limited value – soon ICT will be approached as a tool for many other subjects.

Information society development in Bulgaria
142
10.4. Indicators in relation to Economy and Infrastructure
The second domain of the Information society topic Education is Economy and Infrastructure. Description of indicators for this domain is presented in the table bellow.
Table 46. Description of in relation to economy and infrastructure of education indicators
Name of indicator B2 – 1: Number of computers per 100 pupils Definition Number of computers per 100 pupils in
primary/secondary/tertiary levels. Notes
In Bulgaria number of computers in average (at least Pentium) per 100 pupils in general education; at primary level at secondary level (computers are used primarily for teaching informatics but increasingly also for other subjects).
Sources MES. Time series 2000. e-Europe relevance
2A-1 Provide all schools, teachers and students with convenient access to the Internet and multimedia resources; 2A-6 Ensure that all pupils have the possibility to be digitally literate by the time they leave school.
Future value Limited – in a few years time it will be more interesting to measure the actual use of computers (intensity of usage).
Links To: Hours of computer use per pupil per week indicator. Name of indicator B2 – 4: Expected increases in the number of
computers Definition Increase in the coming year in number of computers in
the primary and lower secondary schools, as expected by schools.
…

Information society development in Bulgaria
143
… Table 46. Description of in relation to economy and infrastructure of education indicators
Notes
In Bulgaria the increase of computers are expected based on the demand by the schools. Priority has shifted from the simple approach of only the hardware provision to the more diligent approach of providing skills also for teachers and pupils to use that hardware. Data available by schools, not by levels of education.
Time series 2001. e-Europe relevance
2A-1 Provide all schools, teachers and students with convenient access to the Internet and multimedia resources.
Future value Limited – focus on hardware will become less interesting.
Name of indicator B2 – 7a: Placement of the computers Definition Location where computers are placed in schools: the
number of computers in the class room, a common room, a pedagogical service centre, a special computer room or other places, per pupil.
Notes
In Bulgaria placement of computers is available by divisions named as follows: for administration, teachers, pupils and other, among these in library.
Sources Schools. Time series 2002. e-Europe relevance
2A-1 Provide all schools, teachers and students with convenient access to the Internet and multimedia resources.
Future value Limited value. Links to other indicators
To B2-7b indicators.
Name of indicator B2 – 8: Schools with their own web site Definition Schools with their own web site, as percentage of all
schools. …
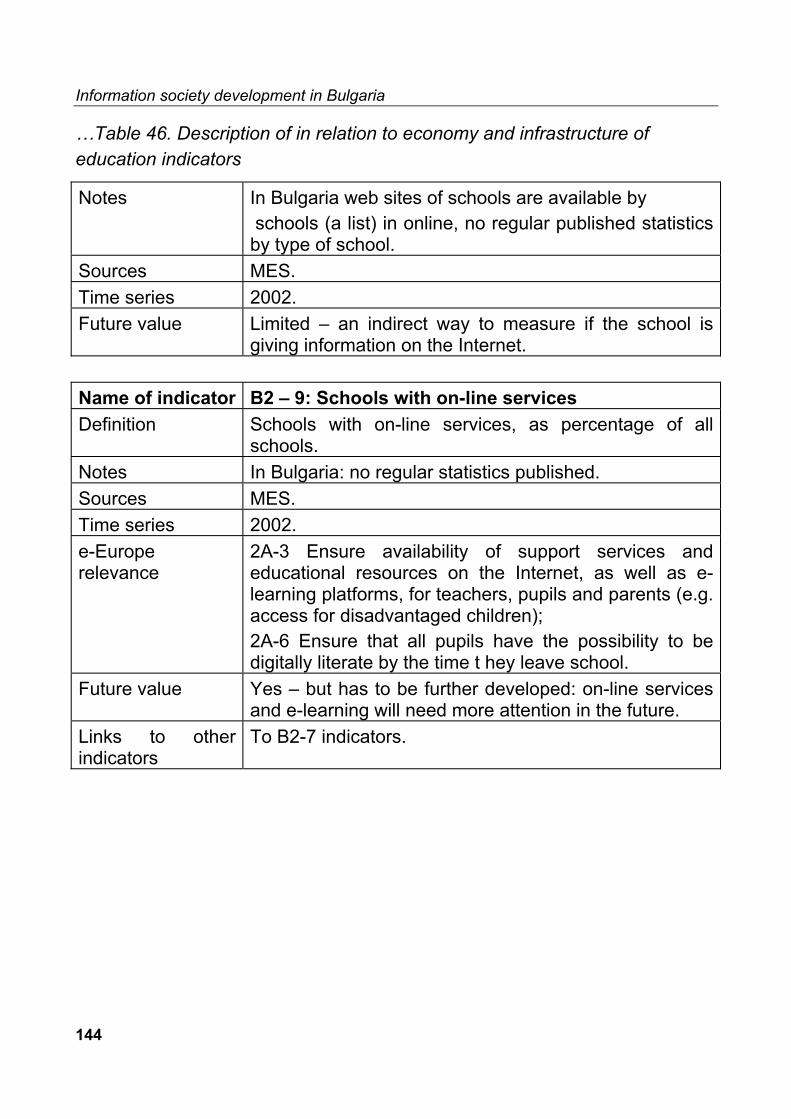
Information society development in Bulgaria
144
…Table 46. Description of in relation to economy and infrastructure of education indicators
Notes In Bulgaria web sites of schools are available by schools (a list) in online, no regular published statistics by type of school.
Sources MES. Time series 2002. Future value Limited – an indirect way to measure if the school is
giving information on the Internet. Name of indicator B2 – 9: Schools with on-line services Definition Schools with on-line services, as percentage of all
schools. Notes In Bulgaria: no regular statistics published. Sources MES. Time series 2002. e-Europe relevance
2A-3 Ensure availability of support services and educational resources on the Internet, as well as e-learning platforms, for teachers, pupils and parents (e.g. access for disadvantaged children); 2A-6 Ensure that all pupils have the possibility to be digitally literate by the time t hey leave school.
Future value Yes – but has to be further developed: on-line services and e-learning will need more attention in the future.
Links to other indicators
To B2-7 indicators.

Information society development in Bulgaria
145
11.5. Indicators in relation to ICT use and access The third domain of Information society topic Education has concerned indicators in relation to ICT use and access. They are presented in the Table 47.
Table 47. Description of in relation to ICT use and access indicators Name of indicator C1-6: Teachers’ opinion about the Internet as a tool Definition Teachers’ opinion about Internet as a tool to support
teaching (useful, occasional useful, not useful). Notes
In Bulgaria: this question is never asked directly but teachers are eager to get further training in ICT.
Sources MES. Time series 2000. Future value Measures readiness – no so interesting in the future. Name of indicator C1-7: Pupils’ access to the Internet Definition Location where the pupils generally access the Internet
for learning purposes. Notes
This question is not asked from teachers in Bulgaria and the learning purpose was not as the restriction. Pupils answered that clubs is the main place to get the Internet access.
Sources MES, newspapers. Time series 2000. e-Europe relevance
2A-1 Provide all schools, teachers and students with convenient access to the Internet and multimedia resources.
Future value Yes. Links to other indicators
To B2-7a; B2-7b indicators.

Information society development in Bulgaria
146
11.6. Indicators in relation to competencies The forth domain of the Information society topic Education has concerned indicators in relation to competencies. The description of the indicators is presented in Table 48. Table 48. Indicators in relation to competencies description Name of indicator
D1-1: New ICT and media students in percentages of all students
Definition New ICT and media students in percentages of all students. Broken down by sex.
Notes In Bulgaria: this field of study (ISCED code 48) is provided in vocational secondary education, higher professional, diploma, bachelor, master and doctor courses. ICT and media studies can lead to a qualification as a Bachelor of Science in Engineering in Electronics, Informatics, Business Information Technology, Computer and Systems Engineering; Telecommunication; Master of Science in Engineering in Electronics, Informatics, Business Information Technology, Computer and Systems Engineering; Informatics for Non-informatics; Master of Engineering In telecommunication; Doctor of Philosophy in Engineering In Information and Communication Technology; Doctor of Philosophy in Natural Sciences in Information and Communication Technology; Diploma in Fundamentals of Information Technology etc. At the beginning of academic year 2001/2002 of all admitted students - % of ICT students.
Sources NSI, MES Time series 2000, 2001. Future value Yes – a lasting indicator (labour market). Links To D1-2; D1-3 indicators.

Information society development in Bulgaria
147
…Table 48. Indicators in relation to competencies description Name of indicator
D1-2: New ICT and media students by level of education
Definition Number of new ICT and media students by level of education.
Notes
In Bulgaria number of ICT and media students by level of education are divided as follows: 1) In upper secondary qualification (vocational secondary and professional secondary education) : Diploma in Computing (professional secondary education curricula 4-1 and 4-2), in Fundamentals of Information Technology (vocational secondary education). 2) In tertiary qualification: Bachelor of Computer and System Engineering, Master of Informatics, Doctor of Philosophy in Engineering etc. At the beginning of academic year 2001/2002 of all admitted students % of ICT students constituted by level of education.
Sources Education 2001/2002. 2002. Yearbook. NSI – BG, MES.Time series 2000, 2001. e-Europe No direct relevance. Future value Yes – a lasting indicator (labour market). Links To D1-1; D1-3 indicators. Name of indicator D1-3: Qualifications and degrees in information
technology and media studies Definition Number of students with completed qualifications and/or
degrees in information technology and media studies. Qualifications and/or degrees in information technology and media studies as a percentages of all degrees taken.
Notes In Bulgaria during the academic year 2000/2001 of all graduates % of ICT graduates in vocational secondary education; higher and higher professional education; in diploma courses, bachelor, M.A. and PhD courses.
…
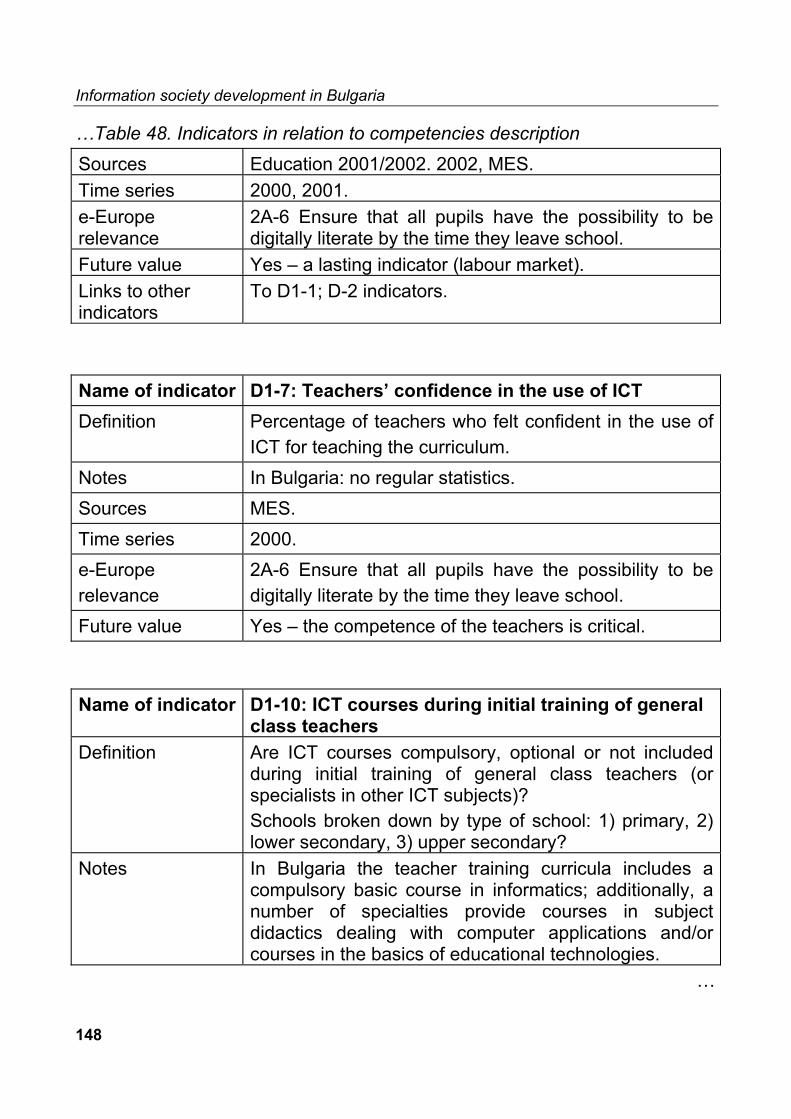
Information society development in Bulgaria
148
…Table 48. Indicators in relation to competencies description Sources Education 2001/2002. 2002, MES. Time series 2000, 2001. e-Europe relevance
2A-6 Ensure that all pupils have the possibility to be digitally literate by the time they leave school.
Future value Yes – a lasting indicator (labour market). Links to other indicators
To D1-1; D-2 indicators.
Name of indicator D1-7: Teachers’ confidence in the use of ICT Definition Percentage of teachers who felt confident in the use of
ICT for teaching the curriculum. Notes In Bulgaria: no regular statistics. Sources MES. Time series 2000. e-Europe relevance
2A-6 Ensure that all pupils have the possibility to be digitally literate by the time they leave school.
Future value Yes – the competence of the teachers is critical.
Name of indicator D1-10: ICT courses during initial training of general class teachers
Definition Are ICT courses compulsory, optional or not included during initial training of general class teachers (or specialists in other ICT subjects)? Schools broken down by type of school: 1) primary, 2) lower secondary, 3) upper secondary?
Notes
In Bulgaria the teacher training curricula includes a compulsory basic course in informatics; additionally, a number of specialties provide courses in subject didactics dealing with computer applications and/or courses in the basics of educational technologies.
…
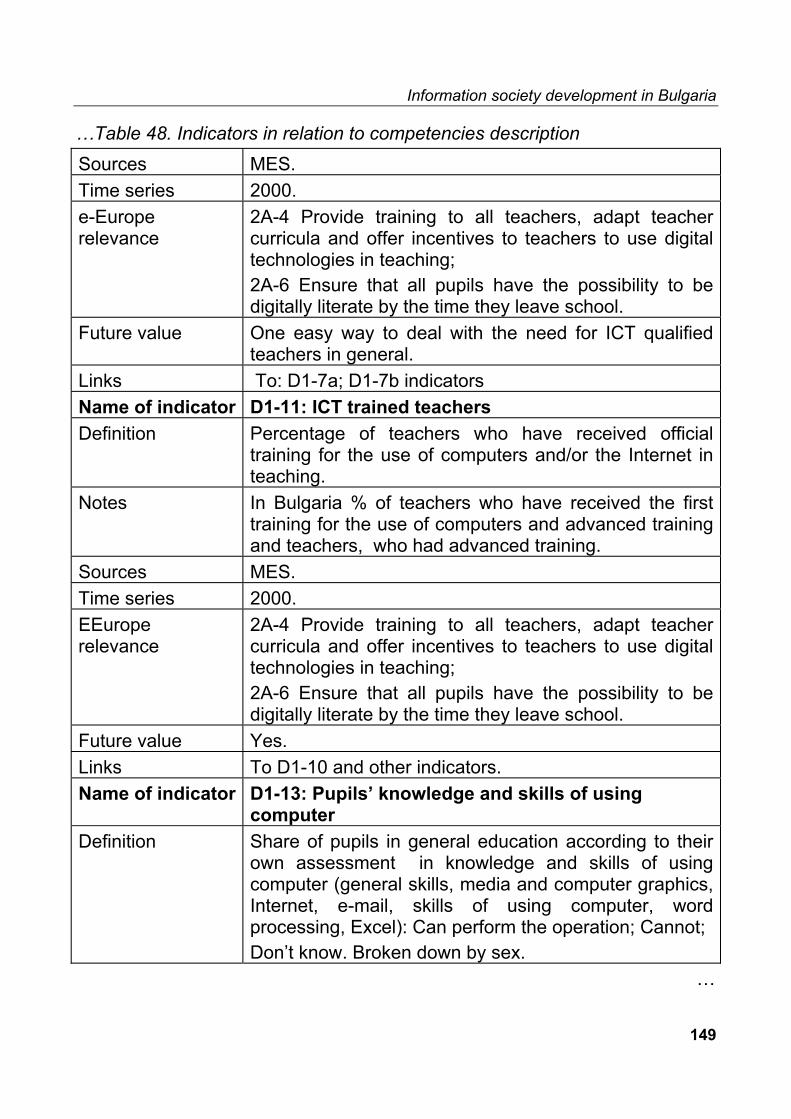
Information society development in Bulgaria
149
…Table 48. Indicators in relation to competencies description Sources MES. Time series 2000. e-Europe relevance
2A-4 Provide training to all teachers, adapt teacher curricula and offer incentives to teachers to use digital technologies in teaching; 2A-6 Ensure that all pupils have the possibility to be digitally literate by the time they leave school.
Future value One easy way to deal with the need for ICT qualified teachers in general.
Links To: D1-7a; D1-7b indicators Name of indicator D1-11: ICT trained teachers Definition Percentage of teachers who have received official
training for the use of computers and/or the Internet in teaching.
Notes In Bulgaria % of teachers who have received the first training for the use of computers and advanced training and teachers, who had advanced training.
Sources MES. Time series 2000. EEurope relevance
2A-4 Provide training to all teachers, adapt teacher curricula and offer incentives to teachers to use digital technologies in teaching; 2A-6 Ensure that all pupils have the possibility to be digitally literate by the time they leave school.
Future value Yes. Links To D1-10 and other indicators. Name of indicator D1-13: Pupils’ knowledge and skills of using
computer Definition Share of pupils in general education according to their
own assessment in knowledge and skills of using computer (general skills, media and computer graphics, Internet, e-mail, skills of using computer, word processing, Excel): Can perform the operation; Cannot; Don’t know. Broken down by sex.
…

Information society development in Bulgaria
150
…Table 48. Indicators in relation to competencies description … Name of indicator
… D1-13: Pupils’ knowledge and skills of using computer
Sources MES. Time series 2000 survey. e-Europe relevance
2A-6 Ensure that all pupils have the possibility to be digitally literate by the time they leave school.
Future value Yes – a lasting indicator (labour market). Links to other indicators
Indicators dealing with ICT literacy.
Name of indicator D1-14*: ICT competence of pupils Definition Indexes for measuring of ICT competence of pupils by
grade and sex in general education based on 31 optional answers: - Theoretical base knowledge about computer (9 questions);
- General skills in using software (16 questions); - Skills (6 questions). The questions were prepared on the basis of national curricula in ICT competence.
Notes In Bulgaria data available for dividing data per school and per pupil.
Sources MES, MTC, MLSP. Time series 2000 . e- Europe relevance
2A-6 Ensure that all pupils have the possibility to be digitally literate by the time they leave school.
Future value Yes – a lasting indicator (labour market). Links to other indicators
Indicators dealing with ICT literacy.
…

Information society development in Bulgaria
151
…Table 48. Indicators in relation to competencies description Name of indicator D1-15: Teachers’ knowledge and skills of using
computer Definition Indexes for measuring teachers’ knowledge and skills of
using computer in general education according to their own assessment. 19 items of knowledge and skills were divided into 2 categories: a) General skills of using computer and standard software; b) Skills of using computer in teaching.
Notes In Bulgaria data available would be divided per school and per subjects.
Sources MES. Time series available
2000.
e-Europe relevance
2A-4 Provide training to all teachers, adapt teacher curricula and offer incentives to teachers to use digital technologies in teaching. 2A-6 Ensure that all pupils have the possibility to be digitally literate by the time they leave school.
Future value Yes – a lasting indicator (labour market). Links to other indicators
Indicators dealing with ICT literacy.

Information society development in Bulgaria
152

Information society development in Bulgaria
153
Chapter 12. Work/ Skills/ Employment This chapter has focused on domains of the third Information society topic: ‘Work, Sills and Employment’. After that overview of indicators and indicators descriptions are provided. They concern skill indicators, work content/applied skills and indicators for structure and outcomes of employment. 12.1. Domains The indicators for Information society tropic Work/ Skills/ Employment are grouped in 3 domains. The skills domain concerns acquisition and provision of skills, needed for Information society development. This domain covers formal education, non-formal learning and education and informal learning indicators. More concretely skill acquisition deals with formal education, non-formal learning / education, and informal learning. The skill provision domain covers education attainment, general ICT skills and life skills thematic. The work domain deals with work content/applied skills, time of work, place of work and work contracts. The first thematic – work content/applied skills, describe work organisation development in Information society through used working tools, working methods, working tasks, self-determination. The time of work is described by worker-centred time flexibility and company-centred time flexibility. Place of work is described by indicators for telework – general, home-based, centre-based and mobile, and for tele-cooperation. The contract of work in information society is described by general indicator as well as through indicators for self-employment, labour market flexibility, duration of the contract and compensations. The employment domain covers benefits from and level, structure and output of employment. The benefits from employment concern material benefits, immaterial benefits, job security and availability, and health effects. Level and structure of employment domain of information society indicators covers

Information society development in Bulgaria
154
areas like overall employment, sectors and occupations and unemployment. Output from employment indicators concerns labour productivity and unit labour costs. There is a separate group of indicators, which are under construction. They concern all domains and are presented separately.
Table 49. Domains for work/skills/employment indicators
3. Work / Skills / Employment 3A Skills 3A1 Formal education 3A2 Non-formal learning / education 3A3 Informal learning 3B Work 3B1 Work content /applied skills 3B2 Time of work 3B3 Place of work 3B4 Work contract 3C Employment 3C1 Benefits from employment 3C2 Level & structure of employment 3C3 Output of employment

Information society development in Bulgaria
155
12.2. Overview of skill indicators and indicators description
The indicators for skills, describing Information society development, are divided in 3 groups: skill acquisition; skill provision; skill requirements.
12.2.1. Skill acquisition
Information society skill acquisition indicators cover areas of formal education, non formal learning/education and informal learning. Table 50. presents their overview, and Table 51. - their description.
Table 50. Overview of skill acquisition indicators A1 – Skill acquisition (Thematic domain: skills) No. Name of indicator Availability Main source A 1 - 1 F o r m a l e d u c a t i o n
A1-1.1 Relative weight of science & technology students in the national education system
Yes MES
A1-1.2*
Number of places in ICT related third level education No
A 1 - 2 N o n - f o r m a l l e a r n i n g / e d u c a t i o n
A1-2.1 Participation rate in education and training No
A1-2.2*
Intensity rate of education and training No
A1-2.3 Average duration of job-related training (per person trained/per person employed)
No
A1-2.4 ICT training places No …

Information society development in Bulgaria
156
… Table 50. Overview of skill acquisition indicators A1-2.5 Employer-provided or –
supported education and training offers
No Different branch organisations
A1-2.6 Vocational education and training
possible to calculate As above
A1-2.7 Vocational education and training paid for by employer
possible to calculate As above
A1-2.8 Vocational education and training to improve skills and job prospects
possible to calculate As above
A1-2.9*
Job-related training on the initiative of the employer – Companies offering training
yes As above, Innovation policy in Bulgaria report
A1-2.10*
Job-related training on the initiative of the employer – Access rate and intensity
yes Branch organisations
A1-2.11*
Time spent of continual vocational education and training within working hours
no
A1-2.12
Spending by enterprises on training yes Branch
organisations A1-2.13*
Impact of enterprise-based training no
A1-2.14
Distance learning (for computer training) no
A 1 - 3 I n f o r m a l l e a r n i n g A1-3.1*
Rate of student access to computers yes MES
A1-3.2 Rate of Internet coverage in schools similar MES
A1-3.3 Place of computer skills acquisition no
A1-3.4 Organisation of computer training for current job no
… * under development

Information society development in Bulgaria
157
… Table 50. Overview of skill acquisition indicators A1-3.5 Public Internet Access Points
(PIAPs) yes MTC
A1-3.6 Libraries offering Internet access to the public yes NSI, Ministry ofr
culture A1-3.7* Staff access to ICTs no
A1-3.8*
Work places equipped with PC similar
A1-3.9*
Work places linked to the Internet similar
A1-3.10* PC access at home Yes Vitosha research
A1-3.11* Use of PC – anywhere Yes Vitosha research
A1-3.12*
Use of e-mail, and purpose of use Yes Vitosha research
Table 51. Description of skill acquisition indicators Name of indicator A1-2.1 Participation rate in education and training Definition Percentage of population, aged 25-64, participating in
education and training (over the 4 weeks prior to the survey).
Notes Is possible to calculate. Sources EIS, Trendchart report. Time series since 2000. eEurope relevance 2b-1 - give the labour force the chance to become
digitally literate through life long learning. Future value The indicator needs to be further improved.
…
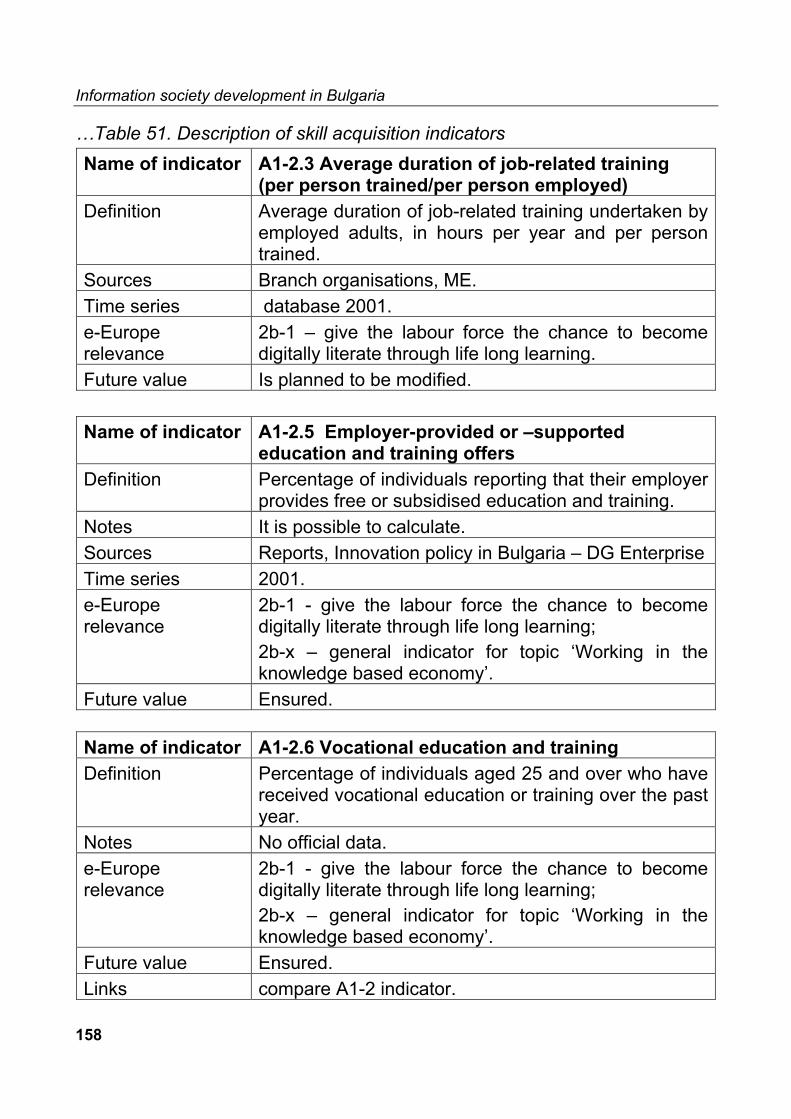
Information society development in Bulgaria
158
…Table 51. Description of skill acquisition indicators Name of indicator A1-2.3 Average duration of job-related training
(per person trained/per person employed) Definition Average duration of job-related training undertaken by
employed adults, in hours per year and per person trained.
Sources Branch organisations, ME. Time series database 2001. e-Europe relevance
2b-1 – give the labour force the chance to become digitally literate through life long learning.
Future value Is planned to be modified. Name of indicator A1-2.5 Employer-provided or –supported
education and training offers Definition Percentage of individuals reporting that their employer
provides free or subsidised education and training. Notes It is possible to calculate. Sources Reports, Innovation policy in Bulgaria – DG Enterprise Time series 2001. e-Europe relevance
2b-1 - give the labour force the chance to become digitally literate through life long learning; 2b-x – general indicator for topic ‘Working in the knowledge based economy’.
Future value Ensured. Name of indicator A1-2.6 Vocational education and training Definition Percentage of individuals aged 25 and over who have
received vocational education or training over the past year.
Notes No official data. e-Europe relevance
2b-1 - give the labour force the chance to become digitally literate through life long learning; 2b-x – general indicator for topic ‘Working in the knowledge based economy’.
Future value Ensured. Links compare A1-2 indicator.

Information society development in Bulgaria
159
…Table 51. Description of skill acquisition indicators Name of indicator A1-2.7 Vocational education and training paid for
by employer Definition Percentage of individuals aged 25 and over in paid
employment who received vocational education or training paid for by their employer.
Notes Is possible to calculate. Sources Reports. Time series Database 2001. e-Europe relevance
2b-1 - give the labour force the chance to become digitally literate through life long learning; 2b-x – general indicator for topic ‘Working in the knowledge based economy’.
Future value Ensured. Links to other indicators
Different breakdowns possible.
Name of indicator A1-2.8 Vocational education and training to
improve skills and job prospects Definition Percentage of individuals aged 25 and over who have
received vocational education or training over the past year to improve skills and job prospects; Percentage of those who received vocational education or training over the past year to improve skills and job prospects who found it “very useful”.
Notes Is possible to calculate. Sources Papers. Time series database 2001. e-Europe relevance
2b-1 - give the labour force the chance to become digitally literate through life long learning; 2b-x – general indicator for topic ‘Working in the knowledge based economy’.
Future value Ensured. Links to other indicators
Different breakdowns possible.

Information society development in Bulgaria
160
…Table 51. Description of skill acquisition indicators Name of indicator A1-2.12 Spending by enterprises on training Definition Expenditure on vocational training as a percentage of
total labour costs. e-Europe relevance
2b-1 - give the labour force the chance to become digitally literate through life long learning; 2b-x – general indicator for topic ‘Working in the knowledge based economy’.
Name of indicator A1-3.2 Rate of Internet coverage in schools Definition Percentage of schools connected to the Internet by
education level (primary, secondary). Notes Number of computers connected to the Internet per
100 pupils at primary level and at secondary level. Sources Ministry of Education and Science Time series 2001. e-Europe relevance
2b-1 - give the labour force the chance to become digitally literate through life long learning.
Future value This is a readiness indicator; intensity and impact indicators will become more pressing in the future.
Name of indicator A1-3.5 Public Internet Access Points (PIAPs) Definition Public Internet Access Points (PIAPs) per 1000
inhabitants.. Notes There is some data. Sources BAIT. Time series 2001, 2002. e-Europe relevance
2b-6 – set up public Internet access points in public places and establish multimedia telecentres in all communities providing access to training and e-work facilities
…

Information society development in Bulgaria
161
…Table 51. Description of skill acquisition indicators Name of indicator A1-3.6 Libraries offering Internet access to the
public Definition Percentage of public libraries offering Internet access
to the public. Notes There is some data available. Sources NSI, MC. Time series 2001. e-Europe relevance
2b-2 – increase IT training places and courses and promote gender equality in such courses, using ESF where appropriate.
Future value Ensured. 12.2.2. Skill provision Overview and description of the skill provision indicators for information society development are presented in Table 52. and 53.
Table 52. Overview of skill provision indicators A2 – Skill provision (Thematic domain: skills) No. Name of indicator Availability Main source A 2 - 1 E d u c a t i o n a l a t t a i n m e n t A2-1.1 Educational attainment (LLL1) yes MLSP
A2-1.2 ICT Intensity of graduate output Yes
2002 European Innovation Scoreboard, MES
A2-1.3 Number of graduates from ICT related third level education
Yes MES
…

Information society development in Bulgaria
162
…Table 52. Overview of skill provision indicators A 2 - 2 G e n e r a l I C T s k i l l s
A2-2.1 Supply of IT Skills in Western Europe Yes MES
A2-2.2 Computer training qualifications no
A2-2.3 Computer training for job No A2-2.4*
Percentage of workforce with (at least) basic IT training no
A2-2.5 European Computer Driving License (ECDL) yes MTC
A 2 - 3 L i f e s k i l l s A2-3.1 Literacy skills no
Table 53. Description of skill provision indicators
Name of indicator A2-1.1 Educational attainment (LLL1) Definition Percentage of population having attained at least
upper secondary level education. Sources NSI, MES. e-Europe relevance
2b-x – general indicator for topic “Working in the knowledge based economy”.
Future value Ensured. Links to other indicators
Broken down by sex, economic status, nationality place of residence (city, countryside), age group (15-24, 25-34, 35-44, 45-54, 55-64, 65-74, 25-64).
Name of indicator A2-1.2 ICT Intensity of graduate output Definition Total number of graduates in science & technology as
a percentage of 20-24 year old people. Notes Total number of graduates in science & technology as
a percentage of 20-29 year old people. Sources 2002 European Innovation Scoreboard. Time series 2001.
…

Information society development in Bulgaria
163
…Table 53. Description of skill provision indicators e-Europe relevance
2b-2 – increase IT training places and courses and promote gender equality in such courses, using ESF where appropriate.
Future value Ensured as long as definition is clear and adequate. Name of indicator A2-2.3 Computer training for job Definition Share of employed persons who had computer
training for their current job. Notes Share of employed persons who had computer
training. Sources No. Time series 2001. e-Europe relevance
2b-1 - give the labour force the chance to become digitally literate through life long learning; 2b-2 – increase IT training places and courses and promote gender equality in such courses..
Future value “Computer training” might have to be specified as computer technology spreads further into every aspect of working life and PC and other IT devices converge.
Name of indicator A2-2.5 European Computer Driving Licence (ECDL) .
Definition Number of ECDL issued in BG. Notes During 01.01.02-30.09.02 issued. Sources MTC. Time series 2002. e-Europe relevance
2b-1 - give the labour force the chance to become digitally literate through life long learning; 2b-2 – increase IT training places and courses and promote gender equality in such courses.
Future value Depends on the acceptance of ECDL as main national training/assessment scheme in the EU Member States. The curriculum has to be updated regularly to account for technological developments and changes in user requirements.
Links to other indicators
Terms of access to ECDL data unknown.
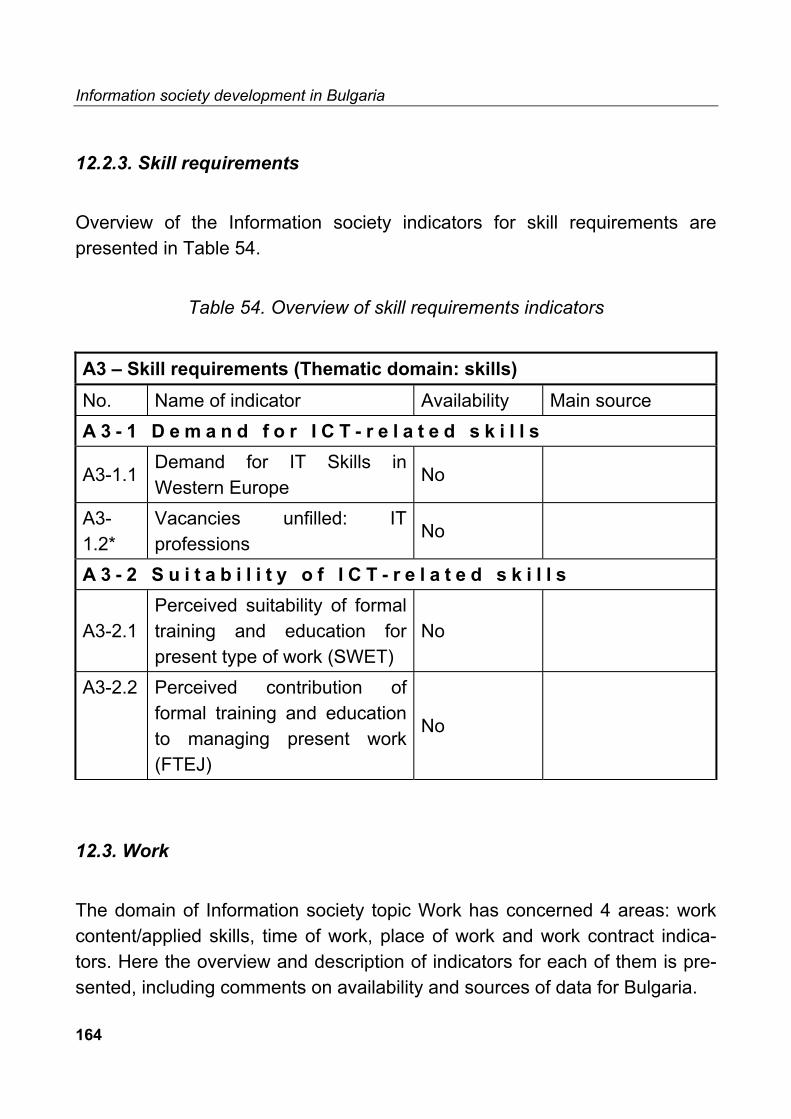
Information society development in Bulgaria
164
12.2.3. Skill requirements Overview of the Information society indicators for skill requirements are presented in Table 54.
Table 54. Overview of skill requirements indicators A3 – Skill requirements (Thematic domain: skills) No. Name of indicator Availability Main source A 3 - 1 D e m a n d f o r I C T - r e l a t e d s k i l l s
A3-1.1 Demand for IT Skills in Western Europe
No
A3-1.2*
Vacancies unfilled: IT professions
No
A 3 - 2 S u i t a b i l i t y o f I C T - r e l a t e d s k i l l s
A3-2.1 Perceived suitability of formal training and education for present type of work (SWET)
No
A3-2.2 Perceived contribution of formal training and education to managing present work (FTEJ)
No
12.3. Work The domain of Information society topic Work has concerned 4 areas: work content/applied skills, time of work, place of work and work contract indica-tors. Here the overview and description of indicators for each of them is pre-sented, including comments on availability and sources of data for Bulgaria.

Information society development in Bulgaria
165
12.3.1. Work content/applied skills
Overview (availability and Bulgarian sources of data) and description of Information society indicators for work content / applied skills are presented in following Table 55 and Table 56. They concern the state-of-the-art of organization of the work in contemporary conditions of penetration of ICT in all sectors of economic and social life.
Table 55. Overview of work content/ applied skills indicators B1 – Work content/applied skills (thematic domain: work organisation) No. Name of indicator Availability Main source B 1 - 1 W o r k i n g t o o l s B1-1.1 Use of computer for work yes Vitosha research B1-1.2* Use of IT working tools yes, similar The same B 1 - 2 W o r k i n g m e t h o d s B1-2.1 Learning organisation no B1-2.2* Collaboration no B1-2.3* Use of group work No B1-2.4 Cooperation between innovating
firms yes Consultancy firms
B1-2.5* Effects of ICTs on the way people work No
B 1 - 3 W o r k i n g t a s k s B1-3.1* Management responsibility No B1-3.2 Occupational changes no B 1 - 4 S e l f - d e t e r m i n a t i o n B1-4.1 Participative organisations No B1-4.2 Job autonomy no B1-4.3* Decision making rights no B1-4.4* Direct participation no B1-4.5 Independence at work no

Information society development in Bulgaria
166
Table 56. Description of work content/ applied skill indicators Name of indicator B1-1.1 Use of computer for work Definition Persons using a personal computer for work as
percentage of working population. Sources Vitosha research. Time series available 2002. e-Europe relevance 2b-4 - support greater flexibility in the workplace;
2b-x – general indicator for topic ‘Working in the knowledge based economy’.
Future value With the convergence of PCs with other appliances for office as well as personal use (e.g. PDAs, Laptops, mobile phones), measurement might become increasingly difficult.
Links See also indicators A1-3.7, A1-3.8, A1-3.9, A1-3.12. Name of indicator B1-2.4 Cooperation between innovating firms Definition Percentage of all innovative firms in the
manufacturing sector that co-operate with other firms (competitors, clients or customers, consultative enterprises, suppliers), or with universities or other higher education institutes, or with government or private non-profit research institutes. An innovative firm is defined as one that has introduced techno-logically new or improved products or services on the market, or technologically new or improved processes. The product should be new to the enterprise, but does not necessarily have to be new to the enterprise’s market. Innovation cooperation is defined as active participation in joint R&D and other innovation projects with other organisations. It does not necessarily imply that both partners derive immediate commercial benefit from the venture. Pure contracting out work, where there is no active participation, is not regarded as cooperation.
…

Information society development in Bulgaria
167
… Table 56. Description of work content/ applied skill indicators Notes Innovation in Bulgarian enterprises, 2000-2002. Sources Innovation Survey (Carried out according to the
methodology of Community Innovation Study). Time series available 2000- 2002. e-Europe relevance 2b-4 – support greater flexibility in the workplace. Future value Ensured.
Name of indicator B1-4.1 Participative organisations Definition Share of the employed labour force who can
participate in key decisions about the organisation of their work. "Within your workplace, are you able to discuss...? - Your working conditions in general; - The organisation of your work when changes take place. If ‘YES’, do these exchanges of views take place...?- With your colleagues; - With your superiors; - With staff representatives; - With outside experts; - On a regular basis; - On a formal basis." - Construction of composite indicator unclear.
Notes Q (in Working Life Barometer): If you are not satisfied with your working conditions, are you able to discuss about it or to make statement? Q (in Working Conditions Survey): If yes do these exchanges of views take place...? - With your superiors; - With employer; - With working environment specialist; - With working environment attorney; - Trade Union trustee; - With your colleagues; - Or you will take the steps yourself?
…

Information society development in Bulgaria
168
… Table 56. Description of work content/ applied skill indicators Sources Working Conditions Survey 2000, Working Life
Barometer 2002. Time series available 2000 & 2002 (from different surveys). e-Europe relevance 2b-4 – support greater flexibility in the workplace. Future value Ensured.
Name of indicator B1-4.2 Job autonomy Definition Share of the employed labour force who have
control over their work content; constructed of three questions: "Are you able, or not, to choose or change? Your order of tasks; Your methods of work; Your speed or rate of work. " Construction of composite indicator unclear.
Notes Q: To what extent can you influence: Your job tasks. Your work tempo. Totally, rather much, very little, not at all.
Sources Working Life Barometer 2002. Time series available 1998, 2002. e-Europe relevance 2b-4 – support greater flexibility in the workplace. Future value Ensured. Links to other indicators
Compare B1-4.5, B2-1.3.
12.3.2. Time of Work The time of work domain has focused on specific features of work organisation in Information society. More concretely they concern worker - centered and company – centered time flexibility, putting an accent on the voluntary part-time work, working time preferences, temporary autonomy, interest in sabbatical, shift work, and working long hours.

Information society development in Bulgaria
169
Table 57. Overview of time of work indicators
B2 – Time of Work (thematic domain: work organisation) No. Name of indicator Availability Main source B 2 - 1 W o r k e r - c e n t r e d t i m e f l e x i b i l i t y B2-1.1 Voluntary part-time work yes NSI B2-1.2* Working time preferences yes NSI B2-1.3 Temporal autonomy yes NSI B2-1.4* Interest in sabbatical no B 2 - 2 C o m p a n y - c e n t r e d t i m e f l e x i b i l i t y B2-2.1 Involuntary part-time work yes NSI B2-2.2 Irregular working times Yes NSI B2-2.3 Shiftwork Yes NSI B2-2.4 Working long hours Yes NSI
Table 58. Description of time of work indicators Name of indicator B2-1.1 Voluntary part-time work Definition Percentage of voluntary part-time workers of all
employed persons. Voluntary part-time workers are those who not give as reason for part-time job: “Could not find a full-time job”.
Notes Yes. Sources NSI. Time series available
Data available since 2001. For the years 1989-2000 data are possible to get from LFS databases.
e-Europe relevance 2b-4 - support greater flexibility in the workplace. Future value A definition which is independent from average
working hours that are ‘usual’ in countries/sectors should be found; different methodology needed.
Links Compare B2-2.1. …

Information society development in Bulgaria
170
…Table 58. Description of time of work indicators Name of indicator B2-1.3 Temporal autonomy Definition Share of the employed labour force who have control
over their working times; “For each of the following statements, please answer yes or no. - You can take your break when you wish. - You are free to decide when to take holidays or days off. - You can influence your working hours. - Do you work. - The same number of hours every day? - The same number of days every week? - Fixed starting and finishing times?” Construction of composite indicator unclear.
Notes Q (in LFS 2001): Who determines of work methods and schedule: determines himself; subordinate relationship. Q: Which is your working time arrangement? Fixed start and end of a working day; Working time banking; A minimum number of hours is fixed by contract; On-call work; Working time by mutual agreement; Determines his/her work schedule; no formal boundaries.
Sources MLSP. e-Europe relevance
2b-4 – support greater flexibility in the workplace.
Future value Use of a dichotomous scale (yes/no) might not be suitable for the subject.
Name of indicator B2-2.1 Involuntary part-time work Definition Part-time workers who give as reason for part-time
job:”Could not find a full-time job”, as percentage of all employed persons.
Sources MLSP. Time series Data available since 2001.
…

Information society development in Bulgaria
171
…Table 58. Description of time of work indicators e-Europe relevance 2b-4 - support greater flexibility in the workplace Future value A definition, which is independent from average
working hours that are ‘usual’ in countries/sectors, should be found; different methodology needed.
Links to other indicators
Compare B2-1.1.
Name of indicator B2-2.2 Irregular working times Definition Working in the evening, at night, on Saturday and/or
Sunday; working shifts. Sources MLSP. Time series available
Data available since 2001.
e-Europe relevance
2b-4 - support greater flexibility in the workplace.
Future value Ensured. Name of indicator B2-2.3 Shift work Definition Percentage of persons in employment who usually
work in shifts. “Do you work shifts? IF ‘YES’, do you work...(ONE ANSWER ONLY): (a) split shifts (with a break of at least 4 hours in between); (b) permanent night shifts; (c) permanent afternoon shifts; (d) permanent morning shifts; (e) alternating morning and afternoon shifts; (f) alternating day and night shifts; (g) alternating morning/afternoon/night shifts; (h) other (SPONTANEOUS)”.
…

Information society development in Bulgaria
172
…Table 58. Description of time of work indicators Notes Q (in LFS 2003): Which is your usual working
schedule: - day shift (between 6a.m. and 6p.m.); - afternoon/night shift (between 6p.m. and 6a.m.); - alternating day and night shifts; - alternating long working days and free days; - free day according to the need; - other. Q (in Living Conditions Survey): Which work schedule best describes your situation: - normal day shift (between 6 a.m.-6 p.m.); - work normally outside regular hours (between 6 p.m. – 6 a.m.); - rotation; Other.
Sources MLSP. Time series 2000, 2001, 2002. e-Europe relevance 2b-4 – support greater flexibility in the workplace. Future value Ensured.
Name of indicator B2-2.4 Working long hours Definition Percentage of persons in employment who usually
work more than 40 hours per week. Sources MLSP. Time series available Data available since 2001. e-Europe relevance 2b-4 – support greater flexibility in the workplace.. Future value Ensured.
12.3.3. Place of work The place of work indicators, which also characterize work organisation in the Information society, are divided into 2 groups: telework (general, home-based, centre-based and mobile) and tele-cooperatrion (See: Table 59.).
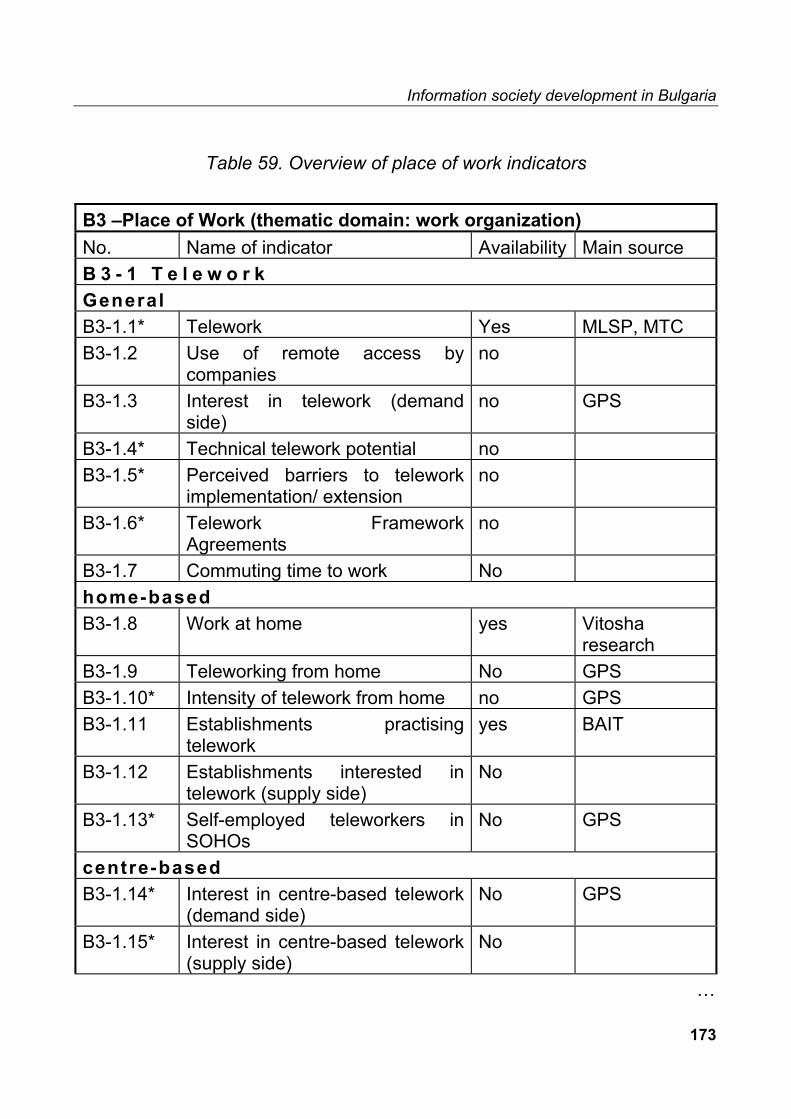
Information society development in Bulgaria
173
Table 59. Overview of place of work indicators
B3 –Place of Work (thematic domain: work organization) No. Name of indicator Availability Main source B 3 - 1 T e l e w o r k General B3-1.1* Telework Yes MLSP, MTC B3-1.2 Use of remote access by
companies no
B3-1.3 Interest in telework (demand side)
no GPS
B3-1.4* Technical telework potential no B3-1.5* Perceived barriers to telework
implementation/ extension no
B3-1.6* Telework Framework Agreements
no
B3-1.7 Commuting time to work No home-based B3-1.8 Work at home yes Vitosha
research B3-1.9 Teleworking from home No GPS B3-1.10* Intensity of telework from home no GPS B3-1.11 Establishments practising
telework yes BAIT
B3-1.12 Establishments interested in telework (supply side)
No
B3-1.13* Self-employed teleworkers in SOHOs
No GPS
centre-based B3-1.14* Interest in centre-based telework
(demand side) No GPS
B3-1.15* Interest in centre-based telework (supply side)
No
…

Information society development in Bulgaria
174
…Table 59. Overview of place of work indicators Mobile B3-1.16* Mobile computing No GPS B3-1.17* Mobile telework No GPS B3-1.18* Establishments practising mobile
work No
B3-1.19* Establishments practising mobile telework
No
B 3 - 2 T e l e - c o o p e r a t i o n B3-2.1* Tele-cooperation (inter-company) No GPS B3-2.2* Tele-cooperation (intra-company) No GPS B3-2.3* "e-Work" within the organisation
(EMERGENCE definition) No
B3-2.4* Outsourced "e-Work" (EMERGENCE definition)
No
B3-2.5* Supply of outsourced "e-Work" services (EMERGENCE definition)
No
More concretely the content of the place of work indicators for benchmarking Information society development are presented in the next Table 60.
Table 60. Description of place of work indicators
Name of indicator B3-1.7 Commuting time to work Definition Average time spent commuting per week.
“In total, how many minutes per day do you normally spend traveling from home to work and back?"
eEurope relevance 2b-4 – support greater flexibility in the workplace. Future value Ensured, as long as there is a ‘main place of work’. Links to other indicators
Broken down by sex and way of going to work. Could be interpreted as an indicator measuring outcome from the introduction of telework; or measuring demand for telecommuting.
…

Information society development in Bulgaria
175
…Table 60. Description of place of work indicators Name of indicator B3-1.8 Work at home Definition See notes in European Commission 2000lfs: 11-12. Notes Q: How far does your working place locate from your
residence? km, works at home. Sources MLSP. Time series available 2001. e-Europe relevance 2b-4 – support greater flexibility in the workplace. Future value Definition may have to be adapted. Links to other indicators
Broken down by sex.
Name of indicator B3-1.11 Establishments practising telework Definition Share of establishments practising telework;
“Establishments with teleworkers are those that have staff who work at a distance from thepremises of their employer; use computers in their work; transmit work results using telecommunications. Teleworkers can be: - Permanent teleworkers who spend nearly all their working time at home; - Alternating teleworkers who spend only part of their working time at home, but at least one full working day per week; - Supplementary teleworkers who spend not their regular working time at home but do additional work and preparation teleworking at home; - Self-employed teleworkers who work either for the respondent’s organisation only or for other organisations as well.”
Notes Share of establishments practicing telework . Sources MLSP, NSI. Time series available 2002. e-Europe relevance 2b-4 – support greater flexibility in the workplace.
…

Information society development in Bulgaria
176
…Table 60. Description of place of work indicators Name of indicator B3-1.12 Establishments interested in telework
(supply side) Definition Share of establishments that are interested in
implementing/extending telework and that have concrete plans to do so in the next 1-2 years; “Establishments with teleworkers are those that have staff who - work at a distance from the premises of their employer; - use computers in their work; transmit work results using telecommunications. Teleworkers can be Permanent teleworkers who spend nearly all their working time at home. Alternating teleworkers who spend only part of their working time at home, but at least one full working day per week. Supplementary teleworkers who spend not their regular working time at home but do additional work and preparation teleworking at home. Self-employed teleworkers who work either for the respondent’s organisation only or for other organisations as well.”
Notes Share of establishments that are interested in implementing/extending telework in near future, % of enterprises.
Sources Survey Vitosha research. Time series available 2002. e-Europe relevance 2b-4 – support greater flexibility in the workplace. Future value Indicator needs to be adapted in time to account for
differences in the understanding of ‘telework’ as a concept; with the further spread of remote access technology, this indicator might become unworkable.
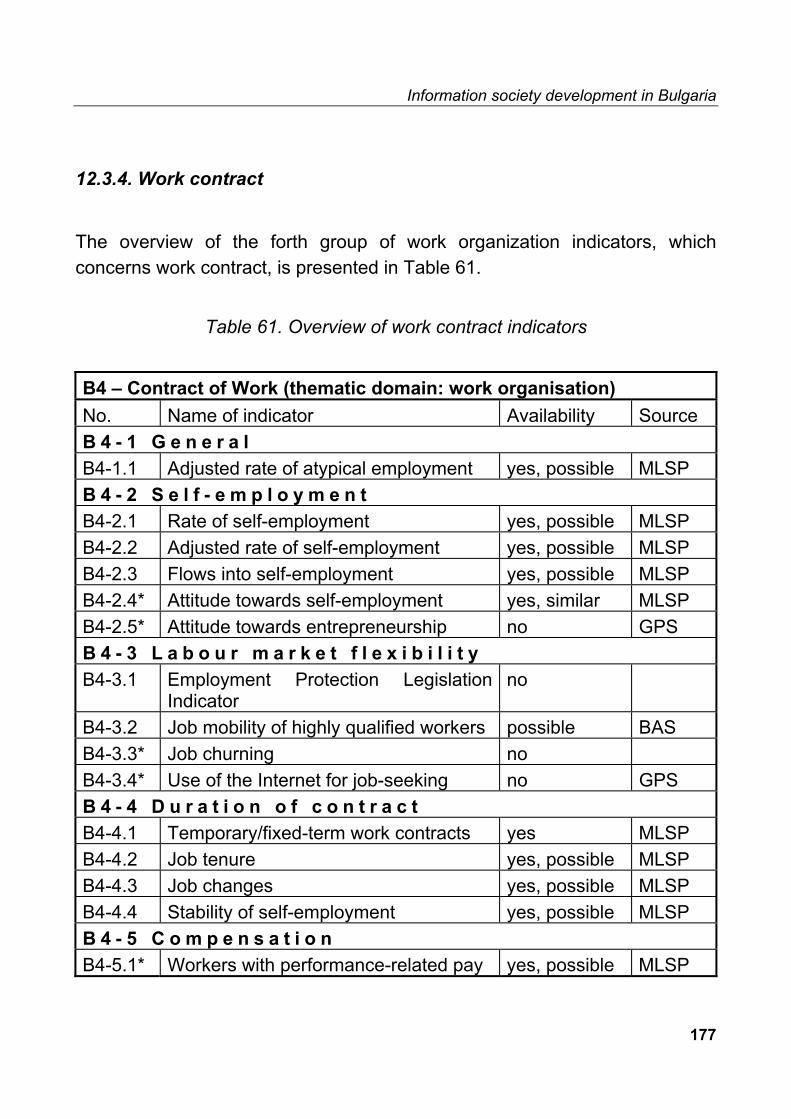
Information society development in Bulgaria
177
12.3.4. Work contract
The overview of the forth group of work organization indicators, which concerns work contract, is presented in Table 61.
Table 61. Overview of work contract indicators
B4 – Contract of Work (thematic domain: work organisation) No. Name of indicator Availability Source B 4 - 1 G e n e r a l B4-1.1 Adjusted rate of atypical employment yes, possible MLSP B 4 - 2 S e l f - e m p l o y m e n t B4-2.1 Rate of self-employment yes, possible MLSP B4-2.2 Adjusted rate of self-employment yes, possible MLSP B4-2.3 Flows into self-employment yes, possible MLSP B4-2.4* Attitude towards self-employment yes, similar MLSP B4-2.5* Attitude towards entrepreneurship no GPS B 4 - 3 L a b o u r m a r k e t f l e x i b i l i t y B4-3.1 Employment Protection Legislation
Indicator no
B4-3.2 Job mobility of highly qualified workers possible BAS B4-3.3* Job churning no B4-3.4* Use of the Internet for job-seeking no GPS B 4 - 4 D u r a t i o n o f c o n t r a c t B4-4.1 Temporary/fixed-term work contracts yes MLSP B4-4.2 Job tenure yes, possible MLSP B4-4.3 Job changes yes, possible MLSP B4-4.4 Stability of self-employment yes, possible MLSP B 4 - 5 C o m p e n s a t i o n B4-5.1* Workers with performance-related pay yes, possible MLSP
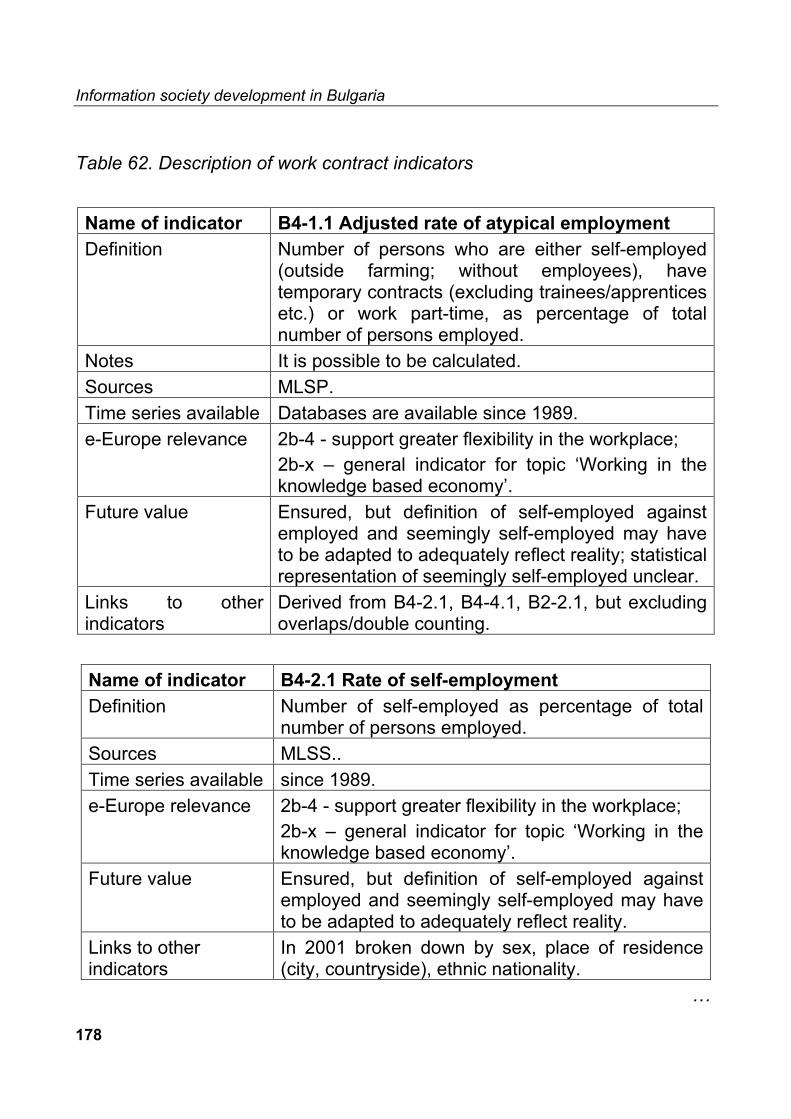
Information society development in Bulgaria
178
Table 62. Description of work contract indicators Name of indicator B4-1.1 Adjusted rate of atypical employment Definition Number of persons who are either self-employed
(outside farming; without employees), have temporary contracts (excluding trainees/apprentices etc.) or work part-time, as percentage of total number of persons employed.
Notes It is possible to be calculated. Sources MLSP. Time series available Databases are available since 1989. e-Europe relevance 2b-4 - support greater flexibility in the workplace;
2b-x – general indicator for topic ‘Working in the knowledge based economy’.
Future value Ensured, but definition of self-employed against employed and seemingly self-employed may have to be adapted to adequately reflect reality; statistical representation of seemingly self-employed unclear.
Links to other indicators
Derived from B4-2.1, B4-4.1, B2-2.1, but excluding overlaps/double counting.
Name of indicator B4-2.1 Rate of self-employment Definition Number of self-employed as percentage of total
number of persons employed. Sources MLSS.. Time series available since 1989. e-Europe relevance 2b-4 - support greater flexibility in the workplace;
2b-x – general indicator for topic ‘Working in the knowledge based economy’.
Future value Ensured, but definition of self-employed against employed and seemingly self-employed may have to be adapted to adequately reflect reality.
Links to other indicators
In 2001 broken down by sex, place of residence (city, countryside), ethnic nationality.
…
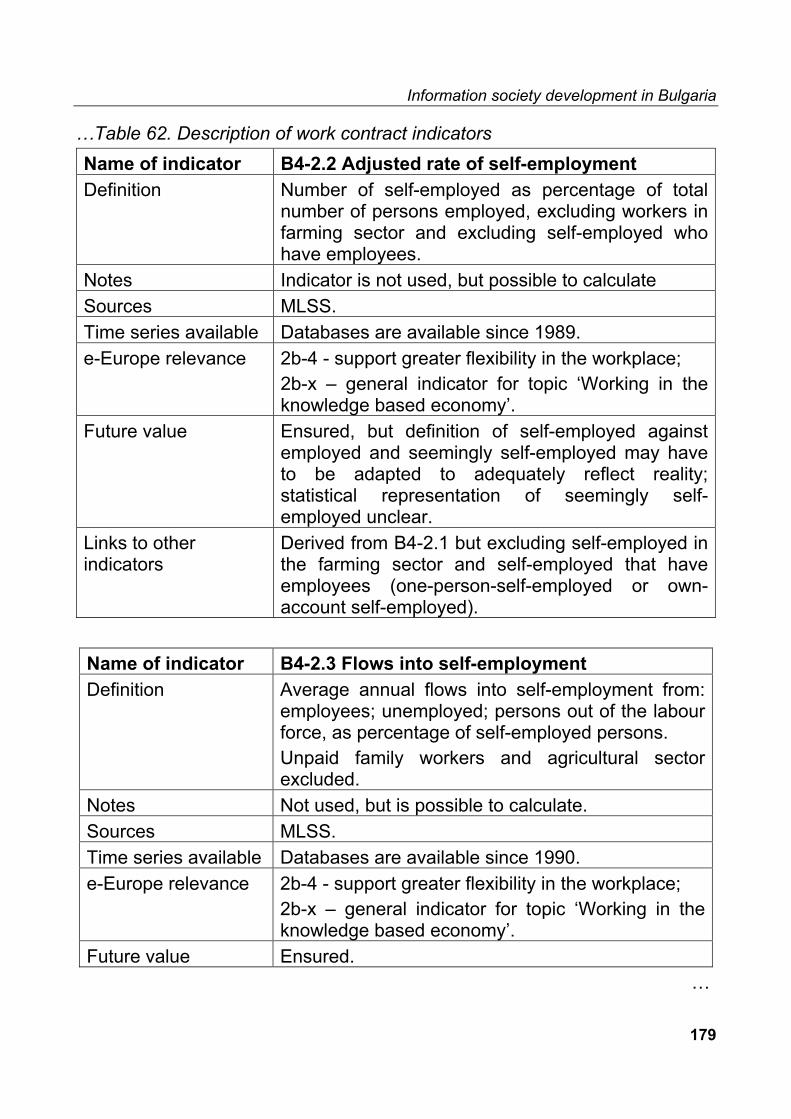
Information society development in Bulgaria
179
…Table 62. Description of work contract indicators Name of indicator B4-2.2 Adjusted rate of self-employment Definition Number of self-employed as percentage of total
number of persons employed, excluding workers in farming sector and excluding self-employed who have employees.
Notes Indicator is not used, but possible to calculate Sources MLSS. Time series available Databases are available since 1989. e-Europe relevance 2b-4 - support greater flexibility in the workplace;
2b-x – general indicator for topic ‘Working in the knowledge based economy’.
Future value Ensured, but definition of self-employed against employed and seemingly self-employed may have to be adapted to adequately reflect reality; statistical representation of seemingly self-employed unclear.
Links to other indicators
Derived from B4-2.1 but excluding self-employed in the farming sector and self-employed that have employees (one-person-self-employed or own-account self-employed).
Name of indicator B4-2.3 Flows into self-employment Definition Average annual flows into self-employment from:
employees; unemployed; persons out of the labour force, as percentage of self-employed persons. Unpaid family workers and agricultural sector excluded.
Notes Not used, but is possible to calculate. Sources MLSS. Time series available Databases are available since 1990. e-Europe relevance 2b-4 - support greater flexibility in the workplace;
2b-x – general indicator for topic ‘Working in the knowledge based economy’.
Future value Ensured. …

Information society development in Bulgaria
180
…Table 62. Description of work contract indicators Name of indicator B4-3.2 Job mobility of highly qualified workers Definition Share of employed highly qualified people who
have changed job since the previous year, either by changing function, position, occupation or enterprise. Highly qualified personnel are defined as those who fulfill one or other of the following conditions: - successfully completed education at ISCED 6
and 7 according to ISCED (1976 version) or - ISCED 5A and 6 according to the 1997 version; - not formally qualified as above but employed in
an S&T occupation (only professionals, ISCO 2) where the above qualifications are normally required.
Notes Not used, but is possible to calculate. Sources MLSP,MES. Time series available Databases are available since 1990. e-Europe relevance 2b-4 - support greater flexibility in the workplace. Future value Ensured.
Name of indicator B4-4.1 Temporary/fixed-term work contracts Definition Temporary workers as percentage for total
employees; “In the majority of Member States, most jobs are based on written work contracts. In some countries, however, contracts of this type are concluded only in specific cases [...]. Given these institutional discrepancies the concepts of “temporary employment” and “work contract of limited duration describe situations which, in different institutional contexts, may be considered similar. A job may be considered temporary if employer and employee agree that its end is determined by objective conditions such as a specific date, the completion of a task or the return of another employee who has been temporarily replaced.

Information society development in Bulgaria
181
Where there is a work contract of limited duration, it usually states the terms of the end of the contract. The following belong to these categories: persons with seasonal employment; persons engaged by an agency or employment exchange and hired to a third party to perform a specific task (unless there is a written work contract of unlimited duration with the agency or employment exchange); persons with specific training contracts. If there are no objective criteria for the end of a job or work contract, this should be considered permanent or of unlimited duration.”
Notes Q: Did you work in this enterprise/organisation under - fixed employment contract; - temporary employment contract; - according to verbal contract?
Sources Labour Force Survey. Time series available Databases are available since 1989. e-Europe relevance 2b-4 - support greater flexibility in the workplace;
2b-x – general indicator for topic ‘Working in the knowledge based economy’.
Future value Ensured. Links to other indicators
The data can be broken down by sex, reason for holding a temporary work contract (contract for training, voluntary, involuntary).
Name of indicator B4-4.2 Job tenure Definition Average job tenure (no information on exact
definition). Notes The length of time workers has been in their current
job or with their current employer. No numbers available, but is possible to calculate on the basis of MLSS data.
Sources Labour Force Survey. …

Information society development in Bulgaria
182
…Table 62. Description of work contract indicators Time series available Databases for calculations are available since 1989 e-Europe relevance 2b-x – general indicator for topic ‘Working in the
knowledge based economy’. Future value Ensured.
Name of indicator B4-4.3 Job changes Definition Percentage of employees (exclusive of persons in
apprenticeship) who changed their job during the last 12 months.
Notes No numbers available, but is possible to calculate on the basis of MLSP data.
Sources Labour Force Survey. Time series available Databases for calculations are available since 1990 e-Europe relevance 2b-x – general indicator for topic ‘Working in the
knowledge based economy’. Future value Ensured; but unclear whether “job” is defined clear
enough.
Name of indicator B4-4.4 Stability of self-employment Definition Percentage of persons who were in the same
employment status a year earlier, by current employment status (own-account self-employed, employer, employee). Unpaid family workers and agricultural sector excluded.
Notes Is possible to calculate on the basis of MLSSdata. Sources Labour Force Survey. Time series available Databases for calculations are available since 1990 e-Europe relevance 2b-4 - support greater flexibility in the workplace;
2b-x – general indicator for topic ‘Working in the knowledge based economy’.
Future value Ensured.
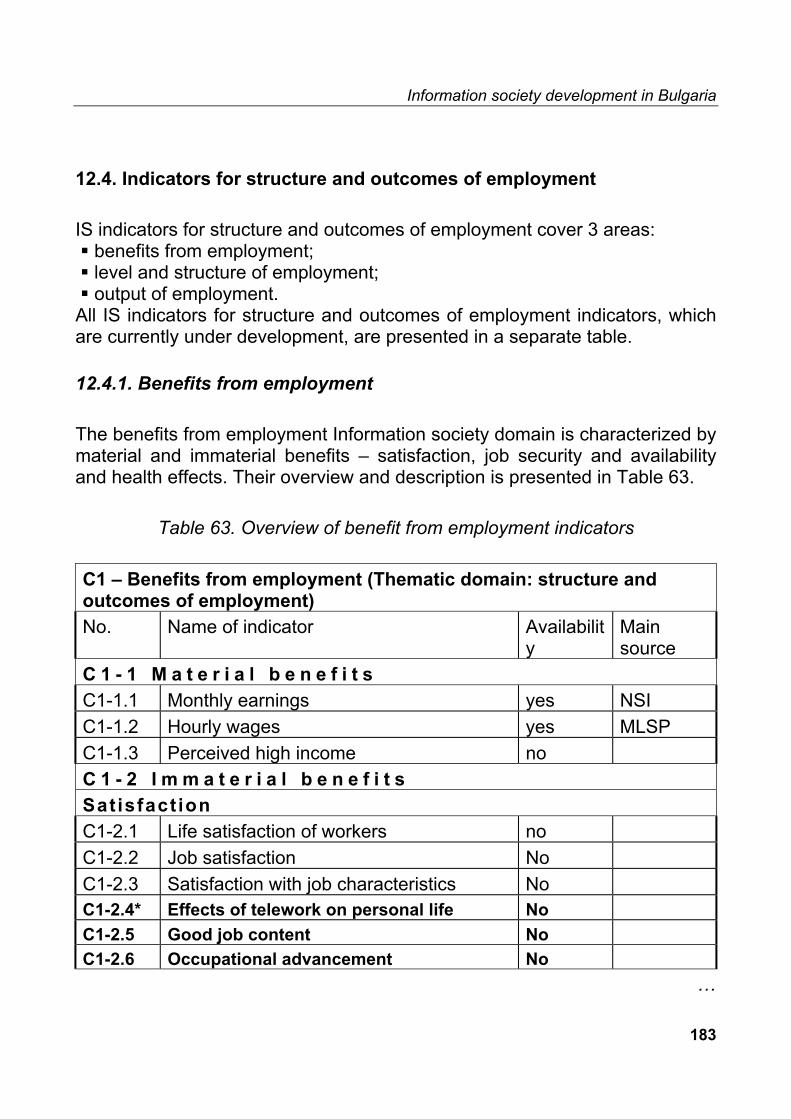
Information society development in Bulgaria
183
12.4. Indicators for structure and outcomes of employment IS indicators for structure and outcomes of employment cover 3 areas: benefits from employment; level and structure of employment; output of employment.
All IS indicators for structure and outcomes of employment indicators, which are currently under development, are presented in a separate table. 12.4.1. Benefits from employment The benefits from employment Information society domain is characterized by material and immaterial benefits – satisfaction, job security and availability and health effects. Their overview and description is presented in Table 63.
Table 63. Overview of benefit from employment indicators C1 – Benefits from employment (Thematic domain: structure and outcomes of employment) No. Name of indicator Availabilit
y Main source
C 1 - 1 M a t e r i a l b e n e f i t s C1-1.1 Monthly earnings yes NSI C1-1.2 Hourly wages yes MLSP C1-1.3 Perceived high income no C 1 - 2 I m m a t e r i a l b e n e f i t s Satisfact ion C1-2.1 Life satisfaction of workers no C1-2.2 Job satisfaction No C1-2.3 Satisfaction with job characteristics No C1-2.4* Effects of telework on personal life No C1-2.5 Good job content No C1-2.6 Occupational advancement No
…

Information society development in Bulgaria
184
…Table 63. Overview of benefit from employment indicators Job security and avai labi l i ty C1-2.7 Individual perception of job security No C1-2.8 Individual perception of personal job
situation No
C1-2.9 Subjective assessment of labour market opportunities
No
C1-2.10 Discouraged workers No Health effects C1-2.11*
Occupational diseases yes, similar
MLSP
C1-2.12 Job-related health complaints yes, similar
MLSP
C1-2.13 Absence due to job-related health complaints
no
C1-2.14 Hard work no
The description of the benefits from employment information society indicators is presented in Table 64.
Table 64. Description of benefit from employment indicators Name of indicator C1-1.1 Monthly earnings Definition Average gross monthly earnings of
- non-manual workers in industry; - manual workers in the manufacturing industry; - in purchasing power parities.
Notes Not exactly the same indicator. Sources NSI, MLSP. Time series available since 1995. e-Europe relevance 2b-x – general indicator for topic ‘Working in the
knowledge based economy’. Future value Ensured. Links Breakdowns available for men and women.
…

Information society development in Bulgaria
185
… Table 64. Description of benefit from employment indicators Name of indicator C1-1.2 Hourly wages Definition Average gross hourly earnings in industry and
services. Sources Survey “Hourly Wages” (NSI). Time series available since 2000 by quarters. e-Europe relevance General relevance for measuring wealth
development in ICT industries. Future value Ensured. Links to other indicators
Data are broken down according to NACE Rev.1 (Statistical classification of economic activities in the European community), including all sections and sub-sections plus a number of divisions.
Name of indicator C1-2.2 Job satisfaction Definition Mean on a scale from 1 = “not satisfied at all” to 6 =
“fully satisfied”. Notes Q: How satisfied are you with your present job?
-very satisfied; -somewhat satisfied; -not very satisfied; -not at all satisfied.
Sources MLSS. Time series available 1998, 2002. e-Europe relevance 2b-x – general indicator for topic ‘Working in the
knowledge based economy’. Future value Ensured. Links to other indicators
Possibilities to break down data to construct indicators on gender differences.
Name of indicator C1-2.7 Individual perception of job security Definition Percentage of employed who “strongly agree” or
“agree” to the statement “my job is secure” (remaining answer categories: neither agree nor disagree, disagree, strongly disagree).
…

Information society development in Bulgaria
186
… Table 64. Description of benefit from employment indicators Notes Q Do you consider it is possible that in the next year
you will lose your current job? Certainly yes, probably yes, probably not, certainly not
Sources MLSP Time series available 1998, 2002 e-Europe relevance 2b-x – general indicator for topic ‘Working in the
knowledge based economy’ Future value Ensured Links to other indicators
Possibilities to break down data to construct indicators on gender differences.
Name of indicator C1-2.9 Subjective assessment of labour market
opportunities Definition Percentage of people considering it “very easy” or
“fairly easy” to find an acceptable job if they were looking actively (remaining answer categories: neither easy nor difficult, fairly difficult, very difficult)
Notes Q: If you would lose your present job, do you think you would find a new one that suites to your skills and experiences? certainly yes, probably yes, probably not, certainly not
Sources MLSP Time series available 1998, 2002 e-Europe relevance 2b-x – general indicator for topic ‘Working in the
knowledge based economy’ Future value Ensured Links to other indicators
Possibilities to break down data to construct indicators on gender differences
Name of indicator C1-2.10 Discouraged workers Definition Proportion of inactive population who would like to
work but think no job is available; Sources MLSP Time series available since 1989.
…

Information society development in Bulgaria
187
…Table 64. Description of benefit from employment indicators e-Europe relevance 2b-x – general indicator for topic ‘Working in the
knowledge based economy’. Future value Ensured.
Name of indicator C1-2.12 Job-related health complaints Definition Percentage of employees reporting at least one of
the following health problems caused by their job: ear problems, eye problems, skin problems, backache, headaches, stomach ache, muscular pain in arms or legs, respiratory problems, allergies, heart disease.
Notes Special questions about occupational diseases were in MLSS2002.
Sources Labour Force Survey . Time series available 2002. e-Europe relevance 2b-x – general indicator for topic ‘Working in the
knowledge based economy’. Future value Ensured.
12.4.2. Level and structure of employment
The next group of Information society indicators is those of level and structure
of employment indicators. It focuses on overall employment and specific
sectors and occupation, which concern Information society development in a
country. The unemployment indicators are focused on potential for increasing
employees, stressing attention on job seekers and labour reserve rate. The
overview of level and structure of employment indicators is presented in
Table 65, and their description – in Table 66.

Information society development in Bulgaria
188
Table 65. Overview of level and structure of employment indicators
C2 – Level and structure of employment (Thematic domain: structure and outcomes of employment) No. Name of indicator Availability Main source C 2 - 1 O v e r a l l e m p l o y m e n t C2-1.1 Total employment rate yes MLSP C2-1.2 Total employment rate (full-time
equivalents) yes MLSP
C2-1.3 Employment rate of women yes MLSP C2-1.4 Employment rate of older people yes MLSP C2-1.5* Absolute employment gap yes MLSP C2-1.6 Employment impact of
parenthood yes MLSP
C2-1.7 Employment rates of mothers with child(ren) aged under 6
yes MLSP
C2-1.8 Employment rate of lone-parents with child(ren) aged under 6
yes MLSP
C 2 - 2 S e c t o r s a n d o c c u p a t i o n s C2-2.1 Employment in the ICT sector no C2-2.2 Share and growth of employment
in the Information Society, high-tech and knowledge-intensive sectors
similar 2002 Innovation European Scoreboard
C2-2.3 Rate of employment in SMEs yes, possible MLSP, MTC, ME C2-2.4 Employment in very small and
small enterprises yes, possible MLSP
C2-2.5* “Gazelle” jobs no C2-2.6 Rate and share of employment in
services yes MLSP
C2-2.7* Index of gender segregation in sectors
yes, possible MLSP
C2-2.8* Index of gender segregation in occupations
yes, possible MLSP
C 2 - 3 U n e m p l o y m e n t C2-3.1 Total unemployment rate yes MLSP C2-3.2 Time-related underemployment yes, similar MLSP
…

Information society development in Bulgaria
189
…Table 65. Overview of level and structure of employment indicators C2-3.3 Invisible underemployment not used, but
possible MLSP
C2-3.4 Re-employment rate not used, but possible
MLSP
C2-3.5 Job seekers not used, but possible
MLSP
C2-3.6 Labour reserve rate not used, but possible
MLSP
Table 66. Description of level and structure of employment indicators Name of indicator C2-1.1 Total employment rate Definition Persons in employment in age bracket 15-64 years
as proportion (%) of total population in the same age bracket.
Sources Labour Force Survey. Time series available since 1989. e-Europe relevance 2b-x – general indicator for topic ‘Working in the
knowledge based economy’. Future value Ensured. Links to other indicators
To be broken down in gender; age brackets (15-24, 25-49, 50-69, 50-74, 16-until pension age, 15-64, 15-69, 15-74).
Name of indicator C2-1.2 Total employment rate (full-time equivalents)
Definition Total hours worked divided by the average annual number of hours worked in full-time jobs, calculated as a proportion of total population in the 15-64 age bracket (%).
Notes Is possible to calculate. Sources Labour Force Survey. Time series available since 1989. e-Europe relevance 2b-x - general indicator for topic ‘Working in the
knowledge based economy’. …

Information society development in Bulgaria
190
…Table 66. Description of level and structure of employment indicators Future value Ensured as long as there is distinction between full-
time and part-time jobs is maintained. Links to other indicators
To be broken down in gender; age (brackets 15-24, 25-54, 55-64).
Name of indicator C2-1.3 Employment rate of women Definition Women in employment in age bracket 15-64 years
as proportion (%) of total population in the same age bracket.
Notes From MLSP. Sources Labour Force Survey. Time series available since 1989. e-Europe relevance 2b-x – general indicator for topic ‘Working in the
knowledge based economy’. Future value Ensured.
Name of indicator C2-1.4 Employment rate of older people Definition Persons in employment in age bracket 55-64 years
as proportion (%) of total population in the same age bracket.
Notes Is possible to calculate for different age groups. Sources Labour Force Survey. Time series available since 1989. e-Europe relevance 2b-x – general indicator for topic ‘Working in the
knowledge based economy’. Future value Ensured. Name of indicator C2-1.6 Employment impact of parenthood Definition The absolute difference in employment rates without
the presence of any children and with the presence of a child aged 0-6 (age group 20-50)
Notes This indicator is not used, but is possible to calculateSources Labour Force Survey. Time series available 1995, since 1997. e-Europe relevance 2b-4 – support greater flexibility in the workplace.
…

Information society development in Bulgaria
191
…Table 66. Description of level and structure of employment indicators Future value Ensured. Links to other indicators
Broken down by sex; Indicator for gender gap in the employment impact of parenthood.
Name of indicator C2-1.7 Employment rates of mothers with
child(ren) aged under 6 Definition Employment rates of mothers in families with
child(ren) aged under 6. Includes only families with no-one aged over 60. Multi-family households excluded.
Notes This indicator is not used, but is possible to calculateSources Labour Force Survey. Time series available 1995, since 1997. e-Europe relevance 2b-x – general indicator for topic ‘Working in the
knowledge based economy’. Future value Ensured.
Name of indicator C2-1.8 Employment rate of lone-parents with child(ren) aged under 6
Definition Employment. rate of lone-parents with child(ren) aged under 6. Includes only families with no-one aged over 60. Multi-family households excluded.
Notes This indicator is not used, but is possible to be calculated.
Sources Labour Force Survey. Time series available 1995, since 1997. e-Europe relevance 2b-x – general indicator for topic ‘Working in the
knowledge based economy’. Future value Ensured.
…

Information society development in Bulgaria
192
… Table 66. Description of level and structure of employment indicators Name of indicator C2-2.2 Share and growth of employment in the
Information Society, high-tech and knowledge-intensive sectors
Definition High-tech sectors: aerospace, computers and office machinery, electronics - communications, pharma-ceuticals, scientific instruments, motor vehicles, electrical machinery, chemicals, other transport equipment and non-electrical machinery. Knowledge intensive services: communication services (post and telecommunications, software, media, Internet…), financing, insurance, real estate and business services (including consulting and R&D), community, social and personal services (including education and health); Information Society sector: the above sectors plus IT manufacturing (see ESDIS 2001).
Notes Employment in high-tech services (% of total workforce).
Sources 2002 European Innovation Scoreboard. Time series available 2001. e-Europe relevance 2b-x – general indicator for topic ‘Working in the
knowledge based economy’. Future value Definition of high-tech and knowledge-intensive may
need to be adapted. “Using the highly aggregated 2 digit level of the NACE (or ISIC) classification does not allow a fine distinction between those services that may be highly knowledge intensive and those which are not. Further improvements in the classification of these services will be necessary.”
Name of indicator C2-2.3 Rate of employment in SMEs Definition Persons employed in SMEs as percentage of total
number of persons employed, by sex. Notes Q: (in LFS) How many persons were employed at
this enterprise / organisation? 1-10, 11-19, 20-49, 50-99, 100-199, 200-499, 500-999, more than 1000.

Information society development in Bulgaria
193
… Table 66. Description of level and structure of employment indicators Sources MLSS, ASME. Time series available Since 1989. e-Europe relevance 2b-x - general indicator for topic ‘Working in the
knowledge based economy’. Name of indicator C2-2.4 Employment in very small and small
enterprises Definition Persons employed in non-agricultural enterprises
with 0-9 employees (very small) or 10-49 employees (small) as a percentage of the total population currently employed in non-agricultural enterprises.
Notes Is possible to calculate. Sources MLSS. Time series available 1995, since 1997. e-Europe relevance 2b-4 – support greater flexibility in the workplace
2b-x – general indicator for topic ‘Working in the knowledge based economy’.
Future value Ensured. Name of indicator C2-2.6 Rate and share of employment in servicesDefinition Percentage of persons employed in services
between 15-64 out of total population in the same age bracket; Percentage of persons employed in services out of total number of persons employed.
Sources MLSP. Time series available since 1989. e-Europe relevance 2b-x – general indicator for topic ‘Working in the
knowledge based economy’. Future value Ensured, but definition of service sector employment
may have to be adapted to adequately reflect reality.Links Broken down by sex.
…

Information society development in Bulgaria
194
… Table 66. Description of level and structure of employment indicators Name of indicator C2-3.1 Total unemployment rate Definition Total unemployed individuals (ILO definition) as a
share of total active population. Notes Labour Force 2001”. Sources MLSP. Time series available Since 1989. e-Europe relevance 2b-x – general indicator for topic ‘Working in the
knowledge based economy’. Future value Ensured.
Name of indicator C2-3.2 Time-related underemployment Definition Involuntary part-time and temporary short-time.
The original definition of time-related underemployment, according to the 16th International Conference of Labour Statisticians (ICLS) 1998, "comprises all persons aged 15 and over who: (a) during the reference week were willing to work additional hours, to work additional hours means that they wanted another job in addition to their current job (s), wanted another job with more hours instead of their current job or wanted to increase the total number of hours worked in their current job(s); (b) were available to work additional hours within a period corresponding with the usual term of notice, given opportunities for additional work and (c) during the reference week worked actually less than a threshold relating to working time. Because data according to this definition will be available only from 2001 onwards, a proxy measure is used. This proxy measure consists of involuntary part-time employment and temporary short-time employment (number of hours actually worked in the reference week is less than normal due to economic of technical reasons).”
…
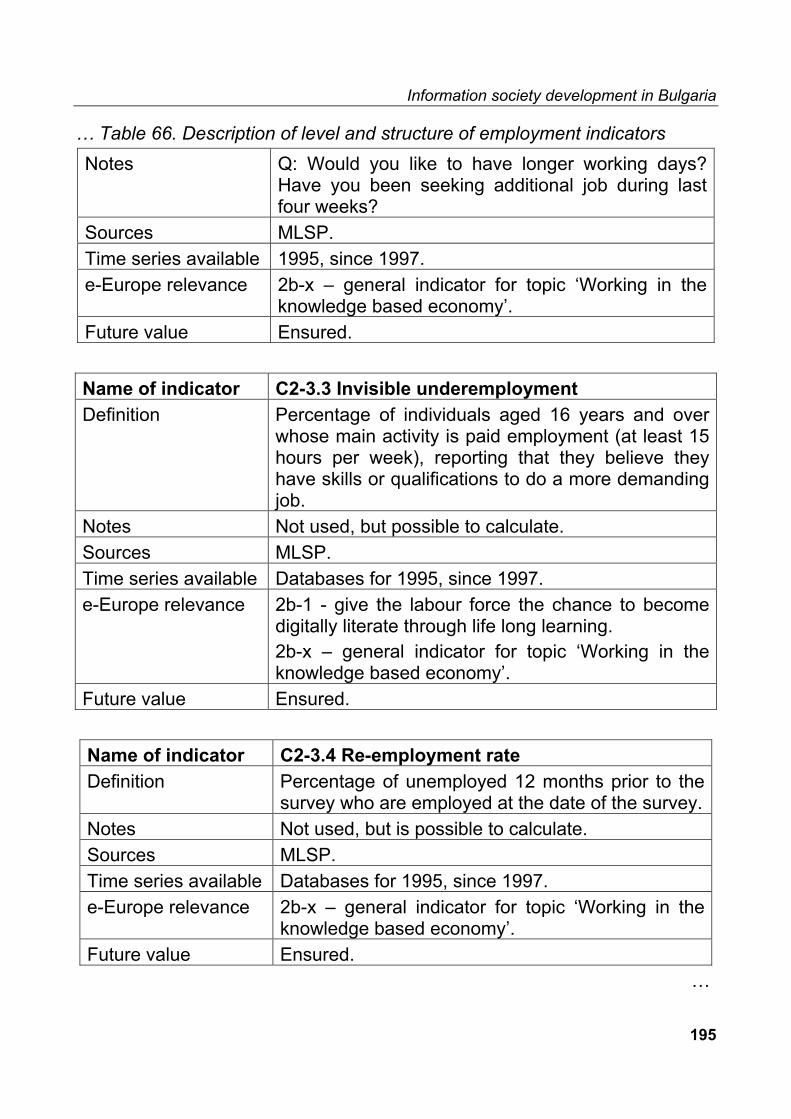
Information society development in Bulgaria
195
… Table 66. Description of level and structure of employment indicators Notes Q: Would you like to have longer working days?
Have you been seeking additional job during last four weeks?
Sources MLSP. Time series available 1995, since 1997. e-Europe relevance 2b-x – general indicator for topic ‘Working in the
knowledge based economy’. Future value Ensured.
Name of indicator C2-3.3 Invisible underemployment Definition Percentage of individuals aged 16 years and over
whose main activity is paid employment (at least 15 hours per week), reporting that they believe they have skills or qualifications to do a more demanding job.
Notes Not used, but possible to calculate. Sources MLSP. Time series available Databases for 1995, since 1997. e-Europe relevance 2b-1 - give the labour force the chance to become
digitally literate through life long learning. 2b-x – general indicator for topic ‘Working in the knowledge based economy’.
Future value Ensured.
Name of indicator C2-3.4 Re-employment rate Definition Percentage of unemployed 12 months prior to the
survey who are employed at the date of the survey.Notes Not used, but is possible to calculate. Sources MLSP. Time series available Databases for 1995, since 1997. e-Europe relevance 2b-x – general indicator for topic ‘Working in the
knowledge based economy’. Future value Ensured.
…

Information society development in Bulgaria
196
… Table 66. Description of level and structure of employment indicators Name of indicator C2-3.5 Job seekers Definition Percentage of currently not employed or marginally
employed (less than 10 hours/week) persons aged less than 60 years who are “currently looking for a job”.
Notes Not used, but is possible to calculate. Sources MLSP. Time series available Databases since 1989. e-Europe relevance 2b-x – general indicator for topic ‘Working in the
knowledge based economy’. Future value Ensured; but unclear whether “job” is defined clear
enough. Name of indicator C2-3.6 Labour reserve rate Definition All non-participants (persons outside the labour
force) between 15 and 64 who want a job (including passive job seekers) and are available. The reference population for the labour reserve is the working age population because changes in the labour reserve rate will depend only on flows in or out the labour reserve (the numerator).
Notes Not used, but is possible to calculate. Sources MLSP. Time series available Databases for 1995 and since 1997. e-Europe relevance 2b-x – general indicator for topic ‘Working in the
knowledge based economy’. Future value Ensured. Links to other indicators
Broken down by gender and age; other independent variables available.

Information society development in Bulgaria
197
12.4.3. Output of employment
Output from employment Information society indicators concerns static and growth of labour productivity and unit labour costs. Their overview – availability and main source, is presented in Table 67.
Table 67. Overview of output of employment indicators C3 – Output of employment (Thematic domain: structure and outcomes of employment) No. Name of indicator Availability Main source C 3 - 1 L a b o u r p r o d u c t i v i t y C3-1.1 Labour productivity (static) Yes C3-1.2 Labour productivity growth Yes Employment in Europe
2002 C 3 - 2 U n i t l a b o u r c o s t s C3-2.1 Unit labour costs (static) yes C3-2.2 Unit labour costs growth yes Employment in Europe
2002
The definition, e-Europe relevance and future value of labour productivity and unit labour costs indicators are presented in Table 68.
Table 68. Description of output of employment indicators
Name of indicator C3-1.1 Labour productivity (static) Definition Output per unit of labour input.45
Commonly: GDP of a certain year per hours worked of all employees in that year. Alternatively: GDP per persons employed.
Sources NSI.
45 Cf. ILO Key Indicators of the Labour Market (KILM), No. 17.

Information society development in Bulgaria
198
… …Table 68. Description of output of employment indicators
Time series since 1993. e-Europe relevance General: effects of ICT investments on productivity. Future value Ensured;
Name of indicator C3-1.2 Labour productivity growth Definition Growth of GDP per hour worked. Sources Employment in Europe 2002. Time series available since 1993. e-Europe relevance 2b-x – general indicator for topic ‘Working in the
knowledge based economy’. Future value Ensured.
Name of indicator C3-2.1 Unit labour costs (static) Definition Labour compensation per unit of gross value added
produced. Sources NSI, MLSP. Time series available Since 1993. e-Europe relevance 2b-x – general indicator for topic ‘Working in the
knowledge based economy’. Future value Ensured.
Name of indicator C3-2.2 Unit labour costs growth Definition Growth of labour compensation per unit of gross
value added produced in %. Sources Employment in Europe 2002. Time series available since 1993. e-Europe relevance 2b-x – general indicator for topic ‘Working in the
knowledge based economy’. Future value Ensured.
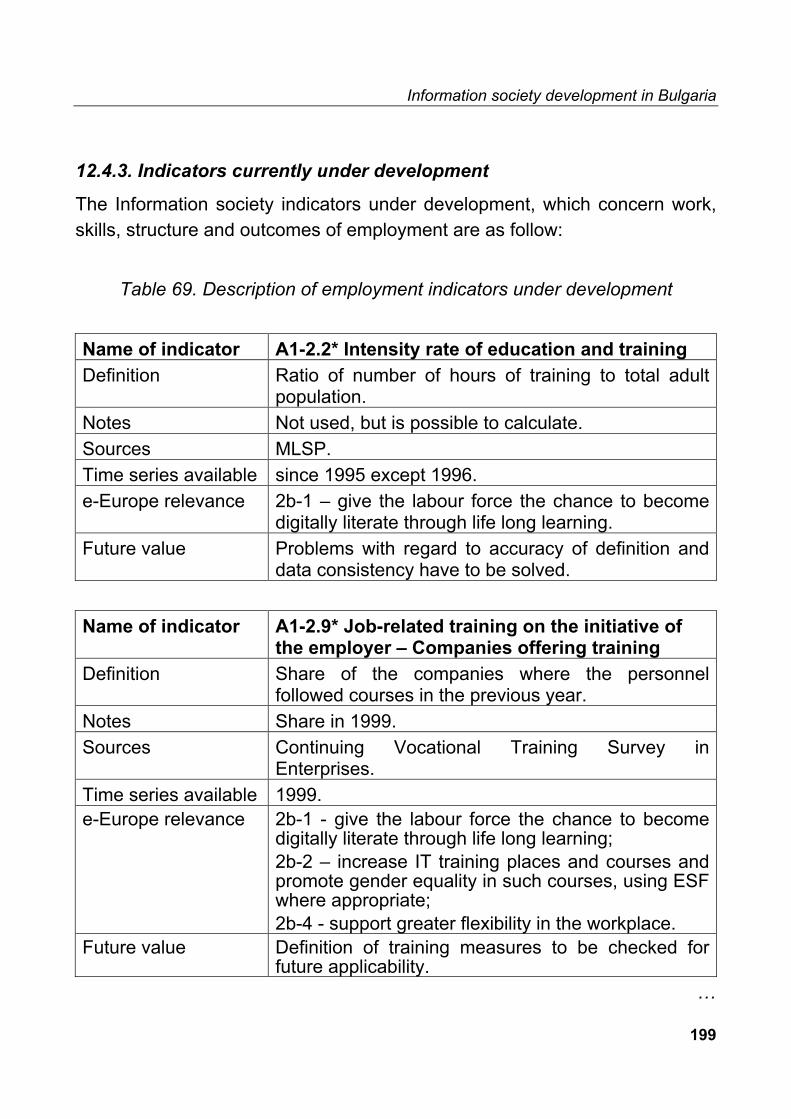
Information society development in Bulgaria
199
12.4.3. Indicators currently under development
The Information society indicators under development, which concern work, skills, structure and outcomes of employment are as follow:
Table 69. Description of employment indicators under development
Name of indicator A1-2.2* Intensity rate of education and training Definition Ratio of number of hours of training to total adult
population. Notes Not used, but is possible to calculate. Sources MLSP. Time series available since 1995 except 1996. e-Europe relevance 2b-1 – give the labour force the chance to become
digitally literate through life long learning. Future value Problems with regard to accuracy of definition and
data consistency have to be solved. Name of indicator A1-2.9* Job-related training on the initiative of
the employer – Companies offering training Definition Share of the companies where the personnel
followed courses in the previous year. Notes Share in 1999. Sources Continuing Vocational Training Survey in
Enterprises. Time series available 1999. e-Europe relevance 2b-1 - give the labour force the chance to become
digitally literate through life long learning; 2b-2 – increase IT training places and courses and promote gender equality in such courses, using ESF where appropriate; 2b-4 - support greater flexibility in the workplace.
Future value Definition of training measures to be checked for future applicability.
…

Information society development in Bulgaria
200
…Table 69. Description of employment indicators under development Name of indicator A1-2.10* Job-related training on the initiative of
the employer – Access rate and intensity Definition a) Number of participants in training/number of
personnel; b) Hours of training/hours worked.
Sources Continuing Vocational Training Survey in Enterprises.
Time series available 1999. e-Europe relevance 2b-1 - give the labour force the chance to become
digitally literate through life long learning; 2b-2 – increase IT training places and courses and promote gender equality in such courses; 2b-4 - support greater flexibility in the workplace.
Future value Definition of training measures to be checked for future applicability.
Name of indicator A1-3.1* Rate of student access to computers Definition Number of students per computer by education level
(primary, secondary). Notes Number of computers per 100 pupils at primary and
secondary level. Sources MES. Time series available 2001. e-Europe relevance 2b-1 - give the labour force the chance to become
digitally literate through life long learning. Future value This is a readiness indicator; intensity and impact
indicators will become more pressing in the future. Name of indicator A1-3.8* Workplaces equipped with PC Definition Percentage of workplaces equipped with PC. Notes a)Percentage of workplaces in public administration
equipped with PC; b) Percentage of companies having at least one computer.
…

Information society development in Bulgaria
201
…Table 69. Description of employment indicators under development Sources Vitosha research. Time series available 2001, 2002. e-Europe relevance 2b-1 – give the labour force the chance to become
digitally literate through life long learning. Future value Ensured as long as definition is clear and adequate.
Name of indicator A1-3.9* Work places linked to the Internet Definition Percentage of workplaces linked to the Internet. Notes a)Percentage of workplaces in public administration
linked to the Internet (from those workplaces equipped with PC); b) Percentage of companies having access to the Internet (% of firms having computers).
Sources MTC. Time series available 2001, 2002. eEurope relevance 2b-1 – give the labour force the chance to become
digitally literate through life long learning. Future value Ensured as long as definition is clear and adequate. Name of indicator A1-3.10* PC access at home Definition Share of the population (14+) who at home have
access to a (a) PC/Mac (b) PC/Mac that is connected online to somewhere else, e.g. the Internet.
Notes a)Share of the population who have PC at home b) Population with Internet connection (share of those who have PC at home).
Sources Vitosha research. Time series available 2001, 2002. e-Europe relevance 2b-1 – give the labour force the chance to become
digitally literate through life long learning. Future value Spread of computers that are not work stations
(e.g. PDAs) and other appliances with Internet access has to be acknowledged when using the indicator in future surveys.
…

Information society development in Bulgaria
202
…Table 69. Description of employment indicators under development Name of indicator A1-3.11* Use of PC - anywhere Definition Share of the population (14+) who have used a PC
or other computer in the month prior to the survey. Notes Share of the population (15-74) who have used a
PC: a) during the last 6 months; b) during the last 7 days.
Sources Vitosha research. Time series available 2001, 2002. e-Europe relevance 2b-1 – give the labour force the chance to become
digitally literate through life long learning. Future value Wording has to be adapted to account for new
developments (spread of computers that are not work stations (e.g. PDAs) and other appliances with functional similarity to a computer).
Name of indicator A1-3.12* Use of e-mail, and purpose of use Definition Share of the population (14+) who have send or
received e-mails either at place of work, at home, or elsewhere, in the month prior to the survey. Purpose of using e-mail (for business, for private purposes, for both, for neither).
Notes Share of Internet users who have send or received e-mails either at place of work, at home, or elsewhere, during the last 6 months.
Sources Vitosha research. . Time series available 2002. e-Europe relevance 2b-1 – give the labour force the chance to become
digitally literate through life long learning. Future value It has to be checked if e-mail applications are
always identified as such by users. …

Information society development in Bulgaria
203
…Table 69. Description of employment indicators under development Name of indicator B1-1.2* Use of IT working tools Definition Use of IT working tools at the workplace:
- mobile phone ; - fax machine ; - PC/terminal ; - PC/terminal in LAN or connected to mainframe; - PC/terminal with access to external networks such as the Internet; - mobile computer; - scanner, plotter; - computer-controlled machines; - ISDN phone; - computer cash register; - others. Differentiation between main working tool and occasional working tool.
Notes Use of IT working tools at the workplace (PC, e-mail, Internet, mobile phone).
Sources Vitosha research. Time series available 2002. e-Europe relevance 2b-4 - support greater flexibility in the workplace;
2b-x – general indicator for topic ‘Working in the knowledge based economy’.
Future value List of working tools has to be adapted and extended continuously.
Name of indicator B1-3.1* Management responsibility Definition Share of persons in work who have managerial
responsibility or supervise work done by other people.
Notes Q: Considering your position in firm, into which labour category would you belong: manager of the firm or the division; specialist, but not a manager; clerk; manual worker; other.
…

Information society development in Bulgaria
204
…Table 69. Description of employment indicators under development Sources Vitosha research. Time series available 1998, 2002. e-Europe relevance 2b-4 support greater flexibility in the workplace. Future value Ensured. Links to other indicators
Data can be desegregated by gender, social status, etc.
Name of indicator B2- 1.2* Working time preferences Definition ”In total, how many hours per week do you work at
present - on average? [...] Provided that you (and your partner) could make a free choice so far as working hours are concerned and taking into account the need to earn your living: How many hours per week would YOU prefer to work at present?” and other related questions.
Notes Q: How many hours per week would you like to work?
Sources MLSP. Time series available 1995, since 1997. e-Europe relevance 2b-4 - support greater flexibility in the workplace. Future value Ensured.
Name of indicator B3-1.1* Telework Definition Percentage of teleworkers of all employed persons.
“When paid workers carry out all, or part of, their work away from their normal places of activity, usually from home, using information and communication technologies” (+ distinction between regularly and occasionally).
Notes Q : Are you doing telework? – possible to get percentage from employed persons Q: Are you doing telework? – percentage from population aged 15-64.
…
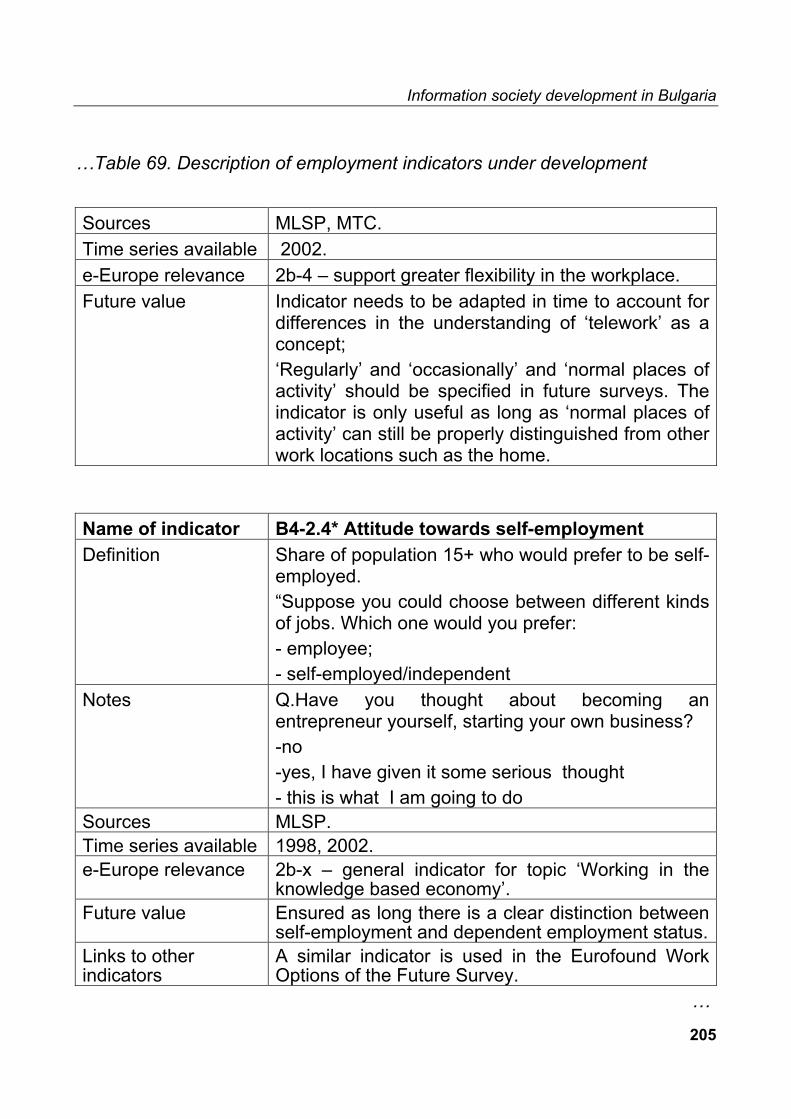
Information society development in Bulgaria
205
…Table 69. Description of employment indicators under development Sources MLSP, MTC. Time series available 2002. e-Europe relevance 2b-4 – support greater flexibility in the workplace. Future value Indicator needs to be adapted in time to account for
differences in the understanding of ‘telework’ as a concept; ‘Regularly’ and ‘occasionally’ and ‘normal places of activity’ should be specified in future surveys. The indicator is only useful as long as ‘normal places of activity’ can still be properly distinguished from other work locations such as the home.
Name of indicator B4-2.4* Attitude towards self-employment Definition Share of population 15+ who would prefer to be self-
employed. “Suppose you could choose between different kinds of jobs. Which one would you prefer: - employee; - self-employed/independent
Notes Q.Have you thought about becoming an entrepreneur yourself, starting your own business? -no -yes, I have given it some serious thought - this is what I am going to do
Sources MLSP. Time series available 1998, 2002. e-Europe relevance 2b-x – general indicator for topic ‘Working in the
knowledge based economy’. Future value Ensured as long there is a clear distinction between
self-employment and dependent employment status.Links to other indicators
A similar indicator is used in the Eurofound Work Options of the Future Survey.
…

Information society development in Bulgaria
206
…Table 69. Description of employment indicators under development Name of indicator B4-5.1* Workers with performance-related pay Definition Share of workers whose remuneration includes:
- piece rate of productivity payments; - payments based on the overall performance of the company (profit sharing scheme) where you work; - payments based on the overall performance of a group; - income from shares in the company you work for.
Notes Q: On what basis do you receive your salary? Is it - pure fixed monthly salary; - pure results pay (piecework, commissions according to sale, bonus etc.); - fixed (monthly salary + results pay (piecework, commissions according to sale, bonus etc.); - other (specify).
Sources MLSP. Time series available 1998, 2002. e-Europe relevance 2b-4 - support greater flexibility in the workplace. Future value Questions might have to be adapted to include new,
innovative types of performance-related pay in the future.
Name of indicator C1-2.11* Occupational diseases Definition Number of recognised cases of occupational
diseases, by group of diagnosis and age. Notes Number of persons suffering from an occupational
disease for the first time. Main occupational diseases: - total; - diseases caused by vibration; - diseases caused by overload of work; - hearing impairment caused by noise; - other occupational diseases; Data are not available by age groups.
…

Information society development in Bulgaria
207
…Table 69. Description of employment indicators under development Sources MLSP. Time series available since 1995. e-Europe relevance 2b-x – general indicator for topic ‘Working in the
knowledge based economy’. Future value Relevant if diseases related to the use of ICT are
accounted for in great enough detail (e.g. eye disorders from screen work, allergic effects and cancer from ICT chemicals).
Name of indicator C2-1.5* Absolute employment gap Definition Difference in employment rates between women
and men in absolute figures (percentage points). Notes Possible to calculate. Sources MLSP. Time series available Since 1989. e-Europe relevance 2b-x – general indicator for topic ‘Working in the
knowledge based economy’. Future value Ensured.
Name of indicator C2-2.7* Index of gender segregation in sectors Definition The average national share of employment for
women and men is applied to each sector, the differences are added up to produce a total amount of gender imbalance. This figure is presented as a proportion of total employment.
Notes Is possible to calculate. Sources MLSP. Time series available since 1989. e-Europe relevance 2b-x – general indicator for topic ‘Working in the
knowledge based economy’. Future value Ensured.
…

Information society development in Bulgaria
208
…Table 69. Description of employment indicators under development Name of indicator C2-2.8* Index of gender segregation in
occupations Definition The average national share of employment for
women and men is applied to each occupation, the differences are added up to produce a total amount of gender imbalance. This figure is presented as a proportion of total employment.
Notes Is possible to calculate. Sources MLSP. Time series available since 1989. e-Europe relevance 2b-x - general indicator for topic ‘Working in the
knowledge based economy’. Future value Ensured.

Information society development in Bulgaria
209
Chapter 13. e-Society and Social Inclusion
The indicators for the Information society topic e-society and social inclusion are grouped in following 3 domains: A1 Identifying the vulnerable – continuity vs. change A2 Access to ICT and accessibility A3 Rationale for participation in Information society
13.1. Overview of e-Society and Social Inclusion indicators The name, availability and main source of data in Bulgaria for Information society topic e-society and social inclusion indicators are presented in Table 70. It contents only those indicators, which are approbated in NAS -10.
Table 70. Overview e-Society and Social Inclusion indicators
A1 – identifying the vulnerable – Continuity vs. change No. Name of indicator Availa-
bility
Main source
A1.1.b Rate of early-school leavers not in further education or training
Yes MES
A1.2.a Labour market situation of the household Yes NSI A1.2.b Inactive population who would like to work
but think no job is available (Discouraged persons)
Yes MLSP
A1.2.c Employment Rate of Older People Yes MLSP A.1.3.a Household income Yes MLSP
…

Information society development in Bulgaria
210
… Table 70. Overview e-Society and Social Inclusion indicators A1.3.b Income poverty based on the income
poverty line Yes MLSP
A1.3.c Distribution of income (S80/S20) Yes MLSP A1.3.d Persistent income poverty based on the
income poverty line No
A1.4.a Educational level of the household Yes MLSP A1.4.b Population by age/age group Yes MLSP A.1.5 People with disabilities Yes Social
Statistics A1.5.a Being hampered/limited in daily activities
due to chronic health condition – definition by a proxy for people with disabilities
No
A1.5.b Having physical or mental impairment that substantially limits one or more major life activities – having a disability
No
A1.5.c Existence of a long standing health problem or disability
No
A1.5.d Internet access by disability status No A1.6.b Usage of high speed access by residence Yes SOE A1.7.a Population by nationality Yes SOE A1.8.a Computer literate workforce No A1.8.b Educational attainment conducive for
ICT/is participating skills Yes MES
A1.8.c Percentage of individuals who can be classified as “late adopters”
Yes MES
A1.8.d Computer training qualifications (employed)
No
A1.8.e Place where basic computer user skills have been acquired
No
A1.10.a Social contacts- frequency No …

Information society development in Bulgaria
211
…Table 70. Overview e-Society and Social Inclusion indicators A2 – Access to ICT and accessibility A2.1 A penetration of digital TV by income No A2.1.b Rate of Internet coverage in schools Yes MES A2.1.c Rate of Internet coverage in schools by
affluence In deve-lop-ment
MES
A2.1.d Internet usage quantified, by household income levels
Yes, pos-sible to calcu-late
Vitosha research
A.2.1.e* Internet usage quantified by different groups
Yes Vitosha research
A2.2.a Public Internet Access Points (PIAP) Yes MTC A2.2.b Percentage of population living near Public
Internet Access Points (PIAP) No
A2.2.c Libraries offering Internet access to the public
Yes Ministry of culture
A2.3.a Personal computer use experience by disability status
No
A2.4.a Web accessibility assessment using the WAI guidlines
No
A.2.4.b Web accessibility – user device independence
No
A2.4.c Web accessibility test using the “Bobby-test”
No
A2.4.e Percentage of central government websites that conform to the WAI guidelines at A level
No
A.2.4.f Percentage of central government websites that conform to the WAI guidelines at AA or AAA level
No
…

Information society development in Bulgaria
212
…Table 70. Overview e-Society and Social Inclusion indicators A2.5.a The existence of frequently asked question
feature on websites No
A2.9.a Perception of affordability of the Internet and PC-s - the price for obtaining the nominal access
No
A2.10.a How to bridge the digital divide in education/among schools
No
A.2.10.b Familiarity with the funding programme and reasons for not availing of the programme available to schools to bridge the digital divide
No
A3 – Rationale for participation in the IS A3.1 Internet content No A3.1.a Availability of multilingual content No A3.1.b Availability of online content suitable for
users with relatively lower literacy level No
A3.1.c Existence of online information focusing on local community
No
A3.1.d Availability of culturally diverse content No A3.6 Use of the Internet for job-seeking no A3.7.a Never connected households /not
connected to the Internet Yes Vitosha
research A3.7.b Likelihood of going online/accessing the
Internet Yes Vitosha
research A3.7.c Individuals perception of the Internet (non
users) Yes Vitosha
research A3.9.a Internet diffusion in the community and
voluntary sector No
A3.12.a Reasons for discontinuing Internet service No A3.12.b Experience of using the Internet measured
in time (years) No

Information society development in Bulgaria
213
13.2. e-Society and Social Inclusion indicators description
The Information society indicators for e-society and e-inclusion are divided into 3 groups: A1. identifying the vulnerable – continuity vs. change A2. access to information and communication technologies A3. rational for participants in Information society. A1. Identifying the vulnerable – Continuity vs. change The description of Information society indicators for identifying the vulnerable – continuity vs. change is presented in Table 71.
Table 71. Description of Identifying the vulnerable – Continuity vs. change indicators
Name of indicator A1.1.b. Rate of early-school leavers not in further
education or training Definition Percentage of population of 18 – 24 years-old having
achieved lower secondary education (ISCED level 2) or less and not attending further education or training
Notes Basic education or less, age 18 – 24, % of adult population, not in education. Data of a single survey, not included in regular statistics .
Sources NSI. Time series 1999. e-Europe relevance 2b-6.1 Policies to avoid info-exclusion;
2b-6 relevant indicator for “participation for all in the knowledge-based economy [and society]” .
Future value Ensured. Links Also relevant for skills and education topics.
…

Information society development in Bulgaria
214
…Table 71. Description of Identifying the vulnerable – Continuity vs. change indicators Name of indicator A1.2.a. Labour market situation of the household Definition Working, if a household has at least one member
who is working; Unemployed, if a household has no working members and at least one member is unemployed; Retired, if a household has no working or unemployed members and at least one member is retired; Other inactive, if a household has no working, unemployed or retired members.
Notes Household – a group of people who live at the same address and share joint financial and/or food resources and who members consider themselves to be members of one household. A household may also consist of one member only. A household would be: - working household is a household with at least one member aged 16 or more is working; - unemployed household is a non-working household with at least one member aged 16 or more who is - unemployed (is not working, is looking for job and is prepared to start working within two weeks); -retired household is a not-working and not-unemployed household with at least one old-age pensioner; -other inactive household is a non-working, non-unemployed and non-retired household.
Sources NSI, MLSP. Time series available Annual. e-Europe relevance 2b-5. Participation for all in the knowledge based
economy. Future value Relevant. …
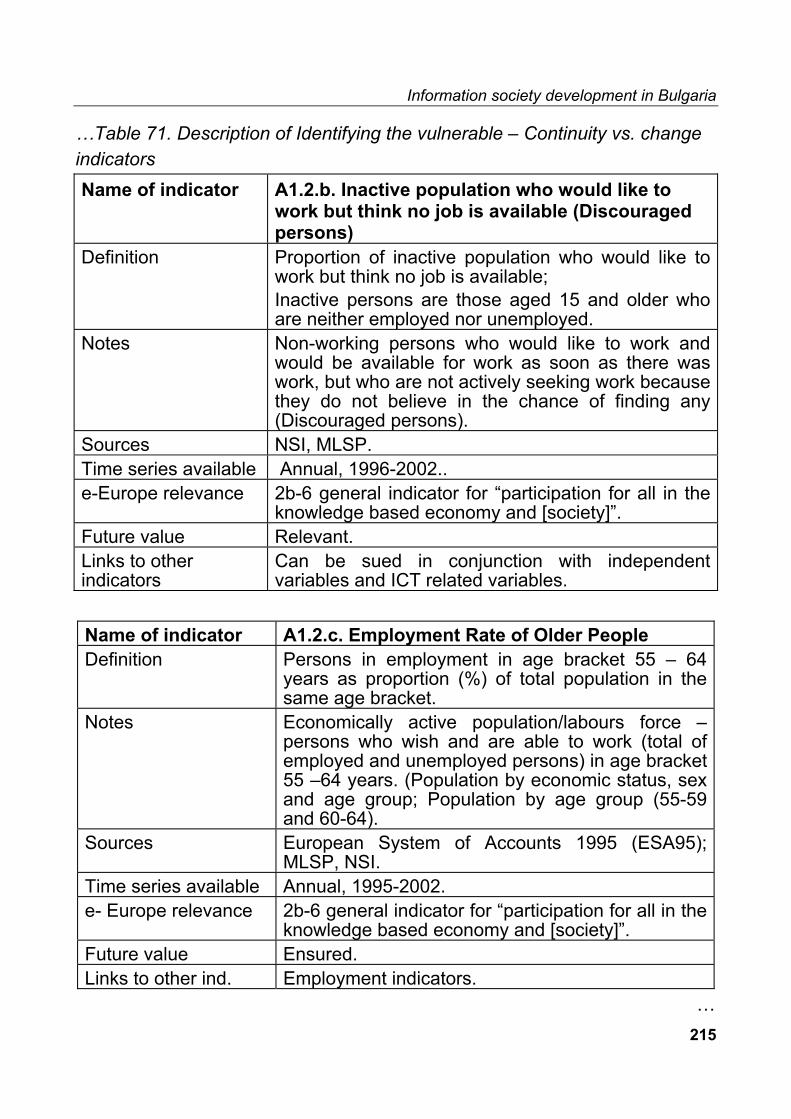
Information society development in Bulgaria
215
…Table 71. Description of Identifying the vulnerable – Continuity vs. change indicators Name of indicator A1.2.b. Inactive population who would like to
work but think no job is available (Discouraged persons)
Definition Proportion of inactive population who would like to work but think no job is available; Inactive persons are those aged 15 and older who are neither employed nor unemployed.
Notes Non-working persons who would like to work and would be available for work as soon as there was work, but who are not actively seeking work because they do not believe in the chance of finding any (Discouraged persons).
Sources NSI, MLSP. Time series available Annual, 1996-2002.. e-Europe relevance 2b-6 general indicator for “participation for all in the
knowledge based economy and [society]”. Future value Relevant. Links to other indicators
Can be sued in conjunction with independent variables and ICT related variables.
Name of indicator A1.2.c. Employment Rate of Older People Definition Persons in employment in age bracket 55 – 64
years as proportion (%) of total population in the same age bracket.
Notes Economically active population/labours force – persons who wish and are able to work (total of employed and unemployed persons) in age bracket 55 –64 years. (Population by economic status, sex and age group; Population by age group (55-59 and 60-64).
Sources European System of Accounts 1995 (ESA95); MLSP, NSI.
Time series available Annual, 1995-2002. e- Europe relevance 2b-6 general indicator for “participation for all in the
knowledge based economy and [society]”. Future value Ensured. Links to other ind. Employment indicators.
…

Information society development in Bulgaria
216
…Table 71. Description of Identifying the vulnerable – Continuity vs. change indicators Name of indicator A.1.3.a. Household income Definition Total net monetary income received by the
household and its members at the time of the interview.
Notes 1) Household is the group of persons living in the common main dwelling (at the same address) and share joint financial and/or food resources and whose members consider they to be members of one household. Household can also consist of one member only. Disposable (net) income includes monetary and non-monetary net income which is received as earnings from employment, income from self-employment (agricultural and non-farm self-employment), property income, pensions and different social benefits, grants, scholarships and other income (selling of goods, settlements of accounts (taxes), refunded insurance premiums, lottery prizes). 2) Net household income – total income of a household (monetary and non-monetary), that does not contain savings or money received from loan repayments. The net household income is generally presented as an average per household member.
Sources NSI, MLSP. Time series available Annual, quarterly, 1996 –2002. e-Europe relevance - 5. Participation for all in the knowledge based
economy. Future value Relevant.
…

Information society development in Bulgaria
217
…Table 71. Description of Identifying the vulnerable – Continuity vs. change indicators Name of indicator A.1.3.b. Income poverty based on the income
poverty line Definition The income poverty line or low income threshold is
based on the individual distribution of equalised income and is set at 60% of its median equalised income.
Notes 1) Poverty line – denotes a level of resources below which subjects (individuals, households, social groups), are considered to be in poverty. The relative poverty level according to income has been determined as 60% of the median household incomes per consumption unit.2) The population living below the poverty line is the share of the total population whose annual income after social transfers is below the poverty line – 60% of the national median income.
Sources NSI, MLSP. Time series Annual, since 1999. e-Europe relevance 2b-6 general indicator for “participation for all in the
knowledge based economy and [society]”. Future value Relevant for identifying association between income
poverty and info-exclusion. Name of indicator A1.3.c. Distribution of income (S80/S20) Definition Ratio of the total income received by the 20% of the
country’s population with the highest income (top quintile) to that received by the 20% of the country’s population the lowest income (lowest quintile).
Notes In Bulgaria average monthly disposable income per household member in households by income deciles (S90/S10) and quintiles (S80/S20).
Sources NSI, MLSP. Time series available Annual, 1997-2002. e-Europe relevance 2b-6 general indicator for “participation for all in the
knowledge based economy and [society]”. Future value Relevant.
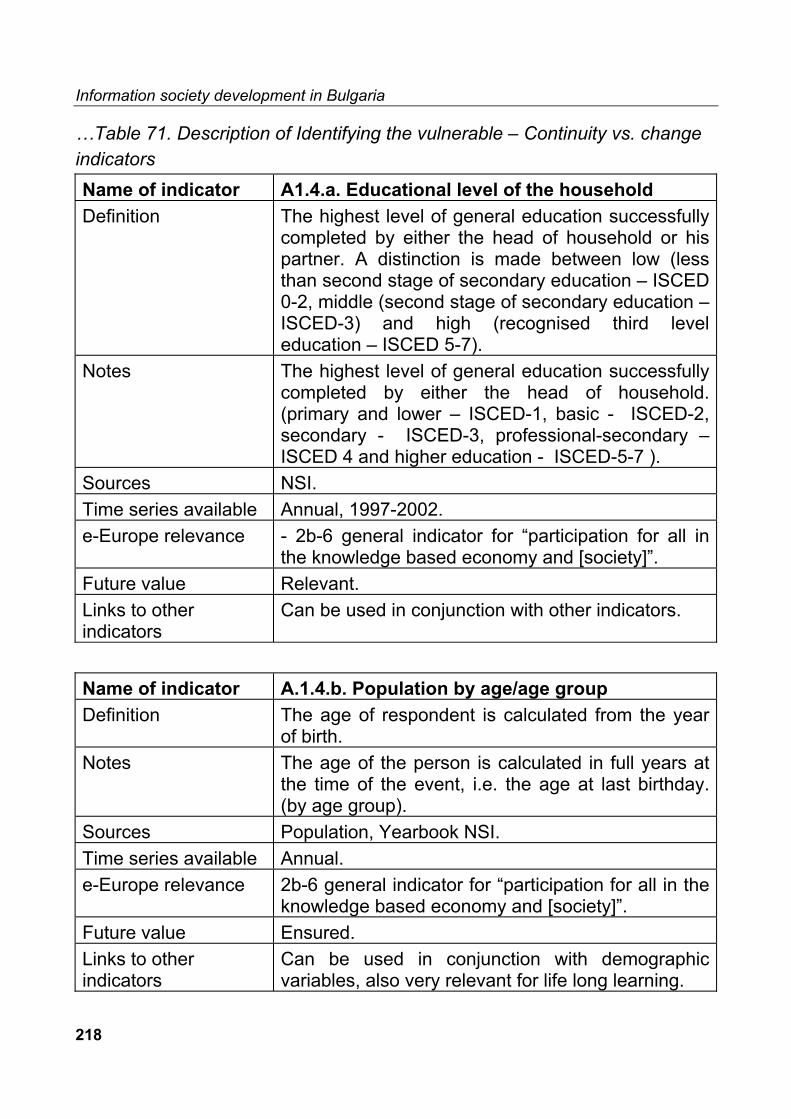
Information society development in Bulgaria
218
…Table 71. Description of Identifying the vulnerable – Continuity vs. change indicators Name of indicator A1.4.a. Educational level of the household Definition The highest level of general education successfully
completed by either the head of household or his partner. A distinction is made between low (less than second stage of secondary education – ISCED 0-2, middle (second stage of secondary education – ISCED-3) and high (recognised third level education – ISCED 5-7).
Notes The highest level of general education successfully completed by either the head of household. (primary and lower – ISCED-1, basic - ISCED-2, secondary - ISCED-3, professional-secondary – ISCED 4 and higher education - ISCED-5-7 ).
Sources NSI. Time series available Annual, 1997-2002. e-Europe relevance - 2b-6 general indicator for “participation for all in
the knowledge based economy and [society]”. Future value Relevant. Links to other indicators
Can be used in conjunction with other indicators.
Name of indicator A.1.4.b. Population by age/age group Definition The age of respondent is calculated from the year
of birth. Notes The age of the person is calculated in full years at
the time of the event, i.e. the age at last birthday. (by age group).
Sources Population, Yearbook NSI. Time series available Annual. e-Europe relevance 2b-6 general indicator for “participation for all in the
knowledge based economy and [society]”. Future value Ensured. Links to other indicators
Can be used in conjunction with demographic variables, also very relevant for life long learning.

Information society development in Bulgaria
219
…Table 71. Description of Identifying the vulnerable – Continuity vs. change indicators Name of indicator A.1.5. People with disabilities Definition The loss of or an abnormality in an anatomical,
physiological or mental structure or function of a person.
Notes Bulgaria: The Order for Protection, Rehabilitation, and Social Integration for Disabled People (37th Parliament on December 14, 1995.):
Disability – every lasting limitation or lack of the ability to accomplish activity to a degree, accepted for normal for a human being.
Disabled people with limited ability to work – people, whose possibilities to find and keep a proper job, as well as to develop professionally, are temporarily or lastingly limited as a result of the disability.
Sources NSI, MLSP. Time series available Annual. e-Europe relevance 2b-6 general indicator for “participation for all in the
knowledge based economy and [society]”. Future value Relevant. Links to other indicators
Needs to be considered together with ICT usage indicators.
Name of indicator A.1.5.d.Internet access by disability status Definition Access to the Internet either at home, or elsewhere
for the people with specific types of disabilities. Notes PC with Internet at home, no regular statistics.
In the case of the Internet, one of its innovative uses of this kind is its role as access and integration measure for people with disabilities (including people with mobility impairments). In some sense, a PC with an Internet connection has to compensate missing ramps, elevators and other access features.
…

Information society development in Bulgaria
220
…Table 71. Description of Identifying the vulnerable – Continuity vs. change indicators Sources MLSP. e-Europe relevance 2b-6 general indicator for “participation for all in the
knowledge based economy and [society]”. Future value Relevant. Links Links with accessibility indicators for the Internet.
Name of indicator A.1.6.b. Usage of high speed access by
residence Definition Which of the following do you most frequently use
to access the Internet from home? Notes The provision of households with ICT equipment
and connections by access type: leased lines, dial-up connections, cable TV lines.
Sources MTC, Vitosha research. Time series available 2000-2002. e-Europe relevance 2b-6 general indicator for “participation for all in the
knowledge based economy and [society]”. Future value Relevant.
Name of indicator A.1.7.a. Population by nationality Definition Nationality comprises three groups:
- nationals of the Member states concerned, - non-nationals of the Member States, who are nationals of one of the other Member State, - a third group comprising all other nationalities.
Notes Population by nationality – country the citizen of which the person is. Can be distinguished: - Bulgarian citizen; - European citizen; - EU member states citizen; - Other.
Sources 2000 Population and Housing Census II, NSI, MLSP.

Information society development in Bulgaria
221
…Table 71. Description of Identifying the vulnerable – Continuity vs. change indicators Time series available 2000. e-Europe relevance 2b-6 general indicator for “participation for all in the
knowledge based economy and [society]”. Future value Relevant, but needs to be more sensitive to minority
groups. Links to other indicators
Can be used in conjunction with other demographic variables.
Name of indicator A.1.8.b. Educational attainment conducive for
ICT/is participating skills Definition Percentage of population having attained at least
upper secondary level. Notes On the basis of ISCED- 97 the proportion of those
with 3rd level education of the whole population. Sources NSI, MLSP. Time series available 1997-2001. e-Europe relevance 2b-6 general indicator for “participation for all in the
knowledge based economy and [society]”; 2b-6.1. Policies to avoid info-exclusion.
Future value Ensured. Links to other indicators
Can be used in conjunction with demographic variables, also very relevant for life long learning.
Name of indicator A.1.8.c. Percentage of individuals who can be
classified as “late adopters” Definition Late adopters are those who are not familiar with
many new information and communications technologies and do not use any.
Notes May be defined as the presence of “digital gap”. Socio-economic differences of individuals, institutions and geographical locations in the use of communication technology and Internet; Percentage of inhabitants (15 – 74 years old) who have never used the Internet.
…

Information society development in Bulgaria
222
…Table 71. Description of Identifying the vulnerable – Continuity vs. change indicators Sources Vitosha research, MLSP.. Time series available 2000- 2002. e-Europe relevance 2b-6 general indicator for “participation for all in the
knowledge based economy and [society]” 2b-6.1. Policies to avoid info-exclusion.
Future value Relevant. Links to other indicators
To ICT usage indicators.
A.2. Access to ICT-s and accessibility
The second group of Information society indicators, which concern benchmarking e-Society and Social inclusion, are connected with the access to information and communication technologies and their accessibility. They are described, according to applied methodology, in Table 72.
Table 72. Description of Access to ICT-s and accessibility indicators Name of indicator A 2.1.b. Rate of Internet coverage in schools Definition Percentage of schools connected to the Internet by
level: - primary; - secondary.
Sources MES, Vitosha research . Time series available 2000-2002. e-Europe relevance 2b-6 general indicator for “participation for all in the
knowledge based economy and [society]”. Future value Relevant. Links To Education Indicator.
…

Information society development in Bulgaria
223
…Table 72. Description of Access to ICT-s and accessibility indicators Name of indicator A.2.1.d. Internet usage quantified, by
household income levels Definition The amount of time spent on the Internet per
month by household income. Notes Not used currently, can be calculated. Sources Vitosha research. Time series available 2000 – 2002. e-Europe relevance 2b-6 general indicator for “participation for all in the
knowledge based economy and [society]”. Future value Relevant. Links Demographic indicator (s).
Name of indicator A.2.1.e. Internet usage quantified, by different
groups Definition Groups using Internet–distigued by age, and % in
the age group, as well as by educational level. Notes There is data for male and female, as well as the
share of those using Internet among those having access to computer.
Sources Vitosha research . Time series available 2000-2002. e-Europe relevance 2b-6 general indicator for “participation for all in the
knowledge based economy and [society]”. Future value Relevan. Links to other indicators
Demographic indicator (s).
Name of indicator A.2.2.a. Public Internet Access Points (PIAPs) Definition Public Internet Access Points (PIAP) as % of all
Internet access points (home, workplace, other). PIAPs are publicly provided centres providing access to the Internet regardless of their public and/or private provider and whether access is free or not.
…
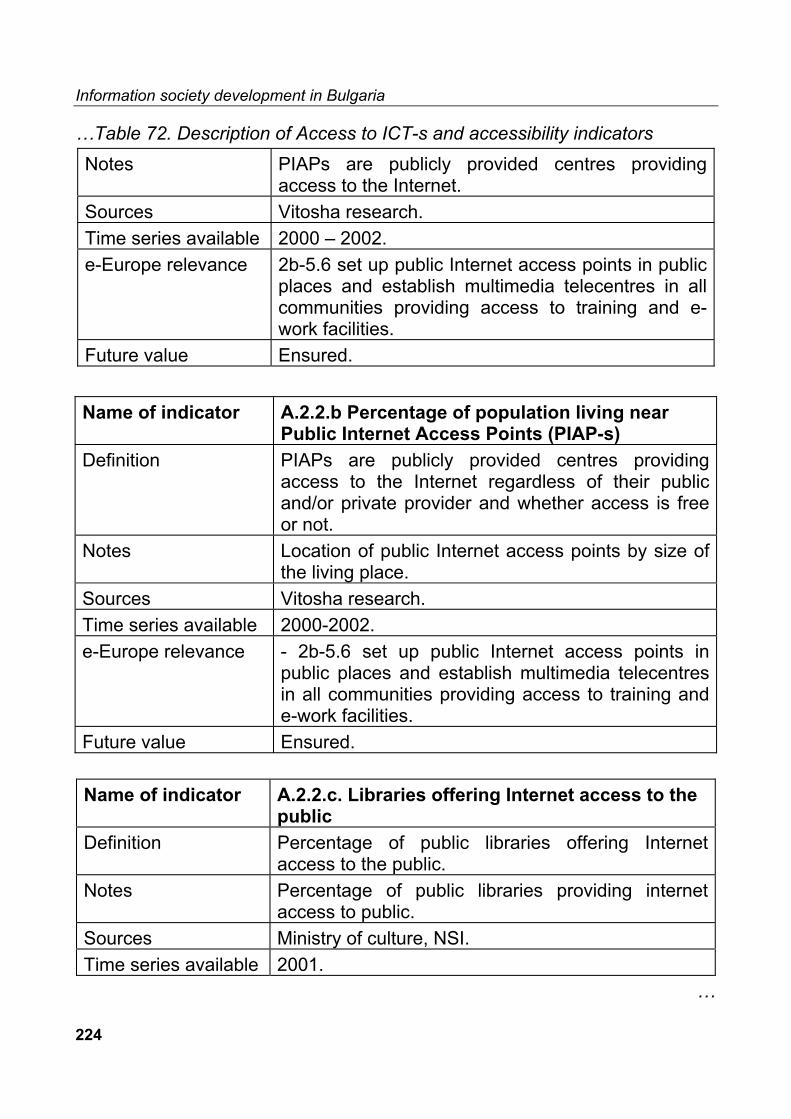
Information society development in Bulgaria
224
…Table 72. Description of Access to ICT-s and accessibility indicators Notes PIAPs are publicly provided centres providing
access to the Internet. Sources Vitosha research. Time series available 2000 – 2002. e-Europe relevance 2b-5.6 set up public Internet access points in public
places and establish multimedia telecentres in all communities providing access to training and e-work facilities.
Future value Ensured. Name of indicator A.2.2.b Percentage of population living near
Public Internet Access Points (PIAP-s) Definition PIAPs are publicly provided centres providing
access to the Internet regardless of their public and/or private provider and whether access is free or not.
Notes Location of public Internet access points by size of the living place.
Sources Vitosha research. Time series available 2000-2002. e-Europe relevance - 2b-5.6 set up public Internet access points in
public places and establish multimedia telecentres in all communities providing access to training and e-work facilities.
Future value Ensured. Name of indicator A.2.2.c. Libraries offering Internet access to the
public Definition Percentage of public libraries offering Internet
access to the public. Notes Percentage of public libraries providing internet
access to public. Sources Ministry of culture, NSI. Time series available 2001.
…

Information society development in Bulgaria
225
…Table 72. Description of Access to ICT-s and accessibility indicators e-Europe relevance 2b-6.1. Policies to avoid info-exclusion will be more
effectively coordinated at European level through benchmarking of performance and exchange of best practice between Member States
Future value Ensured A3. Rationale for participation in the Information society The third group of Information society indicators, which concern benchmarking e-Society and Social inclusion, is connected with the rational for participating in the Information society. They are described, according to applied methodology, in Table 73. Table 73. Description of Rationale for participation in the IS indicators Name of indicator A.3.7.a. Never connected households /not
connected to the Internet Definition Reasons for households with a computer/Web TV
never accessing the Internet. Notes The main reasons for not using the Internet are:
-lack of motivation; - Internet as a subject is not on the agenda, because it does not inform about possibilities; - it is thought that computer is necessary for student to study; - they do not see Internet as a means of communication; - opinion that information obtained from the Internet is not reliable; - lack of skills and knowledge.
Sources NSI, 2000 census. Time series available 2001.
…
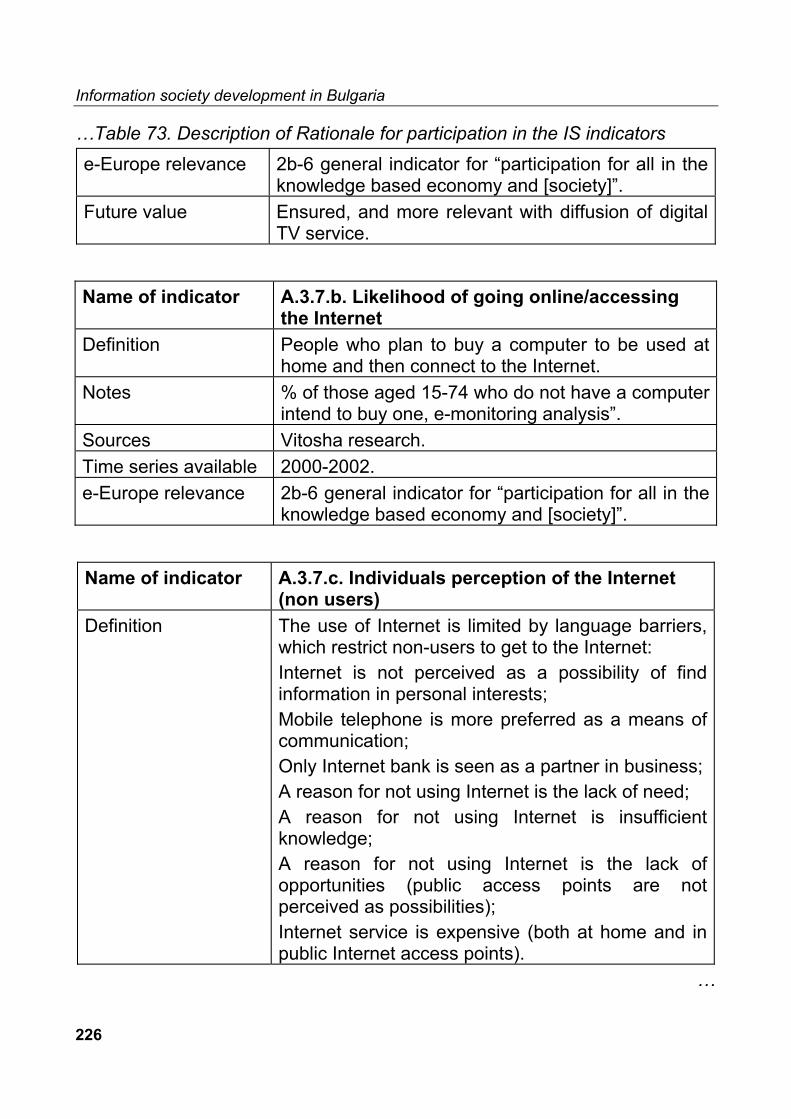
Information society development in Bulgaria
226
…Table 73. Description of Rationale for participation in the IS indicators e-Europe relevance 2b-6 general indicator for “participation for all in the
knowledge based economy and [society]”. Future value Ensured, and more relevant with diffusion of digital
TV service.
Name of indicator A.3.7.b. Likelihood of going online/accessing the Internet
Definition People who plan to buy a computer to be used at home and then connect to the Internet.
Notes % of those aged 15-74 who do not have a computer intend to buy one, e-monitoring analysis”.
Sources Vitosha research. Time series available 2000-2002. e-Europe relevance 2b-6 general indicator for “participation for all in the
knowledge based economy and [society]”.
Name of indicator A.3.7.c. Individuals perception of the Internet (non users)
Definition The use of Internet is limited by language barriers, which restrict non-users to get to the Internet: Internet is not perceived as a possibility of find information in personal interests; Mobile telephone is more preferred as a means of communication; Only Internet bank is seen as a partner in business; A reason for not using Internet is the lack of need; A reason for not using Internet is insufficient knowledge; A reason for not using Internet is the lack of opportunities (public access points are not perceived as possibilities); Internet service is expensive (both at home and in public Internet access points).
…
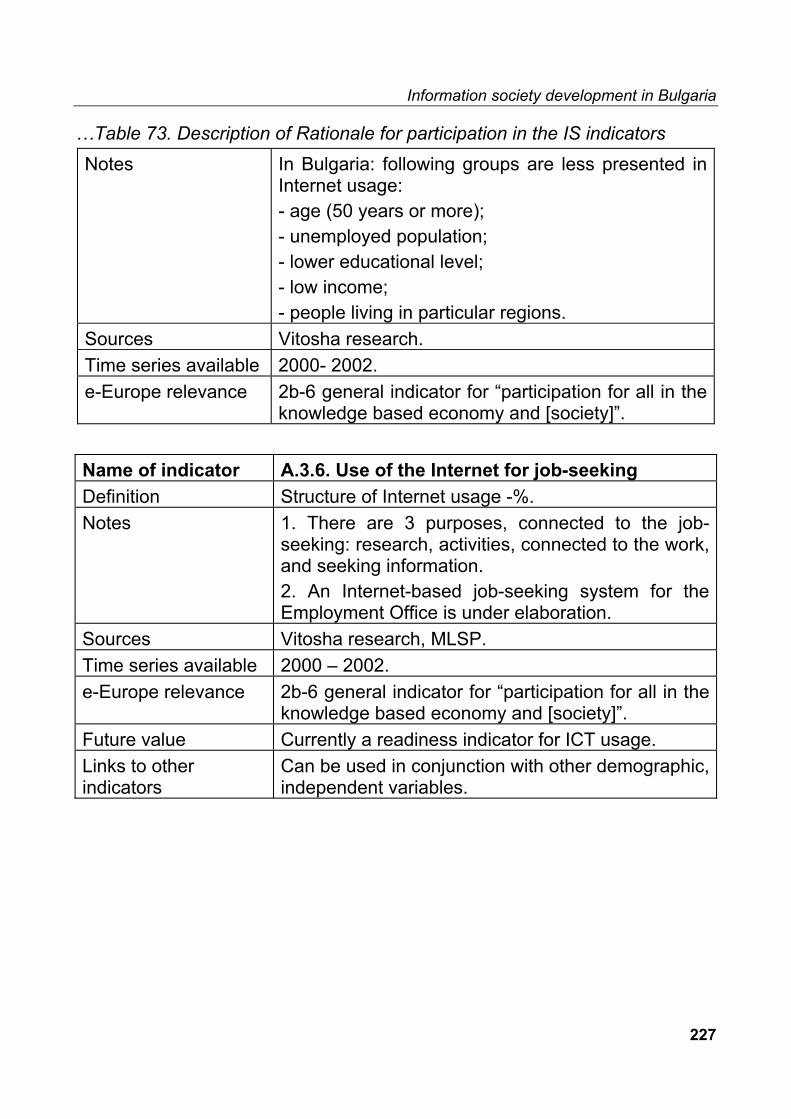
Information society development in Bulgaria
227
…Table 73. Description of Rationale for participation in the IS indicators Notes In Bulgaria: following groups are less presented in
Internet usage: - age (50 years or more); - unemployed population; - lower educational level; - low income; - people living in particular regions.
Sources Vitosha research. Time series available 2000- 2002. e-Europe relevance 2b-6 general indicator for “participation for all in the
knowledge based economy and [society]”. Name of indicator A.3.6. Use of the Internet for job-seeking Definition Structure of Internet usage -%. Notes 1. There are 3 purposes, connected to the job-
seeking: research, activities, connected to the work, and seeking information. 2. An Internet-based job-seeking system for the Employment Office is under elaboration.
Sources Vitosha research, MLSP. Time series available 2000 – 2002. e-Europe relevance 2b-6 general indicator for “participation for all in the
knowledge based economy and [society]”. Future value Currently a readiness indicator for ICT usage. Links to other indicators
Can be used in conjunction with other demographic, independent variables.

Information society development in Bulgaria
228

Information society development in Bulgaria
229
Chapter 14. e - Government
The European content of constructing indicators for Information society topic e-Government is presented in Table 74.
Table 74. Content of e-relevance of IS indicators
Content of e- relevance Availability of low-cost, high-speed networks for Internet access; Efforts by public administrations at all levels to exploit new technologies to make information as accessible as possible; States to provide generalised electronic access to main basic public services; Develop a co-ordinated approach for public sector information, including at European level; Promote the use of open source software in the public sector and e-government best practice through exchange of experiences across the Union States.
14.1. Overview of indicators
The name, availability and main source for Information society indicators, which concern e-Government, are presented in Table 75.
Table 75. Overview of e-Government IS indicators No. Name of indicator Availability Main source A1 Percentage of the population who
regularly use the Internet Yes Vitosha
research …

Information society development in Bulgaria
230
…Table 75. Overview of e-Government IS indicators A2 Percentage of households with
Internet access at home Yes Vitosha
research A3-1 Government services online, Internet
users % visiting government websites Yes MTC
A3-2 Usage of government services online; type of use
Yes MTC
A4 Percentage of municipalities with an on-line presence
Yes MTC
A5 Income taxes: declaration, notification of assessment
Yes MTC, MF
A6* Job search services by labour offices No A7* Social security contributions No A8* Personal documents No A9 Car registration No A10 Application for building permission No A11 Declaration to the police No A12 Online access to public libraries Yes Ministry of
culture A13 Certificates: request and delivery No A14 Enrolment in higher education/
university No
A15* Announcement of moving No A16* Health related services No A17 Social contribution for employees No A18* Corporation tax: declaration,
notification No
A19* VAT: declaration, notification No A20 Registration of a new company No A21* Submission of data to statistical
offices No
A22* Customs declarations No A23 Environment-related permits No
…

Information society development in Bulgaria
231
…Table 75. Overview of e-Government IS indicators A24* Public procurement No
A25* % of electronic service provided by the government
No
A26 Internal use of ICT, Access to the Internet
Yes Vitosha research
A27 Internal use of ICT, Access to e-mail Yes Vitosha research
A28* Availability of a (central) government network or intranet
No
A29 Accessibility of government organisations and information
Yes MTC
A30* Availability of government information at portals
No
A31* Availability of government information at municipal sites
No
A32* % of municipality websites with e-procurement
No
A33 Improved Service Delivery-Central Government
No
A34 Perceived Advantages of Electronic Service Delivery-Central Government
No
A35 Barriers to e-Government-Central Government
No
A36 Perceived Advantages of Electronic Service Deliver-Local & Regional Government
No
A37 Barriers to e-Government-Local & Regional Government
No
A38 Preferred Channel to Interact with Government
No
A39 Most Important Barriers by Segment No A40 Contradictory Views About What e-
Government Will Do to Human Contact
No
…

Information society development in Bulgaria
232
…Table 75. Overview of e-Government IS indicators A41 Do Consumers Prefer Email or the
Phone No
A42 Confidence in the Civil Service No A43 Finding Out About Benefits No A44 Demand for Electronic Services No A45 Public Readiness for e-Government No A46 Mode of Access to Government No A47 Internet Penetration by Nation No
14.2. e-Government indicators description
The definition, notes, Bulgarian sources, e-Europe relevance and future value of e-Government indicators are presented in Table 76.
Table 76. Description of e-Government indicators Name of indicator A1 Percentage of the population who regularly
use the Internet Definition Percentage of the population who regularly use the
Internet. Notes Definition: all forms of use to be included, no matter
where. Population ≥ 18. Sources Vitosha research. Time series available 2000 -2002. e-Europe relevance 3b-1 Efforts by public administrations at all levels to
exploit new technologies to make information as accessible as possible; 3b-2 Member states to provide generalised electronic access to main basic public services by 2003; 1a-4 Availability of low-cost, high-speed networks for Internet access.
…

Information society development in Bulgaria
233
…Table 76. Description of e-Government indicators Future value The population will gradually adopt Internet access,
like other technologies and this indicator will become less relevant with time. How fast it loses meaning will depend on how quickly Internet becomes a part of every day life.
Links to other indicators
To A2, A3, A4 indicators.
Name of indicator A2 Percentage of households with Internet
access at home Definition Percentage of households with Internet access at
home. Notes There is data from different sources. Sources Vitosha research. Time series available 2000- 2002. e-Europe relevance 3b-1 Efforts by public administrations at all levels to
exploit new technologies to make information as accessible as possible; 3b-2 Member states to provide generalised electronic access to main basic public services by 2003; 1a-4 Availability of low-cost, high-speed networks for Internet access.
Future value Internet access at home, like the telephone, may be viewed at a later time as a basic necessity rather than an option. As this occurs, the market will saturate and this indicator will cease to carry any meaning.
Links To A1, A3, A4 indicators. Name of indicator A3-1 Government services online, Internet
users % visiting government websites Definition Percentage of Internet users visiting government
sites. Notes Number of queries, per day or per second, is
estimated (not published). …

Information society development in Bulgaria
234
…Table 76. Description of e-Government indicators Sources MTC. Time series available 2002. e-Europe relevance 3b-1 Efforts by public administrations at all levels to
exploit new technologies to make information as accessible as possible; 3b-2 Member states to provide generalised electronic access to main basic public services by 2003.
Future value This indicator will probably lose meaning very shortly, as municipalities can easily establish an online presence.
Links to other indicators
To A1, A2, A3-2, A4 indicators.
Name of indicator A3-2 Usage of government services online; type
of use Definition Type of use as % of all Internet users, split up by:
- finding/downloading information (for info); - e-mail inquiries; - submission of forms/filling forms.
Notes The usage of on-line services provided by state and government agencies (in the age group from 18) by type of use (%).
Sources Vitosha research. Time series available 2000-2002. e-Europe relevance 3b-1 Efforts by public administrations at all levels to
exploit new technologies to make information as accessible as possible; 3b-2 Member states to provide generalised electronic access to main basic public services by 2003-01-02.
Future value The state has access to databases as an integral whole 7 days a week and 24 hours a day.
Links To A1, A2, A3-1, A4 indicators. …

Information society development in Bulgaria
235
…Table 76. Description of e-Government indicators Name of indicator A4 Percentage of municipalities with an on-line
presence Definition Percentage of municipalities with an on-line presenceNotes All local governments have an Internet access. Sources Ministry of state administration. Time series available 2002. e-Europe relevance 3b-1 Efforts by public administrations at all levels to
exploit new technologies to make information as accessible as possible; 3b-2 Member states to provide generalised electronic access to main basic public services by 2003.
Future value To provide an opportunity for local governments to disclose their documents in an integral and common server.
Links to other indicators
To A1, A2, A3 indicators.
Name of indicator A5 Online services concerning income tax
declarations Definition Availability of online services concerning income tax
declarations, mapped on a 4 point scale: - Information: online info about public services; - Interaction: downloading of forms; - Two-way interaction: processing of forms, including authentication; - Transaction: case handling; decision and delivery (payment).
Notes The taxpayers or their authorised representatives can: - file, view and correct their VAT returns; - file, view and correct their social tax and withheld income tax returns; - submit their VAT refund applications; view their tax account balances;
…

Information society development in Bulgaria
236
…Table 76. Description of e-Government indicators Notes - view their taxpayer account cards;
- make inquiries about other person’s outstanding tax debts; - file their personal income tax returns; - view their social tax calculated, paid by employers and transferred to the Social Insurance Board etc.
Sources E-policy Development in Transition Economies 2002. Time series available 2002. e-Europe relevance 3b-1 Efforts by public administrations at all levels to
exploit new technologies to make information as accessible as possible; 3b-2 Member states to provide generalised electronic access to main basic public services by 2003.
Future value Income tax declarations will be filled mainly electronically.
Links To A6-A15 indicators. Name of indicator A6* Online job search services by labour offices Definition Availability of online job search services by labour
offices, mapped on a four-point scale: - Information: online info about public services; - Interaction: downloading of forms; - Two-way interaction: processing of forms, including authentication; - Transaction: case handling; decision and delivery (payment).
Notes Ministry of economy has developed under Bulgarian dream project job search service for young economists – www.mi.government.bg, where they are able to submit their CVs. An Internet-based job-seeking system for the Employment Office is under elaboration.
Sources www.government.bg …

Information society development in Bulgaria
237
…Table 76. Description of e-Government indicators Time series available 2002; 2003. e-Europe relevance 3b-1 Efforts by public administrations at all levels to
exploit new technologies to make information as accessible as possible; 3b-2 Member states to provide generalised electronic access to main basic public services by 2003.
Future value The population will gradually adopt Internet access, like other technologies and this indicator will become less relevant with time. How fast it loses meaning will depend on how quickly Internet becomes a part of every day life.
Links to other indicators To A5-A16 indicators. Name of indicator A7* Online services concerning social security
contribution payments Definition Availability of online services concerning social
security contribution, mapped on a four-point scale: - Information: online info about public services; - Interaction: downloading of forms; - Two-way interaction: processing of forms, including authentication; - Transaction: case handling; decision and delivery (payment).
Notes Bulgaria: online services concerning social security contribution payment by enterprises, organisations: - Information in the web; - downloading forms; - processing of forms; - delivery, payment via internet-bank. This service is used by employers, but no statistics published.
Sources e-Government programme in Bulgaria. Time series available 2002. …

Information society development in Bulgaria
238
…Table 76. Description of e-Government indicators e-Europe relevance 3b-1 Efforts by public administrations at all levels to
exploit new technologies to make information as accessible as possible; 3b-2 Member states to provide generalised electronic access to main basic public services by 2003.
Future value Internet access, like other technologies will gradually be adopted by the population and this indicator will become less relevant with time. How fast it loses meaning will depend on how quickly Internet becomes a part of every day life.
Links to other indicators To A5-A16 indicators. Name of indicator A8* Online services concerning applications for
personal documents Definition Availability of online services concerning
applications for personal documents mapped on a four-point scale: - Information: online info about public services; - Interaction: downloading of forms; - Two-way interaction: processing of forms, including authentication; - Transaction: case handling; decision and delivery (payment).
Notes Service: “Forms in the Internet”, has made document forms available for citizens to communicate with state agencies. Forms are in PDF-format and can be printed out or filled directly on the screen. At present the citizen can submit forms obtained from the Internet or filled in on the screen him/herself or send them by mail to a respective state agency. It is not possible to transmit these documents directly to state agencies via the e-government portal due to the lack of secure and authenticating transmission system of digital documents. Presumably such possibility will
…

Information society development in Bulgaria
239
…Table 76. Description of e-Government indicators Notes be provided as a result of the realisation of
document management program (DMP) and e-citizen project and the implementation of ID-card.
Sources e-Europe+ 1st Progress Report. Time series available Available continuously. e-Europe relevance 3b-1 Efforts by public administrations at all levels to
exploit new technologies to make information as accessible as possible; 3b-2 Member states to provide generalised electronic access to main basic public services by 2003.
Future value The population will gradually adopt Internet access, like other technologies and this indicator will become less relevant with time. How fast it loses meaning will depend on how quickly Internet becomes a part of every day life.
Links to other indicators To A5-A16 indicators. Name of indicator A12 Online access to public libraries Definition Availability of online access to public libraries,
mapped on a four-point scale: - Information: online info about public services; - Interaction: downloading of forms; - Two-way interaction: processing of forms, including authentication; - Transaction: case handling; decision and delivery (payment).
Notes Percentage of public libraries providing Internet access to public.
Sources Ministry of culture. Time series available 2001. e-Europe relevance 3b-1 Efforts by public administrations at all levels to
exploit new technologies to make information as accessible as possible; 3b-2 Member states to provide generalised electronic access to main basic public services by 2003.
…

Information society development in Bulgaria
240
…Table 76. Description of e-Government indicators Future value The population will gradually adopt Internet
access, like other technologies and this indicator will become less relevant with time. How fast it loses meaning will depend on how quickly Internet becomes a part of every day life.
Links to other indicators
To A5-A16 indicators.
Name of indicator A15* Online services concerning change of
address Definition Ability to hand in announcements of moving online
mapped on a four-point scale: - Information: online info about public services; - Interaction: downloading of forms; - Two-way interaction: processing of forms, including authentication; - Transaction: case handling; decision and delivery (payment).
Notes It is possible to use online services to change address, not yet regularly used.
e-Europe relevance 3b-1 Efforts by public administrations at all levels to exploit new technologies to make information as accessible as possible; 3b-2 Member states to provide generalised electronic access to main basic public services by 2003.
Future value The population will gradually adopt Internet access, like other technologies and this indicator will become less relevant with time. How fast it loses meaning will depend on how quickly Internet becomes a part of every day life.
Links to other indicators
Suggestions how to link this indicator to others (e.g. for test of correlation, test of aggregation, etc.).
…

Information society development in Bulgaria
241
…Table 76. Description of e-Government indicators Name of indicator A16* Online offer of health-related public
services Definition Ability to obtain health-related public services online
mapped on a four-point scale: - Information: online info about public services; - Interaction: downloading of forms; - Two-way interaction: processing of forms, including authentication; - Transaction: case handling; decision and delivery (payment).
Notes Bulgaria: health portals providing: - information and proffessional comments on health and medicine topics; - possibility to consult by e-mail with doctors, pharmacists, hairdressers, and dermatologists.
Sources E-Europe+ 1st Progress Report, Ministry of Transport and Communications.
Time series available Available continuously. e-Europe relevance 3b-1 Efforts by public administrations at all levels to
exploit new technologies to make information as accessible as possible; 3b-2 Member states to provide generalised electronic access to main basic public services by 2003.
Future value The population will gradually adopt Internet access, like other technologies and this indicator will become less relevant with time. How fast it loses meaning will depend on how quickly Internet becomes a part of every day life.
Links to other indicators
To 5-A16 indicator.
…

Information society development in Bulgaria
242
…Table 76. Description of e-Government indicators Name of indicator A18* Online services concerning corporation
tax declarations Definition Availability of online services concerning
corporation tax declarations mapped on a four-point scale: - Information: online info about public services; - Interaction: downloading of forms; - Two-way interaction: processing of forms, including authentication; - Transaction: case handling; decision and delivery (payment).
Notes Availability of online services concerning enterprise tax declarations (VAT, staff income tax, etc, all together): - Information; - downloading forms; - processing of forms; - delivery, payment.
Sources Ministry of finance. Time series available Monthly. e -Europe relevance 3b-3 Develop a co-ordinated approach for public
sector information, including at European; by the European Commission level by the end of end 2000; 3b-4 Promote the use of open source software in the public sector and e-government best practice through exchange of experiences across the Union (through the IST and IDA programmes); by European Commission, Member States during 2001.
Future value The population will gradually adopt Internet access, like other technologies and this indicator will become less relevant with time. How fast it loses meaning will depend on how quickly Internet becomes a part of every day life.
Links To A17-A24 indicators. …

Information society development in Bulgaria
243
…Table 76. Description of e-Government indicators Name of indicator A19* Online services concerning VAT
declaration Definition Availability of online services concerning VAT
declaration, mapped on a four-point scale: - Information: online info about public services; - Interaction: downloading of forms; - Two-way interaction: processing of forms, including authentication; - Transaction: case handling; decision and delivery (payment).
Notes Availability of online services concerning enterprise tax declarations (VAT, staff income tax, etc, all together): - Information; - downloading forms; - processing of forms; - delivery, payment.
Sources Ministry of finance. Time series available Monthly. e-Europe relevance 3b-3 Develop a co-ordinated approach for public
sector information, including at European; by the European Commission level by the end of end 2000; 3b-4 Promote the use of open source software in the public sector and e-government best practice through exchange of experiences across the Union (through the IST and IDA programmes); by European Commission, Member States during 2001.
Future value Internet access, like other technologies will gradually be adopted by the population and this indicator will become less relevant with time. How fast it loses meaning will depend on how quickly Internet becomes a part of every day life.
Links To A18-A24 indicators. …

Information society development in Bulgaria
244
…Table 76. Description of e-Government indicators Name of indicator A21* Online services concerning submission of
data to statistical offices Definition Availability of online services concerning submission
of data to statistical offices mapped on a four-point scale: - Information: online info about public services; - Interaction: downloading of forms; - Two-way interaction: processing of forms, including authentication; - Transaction: case handling; decision and delivery (payment).
Notes Availability of online services concerning submission of data to statistical offices: - information; - downloading forms; - processing of forms; - deliverable.
Sources NSI. Time series available Regularly depend on surveys and deadlines e-Europe relevance 3b-3 Develop a co-ordinated approach for public
sector information, including at European; by the European Commission level by the end of end 2000; 3b-4 Promote the use of open source software in the public sector and e-government best practice through exchange of experiences across the Union (through the IST and IDA programmes); by European Commission, Member States during 2001.
Future value The population will gradually adopt Internet access, like other technologies and this indicator will become less relevant with time. How fast it loses meaning will depend on how quickly Internet becomes a part of every day life.
Links To A18-A24 indicators. …
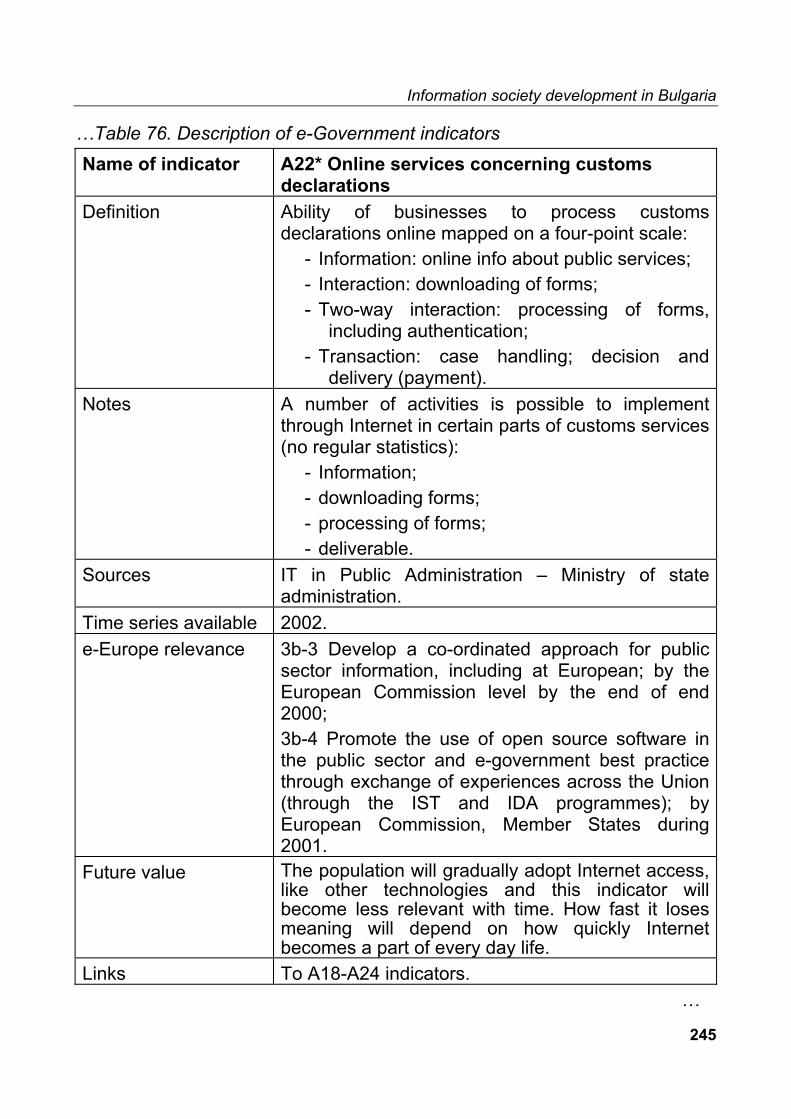
Information society development in Bulgaria
245
…Table 76. Description of e-Government indicators Name of indicator A22* Online services concerning customs
declarations Definition Ability of businesses to process customs
declarations online mapped on a four-point scale: - Information: online info about public services; - Interaction: downloading of forms; - Two-way interaction: processing of forms,
including authentication; - Transaction: case handling; decision and
delivery (payment). Notes A number of activities is possible to implement
through Internet in certain parts of customs services (no regular statistics):
- Information; - downloading forms; - processing of forms; - deliverable.
Sources IT in Public Administration – Ministry of state administration.
Time series available 2002. e-Europe relevance 3b-3 Develop a co-ordinated approach for public
sector information, including at European; by the European Commission level by the end of end 2000; 3b-4 Promote the use of open source software in the public sector and e-government best practice through exchange of experiences across the Union (through the IST and IDA programmes); by European Commission, Member States during 2001.
Future value The population will gradually adopt Internet access, like other technologies and this indicator will become less relevant with time. How fast it loses meaning will depend on how quickly Internet becomes a part of every day life.
Links To A18-A24 indicators. …
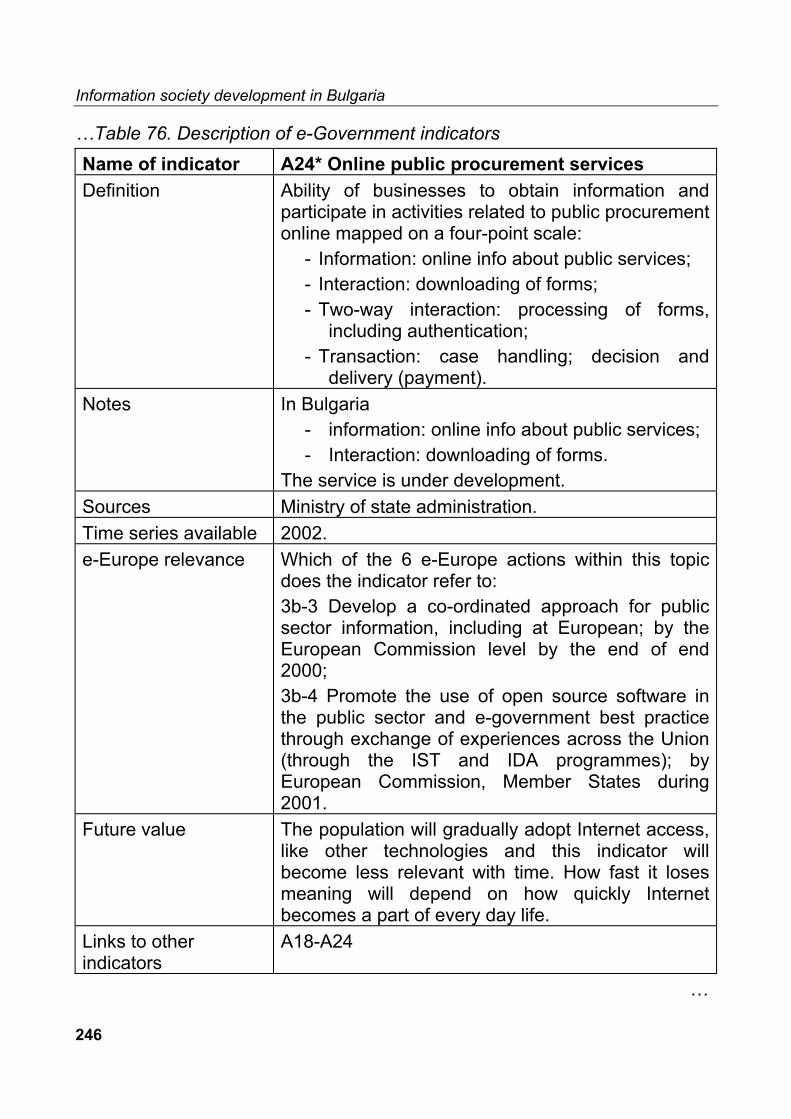
Information society development in Bulgaria
246
…Table 76. Description of e-Government indicators Name of indicator A24* Online public procurement services Definition Ability of businesses to obtain information and
participate in activities related to public procurement online mapped on a four-point scale:
- Information: online info about public services; - Interaction: downloading of forms; - Two-way interaction: processing of forms,
including authentication; - Transaction: case handling; decision and
delivery (payment). Notes In Bulgaria
- information: online info about public services; - Interaction: downloading of forms.
The service is under development. Sources Ministry of state administration. Time series available 2002. e-Europe relevance Which of the 6 e-Europe actions within this topic
does the indicator refer to: 3b-3 Develop a co-ordinated approach for public sector information, including at European; by the European Commission level by the end of end 2000; 3b-4 Promote the use of open source software in the public sector and e-government best practice through exchange of experiences across the Union (through the IST and IDA programmes); by European Commission, Member States during 2001.
Future value The population will gradually adopt Internet access, like other technologies and this indicator will become less relevant with time. How fast it loses meaning will depend on how quickly Internet becomes a part of every day life.
Links to other indicators
A18-A24
…

Information society development in Bulgaria
247
…Table 76. Description of e-Government indicators Name of indicator A25* Percentage of public services available on
the Internet Definition Availability of public services on the Internet;
percentage of electronic services provided by the government sector.
Notes A number of electronic public service deliveries are available in Bulgaria. No regular statistics.
Sources www.government.bg, www.abv.bg, www.econ.bg, www.gbg.bg, etc.
Time series available 2002. e-Europe relevance 3b-1 Efforts by public administrations at all levels to
exploit new technologies to make information as accessible as possible; 3b-2 Member states to provide generalised electronic access to main basic public services by 2003.
Future value The population will gradually adopt Internet access, like other technologies and this indicator will become less relevant with time. How fast it loses meaning will depend on how quickly Internet becomes a part of every day life.
Name of indicator A26 Internal use of ICT, Access to the Internet Definition Percentage of central government workplaces with
Internet access. Notes The existing computer-equipped workplaces (PCs)
in Public Administration Agencies (ministries, national boards, inspectorates, county governments) and agencies (chancelleries) of constitutional institutions, such as Parliament, the Legal Chancellor and others. Percentage of computer-equipped workplaces (PCs) connected to the Internet (estimated).
Sources MTC, BAIT, Vitosha research. Time series available 2000 – 2002.
…

Information society development in Bulgaria
248
…Table 76. Description of e-Government indicators e-Europe relevance 3b-1 Efforts by public administrations at all levels to
exploit new technologies to make information as accessible as possible; 3b-2 Member states to provide generalised electronic access to main basic public services by 2003.
Future value The population will gradually adopt Internet access, like other technologies and this indicator will become less relevant with time. How fast it loses meaning will depend on how quickly Internet becomes a part of every day life.
Name of indicator A27 Internal use of ICT, Access to e-mail Definition Percentage of central government workplaces with
e-mail. Notes Bulgaria: Percentage of computer-equipped
workplaces (PCs) connected to the Internet. Sources MTC, Vitosha research, BAIT. Time series available 2000- 2002. e-Europe relevance 3b-1 Efforts by public administrations at all levels to
exploit new technologies to make information as accessible as possible; 3b-2 Member states to provide generalised electronic access to main basic public services by 2003.
Future value The population will gradually adopt Internet access, like other technologies and this indicator will become less relevant with time. How fast it loses meaning will depend on how quickly Internet becomes a part of every day life.
Name of indicator A28* Availability of a (central) government
network or intranet Definition Availability of a (central) government network or
intranet. …

Information society development in Bulgaria
249
…Table 76. Description of e-Government indicators Notes Hi security communicational infrastructure between
Government, MTC, MF and the Commission for regulation of communications is a subject of a project, funded by ITU (International communications union).
Sources http://www.developmentgateway.org/node/130619/news/item?item_id-348108
Time series available 2003. e-Europe relevance 3b-1 Efforts by public administrations at all levels to
exploit new technologies to make information as accessible as possible; 3b-2 Member states to provide generalised electronic access to main basic public services by 2003.
Future value The population will gradually adopt Internet access, like other technologies and this indicator will become less relevant with time. How fast it loses meaning will depend on how quickly Internet becomes a part of every day life.
Name of indicator A29 Accessibility of government organisations
and information Definition Web presence:% of municipal authorities with a
website. Notes All local governments in Bulgaria have access to
Internet, also the departments and agencies of central government.
Sources MTC. Time series available 2002. e-Europe relevance 3b-1 Efforts by public administrations at all levels to
exploit new technologies to make information as accessible as possible; 3b-2 Member states to provide generalised electronic access to main basic public services by 2003.
…

Information society development in Bulgaria
250
…Table 76. Description of e-Government indicators Future value The population will gradually adopt Internet access,
like other technologies and this indicator will become less relevant with time. How fast it loses meaning will depend on how quickly Internet becomes a part of every day life.
Name of indicator A30* Availability of government information at
portals Definition Availability of government information at portals:
Score 1: no policy information; Score 2: general policy information; Score 3: score 2 + policy papers; Score 4: score 3 + information system.
Notes A portal is defined as a general government website from where you have access to all the available governmental information of the country; policy papers: official policy documents like White Papers, publications and so on, reports, press conferences etc.
Sources www.government.bg , MTC Time series available 2002 e-Europe relevance 3b-1 Efforts by public administrations at all levels to
exploit new technologies to make information as accessible as possible; 3b-2 Member states to provide generalised electronic access to main basic public services by 2003.
Future value The population will gradually adopt Internet access, like other technologies and this indicator will become less relevant with time. How fast it loses meaning will depend on how quickly Internet becomes a part of every day life.
…

Information society development in Bulgaria
251
…Table 76. Description of e-Government indicators Name of indicator A31* Availability of government information at
municipal sites Definition Availability of government information at municipal
sites: Score 1: no policy information; Score 2: general policy information; Score 3: score 2 + policy papers; Score 4: score 3 + information system.
Notes Access to all the available governmental information of the country, documents etc.
Sources MTC. Time series available 2002. e-Europe relevance 3b-1 Efforts by public administrations at all levels to
exploit new technologies to make information as accessible as possible; 3b-2 Member states to provide generalised electronic access to main basic public services by 2003.
Future value The population will gradually adopt Internet access, like other technologies and this indicator will become less relevant with time. How fast it loses meaning will depend on how quickly Internet becomes a part of every day life.
Name of indicator A32* Percentage of municipality websites with
e-procurement Definition Percentage of municipality websites with e-
procurement. Notes Web search at municipal sites. Sources Ministry for state administration. e-Europe relevance 3b-1 Efforts by public administrations at all levels to
exploit new technologies to make information as accessible as possible; 3b-2 Member states to provide generalised electronic access to main basic public services by 2003.

Information society development in Bulgaria
252

Information society development in Bulgaria
253
Chapter 15. e-Health
The e-health is one of the main achievements of information society development. This is a new, fast growing area of social activities. The policy documents, which concern e-health development in Bulgaria, are as follow:
Table 77. Policy concern about e-Health in Bulgaria
Title of document Author Year Type of document *
Bulgarian Health Project 2015
Ministry of Labour and Social Security, Ministry of health
2000 Development Plan
Health Insurance Act Bulgarian Parliament MLSS, Bulgarian Health Insurance Fund
June 2002
Legislation Act
15.1. Overview of e-Health indicators
There is no any official data for e-health development indicators, collected in Bulgaria. That is why no any comments on availability and official sources of information for them are included in Table 78. This state-of-the-art is similar to the most of monitored countries. The e-health Information society indicators are divided in two groups:
- Health system quality development; - Health system usage.
Here only e-health indicators, which have been included in GPS 2003 and in the analysis in the Part I of this book, have been presented. In order to keep comparison with GPS 2002 easier, the original numbers have been kept.

Information society development in Bulgaria
254
Table 78. Overview of e-Health indicators
No. Name of indicator 1. System quality development 1.1.* Establishment of Internet-based quality health information
and service environment (portals) for customers and professionals
1.2.* Development of Internet-based quality health information and service environment (portals) for customers and professionals
1.3.* Development of united Health Information System 1.4.* Development of united e-Health statistics system 1.5.* Development of a system of e-prescriptions 1.6. Development of a system of e-health-cards 1.7.* Establishment of National Gene Bank 1.8.
Development of Occupational health and Safety Network
2. System usage 2.1.* 2.1.1.
Types of general public usage of Internet based e-Health information and services Information about medicines (drugs)
2.1.* 2.1.1.*
Types of general public usage of Internet based e-Health information and services Registration to doctors’ consultation
2.1.* 2.1.3.
Types of general public usage of Internet based e-Health information and services Consultations with health practitioners
2.1.* 2.1.4.
Types of general public usage of Internet based e-Health information and services e-Health Insurance System
2.2.* 2.2.1.
Practitioners usage of Internet Availability of health information and taking part in discussions

Information society development in Bulgaria
255
No. Name of indicator 2.3.* 2.3.1. Practitioners usage of telemedicine
Homecare and remote monitoring system 2.3.* 2.3.2. Practitioners usage
Clinical neurophysiology (telemedicine) 2.3.* 2.3.3 Practitioners usage
Diagnostic radiology (teleradiology) 2.3.* 2.3.4 Practitioners usage
Teleconferences 2.3.* 2.3.5 Practitioners usage
Access to medical information
15.2. e-Health indicators description
The description of the Information society e-health indicators is divided into 2 groups: indicators, which concern e-health system quality development, and e-health system usage. 15.2.1. System quality development
Table 79. Description of e-Health system quality development indicators
Name of indicator 1.1.* Establishment of Internet-based quality health information and service environment (portals) for customers and professionals
Definition Creation of: - new media editions on health and medical issues for citizens and medical professionals; Internet-based health promotion and educational tools for schools; - Internet - based health and medical services for citizens, healthcare professionals and institutions.
…
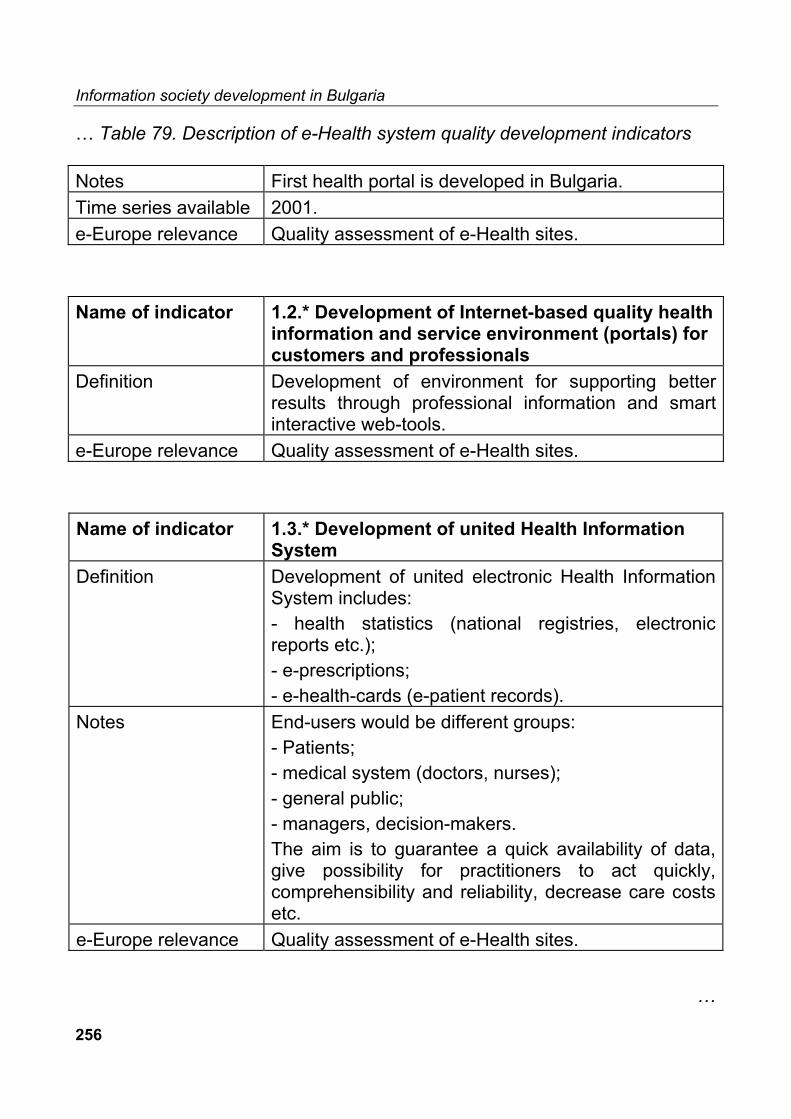
Information society development in Bulgaria
256
… Table 79. Description of e-Health system quality development indicators
Notes First health portal is developed in Bulgaria. Time series available 2001. e-Europe relevance Quality assessment of e-Health sites. Name of indicator 1.2.* Development of Internet-based quality health
information and service environment (portals) for customers and professionals
Definition Development of environment for supporting better results through professional information and smart interactive web-tools.
e-Europe relevance Quality assessment of e-Health sites. Name of indicator 1.3.* Development of united Health Information
System Definition Development of united electronic Health Information
System includes: - health statistics (national registries, electronic reports etc.); - e-prescriptions; - e-health-cards (e-patient records).
Notes End-users would be different groups: - Patients; - medical system (doctors, nurses); - general public; - managers, decision-makers. The aim is to guarantee a quick availability of data, give possibility for practitioners to act quickly, comprehensibility and reliability, decrease care costs etc.
e-Europe relevance Quality assessment of e-Health sites. …

Information society development in Bulgaria
257
… Table 79. Description of e-Health system quality development indicators
Name of indicator 1.4.* Development of united e-Health statistics system
Definition Qualitative follow-up of the health care institutions activities and people health and its analysis with help of electronic statistical system.
Notes Main activities will be to: - Personal - based electronic information; - Information based on reports of healthcare institutions; - information based of registers (e.g. surveys).
Sources Health Project. Name of indicator 1.5.* Development of a system of e-prescriptions Definition Development of a system of usage electronic
prescriptions. Notes To create better comprehensibility, time
economizing, quicker service. There is two-ways electronic data exchange between doctors (using software MediSoft) and pharmacies (using software RAX) since 01.01.2001.
Sources Health Project. Time series available
2000; 2001.
e-Europe relevance Quality assessment of e-Health. Name of indicator 1.6. Development of a system of e-health-cards Definition Development of electronic personal health data
storage and management system for variety of relevant end users.
Notes To guarantee continuous history document, guarantees qualitative care possibility, adequate statistics and partly available to person for giving overview of his/her health status during lifetime.
Sources Health Project. …

Information society development in Bulgaria
258
… Table 79. Description of e-Health system quality development indicators
Name of indicator * 1.7. Establishment of National Gene Bank Definition The establishment of population-based genome-
wide personalized database. Electronic database of health status, genealogical and genetic data (phenotype and genotype) of population.
Notes Pilot phase of the project has been started in three counties in 2002. Gene donors will have electronic gene cards in the future.
Sources Genome Project. Time series available 2002-2005.
Name of indicator 1.8. Development of Occupational health and
Safety Network Definition Development of occupational health network in
order to strengthen and develop infrastructures of the occupational health services and developing human resources for occupational health. Offer easy and immediate access to country occupational health information through user-friendly telematic information system (Internet).
e-Europe relevance Part of EU accession process. 15.2.2. e-Health system usage The Information society group of indicators, which concern e-Health system usage, is very important to benchmark the level of development of supply and demand for e-health services in any country. Like in previous chapters, here only indicators, used in GPS 2003 are presented, presenting their numbers from GPS 2002 in order to keep possibilities for easier comparisons.

Information society development in Bulgaria
259
Table 80. Description of system usage e-Health indicators
Name of indicator 2.1.* Types of general public usage of Internet based e-Health information and services 2.1.1. Information about medicines (drugs)
Definition The main activity is: to use the web search for information on medicines (drugs), their prices, description.
Notes Several independent pharmaceutical firms’ websites has information.
Name of indicator 2.1.* Types of general public usage of Internet
based e-Health information and services 2.1.2.* Registration to doctors’ admission
Definition Access to doctor’s admission, client centered service and environment.
Notes First online registration to doctor’s admission. Time series 2002.
Name of indicator 2.1.* Types of general public usage of Internet
based e-Health information and services 2.1.3. Consultations with health practitioners
Definition Access to online physician consultation. Notes Practical activities via independent health websites
and portals. Name of indicator 2.1.* Types of general public usage of internet
based e-Health information and services 2.1.4. e-Health Insurance System
Definition - personal data; - insurance cover data; - medicines (drugs) subsidy data; - sick leave compensations (compensation for temporary work incapacity); - health (medical) services.
…

Information society development in Bulgaria
260
…Table 80. Description of system usage e-Health indicators Notes Access to personal data related to health insurance
through Internet. Internet bank clients can use the e-services provided by the bank to check the validity of their health insurance, their address, the name of the family physician and the payment of sickness benefits; Internet allows correcting data related to the place of residence.
Sources Bulgarian Health Insurance Fund. Health Insurance Act 2002.
Name of indicator 2.1.* Types of general public usage of Internet
based e-Health information and services 2.1.5.* Expectation (readiness) of general public usage of Internet based health services
Definition - Registration to doctors’ admission. - Getting medicines (drugs) from pharmacy by prescription.
Notes The expectation and readiness of health care services usage was found among Internet non-users.
Sources Report "Bulgaria Digital Divide" www.ced.bg
Time series available
2002.
Name of indicator 2.2.* Practitioners usage of Internet
2.2.1. Availability of health information and taking part in discussions
Definition Availability of information for doctors via Internet and discussion of treatment problems in a wider audience of practitioners.
Notes Independent health websites. e-Europe relevance Practitioners specialist usage. …

Information society development in Bulgaria
261
…Table 80. Description of system usage e-Health indicators Name of indicator 2.3.* Practitioners usage
2.3.1. Homecare and remote monitoring system Definition A development of a unique monitoring program
called doc@HOME for cardiac patients while greatly reducing the cost of care.
Notes Development, implementation, validation and demonstration of a system including the configuration and provision of end-user services using the doc@HOME concept.
Sources Project: Home care and remote monitoring system for the population with special needs allowing expert advice to be generated ex situ based on the collected data (doc@HOME).
Time series 2001. e-Europe relevance Practitioners specialist usage. Name of indicator 2.3.* Practitioners usage
2.3.2. Clinical neurophysiology (telemedicine) Definition Usage of effective technologies. Notes Medical and technical knowledge transfer – giving
better measurements with higher quality of diagnosis and care. Clinical neurophysiology (CN) has reached more patients.
e-Europe relevance Practitioners specialist usage. Name of indicator 2.3.* Practitioners usage
2.3.3. Diagnostic radiology (teleradiology) Definition Usage of effective technologies Notes - Computer-tomography (CT) investigations;
- MRI investigations; - Ultrasound.
e-Europe relevance Practitioners specialist usage. ...

Information society development in Bulgaria
262
…Table 80. Description of system usage e-Health indicators Name of indicator 2.3.* Practitioners usage
2.3.5 Teleconferences (videoconferences) Definition Includes:
-distance learning; -Teleconsultations; -family medicine meetings.
Notes Approx. 17 teleconferences + family medicine meetings 46; Approx 25 teleconsultations; Approx 17 distance learning lecturers; Teleconferences of cardio surgery since 2000.
Time series available 2000-2002 (continuing). e-Europe relevance Practitioners specialist usage.
Name of indicator 2.3.* Practitioners usage
2.3.5 Access to medical information Definition Includes:
- medical Internet databases’ usage (e.g Medline) since 1997; - e-library since 2001; - information service.
Time series available 1997, 2002. e-Europe relevance Practitioners specialist usage.

Information society development in Bulgaria
263
Chapter 16. Conclusions
The benchmarking of the progress of Information society development has had significant impact on both, the making policies and the development of official Information society statistics. The discussed in the second part of the study methodological issues have concerned mainly second target audience. Here it has been taken an attempt to present newly developed and under construction indicators, which are result of the work of a large European team. Making notes and assuming possible sources and time series available for Bulgaria, this part has sought to help national context of further benchmarking Information society development. The presented state-of-the-art of indicators has allowed drawing conclusions, that benchmarking is possible in following areas of Information society development in Bulgaria:
● Telecommunication and Access: o achievement of significant reduce in Internet access tariffs; o new framework for electronic communications and associated
services; o introduction of greater competition in local access networks and
unbending of local loop; o public financing instruments to support the development of
information infrastructure; o reduced prices for leasing lines.
● Education: o Policy and strategy; o Economy and infrastructure;

Information society development in Bulgaria
264
o Information and communication technologies use and access; o Competencies.
● Work/Skills/Employment:
o skill acquisition, skill provision and skill requirements in formal education, non-formal learning / education and informal learning;
o work organisation
– work content / applied skills (working tools, working methods, working tasks, self-determination);
– time of work (worker – centred time flexibility and company – centred time flexibility);
– place of work (tele-work: home-based, centre-based, mobile; tele-cooperation);
– work contract (self-employment, labour market flexibility, duration of contract, compensation);
o employment
– benefits from employment (material benefits and immaterial benefits: satisfaction, job security and availability, health effects);
– level and structure of employment (sectors and occupations, unemployment);
– outputs of employment (labour productivity and unit labour costs.
● e - Society:
o identifying the vulnerable – continuity vs. change; o access to information and communication technologies and
accessibility; o rationale for participation in Information society.

Information society development in Bulgaria
265
● e - Government: o availability of low-cost, high speed networks for Internet access; o efforts by public administration at all levels to exploit new
technologies to make information as accessible as possible; o provision of generalised electronic access to main basic public
services; o developing a coordinated approach for public sector information,
including at European level.
● e - Health: o e-Health quality development; o e-Health system usage.
Making policies and the development of official Information society statistics has been expected to raise new demand for improved and new indicators development, opening new horizons for doing research in this area.

Information society development in Bulgaria
266
References
1. Bulgaria. E-Readiness Assessment 2001,(2002), www.arc.online.bg 2. Chobanova, R., Innovation policy profile: Bulgaria, Enterprise Directorate –
General, Final report, March 2003, ftp://cordis.lu/pub/innovation-policy/studies/ Bulgaria_final_report_march,2003.pdf
3. EUROSTAT (2002), Statistical yearbook on candidate and south-east European countries, 1996-2000
4. Information society (2002), www.ispo.bg 5. IPTS (2000), The New Economy 6. Measuring the Information Society in the EU, the EU Accession Countries,
Switzerland and the US, SIBIS Pocket Book 2002/03, www.sibis-eu.org 7. National Statistical Institute (2002), Bulgaria 2001, Socio-economic development,
Sofia 8. National Strategy for Information Society Development, adopted by the
Government in 1999, updated in 2002. Source: www.mtc.government.bg 9. NSI (2002) Statistical Yearbook 2001, Bulgaria
10. Report of the European Commission on the progress towards accession by each of candidate countries, Brussels, 09.10.2002, SEC/2002/1400-1412
11. Report of the European Commission on the progress towards accession by each of candidate countries”, Brussels, 13.11.2001, SEC/2001/1744-1753.
12. SIBIS, Topic Research and Indicator Development Report, Annexes on Newly Associated States (NAS), empirica et al., http://www.sibis-eu.org/sibis/files/D2-2/SIBIS_WP2_NAS_annex.pdf
13. SIBIS, Topic report No.1 “Telecommunications & Access”, Technopolis, UK, www.sibis-eu.org
14. SIBIS, Topic report No.3 “Security and Trust”, RAND Europe, www.sibis-eu.org 15. SIBIS, Topic report No.4 “Education”, Danish technological Institute, www.sibis-
eu.org 16. SIBIS, Topic report No.5 “Work, employment and skills”, empirica, Germany,
www.sibis-eu.org 17. SIBIS, Topic report No.6 “Social Inclusion”, Work Research Centre, www.sibis-
eu.org 18. SIBIS, Topic report No.7 “E-Commerce”, Databank Consulting, Italy, www.sibis-
eu.org. 19. SIBIS, Topic report No.8 “e-Government”, RAND Europe, www.sibis-eu.org

Information society development in Bulgaria
267
20. SIBIS+ (2003), General Population Survey 21. Towards the Information Society in Europe and the US, SIBIS Benchmarking
Highlights 2002, www.sibis-eu.org 22. www.arc.online.bg 23. www.ccit.government.bg 24. www.government.bg 25. www.ict.bg 26. www.minedu.government.bg