informational campaign effects of the nutrition labeling ... · informational campaign effects of...
TRANSCRIPT

Asirvatham et al., Cogent Social Sciences (2017), 3: 1327684https://doi.org/10.1080/23311886.2017.1327684
MEDIA & COMMUNICATION STUDIES | RESEARCH ARTICLE
Informational campaign effects of the Nutrition Labeling and Education Act (NLEA) of 1990 on dietJebaraj Asirvatham1*, Paul E. McNamara2 and Kathy Baylis2
Abstract: This study examines consumer response to a mass-media educational campaign undertaken as part of the Nutrition Labeling and Education Act (NLEA) of 1990, employing media content analysis. Time and spatial variation in the nutri-tion-label information dissemination in the newspaper media were modeled in a difference-in-difference framework. The goal, however, is not to assess newspaper as a source, but to understand the impact of how nutrition information is portrayed. We find limited impact of the media informational campaign. Articles that portrayed Nutrition Facts Labels in a positive way decreased sugars intake from labeled foods. Interestingly, articles that portrayed Nutrition Facts Labels negatively had more im-pact on unlabeled foods. The findings give insights into communication of nutrition information to the public.
Subjects: Health Policy; Sociology of Media; Mass Communication; Health Communication
Keywords: nutrition information; Nutrition Labeling and Education Act; NLEA; nutrition education; nutrition; mass media; newspaper
*Corresponding author: Jebaraj Asirvatham, Department of Agribusiness Economics, Southern Illinois University Carbondale, 1205 Lincoln Drive, Carbondale, IL 62901, USA E-mails: [email protected], [email protected]
Reviewing editor:Claudia Alvares, Universidade Lusofona de Humanidades e Tecnologias, Portugal
Additional information is available at the end of the article
ABOUT THE AUTHORJebaraj Asirvatham is an applied economist who works in research areas with overlaps in economics, psychology, and nutrition and health. He has several years of research experience in applying advanced econometric and statistical methods to better model the relationships of interest in any research work, particularly in the area of nutrition and health outcomes. In a recent work, he identified causal peer-effects of obese children on the BMI of school children. He has researched the effect of food environment and education on health. In his research work, he uses science-based evidence to model economic relationships. In one specific study, he found differential probability of becoming obese based on obesity prevalence among peers by race and gender. His dissertation research was on behavioral economics of food consumption and nutrition policy, which utilized methods and concepts from economics, psychology, nutrition, and health to model and examine policy influences and behavioral determinants of nutritional outcomes. He teaches Marketing and Pricing of Agriculture Products and Financial Management in Agriculture.
PUBLIC INTEREST STATEMENTDiscussion in the mass media of nutritional tools to choose healthier could have profound effects on consumer’s dietary choices. This study examines consumer response to the mass-media informational campaign to publicize Nutrition Facts Panel (NFP). Nutrition Labeling and Education Act (NLEA) of 1990 required posting a standardized NFP on most processed food products. We conduct a media content analysis of nutrition-label information dissemination in the newspaper media. Information on the date and time of newspaper publication and the date and time of consumer survey were combined with the geographic location of the newspaper in circulation and the city of the respondent. We find limited impact of the media informational campaign. Articles that portrayed Nutrition Facts Labels in a positive way decreased sugars intake from labeled foods. Interestingly, articles that portrayed Nutrition Facts Labels negatively had more impact on unlabeled foods.
Received: 14 November 2016Accepted: 28 April 2017Published: 30 May 2017
© 2017 The Author(s). This open access article is distributed under a Creative Commons Attribution (CC-BY) 4.0 license.
Page 1 of 17
Jebaraj Asirvatham

Page 2 of 17
Asirvatham et al., Cogent Social Sciences (2017), 3: 1327684https://doi.org/10.1080/23311886.2017.1327684
1. IntroductionNutrition labels on food products provide an important source of information on nutrients and ingre-dients. More than two decades ago Nutrition Facts Panel (NFP) were required to be posted on pro-cessed foods. Increasing diet-health awareness among consumers, particularly in the 1980s, created a need for consistent, usable and understandable nutrition information on food products to help consumers make more informed choices. The Nutrition Labeling and Education Act (NLEA) of 1990 was proposed to address these concerns. Important changes included standardized label for-mat across food products, specified comparable serving sizes by food product category, and listed percent daily values. Percent daily value is the percent of a specific nutrient in a standardized serving for an individual with a 2,000 calorie-per-day requirement. Although the NLEA primarily focused on standardizing nutrition facts label, its implementation also involved an informational campaign on how to use the new NFP and its benefits.
Most of the existing literature on NLEA has studied the impacts of the standardization of labels but has largely ignored the campaign effects on nutrient intake, referred to here as dietary outcomes. The standardization of nutrition labels was indeed the more important part of NLEA, but effective communication was key to informing citizens on how to use the information presented in the NFP. The primary objective of this paper is to fill this gap in the literature by estimating the effects of the campaign on dietary outcomes. As the U.S. Food and Drug Administration (FDA) continues to look for ways to improving consumer dietary choices, it is imperative that we assess how previous cam-paigns influenced outcomes. Evaluating the nutrition benefits of such programs can lead to im-provement in consumer health by guiding communication campaigns of future nutrition policies, as well as help policymakers determine benefits of spending on public policies and programs. Implementing and overseeing NLEA cost the government an estimated $163 million in 1993 (Federal Register, 1993).
Since NFP was the main source of nutrition information available at the point-of-purchase, prodi-gious efforts were undertaken to increase public awareness of the new nutrition label among con-sumers and to teach them to read the nutrition label to make informed choices. The nutrition label informational campaign involved propagating information via the news media, including TV net-works and newspapers, and through various public health and nutrition agencies at the county, state and national levels (Kurtzweil, 1994; Van Wagner, 1994). Research on standardization of labels has, in general, found positive effects on both the comprehension of the new labels and on making healthful choices (Satia, Galanko, & Neuhouser, 2005). Previous studies report lower calories from fat, saturated fat and cholesterol among label users (Kreuter, Brennan, Scharff, & Lukwago, 1997; Neuhouser, Kristal, & Patterson, 1999). Most studies, however, evaluate the impact of label-use us-ing correlations, regression adjusted associations, or analysis of covariance. Two studies relevant to this research explicitly address the self-selection of label use to estimate its impact on dietary out-comes. Kim, Nayga, and Capps (2001) used switching regression method that relies on the proper model specification of the selection equation. They do not specifically identify a variable that might be exogenous in the nutrient intake equation. Variyam, Blaylock, and Smallwood (2002) used the absence of nutrition labels in the food away from home as the identification strategy. This strategy, as discussed in the Methods section, has an attractive feature of not relying on exclusion restrictions. While nutrition information was required for most of the packaged foods and was required to be prominently displayed at the point of unpackaged foods, it was absent for food prepared and con-sumed outside (Shapiro, 1995).
In this paper, we employ the difference-in-difference (DID) strategy used by Variyam (2008) to study consumer response to mass-media informational campaign undertaken as part of NLEA. We exploit time and spatial variation in the nutrition label information dissemination. Media variables are constructed, using concepts from media and education literature, to estimate the influence of newspaper media on dietary outcomes. Below we briefly discuss NLEA and the media campaign fol-lowed by media variable, methods, and discussion of results.
Page 3 of 17
Asirvatham et al., Cogent Social Sciences (2017), 3: 1327684https://doi.org/10.1080/23311886.2017.1327684
2. Brief history of the NLEA and the media campaignFood labeling, based on the regulations of the Food and Drug Administration (FDA) in 1973, was voluntary, and only mandatory if fortified by proteins, minerals or vitamins. The NLEA enacted in 1990 was the next major step which required all processed food products to display standardized nutrition information. As a result, 96% of the processed foods had nutrition labels in 1996, an in-crease from about 60% in 1990 (Brecher, Bender, Wilkening, McCabe, & Anderson, 2000).
Before the NLEA was in effect in 1994, the nutrition label carried information on calories from carbohydrates, fats and the whole product, and grams of protein in a non-standardized serving size. The NLEA required NFP to have information on the amount of calories from an entire serving (total), and from fats, saturated fats, and cholesterol in a standardized serving size, and servings per pack-age. Stipulations were also placed for other micronutrients, such as sodium. Calories were to be in amount and percent of reference daily intake for a 2000-calorie diet.
NLEA required that the labeling changes be accompanied by an educational campaign (Weimer, 1999). Prodigious efforts were undertaken, millions spent, and media companies were asked to propagate information on both the benefits from using and how to use. Public health agencies at Federal, State and local levels were to inform and educate the public on the NFP. The FDA made ef-forts to publicize NFP in newspapers, TVs, and also during football games. For example, one TV spot (ad) featured Kirby Puckett of the Minnesota Twins, Roger Clemens of the Boston Red Sox with the Health and Human Services (HHS) Secretary, Donna Shalala (Kessler, 1994). This was not to educate people on the labels but just to encourage consumers to use the labels. Moorman (1996) found that consumers acquired and comprehended more nutrition information from the new labels.
More recently, several cities implemented laws requiring restaurants to post nutrition information next to the items on their menu. More studies find positive impact of the NFP on diet. However, research on the menu labels does not arrive at a similar subjective conclusion (Long, Tobias, Cradock, Batchelder, & Gortmaker, 2015). Studies have suggested that restaurant consumers base their decision on taste and preferences rather than nutrition information (for example, Hatch, 2016; Loureiro & Rahmani 2016).
3. Media and nutrition label use variablesBelow we discuss the importance of media on consumption decisions and describe media variables. Television and newspapers offer a trusted avenue for obtaining news and other information (Frewer, Howard, Hedderley, & Shepherd, 1996). We use newspaper information as the media campaign in-strument because newspapers are considered a more important source of newer concepts due to giving the reader enough time to read and grasp information which can be used in decision-making (Medeiros, Russell, & Shipp, 1991). Newspapers have a wider reach among Americans and are also a cheaper source for disseminating information. Moreover, based on survey results from the Nationwide Food Consumption Survey conducted by USDA in 1987–1988, newspapers were consid-ered one of the most important health information sources among media sources (Wang, Fletcher, & Carley, 1995). The newspaper data has variation at the level of metropolitan and non-metropoli-tan statistical areas, as defined by the Office of Management and Budget (OMB). In this paper, three types of media variables are constructed to measure the impact of newspapers on dietary out-comes, which are described below.
3.1. Number of news articlesThe first media variable is the aggregate number of articles on nutrition labels by Metropolitan Statistical Area (MSA). We do not have information on whether or not an individual subscribed to a specific newspaper. News articles published in any particular geographical area, therefore, do not indicate that the former were effectively read by any individual. As such, we weighed each article against the circulation factor of the respective newspaper. The circulation factor for any newspaper in an MSA is the annual (12 monthly average) net paid a percentage of non-institutionalized house-holds that subscribed to it. Multiplying the timing of the news article publication by the circulation factor is assumed to indicate the probability of being exposed to the article.
Page 4 of 17
Asirvatham et al., Cogent Social Sciences (2017), 3: 1327684https://doi.org/10.1080/23311886.2017.1327684
3.2. Type of informationInformation theory suggests that negative information is perceived differently from positive infor-mation and that their influence on decision or outcome is also of different magnitudes (Mutondo & Henneberry, 2007). For example, in the case of pork treated by irradiation to control parasite (Trichinella), Fox, Hayes, and Shogren (2002) found that the negative information effect dominated when both positive and negative information were presented at the same time, even after revealing that a consumer advocacy group was the source of negative information. In this study, each article is classified as positive or negative based on the article content. Media studies on some aspects of foods suggest that classifying positive and negative information could be a subjective process (Mazzocchi, 2006). In this study, however, there was less ambiguity or subjectivity in classifying an article as positive or negative. News articles that portrayed labels as confusing, inconsistent and not useful, or discredited the label information were deemed negative and less subject to judgment. If the news article simply explained the type of information available in the nutrition label and how to use it, it was considered positive. Out of the 140 articles, 67 were considered positive and 8 were considered negative.
3.3. Depth of news articleSome news articles on nutrition make a passing comment on nutrition labels, while others explain the nutrition label in detail. Any article that discussed labels in detail and objectively was considered detailed. We created another dummy variable to indicate whether or not the article was detailed. Some of the newer aspects introduced in the nutrition labels were percent daily values and stand-ardized serving sizes. Any article that described daily values and standardized serving size, especially with an example, was considered “detailed.” About 50 were considered detailed, and 6 were negative.
Below we give two examples of articles that were used to create media variables. The following article was rated positive but labeled “not detailed.” The article was titled, “There Are No ‘Bad’ Foods”, with the following description: “Use the NFP on the new food label to help determine how much fat is in different foods. Use this information to balance your food choices.”1 Some articles which portrayed NFP as confusing, not useful or made other negative remarks were rated as nega-tive. An example of a negative article had the title “Nutrition Labels May Spur Bad Food Choices, Study Says.”2 The other news articles analysed were rated as neither positive nor negative.
3.4. Nutrition label useA five-point Likert scale was used to assess the use of NFP by respondents, who were asked how often he/she used NFP on food products. The label use variable defined in this study is a binary vari-able where 1 is given to those respondents who “always”, “often” or “sometimes” used nutritional facts panel. Those who “rarely” or “never” used were assigned 0.
4. MethodsThe primary objective is to estimate the impacts of the informational campaign of NLEA on dietary outcomes. Dietary outcomes, as measured by nutrient intake, is regressed on variables that might influence dietary choices. Label use and media variables are of primary interest in this study. Media variables were created using content from news articles on the nutritional label that were published in different locations at different points in time. News articles discussing NFP were staggered over a 3- to 4-year period, overlapping with the entire CSFII data collection process, which spans a 3-year period, 1994–1996. Survey participants, who maintained food diaries, were chosen from different locations and surveyed at different points in time to constitute a more representative sample. Care was taken to survey respondents along different days in a week and different times in a year. Other than this temporal dimension we also crossed the residential location of the respondent with the geographic area where that specific newspaper was distributed. Thus, media content and food dia-ries across MSAs give time and spatial variation to media content information dissemination. In other words, not all respondents in the same sample were exposed to the news articles. This

Page 5 of 17
Asirvatham et al., Cogent Social Sciences (2017), 3: 1327684https://doi.org/10.1080/23311886.2017.1327684
occurred because respondents were either in a geographic area that did not publish news article on NFP or were surveyed (CSFII data) before the publication of such news articles.
A significant challenge in modeling the response to the campaign is that a person who uses labels or reads nutrition information could be more interested in nutrition, and, therefore might make healthier choices (Miller & Cassady, 2015). Such healthful choices, if present, could falsely be attrib-uted to the positive effect of the campaign. This is often referred to as self-selection. Therefore, label use and media variable estimates cannot be considered free of bias in an equation with a dietary choice as the outcome variable. Even though variables focusing on the importance of nutrition, taste, and price are included in the model, there could be some unobserved characteristics that might be correlated with label use and media variables.
Variyam used the exemption of food-away-from-home (FAFH) from labeling requirement to ob-tain reliable estimates. The food-at-home (FAH) include food purchased from store, vending ma-chines and via mail order. The rest of the food products were considered unlabeled which included food from restaurant, fast food/pizza, bar, tavern, lounge, school cafeteria, other cafeteria, care center, soup kitchen, meals on wheels, via other programs, animals grown or caught, gift from someone else, common pot or tray, residential facility, breast milk/water as ingredient and fish caught. Although fresh foods are not all labeled individually, NLEA required grocers to display nutri-ent information by the produce. Since NFP was required only for packaged processed foods, the consumers see the nutrition information only for those food products. The FAFH is exempt from mandatory labeling and thereby serves as a control group of food products while the FAH, which has NFP, would serve as the treatment group of food products. Each nutrient can be obtained from FAFH and FAH, which could formally be written as two different equations. Differentiating the two equa-tions, for each nutrient, would remove unobserved factors that might be correlated with the media and label use variables. This is shown in the statistical model for nutrient intake below:
where yi denotes the quantity of the specified nutrient in the individual i’s diet. Each of the nutrients, listed in the NRP is analyzed separately. Subscript H denotes labeled foods; L stands for label use; M is the media variable; X is a vector of demographic and other variables; η is the individual level unob-served characteristics; and the last term is the error term. Equation for the FAFH is specified as:
where subscript A stands for FAH; and all else are the same as in equation 1. Differentiating equation 2 from 3 removes all unobserved factors, especially those that influence both in similar magnitudes. The modified equation is:
where the coefficient of the label use variable, γ2 is now the effect of the media variable after differ-entiating the unobserved factors influencing dietary outcomes and potentially correlated with me-dia variables. In this paper, we run individual equations and then calculate the difference between the estimates of media variables.
One of the challenges in modeling FAFH is that about 19 percent of the respondents reported no FAFH consumption. To account for these zeros, Variyam used the Heckman selection method, but the inverse mills ratio was not significant in most of the nutrients, and the Wald-test statistics also do not support using it. As such, the Tobit model was used so as to obtain comparable estimates, which has been used to account for zero nutrient intake (Chandran, 2004; Heien & Wessells, 1990).
(1)YHi = �H0 + �H1L + �H2M + �H3X + �i + �Hi
(2)YAi = �A0 + �A1L + �A2M + �A3X + �i + �Ai
Δyi = �0+ �
1L + �
3M + �
3X

Page 6 of 17
Asirvatham et al., Cogent Social Sciences (2017), 3: 1327684https://doi.org/10.1080/23311886.2017.1327684
We integrate MSA and non-MSA information of the respondents. Newspaper articles discussing nutrition labels give time and spatial variation to measure the impact of the informational campaign on nutrient intake.
5. DataThe datasets used are the CSFII conducted in 1994–1996, the HEI constructed by the CNPP, and the newspaper database maintained by Access World News, commonly referred as NewsBank. NewsBank is a premier information provider that “consolidates current and archived information from thou-sands of newspaper titles, as well as newswires, web editions, blogs, videos, broadcast transcripts, business journals, periodicals, government documents and other publications (http://newsbank.com/about-newsbank).” In this research we include newspapers and newswires only because online news were not a popular or a common source of news during the NLEA campaign in the early 1990s. For example, in 1994 only about 11 million American households had a computer and 8 million among them had modem-equipped computers (Morin, 2013) (http://www.people-press.org/1995/10/16/americansgoing-online-explosive-growth-uncertain-destinations/).
CSFII and the Diet and Health Knowledge Survey (DHKS) were two nationwide surveys conducted by the Agricultural Research Service (ARS), USDA during 1994–1996. These surveys were designed to measure the amount of different types of food eaten by Americans. The DHKS was the first national survey of attitudes and knowledge on diet and health for ages 20 years and up. The target popula-tion of these surveys was the noninstitutionalized individuals in all 50 states and Washington, DC. A sample of 5,765 respondents who were part of CSFII participated in the DHKS. Only one person in each household was selected for DHKS, the latter recording the responses of the primary respond-ent’s diet and health knowledge. The DHKS participant’s food intake was then linked to respective food intake data. CSFII contains information on serving sizes of the different food categories and not calories. The amount of calories from these food groups is the product of serving sizes and the aver-age calories hereby obtained. The nutrient intakes were expressed as quantities per 1,000 calories of total energy, i.e. nutrient density, except for the total energy intake which was expressed as calories per kilogram of food, i.e. energy density. Table 1 shows the averages for the various covariates used in the econometric models. Several other variables included in the regression model as control vari-ables were employment, year of survey (1994–1996), region, age, race, gender, urbanization of the residence place, height of respondents, and a variable indicating different levels of exercise. Individuals performing intensive physical activity could be consuming a higher proportion of pro-teins and fats. A mean of 3.9 indicates that the activity level was close to once a week in the sample. However, the standard error was about two points for a mean of about 4 points, implying high vari-ability within the sample.
The Centre for Nutrition Policy and Promotion (CNPP) constructed the Healthy Eating Index (HEI) to measure the healthfulness of the diet of individuals based on the macronutrient composition of their diet in adherence to the existing dietary guidelines. A higher score implies a better diet or a healthier diet. Other than HEI, we use the proportion of calories from fats, as other indicators of diet quality.
5.1. Newspaper databaseThe NLEA campaign started in the year 1993 when the format of NFP was signed into effect by President George Bush. We collected newspaper articles published on NFP during the informational campaign period and maintained by Access NewsBank Circulation, an annual publication of circula-tion figures, which had information of individual newspapers published by census-defined statistical areas. These two together made up the news and circulation database which was then matched with the respective statistical areas of each respondent in the Continuing Survey of Food Intakes of Individuals (CSFII). The media variable is the circulation data for each of the articles summed up at primary sampling unit level, which is a metropolitan or non-metropolitan statistical area, as defined by Office of Management and Budget.

Page 7 of 17
Asirvatham et al., Cogent Social Sciences (2017), 3: 1327684https://doi.org/10.1080/23311886.2017.1327684
The following criteria were applied to select articles during the period January 1993 through December 1996. Only articles that had the word “nutrition” in the lead paragraph, and keywords “nutrition information,” “nutrition label,” or “nutrition facts” anywhere in the article were selected. Out of the total of 369 news articles, only 140 were chosen that were published in the geographic areas where the CSFII survey respondents resided.
Among all statistical areas covered by the CSFII respondents, only 40% (25 out of 62) of the geo-graphic areas had newspapers publishing companies or agencies publish any article matching the above criteria. This translated into 30% of respondents who might have read any such newspaper article. Any article that discussed any of the aspects of the new NFP with the above criteria was in-cluded. Some articles that were not counted included those that discussed recipes, nutrient claims (low fat, for example), or nutrition workshop announcements.
Table 1. Mean and standard deviation (in parentheses) of nutrient intakes of labeled and unlabeled food products by media exposure listed on the NFP
Notes: About 1,718 (31%) respondents were exposed to media and about 3,958 (69%) were not.IU stands for International units, which is equivalent to 0.3 micrograms (mcg).aCalories here is calories per 1,000 g of food.
Nutrients Unit per 1,000 calories
Labeled products Unlabeled productsMedia
exposureNo media exposure
Media exposure
No media exposure
Energy Caloriesa 959 960 986 954
(358) (324) (895) (823)
Total fat Grams 36 35 32 32
(11) (11) (22) (21)
Cholesterol Grams 136 134 118 119
(103) (106) (172) (153)
Sodium Grams 1,727 1,704 1,398 1,459
(654) (700) (1,282) (1,300)
Carbohydrates Grams 130 132 87 88
(31) (31) (62) (59)
Protein Grams 39 40 32 32
(13) (13) (26) (24)
Sat fat Grams 12 12 10 10
(5) (5) (8) (8)
Fiber Grams 9 9 7 6
(5) (6) (9) (8)
Sugars Grams 6 6 5 6
(6) (5) (8) (8)
Vitamin C Milligram 56 59 42 34
(59) (67) (135) (76)
Vitamin A IU 3,979 4,170 3,323 2,987
(5,575) (6,455) (14,591) (12,441)
Calcium Milligram 387 390 267 281
(218) (198) (389) (303)
Iron Milligram 8 9 6 6
(5) (5) (6) (5)

Page 8 of 17
Asirvatham et al., Cogent Social Sciences (2017), 3: 1327684https://doi.org/10.1080/23311886.2017.1327684
It is important to keep in mind that information on the role the FDA played in encouraging report-ers to write about NLEA is not available.
6. ResultsOLS and Tobit estimates are similar for labeled products since less than one percent reported zero food products purchased from the store, vending machine or via mail order. But the OLS and Tobit estimates differed for unlabeled food products since there was about 20 percent who reported zero values. Below, we discuss the FAH (labeled) and FAFH (unlabeled) results separately, and the DID estimates of the media variable (see Table 2).
6.1. Total media exposureTotal circulation had a desirable negative effect on total fat, saturated fat intake, and cholesterol. Total circulation did not influence nutrient consumption from unlabeled products but had a very small effect on sodium, sugar, and protein consumption from labeled foods (Tables 3 and 4). As ex-pected, protein was higher (0.008 g per 1,000 calories) and sugars (0.003) were lower, but sodium
Table 2. Mean and standard deviation (in parentheses) of nutrient intakes of select nutrient intakes by type of media exposure
Notes: About 1,718 (31%) respondents were exposed to media and about 3,958 (69%) were not.IU stands for International units, which is equivalent to 0.3 micrograms (mcg) for vitamin A.aCalories per 1,000 g (= 1 kg) of food.
Nutrients Unit per 1,000 calories
Labeled products Unlabeled productsPositive articles
Negative articles
Positive articles
Negative articles
Energy Caloriesa 961 947 986 954
(325) (309) (895) (823)
Total fat Grams 35 33 32 32
(11) (12) (22) (21)
Cholesterol Grams 135 122 118 119
(108) (84) (172) (153)
Sodium Grams 1,711 1,627 1,398 1,459
(701) (695) (1,282) (1,300)
Carbohydrates Grams 132 131 87 88
(31) (33) (62) (59)
Protein Grams 40 40 32 32
(13) (15) (26) (24)
Sat fat Grams 12 12 10 10
(5) (6) (8) (8)
Fiber Grams 9 9 7 6
(6) (4) (9) (8)
Sugars Grams 6 5 5 6
(5) (6) (8) (8)
Vitamin C Milligram 59 60 42 34
(68) (47) (135) (76)
Vitamin A IU 4,145 4,360 3,323 2,987
(6,550) (4,773) (14,591) (12,441)
Calcium Milligram 388 422 267 281
(199) (183) (389) (303)
Iron Milligram 9 9 6 6
(5) (6) (5) (4)

Page 9 of 17
Asirvatham et al., Cogent Social Sciences (2017), 3: 1327684https://doi.org/10.1080/23311886.2017.1327684
(0.3) was slightly higher from labeled foods. Interestingly, there is some evidence that total circula-tion did reduce intake of saturated (0.004), total fats (0.012), and total energy (0.5), in very small amounts, from unlabeled products. The DID estimates showed a reduced saturated fat (0.7 g) and calcium (18) intake, and higher carbohydrates (4) and fiber (0.8) intake from labeled products rela-tive to the unlabeled products. The censored tobit estimates, however, showed only 0.7 g reduced intake of saturated fat.
Table 3. DID estimate (OLS) of total circulation on nutrient intake per serving, listed on the NFP
Notes: p-values are given in parentheses. IU stands for International units.About 1,718 (31%) respondents were exposed to media and about 3,958 (69%) were not.aCalories per 1,000 g (= 1 kg) of food.*Significant at the 10% level.**Significant at the 5% level.***Significant at the 1% level.
Nutrients Unit per 1,000 calories Labeled products Unlabeled products DIDEnergy Caloriesa 0.0324 −0.354 −19.509
(−0.705) (−0.101) (−0.5)
Total fat Grams 0.0013 −0.0096* −1.132
(−0.639) (−0.069) (−0.17)
Cholesterol Grams 0.0349 0.0418 1.904
(−0.168) (−0.306) (−0.78)
Sodium Grams 0.294* −0.232 −10.544
(−0.078) (−0.461) (−0.84)
Carbohydrates Grams −0.0064 −0.0093 3.89*
(−0.402) (−0.533) (−0.07)
Protein Grams 0.0076** −0.0034 −0.704
(−0.019) (−0.589) (−0.51)
Sat fat Grams 0.0008 −0.0033* −0.654***
(−0.481) (−0.08) (−0.01)
Fiber Grams −0.0005 −0.0014 0.795**
(−0.676) (−0.514) (−0.04)
Sugars Grams −0.0029** 0.0009 0.047
(−0.042) (−0.645) (−0.9)
Vitamin C Milligram −0.0197 −0.0051 3.298
(−0.194) (−0.852) (−0.36)
Vitamin A IU −1.576 2.797 887.766
(−0.275) (−0.427) (−0.12)
Calcium Milligram −0.0657 −0.106 −18.201*
(−0.21) (−0.248) (−0.1)
Iron Milligram 0.0008 −0.0013 0.346
(0.511) (0.337) (0.18)
Page 10 of 17
Asirvatham et al., Cogent Social Sciences (2017), 3: 1327684https://doi.org/10.1080/23311886.2017.1327684
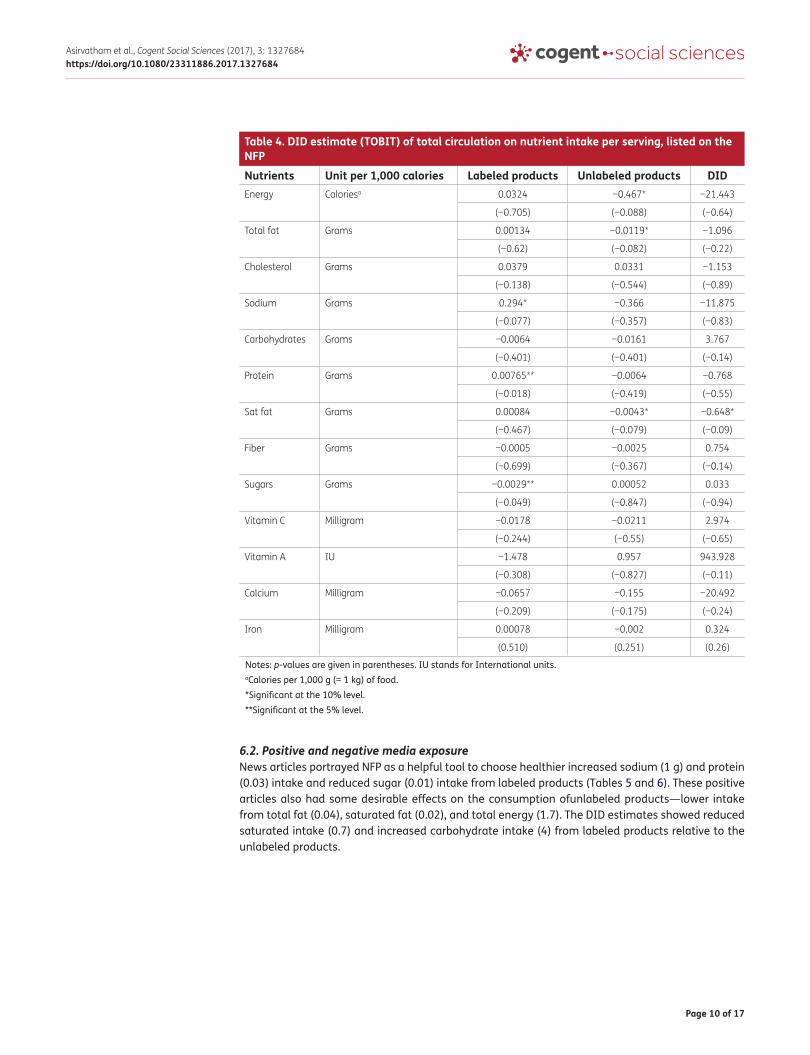
6.2. Positive and negative media exposureNews articles portrayed NFP as a helpful tool to choose healthier increased sodium (1 g) and protein (0.03) intake and reduced sugar (0.01) intake from labeled products (Tables 5 and 6). These positive articles also had some desirable effects on the consumption ofunlabeled products—lower intake from total fat (0.04), saturated fat (0.02), and total energy (1.7). The DID estimates showed reduced saturated intake (0.7) and increased carbohydrate intake (4) from labeled products relative to the unlabeled products.
Table 4. DID estimate (TOBIT) of total circulation on nutrient intake per serving, listed on the NFP
Notes: p-values are given in parentheses. IU stands for International units.aCalories per 1,000 g (= 1 kg) of food.*Significant at the 10% level.**Significant at the 5% level.
Nutrients Unit per 1,000 calories Labeled products Unlabeled products DIDEnergy Caloriesa 0.0324 −0.467* −21.443
(−0.705) (−0.088) (−0.64)
Total fat Grams 0.00134 −0.0119* −1.096
(−0.62) (−0.082) (−0.22)
Cholesterol Grams 0.0379 0.0331 −1.153
(−0.138) (−0.544) (−0.89)
Sodium Grams 0.294* −0.366 −11.875
(−0.077) (−0.357) (−0.83)
Carbohydrates Grams −0.0064 −0.0161 3.767
(−0.401) (−0.401) (−0.14)
Protein Grams 0.00765** −0.0064 −0.768
(−0.018) (−0.419) (−0.55)
Sat fat Grams 0.00084 −0.0043* −0.648*
(−0.467) (−0.079) (−0.09)
Fiber Grams −0.0005 −0.0025 0.754
(−0.699) (−0.367) (−0.14)
Sugars Grams −0.0029** 0.00052 0.033
(−0.049) (−0.847) (−0.94)
Vitamin C Milligram −0.0178 −0.0211 2.974
(−0.244) (−0.55) (−0.65)
Vitamin A IU −1.478 0.957 943.928
(−0.308) (−0.827) (−0.11)
Calcium Milligram −0.0657 −0.155 −20.492
(−0.209) (−0.175) (−0.24)
Iron Milligram 0.00078 −0.002 0.324
(0.510) (0.251) (0.26)
Page 11 of 17
Asirvatham et al., Cogent Social Sciences (2017), 3: 1327684https://doi.org/10.1080/23311886.2017.1327684
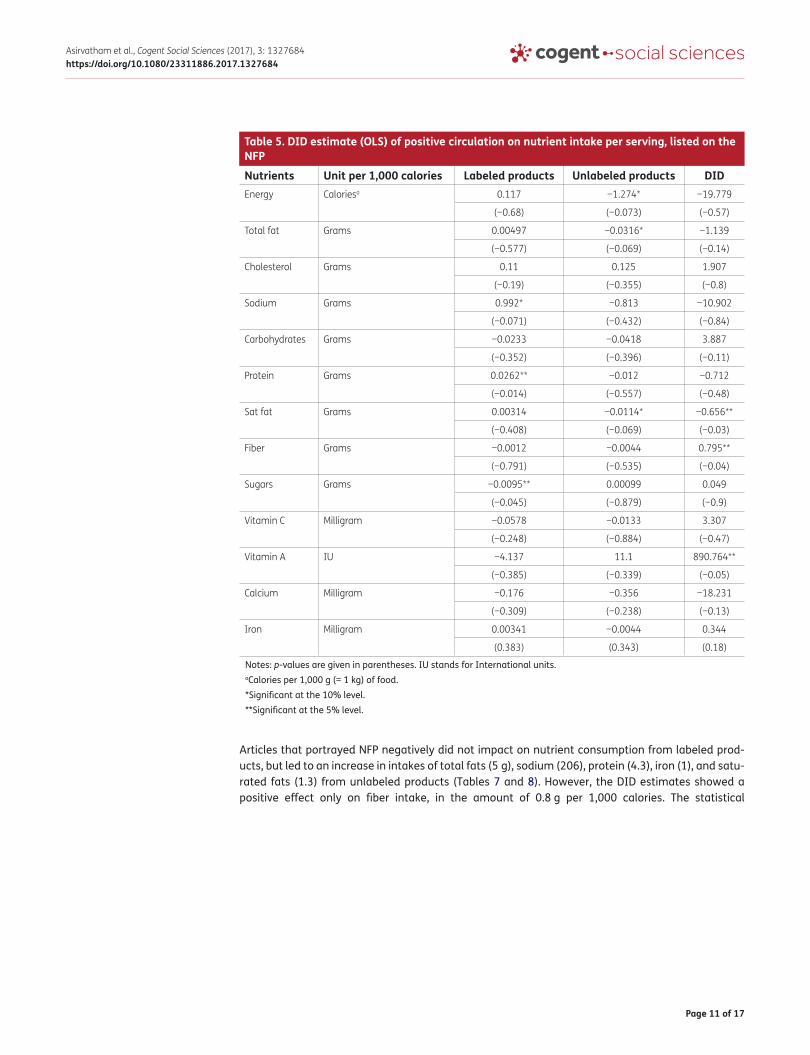
Articles that portrayed NFP negatively did not impact on nutrient consumption from labeled prod-ucts, but led to an increase in intakes of total fats (5 g), sodium (206), protein (4.3), iron (1), and satu-rated fats (1.3) from unlabeled products (Tables 7 and 8). However, the DID estimates showed a positive effect only on fiber intake, in the amount of 0.8 g per 1,000 calories. The statistical
Table 5. DID estimate (OLS) of positive circulation on nutrient intake per serving, listed on the NFP
Notes: p-values are given in parentheses. IU stands for International units.aCalories per 1,000 g (= 1 kg) of food.*Significant at the 10% level.**Significant at the 5% level.
Nutrients Unit per 1,000 calories Labeled products Unlabeled products DIDEnergy Caloriesa 0.117 −1.274* −19.779
(−0.68) (−0.073) (−0.57)
Total fat Grams 0.00497 −0.0316* −1.139
(−0.577) (−0.069) (−0.14)
Cholesterol Grams 0.11 0.125 1.907
(−0.19) (−0.355) (−0.8)
Sodium Grams 0.992* −0.813 −10.902
(−0.071) (−0.432) (−0.84)
Carbohydrates Grams −0.0233 −0.0418 3.887
(−0.352) (−0.396) (−0.11)
Protein Grams 0.0262** −0.012 −0.712
(−0.014) (−0.557) (−0.48)
Sat fat Grams 0.00314 −0.0114* −0.656**
(−0.408) (−0.069) (−0.03)
Fiber Grams −0.0012 −0.0044 0.795**
(−0.791) (−0.535) (−0.04)
Sugars Grams −0.0095** 0.00099 0.049
(−0.045) (−0.879) (−0.9)
Vitamin C Milligram −0.0578 −0.0133 3.307
(−0.248) (−0.884) (−0.47)
Vitamin A IU −4.137 11.1 890.764**
(−0.385) (−0.339) (−0.05)
Calcium Milligram −0.176 −0.356 −18.231
(−0.309) (−0.238) (−0.13)
Iron Milligram 0.00341 −0.0044 0.344
(0.383) (0.343) (0.18)

Page 12 of 17
Asirvatham et al., Cogent Social Sciences (2017), 3: 1327684https://doi.org/10.1080/23311886.2017.1327684
insignificance of negative articles in the case of labeled foods also indicates that these articles did not result in any difference among the respondents whenever nutrition label information was pre-sent. It might, however, have created a lax attitude towards foods that did not have nutrition
Table 6. DID estimate (TOBIT) of positive circulation on nutrient intake per serving, listed on the NFP
Notes: p-values are given in parentheses. IU stands for International units.aCalories per 1,000 g (= 1 kg) of food.*Significant at the 10% level.**Significant at the 5% level.***Significant at the 1% level.
Nutrients Unit per 1,000 calories Labeled products Unlabeled products DIDEnergy Caloriesa 0.117 −1.682* −21.79
(−0.679) (−0.062) (−0.56)
Total fat Grams 0.00522 −0.0403* −1.105
(−0.559) (−0.075) (−0.25)
Cholesterol Grams 0.12 0.0837 −1.159
(−0.153) (−0.642) (−0.89)
Sodium Grams 0.992* −1.307 −12.326
(−0.071) (−0.32) (−0.85)
Carbohydrates Grams −0.0233 −0.0661 3.759***
(−0.351) (−0.295) (−0.01)
Protein Grams 0.0263** −0.0229 −0.778
(−0.014) (−0.38) (−0.52)
Sat fat Grams 0.00323 −0.015* −0.652*
(−0.396) (−0.063) (−0.1)
Fiber Grams −0.0009 −0.0085 0.753
(−0.817) (−0.361) (−0.12)
Sugars Grams −0.0092* −0.0013 0.034
(−0.054) (−0.883) (−0.93)
Vitamin C Milligram −0.0511 −0.0725 2.973
(−0.31) (−0.533) (−0.58)
Vitamin A IU −3.744 4.52 945.651
(−0.433) (−0.755) (−0.17)
Calcium Milligram −0.176 −0.534 −20.556
(−0.308) (−0.156) (−0.13)
Iron Milligram 0.00341 −0.0077 0.322
(0.382) (0.159) (0.30)

Page 13 of 17
Asirvatham et al., Cogent Social Sciences (2017), 3: 1327684https://doi.org/10.1080/23311886.2017.1327684
information. This could also imply that negative information could have fostered discussion rather than acceptance of such. It is important to note that the articles deemed negative discussed label formatting and other features of the NFP except label information.
Table 7. DID estimate (OLS) of negative circulation on nutrient intake per serving, listed on the NFP
Notes: p-values are given in parentheses. IU stands for International units.aCalories per 1,000 g (= 1 kg) of food.*Significant at the 10% level.**Significant at the 5% level.
Nutrients Unit per 1,000 calories Labeled products Unlabeled products DIDEnergy Caloriesa −13.4 −5.608 −19.583
(−0.507) (−0.912) (−0.53)
Total fat Grams −0.528 2.816** −1.116
(−0.407) (−0.024) (−0.18)
Cholesterol Grams −2.707 10.92 1.982
(−0.65) (−0.257) (−0.79)
Sodium Grams 0.639 152.1** −9.848
(−0.987) (−0.04) (−0.84)
Carbohydrates Grams 2.072 1.632 3.888*
(−0.247) (−0.643) (−0.06)
Protein Grams −0.623 3.202** −0.686
(−0.414) (−0.029) (−0.43)
Sat fat Grams −0.146 0.735 −0.65*
(−0.59) (−0.102) (−0.03)
Fiber Grams 0.0655 0.461 0.797**
(−0.821) (−0.368) (−0.03)
Sugars Grams 0.161 −0.853* 0.042
(−0.636) (−0.068) (−0.92)
Vitamin C Milligram 2.232 3.8 3.314
(−0.532) (−0.559) (−0.46)
Vitamin A IU 206.8 361.2 890.171**
(−0.543) (−0.664) (−0.04)
Calcium Milligram 1.862 26.72 −18.058
(−0.88) (−0.216) (−0.17)
Iron Milligram 0.0907 0.623* 0.348
(0.745) (0.058) (0.17)

Page 14 of 17
Asirvatham et al., Cogent Social Sciences (2017), 3: 1327684https://doi.org/10.1080/23311886.2017.1327684
7. ConclusionThe purpose of this study was to study the media campaign effects of one of the most important nutrition public policies in America that provided nutrition information to consumers at the point-of-purchase. The DID estimates showed that total media circulation only reduced saturated fat intake from labeled products relative to unlabeled products. Total circulation slightly increased protein and sodium intake but decreased sugars intake from labeled foods. It is worth noting that total circula-tion reduced, although only in small amounts, total fat, saturated fat and total energy from unla-beled foods. A similar impact was observed in the case of positive news articles for both the labeled and unlabeled products. One reason could be that a larger percentage of positive news articles was found in the total circulation. Unexpectedly, sodium intake from labeled products was higher in re-sponse to total media circulation and positive circulation, although in very small amounts. Sodium might not be among the primary nutrients of consumer choice. Sodium is used in packaged foods as a preservative, flavor enhancer, pH control agent, and an acidulant.
Table 8. DID estimate (TOBIT) of negative circulation on nutrient intake per serving, listed on the NFP
Notes: p-values are given in parentheses. IU stands for International units.aCalories per 1,000 g (= 1 kg) of food.*Significant at the 10% level.**Significant at the 5% level.
Nutrients Unit per 1,000 calories Labeled products Unlabeled products DIDEnergy Caloriesa −13.4 13.04 −21.365
(−0.506) (−0.845) (−0.64)
Total fat Grams −0.529 4.63** −1.08
(−0.407) (−0.017) (−0.33)
Cholesterol Grams −2.727 26.09 −1.08
(−0.65) (−0.104) (−0.9)
Sodium Grams 0.639 206.2** −11.295
(−0.987) (−0.044) (−0.84)
Carbohydrates Grams 2.072 2.883 3.769
(−0.246) (−0.535) (−0.25)
Protein Grams −0.623 4.274** −0.753
(−0.414) (−0.036) (−0.56)
Sat fat Grams −0.146 1.299* −0.644
(−0.59) (−0.052) (−0.12)
Fiber Grams 0.0645 0.742 0.756*
(−0.824) (−0.292) (−0.08)
Sugars Grams 0.156 −0.628 0.03
(−0.647) (−0.344) (−0.94)
Vitamin C Milligram 2.203 13.87 2.995
(−0.54) (−0.183) (−0.54)
Vitamin A IU 205.4 1,651.3 947.187
(−0.547) (−0.205) (−0.15)
Calcium Milligram 1.862 40.43 −20.345
(−0.88) (−0.163) (−0.2)
Iron Milligram 0.0907 0.854* 0.326
(0.745) (0.063) (0.25)
Page 15 of 17
Asirvatham et al., Cogent Social Sciences (2017), 3: 1327684https://doi.org/10.1080/23311886.2017.1327684
Interestingly, negative news articles did not influence labeled but only unlabeled foods. Consumption of such articles led to increased intakes of certain unhealthier nutrients including total fats, sodium, and saturated fats. The statistical insignificance of negative articles in the case of la-beled foods also indicates that these articles did not result in any difference among the respondents whenever nutrition label information was present. It might, however, have created a lax attitude towards foods that did not have nutrition information. It is important to keep in mind that the DID estimates are consistent only if the unobserved factors for both FAFH and FAH are similar. There could indeed be factors that influence FAFH and FAH differently.
Limited campaign effects might be due to the heavy focus on verbal, rather than visual or pictorial, communication. One of the reasons for such differences among individuals is that the educational campaign had not reached all people. For instance, one study reports that only one in three women recalls receiving labeling education in any form (Byrd-Bredbenner, Alfieri, Wong, & Cottee, 2001). Allen (1995) found, using media content analysis, that the labeling information was insufficiently comprehensive to understand and use nutrition labels.
While the study does present important findings, results must be interpreted keeping the limita-tions in mind. First, not all respondents, though adults, were meal preparers, which might indicate that not all respondents had full control over what was prepared at home. Second, the media vari-able assumes that an individual surveyed in a specific geographic region was exposed to that news article, while this may not necessarily be the case. Third, data on campaign that was specifically initi-ated by FDA or other federal agencies is not available. Our results, however, point out important implications, though qualified.
Future informational campaigns should incorporate theoretical concepts from Media and Education Studies to communicate effectively, considering cognitive styles and cognitive skills. As suggested by Jonassen and Grabowski (1993), visual and verbal messages should have been used to better illustrate how to use information in NFP to increase readership and comprehension. One study on newspaper readers, for example, found that about 75 percent of all photos in newspapers are “looked at” in comparison with only 25 percent of the text (Garcia, Stark, & Miller, 1991). Effective communication of credible nutrition information by reliable sources would improve consumer health.
AcknowledgementsCritical comments and suggestions from Karen Chapman-Novakofski, Craig Gundersen, Charles Nelson, and Laurian Unnevehr, Department of Agricultural and Consumer Economics are gratefully acknowledged. Excellent editorial comments from Maria Crawford have improved the writing, and we are thankful to her.
FundingThe authors received no direct funding for this research.
Author detailsJebaraj Asirvatham1
E-mails: [email protected], [email protected] ID: http://orcid.org/0000-0002-5374-5271Paul E. McNamara2
E-mail: [email protected] Baylis2
E-mail: [email protected] Department of Agribusiness Economics, Southern Illinois
University Carbondale, 1205 Lincoln Drive, Carbondale, IL 62901, USA.
2 Department of Agricultural and Consumer Economics, University of Illinois at Urbana-Champaign, Champaign, IL, USA.
Citation informationCite this article as: Informational campaign effects of the Nutrition Labeling and Education Act (NLEA) of 1990 on diet, Jebaraj Asirvatham, Paul E. McNamara & Kathy Baylis, Cogent Social Sciences (2017), 3: 1327684.
Notes1. Published on Tuesday, 9 April 1996, written by Michele
Murphy Wise, and Barbara Zonakis in page D2 in the Section Health & Fitness in the newspaper Post-Tribune (IN).
2. Published on Monday, 16 October 1995, written by Paul Raeburn in page 5-B in the newspaper The Advocate (Baton Rouge, LA).
DataThe underlying research data for this article can be accessed at https://www.ars.usda.gov/northeast-area/beltsville-md/beltsville-human-nutrition-research-center/food-surveys-research-group/docs/csfii-1994-1996-1998-and-dhks-1994-1996/.
ReferencesAllen, A. M. (1995). The new nutrition facts label in the print
media: A content analysis. Journal of the American Dietetic Association, 95, 348–351. doi:10.1016/S0002-8223(95)00089-5

Page 16 of 17
Asirvatham et al., Cogent Social Sciences (2017), 3: 1327684https://doi.org/10.1080/23311886.2017.1327684
Brecher, S. J., Bender, M. M., Wilkening, V. L., McCabe, N. M., & Anderson, E. M. (2000). Status of nutrition labeling, health claims, and nutrient content claims for processed foods: 1997 food label and package survey. Journal of the American Dietetic Association, 100, 1057–1062. doi:10.1016/S0002-8223(00)00308-4
Byrd-Bredbenner, C., Alfieri, L., Wong, A., & Cottee, P. (2001). The inherent educational qualities of nutrition labels. Family and Consumer Sciences Research Journal, 29, 265–280. https://doi.org/10.1177/1077727X01293004
Chandran, R. (2004). A tobit analysis of WIC children’s consumption of pyramid group foods. Paper presented at the American Agricultural Economics Association, Denver, CO. Retrieved from http://ageconsearch.umn.edu/bitstream/19998/1/sp04ch04.pdf
Federal Register. (1993, January 6). Regulatory impact analysis of the final rules to amend the food labeling regulations. Federal Register, 58, 2941.
Fox, J. A., Hayes, D. J., & Shogren, J. F. (2002). Consumer preferences for food irradiation: How favorable and unfavorable descriptions affect preferences for irradiated pork in experimental auctions. Journal of Risk & Uncertainty, 24, 75–95. https://doi.org/10.1023/A:1013229427237
Frewer, L. J., Howard, C., Hedderley, D., & Shepherd, R. (1996). What determines trust in information about food-related risks? Underlying psychological constructs. Risk Analysis, 16, 473–486. doi:10.1111/j.1539-6924.1996.tb01094.x
Garcia, M. R., Stark, M. M., & Miller, E. (1991). Eyes on the news. St. Petersburg, FL: The Poynter Institute.
Hatch, C. M. D. (2016). Examining the use of nutrition information on restaurant menus. Journal of Food Products Marketing, 22, 118–135.
Heien, D., & Wessells, C. R. (1990). Demand systems estimation with microdata: A censored regression approach. Journal of Business & Economic Statistics, 8, 365–371.
Jonassen, D. H., & Grabowski, B. L. (1993). Handbook of individual difference, learning, and instruction. Hillsdale, NJ: Lawrence Erlbaum Associates.
Kessler, D. D. (1994, May 3), Addressing the food marketing institute annual convention. Chicago, IL. Retrieved August 23, 2016, http://www.fda.gov/NewsEvents/Speeches/ucm106534.htm
Kim, S., Nayga, Jr, R. M., & Capps, Jr, O. (2001). Health knowledge and consumer use of nutritional labels: The issue revisited. Agricultural and Resource Economics Review, 30, 10–19. https://doi.org/10.1017/S1068280500000502
Kreuter, M. W., Brennan, L. K., Scharff, D. P., & Lukwago, S. N. (1997). Do nutrition label readers eat healthier diets? behavioral correlates of adults’ use of food labels. American Journal of Preventive Medicine, 13, 277–283.
Kurtzweil, P. (1994, April ). Food label close-up. FDA Consumer, p. 28.
Long, M. W., Tobias, D. K., Cradock, A. L., Batchelder, H., & Gortmaker, S. L. (2015). Systematic review and meta-analysis of the impact of restaurant menu calorie labeling. American Journal of Public Health, 105, e11–e24.
Loureiro, M. L., & Rahmani, D. (2016). The incidence of calorie labeling on fast food choices: A comparison between stated preferences and actual choices. Economics & Human Biology, 22, 82–93.
Mazzocchi, M. (2006). No news is good news: Stochastic parameters versus media coverage indices in demand models after food scares. American Journal of Agricultural Economics, 88, 727–741.
Medeiros, L., Russell, W., & Shipp, R. (1991). Nutrition knowledge as influenced by source of nutrition information. Nutrition Research, 11, 979–988.
Miller, L. M. S., & Cassady, D. L. (2015). The effects of nutrition knowledge on food label use. A review of the literature. Appetite, 92, 207–216. doi:10.1016/j.appet.2015.05.029
Morin, R. (2013, July 11). Is childhood obesity contagious? Pew Research Center. Retrieved from http://www.pewresearch.org/fact-tank/2013/07/11/is-childhood-obesity-contagious/
Moorman, C. (1996). A quasi-experiment to assess the consumer and informational determinants of nutrition information processing activities: The case of the nutrition labeling and education act. Journal of Public Policy & Marketing, 15, 28–44.
Mutondo, J. E., & Henneberry, S. R. (2007). A source-differentiated analysis of U.S. meat demand. Journal of Agricultural and Resource Economics, 32, 515–519.
Neuhouser, M. L., Kristal, A. R., & Patterson, R. E. (1999). Use of food nutrition labels is associated with lower fat intake. Journal of the American Dietetic Association, 99, 45–53. doi:10.1016/S0002-8223(99)00013-9
Satia, J. A., Galanko, J. A., & Neuhouser, M. L. (2005). Food nutrition label use is associated with demographic, behavioral, and psychosocial factors and dietary intake among African Americans in North Carolina. Journal of the American Dietetic Association, 105, 392–402. doi:10.1016/j.jada.2004.12.006
Shapiro, R. (1995). A comprehensive review of the nutrition labeling and education act regulations. In R. Shapiro (Ed.), Nutrition labeling handbook (pp. 125–226). New York, NY: Marcel Dekker.
Van Wagner, L. R. (1994). The ‘E’ in NLEA: The FDA’s public education campaign. (Nutrition Labeling and Education Act; Food and Drug Administration) (includes related articles). Food Processing. Putman Media. Retrieved August 19, 2016, from High Beam Research https://www.highbeam.com/doc/1G1-15687175.html
Variyam, J. N. (2008). Do nutrition labels improve dietary outcomes? Health Economics, 17, 695–708. https://doi.org/10.1002/(ISSN)1099-1050
Variyam, J. N., Blaylock, J., & Smallwood, D. (2002). Characterizing the distribution of macronutrient intake among U.S. Adults: A quantile regression approach. American Journal of Agricultural Economics, 84, 454–466. https://doi.org/10.1111/ajae.2002.84.issue-2
Wang, G., Fletcher, S. M., & Carley, D. H. (1995). Consumer utilization of food labeling as a source of nutrition information. Journal of Consumer Affairs, 29, 368–380. doi:10.1111/j.1745-6606.1995.tb00052.x
Weimer, J. (1999). Accelerating the trend toward healthy eating: Public and private efforts. In E. Frazao (Ed.), America’s eating habits: Changes and consequences (Agriculture Information Bulletin No. 750, pp. 385–401). Washington, DC: Economic Research Service, United States Department of Agriculture.

Page 17 of 17
Asirvatham et al., Cogent Social Sciences (2017), 3: 1327684https://doi.org/10.1080/23311886.2017.1327684
© 2017 The Author(s). This open access article is distributed under a Creative Commons Attribution (CC-BY) 4.0 license.You are free to: Share — copy and redistribute the material in any medium or format Adapt — remix, transform, and build upon the material for any purpose, even commercially.The licensor cannot revoke these freedoms as long as you follow the license terms.
Under the following terms:Attribution — You must give appropriate credit, provide a link to the license, and indicate if changes were made. You may do so in any reasonable manner, but not in any way that suggests the licensor endorses you or your use. No additional restrictions You may not apply legal terms or technological measures that legally restrict others from doing anything the license permits.
Cogent Social Sciences (ISSN: 2331-1886) is published by Cogent OA, part of Taylor & Francis Group. Publishing with Cogent OA ensures:• Immediate, universal access to your article on publication• High visibility and discoverability via the Cogent OA website as well as Taylor & Francis Online• Download and citation statistics for your article• Rapid online publication• Input from, and dialog with, expert editors and editorial boards• Retention of full copyright of your article• Guaranteed legacy preservation of your article• Discounts and waivers for authors in developing regionsSubmit your manuscript to a Cogent OA journal at www.CogentOA.com