infra-red (ir) based wireless body area networks for
TRANSCRIPT

i
INFRA-RED (IR) BASED WIRELESS BODY AREA NETWORKS FOR
MONITORING VITAL SIGNS
A Thesis Submitted By
Attiya Baqai
In fulfillment of the requirements for the degree of
Doctor of Philosophy
In
Electronic Engineering
Department of Electronic Engineering
Faculty of Electrical, Electronic and Computer Engineering
MEHRAN UNIVERSITY OF ENGINEERING & TECHNOLOGY
JAMSHORO
2015

ii
This Thesis is Dedicated
To
My Abbu Dr. Waheed-Uddin Baqai
and my Late Ammi Saleema Baqai

iii
MEHRAN UNIVERSITY OF ENGINEERING & TECHNOLOGY
JAMSHORO
This thesis, written by Ms. Attiya Baqai under the direction of her supervisors and
approved by all the members of the thesis committee, has been presented to and accepted
by the Dean, Faculty of Electrical, Electronic and Computer Engineering, in fulfillment
of the requirements of the degree of Doctor of Philosophy in Electronic Engineering.
Supervisor Co-Supervisor
Internal Examiner External Examiner
Director, IICT Dean, Faculty of Electrical,
Electronic and Computer
Engineering
Date: ______________________
iv
ACKNOWLEDGMENTS
Starting with the name of ALLAH, Most Gracious, Beneficent and Merciful. Prior to
acknowledgment, I would humbly thank Almighty ALLAH, the Most Merciful and the
Most Beneficent, who bestowed me the opportunity, wisdom and courage to successfully
complete this project. I am nothing without His help and guidance. All that I have
achieved till today are just His blessings upon me.
I am very much grateful to my Supervisor Prof. Dr. B.S Chowdhry DEAN FEECE
MUET Jamshoro, whose cooperation, support, encouragement and suggestions have
boosted me to complete this work in a timely manner. I am extremely thankful to my co-
supervisor Dr. Fahim Aziz Umrani for his scholastic and technical advice, skilled
assistance, continuous encouragement, inspiration and strong support throughout this
research. It was his knowledge and vision which made it possible to accomplish the task
and face challenges during this research. I am also very thankful to Prof. Dr. Mukhtiar
Ali Unar Director IICT for all the suggestions, motivation, support, guidance and prayers.
Special thanks to my Father, my mentor, my teacher in every walk of life, my source of
inspiration, my support, my ideal and my best friend Dr. Waheed Uddin Baqai and my
late Mother Saleema Baqai who always dreamed high for me and celebrated my each and
every small to big success.
I am grateful to my family, my Phuppo for taking care like a mother throughout this
journey, my elder phuppo who was there to help me to start this journey, my sisters
(Amber & Nausheen), their husbands and their kids Shariq, Shayan & Haris. Haris even

v
played the role of my experimental subject. I am very thankful to him as he is only 6
years old but he very patiently and sensibly let me put on all the sensors upon him for
taking readings. I can’t express my gratitude to each family member for giving me free
hand to study, for always supporting me, for bearing my absence due to my tough
schedule and work. This research would not have been accomplished if I would not be
having tremendous support from home and family.
I am very much gratified to Engr. Khuhed Memon for all the motivation, moral support,
encouragement, help, guidance; either technical or non-technical, ideas for making things
possible for me and not letting me settle for less. His constant reminders to meet
deadlines, help in fully utilizing my office as lab, facilitating in acquiring equipment and
modules whenever needed and strengthening me to cross every hurdle, are highly
appreciated. His knowledge and discussions related to Matlab and Communication has
helped me a lot in completing this project. I am thankful to him from every perspective.
I want to pay my bundle of thanks to Engr. Azam for helping me out whenever I got
stuck in Microcontroller/ Hardware or Android issues. His kind & selfless nature and
technical expertise have assisted me a lot. I will always remember the discussions with
my research team in my ResearchLab1 IIT building.
This work was tested in the Red Crescent Institute of Cardiology (Hila-e-Ahmar
Hospital) Unit No-2 Latifabad Hyderabad. Special thanks to Dr. Bahadur Khan- Senior
Medical Officer Red Crescent Cardiac Hospital & CCU for his time, cooperation,
vi
discussion, suggestions and facilitation in taking experimental readings on the patients
admitted in the hospital
Great acknowledgment to Lab assistants who rendered their technical services whenever
asked with so much generosity. Mr. Mushtaq, Mr. Mohammad Ali Soomro (Lab
Assistant of Basic Electronics Lab and Digital Electronics Lab ES Dept. MUET) and Mr
Jamil (Senior IT assistant, IICT-MUET)) have significant contribution to help me around.
I am very much thankful to Engr. Sindhu and Engr. Hyder Bux for assisting me in
Optical Communication lab (TL Dept.) with their utmost cooperation and support.
Special Thanks to Mam Rosy Ilyas (Director ELDC) my teacher and my friend for all the
support, prayers, good wishes she used to give me for bucking me up, tolerating and
listening to my daily stories for the ups and down I was facing during my journey,
lending me her mobiles phones for experiments and she didn’t care that she got out of
contact, she offered all her support and enjoyed my every little success.
I would like to thank Prof. Dr. Aftab Memon, Madam Nafeesa Zaki, Prof. Dr. Faisal
Karim Shaikh and Prof. Dr. Wajiha Shah (Head of the Telecommunication and
Electronics Departments) for granting me permissions for using lab equipment within my
office and providing me resources. Many thanks to IICT Mehran UET Jamshoro for
providing this scholarship to fulfil the dream of doing doctorate.
Finally, I am thankful to all my friends, colleagues and students who have helped me or
prayed for me in this journey.

vii
TABLE OF CONTENTS
Description Page
List of Abbreviations ix
List of Tables xi
List of Figures xii
Abstract xv
Chapter 1 INTRODUCTION 01
1.1 INTRODUCTION TO WBAN 02
1.2 BACKGROUND & RATIONALE 02
1.3 MOTIVATION 04
1.4 RESEARCH QUESTIONS AND CHALLENGES 04
1.5 AIMS & OBJECTIVES 06
1.6 METHODOLOGY 07
1.7 MAJOR CONTRIBUTIONS 08
1.8 PROPOSED SYSTEM’S ADVANTAGES 09
1.9 THESIS STRUCTURE 10
1.10 SUMMARY 12
Chapter 2 LITERATURE REVIEW 13
2.1 EXISTING WBAN SYSTEMS AND THEIR
ADVANTAGES AND DISADVANTAGES
13
2.2 IEEE 802.15.6 STANDARDS, REQUIRENMENTS AND
SPECIFICATIONS
18
2.3. OPTICAL COMMUNICATION 21
2.3.1 Characteristics of Optical Communications 23
2.4. SUMMARY 26
Chapter 3 PROTOCOL DESIGN & ALGORITHM 28
3.1 PROTOCOL SPECIFICATION 29
3.2 EXPERIMENTAL SETUP AND METHODOLOGY 32
3.2.1 Patient authentication & sensor Identification 33
3.2.2 Transmission & Reception with interference
rejection
34
3.2.3 Energy efficiency 36
3.2.4 Node Joining/Un-joining 37
3.3 SUMMARY 37
Chapter 4 MOBILE APP DEVELOPMENT 38
4.1 MATLAB DATABASE DEVELOPMENT 38
4.2 MATLAB MOBILE APPLICATION 40
4.3 ARDUINO & ANDROID DATABASE WITH
ANDROID APP ACCESS
45
4.3.1 SD Card Database creation and its Access 46

viii
4.3.2 B4A Anywhere software 46
4.3.3 Developed Android App 47
4.4 SUMMARY 51
Chapter 5 PROTOTYPE DESIGN 52
5.1 SELECTION OF SENSORS 53
5.1.1 Features of e health sensor platform 53
5.1.2 Data Acquisition 55
5.2 SELECTION OF IR SOURCE 56
5.2.1 LED Drive circuitries 56
5.3 IR RECEIVERS/DETECTORS 57
5.3.1 Testing Photodiode 58
5.3.2 Testing Photo Transistor for Transceiver Design 1 59
5.3.3 IR Remote Control Receiver IC and Working of IR
Transceiver design2
61
5.4 PERFORMANCE ANALYSIS 65
5.5 EXPERIMENTAL SETUP 65
5.6 ThorLAB PIN DIODE 67
5.7 SUMMARY 72
Chapter 6 RESULTS & DISCUSSION 73
6.1 TRANSCEIVER DESIGN 1 READINGS WITH
INCREASE IN DISTANCE
73
6.2 TRANSCEIVER DESIGN 1 NOISE EFFECT
READINGS
76
6.3 EXPERIMENTAL RESULTS FOR TRANSCEIVER
DESIGN 2
78
6.4 TRANSCEIVER DESIGN 2 NOISE EFFECT READING 79
6.5 TRANSCEIVER DESIGN 3 84
6.6 TRANSEIVER DESIGN 3 READINGS AND
OBSERVATIONS
87
6.7 DISCUSSION FOR TRANSCEIVER DESIGN 3
EXPERIMENTAL READINGS
89
6.7.1 Data Rate 104
6.8 SUMMARY 108
Chapter 7 CONCLUSION, LIMITATIONS AND FUTURE
RECOMMENDATIONS
109
7.1 ACHIEVEMENTS 109
7.2 LIMITATIONS 113
7.3 FUTURE RECOMMENDATIONS 114
7.4 SUMMARY 114
References 115

ix
LIST OF ABBREVIATIONS
3rd
-Generation = 3G
4th
-Generation = 4G
Amplitude Modulation = AM
Amplitude Shift Keying = ASK
Basic4Android = B4A
Bit Error Rate = BER
Bluetooth Low energy = BLE
Bayonet Neill–Concelman = BNC
Binary Phase Shift Keying = BPSK
Continuous Wave = CW
Data+Control = D+C
Direct Current = DC
Double Side Band = DSB
Digital Storage Scope = DSO
Elliptic Curve Cryptography = ECC
Electrocardiograms = ECG
Electromyography = EMG
Electromagnetic Interference = EMI
Elettronica Veneta = EV
Federal Communications Commission = FCC
Free-space optical = FSO
Gaussian frequency shift keying = GFSK
General Packet Radio Service = GPRS
Galvanic Skin Response = GSR
Integrated circuit = IC
Integrated Development Environment = IDE
Institute of Electrical and Electronics Engineers = IEEE
Intensity Modulation/ Direct Detection = IM/DD
Infra-Red = IR
Inter Symbol Interference = ISI
Industrial, Scientific and Medical = ISM
Light Emitting Diode = LED
Line of Sight = LOS
Media Access Control = MAC
Message Authentication Code = MAC
Multiple Access Interference = MAI
Medical Implant Communication Service = MICS
Non Line of Sight = NLOS
Non Return to Zero = NRZ
On Off Keying = OOK
Operational Amplifiers = OPAMP

x
Optical Wireless Communication = OWC
Pulse Amplitude Modulation = PAM
Personal Area Networks = PAN
Physical layer = PHY
Pulse Position Modulation = PPM
Phase Shift Keying = PSK
Pulse Width Modulation = PWM
Quality of Service = QoS
Rapid Application Development = RAD
Regulatory Cooperation Council = RCC
Radio Frequency = RF
Received = Rx
Return to Zero = RZ
Specific Absorption Rates = SAR
Suppressed Carrier Modulation = SCM
Secure Digital = SD
Signal to Noise Ratio = SNR
Structured Query Language = SQL
Single Side Band = SSB
Test Point = TP
Transmitted = Tx
User Datagram Protocol = UDP
Ultra Violet = UV
Ultra-Wide band = UWB
Visible Light Communication = VLC
Wireless Body Area Networks = WBAN
Wireless Local Area Network = WLAN
Wireless personal Area Networks = WPAN

xi
LIST OF TABLES
Description
Page
Table 2.1 Comparison between RF and IR 24
Table 3.1 Specifications for S, I, D and Sensor Information 31
Table 5.1 Various IR Remote Control Protocols 63
Table 5.2 Protocols supported by Arduino IR Remote Library 63
Table 5.3 MCM31/EV Encoding schemes and their respective data
rates
70
Table 6.1 Experimental Readings for Transceiver Design 1 with
Distance
75
Table 6.2 Experimental Readings for Transceiver Design 1 with Noise
effect
77
Table 6.3 Experimental Readings with Noise for Transceiver Design 2 80
Table 6.4 Experimental Readings with Noise for BER in Transceiver
Design 2
81
Table 6.5 Received Power Readings taken at Research Lab1 IIT
building from PIN RX for change in light due fluorescent
bulbs switching.
85
Table 6.6 Readings taken while switching the light at Research lab1
IIT Building MUET by ambient light sensor of Smart Phone
86
Table 6.7 ThorLAB DET100A Large Area Silicon Detector Electrical
Specifications
87
Table 6.8 Transceiver Design 3 Readings with varying one parameter
at a time
88
Table 6.9 Matlab required parameters calculation with 25KHz and
50KHz sampling frequency for plotting eye diagram and
constellation diagram.
91
Table 7.1 Summary of Research in context of specific parameters 112

xii
LIST OF FIGURES
Description Page
Fig. 1.1 Issues related to WBAN 6
Fig. 2.1 WBAN Applications 14
Fig. 2.2
Existing technologies available for WBAN and their
comparison
15
Fig. 2.3 WBAN Functional Requirements 19
Fig. 2.4 Power vs Data Rate comparison of different wireless standards 20
Fig. 2.5 WBAN requirements according to applications 21
Fig. 2.6 Problems in IR links and their proposed solutions 25
Fig. 3.1 Packet Format and Specifications 29
Fig. 3.2 Conceptual Diagram 32
Fig. 3.3 Circuits for simple IR Transmitter and Receiver 33
Fig. 3.4 System Flowchart 34
Fig. 3.5 Interference creation with various Remote controls (a)
TV/DVD Remote (b) AC remote
35
Fig. 3.5(c) Snapshot of Arduino IDE while receiving all signals i.e. ID1,
ID2 and remote control
36
Fig. 4.1 Flowchart for database creation 39
Fig. 4.2 Snapshot showing various Fields of created database 40
Fig. 4.3 Matlab Mobile App Script Algorithm 41
Fig. 4.4 Script execution output on Matlab Mobile App
42-45
Fig. 4.5 RAD tools by Anywhere Software 47
Fig. 4.6 Android App Screen Shots 48-51
Fig. 5.1 Proposed Prototype WBAN 52
Fig. 5.2 e-health sensor complete kit 54
Fig. 5.3 Sensor Shield 55
Fig. 5.4 LED Drive Circuits 57
Fig. 5.5 Photodetectors 58

xiii
Fig. 5.6 Photo Diode Response in Open Circuit 59
Fig. 5.7 Photo Diode response with Resistor Biasing when a signal
from Remote control is given
59
Fig. 5.8 Photo Transistor Receiver Design 60
Fig. 5.9 Block Diagram and Prototype of IR Transceiver Design1 61
Fig. 5.10 Block Diagram of IR Transceiver Design 2 62
Fig. 5.11 Sony SIRC Protocol & Phillips-RC5 Protocol 64
Fig. 5.12 Test Set-up for Noise Effect Measurements 66
Fig. 5.13 Noise Signal generation from Agilent 33250A Function
generator/ Arbitrary Waveform generator and its effect in
transmission and reception
67
Fig. 5.14 EV/MCM31 Digital Modulation Trainer 69
Fig. 5.15 IR Transceiver using ThorLAB PIN and MCM31/EV Trainer 71
Fig. 6.1 (a-c) Photo Transistor Response with increasing distances 74
Fig. 6.1(d) Effect of increasing Distance on SNR for Transceiver
Design1
75
Fig. 6.1(e) Matlab Simulation for SNR vs BER with varying distance for
Transceiver Design 1
75
Fig. 6.2(a) Results with adding Noise offset from 0V to 2V 76
Fig. 6.2(b) Effect of increasing Noise DC offset on SNR Value for
Transceiver Design 1
77
Fig. 6.2(c) Matlab Simulation for SNR vs BER with DC offset Noise
Value for Transceiver Design 1
77
Fig. 6.3 Experimental setup for Transceiver Design 2 (Link distance up
to 4 feet)
78
Fig. 6.4 Experimental Results with Receiver up to 4 feet apart (a) Sony
Protocol (b) RC5 Protocol
79
Fig. 6.5(a) Experimental Results for Effect of adding Noise offset (RC5
Protocol)
79
Fig. 6.5(b) Experimental Results for Effect of adding Noise offset (Sony
Protocol)
80
Fig. 6.5(c) Effect of Distance & Noise on SNR in IR Receiver IC 80
Fig. 6.5(d) BER curve with noise offset in Transceiver Design 2 82
Fig. 6.6 Comparative results for performance analysis of transceiver
design 1 & 2
83
Fig. 6.7 Research Lab 1 (IIT building MUET) Experimental setup and
lab dimensions
84

xiv
Fig. 6.8 Matlab plots with 2-PSK with 2 lights ON a) I & Q amplitudes
b) Eye Diagram c) Constellation
92
Fig. 6.9 Matlab plots with 2-PSK with 4 lights ON a) I & Q amplitudes
b) Eye Diagram c) Constellation
93
Fig. 6.10 Constellation diagrams for 2-PSK with a) No light b) 2 lights
c) 4 lights
94
Fig. 6.11 Eye diagrams for 2-PSK with a) No light b) 2 lights c) 4 lights 94
Fig. 6.12 Constellation diagrams for 4-PSK with a) No light b) 2 lights
c) 4 lights
94
Fig. 6.13 Eye diagrams for 4-PSK with a) No light b) 2 lights c) 4 lights 95
Fig. 6.14 Eye diagrams for FSK with a) No light b) 2 lights c) 4 lights 95
Fig. 6.15 Eye diagrams for ASK with a) No light b) 2 lights c) 4 lights 95
Fig. 6.16 SNR curves for varying (a) Angle (b) Distance (c) No of
Lights for ASK
96
Fig. 6.17 SNR curves for varying (a) Angle (b) Distance (c) No of
Lights for FSK
97
Fig. 6.18 SNR curves for varying (a) Angle (b) Distance (c) No of Light
for 2PSK
98
Fig. 6.19 SNR curves for varying (a) Angle (b) Distance (c) No of Light
for 4PSK
99
Fig. 6.20 BER vs SNR curves for varying (a) Distance (b) Angle(c) No
of Light for ASK
100
Fig. 6.21 BER vs SNR curves for varying (a) Distance (b) Angle(c) No
of Light for FSK
101
Fig. 6.22 BER vs SNR curves for varying (a) Distance (b) Angle(c) No
of Light for 2PSK
102
Fig. 6.23 Fig. 6.23: BER vs SNR curves for varying (a) Distance (b)
Angle(c) No of Light for 4PSK
103
Fig. 6.24
(a,c,e,g)
Test set up for Binary ASK Transceiver for Data Rate
Observations
104
Fig. 6.25 Information Vs Modulated signal-(b,d,f,h) Tx vs Rx signals at
Node a and Node b
105-107

xv
ABSTRACT
Due to the technology advancement in many fields, life has become easy and safer. We
come across new devices and gadgets every day. This has also improved health care
splendidly. The wearable technology is now part of our daily life and in order to keep one
updated about his/ her health, daily or routine tests are must. Wireless Body Area
Networks is one of that advent of science and technology which has served as a blessing
to reduce health risks. The patients can get their checkups done while staying at their
homes without even going to the hospital and share that information with their Doctors or
Care giver through Smart phones. This reduces the unnecessary expenses and only
initiated when it is required.
WBAN are the networks comprising of many sensors capable of monitoring various vital
signs within human body range (within 2m). These sensors after sensing the
physiological data send this information to a controlling node from where it can be
transferred to hospital, clinic, medical staff or anywhere. Most of the research that is done
for developing WBANs relies on RF, microwave or Ultra-Wide Band Technology. These
technologies are mostly based on Wireless Personal Area Networks WPAN and lack in
fulfilling the requirements of WBAN. They have frequency licensing issues and the
Electromagnetic spectrum has become so overcrowded that researches are trying to find
alternate solutions. The WBAN based on these technologies interfere with the medical
equipment/ devices and vice versa, also they cannot be used in airplanes, they have power
and health issues too.

xvi
In order to address these issues, an alternative of utilizing Optical Wireless
Communication in form of Infra-red signaling has been proposed in this thesis for
WBAN which has huge unregulated free bandwidth available with no licensing issues.
OW links are inherently secure as they confine within the room, fulfilling the major
requirement of WBAN. For this a prototype WBAN has been developed by designing
optical transceivers using cheap and low power components.
An e-health sensor platform by Cooking Hacks Libellium (Spain) has been used in this
research to collect physiological data from the sensors worn over the body. This shield is
compatible with Arduino and comes with an eHealth library. The shield has other
connectivity options but does not include Infra-red connectivity. The transceiver to
transmit and receive IR signals is designed in this research work and the e-health library
is modified using Arduino IR Remote library to support not only this connection but also
to implement security protocol developed for this research. The issues related to WBAN
are investigated and a novel light weight protocol with security and interference rejection
has been developed in this thesis.
Various experiments were performed to observe the effects on the Infra-red link in the
laboratory by varying link distance, angle deviation from LOS, noise, ambient light,
modulation scheme etc. The prototype investigated gives satisfactory results up to 7 feet
(around 2m) with 30 to 60 degrees deviation from LOS. The low data rate requirement
for physiological data and waveform is achieved with acceptable accuracy, which can
further be enhanced to fully exploit the OW high data rate potential.

xvii
The Mobile App developed in this research makes it easy to visualize vital signs data in
forms of charts and graphs. The results can easily be shared or stored for later use.
Initially the results were tested on Matlab Mobile. After getting successful results a
standalone Android App was developed using Basic4Android.
The research presented in this thesis investigates the feasibility of Infra-red signaling
scheme for WBAN and propose it as an alternative approach to the presently deployed
wireless technologies for WBAN by highlighting the potential of OWC.

1
CHAPTER 1
INTRODUCTION
Due to the tremendous advancement of technology in consumer electronics, wireless
transmission techniques, sensors, low power devices and microelectronics [1] the world
is becoming smarter day by day and the burden of the user is being relieved day by day as
things have become easy to access and share with others within seconds. This remarkable
technology advancement has benefited every field. One of such field is the Health care.
With the introduction of the concepts like telemedicine, e-health and m-health, number of
cases that suffered due to lack of availability of resources, access, communication and
delay have greatly reduced. E-health uses internet and electronic processes in order to
transmit medical information whereas M-health is an abbreviation of Mobile health. It
uses Mobile devices for health and clinical information. The m Health field has emerged
as a sub-segment of e Health. Telemedicine uses telecommunications and information to
exchange clinical information. In order to have healthy life frequent tests and checkups
have become the need of today which in critical cases are necessary and must be
monitored continuously. Besides the critical cases, there is an increase in number of
elderly people each year who need periodic or regular checkups but the hospital visits,
out of reach clinics/hospitals/medical centers, unavailability of medical staff, the
transportation difficulties and expenses demands the development of some easy way out
[2]. The advent of WBAN is the solution for the afore mentioned problems which not

2
only improves and facilitates health care but also lifestyle, entertainment, gaming, fitness,
assisted living and many more. Thus WBAN can be utilized to reduce rush at the medical
centers, to efficiently utilize the resources and staff, to improve the lifestyle & health
awareness of the people. Due to easy and fast access WBAN also improves the efficiency
of staff.
1.1 INTRODUCTION TO WBAN
Wireless Body Area Network (WBAN) is the wireless network made of small sensor
nodes with sensing or actuating capabilities which can also have some sort of storage and
processing. The WBAN are specific to the applications in which the human body is
directly involved with sensors being installed within the human body range i.e. in, on or
around the body. Typical coverage of transmission from these sensors is short range
around 2m which is different form WPAN that covers around 10m. Due to the difference
in requirements of WBANs, IEEE 802.15.6 has set a separate standard to fulfill the needs
specific to human body like low power, low data rate, assurance of skin and tissue safety.
Research and study reveals that the amplitude and frequency ranges for human
physiological signals are quite low and hence low data transmission rate and low
sampling frequency would be adequate where as the number and type of sensors to be
deployed depends upon the application and infrastructure [3].
1.2 BACKGROUND & RATIONALE
Depending upon the range, the applications for short-range communications can be
considered in the form of three networks WBAN, WPAN and WLAN they vary in the

3
distances for the coverage, WLAN being in the range of few tens of meters up to WBAN
within range of typically 3 to 2 meters.
In Optical Communications the devices or the nodes utilize communication via short-
range wireless signals operating on optical carrier wavelengths having different
characteristics from their counterpart radio. Optical Wireless Communication (OWC) or
Free-space optical (FSO) technology has recently attracted researchers to explore as a
possible alternative to traditional optical fiber or radio-frequency or microwave links to
meet the requirements of high-bandwidth next generation networks. OWCs are found
especially suitable but not limited for short-range communication systems [4].
For short-range indoor wireless communications, Radio frequency as well as Infrared
both have been used frequently and reported in literature. But due to a number of reasons
preference is given to OWC in specific cases from which to name a few is its low cost for
high bandwidth, is not much effected by electromagnetic interference (EMI), no licensing
required for the spectrum, the components are cheap, having small form factor, light in
weight and power consumption is very low. Majority of the work that is reported for
WBAN has been done using radio, microwave, Ultra-Wide band Bluetooth Low energy
and ZigBee especially ultra-wideband (UWB) [5-9] which have licensing and power
issues. The Radio spectrum has become so over crowded that the researches are trying to
find suitable alternatives. One of the possible solutions is the use of optical signaling
because of its unique features as mentioned above.

4
1.3 MOTIVATION
Fiber Optics have been used for a long time as high speed backbone links so if the optical
Wireless links are stablished they could easily be connected to the pre-deployed
backbone links. Indoor and outdoor systems OW present all the benefits of optical fiber-
based systems with easy and quick installation at a low cost. As optical signals are
confined within a room so this feature provides interference free communication with
frequency reuse in nearby cells/ rooms. The availability of huge bandwidth in THz range
makes it better choice than RF. The same geographical area can be divided in a number
of cells and a single wavelength can be used in the cells without resorting to the
frequency reuse [10-12]. This all can happen with minimum or no inter-channel
interference. The cell size and shape can be specifically defined depending upon the
desired application which is a distinct feature in optical wireless systems. The optical
signals do not interfere with medical equipment radiations, neither these radiations from
medical equipment interfere with optical signals, this make OWC systems extremely
useful in hospital or clinical environment. They are also useful in environments where
use of RF signals is forbidden or can be dangerous like in airplanes etc. So OW can be
extremely suitable in the environments where security is of prime concern.
1.4 RESEARCH QUESTIONS AND CHALLENGES
The OW wireless signaling presents distinctive advantages as mentioned in the previous
section but contrary to the RF system these links pose some disadvantages as well. To
name a few the drawbacks include limitation in mobility, the links get blocked, potential
5
risk of eye and skin damage, connectivity is not easy and as RF links Non-Line of sight
links also suffer from multipath-induced ISI. There are some solutions to the above
mentioned problems: Eye and skin can be made safe from potential hazards if (i) a higher
wavelength of 1550 nm is used, at this wavelength the cornea and lens absorbs the laser
beams and this wavelength is not focused on the retina [13], it also provides compatibility
with the backbone fiber optic links third transmission window, (ii) power-efficient
modulation schemes can be utilized. From different configurations, the most bandwidth
and power efficient is the line of sight link as there is no multipath hence there is no loss
or pulse dispersion and a highly concentrated optical power is achieved [9]. But there are
some limitations to LOS links as they need accurate alignment, they encounter link loss
when get blocked, all these limitations restrict them to particular applications which are
free from blocking. Broadened transmitted beams can be used to enhance coverage area
and provide mobility at the cost of power efficiency suggested in [14, 15], Usage of non-
line of site links can also serve the purpose of improving coverage area.
WBANs are recent phenomenon [16] and most of the research being carried out in this
area is in its infant stage, and therefore, plenty of room to work. The issues that need to
be considered and addressed are illustrated in Figure 1.1.

6
Fig. 1.1 Issues related to WBAN
Keeping in mind the above mentioned challenges, the focus of attention in this research
project is on the following aims and objectives.
1.5 AIMS & OBJECTIVES
The main focus of this research, in relation to the application chosen i.e., WBANs, is put
on OW for indoor environments.
The specific, but not limited to, objectives of this study are:
To analyze the performance of Optical Wireless Communication techniques in
Wireless Broadband Area Networks (WBANs).
To develop a prototype BAN system using optical communications (IR), and
choose different vital signs to test the data transmission.

7
To explore various techniques (such as modulations, forward error coding, and
artificial intelligence, etc.) to enhance the system performance of WBAN devices
for medical applications.
1.6 METHODOLOGY
Following methodology is adopted for this research work:
Optimize and analyze vital sign sensors.
Interfacing of sensors in Wireless Body Area Networks.
Compare Optical signaling with its counterpart, i.e., Radio.
Develop mathematical model for a prototype WBAN device capable of measuring
vital signs.
Implement WBAN test bed.
Test and analyze the performance of WBAN test bed.
The primary aim of this research is to study, examine, develop, design, improve and
demonstrate the applications of Infra-red signaling in WBAN. A prototype WBAN
system capable of measuring different vital signs using sensors, operating on optical
signals is established. The specificities of IR based WBAN are highlighted by comparing
them with the existing WBANs predominantly implemented on UWB systems. The
technical challenges related to implementation of OW link and for developing a prototype
WBAN as mentioned earlier are considered.

8
In order to develop a prototype WBAN system with Infra-red signaling scheme an e-
health sensor platform from Libellium is used comprising of Blood Pressure sensor,
Temperature sensor, Galvanic Skin Response sensor, ECG sensor, Air Flow sensor and
Position sensor. At first, the prototype was developed by keeping in mind that it should
remain cost effective and power efficient design. Secondly the feasibility of WBAN also
depends on network-level issues such as how efficient the communication protocols are.
To deal with the first issue, the low cost and inexpensive optical transceiver is adopted.
Moreover, their integration into future wireless heterogeneous networks gains importance
as a necessary step to shape the 4G landscape. Furthermore, the necessary modelling and
design implementation is carried out in a way that the overall system design remains cost
effective.
1.7 MAJOR CONTRIBUTIONS
A cost effective prototype WBAN system is developed using least expensive and
easily available components for optical transceiver.
A novel protocol with patient and node identification for optical WBAN with
inherent security and interference rejection is developed and tested using infrared
signaling.
The performance of the system is tested and analyzed through SNR, BER, eye
diagrams and constellation diagrams over various parameters such as Distance/
Spacing, Noise, Angle (Orientation) and modulation schemes.

9
Various detectors/ Receivers including phototransistor, photodiode, IR remote
receiver, and ThorLAB photodiode are tested for the development of the
prototype WBAN.
A user friendly mobile app is developed using Basic4Android to acquire, store,
visualize and share the health status/ vital signs data of a person.
1.8 PROPOSED SYSTEM’S ADVANTAGES
Because our proposed WBAN system is based on optical signaling:
- The cost is reduced.
- Power requirement is also reduced.
- Compatible with human body environment as opposed to UWB.
Further, we also aim to work towards standardization of the WBAN by proposing
a new system compatible with the requirements posed by WBAN IEEE 802.15.6
task group.
The proposed system enables medical staff to perform following remote
functions:
- Monitoring can be done in real-time.
- Diagnosis can be done at earlier stages before entering into an alarming
state.
- Possible dangerous diseases can be cured.
10
Additionally, through wire/ wireless communication channels, the medical
professionals can perform the medical diagnosis similarly patients can also
consult their doctors via same channels.
Many chronic diseases can be avoided by implementing the proposed healthcare
system. It can also provide long lasting smarter solution at low cost for continuous
monitoring and managing patients to provide better care.
1.9 THESIS STRUCTURE
In Chapter 1 general overview about the WBAN has been discussed. This chapter briefly
discusses the existing technologies used and available for WBAN. It also points some key
features of optical communication which served as motivation to choose infrared
signaling for design of WBAN prototype in this research. The research challenges,
objectives, proposed methodology and summary of major contributions for this research
are also conversed in this chapter.
In Chapter 2 the existing WBANs, their advantages and disadvantages have been
discussed. It also mentions standards, key requirements and specifications laid down by
IEEE 802.15.6 Task Group 6 specially made for WBAN. This chapter highlights the
characteristics of OWC, compares them with its counterpart i.e. RF communication and
argues for the feasibility of infrared signaling for WBAN highlighting its advantages over
RF. This chapter also puts some light on the problems encountered by Infra-red links and
proposes solutions to address them.

11
The development of a novel protocol for this research having key features of node and
patient identification with interference rejection from other IR sources is highlighted in
Chapter 3 . The protocol specifications and its working algorithm along with simple IR
Transceiver designs are discussed in this chapter. The protocol is specially made light in
computation and processing to incur least possible overhead while addressing the security
and privacy requirements of WBANs.
In Chapter 4 the development of the mobile apps to visualize the physiological data in a
user friendly manner is covered. This chapter presents the app development and their
results in numerical as well as graphical screen shots form. Two mobile app platforms i.e.
Matlab Mobile and Basic4Android are used in this research and discussed in this chapter.
In Chapter 5 the prototype development for the IR based WBAN has been investigated. It
highlights the interfacing of sensors, their connectivity in WBAN, the issues encountered
in choosing transmitter and detectors for the prototype development and their possible
solutions. This chapter also explains the experimental set up and describes each
component, board and equipment specifications, usage and limitations in the
experimental work for this research.
In Chapter 6 the experimental results of the selected components and transceiver designs
for the Prototype WBAN are discussed. The experimental readings and observations
made for the established Infra-red link are analyzed in this chapter for various parameters
such as noise, ambient light, angular displacement of receiver from transmitter’s LOS,
link distance and data rate.

12
Finally in Chapter 7 a conclusion is made for the thesis by highlighting the achievements
made in this research project. It also enumerates the limitations of the project and gives
suggestions for the future extensions for the research carried out in this thesis.
1.10 SUMMARY
In this chapter basic idea of the WBAN was discussed along with brief discussion of the
existing technologies used and available for WBAN. It also points some key features of
optical communication which served as motivation to choose infra-red signaling for
design of WBAN prototype in this research. The research challenges, objectives,
proposed methodology and summary of major contributions for this research are also
conversed in this chapter.
13
CHAPTER 2
LITERATURE REVIEW
The research in this thesis aims to develop of a prototype WBAN, based on Infra-red
signaling. In order to develop such prototype a thorough study about the existing
WBAN’S was needed in order to know the main requirements of WBAN. Optical
Communication has its own unique characteristics so a review has been done to explore
the specific features of OW that can be utilized in WBAN. Hence for this research the
literature review is done in the following three directions:
Studying about already existing WBAN systems and noting their advantages and
disadvantages.
Making the proposed system design compatible with IEEE 802.15.6 standard and
therefore finding its requirements/ specifications.
Exploring the Optical Communication techniques and other skills required to
execute this project.
2.1 EXISTING WBAN SYSTEMS AND THEIR ADVANTAGES AND
DISADVANTAGES
WBAN (Wireless Body Area Network) is derived from the Wireless Sensor Network
which is a very vast field covering numerous applications in different kinds of
environments and ranges. The WBAN are specific to the applications in which the human
14
body is directly involved with sensors being installed within the human body range. Due
to the direct human involvement main concerns related to WBAN are security, privacy
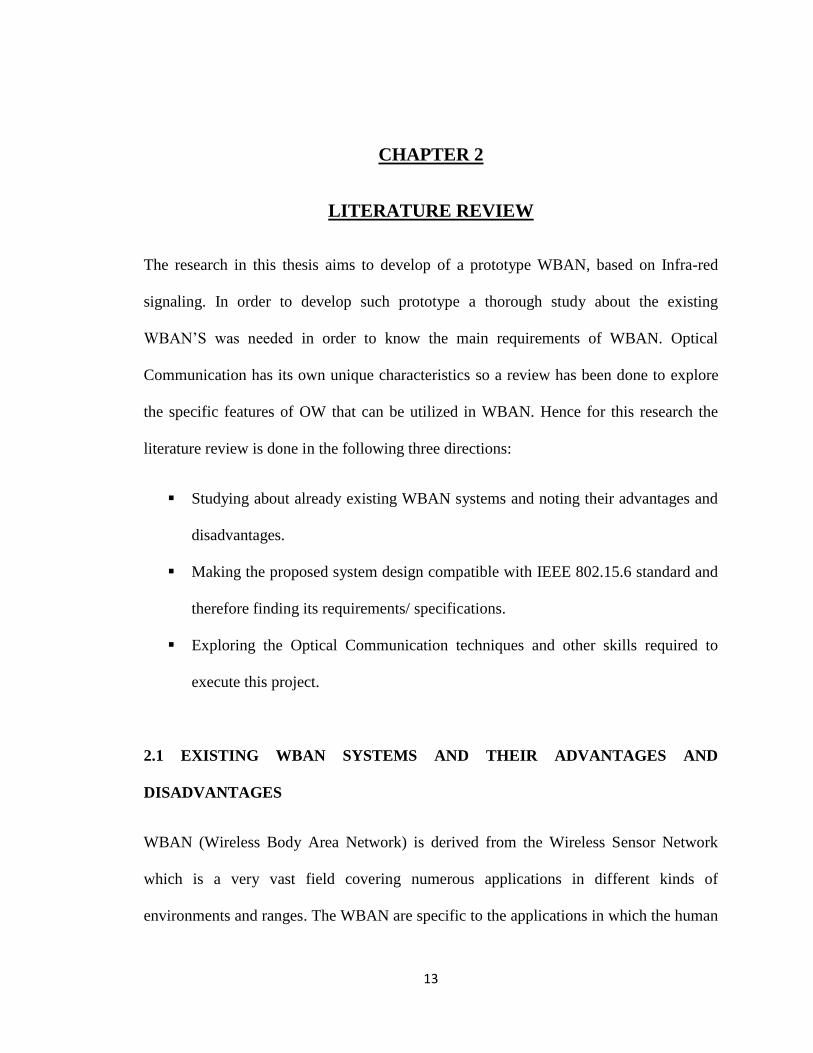
and safety from health issues. The WBAN can be used in variety of applications some of
which are shown in Figure 2.1. In general, from application perspective, WBAN can be
broadly classified in Medical and Non-Medical Applications [2]. Medical applications
can further be classified as wearable and implanted.
Fig. 2.1 WBAN Applications
A WBAN can be described as a set of sensors which are miniaturized in nature, low
power, low cost that can be worn or can be implanted within the human body. They
can have some sort of storage as well as processing capability or can simply be sensor
nodes. These nodes collect physiological data also called vital body parameters or
signs. Some of the common vital signs include Body temperature, Blood oxygen
Saturation, Blood pressure, electrocardiograms (ECG), Pulse rate, heart rate etc. [2].

15
These vital body conditions and movements can be continuously monitored for the
heart attack patients, diabetic or asthma patients. The data from the sensors is sent to
a controlling node which is more intelligent node in terms of processing capability.
This node aggregates the sensors data, performs signal processing and transmits it to
the home base station via existing wireless technologies for WBAN such as Ultra-
Wide Band, Microwave, ZigBee, Bluetooth or Optical Wireless etc. Chakraborty, C.,
Gupta, B., & Ghosh, S. K. (2013) in Figure 2.2 [2] compares the technologies/
standards and their specifications available for WBAN. The data from the home base
station can then be sent to the doctor, medical staff, clinic, caregiver, hospital or
anywhere in real time where the user wants to send the data for further analysis, help
or action.
Fig. 2.2 Existing technologies available for WBAN and their comparison (Source: A review on telemedicine-based WBAN framework for patient monitoring. Telemedicine and e-
Health, 19(8), p.622)

16
[17] Classifies WBAN into three classes as follows which is the basis of WBAN
architecture also known as three tier system.
- Intra-WBAN (communication between sensors and WBAN coordinator).
- Beyond WBAN (communication that is held between coordinators and
outside world).
- Inter-WBAN (communication between WBANs).
Preliminary Study of Wireless Body Area Networks reveals that:
- Majority of WBAN are using UWB (i.e. radio/ microwave) technology
[5-7, 9, 12, 18-27].
- They are developed over PAN technology.
- Existing WBANs have issues with QoS [23].
The main disadvantage of using UWB (i.e. radio/ microwave) technology is use of large
number of antennas which make a multi-hop wireless network which are very close to
human skin. The radio signals also have the effects on human body including organs or
tissues. It also effects if there is any other medical implants such as orthopedic devices,
cardiac pacemakers, and cochlear implants. [19] Discusses the issues related to existing
WBAN technologies with power consumption, SAR, frequency regulations and
transceiver considerations for WBAN for medical applications. Most of the Existing
WBANS are using PAN technologies using RF technologies from which Bluetooth or
ZigBee are more common which have the power consumption, health safety and
frequency licensing issues although low power versions of these technologies i.e.

17
Bluetooth® low energy (LE) and ZigBee RF4CE are also there but they waste the
spectrum and need cautious planning while deployment in order to avoid interference.
[28] Reports about the research for security concerns related to some LE Bluetooth
devices. The people carrying these devices may be unaware but they can easily be
tracked because of a unique identifier that these devices transmit. Most of the work done
in WBAN is reported on the MAC layer protocols. [17] States that although there are
limitations and additional requirements for WBAN which are not fulfilled by existing
technologies and standards but they are still in use mainly because of the unavailability of
the current IEEE 802.15.6 submissive devices. They impose key limitations in terms of
acquired data rates, communication range, peak-power consumption, created RF
interferences, and effective on-body communications. Both ZigBee and Bluetooth LE use
128-bit keys to implement their security mechanisms. These technologies overcome the
common issues related with infra-red like line of sight, interoperability and limited
improved features but they do not cater the breath of security, interference rejection,
frequency reuse, cost and packet payload overhead.
In WBANs equal emphasis should be made on the security as well as system
performance, therefore, it is a challenging task to integrate a high-level security in such
resource-constrained networks. Several prototype implementations of WBANs that deal
with QoS and energy efficiency are reported in the literature, however, less research is
found on the aspects of data security and privacy; also the presented solutions are not
much mature.

18
In order to ensure safe and successful transmission and reception the security
requirements for WBAN such as Confidentiality, Integrity, Authentication, Availability
and Data freshness are to be fulfilled. To address security challenges, issues,
requirements, threats and attacks various solutions/ schemes and protocols are proposed
from which Message Authentication code (MAC), hardware or software encryption
techniques, symmetric or asymmetric cryptography, heterogeneous or hybrid
cryptosystems, Bio metric key establishment, Private or Public keys distribution, Elliptic
Curve Cryptography (ECC) and Hash Functions are some of them[29-45]. All existing
security solutions which involve cryptographically strong protocols incur too much
computation and communication cost for body sensors.
2.2 IEEE 802.15.6 STANDARDS, REQUIRENMENTS AND SPECIFICATIONS
Due to the deficiency of PAN to address the issues related to the requirements and
standardization IEEE made a new Task group in 2007. Alam, M. M., & Hamida, E. B.
(2014) have summarized this standard in [17] which is specifically designed to meet the
WBAN Functional requirements as shown in Figure 2.3.

19
Fig. 2.3 WBAN Functional Requirements
(Source: Alam, M. M., & Hamida, E. B. (2014). Surveying wearable human assistive technology for life
and safety critical applications: Standards, challenges and opportunities. Sensors, 14(5), p.9160)
The main objectives of this standard are to provide communication for short range
usually within the vicinity of a human body (sub meter range typically up to 2 to 3
meters), the devices should offer less power consumption with high security and privacy.
The devices should SAR compliant, MICS, ISM compatible where possible (low
cost).The data rate up to 10Mbps are required if video streaming or high quality images
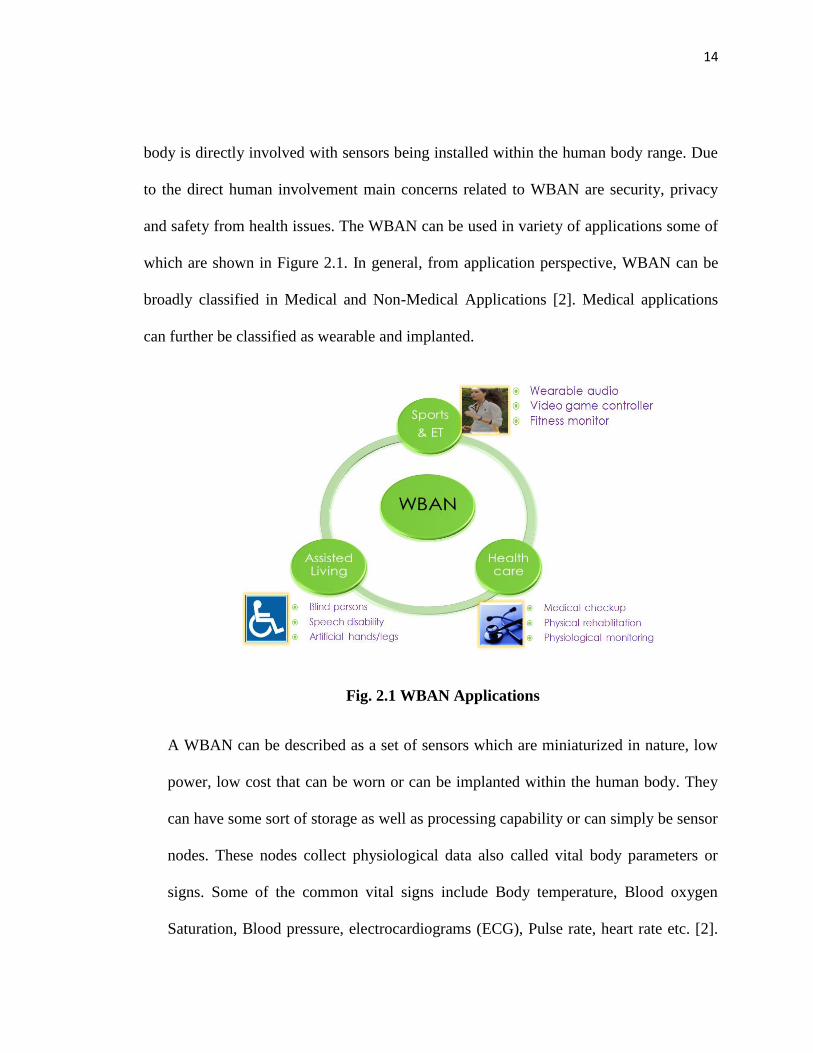
are to be transmitted. Figure 2.4 [17] illustrates the power requirements vs Data Rate for
20
IEEE15.6 WBAN standard. The power consumption for the other standards is quite high
whereas the WBAN requirement is just of 0.1 to 1 mW.
Fig. 2.4 Power vs Data Rate comparison of different wireless standards
Alavikia, Z., Khadivi, P., & Hashemi, M. R. (2012) in [46] summarize the data rate,
delay, security and other parameter requirement for WBAN with respect to the
application chosen as shown in Figure 2.5. In this research Real time data comprising of
waveforms and physiological data is targeted so a bandwidth of 10 to 100Kbps would be
sufficient.

21
Fig. 2.5 WBAN requirements according to applications
(Source: Alavikia, Z., Khadivi, P., & Hashemi, M. R. (2012). A Model for QoS–Aware Wireless
Communication in Hospitals. Journal of medical signals and sensors, 2(1), 1)
The 802.15.16 is a standard in which the requirements of WBAN are adjusted for short
range communication with security, low power and reliability on Physical (PHY) and
Medium Access Control (MAC) layers.
2.3 OPTICAL COMMUNICATION
Information can be sent via wired systems or wireless systems. In wireless systems the
transfer of information can be through visible optical, invisible infra-red, ultra-violet or
Radio Frequency. When the information passes through air or vacuum or space
wirelessly through optical carriers such as visible optical radiation also termed as Visible
Light Communication (VLC), invisible infra-red (IR) or ultra-violet (UV) then this is
referred to as Optical Wireless Communication.[47] Discusses that depending upon the
range, Optical wireless communication (OWC) can be categorized in the following five
categories:

22
i. Ultra-Short range: Mostly used for chip to chip communication.
ii. Short range: Used in under water, WPAN and WBAN applications.
iii. Medium range: Its typical examples are indoor infra-red, Visible Light
communication for WLAN, vehicle to vehicle or to infrastructure
communications.
iv. Long range: This communication is between buildings and is also termed as
Free Space Communication (FSO).
v. Ultra-Long range: This type of communication occurs between satellites and
to establish links for deep space.
For short-range indoor wireless communications, Radio frequency as well as Infra-
red both have been used frequently and reported in literature. But due to a number of
reasons preference is given to OWC in specific cases from which to name a few is its
low cost for high bandwidth, is not much effected by electromagnetic interference
(EMI), no licensing required for the spectrum, the components are cheap, having
small form factor, light in weight, and power consumption is very low. Since the
focus of this research is for short-range optical wireless communication systems and
as Infra-red supersedes OW communication systems for short-range applications
hence Infra-red signaling scheme is investigated here for the intended WBAN.

23
2.3.1 Characteristics of Optical Communications
This section discusses some of the characteristics of OWC that are different from
their counterpart i.e. radio which make it an attractive choice to use OWC for this
research. The OW channel has huge bandwidth typically in the range of THz and that
is not regulated. As the optical signals have higher frequency they are more
directional if compared with RF signals which are Omni directional which does not
require specific directive antennas. Additionally, optical signals do not have the
capability to penetrate solid objects only possible if they become transparent to
radiation frequency; whereas RF signals when operated at lower frequencies have the
capability to traverse through solid objects like walls. Dark objects absorb optical
signals; light-colored objects diffusely reflect them where as shiny surfaces reflect
them directionally. IR signals can pass through glass, but not capable to penetrate
opaque structures such as walls and ceilings which gives the concept of frequency
reuse. As the signal is confined within one room so it avoids interference from nearby
room using same optical carrier frequency similar characteristics as of visible light so
this feature can be used to provide privacy in IR based WBANs. A comparison
between RF and IR is given in Table 2.1.

24
Table 2.1 Comparison between RF and IR
Besides the distinct characteristics, RF and optical signals also have some common
properties like various surfaces which including mirror, buildings, walls and water
have the capability to bounce them off. Both type of signals travel a distance and get
weakened but they can be recovered by the receiver. The amount of recovered signal
depends upon the medium the signal propagation, transmitted signal strength and the
receiver’s sensitivity.
Theoretically, the transmission distance is a function of source output power and
receiver’s sensitivity, hence a transceiver should be designed in order to operate at a
suitable power lever with high receiver gain to obtain desirable link distance but
practically IrDA 1.0 and 1.1 compliant devices have the distance limitation up to 1.0
meter (~3.3 feet) a data rate of 115.2 Kb/s with nearly error free transmission.
Directional IR LEDs can be used to enhance the distance to 30 to 40 feet.

25
Because of the small wavelengths of infra-red in comparison to the detector size, IR
systems are free from the fading effects as opposed to their counterpart RF systems.
The safety from fading and stability in position (i.e. slow movement and static nature
of objects) of the indoor environment result in very low variations in the
characteristics of IR channel for substantial periods of time. Although in IR systems
multipath fading is alleviated but this multipath propagation causes dispersion and
hence resulting in inter-symbol interference in high-speed systems.
[5-12, 27] discusses the features, modulation schemes, comparison with RF, selection
of source as transmitter and detectors as receivers and gave us the reasons supporting
the use of IR in WBANs. The optical wireless signaling offers unique advantages as
mentioned earlier. However, in contrast to the RF system, OW links poses some
disadvantages as well [48]. These problems and their possible solutions are depicted
in Figure 2.6.
Fig. 2.6 Problems in IR links and their proposed solutions

26
With other parameters one of the design considerations for a WBAN is the right choice of
Modulation/ Encoding scheme. Various Modulation schemes are discussed in literature to
ensure the reliability and design of power efficient WBAN [48]. In [12] it is stated that
the intensity modulation direct detection (IM/DD) is the most suitable modulation
scheme for infra-red links. In this modulation, information signal modulates the
instantaneous power of the carrier. [49] Discusses the OW systems usually use three
elementary modulation schemes which are PPM, OOK and SCM. It also discusses
several Spread-spectrum modulation techniques to cope with the issues in OW systems.
[12] compares the results of using OOK with NRZ pulses, OOK with RZ pulses of
normalized width δ(RZ- δ) and pulse position modulation with L pulses (L-PPM) [50]
demonstrates the usage of Gaussian frequency shift keying (GFSK) for the development
of Prototype BAN System with Bluetooth. In [51] WBAN performance is evaluated
through BER and SNR for different BPSK carrier frequencies. [52] analyzes and
compares UWB system using PAM, PWM and PPM.
2.4 SUMMARY
From the survey and literature review it is expected that, the developed techniques
- will advance the vital sign sensors and
- Enable more flexible and highly integrated Tx and Rx architectures.
Currently, majority of the work on WBANs rely on RF and Microwave technologies, and
little is done to investigate the optical signaling schemes despite numerous advantages of
IR over RF. It is aimed to tap into this opportunity!

27
It is also aimed to consider the impacts of
- different transceiver array geometries,
- modulation techniques,
- error-correcting codes, and artificial intelligence techniques
on the performance of the Optical communication systems specifically tailored for
WBAN applications.
The discussion in this chapter gives a general overview about the WBAN. It briefly
discusses the existing technologies used and available for WBAN. It also points some key
features of optical communication which served as motivation to choose infrared
signaling for design of WBAN prototype in this research. The research challenges,
objectives, proposed methodology and summary of major contributions for this research
are also conversed in this chapter.

28
CHAPTER 3
PROTOCOL DESIGN & ALGORITHM
In WBANs equal emphasis should be made on the security as well as system
performance, therefore, it is a challenging task to integrate a high-level security in such
resource-constrained networks. Several prototype implementations of WBANs that deal
with QoS and energy efficiency are reported in the literature, however, less research is
found on the aspects of data security and privacy; also the presented solutions are not
much mature [53]. The pros and cons of the existing security mechanisms are discussed
in Chapter 2.
One of the main concerns in WBANs is the secure transmission, without overloading the
energy requirements. In this research, a new energy efficient protocol is presented with
the following features:
- Improved inherent security
- Interference rejection
- Patient/ node identification
The energy consumption is low as there is no extra circuitry required for encryption.
Also, the nodes can go into the sleep mode in the slots while not transmitting or
receiving. The protocol implementation is experimentally demonstrated using low cost IR
transceiver & Arduino Microcontroller. Experimental results reveal the successful
29
transmission & reception of measured parameters over short ranges with sufficient
accuracy. Furthermore, a Matlab based mobile application is developed which helps to
set up a database in distributed manner and subsequently allow the user to monitor,
visualize and share the measured readings remotely.
This chapter discusses the utilization of IR transceivers to design a new protocol for
energy efficient and secure data transmission in WBANs.
3.1 PROTOCOL SPECIFICATION
A simple but efficient protocol is developed from the perspective of security, and patient/
sensor identification. It also incorporates a method to reject interference from other IR
sources like TV, AC remote controls and false data intruders.
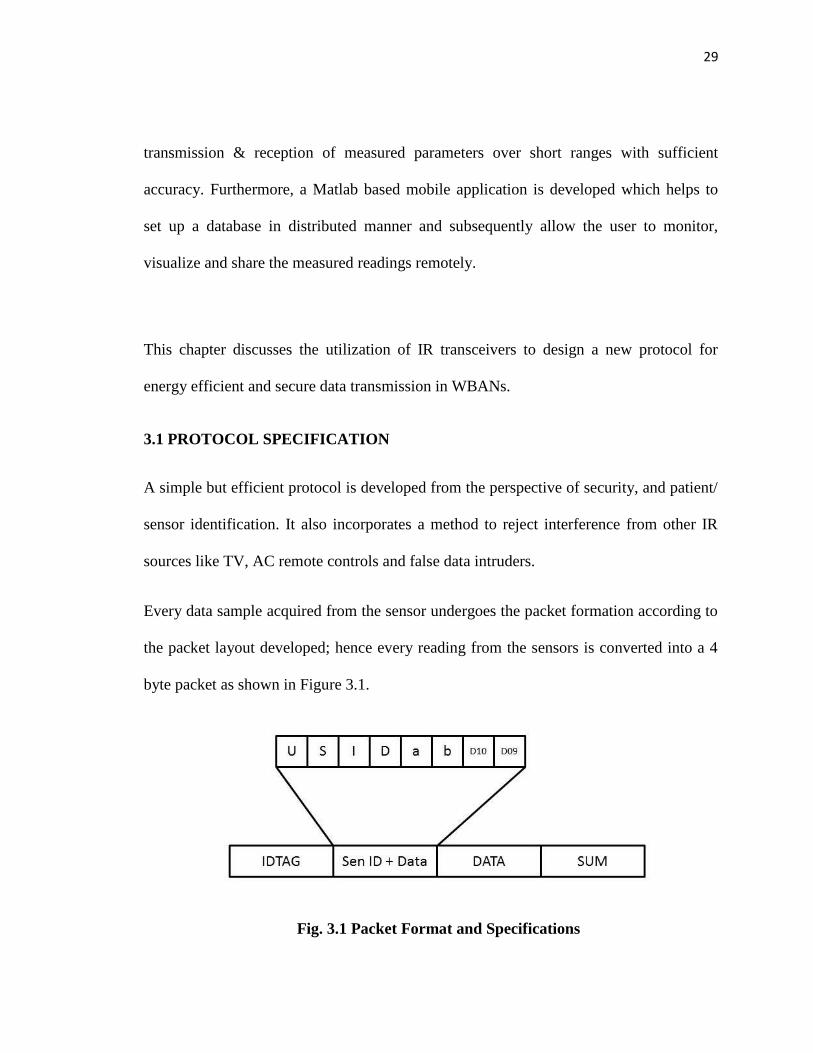
Every data sample acquired from the sensor undergoes the packet formation according to
the packet layout developed; hence every reading from the sensors is converted into a 4
byte packet as shown in Figure 3.1.
Fig. 3.1 Packet Format and Specifications

30
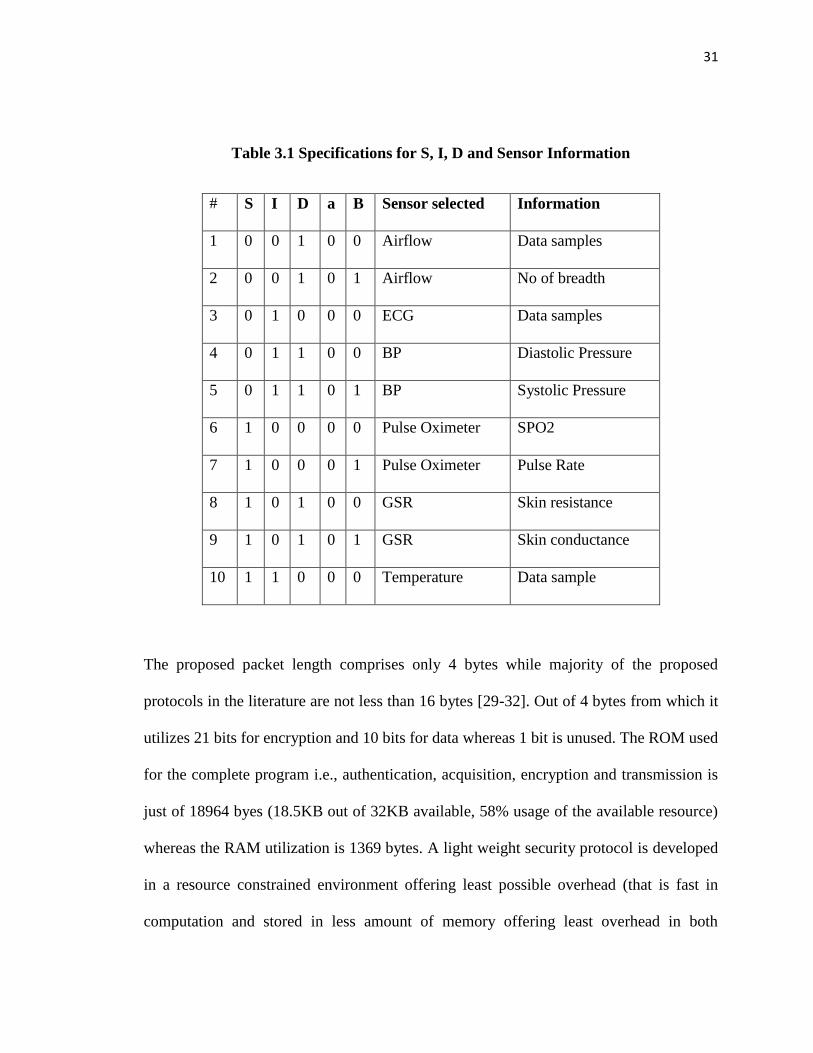
Three types of bits are utilized in the packet: unused bits (1 bit), supervisory bits (21 bits)
and the data bits (10 bits). The first byte called IDTAG uses 8 supervisory bits and is
used for the patient identification. Every person or patient is assigned a unique ID from 1
to 255. It is ensured that neither IDTAG nor SUM exceeds limit of 255 in order to
accommodate it in one byte size. The microcontroller is programmed in a manner that it
generates a unique IDTAG for every person/ patient. For instance the user enters the ID =
123, then the required IDTAG is calculated using the formula developed in Eq 3.1.
IDTAG = [FRACTIONAL PART (SQRT (ID)) x 100] + SUM (3.1)
Here, SUM is the fourth byte of frame and its value is calculated by adding the ID
numbers (in our case SUM = 1+2+3 = 06). This unique IDTAG serve dual purpose.
Firstly, it provides inherent encryption for data transmission; secondly it also rejects the
interference caused by other ambient sources.
The second byte contains 1 unused bit, 5 supervisory bits and two data bits as shown in
Figure 3.1. The specification for Byte 2 is summarized in Table 3.1. There are 10 data
bits divided in byte 2 and byte 3 of the frame. Third byte uses the 8 data bits in
conjunction with the 2 least significant bits of byte 2 to store the data from the sensors.
31
Table 3.1 Specifications for S, I, D and Sensor Information
# S I D a B Sensor selected Information
1 0 0 1 0 0 Airflow Data samples
2 0 0 1 0 1 Airflow No of breadth
3 0 1 0 0 0 ECG Data samples
4 0 1 1 0 0 BP Diastolic Pressure
5 0 1 1 0 1 BP Systolic Pressure
6 1 0 0 0 0 Pulse Oximeter SPO2
7 1 0 0 0 1 Pulse Oximeter Pulse Rate
8 1 0 1 0 0 GSR Skin resistance
9 1 0 1 0 1 GSR Skin conductance
10 1 1 0 0 0 Temperature Data sample
The proposed packet length comprises only 4 bytes while majority of the proposed
protocols in the literature are not less than 16 bytes [29-32]. Out of 4 bytes from which it
utilizes 21 bits for encryption and 10 bits for data whereas 1 bit is unused. The ROM used
for the complete program i.e., authentication, acquisition, encryption and transmission is
just of 18964 byes (18.5KB out of 32KB available, 58% usage of the available resource)
whereas the RAM utilization is 1369 bytes. A light weight security protocol is developed
in a resource constrained environment offering least possible overhead (that is fast in
computation and stored in less amount of memory offering least overhead in both

32
perspectives) by using symmetric keys. The transmission of the packet takes place using
Sony protocol [54].
3.2 EXPERIMENTAL SETUP & METHODOLOGY
Figure 3.2 shows the conceptual block diagram of the proposed system. The experimental
design and implementation of the system is presented in [55]. The sensing node includes
temperature, position, Galvanic skin response, ECG, respiration, blood pressure and pulse
oximeter sensors [56]. The Arduino Uno Board having Atmega328 Microcontroller with
the LED drive circuitry is used as a controlling node and for transmitting IR packets,
whereas Arduino Mega2560 with Atmega AVR microcontroller is used at the receiving
side with IR receiver interfaced with it as shown in Figure 3.3. All the experiments are
performed in a well illuminated room with distance up to 3 to 4 feet between transmitter
and receiver.
Fig. 3.2 Conceptual Diagram
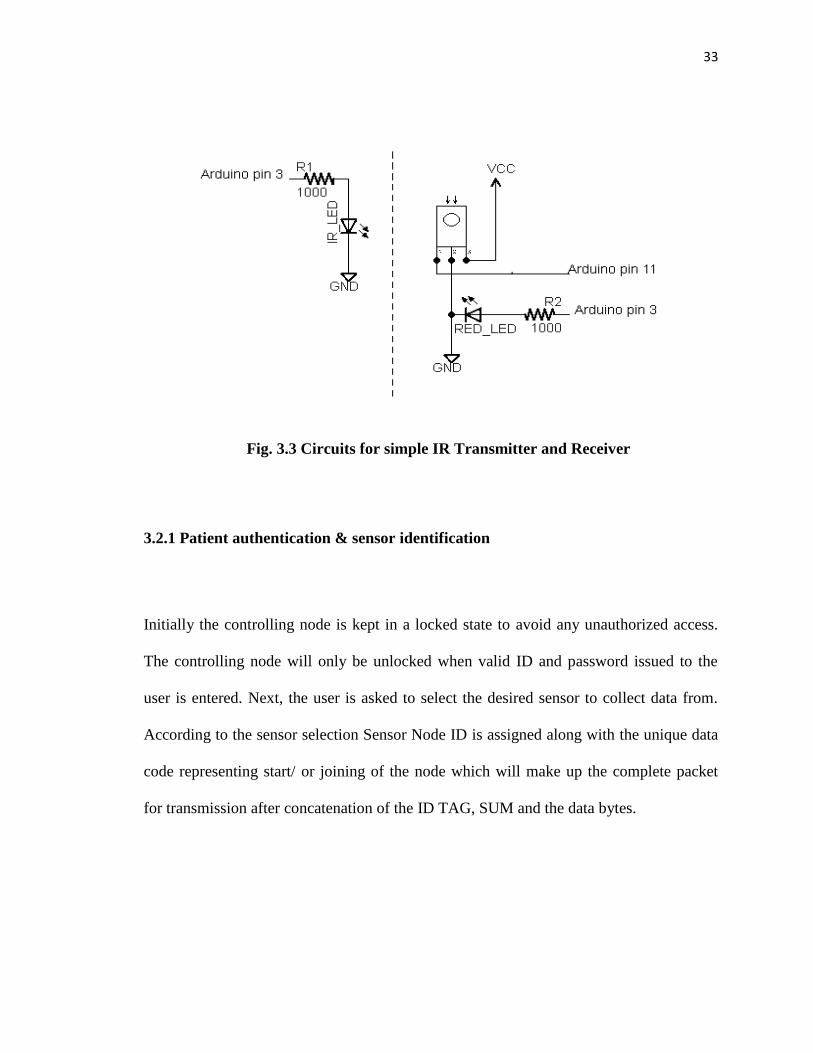
33
Fig. 3.3 Circuits for simple IR Transmitter and Receiver
3.2.1 Patient authentication & sensor identification
Initially the controlling node is kept in a locked state to avoid any unauthorized access.
The controlling node will only be unlocked when valid ID and password issued to the
user is entered. Next, the user is asked to select the desired sensor to collect data from.
According to the sensor selection Sensor Node ID is assigned along with the unique data
code representing start/ or joining of the node which will make up the complete packet
for transmission after concatenation of the ID TAG, SUM and the data bytes.

34
Fig. 3.4 System Flowchart
3.2.2 Transmission & Reception with interference rejection
The transmission initiates with a start packet in which all the 10 data bits are one and it
ends with an end packet where all data bits are zero. A simple IR transmitter is designed
by connecting an LED of 940 nm wavelength through resistor on Arduino. The e-Health
sensor platform library is modified and the proposed algorithms are developed on it as it
does not directly support IR transmission. For this we have used IR remote library which

35
basically supports the transmission of the remote control codes. We have sent the
developed packets using Sony protocol with frequency of 40 kHz.
A simple IR receiver is designed by connecting TV Remote IR receiver IC with Arduino
Mega 2560 microcontroller. The receiver is placed in close proximity of 3 to 4 feet of the
transmitter. The incoming packets are received by the IR receiver and unpacked by the
microcontroller. If they are sent from the authentic source then they must follow the
formula as described in Eq 3.1 for IDTAG otherwise should be rejected and treated as
unauthorized. Similarly if any remote control is directed towards the receiver, it can
reject those signals as well, as shown in Figure 3.5 (a) and (b). The processing results are
shown in Figure 3.5 (c).
(a) (b)
Fig. 3.5 Interference creation with various Remote controls (a) TV/ DVD Remote (b)
AC remote

36
Fig. 3.5 (c) Snapshot of Arduino IDE while receiving all signals i.e. ID1, ID2 and
remote control
3.2.3 Energy efficiency
After the data has been successfully transmitted and received, the controlling node enters
in the sleep mode to save energy during idle periods. The controlling node is scheduled to
wake up every hour or it can be alerted whenever an interrupt is generated from the wake
up circuitry in case of an emergency or upon user’s requirement. Furthermore, the
IDTAGS are soft generated and, therefore no additional circuitry is required for either
encryption or interference rejection. Thus rendering the system energy efficient.

37
3.2.4 Node Joining/ Un-joining
The node enters into the network after authentication process as described above. After
the transmission of start data packet, further packets are formed using actual data from
the sensor which is placed within the packet as described in Table 3.1. When the user
wants to remove the node or when the time for acquisition reaches the preset time limit
an end packet is generated to indicate end of data or removal of the node.
3.3 SUMMARY
This chapter highlighted the development of a novel protocol for this research having key
features of node and patient identification with interference rejection from other IR
sources. The protocol specifications and its working algorithm along with simple IR
Transceiver designs are discussed in this chapter. The protocol is specially made light in
computation and processing to incur least possible overhead while addressing the security
and privacy requirements of WBANs.

38
CHAPTER 4
MOBILE APP DEVELOPMENT
In order to provide the user interface and easy access to the patient/ user an android app is
developed for this research project. Initially the results were tested by using the Matlab
mobile and it gave satisfactory results but to make it more user friendly, a standalone
Android App for acquiring and visualizing vital signs of a person in the form of data and
charts is developed as part of this research project. This chapter discusses the main
development aspects and features of both the mobile Apps.
4.1 MATLAB DATABASE DEVELOPMENT
A database is created through Matlab using simple Excel files by exporting data from the
Arduino Microcontroller. The database creation flowchart is shown in Figure 4.1. The
microcontroller having IR receiver is programmed in such a way that it is capable to
differentiate between various patients with assigned IDs and can store their data
separately in Matlab database. From the data that is coming from the serial port of
Receiving Arduino to Matlab the ID of patient is extracted, through which the record of
the patient is located in the Excel database. Every patient has been assigned a different
sheet name in Excel database file for writing his vital signs information in his respective
sheet. The Matlab program after locating the filename and extracting every individual

39
sensor information, writes it in different columns for a particular patient. The snapshot of
the database with sensors data received by Matlab is shown in Figure 4.2.
Fig. 4.1 Flowchart for database creation

40
Fig. 4.2 Snapshot showing various Fields of created database
4.2 MATLAB MOBILE APPLICATION
A Matlab mobile application [57] is used due to its simplicity to acquire, visualize, store
and share the data from the sensors. It is specially designed by Math Works for smart
phones so that they can be connected to the running sessions on their Cloud or destined
computer. As Matlab mobile does not support the GUI execution, a simple Matlab script
file is developed to be run from Matlab Mobile. Figure 4.3 shows the flowchart for the
algorithm adopted in this script file.

41
Fig. 4.3 Matlab Mobile App Script Algorithm
In order to access the vital signs data of a person or to know the health condition of a
person one must connect to the computer where this information is saved through Matlab
Mobile. In order to access the information one must connect to that computer by giving
first IP address or DNS name, computer name, connector password and port number etc.
through which some are optional settings while others are mandatory. The user knows the
script file name which he or she writes on the Matlab mobile command prompt, once the
Mobile app is connected to the computer. The m script file is simply the code which is
written to load the respective excel file in which the vital signs or sensors data
information is saved for a particular user/ person. After loading the sensor’s data the

42
values are simply displayed on the command prompt with the help of display commands
written in the script file whereas the data from the sensors such as ECG and Airflow are
plotted using plot commands. It is also programmed to show the pictorial representation
of the position detected by the position sensor, five positions detection is programmed for
this purpose. Once the graphs and pictures are brought up in the main window they can
be either saved in pictures/ gallery or easily shared from within the Matlab Mobile App
just like any other applications sharing options. The snapshots of the Matlab Mobile App
running the script file are shown in Figure 4.4.
(a) (b)

43
(c)
(d)
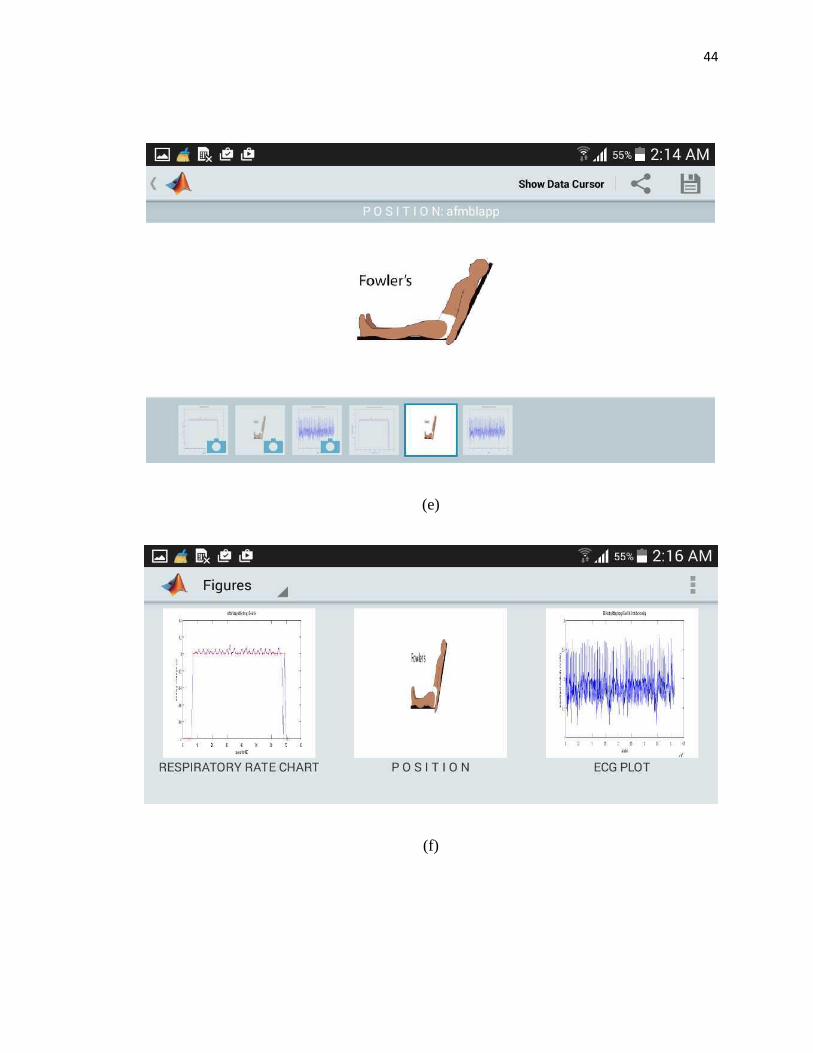
44
(e)
(f)

45
(g)
Fig. 4.4 Script execution output on Matlab Mobile App: (a) Matlab Mobile App
Settings (b) Summary generated on command prompt after script execution (c)
ECG plot (d) Airflow chart (e) Position State (f) images to be saved in pictures (g)
Options to share images from Matlab Mobile
4.3 ARDUINO & ANDROID DATABASE WITH ANDROID APP ACCESS
Another method that is used in this research for accessing the vital signs sensors data
through Mobile is with the help of Android App which is more user friendly, easy and is
independent of the Matlab platform.

46
4.3.1 SD Card Database creation and its Access
After authentication and the sensor’s data extraction from the Arduino program according
to the packet formation, sensor data values are saved now in SD card with every patient’s
separate text file having starting and ending packets to distinguish each sensor data set’s
start and its end. So the SD card will be recording multiple sets of the tests for the same
patient or different patients at different instances.
The Arduino program besides writing the data on SD card also checks for any message at
UDP port 5555 if there is any message then check either it is of the form “fetch:id*#--3*”
or not, if yes then extract the ID from it, note IP address of the sender, read particular
id.txt file from the SD card and the file contents to the same sender’s IP at same port
5555 and if there is no such message on UDP port then skip this step and continue the
previous routine.
4.3.2 B4A Anywhere software
An android app is developed using B4A Anywhere software (Rapid Application
Development) RAD tools. B4X programming language is an enhanced form of VB plus it
gives the facility thorough B4A-Bridge to directly connect your physical device right
from the IDE and observe the effects instantly while developing over the local network
either by using Wi-Fi or Bluetooth so it was found easy to develop the app for this
research using B4A. The features of this software are shown in Figure 4.5 [58].

47
Fig. 4.5 RAD tools by Anywhere Software
4.3.3 Developed Android App
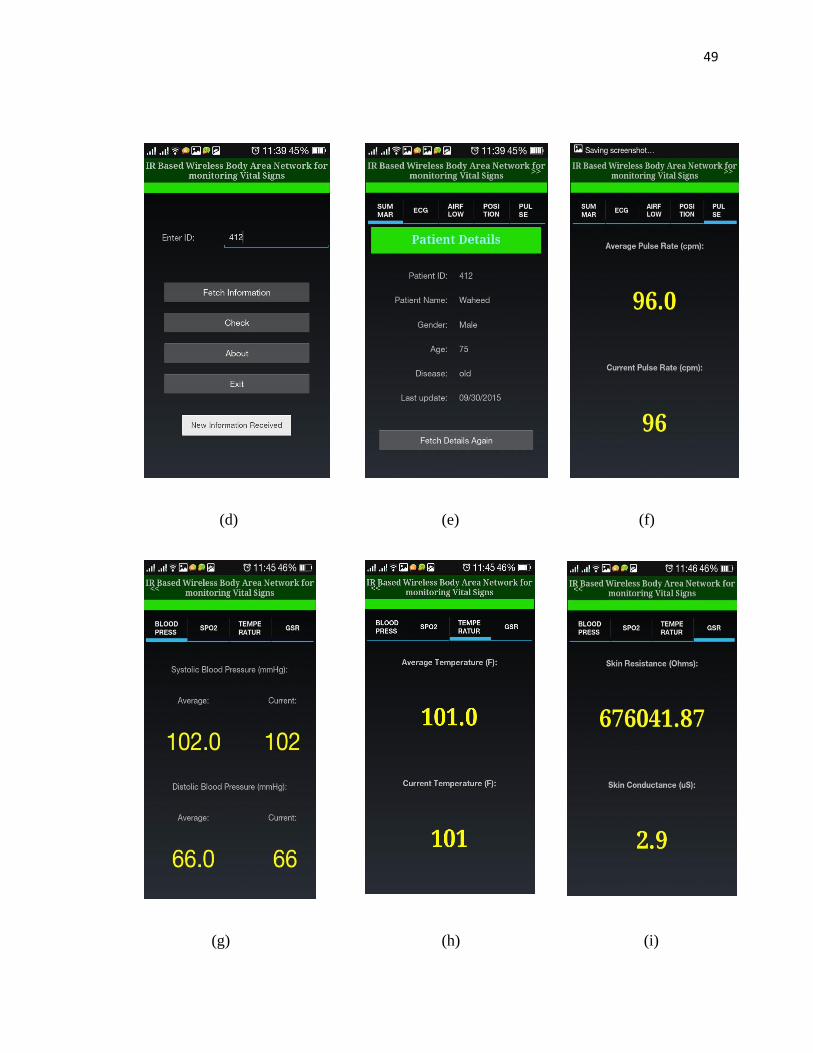
The Android app is capable to perform:
i. Online tests i.e. fetch most recent values.
ii. Fetch previous values saved in the SD card attached with Arduino
Microcontroller.
iii. Display charts/ Graphs of ECG & Airflow, also pictorial representation of
person’s position.
iv. Save and share from within the developed Android App.
Another database is created in the mobile using SQLite. When the user is connected to
the receiver he/ she can get the recent test values. Once the new values are acquired they
are saved in the Mobile’s memory using SQLite which can be seen later in offline mode

48
as well, until the new values are acquired as they will be overwritten in order to display
new graphs and charts in accordance with the fresh data. This is done in order to avoid
any overload on mobile’s memory. The app supports saving and sharing of the data and
charts so it is up to the user’s decision which test reading he/ she wishes to save or share
for later use within mobile. Figure 4.6 illustrates the snapshots of the developed Android
App.
(a) (b) (c)
49
(d) (e) (f)
(g) (h) (i)

50
(j)
(k)
(l)

51
(m) (n)
Fig. 4.6 Android App Screen Shots (a) Home Screen (b) About Screen (c) Start
Screen (d) Fetch Information Screen (e) Results of Fetch Information Screen (f)
Pulse Rate Screen (g) Blood Pressure Screen (h) Temperature Screen (i) GSR
screen (j) Airflow Graph (k) ECG graph (l) Position State Screen (m) Share Screen
(n) Result of Sharing data on WhatsApp Screen
4.4 SUMMARY
This chapter discusses the development of the mobile apps to visualize the physiological
data in a user friendly manner. This chapter presents the app development and their
results in numerical as well as graphical screen shots form. Two mobile app platforms i.e.
Matlab Mobile and Basic4Android are used in this research and discussed in this chapter.

52
CHAPTER 5
PROTOTYPE DESIGN
One of the major contributions for this research work is the prototype design that could
be used as a WBAN. As WBAN is a network consisting of sensors capable of measuring
and monitoring vital signs, the main objectives were to select appropriate sensors, their
interfacing in WBAN & data acquisition through them and the design of optical
transceiver working within sub meter range of human body. The proposed prototype can
be better understood form Figure 5.1.
Fig. 5.1 Proposed Prototype WBAN

53
5.1 SELECTION OF SENSORS
The foremost technical challenge is to design a physiological sensor or device [20]. As
the primary focus in this research was optical signaling from the sensor nodes so a
number of sensor nodes were investigated which can easily be connected and interfaced
in this prototype. After surveying different sensors available in the market, e-health
sensor platform by Cooking Hacks Libellium (Spain) was chosen to be the source of
Vital signs sensor data [56].
5.1.1 Features of e-health sensor platform
The e-health sensor platform is a complete kit which comes along with 9 sensors (V1.0)
and 10 sensors in (V2.0) including EMG sensor. It consists of a biometric shield
compatible with Arduino and Raspberry Pi. The shield contains all the necessary drive
circuitry for the sensors and connectors. The e-health shield and the sensors are shown in
Figure 5.2 [56].

54
Fig. 5.2 e-health sensor complete kit [56]
In this research following sensors are used:
i. Position sensor or Accelerometer
ii. Pulse Oximeter
iii. Temperature sensor
iv. GSR sensor
v. ECG sensors
vi. Blood Pressure sensor
vii. Air Flow sensor

55
Fig. 5.3 Cooking Hacks e-health sensor platform by Libellium (a) Sensor Shield (b)
Sensor Shield mounted on Arduino UNO
5.1.2 Data Acquisition
In order to acquire data, the sensors are plugged in with the shield and connected with the
Arduino UNO microcontroller which now serves as the controlling node for this
prototype WBAN shown in Figure 5.3 (a & b). The e-health shield comes with the e-
health library and programs to acquire the data which are customized and the data packets
are appended with security and patient/ node identification information according to the
developed protocol as described in chapter 3.
E-health sensor platform provides connectivity through the following 5 wireless
technologies:
i. 3G
ii. Bluetooth
56
iii. GPRS
iv. ZigBee/ 802.15.4 and
v. Wi-Fi
All of these require extra shield/ module to be mounted on the shield which is not cost
effective plus it was aimed to provide low power, low cost solution for wireless
transmission. In order to transmit data with low complexity in context of cost, power and
computational overhead, an IR transceiver is designed with the inexpensive and easily
available components.
5.2 SELECTION OF IR SOURCE
There are two main sources for IR transmission i.e. LED and Laser Diode. LED being the
cheaper, simpler, low in output power, suitable for low data rate and short ranges as
compared to the laser diode is chosen here for a simple IR transmitter design.
5.2.1 LED Drive circuitries
Various LED drive circuits were tested to cover longer range as shown in Figure 5.4.
From the experiments it was found that the transistor drive circuitry gives better coverage
amongst the components discussed here. The detection efficiency also depends upon the
receiver or the detector used for the IR transceiver.

57
Fig. 5.4 LED Drive Circuits
Hence a simple IR Transmitter is designed just by connecting IR LED with transistor
drive to pin 3 of the Arduino that is responsible for IR transmission.
5.3 IR RECEIVERS/ DETECTORS
There are various photodetectors available in the market. Following four detectors are
used which are easily available in the market/ Lab at very low price for testing and
analyzing the performance for the development of proposed IR based WBAN.
i. Photodiode
ii. phototransistor
iii. TV remote IR receiver
iv. Thor Lab PIN diode

58
Fig. 5.5 Photodetectors
5.3.1 Testing Photodiode
The photodiode was tested first in an open loop by giving an IR signal from a remote
control as our vital signs data has to be a modulated signal using IR Remote control
modulation schemes. It was observed that the voltage across the simple diode is only of
the order of 300mv (Figure 5.6) which specifies the need for biasing circuitry. So a
resistive biasing circuitry was employed but it introduced noise at the receiver.
Photodiode response in both cases is shown in Figure 5.7 when a square wave signal is
fed to the LED from the Function generator and when a modulated signal from Arduino
pin 3 is given to the LED.

59
Fig. 5.6 Photo Diode Response in Open Circuit Fig. 5.7 Photo Diode response with
ResistorBiasing when a signal
from Remote control is given
5.3.2 Testing Photo Transistor for Transceiver Design 1
In order to improve the response of the photodetector in terms of noise and signal level, a
photo transistor with amplification stage added is used as shown in Figure 5.8. Though
this configuration improves the received signal, but it is still limited to a transmission
distance upto few centimeters. Beyond 5 cm the signal degrades significantly.

60
Fig. 5.8 Photo Transistor Receiver Design
So IR Transevier design 1 is designed with the above mentioned components and drives
that yields better results i.e. LED with transistor drive and a phototransistor with OPAMP
amplification stage. The Block diagram and the prototype is shown in Figure 5.9 (a) and
5.9 (b).

61
Fig. 5.9 (a) Block Diagram of IR Transceiver Design 1 (b) Prototype of IR
Transceiver Design 1
Another IR transiever prototype is designed using simple LED drive transmitter and an
IR remote control receiver IC both connected with the separate arduinos.
5.3.3 IR Remote Control Receiver IC and Working of IR Transceiver design 2
The transmitter of the IR Trasnsceiver design 2 sends the remote control codes but having
vital signs sensors data encoded as remote control codes. This working is explained in
Figure 5.10 where an arduino Uno board sends the data from arduino pin 3 as modulated
IR packets.
(a) (b)

62
Fig. 5.10 Block Diagram of IR Transceiver Design 2
These packets can be encoded in any of the remote control protocol and modulation
scheme supported by Arduino IRremote Library. The new protocol developed in this
research was described in chapter 3. Various IR Remote Control Protocols which are
present are listed in Table 5.1 where as the protocols supported by Arduino IRremote
Library are listed in Table 5.2. In this research Sony SIRC Protocol and Phillips-RC5
Protocol are tested in experiments.

63
Table 5.1 Various IR Remote Control Protocols
Table 5.2 Protocols supported by Arduino IR Remote Library
S. No. Protocol S. No. Protocol
1 NEC 6 DISH
2 Sony 7 Panasonic
3 Sharp 8 JVC
4 RC5 9 Sanyo
5 RC6 10 Mitsubishi
The Arduino IR Remote library provides the following features:
Encodes the data in accordance with desired protocol specification.
Supports development of user defined protocols (Raw data).
Recognizes the protocol type at receiving end.
Decodes the received data according to protocol specifications.
S. No. IR
Protocol
Modulation/
Encoding
Scheme
No of
D+C bits
Msg
Duration(ms)
Carrier
Frequeny
1 ITT Pulse
Distance
14 1.7-2.7ms -
2 JVC Pulse
Distance
16 43.6 (max) 38KHz
3 Nokia
NRC17
Bi Phase 17 20 38KHz
4 NEC Pulse
Distance
16 49.5 (max) 38KHz
5 Sharp Pulse
Distance
13 26 (typ) 38KHz
6 Sony
SIRC
Pulse width 12,15,20 27(max) 40KHz
7 Phillips
RC-5
Bi Phase
(Manchester)
11 25 36KHz
8 Phillips
RC-6
Bi Phase
(Manchester)
variable 36KHz
9 Phillips
RCMM
Pulse position 12,24 3.5-6.5 36KHz
10 Phillips
RECS-80
Pulse
Distance
12 38(max) 38KHz
11 X-Sat Pulse
Distance
16 48(max) 38KHz

64
Supports the protocols mentioned in Table 5.2.
The Sony SIRC Protocol and Phillips-RC5 Protocol formats are shown in Figure 5.11(a)
and (b).
Fig. 5.11 (a) Sony SIRC Protocol Fig. 5.11 (b) Phillips-RC5 Protocol
Once the encoded data is transmitted, it is received by the IR remote control IC. As the
IC contains built in Amplifier, Band pass filter, Demodulator and Comparator, things
become really easiy with this small IC occupying very less space and circuitry with very
low power consumption. The raw data that appears on LED at transmitting side and at pin
1 of the IR remote control receiver IC is shown in Figure 5.11 (a) and 5.11 (b). The
decoding part is taken care by Arduino IR Remote library. So with simple harware design
and using the library features we acquire secure and reliable IR communication between
transmitter and receiver for our prototype WBAN.

65
5.4 PERFORMANCE ANALYSIS
Two parameters are selected to analyze the performance of the IR Transciever designs 1
& 2, which are Distance and Noise. Experimental setup for observing the effect of
varying these parameters through eye diagram is described in the next section.
The measurements can be read directly from the oscilloscope where as the signal to noise
ratio and bit error rate (BER) can be calculated by using Eq 5.1 to Eq 5.4.
( )
( ) (5.1)
( ) ( ) (5.2)
(√ ) (5.3)
(
√ ) (5.4)
We have taken readings and calculated the above mentioned parameters for both
Transeiver designs 1 & 2.
5.5 EXPERIMENTAL SETUP
An eye diagram is generated on an oscilloscope using the setup of Figure 5.12 . The data
signal to be transmitted is generated from either the function generator or from arduino
pin 3 which is applied to the LED drive circuitry and also visualized at oscilloscope’s
channel 1. When taking the measurements for noise effect, a noise signal is added with
this input signal from Agilent 33250A Function generator/ Arbitrary Waveform

66
generator, whereas the received signal from the detector is visualised at channel 2 of the
oscilloscope. Here we have used the data signal itself as a trigger signal for making
overlapping eye patterns and have set the persistance value to 1 sec in order to get clear
measurement results from the eye diagrams [59-64].
Fig. 5.12 Test Set-up for Noise Effect Measurements
The noise signal generated from the Function generator is a white noise. There are four
options available in the Function generator to vary noise parameters as shown in Figure
5.13. Experiments show significant effect in reception when DC Noise offset is varied
hence results for varying offset value are discussed in chapter 6.

67
Fig. 5.13 Noise Signal generation from Agilent 33250A Function generator/
Arbitrary Waveform generator and its effect in transmission and reception
5.6 ThorLAB PIN DIODE
Due to the limitations incurred by the photodiode and phototransistor in terms of distance
and sensitivity to noise, other options like TV remote control receiver IC and ThorLAB
PIN diode were also tested in this research for the suitability of designing WBAN
Prototype IR receiver. The ThorLAB DET100A is a large area Silicon photodetecter with
a wavelength range of 400 to 1100nm and Peak Wavelength at 970nm which is close to
the IR Transmitter LED used i.e. 940nm. These diodes are ideal for measuring both
pulsed and CW light sources. The output is taken from the BNC connector which is the
direct photocurrent out of the photodiode anode and is the function of incident light
power and wavelength. The output from the PIN diode is coming in range of 300mV so
an OPAMP amlifier is connected to its BNC output to amplify the signal upto 2V. This
PIN Diode is used in conjuction with the EV/MCM31 Digital Modulation Trainer which

68
is used here to generate an encoded and modulated signal which will serve as Tx signal
and through which IR LED is driven. The ThorLAB receiver is palced at a distance of
upto 3 feet from the IR transmitter. The ThorLAB Receiver’s output after getting
amplified is now fed to another EV/MCM31 trainer to ensure isolation between
transmitting trainer and receiving trainer plus to vary the distance between transmitter
and receiver easily.
The MCM31/EV trainer board (Figure 5.14) is used here to study the effects of digital
modulation schemes on the reception provided by the trainer along with the test points
and connectivity [65], through which it becomes easy and handy to observe the impacts
of varying various parameters like distance between the transmitter and receiver, angular
displacement from LOS to few degrees from receiver, effects of increasing light intensity
in the room by making the number of lights ON and OFF. Different encoding schemes
(BIT, Dibit, TRIBIT, Manchester) provided by the trainer were also tested to observe the
effect on reception. Various experiments are performed and the performance of the link
is evaluated with the help of eye diagrams and constellation diagrams plotted on
TEKTRONIX TDS2012 Oscilloscope discussed in chapter 6.

69
Fig. 5.14 EV/MCM31 Digital Modulation Trainer
The modulation scheme, encoding scheme, demodulator and decoder are selected through
the jumpers.
Following connections and settings are carried out in order to perform all the experiments
for this Transeiver set up.
- TP20 is used as the TX signal for driving IR LED from trainer 1.
- Amplified output from ThorLAB PIN detector connected to TP20 of Trainer 2 at
distance upto 5-7 ft.
- TP24 which is the low pass filtered output and serves as the carrier removed
signal is used to plot the eye diagrams of the received signal.
- TP9 (Trainer 2) RX DATA is used to compare the received data against the
transmitted data at TP4 (Trainer1).

70
- TP3 is used to observe the clock frequency/ data seed for the generated data
according to selected encoding scheme and modulation through jumpers which
are fixed or by default setting of the trainer.
- The data rates supported by the trainer are listed in Table 5.3.
Table 5.3 MCM31/EV Encoding schemes and their respective data rates
S.No Encoding Scheme Data speed (bits/s)
1 Manchester 300
2 Bit 600
3 DiBit 1.2K
4 Tribit 1.8K
- The bit speed is changed to keep the same symbol speed (i.e. 600 Baud) in every
encoding/ modulation.
- TP27(X) and TP28(Y) of trainer 2 are used to plot constellation diagrams on
Oscilloscope in XY Mode.
The transeiver designed using the two trainers is illustrated in Figure 5.15.

71
Figu
re 5
.15
IR T
ran
seiv
er
usi
ng
Th
orL
AB
PIN
an
d M
CM
31
/EV
Tra
iner

72
The experimentul results with these connections and settings according to the variations
in parameters chosen are discussed in Chapter 6.
5.7 SUMMARY
The prototype development for the IR based WBAN has been covered in this chapter. It
highlights the interfacing of sensors, their connectivity in WBAN, the issues encountered
in choosing transmitter and detectors for the prototype development and their possible
solutions. This chapter also explains the experimental set up and describes each
component, board and equipment specifications, usage and limitations in the
experimental work for this research.

73
CHAPTER 6
RESULTS & DISCUSSION
The performance of Transceiver designs presented in chapter 5 is evaluated in this
chapter by using eye diagrams. The first two designs are tested for the two parameters i.e.
Distance and Noise whereas Transceiver design using ThorLab PIN detector is tested for
varying distance, ambient light, angle and modulation schemes.
6.1 TRANSCEIVER DESIGN 1 READINGS WITH INCREASE IN DISTANCE
Figure 6.1 (a-c) shows the effect of varying link distance when a simple square wave was
transmitted through IR transceiver design 1. The received waveforms and eye diagram
clearly shows the degradation in the signal when the distance is increased. The
experimental readings found from oscilloscope and the SNR calculated using Eq 5.1 and
Eq 5.2 are listed in Table 6.1. The degradation of SNR with increase in distance is also
visualized by graph in Figure 6.1 (d) whereas the BER is calculated using Eq 5.3 & Eq
5.4 and plotted in Matlab in Figure 6.1 (e).

74
Fig. 6.1 (a) Fig. 6.1 (b)
Fig. 6.1 (c)
Fig. 6.1 Photo Transistor Response- (a) Tx-Rx 3cm (b) Tx-Rx 6 cm (c) Tx-Rx 9cm

75
Table 6.1 Experimental Readings for Transceiver Design 1 with Distance
S.No. Distance
(cm)
Noise
level
(mV)
Signal
level
(V)
SNR SNR
(dB)
Jitter
(µs)
Vertical
Eye
Opening
(V)
Horizontal
Eye
Opening
(µs)
Rise
Time
(µs)
Fall
Time
(µs)
1 3cm 560 9.12 16.28 24.23 14 7.76 47 17.6 16.45
2 3cm 560 9.6 17.1 24.6 16 8.4 50 17.1 17.60
3 6cm 280 2.52 9 19.08 13 2.2 56 20 21.03
4 6cm 320 2.52 7.8 17.84 11 2.1 58 22 24
5 6cm 160 1.42 8.87 18.9 22 1.16 74 20.2 21.2
6 9cm 80 376m 4.7 13.44 15 192m 96 24.4 26.60
7 9cm 160 608m 3.8 11.59 18 336m 97 36.3 38.2
8 9cm 140 460 3.2 10.1 20 260m 42 21.5 25
Fig. 6.1 (d) Effect of increasing Distance on SNR (e) Matlab Simulation for SNR vs
BER with varying distance for Transeiver Design1
SNR of 16.28 achieved with 3 cm Distance
(e) (d)
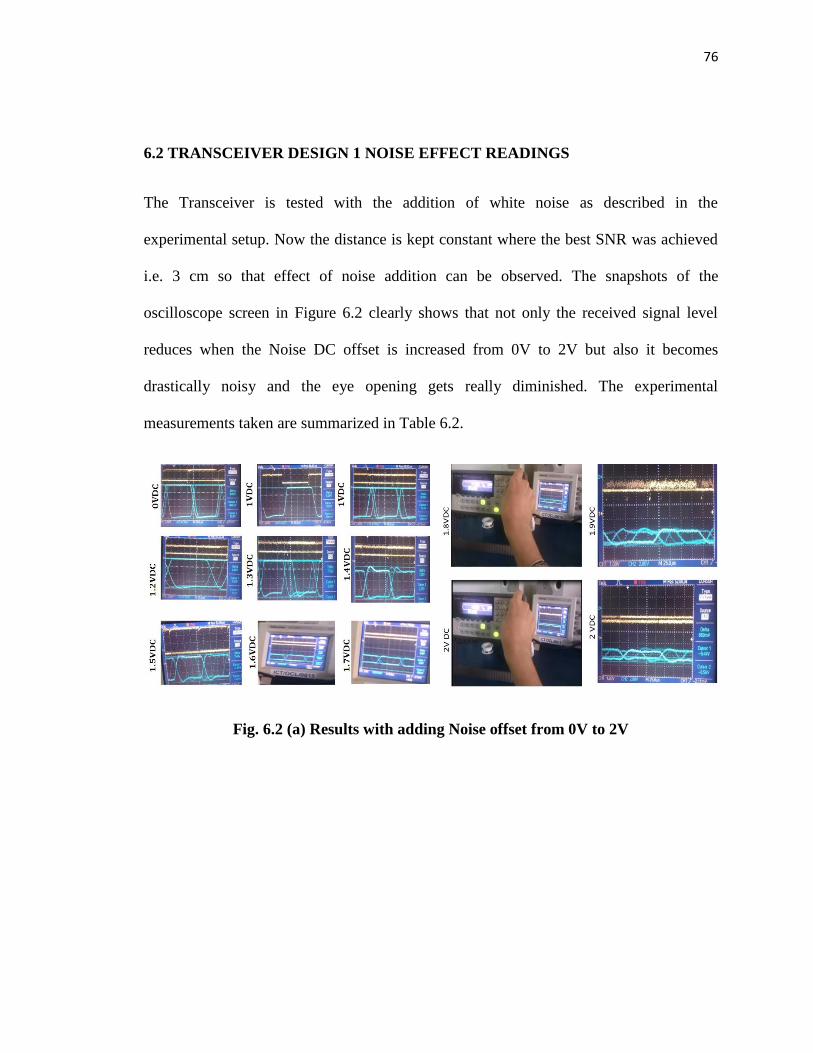
76
6.2 TRANSCEIVER DESIGN 1 NOISE EFFECT READINGS
The Transceiver is tested with the addition of white noise as described in the
experimental setup. Now the distance is kept constant where the best SNR was achieved
i.e. 3 cm so that effect of noise addition can be observed. The snapshots of the
oscilloscope screen in Figure 6.2 clearly shows that not only the received signal level
reduces when the Noise DC offset is increased from 0V to 2V but also it becomes
drastically noisy and the eye opening gets really diminished. The experimental
measurements taken are summarized in Table 6.2.
Fig. 6.2 (a) Results with adding Noise offset from 0V to 2V

77
Table 6.2 Experimental Readings for Transceiver Design 1 with Noise effect
S.No. Noise
offset
V
DC
Noise
level(mV)
Signal
level(V)
SNR SNR
(dB)
Vertical
Eye
Opening(V)
Horiz-
ontal
Eye
Opening
(µs)
Jitter
(µs)
Rise
Time
(µs)
Fall
Time
(µs)
1 0 640 9.60 15 23.52 8.56 93 14 15.1 16.8
2 1 880 9.2 10.45 20.3 7.92 96 27 15.3 17.8
3 1.2 960 8.56 8.916 19 7.12 68 4.6 16.5 17.2
4 1.3 1.04V 7.76 7.46 17.4 6.24 85 12 18.2 20
5 1.4 800 7.2 9 19.08 5.2 99 10 21.8 29
6 1.4 880 7.04 8.4 18.48 5 102 16 20.7 26
7 1.5 1.04V 7.04 6.7 16.5 4.72 88 24 22.9 78.7
8 1.6 1.12V 6.24 5.57 14.92 3.84 88 13 21.2 22
9 1.6 1.36V 6.24 4.58 13.22 3.4 99 19 20.3 22.2
10 1.7 1.44V 5.28 3.66 11.27 2.9 92 24 18.2 20
11 1.8 960 4.16 4.33 12.73 2.72 97 26 18.8 19.3
12 1.9 960 3.36 3.5 10.88 2.24 99 9 16.3 18.8
13 2 800 1.84 2.3 7.23 960m 92 2.2 18.8 21.4
Best SNR of 15(23.52dB) achieved with 0VDC
Fig. 6.2 (b) Effect of increasing Noise DC
offset on SNR
Fig. 6.2 (c) Matlab Simulation for SNR vs
BER with DC offset Noise Value for
Transeiver Design 1

78
6.3 EXPERIMENTAL RESULTS FOR TRANSCEIVER DESIGN 2
The Transceiver Design 2 as discussed in Figure 5.10 is also tested by varying link
distance as well as DC Noise offset value in a well illuminated room setup as shown in
Figure 6.3. Readings are taken while increasing the distance from 1ft to 4ft and
comparing the data sent versus received data as shown in Figure 6.4 (a) and (b). It is
observed that there are not many errors introduced in the data and the WBAN vital signs
data reach the destination quite reliably. Also the received signal maintains a good SNR
value due to the built in circuitry in the IR Remote Control Receiver IC. The data was
sent using Sony as well as RC5 protocols.
Fig. 6.3 Experimental setup for Transceiver Design 2 (Link distance upto 4 feet)

79
(a) (b)
Fig. 6.4 Experimental Results with Receiver upto 4 feet apart (a) Sony Protocol (b)
RC5 Protocol
6.4 TRANSCEIVER DESIGN 2 NOISE EFFECT READING
The Noise is added in the same way as in Transceiver Design 1. The observations and
readings show that the SNR remains pretty constant with the increase in Noise DC offset
but after a threshold value of DC offset the data starts getting corrupted. This effect is
shown in Figure 6.5 (a-c) for both protocols i.e. RC5 as well as Sony.
Fig. 6.5 (a) Experimental Results for Effect of adding Noise offset (RC5 Protocol)

80
Table 6.3 Experimental Readings with Noise for Transceiver Design 2
Fig. 6.5 (b) Experimental Results for Effect of adding Noise offset (Sony Protocol)
(c) Effect of Distance & Noise on SNR in IR Receiver IC
(b) (c)

81
As the SNR is not much effected by the addition of DC offset noise so calculation based
on SNR will not yeild correct results so we have measured the level of data corruption by
calculating BER through Matlab by importing transmitted sequence versus received
sequence and then comparing bit by bit to calculate number of errors. Thus BER is given
by Eq 6.1.
(6.1 )
The readings taken are illustrated in Table 6 and Figure 6.5 (d).
Table 6.4 Experimental Readings with Noise for BER in Transceiver Design 2
S.No. Noise
offset
No of
samples
No of bits
(no of
Samples*16bits)
No of
bits in
error
Bit error
rate
1 0 VDC 3000 48000 0 0
2 0.5VDC 3000 48000 07 0.000146
3 1VDC 3000 48000 13 0.000271
4 1.3VDC 3000 48000 843 0.0175
5 1.6 VDC 3000 48000 967 0.020146
6 1.7VDC 3099 49584 2183 0.044026
7 1.72VDC 1632 26112 977 0.03741
8 1.73VDC 3026 48416 1803 0.03724
9 1.74VDC 3028 48448 1333 0.027514
10 1.75VDC 3034 48512 1115 0.0222969
11 1.8 VDC 2894 46304 5673 0.122516
12 1.9 VDC 3000 48000 9078 0.189125

82
Fig. 6.5 (d) BER curve with noise offset in Transceiver Design 2
It is observed in Figure 6.5 (d) that when the DC Noise offset is below the threshold
value of 1.3V DC, the BER is within the range of 0 to 1 %. So in order to get successful
reception within tolerable limts the Noise DC offset should be less than 1.3VDC.
Two low cost transceiver designs have been tested for WBAN using optical signaling
schemes with their performance analysis with respect to Distance and Noise. It is
demonstrated through experiments that Transceiver Design 2 is better than Transceiver
Design 1 due to coverage upto 4 feet as well as signal quality which are the requirements
of WBAN. These comparative results are summarized in Figure 6.6.

83
Fig. 6.6 Comparative results for peformance analysis of transceiver design 1 & 2

84
6.5 TRANSCEIVER DESIGN 3
The arrangements and connections of the ThorLAB PIN receiver with the MCM31/EV
Trainers were discussed in chapter 5. In order to evaluate the performance of this
transceiver system discussed in Figure 5.15. The experimental setup was made in the
Research Lab1 IIT Building MUET whose dimensions for this evaluation are illustrated
in Figure 6.7.
Fig. 6.7 Research Lab 1 (IIT building MUET) Experimental setup and lab
dimensions
An IR LED of 940nm wavelength is used for the experiments in conjunction with the
MCM31/EV Trainer to serve as the Transmitter shown as Tx in Figure 6.7 whereas a
Silicon based PIN detector is used with another MCM31/EV Trainer which serves as the

85
receiver also shown as Rx in Figure 6.7. This setup is placed on the desk in the middle of
the lab as the light if falling directly upon the receiver severely deteriorates the reception.
Also the window is covered because even if the sunlight not falling directly upon the
window but it was creating so much interference and noise that it was not possible to
carry out experiments. The room lights were purposely turned ON and OFF to observe
the impact of fluorescent/ ambient lights on the optical wireless communication link.
Table 6.5 and Table 6.6 explains the impact of turning specific light switching (ON/OFF)
upon the PIN Rx received power and light intensity in the Lab (lux). NewPort Digital
power Meter Model 815 was used to calculate the received power from PIN RX due to
lights variation at the above mentioned installation place. Table 6.5 enlists the readings
taken at Research Lab1 IICT MUET for this experimental setup.
Table 6.5 Received Power Readings taken at Research Lab1 IIT building from PIN
RX for change in light due fluorescent bulbs switching.
S. No. No. of lights ON Power received
1 One 0.62mW
2 Two 0.72mW
3 Three 1.44mW
4 Four 1.84mW
The PIN Rx is placed on a stand with rotor and markings in the base to calculate angular
displacement from LOS between Tx and Rx. The distance towards the wall also has
impact upon the readings. If the receiver is rotated clockwise (towards right wall where a
white board is placed and has greater distance from receiver to wall) the angle is less up

86
to which we can get acceptable reception as compared to the anticlockwise rotation of the
dial (towards the left wall which is just 2 feet away from the receiver). This angle also
depends upon the modulation scheme, noise due to the presence of amount of light and
the distance between the Tx and Rx.
In order to have a quantitative measurement of the light present in the lab, an ambient
light sensor (Vendor: TAOS, version: 1, power: 0.75, maximum range: 3000, resolution
1.0) built in the smart phone (Huawei Honor 6) was used along with sensor box for
Android app in these experiments to measure incident light intensity at the point where
the receiver is placed. Table 6.6 demonstrates the variation in lux values due to switching
of lights installed in the Research lab. It was observed that the lux meter showed
maximum value of 499 lux when all the four lights were ON and if the smart phone is
kept directly below the light installed at the ceiling which decreases gradually if the
phone is taken away from the light. The android app showed the reading in the range of
2000 lux when faced towards the window when the window is uncovered and 0 lux when
the smart phone is covered or there is complete darkness. It should be noted that the PIN
Rx is facing towards the LED Tx and not facing up towards the ceiling so less amount of
light is entering the PIN receiver.
Table 6.6 Readings taken while switching the light at Research lab1 IIT Building
MUET by ambient light sensor of Smart Phone
S. No. No. of lights ON Illuminance (Lux) 1 None 0-2
2 One 4-6
3 Two 8-14
4 Three 16-20
5 Four 34-39
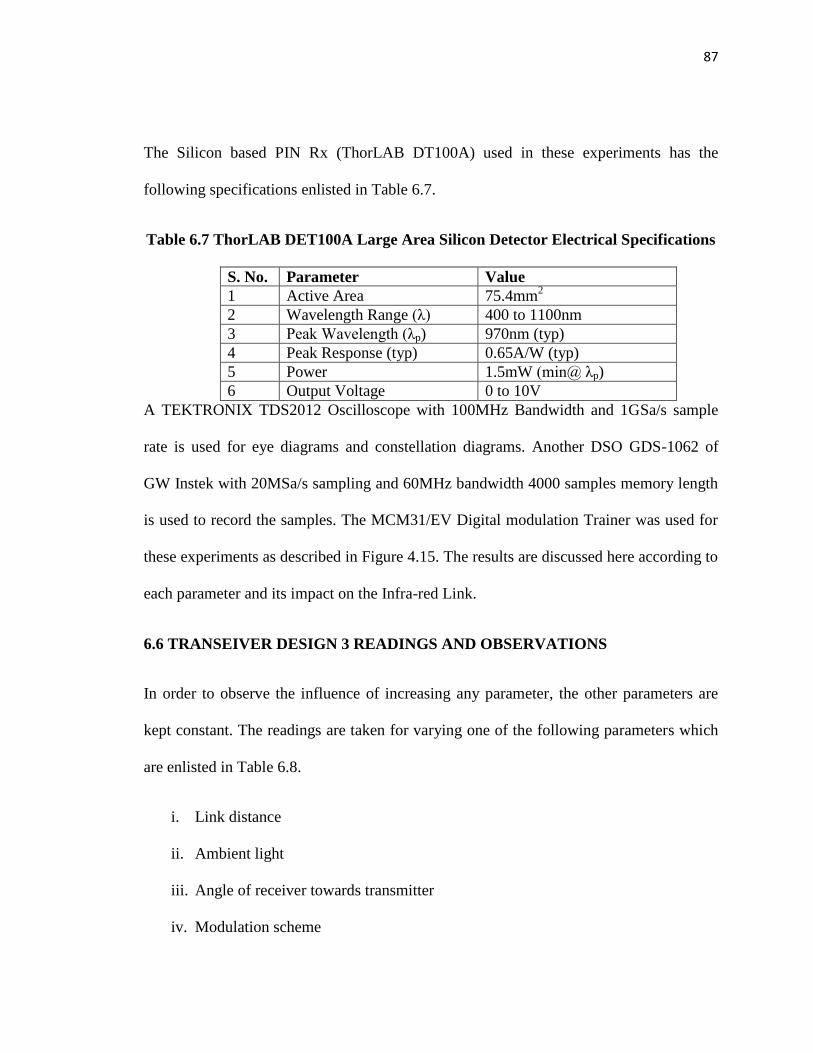
87
The Silicon based PIN Rx (ThorLAB DT100A) used in these experiments has the
following specifications enlisted in Table 6.7.
Table 6.7 ThorLAB DET100A Large Area Silicon Detector Electrical Specifications
S. No. Parameter Value
1 Active Area 75.4mm2
2 Wavelength Range (λ) 400 to 1100nm
3 Peak Wavelength (λp) 970nm (typ)
4 Peak Response (typ) 0.65A/W (typ)
5 Power 1.5mW (min@ λp)
6 Output Voltage 0 to 10V
A TEKTRONIX TDS2012 Oscilloscope with 100MHz Bandwidth and 1GSa/s sample
rate is used for eye diagrams and constellation diagrams. Another DSO GDS-1062 of
GW Instek with 20MSa/s sampling and 60MHz bandwidth 4000 samples memory length
is used to record the samples. The MCM31/EV Digital modulation Trainer was used for
these experiments as described in Figure 4.15. The results are discussed here according to
each parameter and its impact on the Infra-red Link.
6.6 TRANSEIVER DESIGN 3 READINGS AND OBSERVATIONS
In order to observe the influence of increasing any parameter, the other parameters are
kept constant. The readings are taken for varying one of the following parameters which
are enlisted in Table 6.8.
i. Link distance
ii. Ambient light
iii. Angle of receiver towards transmitter
iv. Modulation scheme
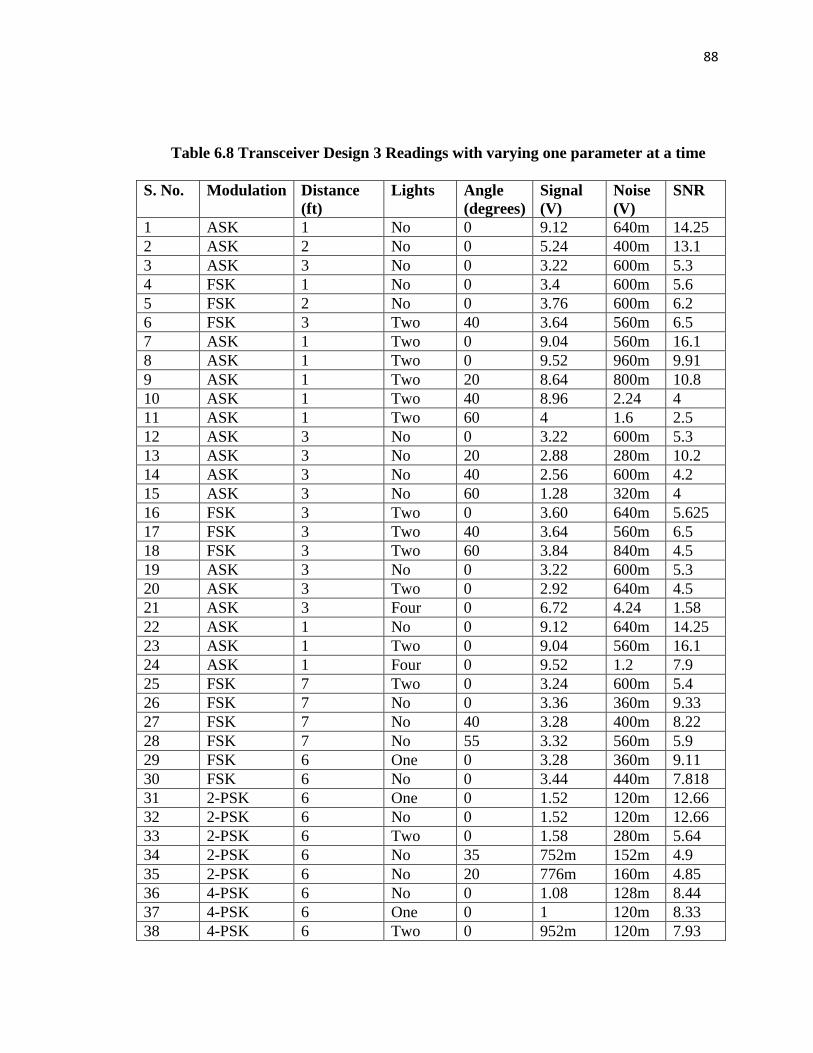
88
Table 6.8 Transceiver Design 3 Readings with varying one parameter at a time
S. No. Modulation Distance
(ft)
Lights Angle
(degrees)
Signal
(V)
Noise
(V)
SNR
1 ASK 1 No 0 9.12 640m 14.25
2 ASK 2 No 0 5.24 400m 13.1
3 ASK 3 No 0 3.22 600m 5.3
4 FSK 1 No 0 3.4 600m 5.6
5 FSK 2 No 0 3.76 600m 6.2
6 FSK 3 Two 40 3.64 560m 6.5
7 ASK 1 Two 0 9.04 560m 16.1
8 ASK 1 Two 0 9.52 960m 9.91
9 ASK 1 Two 20 8.64 800m 10.8
10 ASK 1 Two 40 8.96 2.24 4
11 ASK 1 Two 60 4 1.6 2.5
12 ASK 3 No 0 3.22 600m 5.3
13 ASK 3 No 20 2.88 280m 10.2
14 ASK 3 No 40 2.56 600m 4.2
15 ASK 3 No 60 1.28 320m 4
16 FSK 3 Two 0 3.60 640m 5.625
17 FSK 3 Two 40 3.64 560m 6.5
18 FSK 3 Two 60 3.84 840m 4.5
19 ASK 3 No 0 3.22 600m 5.3
20 ASK 3 Two 0 2.92 640m 4.5
21 ASK 3 Four 0 6.72 4.24 1.58
22 ASK 1 No 0 9.12 640m 14.25
23 ASK 1 Two 0 9.04 560m 16.1
24 ASK 1 Four 0 9.52 1.2 7.9
25 FSK 7 Two 0 3.24 600m 5.4
26 FSK 7 No 0 3.36 360m 9.33
27 FSK 7 No 40 3.28 400m 8.22
28 FSK 7 No 55 3.32 560m 5.9
29 FSK 6 One 0 3.28 360m 9.11
30 FSK 6 No 0 3.44 440m 7.818
31 2-PSK 6 One 0 1.52 120m 12.66
32 2-PSK 6 No 0 1.52 120m 12.66
33 2-PSK 6 Two 0 1.58 280m 5.64
34 2-PSK 6 No 35 752m 152m 4.9
35 2-PSK 6 No 20 776m 160m 4.85
36 4-PSK 6 No 0 1.08 128m 8.44
37 4-PSK 6 One 0 1 120m 8.33
38 4-PSK 6 Two 0 952m 120m 7.93

89
39 4-PSK 6 Two 0 1.04 272m 3.82
40 4-PSK 6 Two 10 976m 224m 4.35
41 4-PSK 6 Two 10 960m 192m 5
42 4-PSK 6 Two 10 1.09 176m 6.19
43 4-PSK 6 Two 10 1.22 392m 3.16
44 4-PSK 6 Two 10 1.37 528m 2.59
45 4-PSK 6 Two 40 808m 352m 2.29
46 4-PSK 5 No 0 3.10 200m 15.5
47 4-PSK 5 Two 0 3.12 300m 10.4
48 4-PSK 5 Three 0 1.74 600m 2.9
49 4-PSK 5 Four 0 3.40 1.38 2.4
50 4-PSK 5 No 20 1.72 520m 3.3
51 4-PSK 5 No 40 1.32 340m 3.8
52 4-PSK 5 No 60 328m 124m 2.64
6.7 DISCUSSION FOR TRANSCEIVER DESIGN 3 EXPERIMENTAL
READINGS
It is observed that although the SNR decreases with increasing distance but it is not much
affected or remains in acceptable range up to 7 feet which is our intended range for the
WBAN.
The effect of angular displacement of the receiver from Tx has shown different
characteristics in different modulation schemes. The signal degrades in general when the
receiver moves away from transmitter slowly up to 40 degrees but is much degraded
when moved from 40 to 60 degrees (keeping the distance and light condition same while
observing the effect for the same condition). It effects more in 2-PSK and 4-PSK and less
in ASK and FSK. Amongst all FSK is more tolerant up to 60 degrees and provides good
performance even at 60 degrees which other modulation schemes do not. 2-PSK and 4-
PSK give best results with the increasing distance provided less noise from light and

90
minimum angle displacement (20 to 35 degrees) compared to other modulation schemes.
From the four tested modulation schemes FSK yielded best results in tolerating noise
from light when compared through eye diagrams and SNRs.
It is observed that from the chosen parameters ambient light effects the reception the
most. The effect is quite severe for any distance, modulation scheme or angle at which
the receiver is facing the transmitter. Figure 6.8 (a) to (c) illustrates the effect through I
and Q amplitudes, eye diagram and constellation diagram. The diagrams are plotted by
exporting the data from GW INSTEK DSO to Matlab to verify the SNR, eye diagrams
and constellation results obtained from Tektronix oscilloscope.
In order to get correct eye diagrams and constellation diagrams following settings are
done in Matlab according to the specifications of the MCM31/EV trainer and GW
INSTEK DSO:
No of samples = 4000 (memory length of DSO)
Baud rate = 600 (fixed baud rate for any encoding scheme by MCM31/EV)
The readings are taken at two Sampling Frequencies by Oscilloscope:
1. 25Khz
2. 50KHZ

91
Table 6.9 Matlab required parameters calculation with 25KHZ and 50KHZ
sampling frequency for plotting eye diagram and constellation diagram.
Sampling Frequency =25Khz
Samples per symbol =41.66
Samples per symbol 41
41 samples = 1 symbol
And Total samples = 4000
4000 samples 96 symbols
Sampling Frequency =50Khz
Samples per symbol =83.3
Samples per symbol 83
83 samples = 1 symbol
And Total samples = 4000
4000 samples 48 symbols

92
Fig. 6.8 Matlab plots with 2-PSK with 2 lights ON a) I & Q amplitudes b) Eye
Diagram c) Constellation diagram

93
Fig. 6.9 Matlab plots with 2-PSK with 4 lights ON a) I & Q amplitudes b) Eye
Diagram c) Constellation diagram

94
Fig. 6.10 Constellation diagrams for 2-PSK with a) No light b) 2 lights c) 4 lights
Fig. 6.11 Eye diagrams for 2-PSK with a) No light b) 2 lights c) 4 lights
Fig. 6.12 Constellation diagrams for 4-PSK with a) No light b) 2 lights c) 4 lights
(c) (a) (b)
(c) (a) (b)
(c) (a) (b)

95
Fig. 6.13 Eye diagrams for 4-PSK with a) No light b) 2 lights c) 4 lights
Fig. 6.14 Eye diagrams for FSK with a) No light b) 2 lights c) 4 lights
Fig. 6.15: Eye diagrams for ASK with a) No light b) 2 lights c) 4 lights
Fig 6.8 to 6.15 shows the effects of switching lights ON for various modulation schemes
with the help of eye and constellation diagrams which clearly indicates the better
performance of FSK. The experimental results of increasing distance, angle deviation,
(c)
(b) (a) (c)
(a) (b)
(c) (a) (b)

96
number of lights with ASK, FSK, 2PSK and QPSK on SNR and BER are illustrated in
Fig 6.16 to 6.23.
(c)
Fig. 6.16: SNR curves for varying (a) Angle (b) Distance (c) No of Lights for ASK
14.25 13.1
5.3
0
5
10
15
1 2 3
S
N
R
Distance in feet
SNR vs Distance for ASK
5.3 4.5
1.58 0
2
4
6
No light Two lights Four Lights
S
N
R
No of Lights
SNR vs No of Lights for ASK
16.1
10.8
4 2.5
0
10
20
0 20 40 60
S
N
R
Angle in degrees
SNR vs Angle curve for ASK
(a) (b)

97
(c)
Fig. 6.17: SNR curves for varying (a) Angle (b) Distance (c) No of Lights for FSK
9.33 8.22
5.9
0
5
10
0 40 55
S
N
R
Angle in degrees
SNR vs Angle curve for FSK
9.33 9.11
6.5
0
5
10
No light one light Two Lights
S
N
R
No of Lights
SNR vs No of Lights for FSK
9.33
9.11
9.27
9
9.1
9.2
9.3
9.4
7 6 1
S
N
R
Distance in feet
SNR vs Distance for FSK
(a) (b)
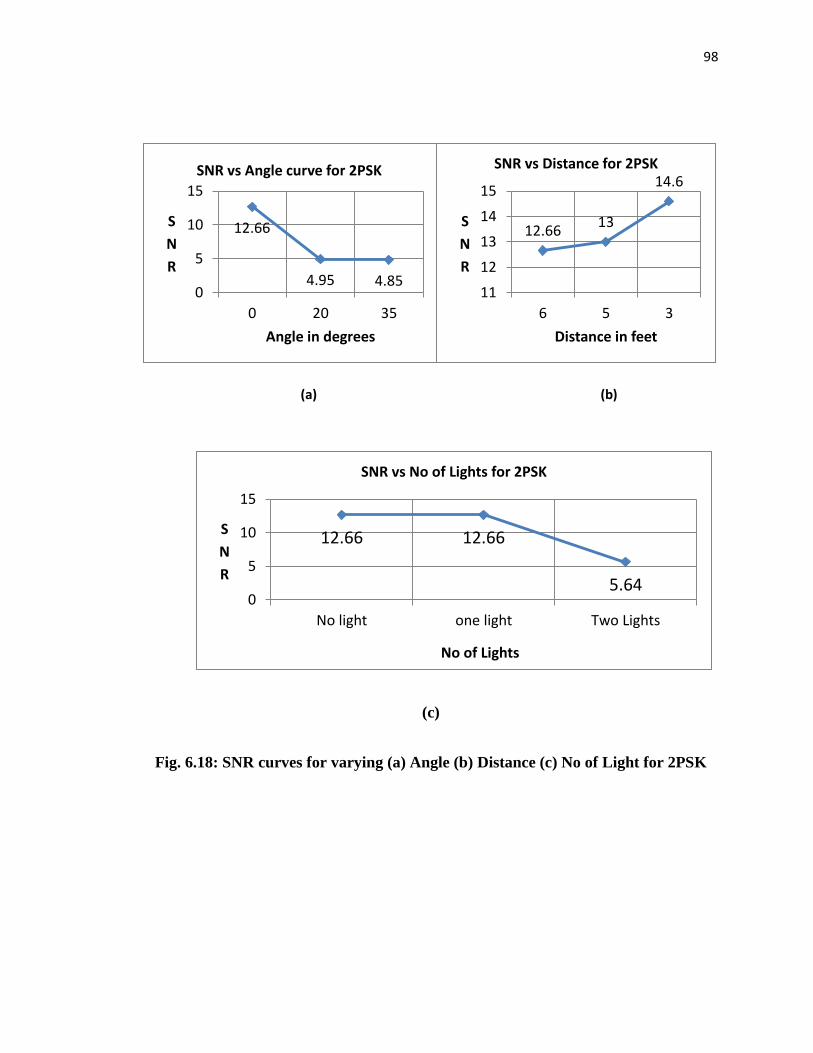
98
(c)
Fig. 6.18: SNR curves for varying (a) Angle (b) Distance (c) No of Light for 2PSK
12.66 12.66
5.64 0
5
10
15
No light one light Two Lights
S
N
R
No of Lights
SNR vs No of Lights for 2PSK
12.66
4.95 4.85 0
5
10
15
0 20 35
S
N
R
Angle in degrees
SNR vs Angle curve for 2PSK
12.66 13
14.6
11
12
13
14
15
6 5 3
S
N
R
Distance in feet
SNR vs Distance for 2PSK
(a) (b)

99
(c)
Fig. 6.19: SNR curves for varying (a) Angle (b) Distance (c) No of Light for 4PSK
8.44
15 14.3
0
5
10
15
20
6 5 3
S
N
R
Distance in feet
SNR vs Distance for 4PSK
15.5
10.4
2.9 2.4
0
5
10
15
20
No light Two light Three Lights Four
S
N
R
No of Lights
SNR vs No of Lights for 4PSK
8.44
15 14.3
0
5
10
15
20
6 5 3
S
N
R
Distance in feet
SNR vs Distance for 4PSK
(a) (b)

100
(c)
Fig. 6.20: BER vs SNR curves for varying (a) Distance (b) Angle(c) No of
Light for ASK
5 6 7 8 9 10 11 12 13 14 1510
-14
10-12
10-10
10-8
10-6
10-4
10-2
SNR
BE
R
SNR vs BER curve for ASK with Varying Distance
1 ft
3 ft
2 ft
2 4 6 8 10 12 14 16 1810
-20
10-15
10-10
10-5
100
SNR vs BER curve for ASK with Varying Angle
SNRB
ER
60 deg
40 deg
0 deg
20 deg
1.5 2 2.5 3 3.5 4 4.5 5 5.510
-3
10-2
10-1
100
SNR vs BER curve for ASK with Varying No of Lights
SNR
BE
R
Two Lights
No Light
Four Lights
(a) (b)

101
(a)
Fig. 6.21: BER vs SNR curves for varying (a) Distance (b) Angle(c) No of
Light for FSK
9.05 9.1 9.15 9.2 9.25 9.3 9.35
10-3.3
10-3.2
SNR vs BER curve for FSK with Varying Distance
SNR
BE
R
1 ft
7 ft
6 ft
5.5 6 6.5 7 7.5 8 8.5 9 9.510
-4
10-3
10-2
10-1
SNR vs BER curve for FSK with Varying Angle
SNR
BE
R
0 deg
40 deg
55 deg
6.5 7 7.5 8 8.5 9 9.510
-4
10-3
10-2
10-1SNR vs BER curve for FSK with Varying No of Lights
SNR
BE
R
No Lights
One Light
Two Lights
(b) (c)

102
(c)
Fig. 6.22: BER vs SNR curves for varying (a) Distance (b) Angle(c) No of Light for 2PSK
5 6 7 8 9 10 11 12 1310
-7
10-6
10-5
10-4
10-3
SNR vs BER curve for 2PSK with Varying No of Lights
SNR
BE
R
Two Lights
One & no Light
12.5 13 13.5 14 14.5 1510
-8
10-7
10-6SNR vs BER curve for 2PSK with Varying Distance
SNR
BE
R
6 ft
5 ft
3 ft
4 5 6 7 8 9 10 11 12 1310
-7
10-6
10-5
10-4
10-3
SNR vs BER curve for 2PSK with Varying Angle
SNRB
ER
20 deg35
deg
0 deg
(a) (b)

103
(c)
Fig. 6.23: BER vs SNR curves for varying (a) Distance (b) Angle(c) No of
Light for 4PSK
2 3 4 5 6 7 8 910
-3
10-2
10-1
SNR vs BER curve for 4PSK with Varying Angle
SNR
BE
R
40 deg
10 deg
0 deg
8 9 10 11 12 13 14 1510
-5
10-4
10-3
10-2
SNR vs BER curve for 4PSK with Varying Distance
SNR
BE
R
6 ft
5 ft
3 ft
2 4 6 8 10 12 14 1610
-5
10-4
10-3
10-2
10-1
SNR vs BER curve for 4PSK with Varying No of Lights
SNR
BE
R
Two lights
Four lights
Three lights
No light
(a) (b)

104
6.7.1 Data Rate
One important parameter for any Wireless Communication is the Data Rate which a
wireless link can support. As WBAN are low data rate applications, so simple
transceiver was used to test the data rate supported here. The MCM31/EV Trainer boards
used for the SNR calculations with respect to change in Ambient light, Distance,
Modulation scheme or Angle as discussed in the previous section could not be used to
calculate the supported the data rate due to the limitation of the fixed 600 baud and
carrier frequency that can be selected from the available frequencies which are 300Hz,
600Hz, 1.2KHz and 1.8KHz. In order to cope with this limitation and keeping the
circuitry as simple as possible, binary ASK modulation was chosen to observe the data
rate with the setup as shown in Figure 6.24.
Fig. 6.24 Test set up for Binary ASK Transceiver for Data Rate Observations
Two Function generators are used to generate carrier wave as well as Information signal
which are fed to The Balanced Modulator card T10B AM/DSB/SSB by EV. This
modulator module can modulate information signal up to 100KHz. The carrier and the

105
information signal frequencies are increased gradually and the modulated output is
observed on the oscilloscope ensuring that the output is not over modulated by adjusting
the information and carrier amplitudes. The Balanced Modulator generates the Modulated
output of the order of 600mV which cannot directly drive an LED so Amplifier is used to
drive the LED. The readings for the Tx signal are taken from Node a as shown in Figure
6.24. Also it is observed that when the frequency is increased the LED becomes dimmer
and the receiver is not able to detect the modulated wave. When the carrier frequency was
increased beyond 5MHz the LED becomes completely off or not visible. Similarly
information signal frequency also has a limit. With the increase in information signal
frequency the received signal gradually decreases in amplitude and less recognizable. The
receiver amplitude is also quite low so it is observed on Oscilloscope after amplification
as mentioned by Node b in Figure 6.24. Figure 6.25 illustrates these effects.
(a) Information Signal 50KHz & Carrier Signal 300KHz (b) Rx vs Tx signal for
50Kb/s data rate

106
(c) Information Signal 100KHz & Carrier Signal 300KHz (d) Rx vs Tx signal for
100Kb/s data rate
(e) Information Signal 100KHz & Carrier Signal 1MHz (f) Rx vs Tx signal for
100Kb/s data rate

107
(g) Information Signal 200KHz & Carrier Signal 2MHz (h) Rx vs Tx signal for
200Kb/s data rate
Fig. 6.25 (a, c, e, g) Information Vs Modulated signal-(b, d, f, h) Tx vs Rx signals at
Node a and Node b
In Figure 6.25 (b) and (e) the amplitude of the received modulated signal is of the order
of 170mV Vp-p with 300 KHz carrier this voltage is significantly reduced to 74mV Vp-p
Figure 6.25 (f) and (h) but it is still recognizable. It can be seen that there is a difference
between the amplitude of the Noise when the Receiver in ON and when it is OFF which
can serve to extract the information signal from the received modulated signal. Although
the target was to achieve data rates in MHz but due to hardware limitations, a data rate of
200Kbits/sec could be achieved. This can be improved with multiple stages of Amplifiers
or more powerful amplifiers at Tx and Rx side. One possible approach is by using
thresholding circuits at the receiver side after the amplification stage and filtering the
noise.

108
6.8 SUMMARY
In this chapter the experimental results of the selected components and transceiver
designs for the Prototype WBAN were discussed. The experimental readings and
observations made for the established Infra-red link are analyzed in this research work for
various parameters such as noise, ambient light, modulation scheme, angular
displacement of receiver from transmitter’s LOS, link distance and data rate.

109
CHAPTER 7
CONCLUSION, LIMITATIONS AND FUTURE
RECOMMENDATIONS
This chapter discusses the overall achievements of the research presented in this thesis.
The main objectives set for this research were sufficiently achieved with some limitations
that can be improved and enhanced further. The subsequent sections converse them
separately.
7.1 ACHIEVEMENTS
The main Objective of this research was to develop a prototype WBAN using infra-red
signaling and analyze its performance instead of using its counterpart i.e. Radio
Frequency WBAN which is achieved with sufficient accuracy. Its performance was
analyzed over various parameters such as distance, noise, angular displacement and
modulation schemes. The good SNR (around 20dB to 26dB) and BER values (within the
range of 0 to 1 %) for the Transceiver design 2, where as for the Transceiver design 3 the
quality of the resulting eye and constellation diagrams demonstrates the feasibility of IR
signaling for WBAN which is very less researched or experimented for this particular
application in spite of its numerous advantages like security and non-interference.
Although use of Infra-red for short range indoor applications or WPAN is found in
applications but less work has been done for this application. Infra-red Based WBAN can
particularly be useful in hospitals and airplanes or environments requiring limited access

110
and high security, as IR signals do not interfere with the signals generated from medical
equipment or aviation equipment which is the case with microwave or RF signals. The
signals are confined within the room and cannot penetrate through walls so it provides
inherent security to the data and avoidance to eavesdropping problem which fulfills one
of the requirements of the WBAN. The IR link distance tested in this research was from 5
to 7 feet which is in compliance with IEEE 802.15.6 standard for WBAN. A research
team at Worcester Polytechnic Institute Worcester, Massachusetts MA 01609, United
States has tried to establish an Optical link using least expensive components in their
thesis “VISIBLE LIGHT COMMUNICATION SYSTEMS”: (March 2015)” using white-
LEDs but they could only perform the successful transmission up to 1 foot with
transmission rate of 1.2kbps [66] . Another research work published in IEEE Photonics
Journal (Feb 2013) reports the successful transmission up to the distance of 1.65m using
white light LED with Manchester coding and have tested their transmission for 1.25Mb/s
and 2.5 Mb/s data rates, but their design uses pair of focusing lens and a medium Power
Amplifier to support the data rate in MHz range, which results in quite expensive design
[67]. Another requirement of this research was low cost and low power WBAN prototype
which is achieved by using least expensive, commercially available and low power
consuming components to build simple transceivers. So the focus was kept on using low
cost and easily available components. The research in scientific reports (2014) [68] has
used spin-nano-oscillator based wireless communication while using microwave
technology and ASK modulation (ASK modulation is used in this research as well for
testing data rate capability of the link with Transceiver design using ThorLAB PIN Rx) .

111
They have reported successful communication with 1m distance and 200kbps data rate.
In this research RF/ microwave or UWB is not used due to the reasons argued in the
previous chapters but the Data rate up to 100Kbps is achieved in this research in
Transceiver Design 3. This data rate is meeting the requirement of the application
intended i.e. for WBAN (10kbps to 100kbps as discussed in Fig 2.5 for physiological
data). The system remains SAR compatible as the LED only emits in the range of mW
plus the IR LED transmitter is not within 20cm range to damage tissue/ skin. The
modulation schemes utilized further reduce the power consumption and hence reduce the
chances of health risks.
The security requirement of WBAN is further achieved by developing a novel protocol
which includes patient and sensor identification. This protocol also provides a mechanism
to reject interference from other IR sources like remote controls for the devices using IR
protocols. The protocol not only incurs very less overhead in computation but also needs
less amount of storage as compared to the other protocols previously presented for
WBAN using RF, microwave or Ultra-wideband technologies incorporating different
encryption schemes. The existing protocols have large overhead ranging from 128 bits to
64 bytes for incorporating security. In this research the protocol is developed to provide
balance between security need and overhead. It only comprises of 32 bits for each packet
with 10 bits sensor data in it. In this research no hardware encryption was used hence the
protocol is also cost effective besides providing less computational overhead.

112
The transceiver design with the remote control receiver IC yielded better SNR and
immunity to reject ambient noise but has a fixed carrier frequency for selected protocol
(Sony, Phillips etc.) and hence limiting the maximum data rate. Its maximum allowable
angle displacement was observed to be 30 to 35 degrees. In this research this IC is
explored and utilized other than its conventional function to control appliances through
remote controls. Whereas for the transceiver built from ThorLAB PIN detector the
maximum range that was tested was 7.5 feet ( 2m) and maximum angle displacement to
be 60 degrees. This link was more sensitive to ambient light for which FSK produced the
best results in tolerating the background noise. Table 7.1 gives the comparison of various
improved parameters in this research.
Table 7.1 Summary of Research in context of specific parameters
S.No Source Ref Parameter Value improvement
1 Choi, H. S
et.al
(2014)
[66] Distance 1m 2m
Data Rate 100kbps 100kbps
Technology Microwave Infra-red
SNR 12.5dB 15dB, 20-26dB
2 Chow,C. W
et.al
(2013)
[67] Distance 1.65m 2.286m
Data Rate 1.2Mbps 200kbps
Technology VLC IR
Encoding Manchester NRZ,
Manchester,
Dibit, Tribit
Modulation None ASK,FSK,PSK
Angle LOS Tested upto 60°
Ambient
Light
Fixed Tested upto 50lux
Cost High Low
3 Ambady, S.
et.al (2015-
USA)
[68] Distance 1 foot 7.5 feet
Data rate 1.2Kbps 200kbps
4 Multiple [32- Packet size 128bits- 32 bits in total
113
47] 64bytes
5 Electronics
Wall Corp
[69] Cost of
wireless
Module
2000/Rs to
9000/Rs
<100 Rs
6 TI 4Q2014
digikey
[70] Power
consumption
Tx Current
RF (Zigbee,
LE Bluetooth)
:20mA to
40mA
IR: 20mA
Infineon
Technologies
AG(2010)
[71] Idle Tx
current
RF: < 1µA IR:0.1µA
Digi-Key
Electronics
(2008)
[72] Peak current
draw
LE =12.5mA,
ANT=17mA,
RF4CE=40mA
IrDA : 10mA
Once the data from the authentic user is received by the IR Receiver it can be accessed by
Smart phone through a user friendly Android App which can save and share the data
from within the Mobile App.
7.2 LIMITATIONS
Due to the hardware limitations and time constraints we could not get the modulators
supporting modulations in MHz. The MCM31/EV Trainer used in experiments supports
only 600 baud and the AM/DSB/SSB T10B EV module only supports modulation
frequency up to 100 KHz so the data rate up to 100Kbits/sec could be verified. The
prototype is tested only for LOS with wider beam widths and can be utilized for
developing diffuse link.

114
7.3 FUTURE RECOMMENDATIONS
This prototype can further be extended to incorporate multiple transmitters and multiple
receivers to send data of different sensors in parallel or multiplexing techniques can be
incorporated to fully utilize the available bandwidth for the optical spectrum. The system
can also be extended to use 1550nm source in order to resolve blocking, further improve
the health issues and enhance mobility. There is room for the improvement in data rate
and range enhancement. Different arrays of highly integrated transmitters and receivers
can be utilized and their suitable geometry can also yield better results.
7.4 SUMMARY
This chapter finally concludes the thesis by highlighting the achievements and novelty of
this research project. It also enumerates the limitations of the project and gives
suggestions for the future extensions for the research made in this thesis.

115
REFEERENCES
[1] Jang, C. S., Lee, D. G., & Han, J. W. (2008, December). A proposal of security framework for
wireless body area network. In Security Technology, 2008. SECTECH'08. International
Conference on (pp. 202-205). IEEE.
[2] Chakraborty, C., Gupta, B., & Ghosh, S. K. (2013). A review on telemedicine-based WBAN
framework for patient monitoring. Telemedicine and e-Health, 19(8), 619-626.
[3] Cao, H., Leung, V., Chow, C., & Chan, H. (2009). Enabling technologies for wireless body area
networks: A survey and outlook. Communications Magazine, IEEE, 47(12), 84-93.
[4] S. Arnon, (Marcel Dekker, 2003) “Optical wireless communication,” invited chapter for The
Encyclopedia of Optical Engineering (EOE).
[5] Chen, H., Wu, W., & Lee, J. (2010). A WBAN-based real-time electroencephalogram monitoring
system: design and implementation. Journal of medical systems, 34(3), 303-311.
[6] Zhao, C., Zhou, Z., & Kwak, K. (2010). Novel UWB transceiver for WBAN networks: a study on
AWGN channels. ETRI journal, 32(1), 11-21.
[7] Ken-ichi Takizawa, Takahiro Aoyagi, Huan-Bang Li, Jun-ichi Takada, Takehiko Kobayashi, and
Ryuji Kohno, (2009, June). "Path Loss and Power Delay Profile Channel Models for Wireless
Body Area Networks," 2009 IEEE International Symposium on Antennas and Propagation,
(Charleston, SC, USA).
[8] Takahiro Aoyagi, Ken-ichi Takizawa, Takehiko Kobayashi, Jun-ichi Takada, and Ryuji Kohno,
(June 2009). "Development of a WBAN Channel Model for Capsule Endoscopy", IEEE
International Symposium on Antennas and Propagation, Charleston, SC, USA.
[9] Kwak, K. S., Ameen, M. A., Kwak, D., Lee, C., & Lee, H. (2009, September). A study on
proposed IEEE 802.15 WBAN MAC protocols. In Communications and Information Technology,
2009. ISCIT 2009. 9th International Symposium on (pp. 834-840). IEEE.
[10] Wisely, D. R. (1996). A 1 Gbit/s optical wireless tracked architecture for ATM delivery.
[11] Carruthers, J. B., & Kannan, P. (2002). Iterative site-based modeling for wireless infrared
channels. Antennas and Propagation, IEEE Transactions on, 50(5), 759-765.
[12] Kahn, J. M., & Barry, J. R. (1997). Wireless infrared communications. Proceedings of the IEEE,
85(2), 265-298.
[13] Rockwell, D. A., & Mecherle, G. S. (2001, November). Wavelength selection for optical wireless
communications systems. In ITCom 2001: International Symposium on the Convergence of IT and
Communications (pp. 27-35). International Society for Optics and Photonics.
[14] Al‐Ghamdi, A. G., & Elmirghani, J. M. (2003). Multiple spot diffusing geometries for indoor
optical wireless communication systems. International Journal of Communication Systems,
16(10), 909-922.
[15] Takano, H., & Shimamoto, S. (2004). A study of optical wireless mobile communications with
movable cells employing cycle emissions. Electronics and Communications in Japan (Part I:
Communications), 87(10), 45-57.
[16] Chowdhry, N. P., Ashraf, A., Chowdhry, B. S., Baloch, A. K., Ansari, A. W., & De Meer, H.
(2010). Grid for Post Operative Care through Wireless Sensor Networks. Grid Technologies for E-
Health: Applications for Telemedicine Services and Delivery: Applications for Telemedicine
Services and Delivery, 164.
[17] Alam, M. M., & Hamida, E. B. (2014). Surveying wearable human assistive technology for life
and safety critical applications: Standards, challenges and opportunities. Sensors, 14(5), 9153-
9209.

116
[18] Taparugssanagorn, A., Pomalaza-Ráez, C., Isola, A., Tesi, R., Hämäläinen, M., & Iinatti, J. (2009,
February). UWB channel modeling for wireless body area networks in medical applications. In
Proc. international symposium on medical information and communication technology (ISMICT).
[19] Bilstrup, K. (2008). A preliminary study of wireless body area networks. Technical Report
IDE0854, School of Information Science, Computer and Electrical Engineering, Halmstad
University.
[20] Jung, J., Ha, K., Lee, J., Kim, Y., & Kim, D. (2008). Wireless body area network in a ubiquitous
healthcare system for physiological signal monitoring and health consulting. International Journal
of Signal Processing, Image Processing and Pattern Recognition, 1(1), 47-54.
[21] Otto, C., Milenkovic, A., Sanders, C., & Jovanov, E. (2006). System architecture of a wireless
body area sensor network for ubiquitous health monitoring. Journal of Mobile Multimedia, 1(4),
307-326.
[22] IEEE 802.15 Working Group for WPAN - http://www.ieee802.org/15/, last accessed on 25th
March 2011.
[23] Hanlen, L., Smith, D., Boulis, A., Gilbert, B., Chaganti, V., Craven, L. & Zhang, A. (2011).
Wireless bodyarea-networks: toward a wearable intranet. National ICT Australia.
[24] Hussain, A., & Kwak, K. S. (2009). Positioning in Wireless Body Area Network using GSM.
JDCTA, 3(3), 167-172.
[25] Wolf, M., & Kreß, D. (2003). Short-range wireless infrared transmission: the link budget
compared to RF. IEEE wireless communications, 10(2), 8-14.
[26] Daunoras, J., Lukočius, R., & Virbalis, J. A. (2015). Pulse sensor of physiological parameter
monitoring system. Elektronika ir Elektrotechnika, 78(6), 67-70.
[27] Jeffrey B. Carruthers, (2002). “Wireless Infrared Communications”, Wiley Encyclopedia of
Telecommunications.
[28] Tessel Renzenbrink, (2015, May). “Low Energy Signals Make Phones and Wearables Easy to
Track”, techthefuture.com , http://www.techthefuture.com/technology/low-energy-signals-make-
phones-and-wearables-easy- to-track/ (last accessed on 13-10-2015)
[29] A. Arya, N. Bilandi. (2014). A Review: Wireless Body Area Networks for Health
Care.International Journal of Innovative Research in Computer, Vol. 2, No. 4, pp. 3800-3806.
[30] He, D., Chan, S. C., Zhang, Y., & Yang, H. (2014). Lightweight and Confidential Data Discovery
and Dissemination for Wireless Body Area Networks. Biomedical and Health Informatics, IEEE
Journal of, 18(2), 440-448.
[31] Crosby, G. V., Ghosh, T., Murimi, R., & Chin, C. A. (2012). Wireless body area networks for
healthcare: a survey. Journal of Ad hoc, Sensor & Ubiquitous Computing (IJASUC), Vol. 3, No.3,
pp. 1-26.
[32] Al Ameen, M., Liu, J., & Kwak, K. (2012). Security and privacy issues in wireless sensor
networks for healthcare applications. Journal of medical systems, 36(1), 93-101.
[33] Ullah, S., Imran, M., & Alnuem, M. (2014). A hybrid and secure priority-guaranteed MAC
protocol for wireless body area network. International Journal of Distributed Sensor Networks,
2014.
[34] Dimitriou, T., & Ioannis, K. (2008, October). Security issues in biomedical wireless sensor
networks. In Applied Sciences on Biomedical and Communication Technologies, 2008.
ISABEL'08. First International Symposium on (pp. 1-5). IEEE.
[35] Ramli, S. N., & Ahm, R. (2011, December). Surveying the wireless body area network in the
realm of wireless communication. In Information Assurance and Security (IAS), 2011 7th
International Conference on (pp. 58-61). IEEE.
[36] I. A. AL-Rassan, N. Khan. (2011). Secure & Energy Efficient key Management Scheme for
WBAN– A Hybrid Approach. International Journal of Computer Science and Network Security,
Vol. 11, No. 6, pp. 169-172.

117
[37] Qadri, S. F., Awan, S. A., Amjad, M., Anwar, M., & Shehzad, S. (2013). Applications,
challenges, security of wireless body area networks (WBANS) and functionality of IEEE
802.15.4/ZIGBEE. Sci. Int, Lahore.
[38] Kanjee, M. R., & Liu, H. (2013, September). A generic authentication protocol for wireless body
area networks. In Proceedings of the 8th International Conference on Body Area Networks (pp.
502-508). ICST (Institute for Computer Sciences, Social-Informatics and Telecommunications
Engineering).
[39] Barakah, D. M., & Ammad-uddin, M. (2012, February). A survey of challenges and applications
of wireless body area network (WBAN) and role of a virtual doctor server in existing architecture.
In Intelligent Systems, Modelling and Simulation (ISMS), 2012 Third International Conference on
(pp. 214-219). IEEE.
[40] Kumar, R., & Mukesh, R. (2013). State Of The Art: Security In Wireless Body Area Networks.
International Journal of Computer Science & Engineering Technology (IJCSET) Vol, 4, 622-630.
[41] E. Davies, et al. (2014). A Survey On Wireless Body Area Network. International Journal of
Scientific and Research Publications, Vol. 4, No. 3.
[42] Javali, C., Revadigar, G., Libman, L., & Jha, S. (2014). SeAK: Secure Authentication and Key
Generation Protocol Based on Dual Antennas for Wireless Body Area Networks. In Radio
Frequency Identification: Security and Privacy Issues (pp. 74-89). Springer International
Publishing.
[43] Wu, X. (2014). A Lightweight Trust-based Access Control Model in Cloud-Assisted Wireless
Body Area Networks. International Journal of Security and Its Applications, 8(5), 131-138.
[44] Mana, M., Feham, M., & Bensaber, B. A. (2009). SEKEBAN (secure and efficient key exchange
for wireless body area network). International Journal of Advanced Science and Technology, 12,
45-60.
[45] Saleem, S., Ullah, S., & Kwak, K. S. (2011). A study of IEEE 802.15. 4 security framework for
wireless body area networks. Sensors, 11(2), 1383-1395.
[46] Alavikia, Z., Khadivi, P., & Hashemi, M. R. (2012). A Model for QoS–Aware Wireless
Communication in Hospitals. Journal of medical signals and sensors, 2(1), 1.
[47] Mohammad Ali Khalighi, and Murat Uysal, (2014). Survey on Free Space Optical
Communication: A Communication Theory Perspective, IEEE COMMUNICATION SURVEYS
& TUTORIALS, VOL. 16, NO. 4, FOURTH QUARTER 2014, pp 2231-2258.
[48] Karunatilaka, D., Zafar, F., Kalavally, V., & Parthiban, R. (2015). LED Based Indoor Visible
Light Communications: State of the Art. DOI 10.1109/COMST.2015.2417576, IEEE
Communications Surveys & Tutorials.
[49] O’Brien, D. C., Katz, M., Wang, P., Kalliojarvi, K., Arnon, S., Matsumoto, M. & Jivkova, S.
(2005). Short-range optical wireless communications. In Wireless world research forum (pp. 1-
22).
[50] https://www.ieee.org/.../wireless_body_area_networks_healthcare_yu.pdf (last accessed on 13-10-
2015)
[51] Sukhraj Kaur, Rachita and Dr. Jyoteesh Malhotra, (2014). Error Rate Performance of Binary
Modulation through Wireless Body Area Networks, International Journal of Advanced Science
and Technology Vol.72, pp.31-36, http://dx.doi.org/10.14257/ijast.2014.72.03
[52] Patil, S. R., & Raskar, V. B. (2015). Analysis and Simulation of Relay Assisted Pulse Position
Modulation Scheme using UWB System. International Journal of Engineering Research and
General Science Volume 3, Issue 3, May-June, 2015, ISSN 2091-2730, pp 170-180.
[53] M. S. Saha, D. D. K. Anvekar. (2014). State of The Art in WBAN Security & Open Research
Issues. International Journal on Recent and Innovation Trends in Computing and Communication,
Vol. 2, No. 7, pp. 1958 – 1964.

118
[54] SB-Projects: IR Remote Control, Sony SIRC Protocol,
http://www.sbprojects.com/knowledge/ir/sirc.php (last accessed on 13-102-2015).
[55] Attiya Baqai, et al. (2014). Design, Development and Implementation of the IR Signaling
Techniques for Monitoring Ambient and Body Temperature in WBANs. MUET Research J. of
Eng & Tech. (MURJ), vol. 33, no. 3, pp. 365-371.
[56] www.cooking-hacks.com (last accessed on 13-10-2015).
[57] www.mathworks.com/mobile/ (last accessed on 13-10-2015).
[58] www.b4x.com/b4a.html (last accessed on 13-10-2015)
[59] Jutzi, M., Berroth, M., Wöhl, G., Parry, C., Oehme, M., Bauer, M. & Kasper, E. (2004). SiGe PIN
photodetector for infrared optical fiber links operating at 1.25 Gbit/s. Applied surface science,
224(1), 170-174.
[60] Hale, P. D., Jargon, J., Wang, C. J., Grossman, B., Claudius, M., Torres, J. L. & Williams, D. F.
(2012). A statistical study of de-embedding applied to eye diagram analysis. Instrumentation and
Measurement, IEEE Transactions on, 61(2), 475-488.
[61] Krehlik, P., ŚLIWCZYŃSKI, Ł., & Sikorski, G. (2010). Precise Measurements of Highly
Attenuated Optical Eye Diagrams. Advances in Electronics and Telecommunications, 1(2), 67-69.
[62] Understanding Data Eye Diagram Methodology for Analyzing High Speed Digital Signals.
http://onsemi.com (last accessed on 13-10-2015)
[63] Eye Diagram Measurements in Advanced Design System, by Agilent EEsof EDA.
www.agilent.com/find/eesof (last accessed on 13-10-2015)
[64] Anatomy of an Eye Diagram. http://www.tektronix.com (last accessed on 13-10-2015)
[65] TEACHER/STUDENT Handbook for Digital Modulations mod.MCM31/EV Volume 1/2.
[66] Ambady, S. (2015). “Visible Light Communication” (Thesis, Worcester Polytechnic Institute,
USA).
[67] Chow, C. W., Yeh, C. H., Liu, Y. F., & Huang, P. Y. (2013). Mitigation of optical background
noise in light-emitting diode (LED) optical wireless communication systems. Photonics Journal,
IEEE, 5(1), 7900307-7900307.
[68] Choi, H. S., Kang, S. Y., Cho, S. J., Oh, I. Y., Shin, M., Park, H., & Park, C. S. (2014). Spin nano-
oscillator-based wireless communication. Scientific reports, 4.
[69] Electronics Wall Corporation. http://www.ewallpk.com/ ((last accessed on 02-11-2015)
[70] “ Wireless Connectivity” , Texas Instruments 4Q 2014. www.ti.com/wirelessconnectivity (last
accessed on 02-11-2015)
[71] Gotschlich, M. (2010). Remote Controls–Radio Frequency or Infrared.Whitepaper, Infineon
Technologies AG.
[72] Smith, P. (2011). Comparing low-power wireless technologies. Tech Zone, Digikey Online
Magazine, Digi-Key Corporation, 701.