inglewood blvd traffic redesign cee181
TRANSCRIPT
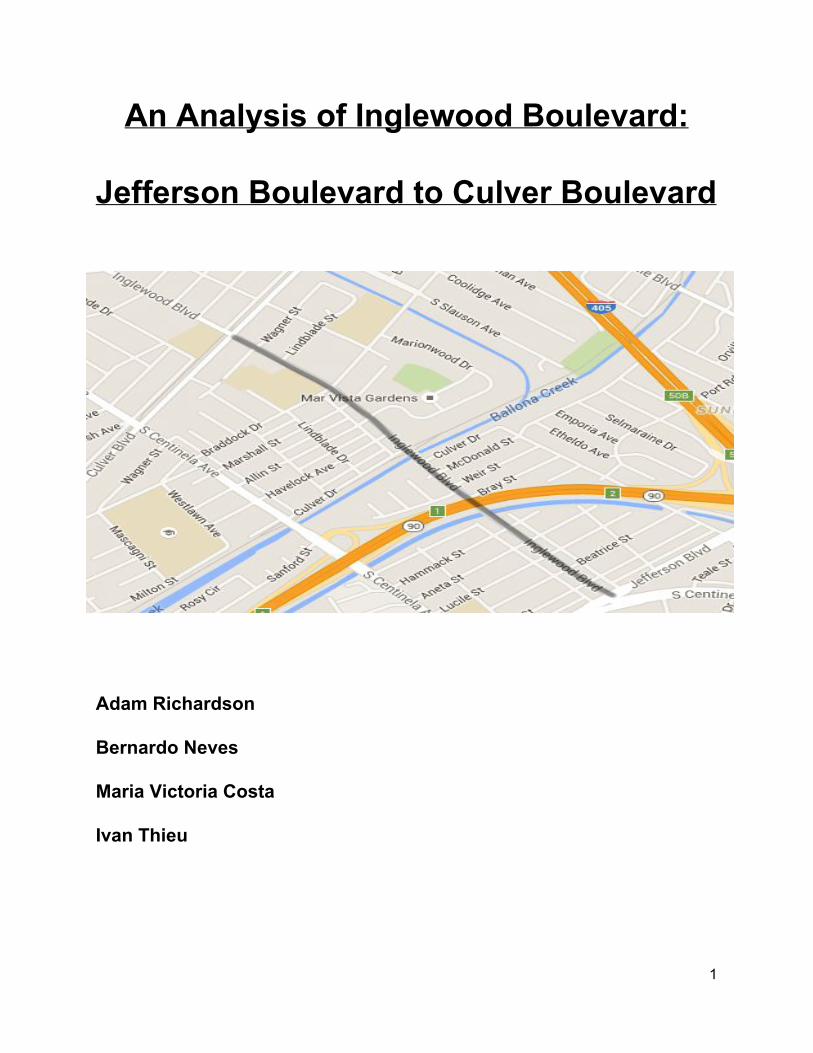
An Analysis of Inglewood Boulevard:
Jefferson Boulevard to Culver Boulevard
Adam Richardson Bernardo Neves Maria Victoria Costa Ivan Thieu
1
Table of Contents
Executive Summary: 3
Introduction/ Objective of Study: 4
Background/ Existing Conditions: 4
Intersection Characterizations: 5
Amber Times, Red Clearance Times, and Pedestrian Clearance Times: 10
Inglewood Blvd Street Classification: 11
Current and Projected Intersection LOS: 12
Current Traffic Signal Coordination (Time Space) Diagram: 13
Pedestrians and Accidents: 15
Free Flow Speed Diagrams and Arterial Level of Service: 16
AM Peak Hour Speed and Delay Analysis: 16
PM Peak Hour Speed and Delay Analysis: 17
Identified Problems and Deficiencies: 19
Summary of Analysis: 21
Solving Traffic Signal Coordination: 21
Solving Lack of Left Turn Lanes: 23
Improving Inglewood/Culver Blvd Intersection Projected LOS: 24
Solving Local Concerns: 25
Conclusions/ Recommendations: 27
Corridor Solution 1: 27
Corridor Solution 2: 27
References: 28
Appendix: 29
2
Executive Summary
Inglewood Boulevard from Jefferson Boulevard to Culver Boulevard is a heavily traveled roadway that is used by many as a shortdistance alternative to the 405 freeway, to connect different parts of the coastal Los Angeles, and as a thoroughfare for the surrounding community. As such, it is important to optimize its flow in a safe and sustainable manner to handle the ever increasing demands placed on it by the ever increasing number of vehicles that traverse it each day. This report is intended to analyze the current transportation issues present in the system and to develop solutions for the future while accounting for the expected growth of the city.
Inglewood Boulevard is a minor urban arterial street, and generally operates at arterial Level of Service (LOS) B or C during the the peak AM and PM hours. The average delay is between 53168 seconds for both ways during the AM and PM peak hours. The current intersection LOS is better than C for all intersections in the AM and PM except Inglewood/Culver in the AM and Inglewood/Braddock in the PM, during which both experience a LOS D. There are not a significant number of accidents at any intersection or street section to indicate any problems, and the number of pedestrians is well below the design thresholds. The expected growth rate for the area is 1% every year for the next five years, except for the intersection of Inglewood/Jefferson. There, the southbound right turns and eastbound left turns are expected to increase 200% by the end of the next five years.
The problems that have been identified are as follows: a significant decrease in the LOS for the Inglewood/Culver intersection in the next 5 years to unacceptable levels (LOS E); a lack of left turn lanes for the majority of the corridor; a rather narrow signal bandwidth efficiency; and a few concerns from the local community regarding speeding, a lack of safe crosswalks, and the number of oversized vehicles parked under the CA90 freeway.
The two main solutions take aim at improving the corridor in general. The first solution takes aim at improving the signal bandwidth efficiency, by changing the offset of the Braddock Drive signal to 19 seconds during the AM peak hours. This raises the northbound bandwidth efficiency to 53%, without affecting the southbound bandwidth. This is expected to significantly reduce the congestion, because the northbound traffic is the main direction of travel in the AM peak. The second solution aims at improving the LOS of the Inglewood/Culver intersection. It accomplishes this by cutting twenty feet out of the side median on Culver Blvd that lies to the north of the street, and putting in one additional ten foot lane in each direction (East/West). This is calculated to bring the 2020 LOS up to C.
The recommendations for each of the other issues are: install speed humps and/or increase signage and enforcement to reduce speeding; install “No Oversize Vehicle Parking” signs under the CA90 freeway and enforce regularly to remove that nuisance; investigate cutting 35 feet into the rightofway on each side of the road to free up enough space for dedicated center left turn lanes; and install “Rectangular Rapid Flash LED Beacons” and other warning signals at crosswalks to increase their visibility and safety.
3
Introduction and Objectives
The city of Los Angeles is one of the most populated cities in the world making it a city that requires efficient and effective traffic control. In our study, we focused on the Inglewood Blvd street corridor which runs from Jefferson Blvd to Culver Blvd. This corridor was chosen because of the large amount of traffic it faces each day as people try to get to work and drop their children off at the nearby school. According to the Los Angeles Department of Transportation (LADOT), as shown in Figure I of the appendix, this corridor experiences an average daily traffic of over 10,000 vehicles each day, making it an effective candidate for improvement.
Our study was conducted with the intent of optimizing the traffic flow along Inglewood Blvd from Jefferson Blvd to Culver Blvd which spans a distance of around 5600 ft. In addition, a few concerns of the local residents needed to be addressed in the proposed corridor solution. These concerns were aimed at three main areas: the lack of safe crosswalks, the high rate of vehicles exceeding the speed limit, and the numerous RV and mobile homes that parked for extended periods of time underneath the CA90 overpass. Furthermore, there is also a new development in nearby Playa Vista, which is expected to put additional strain on the existing roads. Specifically, eastbound left turns from Jefferson Blvd onto Inglewood Blvd and southbound right turns from Inglewood Blvd onto Jefferson Blvd are estimated to increase by 200% in a five year time frame. In addition, there is an expected background growth of 1% per year for the next five years due to an increasing number of people moving to Los Angeles that will be factored into the calculations for the design.
Using data from the current traffic conditions, we create an analysis aimed to not only address the concerns of local residents, but also to improve the road conditions so that it can efficiently and effectively handle the additional volumes by 2020.
Background and Existing Conditions
Inglewood Blvd is an arterial consisting of mainly two through lanes in each
direction. In those two lanes, the left and right turns are also shared, with exceptions on Jefferson Blvd and Culver Blvd which contain additional through lanes and separate left turn lanes. The existing background conditions are based on data provided by the Los Angeles Department of Transportation (LADOT), by field observations conducted by the students of UCLA, and information given by our professors. The LADOT provided traffic collision reports, traffic control reports, signal plans and timing charts. Our classmates and team members collected and provided the traffic flow data during AM and PM peak hours at Inglewood intersections, and also the corridor floating car surveys used in the travel time diagrams. Our professors provided us with the time space diagram and information regarding the commonly accepted design principles.
4
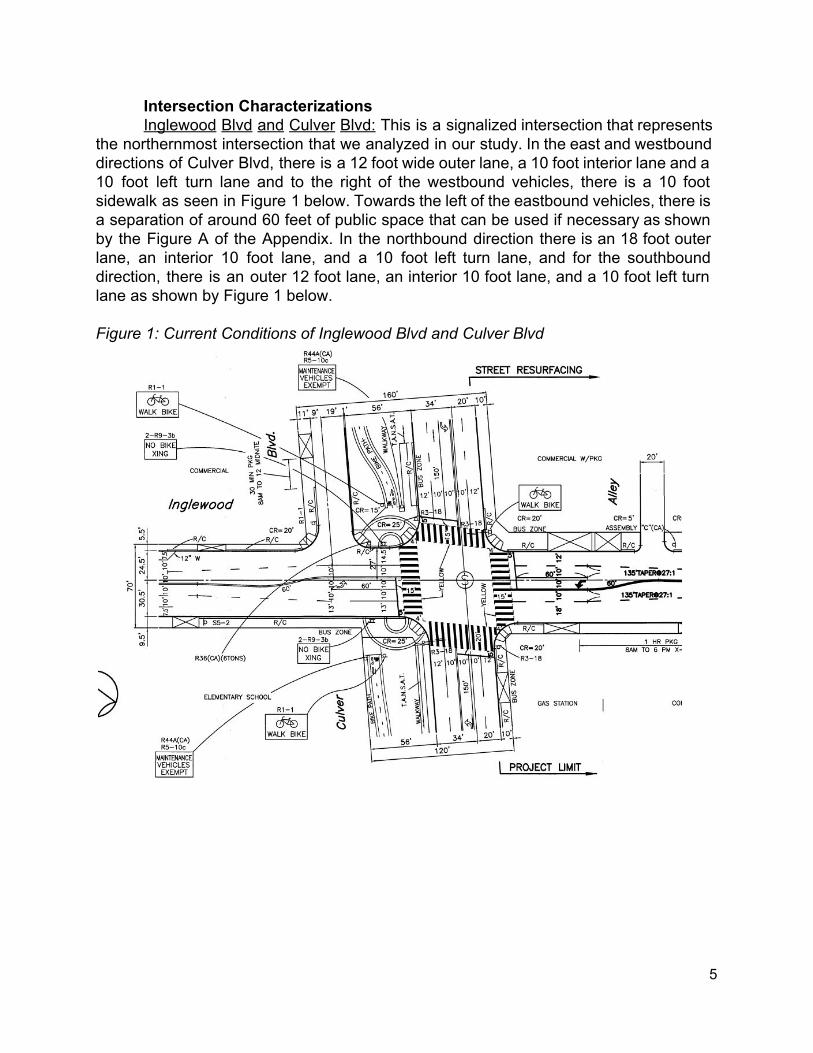
Intersection Characterizations Inglewood Blvd and Culver Blvd: This is a signalized intersection that represents
the northernmost intersection that we analyzed in our study. In the east and westbound directions of Culver Blvd, there is a 12 foot wide outer lane, a 10 foot interior lane and a 10 foot left turn lane and to the right of the westbound vehicles, there is a 10 foot sidewalk as seen in Figure 1 below. Towards the left of the eastbound vehicles, there is a separation of around 60 feet of public space that can be used if necessary as shown by the Figure A of the Appendix. In the northbound direction there is an 18 foot outer lane, an interior 10 foot lane, and a 10 foot left turn lane, and for the southbound direction, there is an outer 12 foot lane, an interior 10 foot lane, and a 10 foot left turn lane as shown by Figure 1 below.
Figure 1: Current Conditions of Inglewood Blvd and Culver Blvd
5
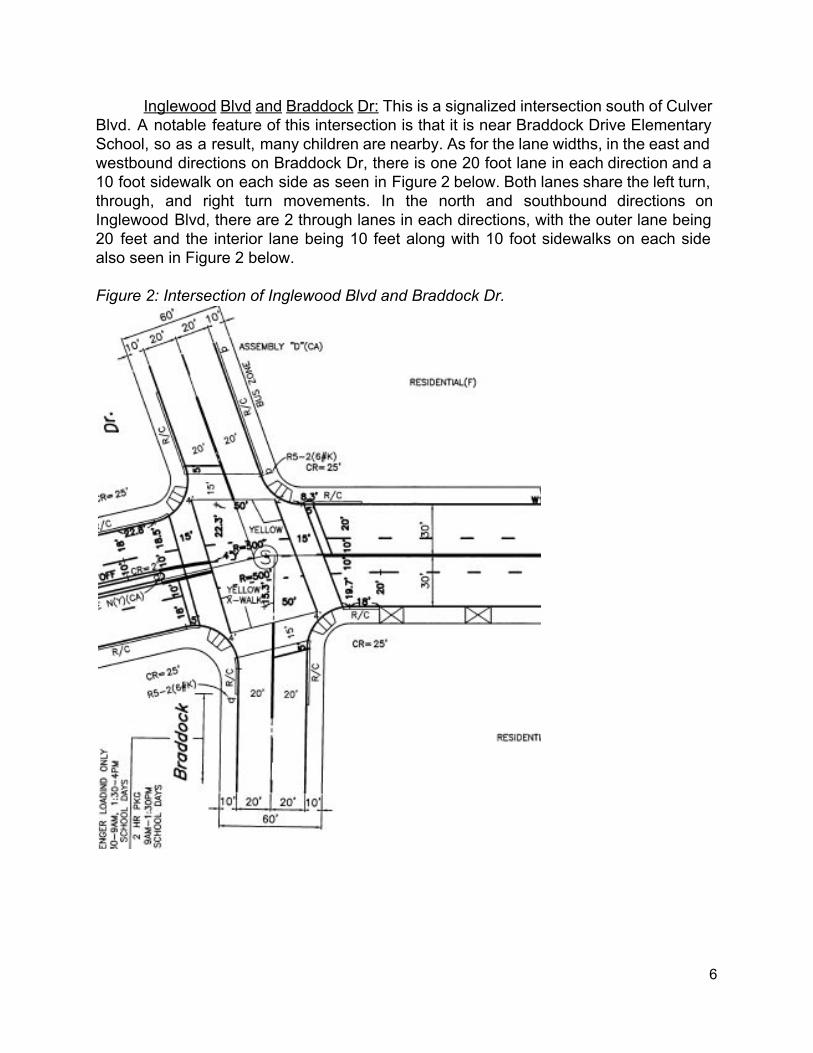
Inglewood Blvd and Braddock Dr:This is a signalized intersection south of Culver Blvd. A notable feature of this intersection is that it is near Braddock Drive Elementary School, so as a result, many children are nearby. As for the lane widths, in the east and westbound directions on Braddock Dr, there is one 20 foot lane in each direction and a 10 foot sidewalk on each side as seen in Figure 2 below. Both lanes share the left turn, through, and right turn movements. In the north and southbound directions on Inglewood Blvd, there are 2 through lanes in each directions, with the outer lane being 20 feet and the interior lane being 10 feet along with 10 foot sidewalks on each side also seen in Figure 2 below.
Figure 2: Intersection of Inglewood Blvd and Braddock Dr.
6
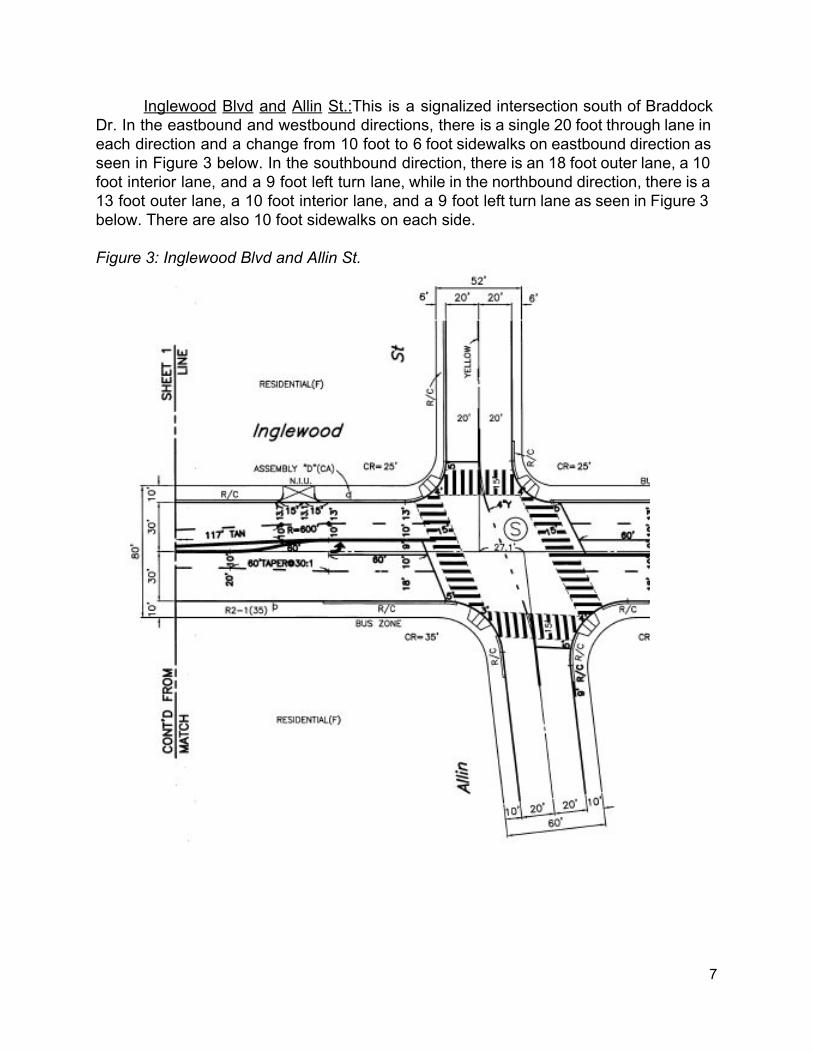
Inglewood Blvd and Allin St.:This is a signalized intersection south of Braddock Dr. In the eastbound and westbound directions, there is a single 20 foot through lane in each direction and a change from 10 foot to 6 foot sidewalks on eastbound direction as seen in Figure 3 below. In the southbound direction, there is an 18 foot outer lane, a 10 foot interior lane, and a 9 foot left turn lane, while in the northbound direction, there is a 13 foot outer lane, a 10 foot interior lane, and a 9 foot left turn lane as seen in Figure 3 below. There are also 10 foot sidewalks on each side.
Figure 3: Inglewood Blvd and Allin St.
7
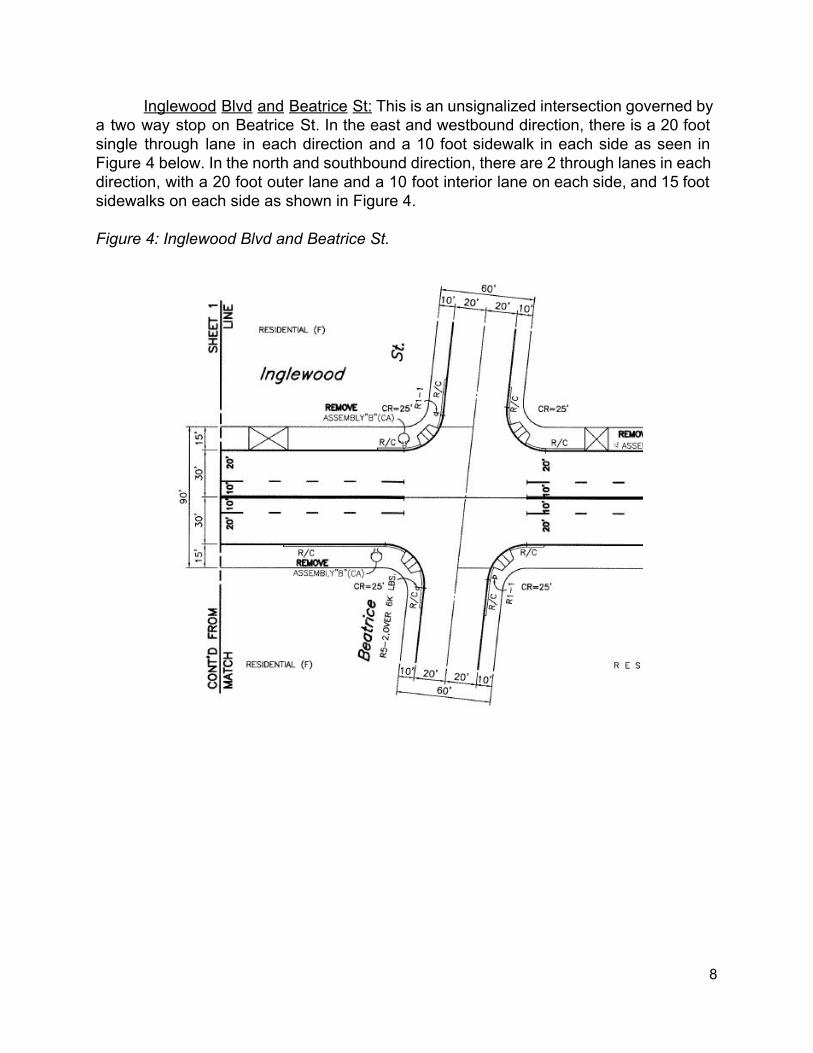
Inglewood Blvd and Beatrice St:This is an unsignalized intersection governed by a two way stop on Beatrice St. In the east and westbound direction, there is a 20 foot single through lane in each direction and a 10 foot sidewalk in each side as seen in Figure 4 below. In the north and southbound direction, there are 2 through lanes in each direction, with a 20 foot outer lane and a 10 foot interior lane on each side, and 15 foot sidewalks on each side as shown in Figure 4.
Figure 4: Inglewood Blvd and Beatrice St.
8
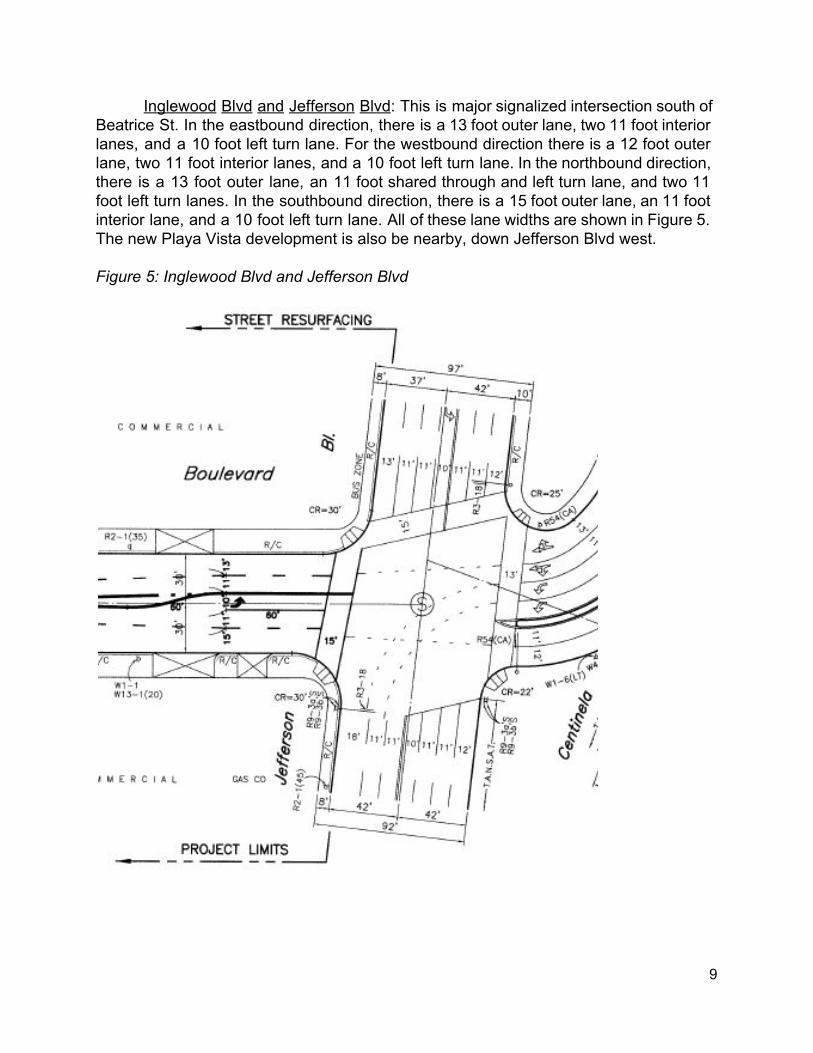
Inglewood Blvd and Jefferson Blvd: This is major signalized intersection south of Beatrice St. In the eastbound direction, there is a 13 foot outer lane, two 11 foot interior lanes, and a 10 foot left turn lane. For the westbound direction there is a 12 foot outer lane, two 11 foot interior lanes, and a 10 foot left turn lane. In the northbound direction, there is a 13 foot outer lane, an 11 foot shared through and left turn lane, and two 11 foot left turn lanes. In the southbound direction, there is a 15 foot outer lane, an 11 foot interior lane, and a 10 foot left turn lane. All of these lane widths are shown in Figure 5. The new Playa Vista development is also be nearby, down Jefferson Blvd west.
Figure 5: Inglewood Blvd and Jefferson Blvd
9
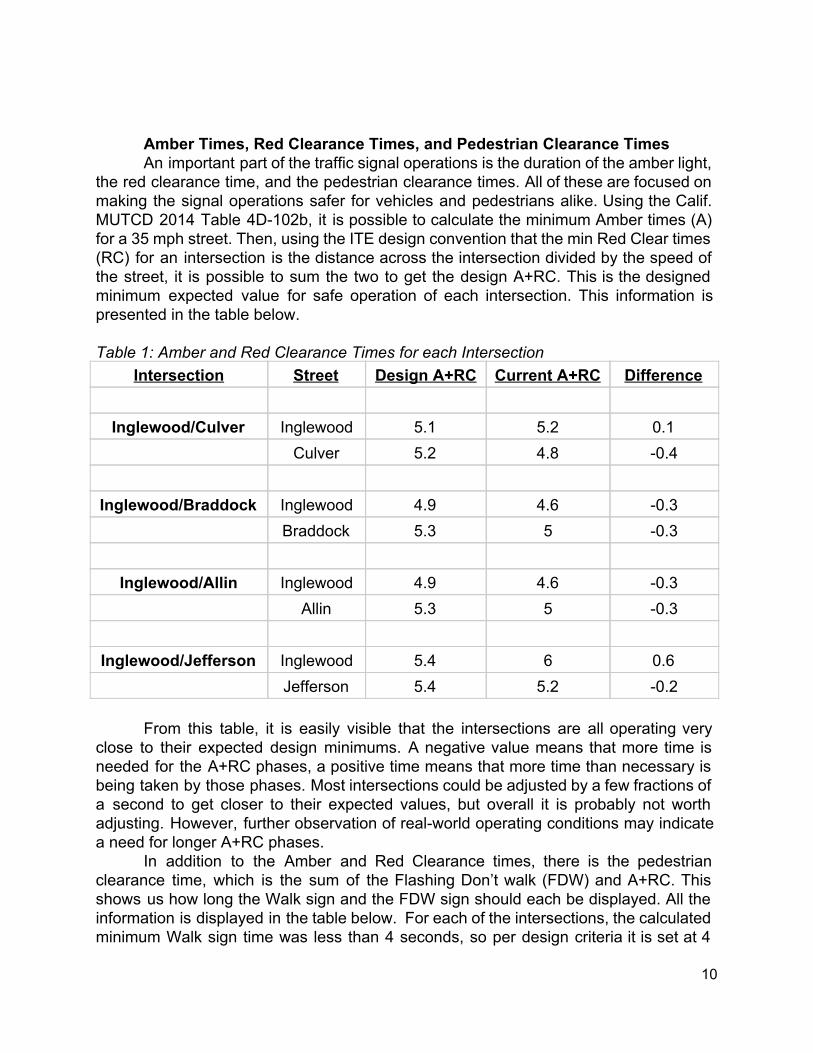
Amber Times, Red Clearance Times, and Pedestrian Clearance Times An important part of the traffic signal operations is the duration of the amber light,
the red clearance time, and the pedestrian clearance times. All of these are focused on making the signal operations safer for vehicles and pedestrians alike. Using the Calif. MUTCD 2014 Table 4D102b, it is possible to calculate the minimum Amber times (A) for a 35 mph street. Then, using the ITE design convention that the min Red Clear times (RC) for an intersection is the distance across the intersection divided by the speed of the street, it is possible to sum the two to get the design A+RC. This is the designed minimum expected value for safe operation of each intersection. This information is presented in the table below. Table 1: Amber and Red Clearance Times for each Intersection
Intersection Street Design A+RC Current A+RC Difference Inglewood/Culver Inglewood 5.1 5.2 0.1
Culver 5.2 4.8 0.4 Inglewood/Braddock Inglewood 4.9 4.6 0.3 Braddock 5.3 5 0.3
Inglewood/Allin Inglewood 4.9 4.6 0.3 Allin 5.3 5 0.3 Inglewood/Jefferson Inglewood 5.4 6 0.6 Jefferson 5.4 5.2 0.2
From this table, it is easily visible that the intersections are all operating very close to their expected design minimums. A negative value means that more time is needed for the A+RC phases, a positive time means that more time than necessary is being taken by those phases. Most intersections could be adjusted by a few fractions of a second to get closer to their expected values, but overall it is probably not worth adjusting. However, further observation of realworld operating conditions may indicate a need for longer A+RC phases.
In addition to the Amber and Red Clearance times, there is the pedestrian clearance time, which is the sum of the Flashing Don’t walk (FDW) and A+RC. This shows us how long the Walk sign and the FDW sign should each be displayed. All the information is displayed in the table below. For each of the intersections, the calculated minimum Walk sign time was less than 4 seconds, so per design criteria it is set at 4
10
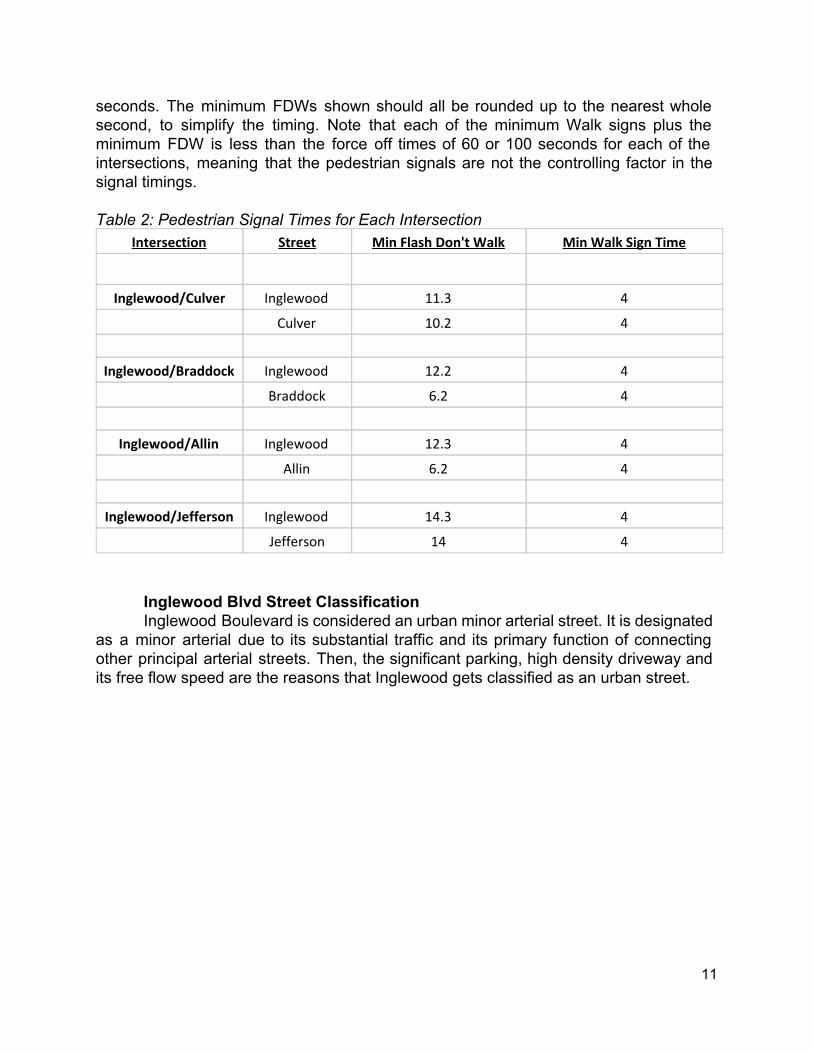
seconds. The minimum FDWs shown should all be rounded up to the nearest whole second, to simplify the timing. Note that each of the minimum Walk signs plus the minimum FDW is less than the force off times of 60 or 100 seconds for each of the intersections, meaning that the pedestrian signals are not the controlling factor in the signal timings.
Table 2: Pedestrian Signal Times for Each Intersection
Intersection Street Min Flash Don't Walk Min Walk Sign Time
Inglewood/Culver Inglewood 11.3 4
Culver 10.2 4
Inglewood/Braddock Inglewood 12.2 4
Braddock 6.2 4
Inglewood/Allin Inglewood 12.3 4
Allin 6.2 4
Inglewood/Jefferson Inglewood 14.3 4
Jefferson 14 4
Inglewood Blvd Street Classification Inglewood Boulevard is considered an urban minor arterial street. It is designated
as a minor arterial due to its substantial traffic and its primary function of connecting other principal arterial streets. Then, the significant parking, high density driveway and its free flow speed are the reasons that Inglewood gets classified as an urban street.
11
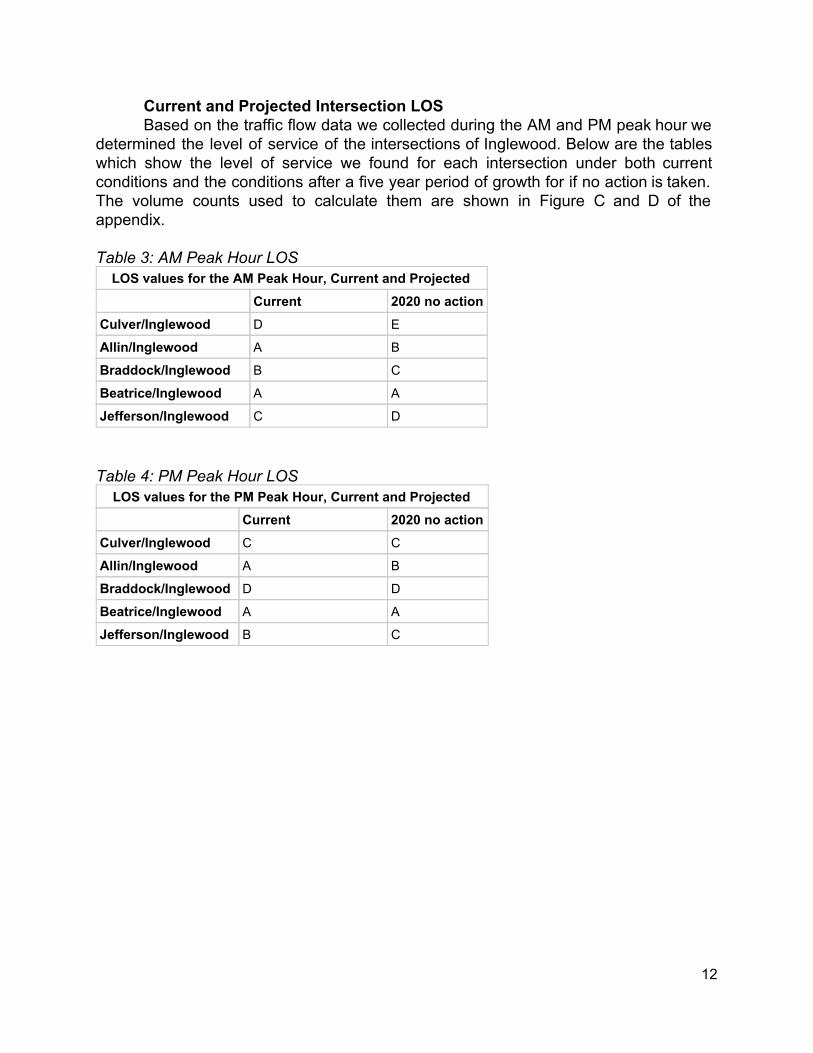
Current and Projected Intersection LOS Based on the traffic flow data we collected during the AM and PM peak hour we
determined the level of service of the intersections of Inglewood. Below are the tables which show the level of service we found for each intersection under both current conditions and the conditions after a five year period of growth for if no action is taken. The volume counts used to calculate them are shown in Figure C and D of the appendix. Table 3: AM Peak Hour LOS
LOS values for the AM Peak Hour, Current and Projected Current 2020 no action Culver/Inglewood D E
Allin/Inglewood A B
Braddock/Inglewood B C
Beatrice/Inglewood A A
Jefferson/Inglewood C D
Table 4: PM Peak Hour LOS LOS values for the PM Peak Hour, Current and Projected
Current 2020 no action Culver/Inglewood C C
Allin/Inglewood A B
Braddock/Inglewood D D
Beatrice/Inglewood A A
Jefferson/Inglewood B C
12
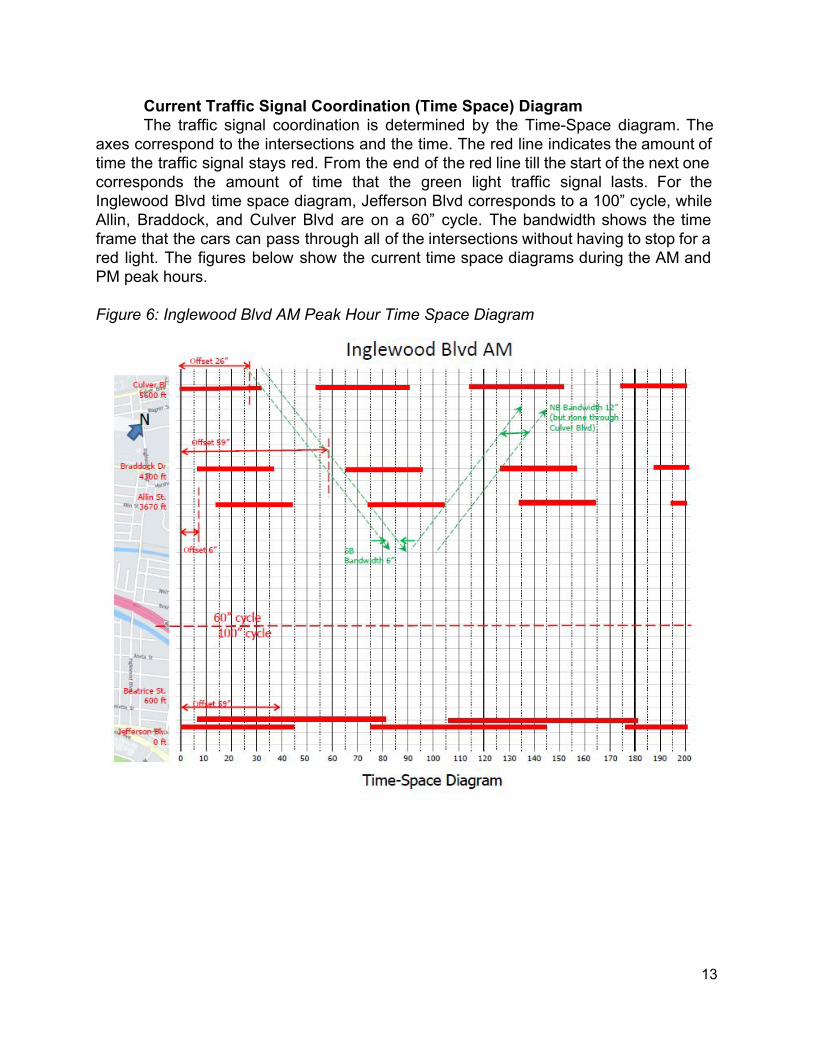
Current Traffic Signal Coordination (Time Space) Diagram The traffic signal coordination is determined by the TimeSpace diagram. The
axes correspond to the intersections and the time. The red line indicates the amount of time the traffic signal stays red. From the end of the red line till the start of the next one corresponds the amount of time that the green light traffic signal lasts. For the Inglewood Blvd time space diagram, Jefferson Blvd corresponds to a 100” cycle, while Allin, Braddock, and Culver Blvd are on a 60” cycle. The bandwidth shows the time frame that the cars can pass through all of the intersections without having to stop for a red light. The figures below show the current time space diagrams during the AM and PM peak hours. Figure 6: Inglewood Blvd AM Peak Hour Time Space Diagram
13
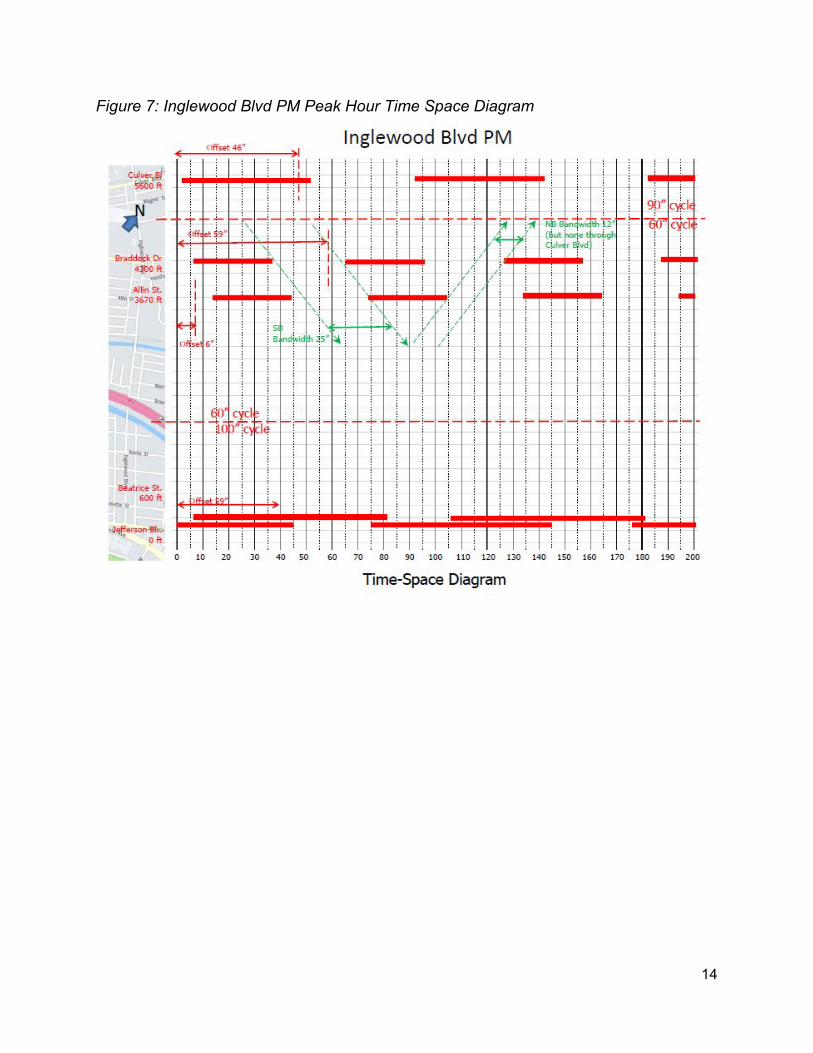
Figure 7: Inglewood Blvd PM Peak Hour Time Space Diagram
14
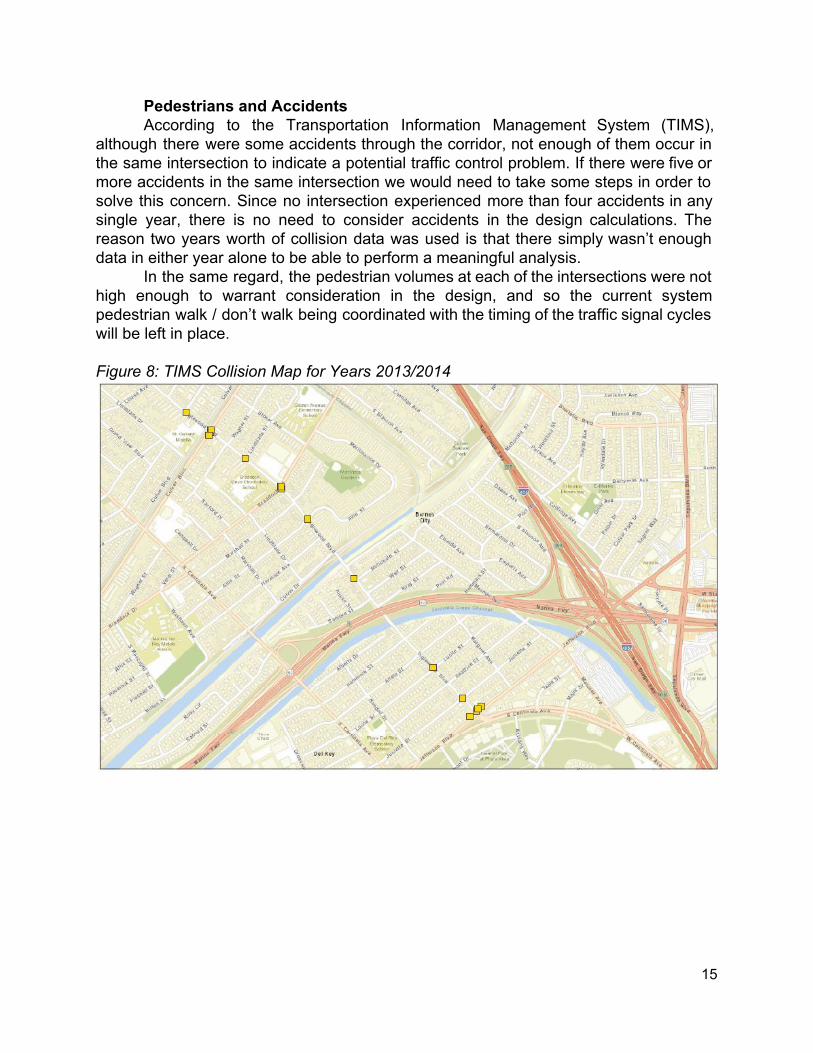
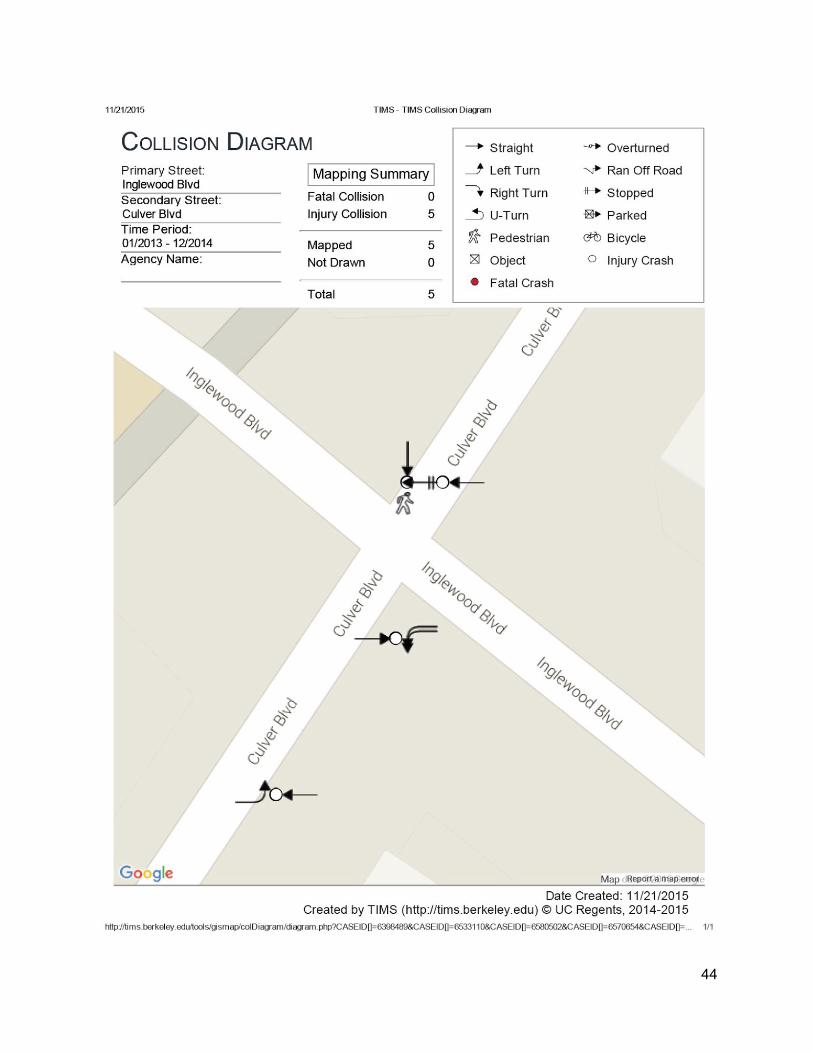
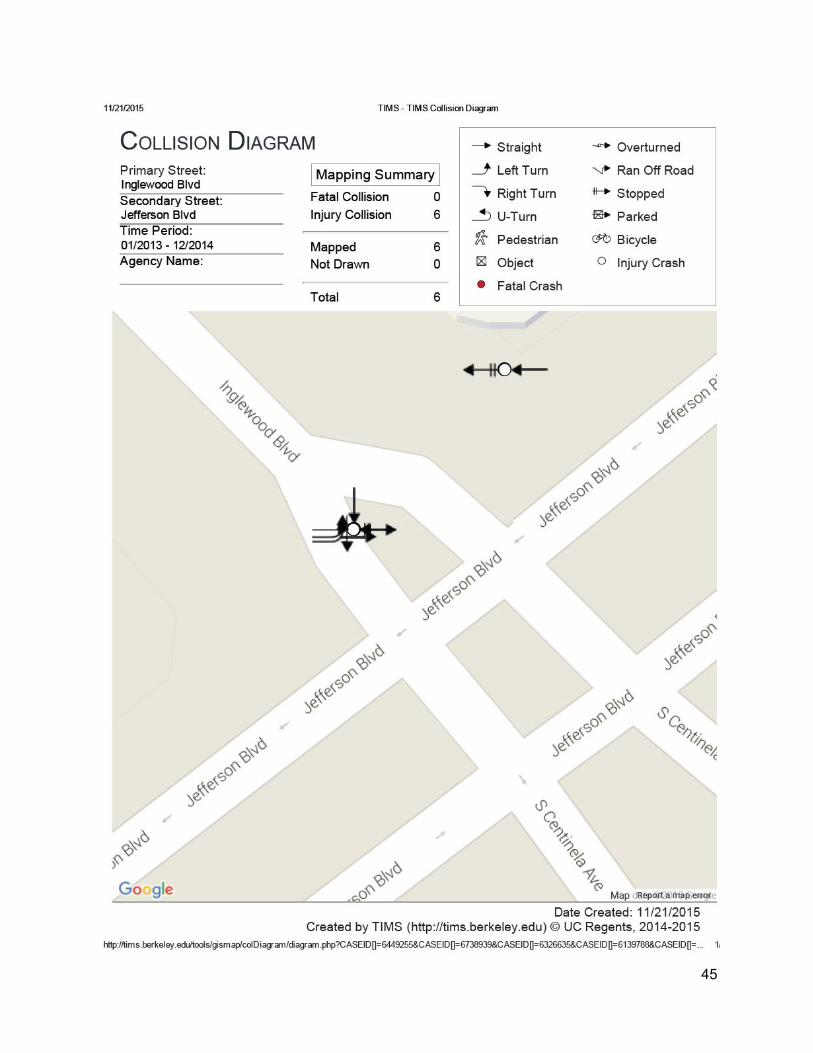
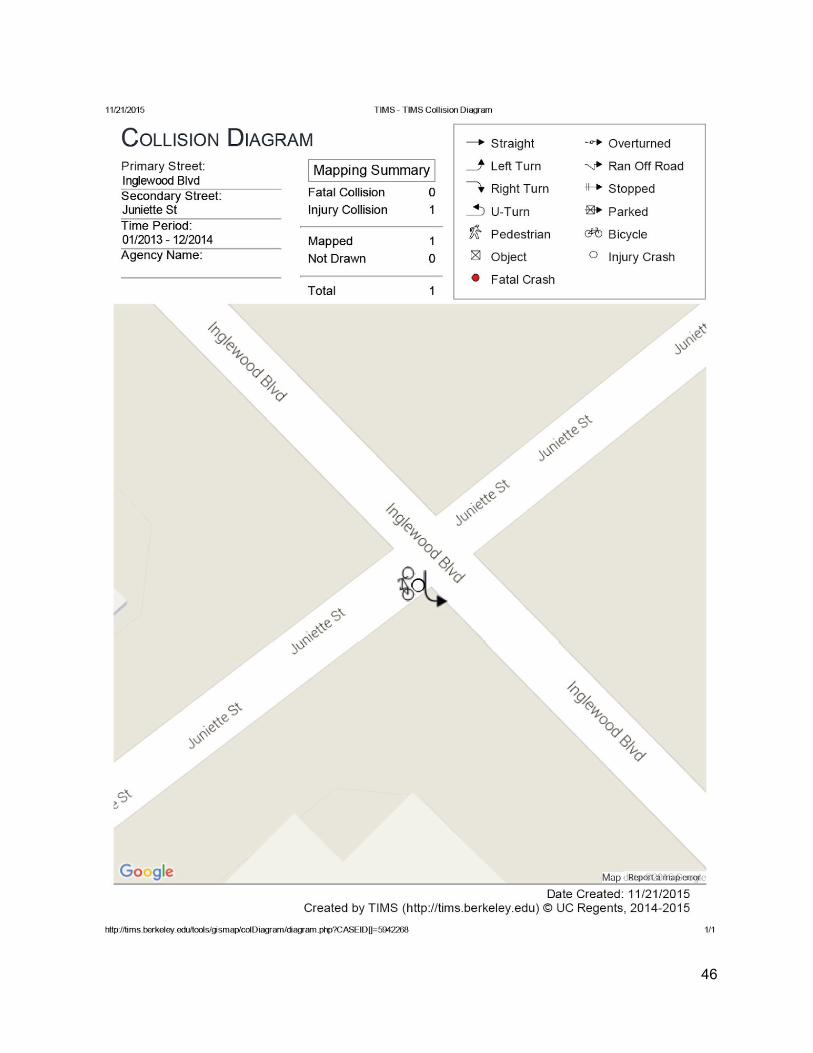
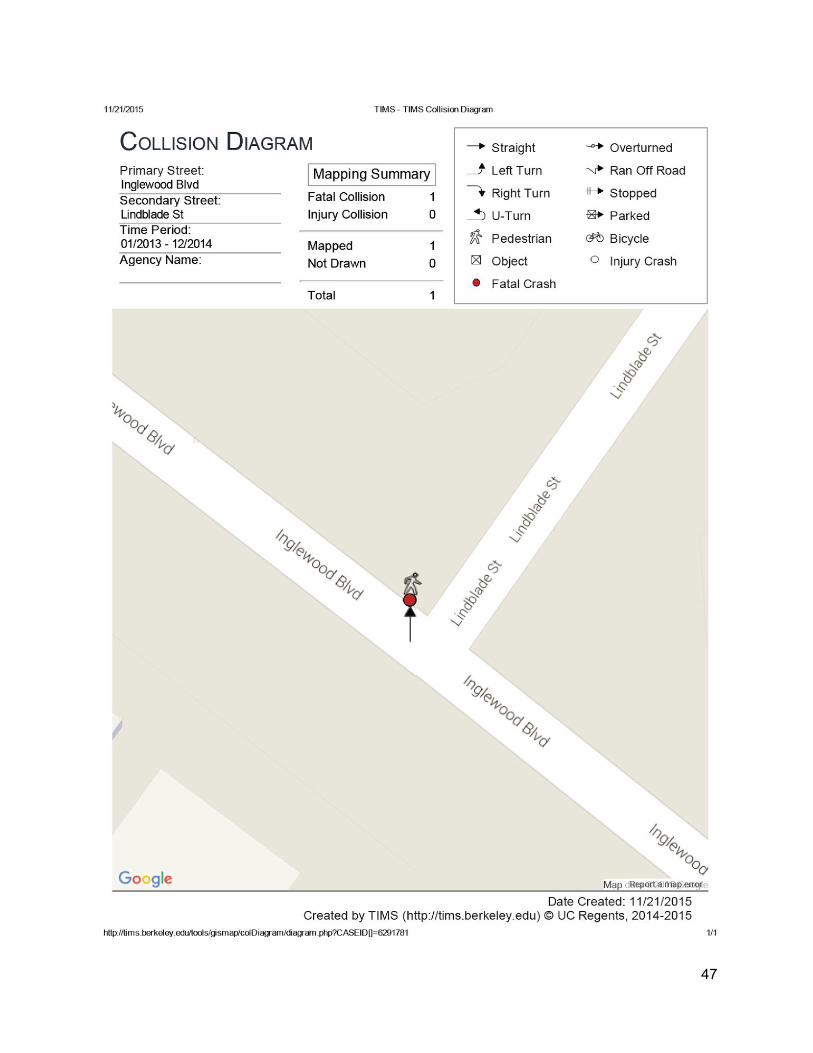
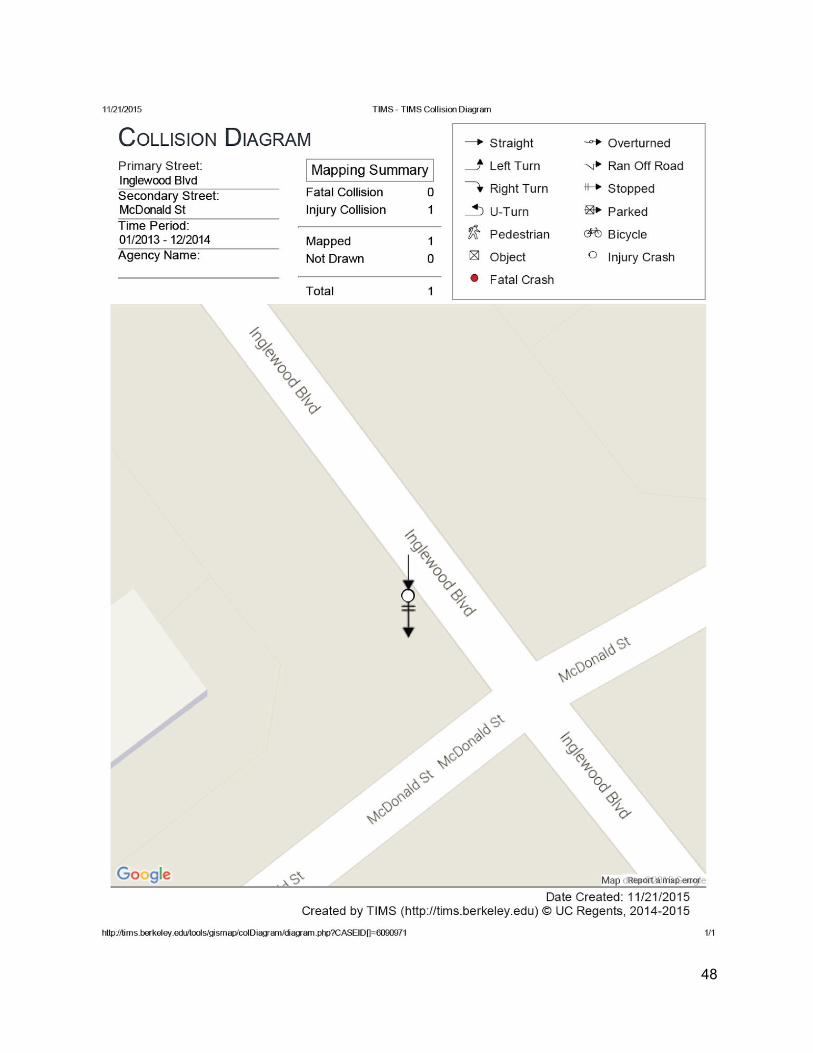
Pedestrians and Accidents According to the Transportation Information Management System (TIMS),
although there were some accidents through the corridor, not enough of them occur in the same intersection to indicate a potential traffic control problem. If there were five or more accidents in the same intersection we would need to take some steps in order to solve this concern. Since no intersection experienced more than four accidents in any single year, there is no need to consider accidents in the design calculations. The reason two years worth of collision data was used is that there simply wasn’t enough data in either year alone to be able to perform a meaningful analysis.
In the same regard, the pedestrian volumes at each of the intersections were not high enough to warrant consideration in the design, and so the current system pedestrian walk / don’t walk being coordinated with the timing of the traffic signal cycles will be left in place. Figure 8: TIMS Collision Map for Years 2013/2014
15
Free Flow Speed Diagrams and Arterial Level of Service In order to evaluate and understand how the time travel changes between
directions and hours, runs were made during the morning and afternoon peak hours on Inglewood Boulevard. The idea was to make the maximum runs till reaching 6 runs for each northbound and southbound. Although we had time to complete 6 runs in the morning, in the evening only 4 was possible, due to an accident that happened in the street causing a delay. That accident happened at the intersection of Centinela Ave (Inglewood Blvd south past Jefferson Blvd) and Bluff Creek Dr / Major St, so it fell outside of our area of study.
After collecting the data in the field, graphs were plotted in order to evaluate the fastest run, the slowest run, the average speed among all runs, and the delay of each run, which is calculated by using the Free Flow Speed. This information is presented below in graphic form.
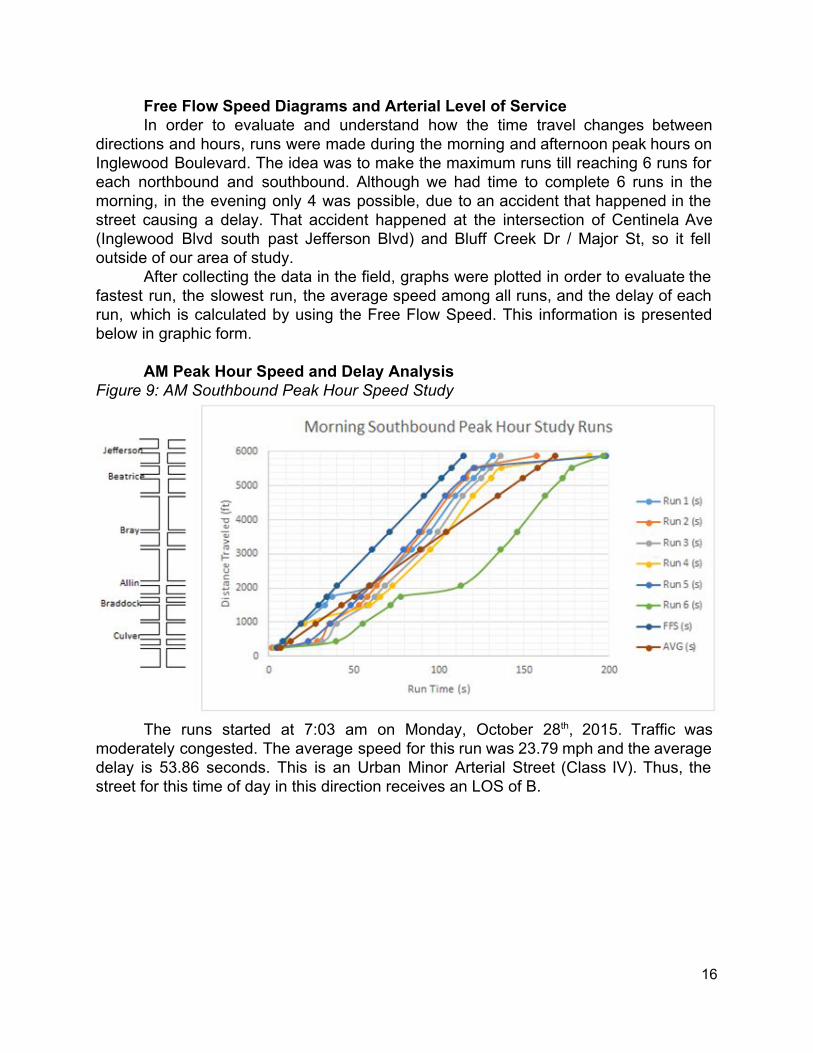
AM Peak Hour Speed and Delay Analysis
Figure 9: AM Southbound Peak Hour Speed Study
The runs started at 7:03 am on Monday, October 28th, 2015. Traffic was
moderately congested. The average speed for this run was 23.79 mph and the average delay is 53.86 seconds. This is an Urban Minor Arterial Street (Class IV). Thus, the street for this time of day in this direction receives an LOS of B.
16
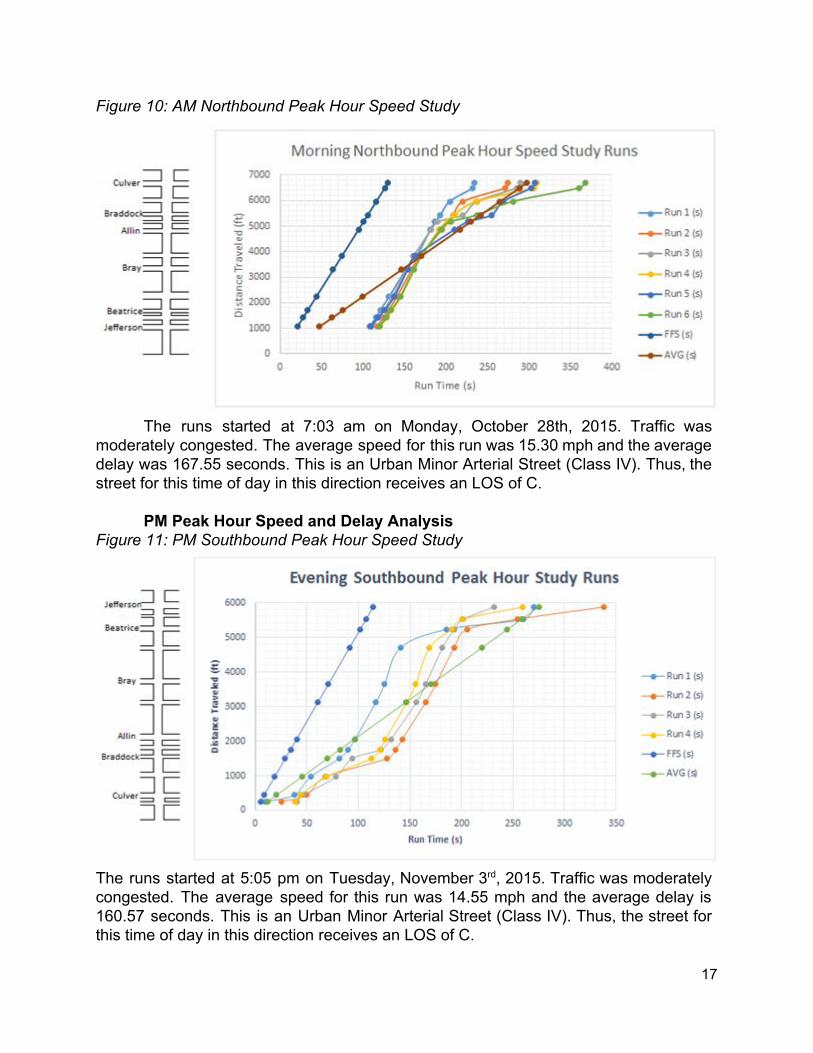
Figure 10: AM Northbound Peak Hour Speed Study
The runs started at 7:03 am on Monday, October 28th, 2015. Traffic was
moderately congested. The average speed for this run was 15.30 mph and the average delay was 167.55 seconds. This is an Urban Minor Arterial Street (Class IV). Thus, the street for this time of day in this direction receives an LOS of C.
PM Peak Hour Speed and Delay Analysis
Figure 11: PM Southbound Peak Hour Speed Study
The runs started at 5:05 pm on Tuesday, November 3rd, 2015. Traffic was moderately congested. The average speed for this run was 14.55 mph and the average delay is 160.57 seconds. This is an Urban Minor Arterial Street (Class IV). Thus, the street for this time of day in this direction receives an LOS of C.
17
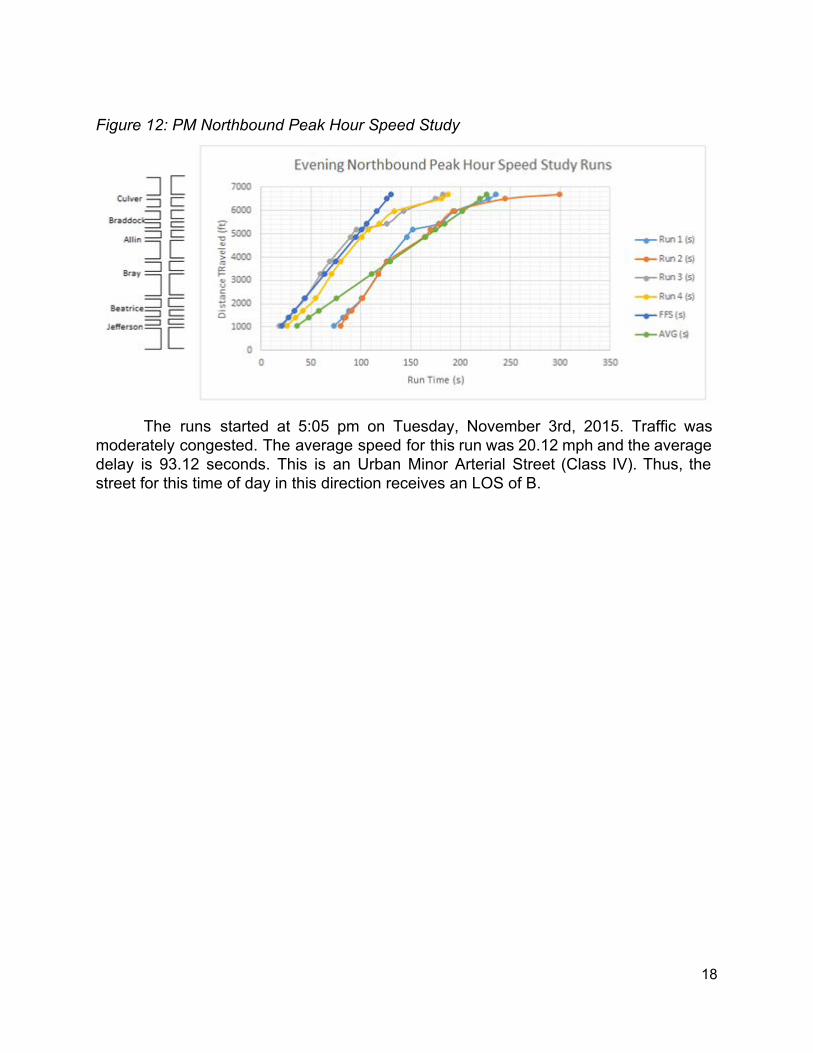
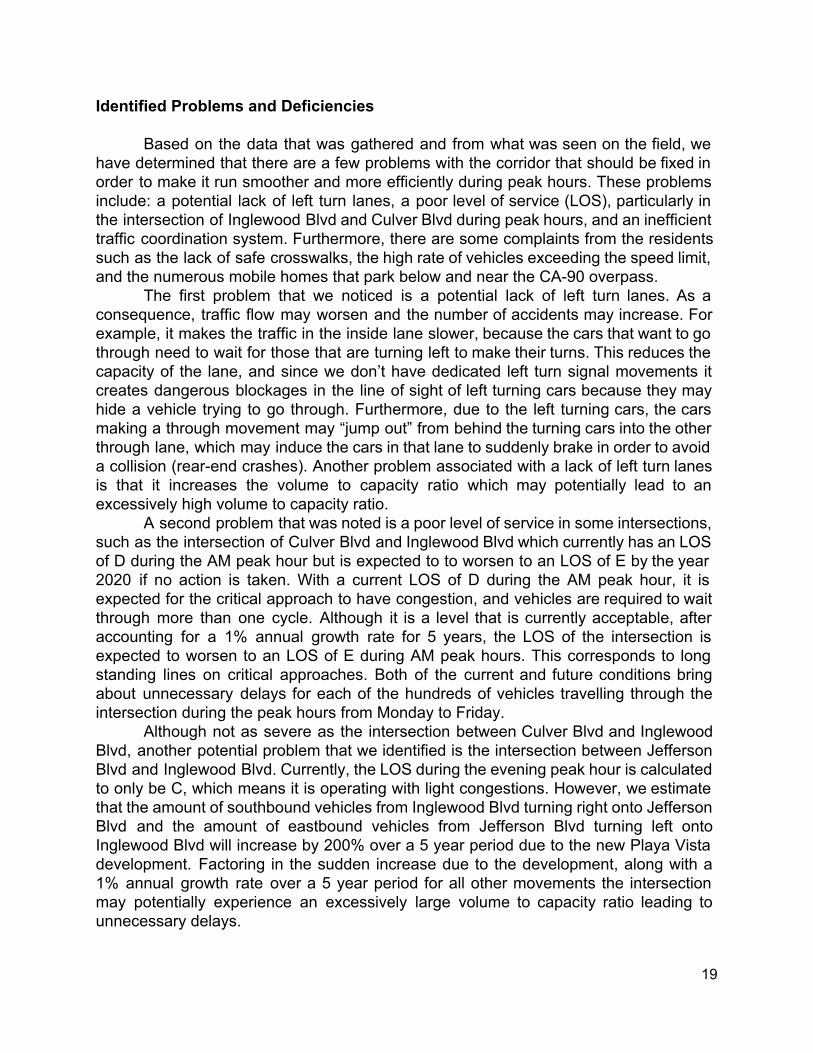
Figure 12: PM Northbound Peak Hour Speed Study
The runs started at 5:05 pm on Tuesday, November 3rd, 2015. Traffic was
moderately congested. The average speed for this run was 20.12 mph and the average delay is 93.12 seconds. This is an Urban Minor Arterial Street (Class IV). Thus, the street for this time of day in this direction receives an LOS of B.
18
Identified Problems and Deficiencies
Based on the data that was gathered and from what was seen on the field, we have determined that there are a few problems with the corridor that should be fixed in order to make it run smoother and more efficiently during peak hours. These problems include: a potential lack of left turn lanes, a poor level of service (LOS), particularly in the intersection of Inglewood Blvd and Culver Blvd during peak hours, and an inefficient traffic coordination system. Furthermore, there are some complaints from the residents such as the lack of safe crosswalks, the high rate of vehicles exceeding the speed limit, and the numerous mobile homes that park below and near the CA90 overpass.
The first problem that we noticed is a potential lack of left turn lanes. As a consequence, traffic flow may worsen and the number of accidents may increase. For example, it makes the traffic in the inside lane slower, because the cars that want to go through need to wait for those that are turning left to make their turns. This reduces the capacity of the lane, and since we don’t have dedicated left turn signal movements it creates dangerous blockages in the line of sight of left turning cars because they may hide a vehicle trying to go through. Furthermore, due to the left turning cars, the cars making a through movement may “jump out” from behind the turning cars into the other through lane, which may induce the cars in that lane to suddenly brake in order to avoid a collision (rearend crashes). Another problem associated with a lack of left turn lanes is that it increases the volume to capacity ratio which may potentially lead to an excessively high volume to capacity ratio.
A second problem that was noted is a poor level of service in some intersections, such as the intersection of Culver Blvd and Inglewood Blvd which currently has an LOS of D during the AM peak hour but is expected to to worsen to an LOS of E by the year 2020 if no action is taken. With a current LOS of D during the AM peak hour, it is expected for the critical approach to have congestion, and vehicles are required to wait through more than one cycle. Although it is a level that is currently acceptable, after accounting for a 1% annual growth rate for 5 years, the LOS of the intersection is expected to worsen to an LOS of E during AM peak hours. This corresponds to long standing lines on critical approaches. Both of the current and future conditions bring about unnecessary delays for each of the hundreds of vehicles travelling through the intersection during the peak hours from Monday to Friday.
Although not as severe as the intersection between Culver Blvd and Inglewood Blvd, another potential problem that we identified is the intersection between Jefferson Blvd and Inglewood Blvd. Currently, the LOS during the evening peak hour is calculated to only be C, which means it is operating with light congestions. However, we estimate that the amount of southbound vehicles from Inglewood Blvd turning right onto Jefferson Blvd and the amount of eastbound vehicles from Jefferson Blvd turning left onto Inglewood Blvd will increase by 200% over a 5 year period due to the new Playa Vista development. Factoring in the sudden increase due to the development, along with a 1% annual growth rate over a 5 year period for all other movements the intersection may potentially experience an excessively large volume to capacity ratio leading to unnecessary delays.
19
Another potential problem we noticed after collecting and analysing all the data is the bandwidth efficiency, which we noticed could have been improved through better signal coordination to reduce delays of the cars going through the major street, Inglewood Blvd, during the AM and PM peak hours. The current bandwidth efficiencies for the AM peak hour is 10% for vehicles going southbound and 20% for vehicles going northbound. As for the PM peak hour, the bandwidth efficiency is 42% for southbound vehicles and 20% for northbound vehicles. Due to a larger number of cars travelling in the northbound direction as opposed to the southbound direction during the AM peak hour, according to the data collected in the field, we believe that the bandwidth efficiency for the northbound vehicles should be greater. Furthermore, under current conditions, the corridor has no coordination with Culver Blvd during AM peak hours despite sharing an equivalent cycle length of 60 seconds. Therefore, the bandwidth efficiency should not only be larger, but also include some coordination with Culver Blvd during the AM peak hours to reduce delays and make the corridor operate more smoothly.
20
Summary of Analysis
For each of the problems described in the above section, a couple of solutions were developed based on available resources and design principles. They are each briefly discussed and weighed, then they are combined with the other components into two corridor solution plans, which are outlined in the section that follows. It should be noted here again that all of the solutions proposed are designed for the expected conditions in 2020, based on a 1% annual growth rate (except for the two turning motions on Inglewood and Jefferson, which are expected to triple in the next five years).
Solving Traffic Signal Coordination The problem posed by traffic signal coordination is complicated by its junctions
with Culver and Jefferson, but it is possible to optimize the signals in between because they all have the same cycle length of 60 seconds.
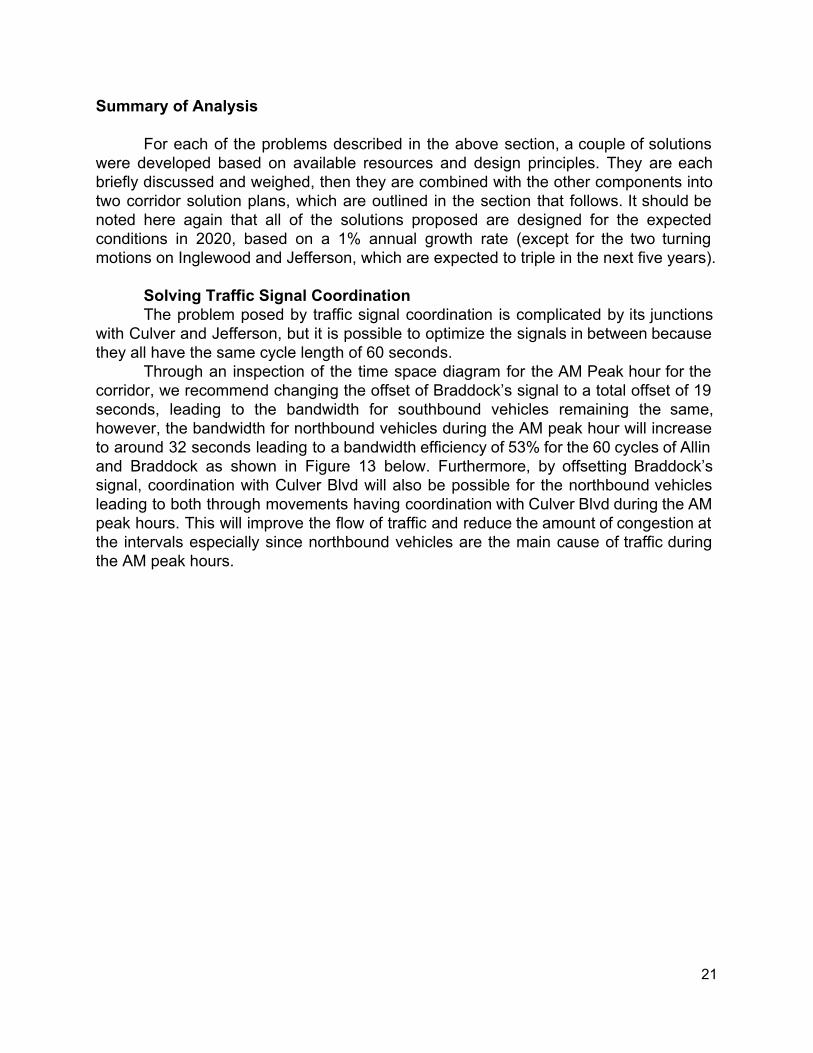
Through an inspection of the time space diagram for the AM Peak hour for the corridor, we recommend changing the offset of Braddock’s signal to a total offset of 19 seconds, leading to the bandwidth for southbound vehicles remaining the same, however, the bandwidth for northbound vehicles during the AM peak hour will increase to around 32 seconds leading to a bandwidth efficiency of 53% for the 60 cycles of Allin and Braddock as shown in Figure 13 below. Furthermore, by offsetting Braddock’s signal, coordination with Culver Blvd will also be possible for the northbound vehicles leading to both through movements having coordination with Culver Blvd during the AM peak hours. This will improve the flow of traffic and reduce the amount of congestion at the intervals especially since northbound vehicles are the main cause of traffic during the AM peak hours.
21
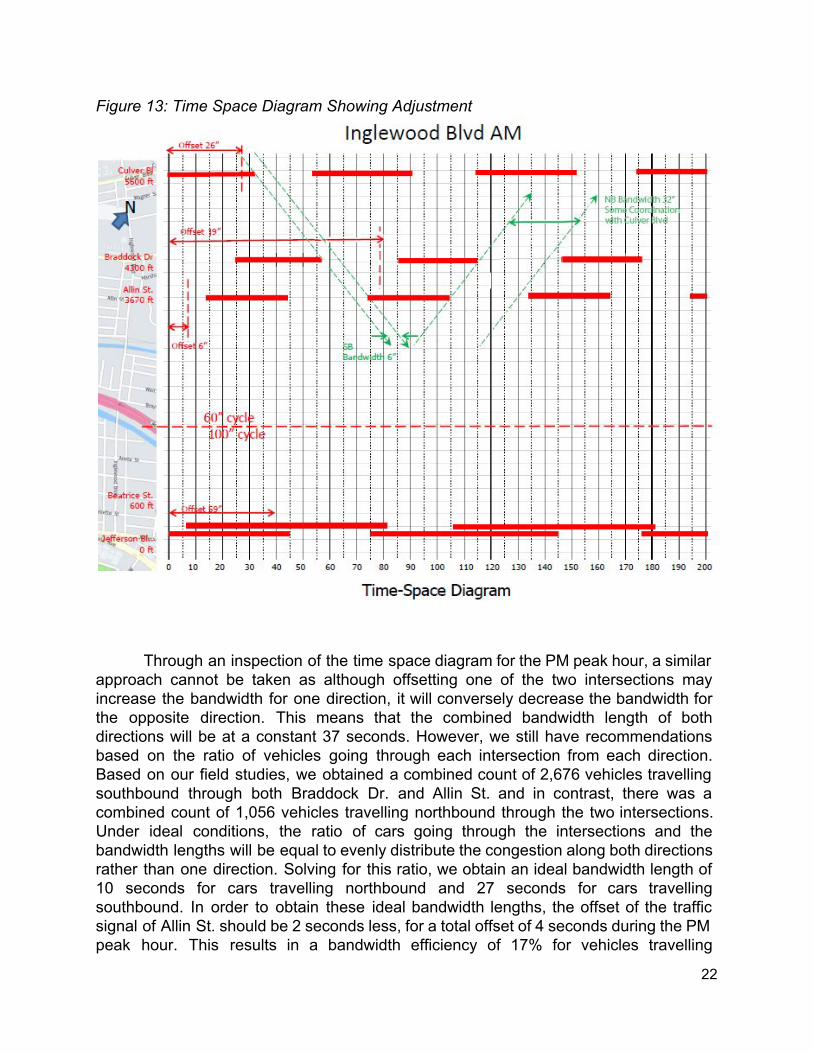
Figure 13: Time Space Diagram Showing Adjustment
Through an inspection of the time space diagram for the PM peak hour, a similar approach cannot be taken as although offsetting one of the two intersections may increase the bandwidth for one direction, it will conversely decrease the bandwidth for the opposite direction. This means that the combined bandwidth length of both directions will be at a constant 37 seconds. However, we still have recommendations based on the ratio of vehicles going through each intersection from each direction. Based on our field studies, we obtained a combined count of 2,676 vehicles travelling southbound through both Braddock Dr. and Allin St. and in contrast, there was a combined count of 1,056 vehicles travelling northbound through the two intersections. Under ideal conditions, the ratio of cars going through the intersections and the bandwidth lengths will be equal to evenly distribute the congestion along both directions rather than one direction. Solving for this ratio, we obtain an ideal bandwidth length of 10 seconds for cars travelling northbound and 27 seconds for cars travelling southbound. In order to obtain these ideal bandwidth lengths, the offset of the traffic signal of Allin St. should be 2 seconds less, for a total offset of 4 seconds during the PM peak hour. This results in a bandwidth efficiency of 17% for vehicles travelling
22
northbound and 45% for vehicles travelling southbound during the PM peak hours through Braddock Dr. and Allin St. Coordinating this with Braddock or Jefferson will be impossible due to a difference in cycle lengths. However, unlike simply offsetting Braddock’s signal, which would not decrease any bandwidth efficiency, changing the signal offsets during the PM peak hour will result in one direction’s bandwidth efficiency increasing, but, because the opposing direction bandwidth efficiency will decrease as a result, we do not recommend this method.
Solving Lack of Left Turn Lanes In order to solve this problem, there are some solutions that may be available to
create twoway left turn lanes on Inglewood Boulevard. The first one is to cut into the rightofway on either side of the street. This first
option is based on the fact that there is 1215’ of clearance in each side (rightofway + sidewalk) that the city owns. The idea is to cut 35’ into each side to make room for an infinite queue left turn lane, with dedicated left turn lane sections at each intersection. The mina problems with this are the proximity of schools and the number of trees that are within the 5’ zone on the southbound side of the road. Although those are some concerns, this is a very viable solution because this lane serves as a twoway turn in between signalized intersections to facilitate movements into/from developments on either side (unsignalized intersections, shopping developments, driveways, etc.), and allows curbside parking to remain, which is important given that most homes along Inglewood Blvd do not have driveways or garages.
The second option is to remove the curb parking. This solution would open 8’ from each side, 16’ total, leaving the 12’ minimum curbside lane width required. This gained space would allow the creation of either dedicated turn lanes or a dual purpose infinite queue left turn lane as stated above, and serving the same purposes.
The expected LOS values for adding the left turn lanes are laid out in the following tables.
Table 5: AM Difference for Projected LOS
Projected LOS Values for the AM Peak Hour
Current 2020 no action Added Left Turn Lane Allin/Inglewood A B B
Braddock/Inglewood B C B
Beatrice/Inglewood A A A
Table 6: PM Difference for Projected LOS
Projected LOS Values for the PM Peak Hour
Current 2020 no action Added Left Turn Lane Allin/Inglewood A B A
Braddock/Inglewood D D C
Beatrice/Inglewood A A A
23
Given that the addition of a turn lane, according to the analysis method outlined by Professors Okitsu and Gibson, will not significantly improve the LOS values for AM and PM peak hours, this problem is not as large as initially suspected. Therefore, this solution, if implemented, would be more for ease of use and safety than for increasing the LOS of the corridor.
Improving the Inglewood/Culver Intersection Projected LOS As stated before, the projected level of service for Culver in 2020 is not
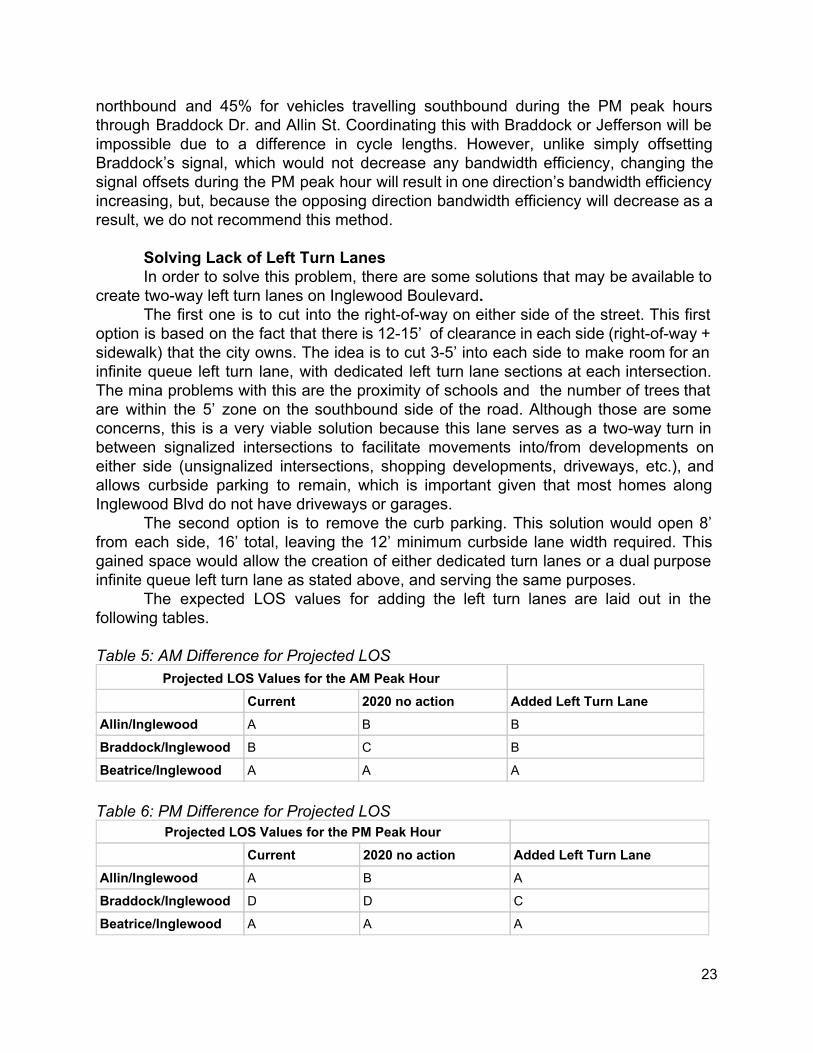
acceptable according to the MUTCD. The current level of service D corresponds to the design capacity under urban conditions, and, although it is not the preferable condition it is still acceptable. However, it is vital to adopt a long term improvement for this situation in order to solve the problem of increased demand in the future years, as it is expected to fall into an LOS of E by 2020. The alternative that we recommend is to add one more 10’ lane in each direction at Culver Blvd. As a result, the additional 20’ would reduce the side median between streets from approximately 54’ to 34’, but the LOS would improve. The map below shows the current situation.
Figure 14: Culver current map
Because we are adding two new lanes only in one side of the street it would be
also necessary to redesign the left turn lane. With this modification the new LOS would be C, accepted for design capacity as provided in the table below.
24
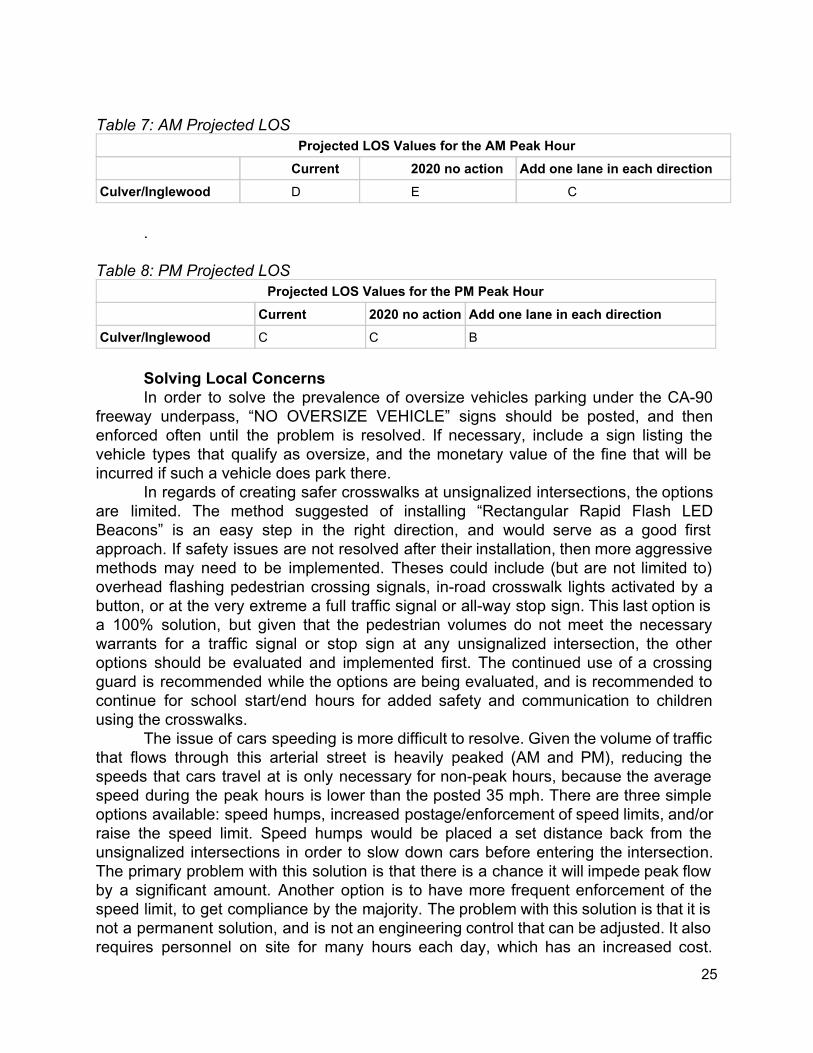
Table 7: AM Projected LOS
Projected LOS Values for the AM Peak Hour Current 2020 no action Add one lane in each direction
Culver/Inglewood D E C
.
Table 8: PM Projected LOS Projected LOS Values for the PM Peak Hour
Current 2020 no action Add one lane in each direction Culver/Inglewood C C B
Solving Local Concerns In order to solve the prevalence of oversize vehicles parking under the CA90
freeway underpass, “NO OVERSIZE VEHICLE” signs should be posted, and then enforced often until the problem is resolved. If necessary, include a sign listing the vehicle types that qualify as oversize, and the monetary value of the fine that will be incurred if such a vehicle does park there.
In regards of creating safer crosswalks at unsignalized intersections, the options are limited. The method suggested of installing “Rectangular Rapid Flash LED Beacons” is an easy step in the right direction, and would serve as a good first approach. If safety issues are not resolved after their installation, then more aggressive methods may need to be implemented. Theses could include (but are not limited to) overhead flashing pedestrian crossing signals, inroad crosswalk lights activated by a button, or at the very extreme a full traffic signal or allway stop sign. This last option is a 100% solution, but given that the pedestrian volumes do not meet the necessary warrants for a traffic signal or stop sign at any unsignalized intersection, the other options should be evaluated and implemented first. The continued use of a crossing guard is recommended while the options are being evaluated, and is recommended to continue for school start/end hours for added safety and communication to children using the crosswalks.
The issue of cars speeding is more difficult to resolve. Given the volume of traffic that flows through this arterial street is heavily peaked (AM and PM), reducing the speeds that cars travel at is only necessary for nonpeak hours, because the average speed during the peak hours is lower than the posted 35 mph. There are three simple options available: speed humps, increased postage/enforcement of speed limits, and/or raise the speed limit. Speed humps would be placed a set distance back from the unsignalized intersections in order to slow down cars before entering the intersection. The primary problem with this solution is that there is a chance it will impede peak flow by a significant amount. Another option is to have more frequent enforcement of the speed limit, to get compliance by the majority. The problem with this solution is that it is not a permanent solution, and is not an engineering control that can be adjusted. It also requires personnel on site for many hours each day, which has an increased cost.
25
Increased signage could be used in conjunction or separately from this option. Increased signage includes more speed limit signs, or the “Radar Speed Indicator Signs” that inform drivers of their speed in real time. The third solution is the least desirable but easiest to implement: raising the speed limit. This does not solve the problem per se, but instead raises the tolerance level of the residents of the area and encourages them to be more cautious in their actions when near the street. This is problematic, because there are two schools directly on Inglewood Blvd and another two blocks off on a side street, meaning there is the potential for high volumes of children on the sidewalks. This could be mitigated by installing a fencing or railing along the curb wherever parking is not allowed, but it still would not provide complete protection. Therefore, this report recommends against the use of this option.
26
Conclusion / Recommendations
After collecting data from the field, reviewing the LADOT street planning diagrams, performing calculations and applying accepted design principles, we have come up with two alternates that we believe will make the corridor run more effectively and be able to handle the estimated 2020 volumes. Our first Corridor Solution is our minor improvement which will cost minimal time and effort, while our second Corridor Solution is our major improvement which is geared towards a long term improvement with less consideration to cost.
Corridor Solution 1 The first alternative that we recommend is to change the signal coordination to
improve the bandwidth efficiency in the northbound direction during the AM peak hour. From our analysis of the time space diagram, we noticed that by reducing the offset of the signal on Braddock from 59 seconds to 19 seconds, the bandwidth efficiency of the northbound vehicles will increase from 20% to 53% without decreasing the bandwidth efficiency of the southbound vehicles. Furthermore, it will have some coordination with Culver Blvd which will further decrease delays on the corridor. We believe that the change will benefit the corridor because currently, most of the delay during the AM peak hour comes from northbound vehicles due to a greater volume. Therefore, we believe that making the signals more efficient for the northbound vehicles will greatly reduce the traffic for the AM peak hour.
Corridor Solution 2 This corridor solution is aimed at a more long term solution that will drastically
improve the volume to capacity ratio on Culver Blvd, which is expected to reach an LOS of E within five years. Our recommendation is to add an extra 10 foot through lane in each direction for the east and westbound lanes. To make room for this, we will use around 20 feet of the 53 feet available as public space as shown above in Figure 14. This will give us the space needed to create the extra lanes without having to resort to buying property. Through this solution, the LOS of Culver Blvd is estimated to be C in the AM peak hour and B in the PM peak hour as shown above in Tables 7 and 8.
Solutions to Local Concerns To address the concerns of the community, we recommend the following actions.
In regards to speeding, the placement of a few speed humps and a “Radar Speed Indicator Sign” as the first step to solving the problem. To remove the nuisance of oversize vehicles parked long term under the CA90 freeway, we recommend posting “No Oversize Vehicle Parking” signs and strictly enforcing them for a period of time. To address whether or not to cut into the right of way to install a dedicated twoway turn lane through the corridor, further study is needed. For the increased safety of crosswalks, we recommend the installation of “Rectangular Rapid Flash LED Beacons” and the continued use of crossing guards during school start/end hours.
27
References Gibson, Patrick, and Walter Okitsu. "Lecture Notes." CEE 181. UCLA, Los Angeles. Lecture. "Google Maps." Google Maps. N.p., n.d. Web. Nov. 2015. <http://maps.google.com/>. "LADOT Transportation Planning System Data." Inglewood Blvd Corridor. LADOT, n.d. Web. Nov. 2015. "TIMS Transportation Injury Mapping System." TIMS Transportation Injury Mapping System. SafeTREC, n.d. Web. Nov. 2015. <http://tims.berkeley.edu/>.
28
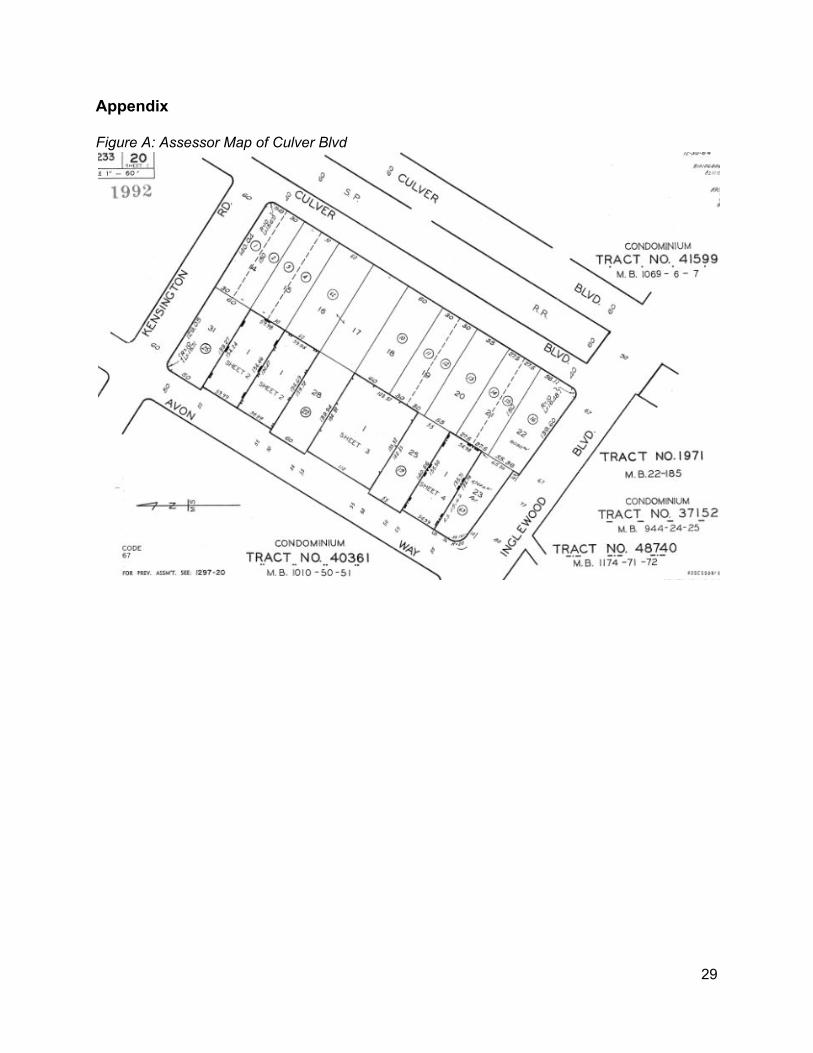
Appendix Figure A: Assessor Map of Culver Blvd
29
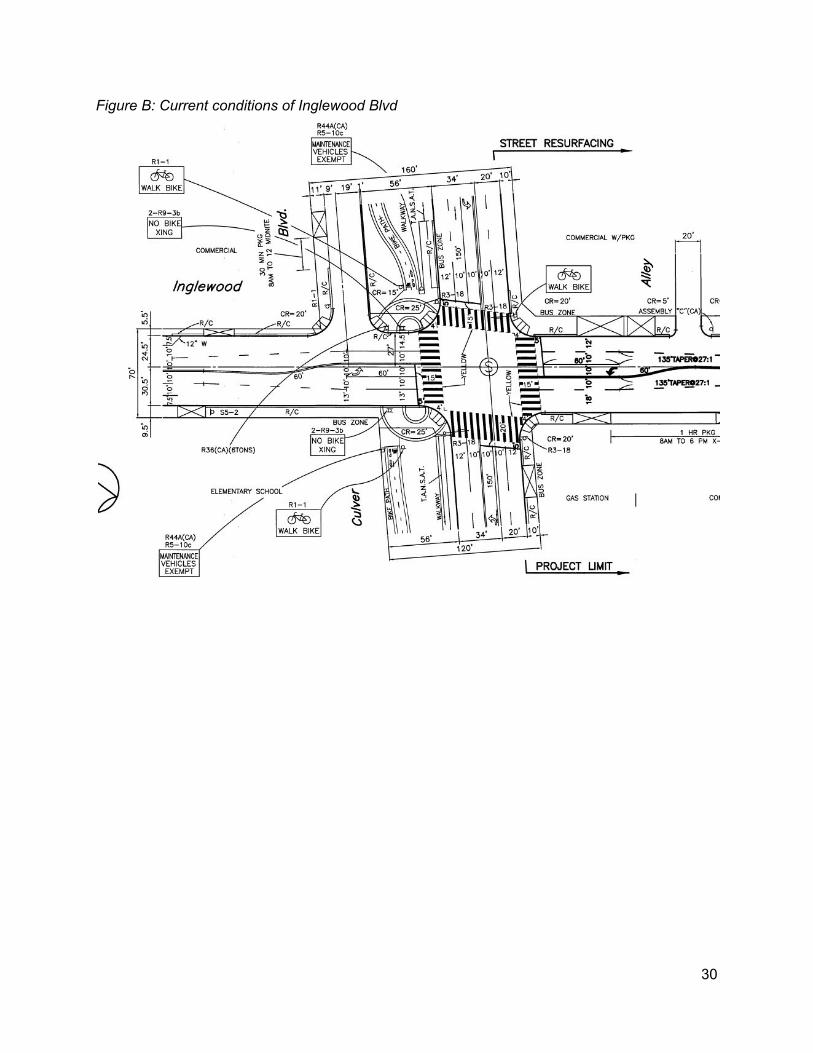
Figure B: Current conditions of Inglewood Blvd
30
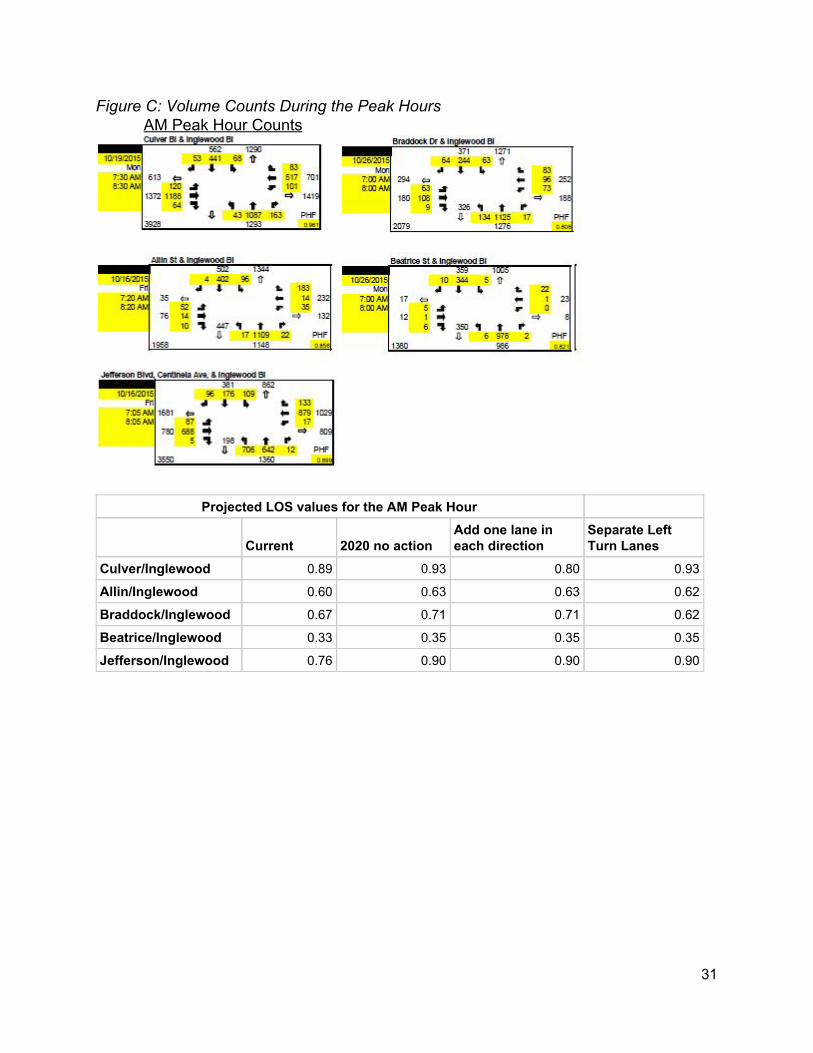
Figure C: Volume Counts During the Peak Hours AM Peak Hour Counts
Projected LOS values for the AM Peak Hour
Current 2020 no action Add one lane in each direction
Separate Left Turn Lanes
Culver/Inglewood 0.89 0.93 0.80 0.93
Allin/Inglewood 0.60 0.63 0.63 0.62
Braddock/Inglewood 0.67 0.71 0.71 0.62
Beatrice/Inglewood 0.33 0.35 0.35 0.35
Jefferson/Inglewood 0.76 0.90 0.90 0.90
31
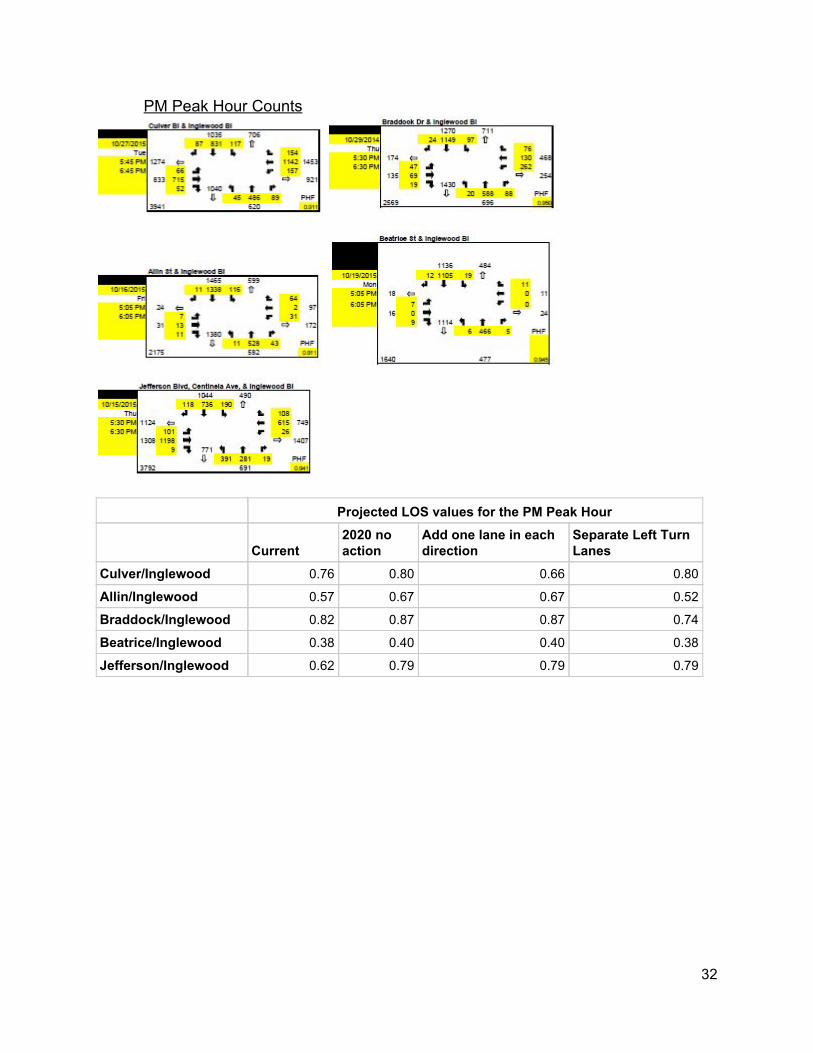
PM Peak Hour Counts
Projected LOS values for the PM Peak Hour
Current 2020 no action
Add one lane in each direction
Separate Left Turn Lanes
Culver/Inglewood 0.76 0.80 0.66 0.80
Allin/Inglewood 0.57 0.67 0.67 0.52
Braddock/Inglewood 0.82 0.87 0.87 0.74
Beatrice/Inglewood 0.38 0.40 0.40 0.38
Jefferson/Inglewood 0.62 0.79 0.79 0.79
32
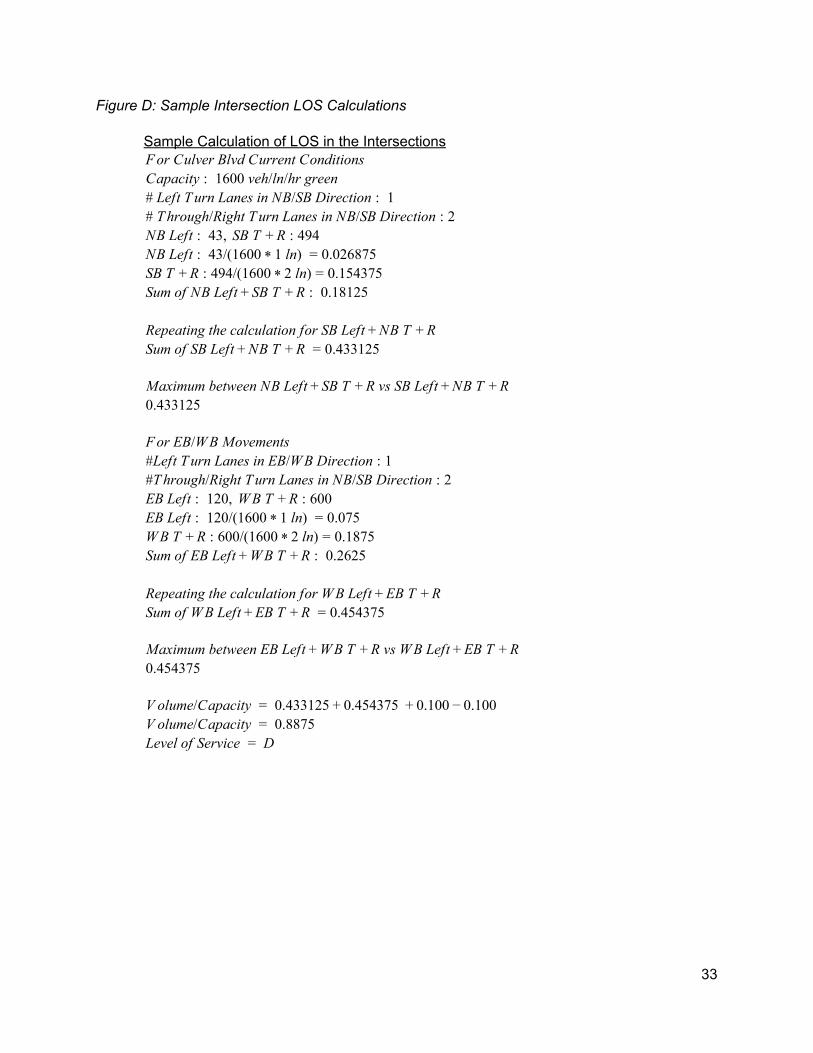
Figure D: Sample Intersection LOS Calculations
Sample Calculation of LOS in the Intersections or Culver Blvd Current ConditionsF apacity 1600 veh/ln/hr greenC : Left Turn Lanes in NB/SB Direction 1# : Through/Right Turn Lanes in NB/SB Direction# : 2 B Left 43, SB T 94N : + R : 4 B Left 43/(1600 ln) .026875N : * 1 = 0 B T 94/(1600 ln) .154375S + R : 4 * 2 = 0 um of NB Left B T 0.18125S + S + R :
epeating the calculation for SB Left B TR + N + R um of SB Left B T .433125S + N + R = 0
aximum between NB Left B T vs SB Left B TM + S + R + N + R .4331250
or EB/WB MovementsF Left Turn Lanes in EB/WB Direction# : 1 Through/Right Turn Lanes in NB/SB Direction# : 2 B Left 120, WB T 00E : + R : 6 B Left 120/(1600 ln) .075E : * 1 = 0 B T 00/(1600 ln) .1875W + R : 6 * 2 = 0 um of EB Left B T 0.2625S +W + R :
epeating the calculation for WB Left B TR + E + R um of WB Left B T .454375S + E + R = 0
aximum between EB Left B T vs WB Left B TM +W + R + E + R .4543750
olume/Capacity 0.433125 .454375 .100 .100V = + 0 + 0 − 0 olume/Capacity 0.8875 V = evel of Service DL =
33

or Allin St. AM Current ConditionsF Lanes in the NB/SB Direction# B Left 17N = B Left 95S = B Left PCE 7 4N = 1 * 2 = 3 B Left PCE 95 570S = * 6 = B Right 22N = B Right 4S = B T 06S + R = 4 B T 1131N + R = B V ehicles going Through on the left lane ax((1131 4)/2, )N = m − 3 0
48.5= 5 B V ehicles going T on the right lane 131 48.5N + R = 1 − 5
82.5= 5 SB Left BT (Right lane) ight Turn)/Capacity (95 82.5)/1600( + N + R = + 5
.4234375= 0 epeating the Steps for NB Left BT (Right lane) B RR + S + S
.264375= 0 aximum between NB Left B T vs SB Left B TM + S + R + N + R
.42343750
or EB MovementsF B Left 52E = B All 232W = B Left B All .1775E +W = 1600
52+232 = 0 epeating the calculation for WB Left B TR + E + R um of WB Left B All .069375S + E = 0
aximum between EB Left B All vs WB Left B AllM +W + E
.17750 olume/Capacity 0.4234375 .1775 .100 .100V = + 0 + 0 − 0 olume/Capacity 0.60V = evel of Service AL =
34
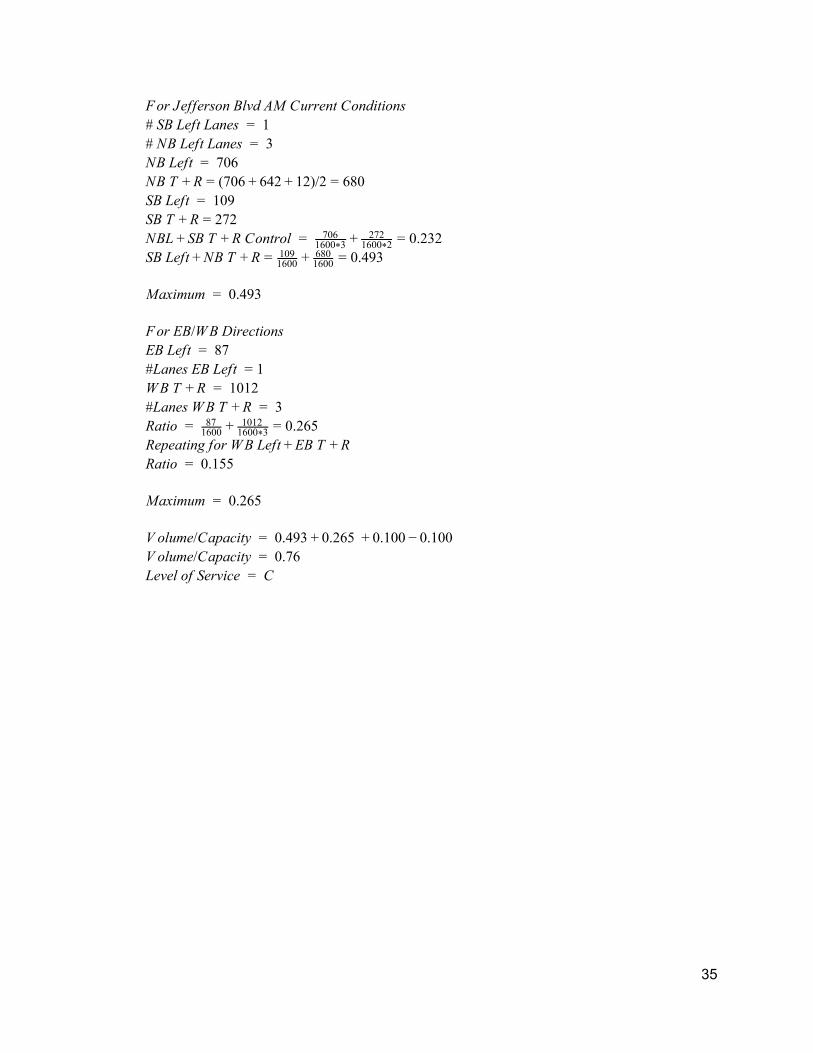
or Jefferson Blvd AM Current ConditionsF SB Left Lanes 1# =
NB Left Lanes 3# = B Left 706N = B T 706 42 2)/2 80N + R = ( + 6 + 1 = 6 B Left 109S = B T 72S + R = 2 BL B T Control .232N + S + R = 706
1600 3*+ 272
1600 2*= 0
B Left B T .493S + N + R = 1091600 +
6801600 = 0
aximum 0.493M =
or EB/WB DirectionsF B Left 87E = Lanes EB Left # = 1 B T 1012W + R = Lanes WB T 3# + R = atio .265R = 871600 +
10121600 3*
= 0 epeating for WB Left B TR + E + R atio 0.155R =
aximum 0.265M =
olume/Capacity 0.493 .265 .100 .100V = + 0 + 0 − 0 olume/Capacity 0.76V = evel of Service CL =
35
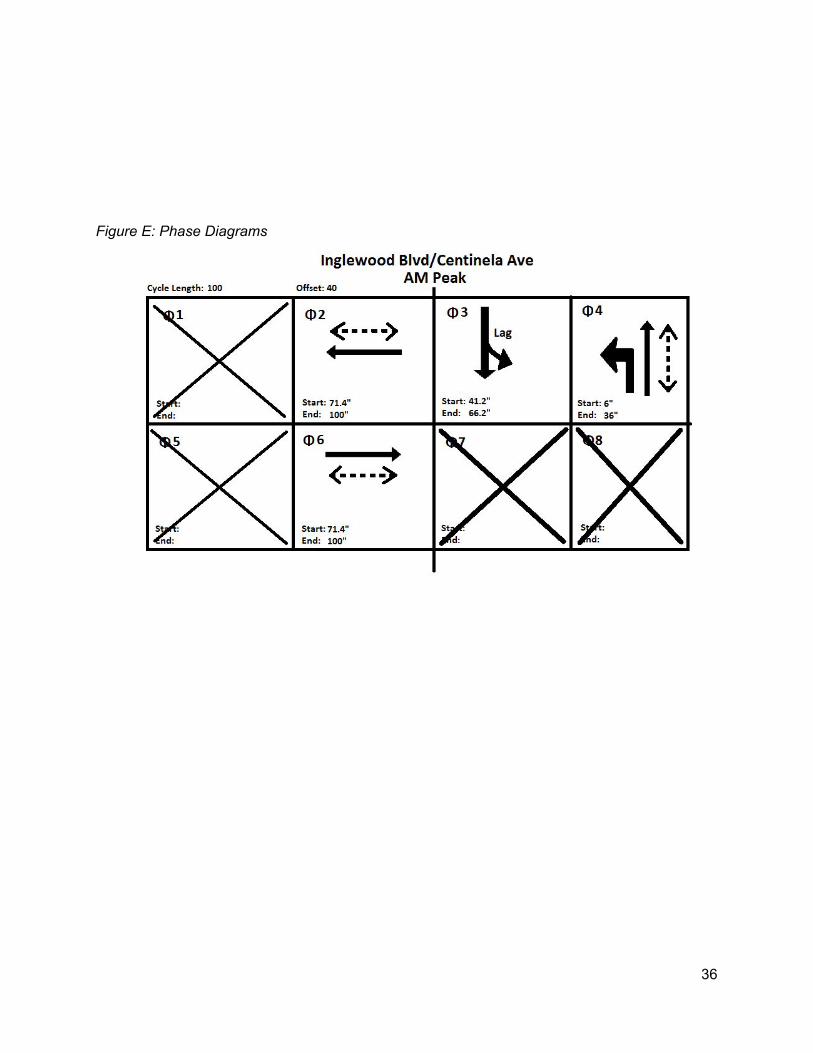
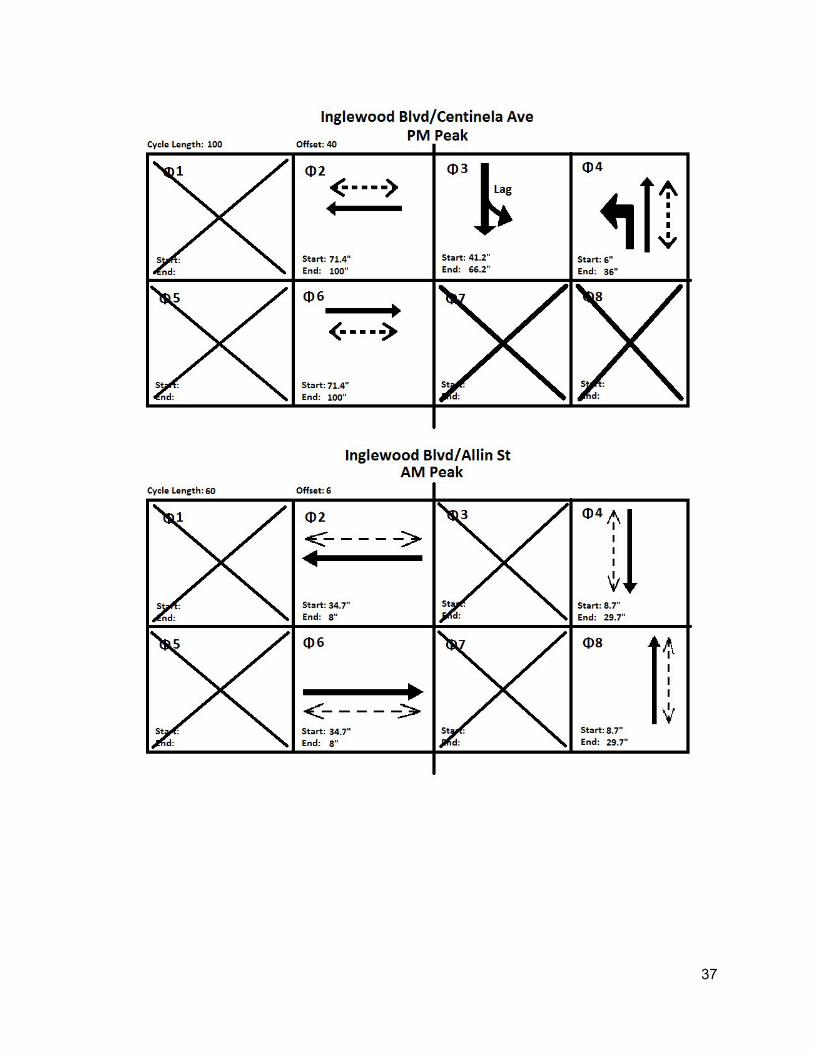
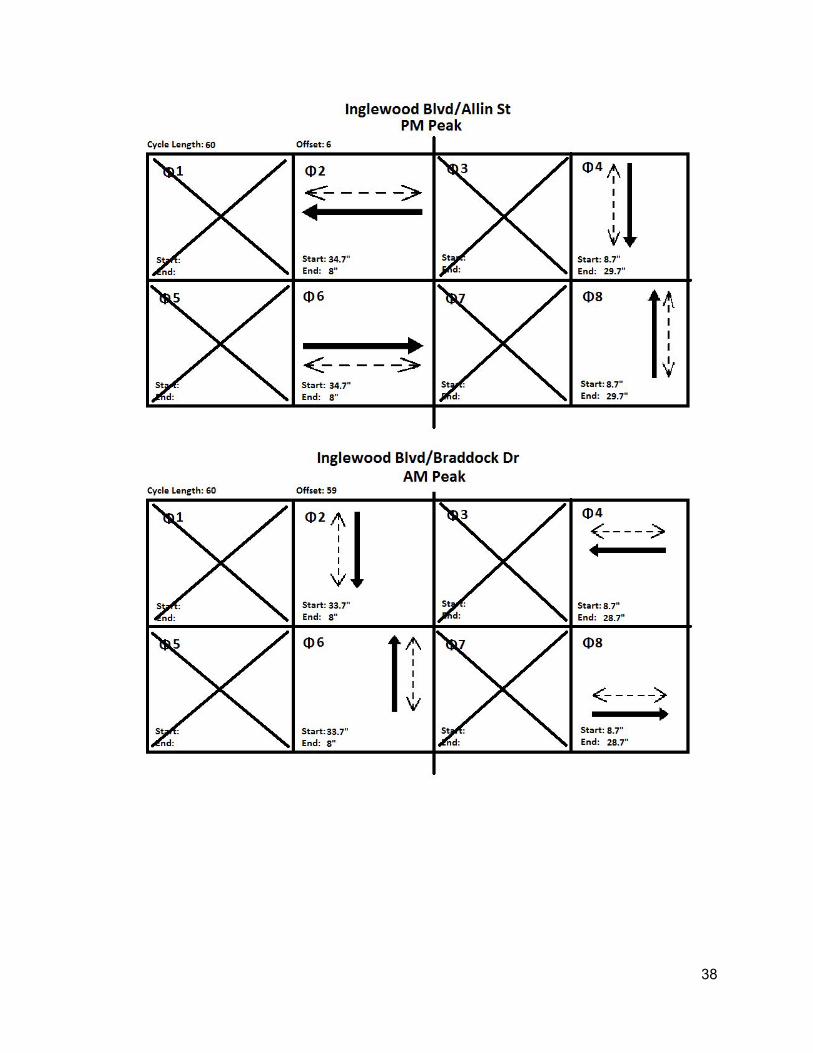
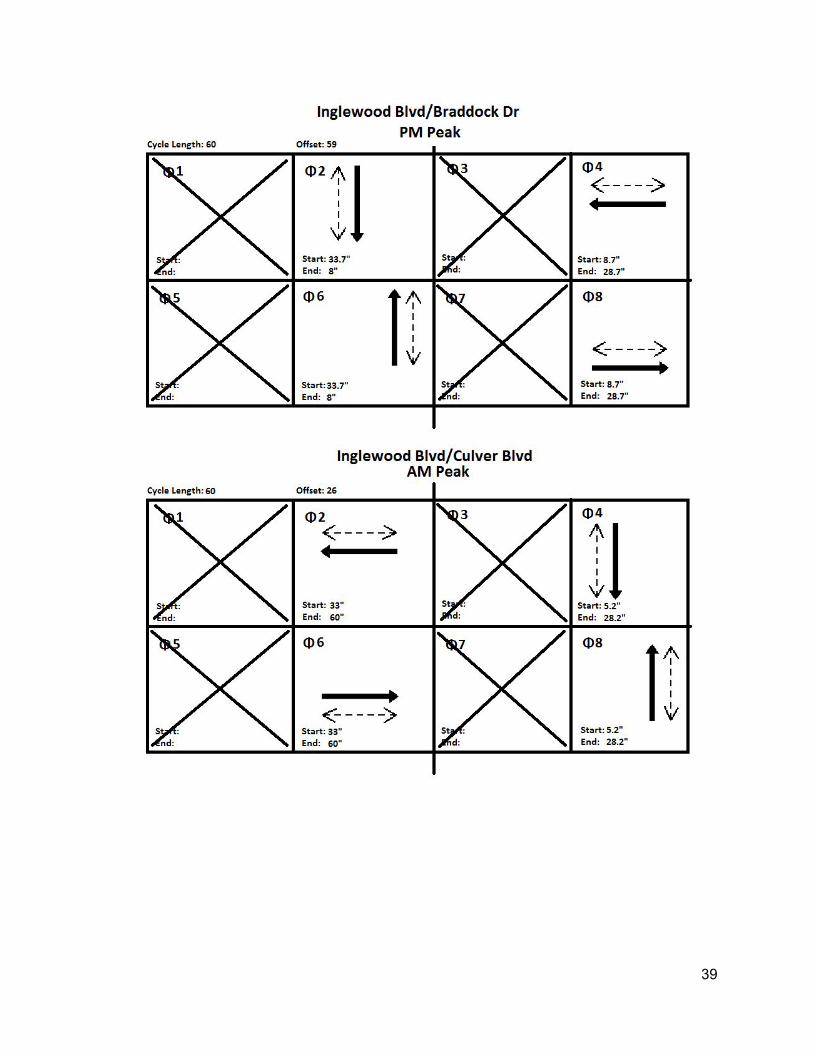
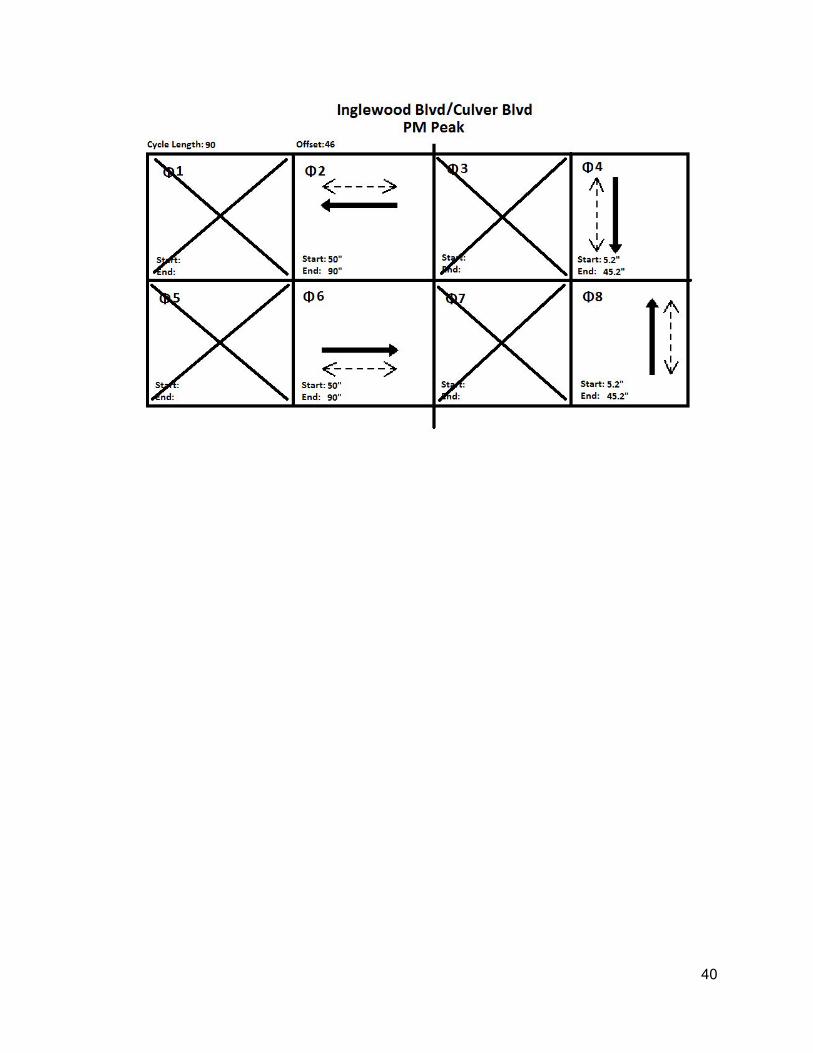
Figure E: Phase Diagrams
36
37
38
39
40
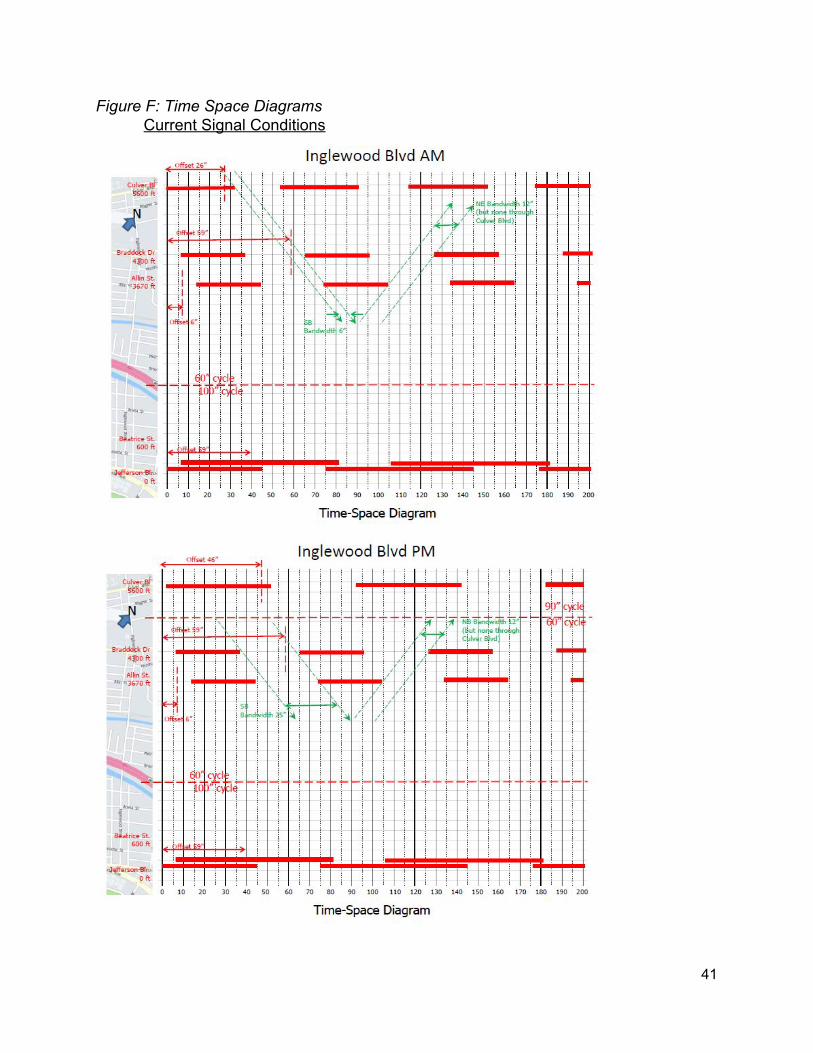
Figure F: Time Space Diagrams Current Signal Conditions
41
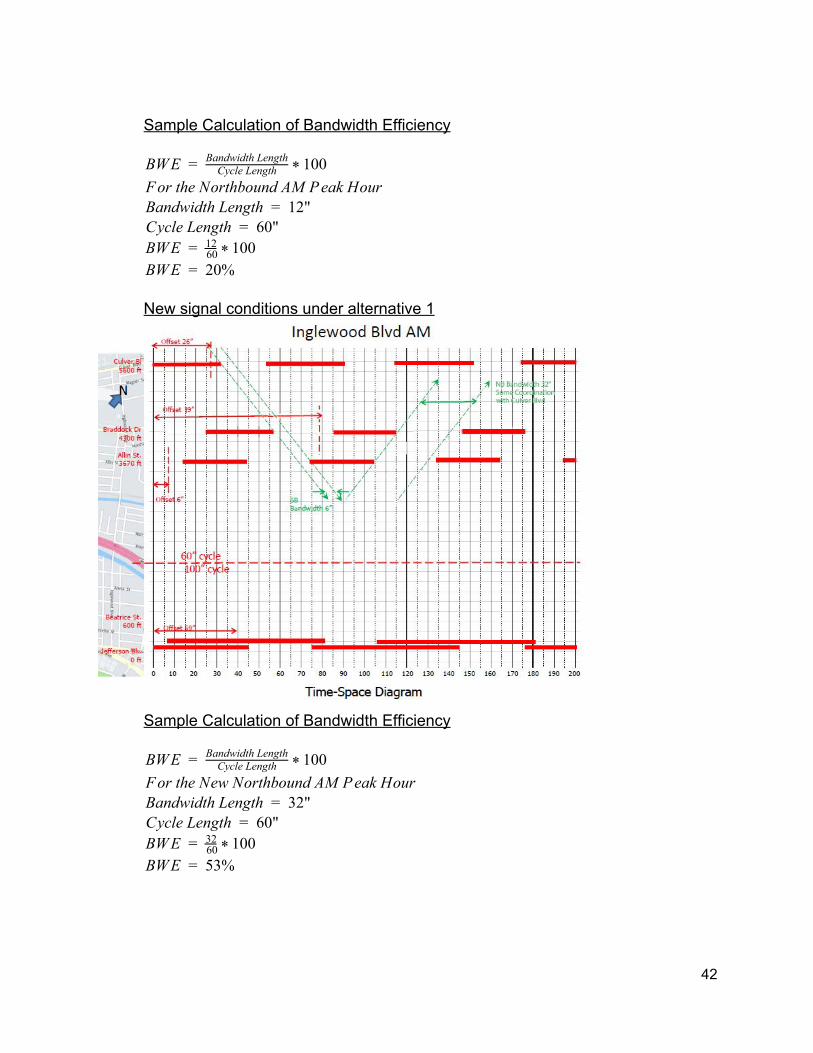
Sample Calculation of Bandwidth Efficiency WE 00B = Cycle Length
Bandwidth Length* 1
or the Northbound AM Peak Hour F andwidth Length 12" B = ycle Length 60" C = WE 00B = 60
12 * 1
WE 20% B = New signal conditions under alternative 1
Sample Calculation of Bandwidth Efficiency WE 00B = Cycle Length
Bandwidth Length* 1
or the New Northbound AM Peak Hour F andwidth Length 32" B = ycle Length 60" C = WE 00B = 60
32 * 1
WE 53% B =
42
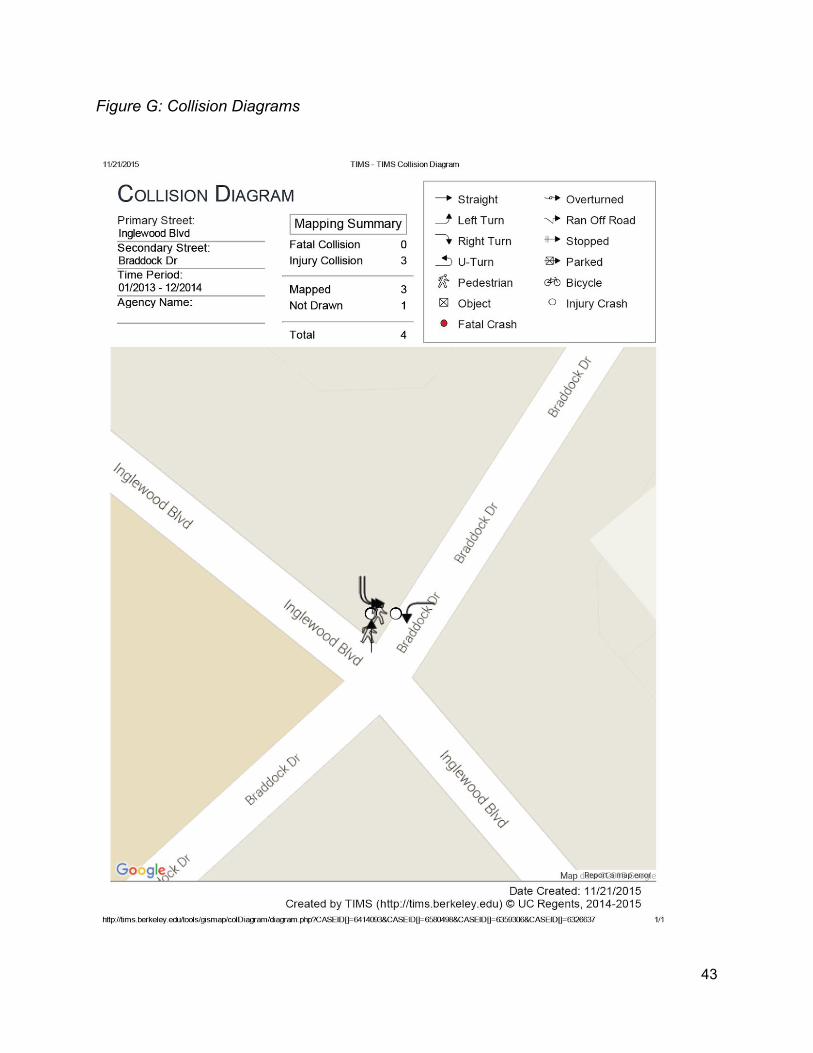
Figure G: Collision Diagrams
43
44
45
46
47
48
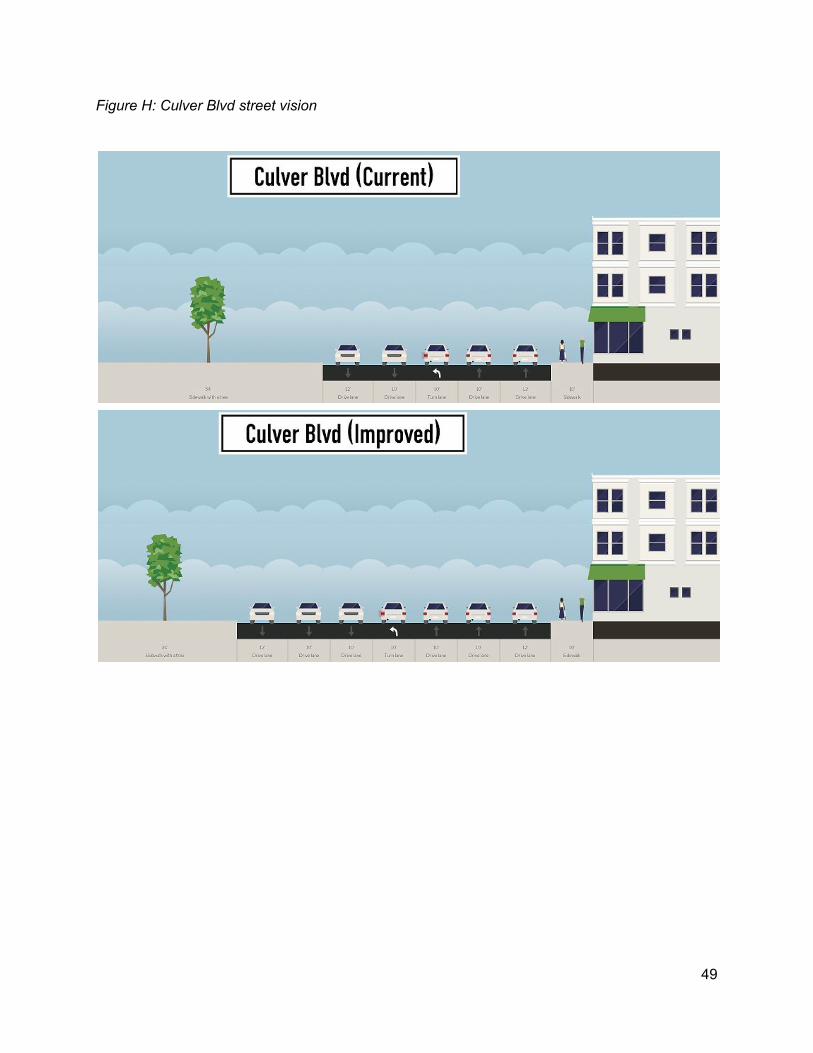
Figure H: Culver Blvd street vision
49
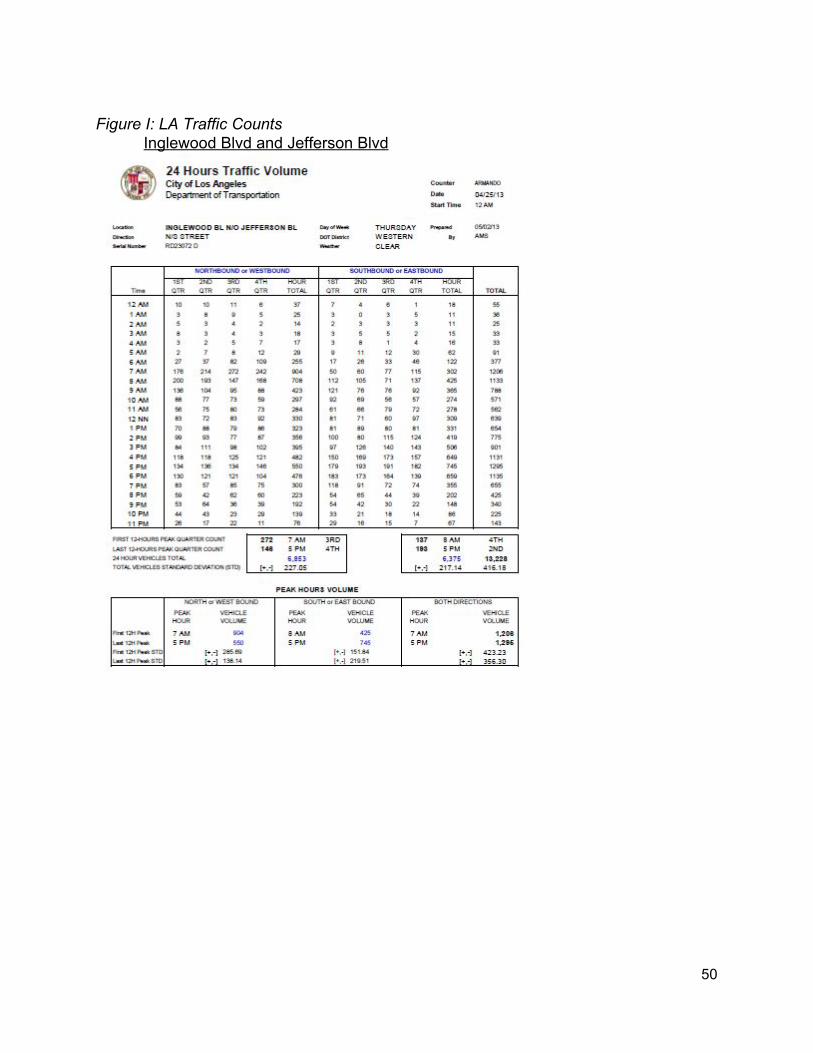
Figure I: LA Traffic Counts
Inglewood Blvd and Jefferson Blvd
50
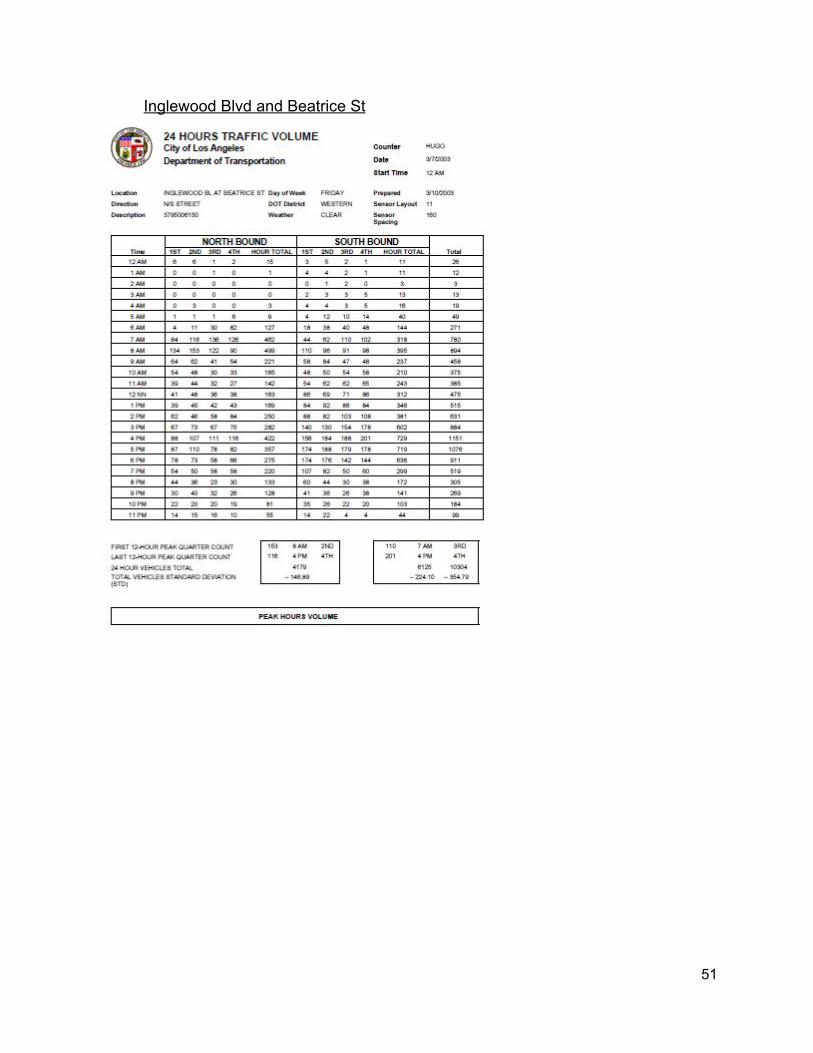
Inglewood Blvd and Beatrice St
51
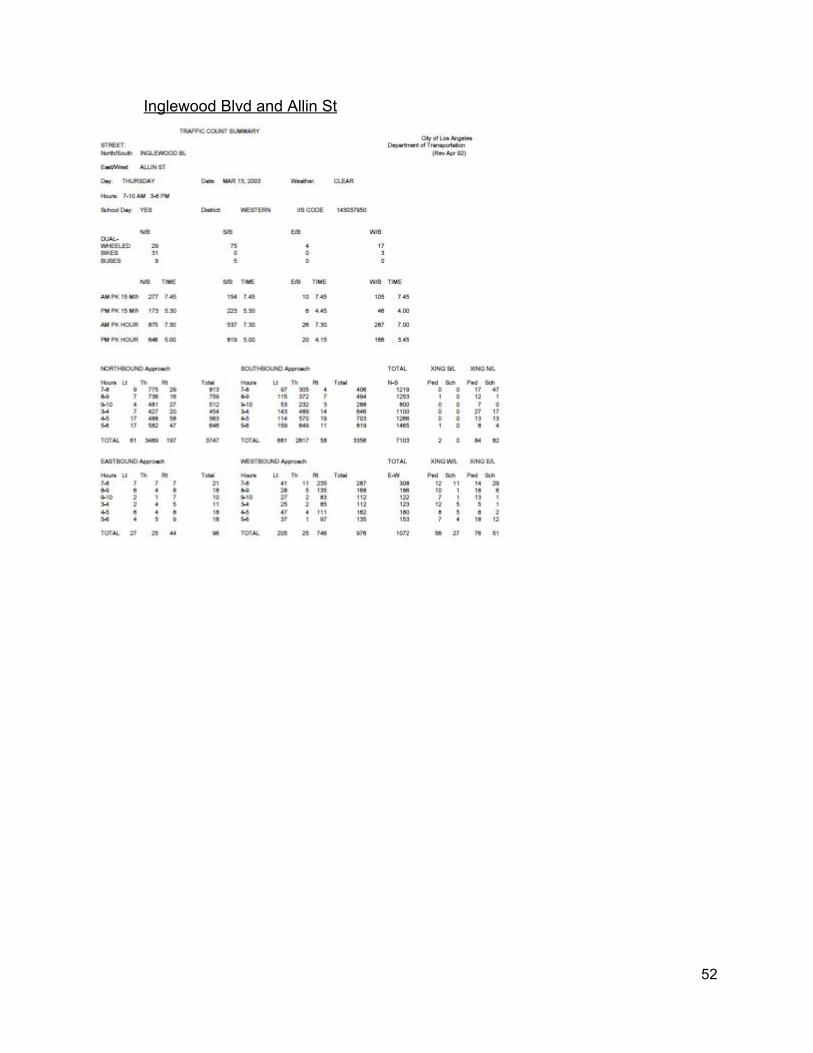
Inglewood Blvd and Allin St
52
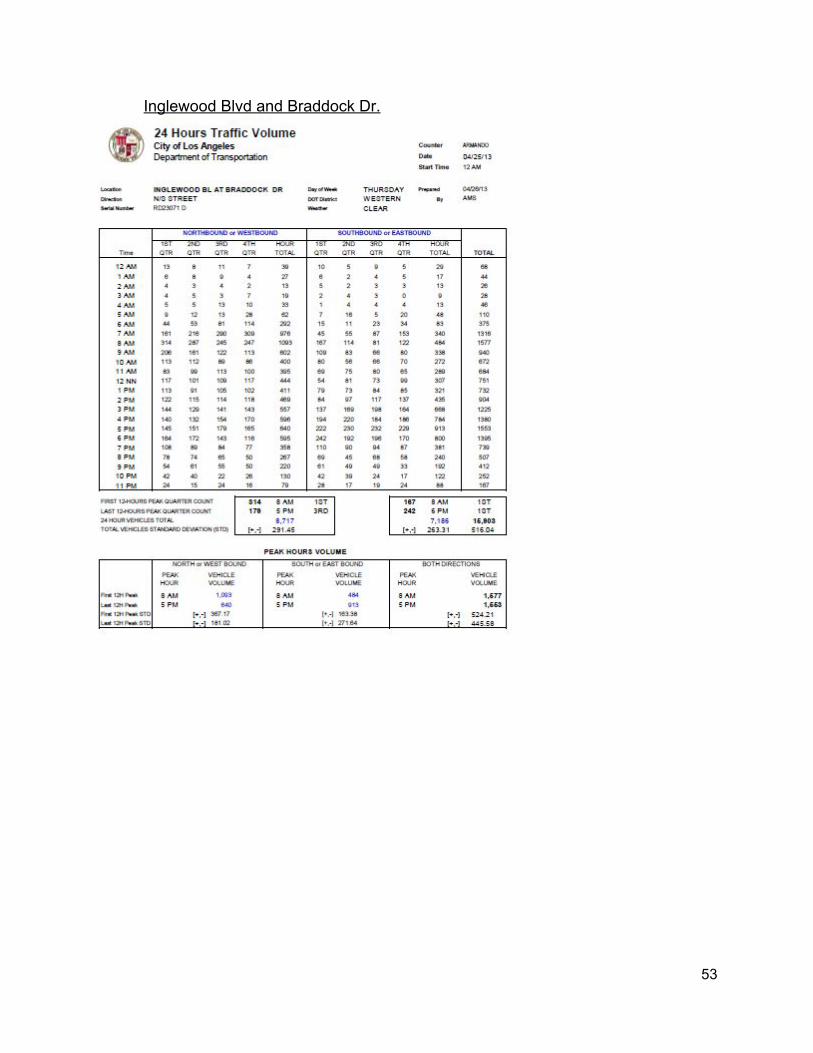
Inglewood Blvd and Braddock Dr.
53
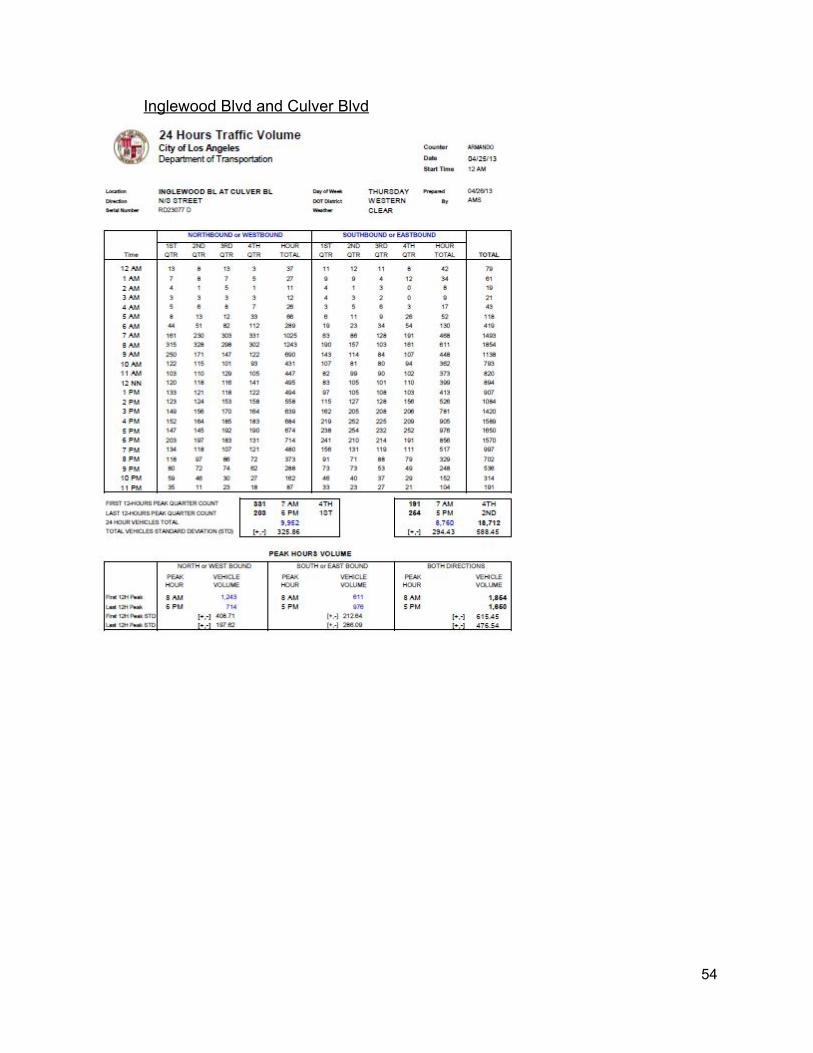
Inglewood Blvd and Culver Blvd
54