innovative electrical engineering for a...
TRANSCRIPT
THE HONG KONG
INSTITUTION OF ENGINEERS
ELECTRICAL DIVISION
The 30th Annual Symposium
Thursday
18th October 2012
INNOVATIVE ELECTRICAL ENGINEERING FORA LOW CARBON CITY
at
Ballroom
Sheraton Hotel
Nathan Road
Kowloon
Hong Kong

SYMPOSIUM PROGRAMME
08.30 Registration and Coffee
09.00 Welcome Address
– Ir Albert W.K. To
Chairman, Electrical Division, The HKIE
09.05 Opening Address
– Ir Raymond K.S. Chan
Senior Vice President, The HKIE
09.10 Keynote Speech
– Mr Liam G. O’Sullivan
Programme Director
Low Carbon London, UK
1. Green Power System Development
09.40 Operation & Maintenance Initiatives and Practices of theStandalone PV System on Town Island
– Mr Raymond Ho, Engineer I
– Mr Wilson K.W. Chan, Engineer II
East & West Region
CLP Power Hong Kong Limited
10.00 Contributing Towards a Low Carbon City – Green Initiatives byHK Electric
– Ir Raymond W.M. Choi
Chief Customer Services Engineer
The Hongkong Electric Co. Ltd.
10.20 Discussion
10.40 Coffee Break
- 1 -
- 2 -
2. Innovative Projects and Initiatives
11.10 Generation Dispatch Methodology under Low CarbonEmission Scenario
– Dr Y.H. Hou
Assistant Professor
Department of Electrical & Electronic Engineering
University of Hong Kong
11.30 Zero Carbon Building and its Key Carbon Neutrality Strategies
– Ir Dr G.Y. Li
Senior Manager (Research)
Construction Industry Council
– Ir Dr Raymond M.H. Yau, Director
Ove Arup & Partners Hong Kong Ltd.
11.50 Latest Technologies of Lighting Design to Achieve LowCarbon Living
– Mr Kelon K.K. Yan
Manager, Lighting Division
Megaman (HK) Electrical & Lighting Ltd.
12.10 Discussion
12.30 Lunch
3. Energy Efficient Railway System
14.10 Fully Automatic Operation (FAO) System Design inSouth Island Line (East) Project– Ir C.L. Leung
Chief E&M Engineer
Projects Division
MTR Corporation Limited
- 3 -
14.30 Design Considerations for High Speed Train– Ir C.S. Chan, Acting Project Manager –
Rolling Stock– Ms Sha Wong, Engineering Manager –
Rolling Stock & SignallingProjects DivisionMTR Corporation Limited
14.50 Discussion
15.10 Coffee Break
4. Towards Low Carbon Excellence
15.40 New Baseline on Energy Efficiency of Electrical Installations forLow Carbon Development– Ir Dominic S.K. Lau, Senior Engineer– Ir David W.H. Li, Engineer
Electrical & Mechanical Services DepartmentThe Government of the HKSAR
16.00 Introducing Carbon Audit for Greener Government SewageTreatment Facilities in Hong Kong– Dr Daniel T.W. Tang
Senior ChemistDrainage Services DepartmentThe Government of the HKSAR
16.20 Discussion
16.45 Summing Up– Ir Dr K.M. Leung
Symposium ChairmanElectrical Division, The HKIE
Closing Address– Ir F. Chan, JP
DirectorElectrical & Mechanical Services DepartmentThe Government of the HKSAR
- 4 -
Acknowledgement
The Electrical Division of The Hong Kong Institution of Engineers would like
to express its sincere appreciation and gratitude to the following persons and
organizations for their contributions to the Symposium :
Speakers / AuthorsMr Liam G. O’Sullivan Mr Kelon K.K. YanIr F. Chan, JP Ir C.L. LeungIr Raymond K.S. Chan Ir C.S. ChanMr Raymond Ho Ms Sha WongMr Wilson K.W. Chan Ir Dominic S.K. LauIr Raymond W.M. Choi Ir David W.H. LiDr Y.H. Hou Dr Daniel T.W. TangIr Dr G.Y. LiIr Dr Raymond M.H. Yau
Sponsors
Siemens Ltd.CLP Power Hong Kong Ltd.The Hongkong Electric Co., Ltd.Junefair Engineering Co. Ltd.Kum Shing GroupThe Jardine Engineering Corporation Ltd.Best Honor Electrical Ltd.C&K Instrument (HK) Ltd.Keystone Electric Wire & Cable Co. Ltd.Alstom Grid Ltd.MTR Corporation Ltd.Greenland Engineering Co., Ltd.Mitsubishi Electric (Hong Kong) Ltd.Meiden Pacific (China) Ltd.TE Connectivity Hong Kong Ltd.Wenden Engineering Service Co., Ltd.Metrix Engineering Co., Ltd.Chat Horn Engineering Ltd.FSE Engineering Group Ltd.Beghelli Asia Pacific Ltd.Schneider Electric (Hong Kong) LimitedThe Hong Kong & Kowloon Electric Trade AssociationHong Kong Electrical Contractors’ Association Ltd.
- 5 -
30TH ANNUAL SYMPOSIUM ORGANIZING COMMITTEE
Note :All material in this booklet is copyright and may not be reproduced in whole or in part without written permission from The Hong Kong Institution of Engineers. The views expressed are not necessary those of the Electrical Division or the Institution.
Symposium Chairman : Ir Dr K.M. Leung
Members : Ir Albert W.K. To
Ir Geoffrey L. Chan
Ir C.L. Leung
Ir Siu-Kwong Ho
Ir Sai-King Ho
Ir T.K. Chiang
Ir C.L. Wong
Ir Mandy M.Y. Leung
Ir Steve K.K. Chan
Hon. Secretary and Treasurer : Ir Y.K. Chu
Paper No. 1
OPERATION & MAINTENANCE INITIATIVES ANDPRACTICES OF THE STANDALONE PV SYSTEM ON
TOWN ISLAND
Speakers : Mr Raymond Ho, Engineer IMr Wilson K.W. Chan, Engineer IIEast & West RegionCLP Power Hong Kong Limited
- 1.1 -
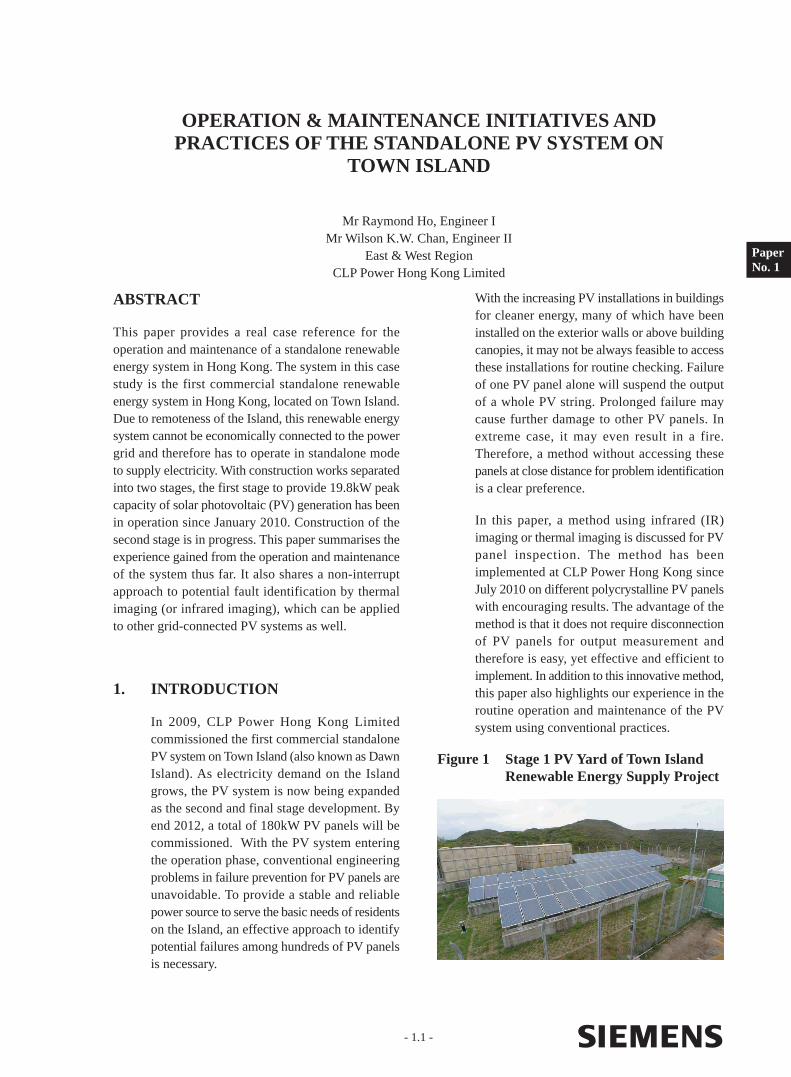
OPERATION & MAINTENANCE INITIATIVES ANDPRACTICES OF THE STANDALONE PV SYSTEM ON
TOWN ISLAND
Mr Raymond Ho, Engineer IMr Wilson K.W. Chan, Engineer II
East & West RegionCLP Power Hong Kong Limited
PaperNo. 1
ABSTRACT
This paper provides a real case reference for the operation and maintenance of a standalone renewable energy system in Hong Kong. The system in this case study is the first commercial standalone renewable energy system in Hong Kong, located on Town Island. Due to remoteness of the Island, this renewable energy system cannot be economically connected to the power grid and therefore has to operate in standalone mode to supply electricity. With construction works separated into two stages, the first stage to provide 19.8kW peak capacity of solar photovoltaic (PV) generation has been in operation since January 2010. Construction of the second stage is in progress. This paper summarises the experience gained from the operation and maintenance of the system thus far. It also shares a non-interrupt approach to potential fault identification by thermal imaging (or infrared imaging), which can be applied to other grid-connected PV systems as well.
1. INTRODUCTION
In 2009, CLP Power Hong Kong Limited commissioned the first commercial standalone PV system on Town Island (also known as Dawn Island). As electricity demand on the Island grows, the PV system is now being expanded as the second and final stage development. By end 2012, a total of 180kW PV panels will be commissioned. With the PV system entering the operation phase, conventional engineering problems in failure prevention for PV panels are unavoidable. To provide a stable and reliable power source to serve the basic needs of residents on the Island, an effective approach to identify potential failures among hundreds of PV panels is necessary.
With the increasing PV installations in buildings for cleaner energy, many of which have been installed on the exterior walls or above building canopies, it may not be always feasible to access these installations for routine checking. Failure of one PV panel alone will suspend the output of a whole PV string. Prolonged failure may cause further damage to other PV panels. In extreme case, it may even result in a fire. Therefore, a method without accessing these panels at close distance for problem identification is a clear preference.
In this paper, a method using infrared (IR) imaging or thermal imaging is discussed for PV panel inspection. The method has been implemented at CLP Power Hong Kong since July 2010 on different polycrystalline PV panels with encouraging results. The advantage of the method is that it does not require disconnection of PV panels for output measurement and therefore is easy, yet effective and efficient to implement. In addition to this innovative method, this paper also highlights our experience in the routine operation and maintenance of the PV system using conventional practices.
Figure 1 Stage 1 PV Yard of Town Island Renewable Energy Supply Project

- 1.2 -
Operation & Maintenance Initiatives and Practices of the Standalone PV System on Town Island
2. MAJOR FAILURE MODE OF CRYSTALLINE-TYPE PV PANELS
There are various reasons leading to crystalline-type PV panel failure. The failure may be caused by a single PV cell fault in a panel or by the mis-connection of panels, such assembling together different panels with different ratings. The output of the faulty panel and the string it is connected to will be affected. There are two main types of failure: open circuit fault and short circuit fault.
In case of an open circuit fault, no output will be generated from the PV panel and the PV string voltage will be lower than the normal range of values when disconnected from the PV array. When the faulty string is part of a connected array, the current will pass through the bypass diode of the failed panel. With inverter maximum power point tracking in effect, the string voltage of the faulty string will align with others as set by the inverter. The voltage across the faulty string will be adjusted to a higher voltage than the actual maximum power point voltage of that string, to meet the maximum array power. The faulty string will then generate less current and less overall power.
Bad contact problem is usually due to manufacturing defect, moisture intrusion or thermo-mechanical fatigue after years of operation. The conductivity of the ageing contact decreases and causes local heating. It limits the current output of that PV panel. For new type back-contact PV panels, contact ageing cannot easily be observed during a regular visual inspection. With further contact ageing, a shunting path within a PV cell and short circuit may form.
A PV cell with short circuit fault generates abnormal voltage. With the inverter voltage control, other healthy PV cells in the string will generate higher voltages, hence lowering the overall power. The higher voltage can also reverse-bias the faulty PV cell causing local heating. In some cases, destructive effects, such as degradation of PV cells, solder melting or glass cracking, may result.
The effect of shading will be similar to the situation of a short-circuited PV cell. The shaded PV cell will generate less current, limiting the overall power. Usually, the partial shading is not permanent and will cause less damage to the panel.
3. CONVENTIONAL MAINTENANCE METHOD FOR PV PANELS
Compared with that of other major electrical equipment, e.g. transformers and switchgears, the immediate effect of PV panel failure on the power system is less significant. Lower system output than the expected generation target (or carbon footprint target) is the most direct impact. However, the failure if unattended may develop into a fire incident and cause severe damage. It is therefore important to perform regular maintenance to mitigate the risk. But in many smaller scale PV facilities, the maintenance works are overseen by owners themselves who are generally lacking adequate technical knowledge and support, such as schools and non-profit making organisations.
As recommended by manufacturers, the maintenance of PV panels should include regular visual inspection and cleaning. Through the visual inspection, physical damages and contaminations can be observed. It is also suggested to carry out routine voltage and current measurements. These values can be obtained from the inverter data log or from site measurement.
The values will be compared with the manufacturer-declared performance range. When an array is identified with abnormal data, an open circuit voltage test to the array is required to pin-point the fault. The process from data analysis to the voltage test requires technical knowledge of PV systems.
To perform the open circuit voltage test, the array has to be isolated from the system during which the system output will be affected. The test on every string in an array takes hours and has to be conducted under sufficient and stable
- 1.3 -
Operation & Maintenance Initiatives and Practices of the Standalone PV System on Town Island
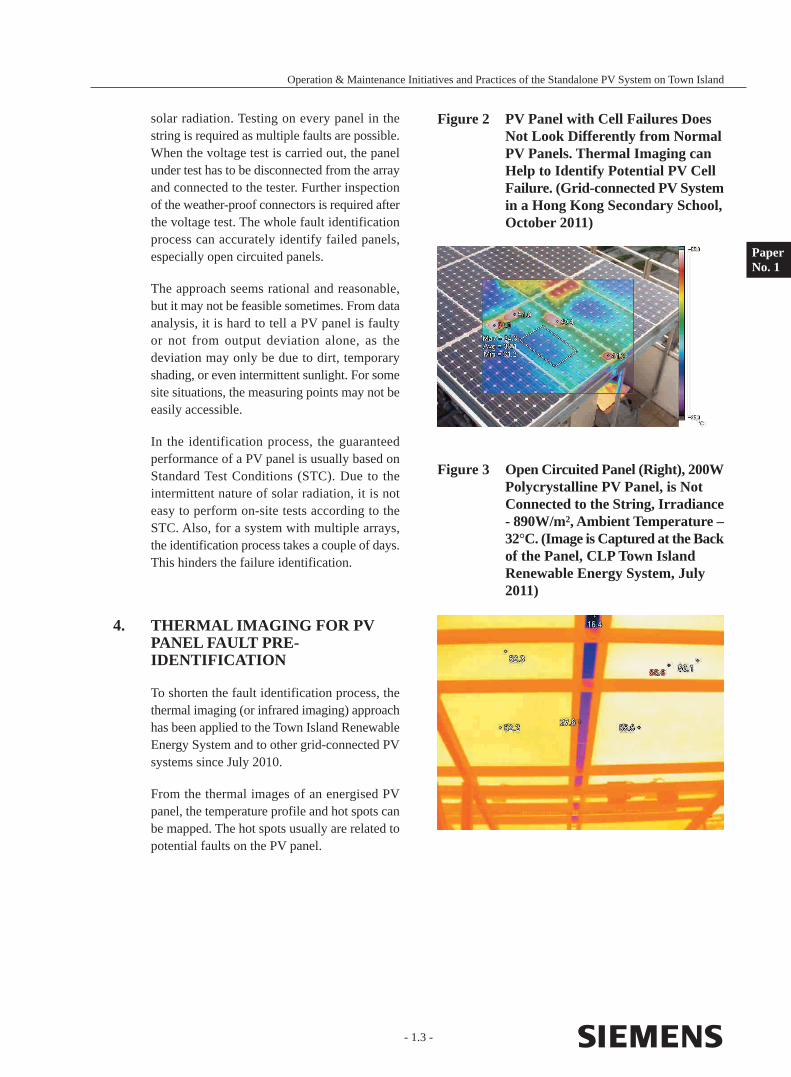
solar radiation. Testing on every panel in the string is required as multiple faults are possible. When the voltage test is carried out, the panel under test has to be disconnected from the array and connected to the tester. Further inspection of the weather-proof connectors is required after the voltage test. The whole fault identification process can accurately identify failed panels, especially open circuited panels.
The approach seems rational and reasonable, but it may not be feasible sometimes. From data analysis, it is hard to tell a PV panel is faulty or not from output deviation alone, as the deviation may only be due to dirt, temporary shading, or even intermittent sunlight. For some site situations, the measuring points may not be easily accessible.
In the identification process, the guaranteed performance of a PV panel is usually based on Standard Test Conditions (STC). Due to the intermittent nature of solar radiation, it is not easy to perform on-site tests according to the STC. Also, for a system with multiple arrays, the identification process takes a couple of days. This hinders the failure identification.
4. THERMAL IMAGING FOR PV PANEL FAULT PRE-IDENTIFICATION
To shorten the fault identification process, the thermal imaging (or infrared imaging) approach has been applied to the Town Island Renewable Energy System and to other grid-connected PV systems since July 2010.
From the thermal images of an energised PV panel, the temperature profile and hot spots can be mapped. The hot spots usually are related to potential faults on the PV panel.
PaperNo. 1
Figure 2 PV Panel with Cell Failures Does Not Look Differently from Normal PV Panels. Thermal Imaging can Help to Identify Potential PV Cell Failure. (Grid-connected PV System in a Hong Kong Secondary School, October 2011)
Figure 3 Open Circuited Panel (Right), 200W Polycrystalline PV Panel, is Not Connected to the String, Irradiance - 890W/m2, Ambient Temperature – 32°C. (Image is Captured at the Back of the Panel, CLP Town Island Renewable Energy System, July 2011)
- 1.4 -
Operation & Maintenance Initiatives and Practices of the Standalone PV System on Town Island
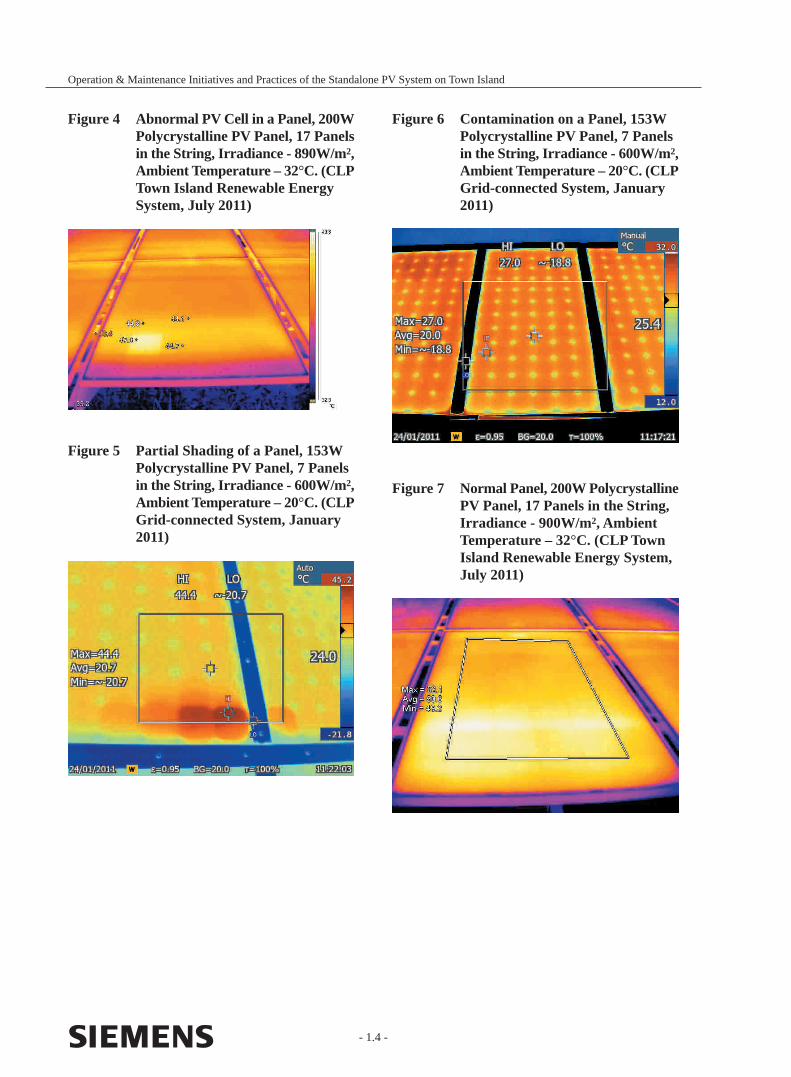
Figure 4 Abnormal PV Cell in a Panel, 200W Polycrystalline PV Panel, 17 Panels in the String, Irradiance - 890W/m2, Ambient Temperature – 32°C. (CLP Town Island Renewable Energy System, July 2011)
Figure 5 Partial Shading of a Panel, 153W Polycrystalline PV Panel, 7 Panels in the String, Irradiance - 600W/m2, Ambient Temperature – 20°C. (CLP Grid-connected System, January 2011)
Figure 6 Contamination on a Panel, 153W Polycrystalline PV Panel, 7 Panels in the String, Irradiance - 600W/m2, Ambient Temperature – 20°C. (CLP Grid-connected System, January 2011)
Figure 7 Normal Panel, 200W Polycrystalline PV Panel, 17 Panels in the String, Irradiance - 900W/m2, Ambient Temperature – 32°C. (CLP Town Island Renewable Energy System, July 2011)
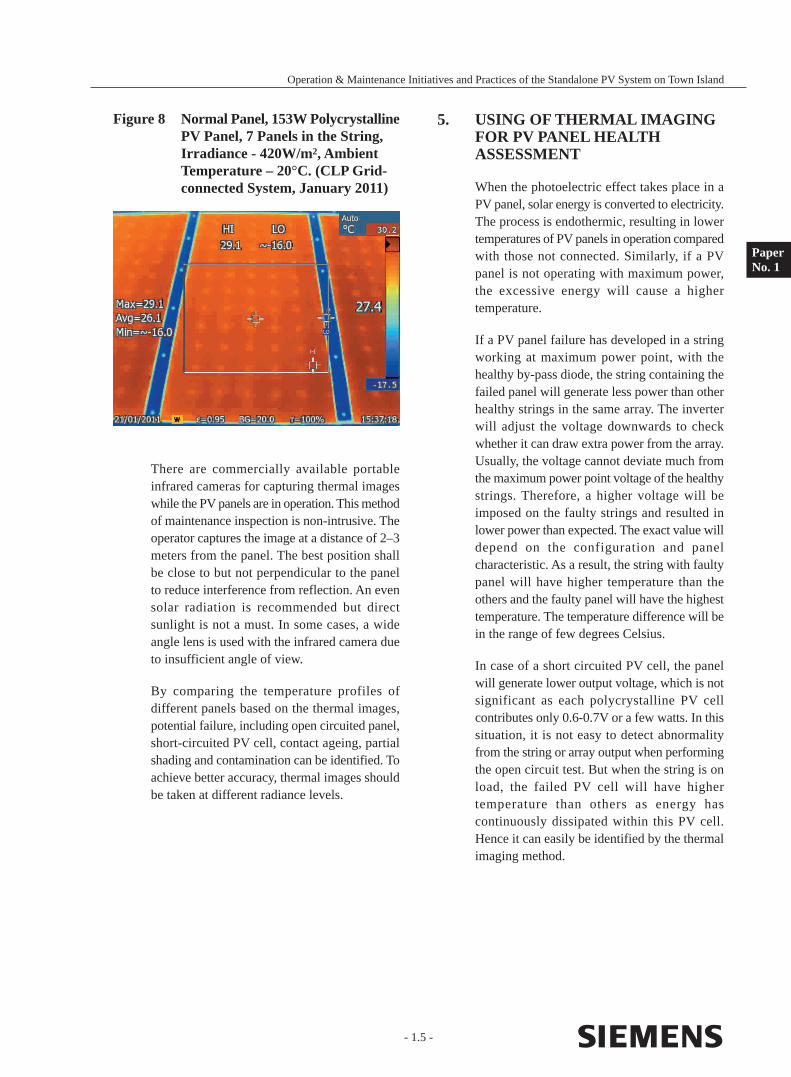
There are commercially available portable infrared cameras for capturing thermal images while the PV panels are in operation. This method of maintenance inspection is non-intrusive. The operator captures the image at a distance of 2–3 meters from the panel. The best position shall be close to but not perpendicular to the panel to reduce interference from reflection. An even solar radiation is recommended but direct sunlight is not a must. In some cases, a wide angle lens is used with the infrared camera due to insufficient angle of view.
By comparing the temperature profiles of different panels based on the thermal images, potential failure, including open circuited panel, short-circuited PV cell, contact ageing, partial shading and contamination can be identified. To achieve better accuracy, thermal images should be taken at different radiance levels.
- 1.5 -
Operation & Maintenance Initiatives and Practices of the Standalone PV System on Town Island
Figure 8 Normal Panel, 153W Polycrystalline PV Panel, 7 Panels in the String, Irradiance - 420W/m2, Ambient Temperature – 20°C. (CLP Grid-connected System, January 2011)
PaperNo. 1
5. USING OF THERMAL IMAGING FOR PV PANEL HEALTH ASSESSMENT
When the photoelectric effect takes place in a PV panel, solar energy is converted to electricity. The process is endothermic, resulting in lower temperatures of PV panels in operation compared with those not connected. Similarly, if a PV panel is not operating with maximum power, the excessive energy will cause a higher temperature.
If a PV panel failure has developed in a string working at maximum power point, with the healthy by-pass diode, the string containing the failed panel will generate less power than other healthy strings in the same array. The inverter will adjust the voltage downwards to check whether it can draw extra power from the array. Usually, the voltage cannot deviate much from the maximum power point voltage of the healthy strings. Therefore, a higher voltage will be imposed on the faulty strings and resulted in lower power than expected. The exact value will depend on the configuration and panel characteristic. As a result, the string with faulty panel will have higher temperature than the others and the faulty panel will have the highest temperature. The temperature difference will be in the range of few degrees Celsius.
In case of a short circuited PV cell, the panel will generate lower output voltage, which is not significant as each polycrystalline PV cell contributes only 0.6-0.7V or a few watts. In this situation, it is not easy to detect abnormality from the string or array output when performing the open circuit test. But when the string is on load, the failed PV cell will have higher temperature than others as energy has continuously dissipated within this PV cell. Hence it can easily be identified by the thermal imaging method.
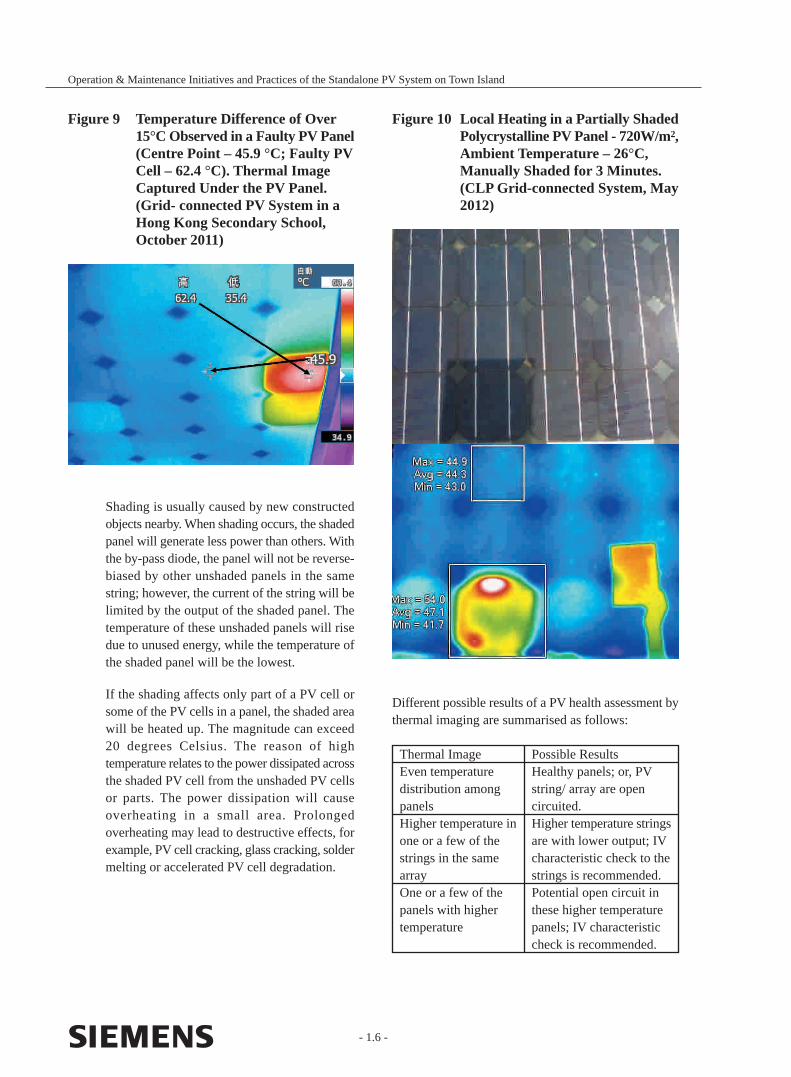
Shading is usually caused by new constructed objects nearby. When shading occurs, the shaded panel will generate less power than others. With the by-pass diode, the panel will not be reverse-biased by other unshaded panels in the same string; however, the current of the string will be limited by the output of the shaded panel. The temperature of these unshaded panels will rise due to unused energy, while the temperature of the shaded panel will be the lowest.
If the shading affects only part of a PV cell or some of the PV cells in a panel, the shaded area will be heated up. The magnitude can exceed 20 degrees Celsius. The reason of high temperature relates to the power dissipated across the shaded PV cell from the unshaded PV cells or parts. The power dissipation will cause overheating in a small area. Prolonged overheating may lead to destructive effects, for example, PV cell cracking, glass cracking, solder melting or accelerated PV cell degradation.
Thermal ImageEven temperature distribution among panelsHigher temperature in one or a few of the strings in the same arrayOne or a few of the panels with higher temperature
Possible ResultsHealthy panels; or, PV string/ array are open circuited.Higher temperature strings are with lower output; IV characteristic check to the strings is recommended.Potential open circuit in these higher temperature panels; IV characteristic check is recommended.
- 1.6 -
Operation & Maintenance Initiatives and Practices of the Standalone PV System on Town Island
Figure 9 Temperature Difference of Over 15°C Observed in a Faulty PV Panel (Centre Point – 45.9 °C; Faulty PV Cell – 62.4 °C). Thermal Image Captured Under the PV Panel. (Grid- connected PV System in a Hong Kong Secondary School, October 2011)
Figure 10 Local Heating in a Partially Shaded Polycrystalline PV Panel - 720W/m2, Ambient Temperature – 26°C, Manually Shaded for 3 Minutes. (CLP Grid-connected System, May 2012)
Different possible results of a PV health assessment by thermal imaging are summarised as follows:
7. OTHER ABNORMALITIES OF PV PANELS
PV warranties typically allow for 20% output degradation during the 25-year warranty life. It is widely known that the performance of PV panels installed outdoor decreases steadily over time. The yearly degradation rate must be less than 0.5% in order to provide the present 25-year power warranty (at least 80% of its initial nominal power) or longer.
During the first year, higher degradation rates were observed in some studies and these handicaps were usually irreversible. As statistics show, degradation, if occurs, tends to appear early rather than late (~3% degradation rate in first few years to ~0.3% by 50 years).
The defects and abnormal degradation increase operating cost significantly. A PV system that cannot generate the expected level of output will result in lower returns. Prolonged defects may cause accelerated performance degradation and lead to safety risk. There are three main cost considerations for carrying out immediate defect rectification or not recognising that panels with minor failures can usually continue to operate for years: the replacement cost, cost due to reduced power production, and increased operation and maintenance costs associated with the potential defective units.
The replacement cost per watt should be estimated basing on, but not limited to, dismantling and installation cost, transportation cost, material cost, and labour cost. There is another consideration on PV panel mismatching after replacement. With technology advancement, new panels usually do not have the same specification as the faulty ones. The replacement of a panel may result in new supporting structure, wiring and even a new inverter. For better control of maintenance cost, it is necessary to monitor panel performance regularly for advance planning. Sample tests in maintenance will be more effective for a given large-scale installation.
In addition to PV cell condition, there are other factors affecting the performance and endurance of the PV system.
Higher temperature in one or a few of the cells with sharp image edgeHigher temperature in one or a few of cells with blurred or uneven edgeTiny hot spots on the panel
Hot spot at the bypass diode boxHigh temperature at the bypass diode box
Cell failure; IV characteristic check is recommended.
Partial shading; Inspection to identify potential shading object.
Surface contamination; or,short circuit path developed within cell.Cleaning of dirt; and detailed inspection required.Bypass diode failure;Panel replacement needed.Panel voltage mismatch, potential panel failure;IV characteristic check is recommended.
*Panels shall be operated at maximum power point when carrying out thermal imaging analysis.
- 1.7 -
Operation & Maintenance Initiatives and Practices of the Standalone PV System on Town Island
The thermal imaging method has a clear advantage in cell and panel level investigation in a non-intrusive manner. It can be applied to different site situations. In particular, uneven heating may not be a failure in itself but is a sign of early deterioration. This demonstrates the value of thermal imaging for early fault detection and prevention.
6. ON SITE APPLICATION OF I-V CURVE TESTER
In addition to thermal imaging, an I-V curve test is applied to check the current and voltage characteristics of a PV string. A portable I-V curve analyser with pyranometer and thermocouples is used. This tool helps to analyse the performance of PV strings and to identify potential degradation of PV panels. Latest analyser models are more light-weighed and can support applications at the panel level. The I-V analysis is very useful to evaluate the PV system condition when the operation history and solar irradiance records are insufficient.
PaperNo. 1
8. SUGGESTED ROUTINE MAINTENANCE
PV systems are generally regarded as maintenance free and environment-friendly. However, if no routine maintenance is performed, system degradation or even discarding of failed PV modules will result. A PV system unable to operate at its rated power can no longer be regarded as environment-friendly. Routine maintenance is necessary to ensure that the solar system performs in line with the service standard. In addition to conventional maintenance practices, an enhanced routine maintenance method is carried out for the Town Island PV System as per the following:
8.1 CONTINUOUS
Observe abnormal low power output, abnormal voltage or current output, and warning from the inverter log. Make a necessary response according to the alarm warning.
8.2 MONTHLY TO QUARTERLY
Perform visual inspection for accumulation of dirt, bird droppings, shading and abnormalities on the PV system.
Check PV panels visually for defects and abnormality including burnt marks, cracks, fractures, discolouring, deformation and rusting of panel frameworks and structures. PV panels with defects should be further investigated to
Abnormality on the wiring and earthing of the PV panel can easily be identified. On the PV panel, ageing panel sealing will cause water ingress. The aluminium frame of the PV panel may suffer from corrosion caused usually by the bi-metal effect across its contact with the support metal structure. Proper insulation between the panel and the structure shall be applied.
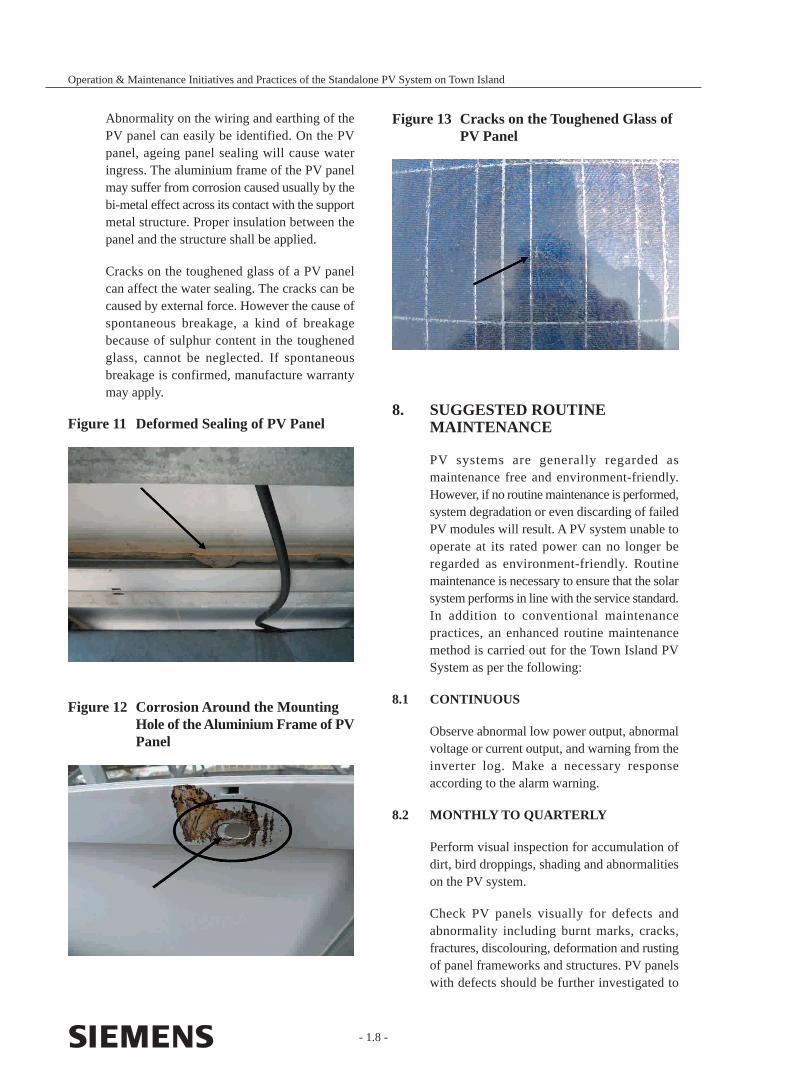
Cracks on the toughened glass of a PV panel can affect the water sealing. The cracks can be caused by external force. However the cause of spontaneous breakage, a kind of breakage because of sulphur content in the toughened glass, cannot be neglected. If spontaneous breakage is confirmed, manufacture warranty may apply.
Figure 11 Deformed Sealing of PV Panel
- 1.8 -
Operation & Maintenance Initiatives and Practices of the Standalone PV System on Town Island
Figure 13 Cracks on the Toughened Glass of PV Panel
Figure 12 Corrosion Around the Mounting Hole of the Aluminium Frame of PV Panel
Replacement depends on several factors, such as replacement cost, system output performance, transportation cost, system capacity...etc. It involves detailed calculation and will not be discussed in this paper. Prior to performing any maintenance, follow the safety practices as specified in the PV system’s operation procedures. Precautions should be taken to minimise the hazards when undertaking any maintenance.
9. SAFETY PRECAUTIONS OF PV SYSTEM MAINTENANCE
Local electricians are experienced in handling alternating current systems. However, a PV system is a direct current system usually with higher voltage and some systems may be connected in special grounding arrangement. Additional safety precautions shall be taken:
9.1 PERSONAL PROTECTIVE EQUIPMENT (PPE)
The voltage of a PV array can reach 600V, and in some special cases, near 1000V. The electrician shall use PPE with a suitable insulation level.
9.2 TOOLS AND MATERIALS
The switches and cables used in a PV system shall be able to withstand the DC voltage of the PV system and the strong sunlight environment. The electrician shall select suitable tools and materials when carrying out replacement during maintenance.
9.3 SPECIAL GROUNDING ARRANGEMENT
Some PV systems require positive or negative grounding connections. The electrician shall understand the system arrangement and select appropriate earthing connection before carrying out their work on a PV system.
9.4 EMERGENCY HANDLING
Unlike a conventional electrical system, a PV system cannot be shut down, as the PV array will always generate electricity when the sun shines. The capacitors inside the inverters may
determine the need for replacement.
Connection boxes, junctions of wiring and earthing should also be checked for connection conditions and the integrity of cable sealing and conduits. If water has accumulated, verify the functions of components. Bypass diodes, blocking diodes of PV strings and surge arresters should also be verified.
Verify the integrity and operations of protective devices including fuses, circuit breakers, RCDs, earth fault protection systems and isolation devices.
Perform thermal scans to observe abnormal hotspots on PV panels and wirings. Failed panels and panels with unnoticed dusts will have higher temperature. PV performance can be preliminarily evaluated by the IR test and the results can be used for further analysis.
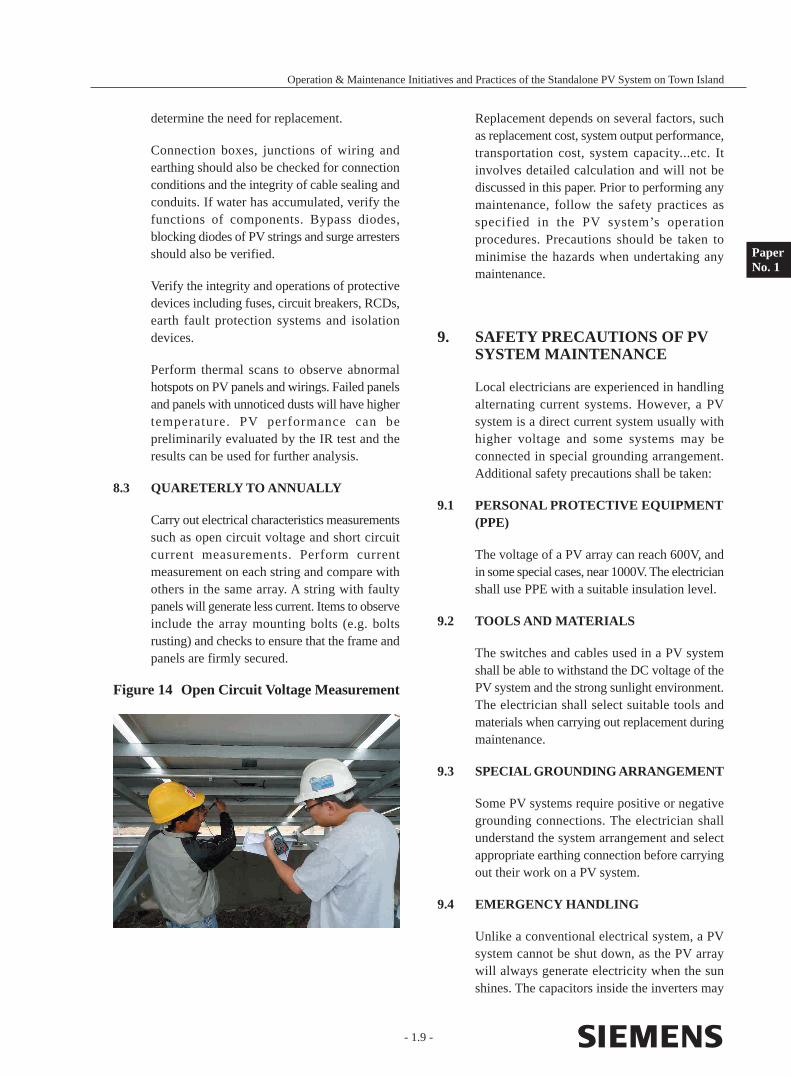
8.3 QUARETERLY TO ANNUALLY
Carry out electrical characteristics measurements such as open circuit voltage and short circuit current measurements. Perform current measurement on each string and compare with others in the same array. A string with faulty panels will generate less current. Items to observe include the array mounting bolts (e.g. bolts rusting) and checks to ensure that the frame and panels are firmly secured.
Figure 14 Open Circuit Voltage Measurement
- 1.9 -
Operation & Maintenance Initiatives and Practices of the Standalone PV System on Town Island
PaperNo. 1
An integral, encapsulated unit containing a number of PV cells.
Photovoltaic (PV) Cell – The treated semiconductor material that converts solar irradiance to electricity.
Infrared Camera – The camera captures thermal images based on infrared radiation.
REFERENCES
[1] Manuel Va’zquez and Ignacio Rey-Stolle – Photovoltaic Module Reliability Model Based on Field Degradation Studies. Prog. Photovolt: Res. Appl. 2008; 16:419 – 43
[2] D. L. King, J. A. Kratochvil, M. A. Quintana, and T. J. McMahon – Applications for Infrared Imaging Equipment in Photovoltaic Cell, Module, and System Testing
[3] Chris Deline – Partially Shaded Operation Of A Grid-Tied PV System
[4] G. Acciani, G.B. Simione and S. Vergura – Thermographic Analysis of Photovoltaic Modules
[5] W. Herrmann, W. Wiesner, W. Vaaßen – Hot Spot Investigations on PV Modules - New Concepts for a Test Standard and Consequences for Module Design with Respect to Bypass Diodes
[6] Electrical and Mechanical Services Department, HKSAR – Code of Practice for the Electricity (Wiring) Regulations
[7] National Fire Protection Association, United States – National Electrical Code Handbook
[8] North American Board of Certified Energy Practitioners, United States – Solar PV Installer Job Task Analysis
[9] IEC61724 Photovoltaic System Performance Monitoring – Guidelines for Measurement, Data Exchange and Analysis
also store energy. Electricians shall always treat all wiring and components as energised, especially when handling potential fault.
10. CONCLUSION
In this paper, a method using infrared (IR) imaging or thermal imaging is proposed for PV panel failure pre-identification and has been implemented with encouraging results. Disconnection of PV panels for output measurement is not required. This can provide an easy, effective and efficient approach to potential failure identification. In addition, this paper also covers our practices in the routine operation and maintenance of the PV system and the associated safe working precautions.
ACKNOWLEDGEMENT
The commissioning of the renewable energy system on Town Island mentioned in this paper is the result of concerted efforts of multiple stakeholders, including the Agriculture, Fisheries and Conservation Department, the Electrical and Mechanical Services Department, the Environmental Protection Department, the Lands Department, the Sai Kung District Council, and many anonymous persons and parties. The authors gratefully acknowledge the contributions of the Town Island Drug Treatment & Rehabilitation Centre for their support during the construction and operation of the system. Last but not least, the authors would like to thank CLP Power management for its support in publishing this paper.
GLOSSARY
Array – A collection of electrically connected photovoltaic (PV) string.
String – A designation for a number of PV panels assembled in a single mechanical frame.
Panel – The smallest replaceable unit in a PV array.
- 1.10 -
Operation & Maintenance Initiatives and Practices of the Standalone PV System on Town Island

NOTES
1. The Town Island Renewable Energy Supply System is one of the renewable energy projects at CLP Power Hong Kong Limited. CLP Power Hong Kong is the largest electric utility in Hong Kong supplying Kowloon, the New Territories, Lantau Island and most of the outlying islands. Operating a vertically integrated electricity generation, transmission and distribution business, CLP Power Hong Kong provides a highly reliable electricity supply and excellent services to over 5.5 million people in its supply area.
2. CLP Power Hong Kong is a wholly owned subsidiary of CLP Holdings Limited. Outside Hong Kong, CLP Holdings also invests in energy businesses in Mainland China, Australia, India and Southeast Asia. It is the largest external investor in the Chinese Mainland in electricity generation, and a leading international private sector power company in Asia Pacific, with a diversified portfolio of power generation assets producing gas fired, coal fired, hydro, renewable and nuclear energy.
- 1.11 -
Operation & Maintenance Initiatives and Practices of the Standalone PV System on Town Island
PaperNo. 1

- Notes and Questions -
Paper No. 2
CONTRIBUTING TOWARDS A LOW CARBON CITY —GREEN INITIATIVES BY HK ELECTRIC
Speaker : Ir Raymond W.M. ChoiChief Customer Services EngineerThe Hongkong Electric Co. Ltd.
- 2.1 -
CONTRIBUTING TOWARDS A LOW CARBON CITY —GREEN INITIATIVES BY HK ELECTRIC
Ir Raymond W.M. ChoiChief Customer Services EngineerThe Hongkong Electric Co. Ltd.
PaperNo. 2
ABSTRACT
At HK Electric, lowering carbon emissions continues to be one of the most important goals in our pursuit for sustainability. Working towards carbon reduction, we have implemented many green initiatives and the following are illustrations of what a socially responsible power company like HK Electric has done in the quest for carbon reduction:
• Acting as a Responsible Corporate Citizen – Reducing carbon starts from within
• Engaging and Partnering with Customers – Assisting others to reduce their carbon footprint
• Low Carbon Initiatives and Designs on the Transmission & Distribution Network – How our equipment and station design helps to lower carbon
• Global Initiatives – What other Power Assets’ companies are doing for the environment
• Looking Ahead – Plans for the future
This paper expands on each of these areas detailing the many ways that HK Electric contributes to a Low Carbon City.
1. INTRODUCTION
Carbon dioxide is considered to be the greenhouse gas (GHG) that contributes the most to global warming. Some carbon dioxide is necessary in the atmosphere to maintain a habitable environment otherwise it would be too cold. However, human activities such as burning fossil fuels, deforestation, industrial and transportation emissions have increased the carbon dioxide concentration in the atmosphere leading to global warming.
Recognizing the need to lower carbon, HK Electric has undertaken many initiatives related to carbon reduction in our pursuit for sustainability.
2. ACTING AS A RESPONSIBLE CORPORATE CITIZEN
At HK Electric, we believe that lowering carbon starts from within. With this in mind, we have implemented many low carbon initiatives internally driven by the commitment of management and our staff.
2.1 ATTITUDE
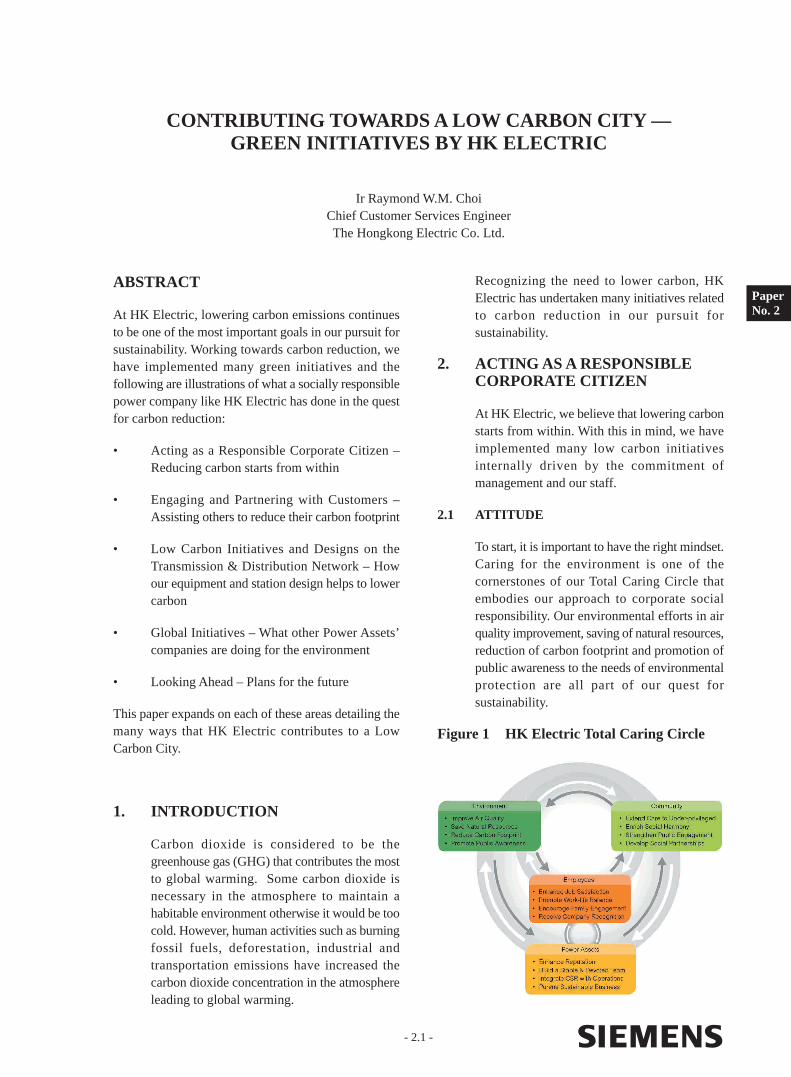
To start, it is important to have the right mindset. Caring for the environment is one of the cornerstones of our Total Caring Circle that embodies our approach to corporate social responsibility. Our environmental efforts in air quality improvement, saving of natural resources, reduction of carbon footprint and promotion of public awareness to the needs of environmental protection are all part of our quest for sustainability.
Figure 1 HK Electric Total Caring Circle
- 2.2 -
Contributing Towards a Low Carbon City — Green Initiatives by HK Electric
HK Electric also has an Environmental Policy that serves as a foundation for our endeavors to protect and care for the environment.
2.2 SHOWING OUR COMMITMENT
In showing our commitment towards the environment and reducing carbon, we are actively engaged with external organizations to benchmark our performance.
• The internationally recognized Carbon Disclosure Project (CDP) is an independent not-for-profit organization based in the UK working to drive greenhouse gas emissions reduction and sustainable water use by business and cities.
As a participant in the Carbon Disclosure Project (CDP) since 2005, HK Electric under Power Assets has been reporting annually our greenhouse gas (GHG) emissions and our efforts in reducing GHG emissions. In 2011, Power Assets topped the list of 15 Hong Kong companies in the CDP in terms of carbon reduction and public disclosure. In addition, Power Assets was named as one of the two Carbon Performance Leaders out of 109 responding companies in the region and the only Hong Kong company that qualified for the Highest Performance Band (“A”) in CDP’s Asia ex-Japan Report 2011.
• With buildings accounting for some 89% of the electricity consumed in Hong Kong, the Hong Kong SAR Governmen t ’s Environmental Protection Department (EPD) has established the Carbon Reduction Charter to encourage organizations to carry out activities in support of GHG emission reduction. As a signatory to the Carbon Reduction Charter, we support “Green Hong Kong • Carbon Audit” as a “Carbon Audit • Green Partner”. We conduct regular carbon audits in specific office premises and implement a wide range of low carbon measures in our workplace. Compared with the baseline year of 2007, we achieved an overall 20% reduction in carbon footprint for our Head Office building.
• The Manifesto for Energy Efficiency in
Buildings organized by the World Business Council for Sustainable Development is another initiative that aims to reduce energy use and carbon emissions from commercial buildings. In November 2011, a task force was set up to implement requirements of this Manifesto.
• We have also commissioned an independent accreditation body to verify our GHG assertions for our electricity supply operations in Hong Kong following the ISO 14064 standard, with a view to enhancing the transparency and disclosure of our GHG emissions inventory.
2.3 REDUCING CARBON IN POWER GENERATION
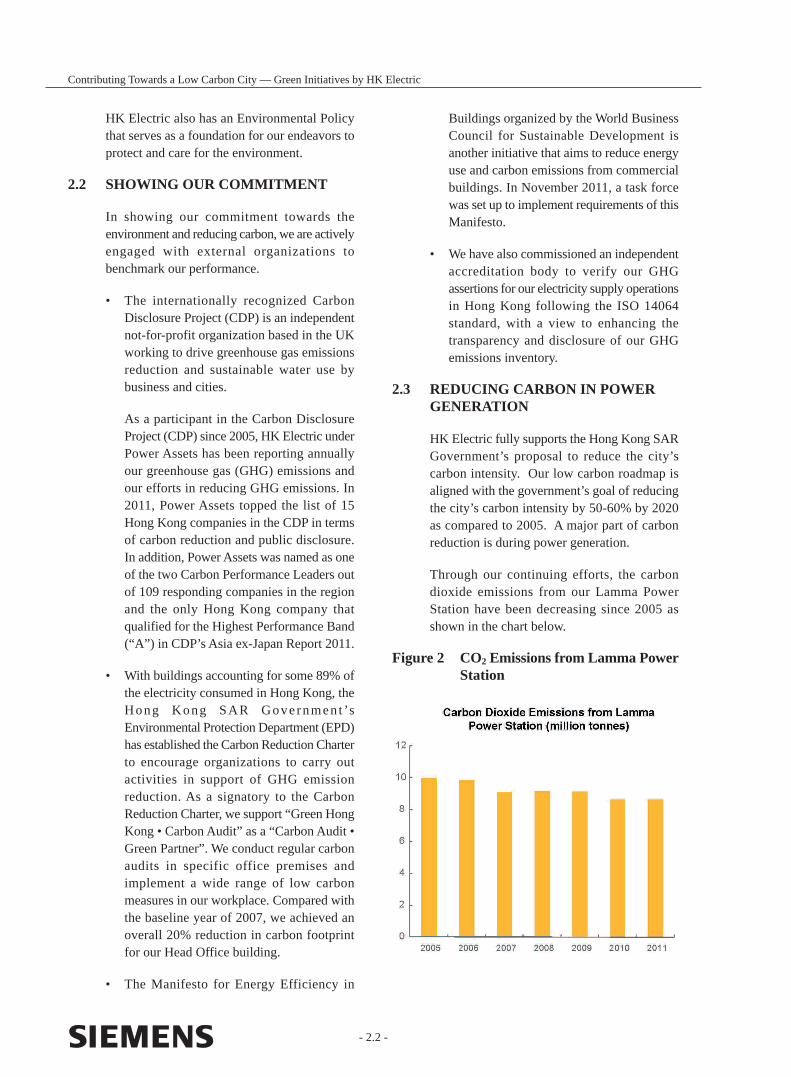
HK Electric fully supports the Hong Kong SAR Government’s proposal to reduce the city’s carbon intensity. Our low carbon roadmap is aligned with the government’s goal of reducing the city’s carbon intensity by 50-60% by 2020 as compared to 2005. A major part of carbon reduction is during power generation.
Through our continuing efforts, the carbon dioxide emissions from our Lamma Power Station have been decreasing since 2005 as shown in the chart below.
Figure 2 CO2 Emissions from Lamma Power Station
Following on this success, the TFPV system is being expanded from 550kW to 1MW in 2012.
The chart below shows the total renewable energy generation from our wind turbine and solar array since 2006.
Figure 4 HK Electric Renewable Energy Generation
- 2.3 -
Contributing Towards a Low Carbon City — Green Initiatives by HK Electric
In 2011, about 33% of our power output was from natural gas, resulting in a reduction in CO2
emissions of 13.4% compared to emissions prior to introduction of natural gas in 2005. Along these lines, we will continue to seek ways to introduce more low-carbon fuels in our electricity generation.
2.4 RENEWABLE ENERGY
Another important part of our mission to reduce carbon is through the use of renewable energy.
Since commissioning in 2006, our first 800kW wind turbine, Lamma Winds, has generated 5,300MWh of electricity and avoided 4,400 tonnes of CO2 emissions by end 2011.
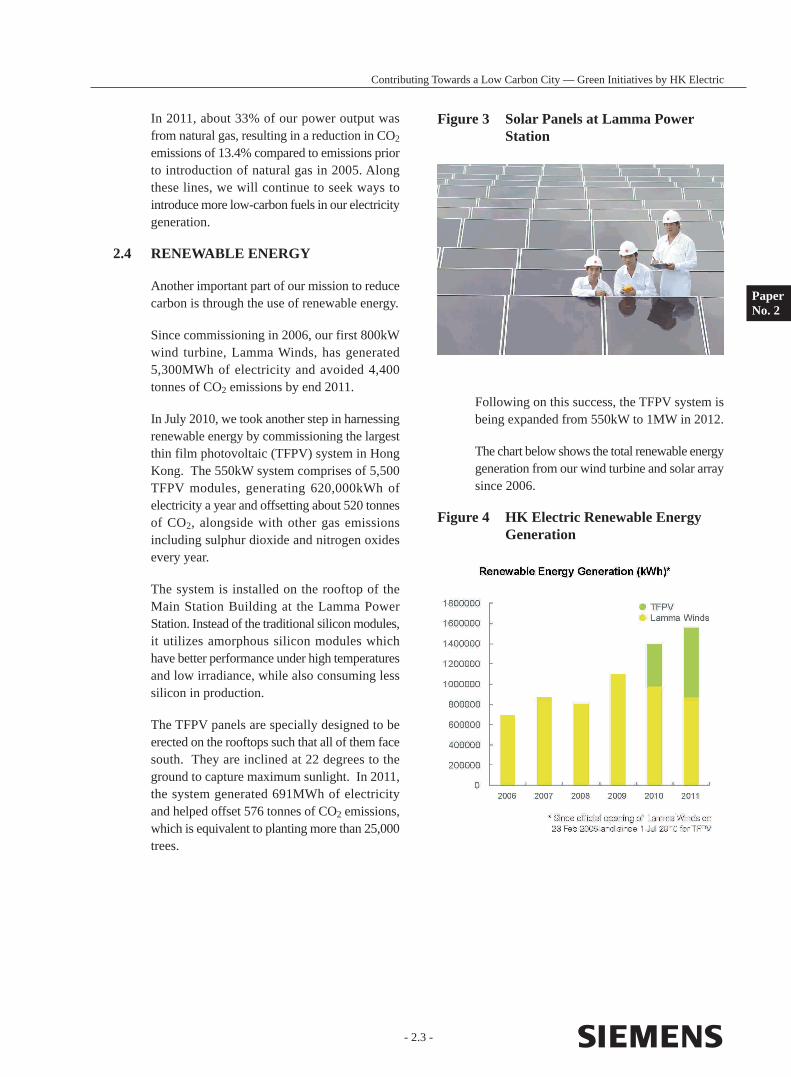
In July 2010, we took another step in harnessing renewable energy by commissioning the largest thin film photovoltaic (TFPV) system in Hong Kong. The 550kW system comprises of 5,500 TFPV modules, generating 620,000kWh of electricity a year and offsetting about 520 tonnes of CO2, alongside with other gas emissions including sulphur dioxide and nitrogen oxides every year.
The system is installed on the rooftop of the Main Station Building at the Lamma Power Station. Instead of the traditional silicon modules, it utilizes amorphous silicon modules which have better performance under high temperatures and low irradiance, while also consuming less silicon in production.
The TFPV panels are specially designed to be erected on the rooftops such that all of them face south. They are inclined at 22 degrees to the ground to capture maximum sunlight. In 2011, the system generated 691MWh of electricity and helped offset 576 tonnes of CO2 emissions, which is equivalent to planting more than 25,000 trees.
PaperNo. 2
Figure 3 Solar Panels at Lamma Power Station
- 2.4 -
Contributing Towards a Low Carbon City — Green Initiatives by HK Electric
In addition, HK Electric also has plans for an offshore wind farm. Comprising up to 35 wind turbines, the wind farm is targeted for completion by the end of 2015 and will be located at a 600-hectare site, about 3.5km southwest off Lamma Island with a generating capacity of about 100MW. It is expected to generate about 175GWh of energy annually, which is enough to supply electricity for about 50,000 families; this will offset 150,000 tonnes of CO2 emissions and the burning of 62,000 tonnes of coal.
2.5 NURTURING OF LOW CARBON CULTURE
Before reaching out to others, it is important for HK Electric to foster an internal culture to care for the environment and to reduce carbon in our daily work.
• Even though we generate electricity, it is necessary for us as a responsible company to conserve the energy and resources that we use. To this end, we have introduced in-house initiatives for conserving electricity and water, increasing vehicle fuel efficiency, using bio-diesel for Internal Combustion Engine (ICE) vehicles and deploying electric vehicles for operational tasks.
The annual saving targets for electricity and water consumption in major office buildings were set, closely monitored and engineered out. Between January 2011 and June 2012, over 2 million units in electricity and 1,655m3
of water were saved in two main office buildings. To meet our targets, we raised the awareness of employees and contractors by promulgating electricity and water usage tips as well as implementing energy management opportunities that included optimizing air-conditioning chill water temperature and operation patterns; altering lighting & passenger lift usage, high energy efficient luminaries (e.g. induction type and LED), and temperature and water flow controlled water heaters etc.
It is noted that implementing these seemingly trivial green initiatives in a systematic and professional manner has proved to be equally important as adopting cutting edge
technology in reducing our carbon footprint sustainably.
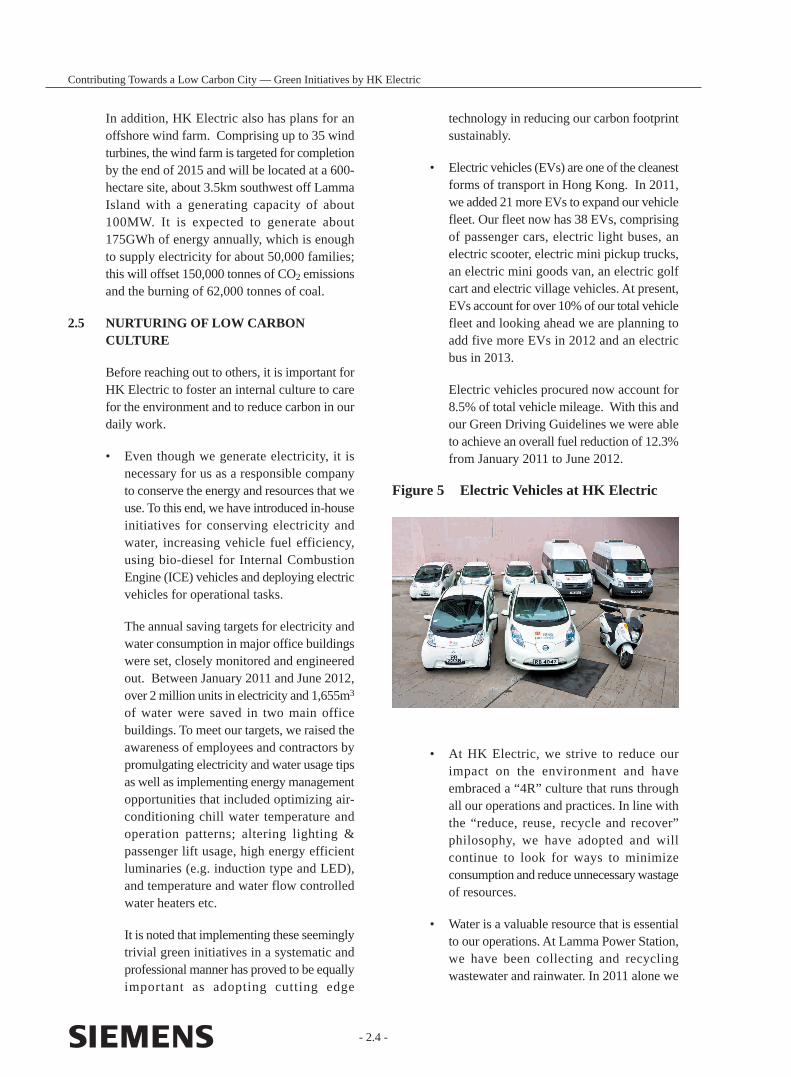
• Electric vehicles (EVs) are one of the cleanest forms of transport in Hong Kong. In 2011, we added 21 more EVs to expand our vehicle fleet. Our fleet now has 38 EVs, comprising of passenger cars, electric light buses, an electric scooter, electric mini pickup trucks, an electric mini goods van, an electric golf cart and electric village vehicles. At present, EVs account for over 10% of our total vehicle fleet and looking ahead we are planning to add five more EVs in 2012 and an electric bus in 2013.
Electric vehicles procured now account for 8.5% of total vehicle mileage. With this and our Green Driving Guidelines we were able to achieve an overall fuel reduction of 12.3% from January 2011 to June 2012.
Figure 5 Electric Vehicles at HK Electric
• At HK Electric, we strive to reduce our impact on the environment and have embraced a “4R” culture that runs through all our operations and practices. In line with the “reduce, reuse, recycle and recover” philosophy, we have adopted and will continue to look for ways to minimize consumption and reduce unnecessary wastage of resources.
• Water is a valuable resource that is essential to our operations. At Lamma Power Station, we have been collecting and recycling wastewater and rainwater. In 2011 alone we
- 2.5 -
Contributing Towards a Low Carbon City — Green Initiatives by HK Electric
PaperNo. 2
3.1 PROMOTIONS
3.1.1 SMART POWER CAMPAIGN
The Smart Power Campaign is an annual event used to promote energy efficiency and conservation messages among the public, in particular the younger generations. For 2011, the Smart Power Campaign was launched to encourage the public to adopt a low carbon lifestyle and realize the benefits of green living. Throughout the year, more than 70,000 people took part in our activities, starting with the launch of the “HK Electric Low Carbon App” for personal mobile devices to obtain smart tips on the efficient and safe use of electricity. The free-to-download application also enables customers to register for e-bills and provides access to the Account-On-Line Service and 25-month electricity consumption records, enabling customers to monitor their own electricity usage. Over 15,000 downloads were recorded in 2011.
As part of the campaign, we held a number of seminars, talks and exhibitions around Hong Kong and hosted open days at Lamma Power Station and Lamma Winds in order to raise awareness on smart and efficient electricity use. At the close of the programme, we ran a Low Carbon Bazaar at Southorn Playground in February 2012 in which students from 21 secondary schools put up for sale their DIY low carbon products and raised about HK$90,000 to support green activities for some of our green group partners.
Apart from green activities, a new Smart Power Centre was opened in April 2011 to promote smart use of electricity by showcasing various energy conservation measures for domestic and small and medium sized enterprises (SME) customers, such as automatic lighting controls, low-emission glass and window films. Guided group tours were conducted for various stakeholders including SMEs, engineering institutions, and NGOs.
3.1.2 E-BILLS PROMOTION
To further advocate green living, we promote the use of e-bills. There were 11,007 e-bill
used 138,400m3 of recycled wastewater and rainwater, equivalent to 6.1% of the total water consumption.
• We collect and recycle different types of waste from our office locations, including waste paper, metal, plastics, used batteries, compact fluorescent lamps and printer cartridges. Waste from our power plant operations, such as spent lube oil, ash and gypsum is collected by contractors for various industrial uses. All chemical waste is handled and disposed of by licensed waste collectors in compliance with relevant statutory requirements. In 2011, we recycled 91,000 tonnes of gypsum, 107,000 litres of waste oil and 214,000 tonnes of ash.
As an illustration to encourage our colleagues to reduce food waste, we set up a booking system for ordering food. We have installed two on-site food waste eliminators that treat organic waste, including grass trimmings, to produce a nutrient-rich liquid that can be used for irrigating vegetation. This reduces the amount of waste that is sent to landfill and hence emissions due to transportation. Together with the reduction in emissions resulting from the decomposition of food waste, a saving of more than 5 tonnes of CO2
emissions can be achieved per annum.
• In line with its Environmental Policy, HK Electric has introduced Green Purchasing Guidelines. During purchasing, the Company endeavors, whenever possible, to consider the factor of environmental friendliness together with quality, price and punctuality in its purchase of commodities and to choose suppliers who support environmental protection and resources conservation.
3. ENGAGING AND PARTNERING WITH CUSTOMERS
A way for us to contribute towards a low carbon city is to engage and partner with our customers to help them on their carbon reduction journey as described in the following sections.
- 2.6 -
Contributing Towards a Low Carbon City — Green Initiatives by HK Electric
for commercial and industrial customers, including NGOs, to help them identify potential areas for energy-saving improvements. In 2011, a total of 54 energy audits were conducted for customers. Launched in 2009, the programme covers commercial buildings, offices, shopping centres and public areas of residential buildings.
3.2.3 SPONSORING RENEWABLE ENERGY GENERATION
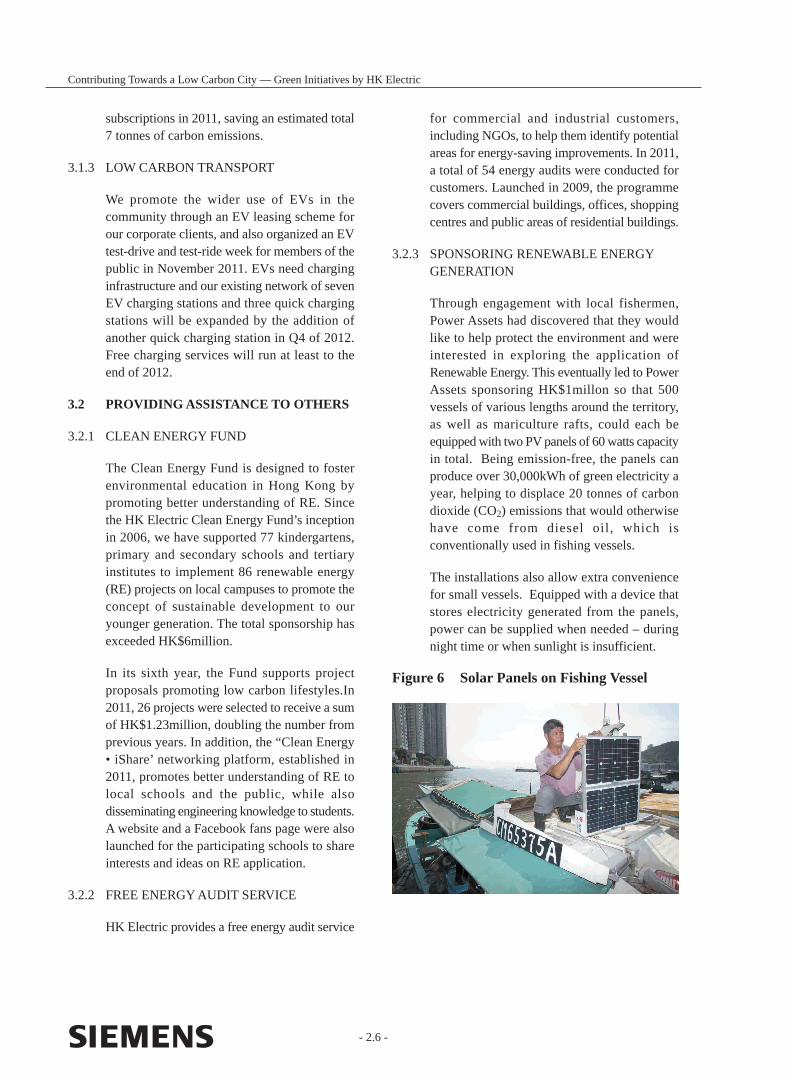
Through engagement with local fishermen, Power Assets had discovered that they would like to help protect the environment and were interested in exploring the application of Renewable Energy. This eventually led to Power Assets sponsoring HK$1millon so that 500 vessels of various lengths around the territory, as well as mariculture rafts, could each be equipped with two PV panels of 60 watts capacity in total. Being emission-free, the panels can produce over 30,000kWh of green electricity a year, helping to displace 20 tonnes of carbon dioxide (CO2) emissions that would otherwise have come from diesel oil, which is conventionally used in fishing vessels.
The installations also allow extra convenience for small vessels. Equipped with a device that stores electricity generated from the panels, power can be supplied when needed – during night time or when sunlight is insufficient.
Figure 6 Solar Panels on Fishing Vessel
subscriptions in 2011, saving an estimated total 7 tonnes of carbon emissions.
3.1.3 LOW CARBON TRANSPORT
We promote the wider use of EVs in the community through an EV leasing scheme for our corporate clients, and also organized an EV test-drive and test-ride week for members of the public in November 2011. EVs need charging infrastructure and our existing network of seven EV charging stations and three quick charging stations will be expanded by the addition of another quick charging station in Q4 of 2012. Free charging services will run at least to the end of 2012.
3.2 PROVIDING ASSISTANCE TO OTHERS
3.2.1 CLEAN ENERGY FUND
The Clean Energy Fund is designed to foster environmental education in Hong Kong by promoting better understanding of RE. Since the HK Electric Clean Energy Fund’s inception in 2006, we have supported 77 kindergartens, primary and secondary schools and tertiary institutes to implement 86 renewable energy (RE) projects on local campuses to promote the concept of sustainable development to our younger generation. The total sponsorship has exceeded HK$6million.
In its sixth year, the Fund supports project proposals promoting low carbon lifestyles.In 2011, 26 projects were selected to receive a sum of HK$1.23million, doubling the number from previous years. In addition, the “Clean Energy • iShare’ networking platform, established in 2011, promotes better understanding of RE to local schools and the public, while also disseminating engineering knowledge to students. A website and a Facebook fans page were also launched for the participating schools to share interests and ideas on RE application.
3.2.2 FREE ENERGY AUDIT SERVICE
HK Electric provides a free energy audit service
3.3 SHARING OUR KNOWLEDGE AND INFORMATION
3.3.1 PROVIDING INFORMATION TO CUSTOMERS
Through our website (www.hkelectric.com), we are able to share information easily on reducing carbon and improving energy efficiency with our customers.
Firstly, there is a carbon calculator that estimates the amount of carbon dioxide emitted based on your annual electricity consumption or your average monthly electricity consumption in Summer and Winter.
For our commercial and industrial customers, we have the service “Electricity@Office” where you can estimate your annual/average monthly electricity charges and to find out how much you can save when energy efficient appliances are used via the interactive “Energy Survey” programme. The service also provides useful information on energy efficiency, choice of tariff and power quality.
For domestic customers there is a similar service called “Electricity@Home’ geared towards the needs of home users. For example, there is a buying guide for domestic electrical appliances as well as a moving guide for easy reference.
For domestic customers, we have also recently updated their monthly bill to include 25-month historical consumption data, CO2 emission per unit of electricity consumed and the per capita consumption for HK Electric domestic customers.
Besides our website, we also reach out to our customers by conducting energy efficiency talks for community organizations and housing estates.
3.3.2 ELECTRIC COOKING
Electric cooking has many benefits such as providing a quiet, clean and cool cooking environment. To encourage the public to switch to electric cooking, our Home Management Centre (HMC) offers numerous cooking classes and promotional activities, such as festive
- 2.7 -
Contributing Towards a Low Carbon City — Green Initiatives by HK Electric
PaperNo. 2
cooking workshops and arranging school visits to the HMC. In 2011 the HMC also held the “13th Secondary School Cooking Contest” and “Low Carbon Christmas Cooking Contest”.
In addition, the Electric Domestic Kitchen Centre was launched in April 2011 to further promote the benefits of electric cooking to the public. The centre displays state-of-the-art electric appliances in showroom style kitchens, demonstrating that electric cooking can be integrated into any home lifestyle.
3.4 SMART METERING
Since the 1990’s, HK Electric has been installing intelligent full-featured electronic meters equipped with communications for high usage customers. Sometimes referred to as Smart Meters, these devices provide half-hourly interval metering information that can help our customers conserve energy and reduce their carbon footprint. Our deployment of the latest smart metering technology continues with a view to facilitate carbon reduction.
4. LOW CARBON INITIATIVES ON THE TRANSMISSION & DISTRIBUTION NETWORK
HK Electric has also implemented low carbon initiatives on the Transmission & Distribution (T&D) network.
4.1 POWER FACTOR CORRECTION IN ZONE SUBSTATIONS
Capacitor banks are commonly installed in power systems for power factor correction to reduce losses under various system loading conditions. In HK Electric, capacitor banks are connected to 11kV and 22kV busbars at zone substations for reactive power compensation. In addition to the normal capacitor bank design features such as stepped capacitor bank switching for better control of compensation, HK Electric has recently developed a fully computerized capacitor switching algorithm in the Energy Management System to replace the existing manual switching system with an aim to achieve even better power
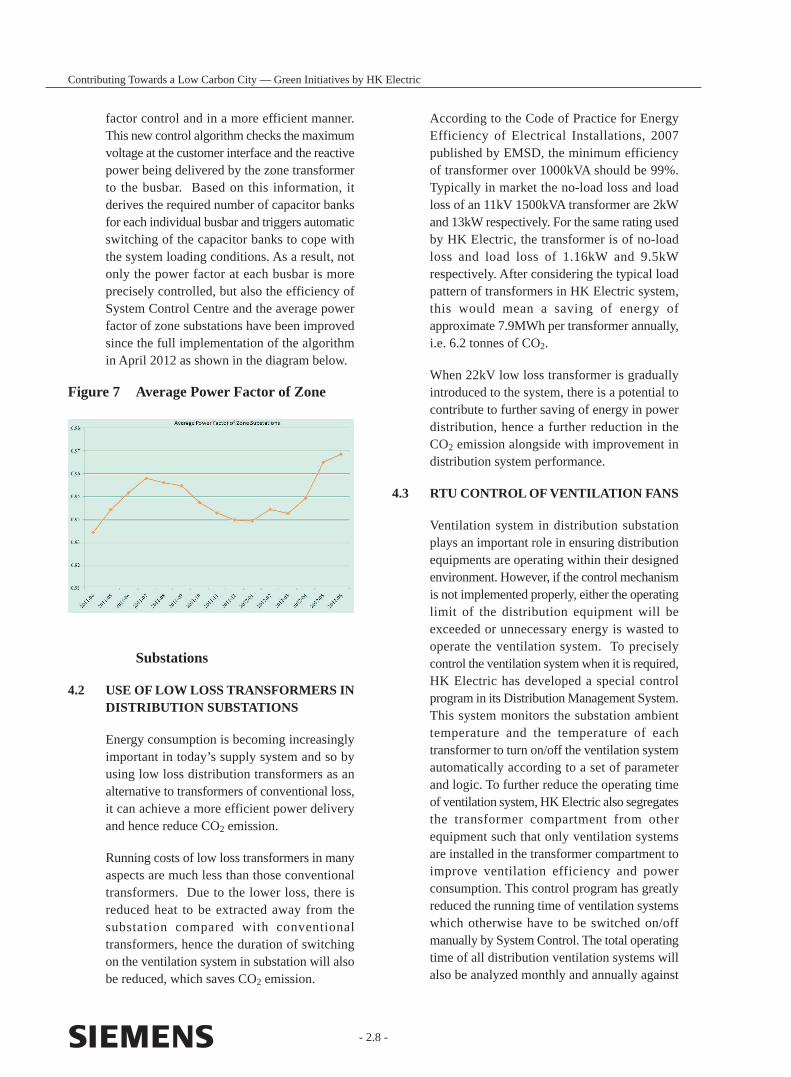
factor control and in a more efficient manner. This new control algorithm checks the maximum voltage at the customer interface and the reactive power being delivered by the zone transformer to the busbar. Based on this information, it derives the required number of capacitor banks for each individual busbar and triggers automatic switching of the capacitor banks to cope with the system loading conditions. As a result, not only the power factor at each busbar is more precisely controlled, but also the efficiency of System Control Centre and the average power factor of zone substations have been improved since the full implementation of the algorithm in April 2012 as shown in the diagram below.
Figure 7 Average Power Factor of Zone
Substations
4.2 USE OF LOW LOSS TRANSFORMERS IN DISTRIBUTION SUBSTATIONS
Energy consumption is becoming increasingly important in today’s supply system and so by using low loss distribution transformers as an alternative to transformers of conventional loss, it can achieve a more efficient power delivery and hence reduce CO2 emission.
Running costs of low loss transformers in many aspects are much less than those conventional transformers. Due to the lower loss, there is reduced heat to be extracted away from the substation compared with conventional transformers, hence the duration of switching on the ventilation system in substation will also be reduced, which saves CO2 emission.
- 2.8 -
Contributing Towards a Low Carbon City — Green Initiatives by HK Electric
According to the Code of Practice for Energy Efficiency of Electrical Installations, 2007 published by EMSD, the minimum efficiency of transformer over 1000kVA should be 99%. Typically in market the no-load loss and load loss of an 11kV 1500kVA transformer are 2kW and 13kW respectively. For the same rating used by HK Electric, the transformer is of no-load loss and load loss of 1.16kW and 9.5kW respectively. After considering the typical load pattern of transformers in HK Electric system, this would mean a saving of energy of approximate 7.9MWh per transformer annually, i.e. 6.2 tonnes of CO2.
When 22kV low loss transformer is gradually introduced to the system, there is a potential to contribute to further saving of energy in power distribution, hence a further reduction in the CO2 emission alongside with improvement in distribution system performance.
4.3 RTU CONTROL OF VENTILATION FANS
Ventilation system in distribution substation plays an important role in ensuring distribution equipments are operating within their designed environment. However, if the control mechanism is not implemented properly, either the operating limit of the distribution equipment will be exceeded or unnecessary energy is wasted to operate the ventilation system. To precisely control the ventilation system when it is required, HK Electric has developed a special control program in its Distribution Management System. This system monitors the substation ambient temperature and the temperature of each transformer to turn on/off the ventilation system automatically according to a set of parameter and logic. To further reduce the operating time of ventilation system, HK Electric also segregates the transformer compartment from other equipment such that only ventilation systems are installed in the transformer compartment to improve ventilation efficiency and power consumption. This control program has greatly reduced the running time of ventilation systems which otherwise have to be switched on/off manually by System Control. The total operating time of all distribution ventilation systems will also be analyzed monthly and annually against
- 2.9 -
Contributing Towards a Low Carbon City — Green Initiatives by HK Electric
PaperNo. 2
the air temperature obtained from the HK Observatory and the ventilation system setting will be optimized if required.
4.4 RAISING THE VOLTAGE TO 22KV
HK Electric started to introduce the 22kV distribution system in early 2000’s. The 22kV closed-ring system adopted by HK Electric has the advantage of higher security and reliability of electricity supply to customer and higher load density demanded by high rise buildings with less underground cables.
The reduction in quantities of 22kV cables and cable joints as compared to 11kV can help alleviate the underground space problem and reduce disturbance to the public in the long term, which also reduces CO2 emission.
The energy saving and the associated CO2
reduction for cables from zone substations to distribution substations are estimated to be 7.7MWh and 6.0 tonnes per MVA load delivered per annum respectively for a mature system if 22kV cable system is adopted instead of 11kV cable system.
5. GLOBAL CARBON REDUCTION INITIATIVES BY POWER ASSETS
5.1 DALI AND LAOTING WIND FARMS IN CHINA
Power Assets has invested in two wind farms in Mainland China - one 48MW in Dali, Yunnan Province and one 49.5MW in Laoting, Hebei Province. The two projects have been registered for Clean Development Mechanism (CDM) under the Kyoto Protocol and are eligible to generate Carbon Credits. The Dali Wind Farm achieved Commercial Operation Date (COD) on 1 January 2009 and the Laoting Wind Farm achieved full COD on 1 October 2009.
5.2 LOW CARBON PROJECTS AT UK POWER NETWORKS
In the UK, the regulator OFGEM established a Low Carbon Networks (LCN) fund that encourages companies to test and anticipate how
the networks will need to change now, so that they can be ready for the transformation to a low-carbon future. The fund runs from 2010 to 2015. Our associate, UK Power Networks, is a distribution network operator which serves 8 million households in the UK and has so far been successful with two winning bids for the LCN fund.
The first is Low Carbon London which focuses on modernization of the network to serve a low carbon city. The project covers key areas such as Distributed Generation, EV’s, Smart Meters, Demand Side Management and Wind Twinning (matching energy demand to wind generation).
Another winning project is Flexible Plug & Play which explores ways for cost effective connection of renewable generation to the distribution network.
5.3 SMART METERING AT CITIPOWER AND POWERCOR, AUSTRALIA
Our associates Citipower and Powercor, are two distribution companies in Australia that supplies over 900,000 customers in the state of Victoria. By 2013, they expect to complete their deployment of over 1.1million Smart Meters in compliance with a mandate from the Victorian Government. These meters together with their Advanced Metering Infrastructure (AMI) will empower energy consumers to better manage their energy consumption, thus facilitating them with an avenue to better control their carbon footprint.
6. LOOKING AHEAD
Continuing on our low carbon journey in 2012, HK Electric aims to expand solar generation capacity from 550kW to 1MW in addition to enhancing turbine efficiency of one generator at Lamma Power Station. Development work will also continue for our 100MW offshore wind farm with the setting up of a wind monitoring station to collect the necessary data and information for a detailed project engineering design by 2013.

- 2.10 -
Contributing Towards a Low Carbon City — Green Initiatives by HK Electric
Internally, we will endeavor to reduce fuel usage of the Company’s vehicle fleet in 2012 as compared with 2011 while increasing EV mileage.
Caring for our staff in a green way, we will install solar air-conditioning systems on more vehicles in 2012.
For our non-domestic customers, we will conduct energy audits to help them identify energy-saving opportunities.
To line up with international standards, we will establish an energy management system based on ISO 50001 for our Lamma Power Station.
7. CONCLUSION
In this age of global warming and extreme weather conditions, the need to reduce carbon have become a top priority that requires participation from all segments of society. For the sake of future generations, it is imperative for us to take action now. No longer can we afford to remain complacent.
Power Assets, with businesses in Hong Kong as well as overseas, continues to fulfill its corporate social responsibility by deploying initiatives and technologies for reducing carbon. In Hong Kong, these combined actions contribute to a low carbon city.
ACKNOWLEDGEMENT
The author gratefully acknowledges the opportunity and support from the management and colleagues of The Hongkong Electric Co., Ltd. in making this paper possible.

- Notes and Questions -

- Notes and Questions -
Paper No. 3
GENERATION DISPATCH METHODOLOGY UNDERLOW CARBON EMISSION SCENARIO
Speaker : Dr Y.H. HouAssistant ProfessorDepartment of Electrical & Electronic EngineeringUniversity of Hong Kong
ABSTRACT
This paper focuses on a novel generation dispatch methodology with geographical emission constraint. This is a new concept for generation dispatch. Current generation dispatch method only considers the cost and total amount of emission, such as CO2 and SOx. However, due to the geographical distribution and meteorological condition, even for the same amount of pollutant, the effect for a city might be completely different. In the method presented in this work, pollutants distribution associated with geographical distribution of power plants and meteorological condition will be integrated into the generation dispatch models. The generation dispatch pattern is thus established with acceptable air pollution level for a specified location. The proposal model and method are demonstrated by an IEEE standard test system.
1. INTRODUCTION
Coal-fired power plants are the main suppliers of electric energy, as well as the major sources of air pollutant emission at present, especially in China. China’s economy will continue increasing in a sustained and fast rate in the future decades. This trend results from China’s three-step development strategy. The expected average annual GDP growth rate will reach 6.4% from 2005 to 2050. However, China’s economy significant improvement also results in excessive consumption of resources and severe environmental pollution.
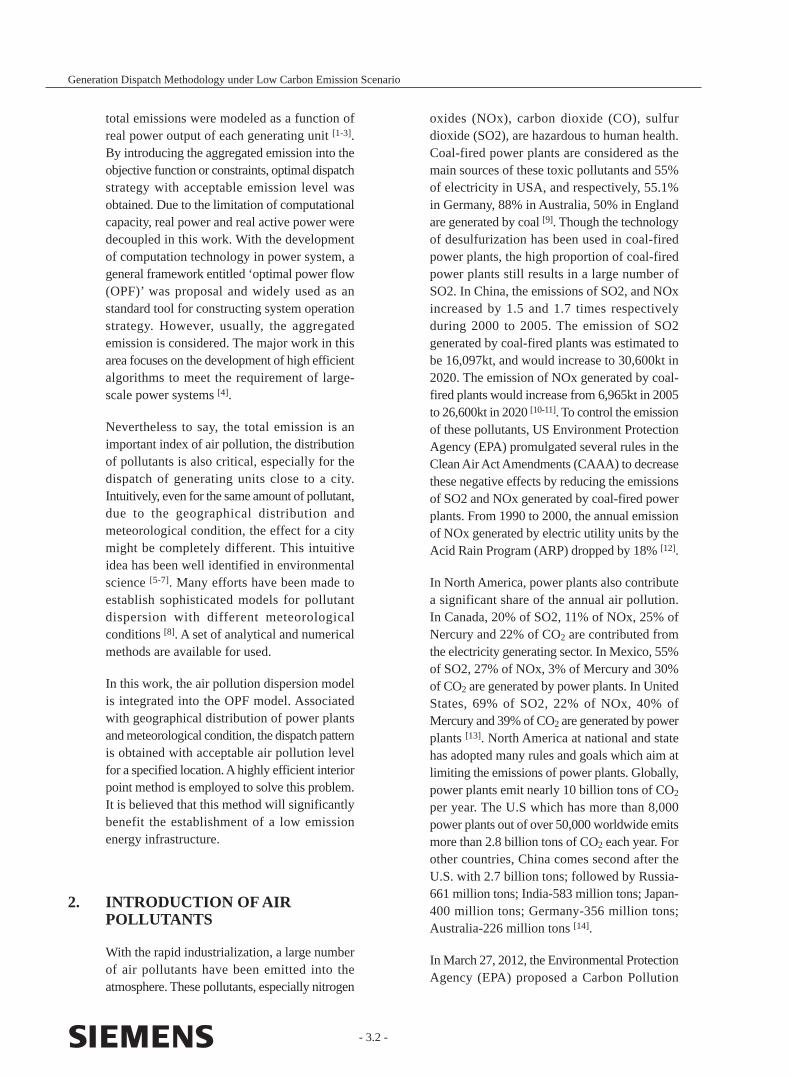
The primary energy demand forecast curves of the National Development and Reform Commission (NDRC) is based on three scenarios, namely, the energy savings scenario, the low-carbon scenario, and the enhanced low-carbon scenario. These scenarios are all upward sloping
along the timeline, as shown in Figure 1. Albeit forecasted considering energy savings and emission reduction, the primary energy consumption, including coal, petroleum, natural gas, etc., will expand to 5,022 million tce (tonne coal equivalent) in 2050, 2.5 times the 2005 figures.
Figure 1 Primary Energy Demand Forecast of China by 2050
As for the emission, in 2008, the corresponding SO2, NOx, and CO2 emissions by these coal-fired power plants reached 45.8%, 50%, and 48%, respectively, of the total amount discharged in China. At the same time, the corresponding SO2, NOx, and PM10 emissions by public electricity generation reached 89%, 46%, and 28% in Hong Kong. As a result, the emission constraint should be seriously involved in the dispatch of generation.
To support a significant economy development, as well as to secure energy and achieve the carbon emission target, tremendous challenges have to be overcome. Since coal continues to dominate the Chinese energy mix, thermal power plants are major options for coal utilization in China. Various clean energy technologies have been successfully applied to mitigate the CO2
emission problem. Generation dispatch with emission constraints is a traditional topic in power systems operation. In the pioneering work,
- 3.1 -
GENERATION DISPATCH METHODOLOGY UNDERLOW CARBON EMISSION SCENARIO
Dr Y.H. HouAssistant Professor
Department of Electrical & Electronic EngineeringUniversity of Hong Kong
PaperNo. 3
total emissions were modeled as a function of real power output of each generating unit [1-3]. By introducing the aggregated emission into the objective function or constraints, optimal dispatch strategy with acceptable emission level was obtained. Due to the limitation of computational capacity, real power and real active power were decoupled in this work. With the development of computation technology in power system, a general framework entitled ‘optimal power flow (OPF)’ was proposal and widely used as an standard tool for constructing system operation strategy. However, usually, the aggregated emission is considered. The major work in this area focuses on the development of high efficient algorithms to meet the requirement of large-scale power systems [4].
Nevertheless to say, the total emission is an important index of air pollution, the distribution of pollutants is also critical, especially for the dispatch of generating units close to a city. Intuitively, even for the same amount of pollutant, due to the geographical distribution and meteorological condition, the effect for a city might be completely different. This intuitive idea has been well identified in environmental science [5-7]. Many efforts have been made to establish sophisticated models for pollutant dispersion with different meteorological conditions [8]. A set of analytical and numerical methods are available for used.
In this work, the air pollution dispersion model is integrated into the OPF model. Associated with geographical distribution of power plants and meteorological condition, the dispatch pattern is obtained with acceptable air pollution level for a specified location. A highly efficient interior point method is employed to solve this problem. It is believed that this method will significantly benefit the establishment of a low emission energy infrastructure.
2. INTRODUCTION OF AIR POLLUTANTS
With the rapid industrialization, a large number of air pollutants have been emitted into the atmosphere. These pollutants, especially nitrogen
oxides (NOx), carbon dioxide (CO), sulfur dioxide (SO2), are hazardous to human health. Coal-fired power plants are considered as the main sources of these toxic pollutants and 55% of electricity in USA, and respectively, 55.1% in Germany, 88% in Australia, 50% in England are generated by coal [9]. Though the technology of desulfurization has been used in coal-fired power plants, the high proportion of coal-fired power plants still results in a large number of SO2. In China, the emissions of SO2, and NOx increased by 1.5 and 1.7 times respectively during 2000 to 2005. The emission of SO2 generated by coal-fired plants was estimated to be 16,097kt, and would increase to 30,600kt in 2020. The emission of NOx generated by coal-fired plants would increase from 6,965kt in 2005 to 26,600kt in 2020 [10-11]. To control the emission of these pollutants, US Environment Protection Agency (EPA) promulgated several rules in the Clean Air Act Amendments (CAAA) to decrease these negative effects by reducing the emissions of SO2 and NOx generated by coal-fired power plants. From 1990 to 2000, the annual emission of NOx generated by electric utility units by the Acid Rain Program (ARP) dropped by 18% [12].
In North America, power plants also contribute a significant share of the annual air pollution. In Canada, 20% of SO2, 11% of NOx, 25% of Nercury and 22% of CO2 are contributed from the electricity generating sector. In Mexico, 55% of SO2, 27% of NOx, 3% of Mercury and 30% of CO2 are generated by power plants. In United States, 69% of SO2, 22% of NOx, 40% of Mercury and 39% of CO2 are generated by power plants [13]. North America at national and state has adopted many rules and goals which aim at limiting the emissions of power plants. Globally, power plants emit nearly 10 billion tons of CO2
per year. The U.S which has more than 8,000 power plants out of over 50,000 worldwide emits more than 2.8 billion tons of CO2 each year. For other countries, China comes second after the U.S. with 2.7 billion tons; followed by Russia-661 million tons; India-583 million tons; Japan-400 million tons; Germany-356 million tons; Australia-226 million tons [14].
In March 27, 2012, the Environmental Protection Agency (EPA) proposed a Carbon Pollution
- 3.2 -
Generation Dispatch Methodology under Low Carbon Emission Scenario
Standard for New Power Plants. This step under the Clean Air Act sets national limits on the carbon emissions of power plants. EPA reviewed new technical information that is focused on toxic air pollution limits for new power plants under the Mercury and Air Toxics Standards [15]. The Emission Standard of Air Pollutants for Thermal Power Plants (GB13223-2011) [16] was adopted by China’s Ministry Environmental Protection (MEP) on July 18, 2012. This standard stipulates limitations on concentrations of SO2, NOx and mercury.
Air pollution is effected by a variety of environmental factors which have complicated relationships between each other. To control air pollution effectively, some scientific methods should be used to monitor and measure air pollutants. An Environmental Air Pollution Monitoring System (EAPMS) based on the IEEE 1451.2 standard [17] is developed to monitor the concentrations of major air pollutant gases such as CO, NO2, SO2 and O3. Two spatial interpolation methods [18], Inverse Distance Weighted Interpolation (IDW) and Ordinary Kriging (OK), are employed to create the maps which show spatial distributions of SO2, NOx concentrations. A fully coupled “online” Weather Research and Forecast ing/Chemistry (WRF/Chem) model [19] is used to forecast CO and NOx at all of the surface sites. This model considers many chemical and physical processes such as emission, transport, deposition, transformation, photolysis and radiation. An autoregressive integrated moving average model with periodicity [20] is employed to predict the air pollution PM2.5.
3. AIR POLLUTANT DISPERSION MODELING
3.1 AIR POLLUTION DISPERSION MODELS
Air pollution dispersion models are employed to describe how air pollutants disperse under the ambient environmental conditions. The air pollution dispersion models are also known as atmospheric dispersion models, atmospheric diffusion models, air dispersion models and air quality models. It is modeled as a set of equations
with different assumptions. By solving these equations, air pollutants arise from planned or unplanned sources, such as power plants, vehicles and factories, can be estimated or predicted. Usually, downwind concentration of air pollutants emitted from emission sources can be estimated or predicted for the purpose of air quality assessment. These models are critical for determining whether existing or proposed new industrial facilities are or will be in compliance with the environmental standards. Governments or organizations are also using these models to evaluate or design control strategies to reduce pollution. To meet these requirements, many commercial models and software have been selected by different organizations, such as “AERMOD’ air pollution dispersion model is pointed by the U.S. Environmental Protection Agency (U.S. EPA).
The methodology to establish air pollution dispersion models is a classical topic in environmental science. Usually, following data are required:
• Meteorological conditions: wind speed and direction, the amount of atmospheric turbulence, and air temperature, etc.
• Emissions parameters: source location and height, source vent stack diameter and exit velocity, exit temperature and mass flow rate, etc.
• Terrain elevations at the source location and at the receptor location.
• The location, height and width of any obstructions (such as buildings or other structures) in the path of the gaseous emission plume.
3.2 GAUSSIAN PLUME MODEL
A widely used model, Gaussian plume model, is employed in this paper. This model is established based on the assumption that regard to air pollutant emissions and meteorological changes, over a few hours, steady-state condition of dispersion can be achieved. The air pollution is described as plume emits from the top of a stack with constant height and diameter. Since
- 3.3 -
Generation Dispatch Methodology under Low Carbon Emission Scenario
PaperNo. 3
The ground-level concentration can be calculated with z=0. Equ. can be reduced as follows.
By analyzing Equ. or , the pollution concentration is highest along the directly downwind direction. With y=0, the downwind ground level of pollution concentration is
direction at point (x,y,z), E is emission rate from the source, u is the wind speed, H is the effective stack height, sy and sz are standard deviations of a statistically normal plume in the lateral and vertical dimensions, respectively. Usually, sy
and sz are modeled as functions of x.
The effective stack height H is defined as
(1)
(2)(3)
(4)
where is the plume rise due the plume’s buoyancy, h is the stack height.
Consider variable character is t ics of environmental conditions, following four assumptions must be satisfied.
• Mass is conserved through reflection at
surfaces.
• Background pollution is negligible.
• In the study area, no variation in wind speed or direction is considered.
• No account for chemical properties, chemical reaction or decomposition of the materials within the plume.
• In the cross-wind direction (y) and in the vertical direction (z), the plume spread has a normal distribution.
• The emission rate (E) is constant and continuous.
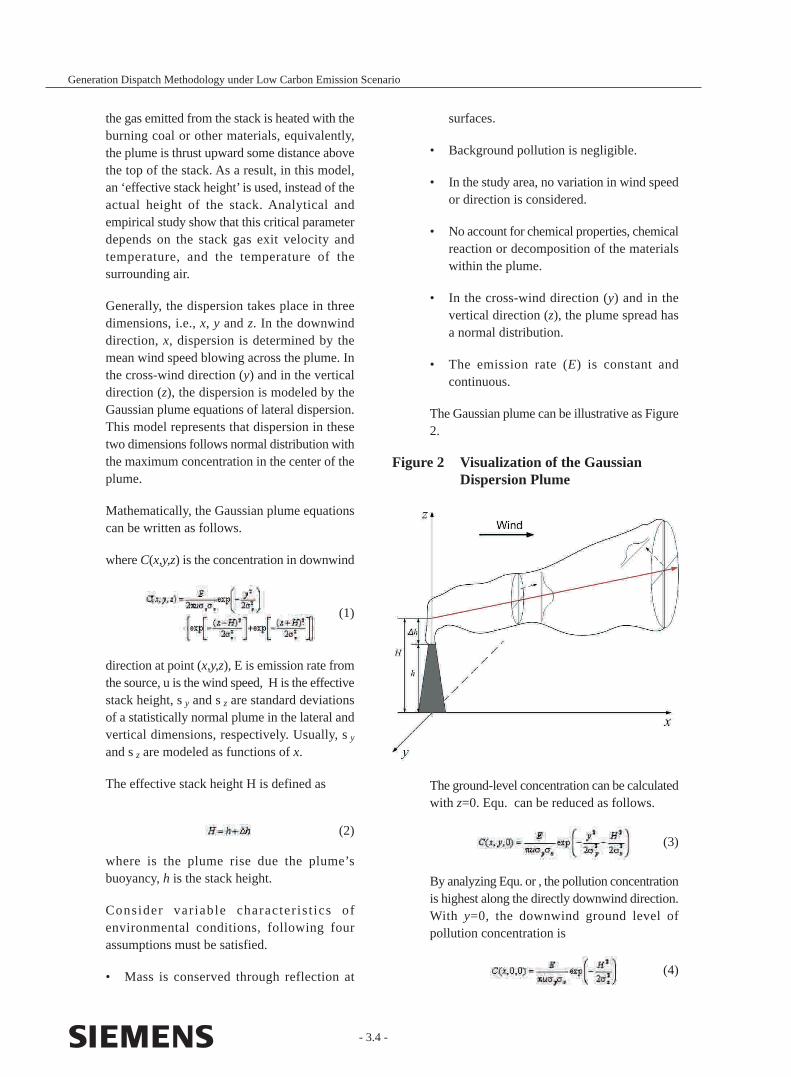
The Gaussian plume can be illustrative as Figure 2.
Figure 2 Visualization of the Gaussian Dispersion Plume
the gas emitted from the stack is heated with the burning coal or other materials, equivalently, the plume is thrust upward some distance above the top of the stack. As a result, in this model, an ‘effective stack height’ is used, instead of the actual height of the stack. Analytical and empirical study show that this critical parameter depends on the stack gas exit velocity and temperature, and the temperature of the surrounding air.
Generally, the dispersion takes place in three dimensions, i.e., x, y and z. In the downwind direction, x, dispersion is determined by the mean wind speed blowing across the plume. In the cross-wind direction (y) and in the vertical direction (z), the dispersion is modeled by the Gaussian plume equations of lateral dispersion. This model represents that dispersion in these two dimensions follows normal distribution with the maximum concentration in the center of the plume.
Mathematically, the Gaussian plume equations can be written as follows.
where C(x,y,z) is the concentration in downwind
- 3.4 -
Generation Dispatch Methodology under Low Carbon Emission Scenario
where E is defined by , CF is a coefficient matrix with dimension NG¥ NL (NG¥is the number of buses with generators and NL is the number of buses with loads). For any element of CF, CF(Gi-
Lj), describes the relationship between generator Gi and load Lj. It is defined as:
For load Lj in downwind direction of Gi
where h, q and r are parameters vector.
From system-wide viewpoint, emissions in total should be lower than an upper bound, i.e.,
where PG is the active power output of controllable generators, a, b, c are the fuel cost coefficient vectors, .¥ is element-wise multiplication between vectors or between matrices.
4.2 EQUALITY CONSTRAINTS
Equality constraints include AC power flow equations, balance equations
where:
PL,QL: vectors of active and reactive power loads of all buses. (Non-controllable active and reactive power supplies are treated as equivalent loads)
G, B: real and imaginary part of admittance matrix,
e, f : real and imaginary part of the voltage vector of all buses, respectively
(9)
(10)
(11)
(12)
(13)
(14)
(5)(6)
or(7)
(8)
(15)
Otherwise
(16)
In Equ. , sy and sz are functions of (xGi-xLj) and defined by (5)~(6) or (7)~(8), others variables
For load at point (x, y), the ground-level concentration vector can be calculated as
QC : reactive power output of controllable compensators
4.3 INEQUALITY CONSTRAINTS
Inequality constraints includes bus voltage level, active power limits of generators, VAR limits of generators and shunts
Variations sy and sz are key parameters. Empirical study shows sy and sz can be modeled as linear functions or exponential functions as follows.
where Iy, Iz, gy, gz, ay, and az are constants, which are determined by many factors, such as atmospheric stability, wind speed, ambient temperature, stack height, gas exit velocity, and gas exit temperature.
4. GENERATION DISPATCH MODEL WITH AIR POLLUTANT DISPERSION
4.1 OBJECTIVE FUNCTION
- 3.5 -
Generation Dispatch Methodology under Low Carbon Emission Scenario
PaperNo. 3
where (.),(.) : lower and upper limits of variables.
4.4 AIR POLLUTION DISPERSION CONSTRAINTS
Generally, pollutant emission from a thermal unit is a quadratic function of real power. The vector of emission is:
(18)
(17)
(19)
(20)
(21)
(22)
(23)
(24)
where:
(25)
(24)
are the same as (3).
The upper bound of pollution should satisfy the following inequality.
5. INTERIOR POINT METHOD FOR PROPOSED MODEL
• Lagrangian function is defined as:
where (y,z,w) are Lagrangian multipliers.
• KKT system with the Lagrangian function is:
where Lml , L
mu are perturbed complementary
conditions, m is perturbed factor, w £ 0; y ¹ 0; l ³ 0; u ³ 0; z ³ 0.
• By applying Newton’s method, the correction equations of the reduced system can be written as follows:
denote the residuals of the perturbed KKT systems Equ. (21)(22).
• The variables are updated according to:
6. ILLUSTRATIVE CASES
6.1 COMPUTATIONAL EFFORTS
The authors developed a C++ vectorization calculation library based on STL (Standard Template Library) to implement the basic linear algebra. The algorithm for Hessian computation proposed in [21] is implemented in C++ with high efficiency. LU and Cholesky factorization modules are implemented using parts of UMFPACK in [22].
All programs are complied with Microsoft Visual Studio V.6.0. Tests were run on a PC (Intel-Pentinum4 2.0GHz, 1GB RAM).
6.2 TEST SYSTEM
The modified IEEE 14-bus system is employed
- 3.6 -
Generation Dispatch Methodology under Low Carbon Emission Scenario
A generic optimization problem with both upper and lower inequality constrains is as following:
where c(x) is the objective function, H(x) is equality constraints, G(x) is inequality constraints, g,g are lower and upper limits of G(x), respectively.
The primal-dual interior point method framework applied on model (18) can be described as :
• slack variable vectors (l,u) *0 are introduced hence inequality constraints are converted into:
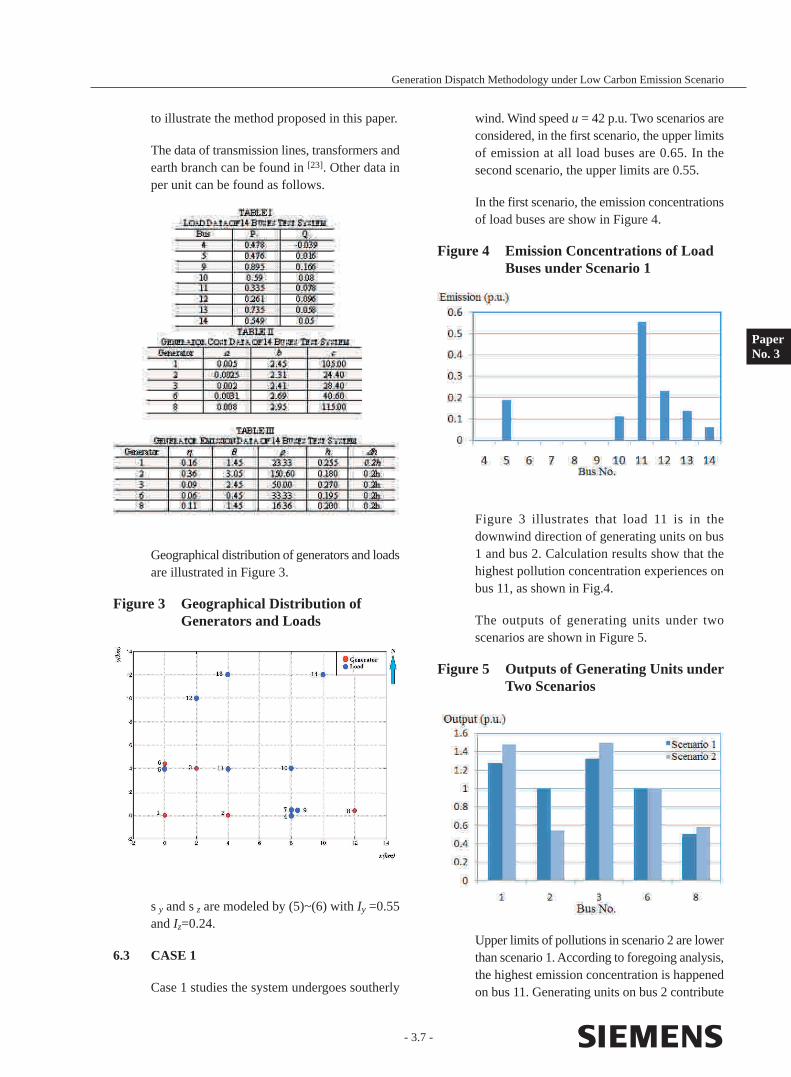
to illustrate the method proposed in this paper.
The data of transmission lines, transformers and earth branch can be found in [23]. Other data in per unit can be found as follows.
Geographical distribution of generators and loads are illustrated in Figure 3.
Figure 3 Geographical Distribution of Generators and Loads
sy and sz are modeled by (5)~(6) with Iy =0.55 and Iz=0.24.
6.3 CASE 1
Case 1 studies the system undergoes southerly
wind. Wind speed u = 42 p.u. Two scenarios are considered, in the first scenario, the upper limits of emission at all load buses are 0.65. In the second scenario, the upper limits are 0.55.
In the first scenario, the emission concentrations of load buses are show in Figure 4.
Figure 4 Emission Concentrations of Load Buses under Scenario 1
Figure 3 illustrates that load 11 is in the downwind direction of generating units on bus 1 and bus 2. Calculation results show that the highest pollution concentration experiences on bus 11, as shown in Fig.4.
The outputs of generating units under two scenarios are shown in Figure 5.
Figure 5 Outputs of Generating Units under Two Scenarios
Upper limits of pollutions in scenario 2 are lower than scenario 1. According to foregoing analysis, the highest emission concentration is happened on bus 11. Generating units on bus 2 contribute
- 3.7 -
Generation Dispatch Methodology under Low Carbon Emission Scenario
PaperNo. 3
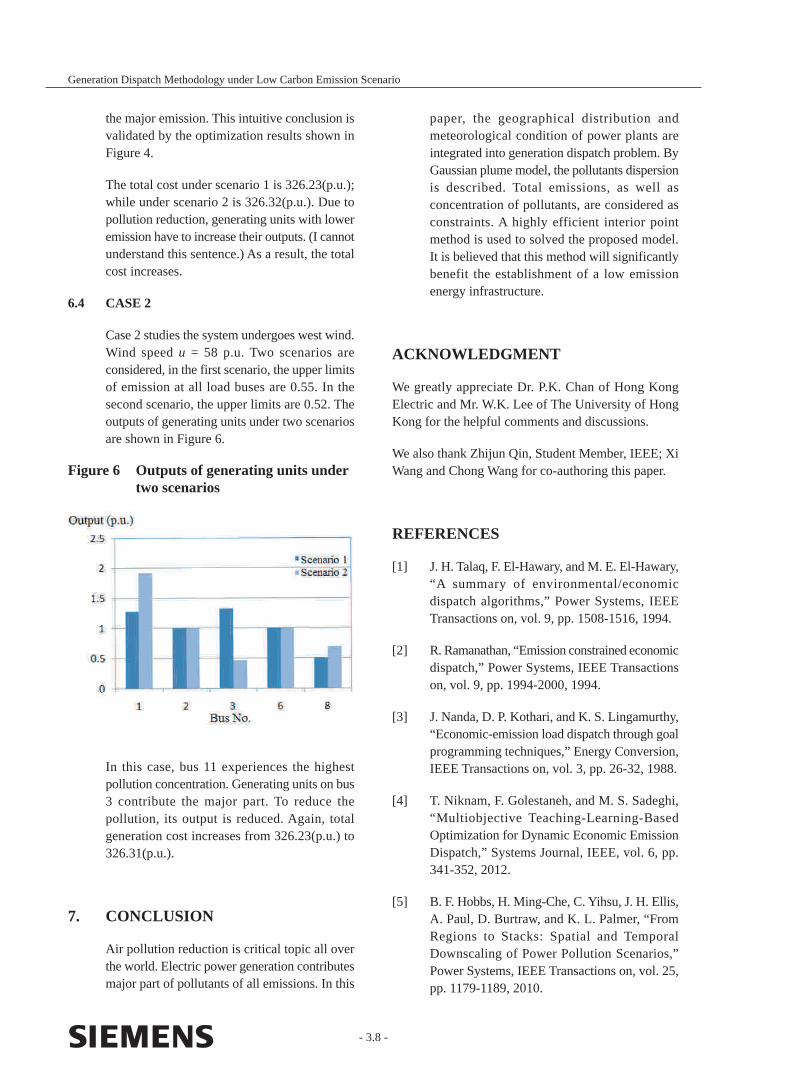
the major emission. This intuitive conclusion is validated by the optimization results shown in Figure 4.
The total cost under scenario 1 is 326.23(p.u.); while under scenario 2 is 326.32(p.u.). Due to pollution reduction, generating units with lower emission have to increase their outputs. (I cannot understand this sentence.) As a result, the total cost increases.
6.4 CASE 2
Case 2 studies the system undergoes west wind. Wind speed u = 58 p.u. Two scenarios are considered, in the first scenario, the upper limits of emission at all load buses are 0.55. In the second scenario, the upper limits are 0.52. The outputs of generating units under two scenarios are shown in Figure 6.
Figure 6 Outputs of generating units under two scenarios
In this case, bus 11 experiences the highest pollution concentration. Generating units on bus 3 contribute the major part. To reduce the pollution, its output is reduced. Again, total generation cost increases from 326.23(p.u.) to 326.31(p.u.).
7. CONCLUSION
Air pollution reduction is critical topic all over the world. Electric power generation contributes major part of pollutants of all emissions. In this
paper, the geographical distribution and meteorological condition of power plants are integrated into generation dispatch problem. By Gaussian plume model, the pollutants dispersion is described. Total emissions, as well as concentration of pollutants, are considered as constraints. A highly efficient interior point method is used to solved the proposed model. It is believed that this method will significantly benefit the establishment of a low emission energy infrastructure.
ACKNOWLEDGMENT
We greatly appreciate Dr. P.K. Chan of Hong Kong Electric and Mr. W.K. Lee of The University of Hong Kong for the helpful comments and discussions.
We also thank Zhijun Qin, Student Member, IEEE; Xi Wang and Chong Wang for co-authoring this paper.
REFERENCES
[1] J. H. Talaq, F. El-Hawary, and M. E. El-Hawary, “A summary of environmental/economic dispatch algorithms,” Power Systems, IEEE Transactions on, vol. 9, pp. 1508-1516, 1994.
[2] R. Ramanathan, “Emission constrained economic dispatch,” Power Systems, IEEE Transactions on, vol. 9, pp. 1994-2000, 1994.
[3] J. Nanda, D. P. Kothari, and K. S. Lingamurthy, “Economic-emission load dispatch through goal programming techniques,” Energy Conversion, IEEE Transactions on, vol. 3, pp. 26-32, 1988.
[4] T. Niknam, F. Golestaneh, and M. S. Sadeghi, “Multiobjective Teaching-Learning-Based Optimization for Dynamic Economic Emission Dispatch,” Systems Journal, IEEE, vol. 6, pp. 341-352, 2012.
[5] B. F. Hobbs, H. Ming-Che, C. Yihsu, J. H. Ellis, A. Paul, D. Burtraw, and K. L. Palmer, “From Regions to Stacks: Spatial and Temporal Downscaling of Power Pollution Scenarios,” Power Systems, IEEE Transactions on, vol. 25, pp. 1179-1189, 2010.
- 3.8 -
Generation Dispatch Methodology under Low Carbon Emission Scenario

[6] T. Colos and M. L. Unguresan, “Method of numerical simulation for the air pollution dispersion,” in Automation Quality and Testing Robotics (AQTR), 2010 IEEE International Conference on, 2010, pp. 1-4.
[7] A. A. Osalu, M. A. Kaynejad, E. Fatehifar, and A. Elkamel, “Developing a New Air Pollution Dispersion Model with Chemical Reactions Based on Multiple Cell Approach,” in Environmental and Computer Science, 2009. ICECS ’09. Second International Conference on, 2009, pp. 24-28.
[8] D. R. Middleton, “Modelling air pollution transport and deposition,” in Pollution of Land, Sea and Air: An Overview for Engineers, IEE Colloquium on, 1995, pp. 11/1-11/7
[9] J. Tseyen-Oidov, Z. Battogtokh, A. Tumenbayar, The Issues of Standardization of Some Pollutants Emitted during Thermal Power Generation, Research Paper, Collection, 2004
[10] D.G. Streets, S.T. Waldhoff. Present and future emissions of air pollutants in China: SO2, NOx and CO. Atmospheric Environment, 2000, 34(3): 363-374.
[11] Yu Zhao, Shuxiao Wang, Lei Duan, Yu Lei, Pengfei Cao, Jiming Hao. Primary air pollutant emissions of coal-fired power plants in China: Current status and future prediction. Atmospheric Environment, 2008, 42(36):8442-8452.
[12] C.J. Frost, S.A. McKeen, M. Trainer, et al. Effects of changing power plant NOx emission on ozone in the eastern United States: Proof of concept. Journal of Geophysical Research, vol.111, D12306, 2006.
[13] North American Power Plant Air Emissions, 2004 [Online].Available: http://www.cec.org/Storage/56/4876_PowerPlant_AirEmission_en.pdf
[14] Carbon Dioxide Emissions From Power Plants Rated Worldwide, 2007 [Online].Available: http://www.sciencedaily.com/releases/2007/11/ 071114163448.htm
[15] Mercury and Air Toxics Standards, [Online].
http://www.epa.gov/mats/index.html
[16] Emission Standard of Air Pollutants for thermal power plants, 2001 [Online]. Available: http://www.zhb.gov.cn/gkml/hbb/qt/201109/ t20110921_217526.htm
[17] N. Kularatna, B.H. Sudantha. An Environmental Air Pollution Monitoring System Based on the IEEE 1451 Standard for Low Cost Requirements. Sensors Journal, IEEE , vol.8, no.4, pp.415-422, April 2008.
[18] Shuting Li, Shujun Song, Xin Fei. Spatial characteristics of air pollution in the main city area of Chengdu, China. Geoinformatics, 2011 19th International Conference on , vol., no., pp.1-4, 24-26 June 2011.
[19] Georg A. Grell, Steven E. Peckham, et al. Fully coupled “online” chemistry within the WRF model. Atmospheric Environment ,2005, 39(37):6957-6975.
[20] Weiqiang Wang, Ying Guo. Air Pollution PM2.5 Data Analysis in Los Angeles Long Beach with Seasonal ARIMA Model. Energy and Environment Technology, 2009. ICEET '09. International Conference on, vol.3, no., pp.7-10, 16-18 Oct. 2009.
[21] R.D Zimmerman. AC power flows, generalized OPF costs and their derivatives using complex matrix notation. [Online].Available: http://www.pserc.cornell.edu/matpower.
[22] T.A.Davis, “Algorithm 832: UMFPACK, an unsymmetric-pattern multifrontal method,” ACM Transactions on Mathematical Software, vol. 30, no. 2, pp. 196-199, 2004.
[23] Z. Qin, Y. Hou “Application of Non-linear Programming for Large-Scale AC-DC Power Flow Analysis,” in Proc. 2012 IEEE Power and Energy Society General Meeting -, 23-26 July 2012.
NOTES
1. This work is partly supported by the Research Grant Council, Hong Kong SAR (RGC-HKU
- 3.9 -
Generation Dispatch Methodology under Low Carbon Emission Scenario
PaperNo. 3

7124/10E, RGC-HKU 7124/11E), National Key R e s e a r c h P r o g r a m ( 9 7 3 P r o g r a m , 2012CB215102) and National Natural Science Foundation of China (51277155)
2. Yunhe Hou, Zhijun Qin and Chong Wang are with the Electrical and Electronic Engineering Department, University of Hong Kong, Hong Kong, China. (e-mail: [email protected], [email protected], [email protected])
3. Xi Wang is with school of chemistry and environment, South China Normal University, China(e-mail: [email protected])
Generation Dispatch Methodology under Low Carbon Emission Scenario
- 3.10 -

- Notes and Questions -

- Notes and Questions -

Paper No. 4
ZERO CARBON BUILDING ANDITS KEY CARBON NEUTRALITY STRATEGIES
Speakers : Ir Dr G.Y. LiSenior Manager (Research)Construction Industry Council
Ir Dr Raymond M.H. YauDirectorOve Arup & Partners Hongkong Ltd.
- 4.1 -
ZERO CARBON BUILDING ANDITS KEY CARBON NEUTRALITY STRATEGIES
Ir Dr G.Y. Li, Senior Manager (Research)Construction Industry Council
Ir Dr Raymond M.H. Yau, DirectorOve Arup & Partners Hong Kong Ltd.
PaperNo. 4
ABSTRACT
In Hong Kong, buildings consume most of the energy and are the major contributor to the Green House Gas (GHG) emissions. To this end, the Hong Kong Construction Industry Council (CIC) has initiated a series of initiatives to reduce the GHG emissions from the construction industry, and has developed the first Zero Carbon Building (ZCB) in Hong Kong. Located in Kowloon East, the ZCB integrates the state-of-the-art design and technologies, including passive design, active systems and the renewable energy systems with a view to achieving the zero carbon emissions. The main objective of the ZCB is to showcase the state-of-the-art eco-building design and technologies to the construction industry internationally and locally as well as to raise the awareness of sustainable living in Hong Kong. This paper highlights the key engineering considerations of the ZCB design.
Figure 1 Artist Impression of Zero Carbon Building
1. INTRODUCTION
The project is an attempt to create a new kind of zero carbon environment that integrates work, education and social well-being. The ZCB is designed to address specific local challenges in achieving zero carbon and is fitted out with over 90 environmental features which will allow local and international researchers to explore and understand future design practices. The total site area is about 14,700sqm (including the ZCB with a footprint of 1,400sqm). The three-storey building comprises of an exhibition/education centre, an eco-home show, an eco-cafe and a multi-function room; the open space is the first native urban woodland in Hong Kong. The venue will also be open to the public for “green weddings” and other sustainable living experiences.
1.1 OVERALL OBJECTIVE
Carbon Neutral Energy Positive - The CIC ZCB has its mission in carbon neutrality. The ZCB is connected to the local power utility grid and produces on-site renewable energy for offsetting the site energy consumption supplied by the grid on an annual basis. The ZCB also goes beyond the common definition of a Zero Carbon Building by exporting surplus renewable energy to the local grid to offset the embodied energy of its construction process and major structural materials. The renewable energy is generated from on-site renewable energy systems – biodiesel tri-generation system and PV systems.
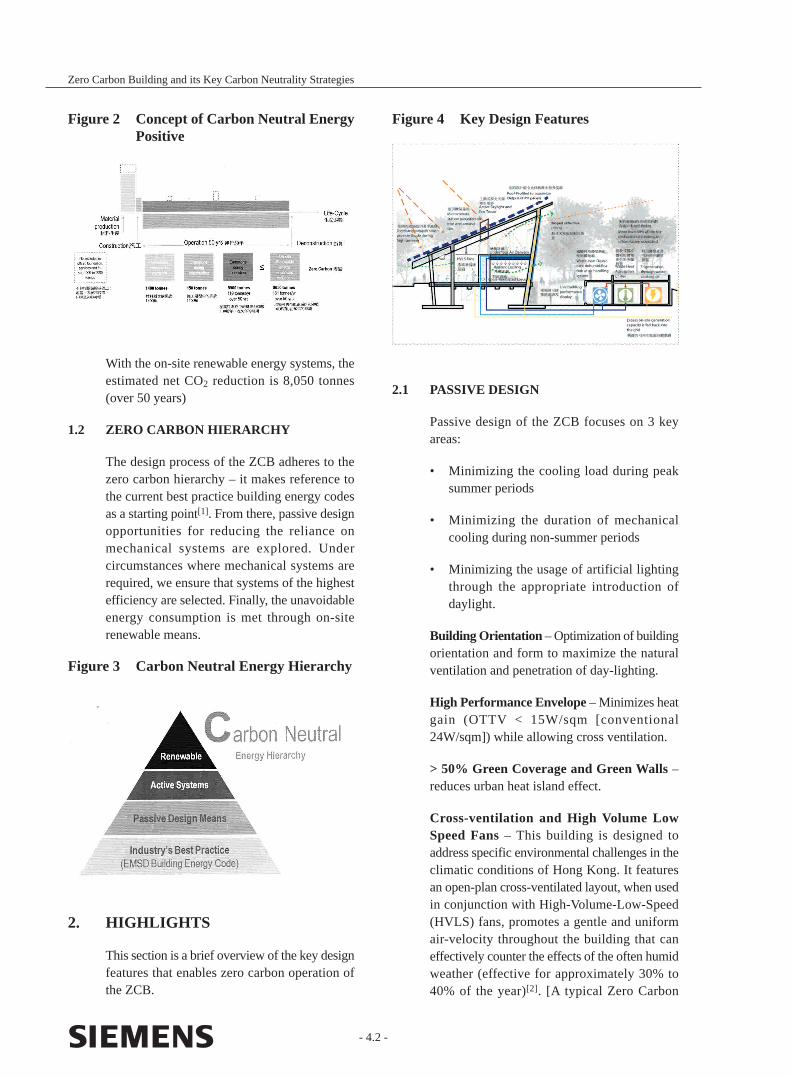
With the on-site renewable energy systems, the estimated net CO2 reduction is 8,050 tonnes (over 50 years)
1.2 ZERO CARBON HIERARCHY
The design process of the ZCB adheres to the zero carbon hierarchy – it makes reference to the current best practice building energy codes as a starting point[1]. From there, passive design opportunities for reducing the reliance on mechanical systems are explored. Under circumstances where mechanical systems are required, we ensure that systems of the highest efficiency are selected. Finally, the unavoidable energy consumption is met through on-site renewable means.
Figure 3 Carbon Neutral Energy Hierarchy
2. HIGHLIGHTS
This section is a brief overview of the key design features that enables zero carbon operation of the ZCB.
2.1 PASSIVE DESIGN
Passive design of the ZCB focuses on 3 key areas:
• Minimizing the cooling load during peak summer periods
• Minimizing the duration of mechanical cooling during non-summer periods
• Minimizing the usage of artificial lighting through the appropriate introduction of daylight.
Building Orientation – Optimization of building orientation and form to maximize the natural ventilation and penetration of day-lighting.
High Performance Envelope – Minimizes heat gain (OTTV < 15W/sqm [conventional 24W/sqm]) while allowing cross ventilation.
> 50% Green Coverage and Green Walls – reduces urban heat island effect.
Cross-ventilation and High Volume Low Speed Fans – This building is designed to address specific environmental challenges in the climatic conditions of Hong Kong. It features an open-plan cross-ventilated layout, when used in conjunction with High-Volume-Low-Speed (HVLS) fans, promotes a gentle and uniform air-velocity throughout the building that can effectively counter the effects of the often humid weather (effective for approximately 30% to 40% of the year)[2]. [A typical Zero Carbon
- 4.2 -
Zero Carbon Building and its Key Carbon Neutrality Strategies
Figure 2 Concept of Carbon Neutral Energy Positive
Figure 4 Key Design Features
- 4.3 -
Zero Carbon Building and its Key Carbon Neutrality Strategies
Building, most of them in Northern Climates, is basically designed to be tightly sealed boxes with little environmental exchange with the exterior.]
Automatic Windows and User Control – A number of high-level windows are centrally controlled by coordinating their operation with the air-conditioning (A/C) strategy. At the same time, there are a number of low-level windows that can be controlled by the user to tailor the amount of ventilation and wind-speed at the occupied level.
Microclimate Monitoring – The “passive operation” of the building is controlled by a centralized Building Management System that monitors the external conditions to optimize the operation of window and its interface with the air-conditioning systems. Four microclimate monitoring stations are placed on and around the building to enhance our understanding of how the building performs and interacts with its surroundings. This is particularly important in the high-density context of Hong Kong.
Natural Lighting – Daylight, with little of the associated heat, is allowed to diffuse through the large north-facing facade. The sloped ceiling amplifies the interior brightness through reflection. This is coupled with a dimming system that adjusts the level of artificial lighting to minimize energy consumption.
Light-tubes – Daylight harvesting devices that direct daylight deep into the core of the building.
2.2 ACTIVE SYSTEMS
High Temperature Systems - Under air-conditioned mode, the building uses an advanced concept: high supply air temperature system consisting of underfloor air-supply, radiant system and desiccant dehumidification. To achieve the desired room conditions of 26°C, 55% RH, conventional system overcools the supply air (10°C to 14°C) to achieve dehumidification. In this design, the humid fresh-air is pre-treated through a desiccant dehumidification process; hence the air and coil temperatures can be significantly higher, thus putting lesser load on the chillers.
PaperNo. 4
Task-lighting – Rather than uniformly lighting the areas to a high-level of brightness, most of the building areas will be illuminated to approximately 200lux (appropriate for circulation), while task-lighting is provided at areas where fine work occurs (office desk, display etc).
CO2 Sensor – The cooling and dehumidification of fresh-air requires large amounts of energy. The CO2 sensors monitor the air-quality within occupied spaces and adjusts the amount of fresh-air provided to each space as required.
Occupancy and Daylight Sensors – Occupancy sensors are adopted for switch-off the lighting of office areas divided in zones and partitioned rooms should there be no occupants over a preset period. Daylight sensors are provided at the perimeter of office areas for monitoring the daylight level and dim the associated lighting to desired level according to the pre-set program of dimmer rack system.
Active Skylights – A controllable skylight that allows users to actively adjust the natural daylight level through control of louver blades.
Low Energy Office Equipment – A number of requirements is specified for the office occupants in terms of equipment efficiency and usage.
Comprehensive Monitoring – More than 2,600 sensors are built into the building reporting on every aspect of the building performance. The results are displayed interactively on a 3-D model of the building in real-time.
2.3 RENEWABLE ENERGY
Figure 5 Energy Cascade
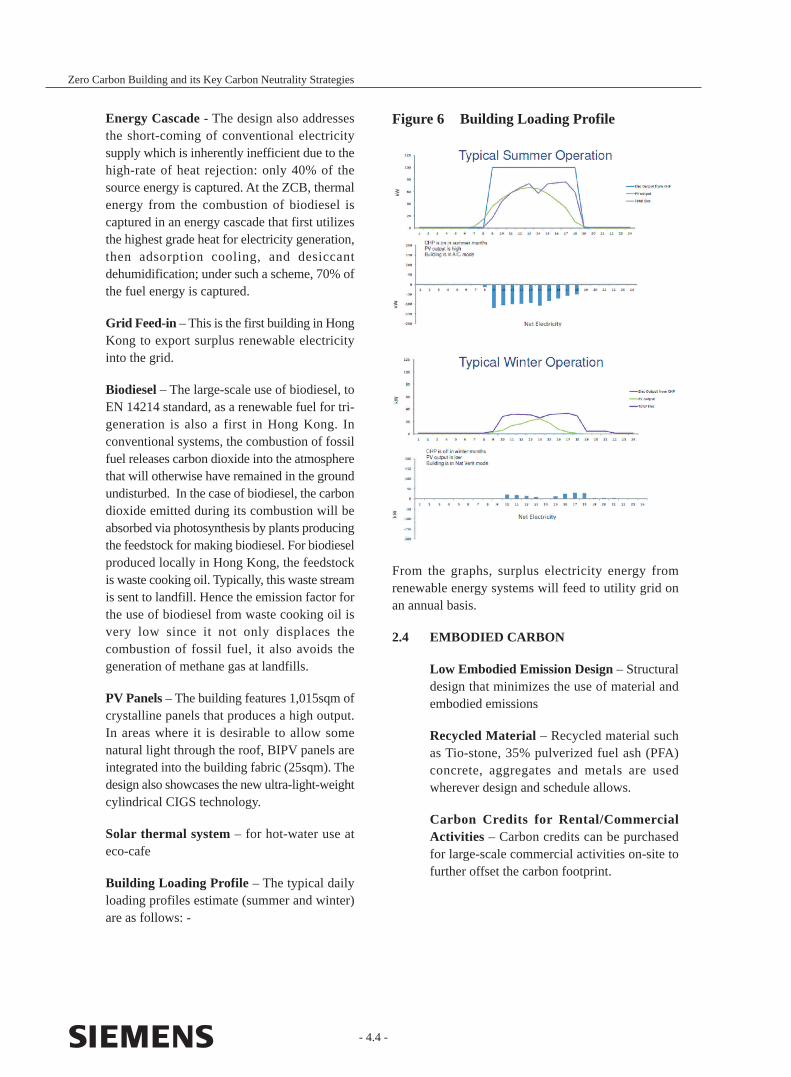
- 4.4 -
Zero Carbon Building and its Key Carbon Neutrality Strategies
Energy Cascade - The design also addresses the short-coming of conventional electricity supply which is inherently inefficient due to the high-rate of heat rejection: only 40% of the source energy is captured. At the ZCB, thermal energy from the combustion of biodiesel is captured in an energy cascade that first utilizes the highest grade heat for electricity generation, then adsorption cooling, and desiccant dehumidification; under such a scheme, 70% of the fuel energy is captured.
Grid Feed-in – This is the first building in Hong Kong to export surplus renewable electricity into the grid.
Biodiesel – The large-scale use of biodiesel, to EN 14214 standard, as a renewable fuel for tri-generation is also a first in Hong Kong. In conventional systems, the combustion of fossil fuel releases carbon dioxide into the atmosphere that will otherwise have remained in the ground undisturbed. In the case of biodiesel, the carbon dioxide emitted during its combustion will be absorbed via photosynthesis by plants producing the feedstock for making biodiesel. For biodiesel produced locally in Hong Kong, the feedstock is waste cooking oil. Typically, this waste stream is sent to landfill. Hence the emission factor for the use of biodiesel from waste cooking oil is very low since it not only displaces the combustion of fossil fuel, it also avoids the generation of methane gas at landfills.
PV Panels – The building features 1,015sqm of crystalline panels that produces a high output. In areas where it is desirable to allow some natural light through the roof, BIPV panels are integrated into the building fabric (25sqm). The design also showcases the new ultra-light-weight cylindrical CIGS technology.
Solar thermal system – for hot-water use at eco-cafe
Building Loading Profile – The typical daily loading profiles estimate (summer and winter) are as follows: -
Figure 6 Building Loading Profile
From the graphs, surplus electricity energy from renewable energy systems will feed to utility grid on an annual basis.
2.4 EMBODIED CARBON
Low Embodied Emission Design – Structural design that minimizes the use of material and embodied emissions
Recycled Material – Recycled material such as Tio-stone, 35% pulverized fuel ash (PFA) concrete, aggregates and metals are used wherever design and schedule allows.
Carbon Credits for Rental/Commercial Activities – Carbon credits can be purchased for large-scale commercial activities on-site to further offset the carbon footprint.
3. CONCLUSION
3.1 PERFORMANCE
The site is expected to consume approximately 130MWh of energy each year (~ 70kWh/sqm/yr for building related energy), while on-site renewable are expected to supply approximately 230MWh of electricity per annum, of which 100MWh will be exported to the utility grid. Not only will the operation of the building be zero carbon, the energy export will also offset over 2,000 tonnes of CO2e over its 50 year life-cycle – approximately equivalent to the embodied carbon within its major structural components.
Figure 7 Passive and Active Design vs Low & Zero Carbon Technologies
- 4.5 -
Zero Carbon Building and its Key Carbon Neutrality Strategies
3.2 LESSONS LEARNT
Designing for Local Context – while there are many zero carbon buildings in relatively cool or mild climates (typically designed to be tightly sealed spaces with little energy exchange with the exterior), there are relatively few examples in the hot and humid sub-tropical climate such as in Hong Kong. For the CIC ZCB, the design team experimented with a building that has the flexibility to switch between a tightly sealed air-conditioned environment, to a highly porous cross-ventilated mode with low thermal storage capacity. The objective is to create a gentle but uniform air-movement throughout the building to counter the often high humidity of Hong Kong.
Biodiesel - The decision to incorporate biodiesel tri-generation as a zero carbon fuel source was the subject of much debate. While living within
PaperNo. 4
the solar or wind “footprint” of the site is a lofty ideal, the requirements for flexible use of space that can incorporate different commercial activities meant that other fuel source with higher energy density must be considered. The decision was further helped by the fact that biodiesel is produced locally in Hong Kong with waste cooking oil as feedstock. Typically, this waste stream is sent to landfill. Hence the emission factor for the use of biodiesel from waste cooking oil is very low since it not only displaces the combustion of fossil fuel, it also avoids the generation of methane gas at landfills.
3.3 SUMMARY
The ZCB is expected to cater for 40,000 visitors per year, for a wide range of functions: zero carbon exhibition tours, seminars and conferences, eco-wedding. Office space for about 30 permanent occupants is also included.
ACKNOWLEDGEMENT
The authors gratefully acknowledge the design contributions of Ronald Lu and Partners (Architectural Design) and URBIS (landscape design).
We also greatly appreciate Ir Desmond C.S. Lam, Gigi Kam and Trevor Ng of Ove Arup & Partners Hong Kong Limited for co-authoring this paper.
REFERENCES
[1] Code of Practice for Energy Efficiency of Building Services Installation, Electrical and Mechanical Services Department, HKSAR Government, 2012
[2] Thermal Environmental Conditions for Human Occupancy (ANSI approved), ANSI/ASHRAE 55-2010
NOTES
1. This project is funded by the Construction Industry Council.

- Notes and Questions -
Paper No. 5
LATEST TECHNOLOGIES OF LIGHTING DESIGNTO ACHIEVE LOW CARBON LIVING
Speaker : Mr Kelon K.K. YanManager, Lighting DivisionMegaman (HK) Electrical & Lighting Ltd.
- 5.1 -
LATEST TECHNOLOGIES OF LIGHTING DESIGNTO ACHIEVE LOW CARBON LIVING
Mr Kelon K.K. YanManager, Lighting Division
Megaman (HK) Electrical & Lighting Ltd.
PaperNo. 5
ABSTRACT
This paper gives an account on the latest techologies of lighting design. The lighting industries have a number of advanced hardware and software technologies these days that enhance the lighting quality and minimize energy consumption, which in turns lower the carbon emission. Lighting systems like solid state modules with “Zhaga” consortium, interactive day lighting, and electroless compact metal halide will be introduced. Different diffusion materials and lighting simulation software will also be detailed.
1. INTRODUCTION
Do you know what percentage of Greenhouse Gases (GHG) emission in Hong Kong is caused by lighting?
According to the data provided by Environmental Protection Department (EPD) in 2008, electricity generation accounts for more than 65% of total GHG emission in Hong Kong. As no less than 80% of total GHG is carbon dioxide (CO2), more than 50% of carbon dioxide emission in Hong Kong arises from electricity generation.
Referring to the “Hong Kong Energy End-use Data 2011’ published by Electrical and Mechanical Services Department (EMSD), 11% of the end-uses of electricity in Hong Kong in 2009 is on lighting (being the second place of well-defined electrical systems on electricity end-uses consumption). Therefore, we got the figure of about 5% of carbon dioxide generated in Hong Kong arises from use of lighting. Though the percentage is not that high, there is room to reduce carbon dioxide emission arising from lighting. A good lighting design and installation can greatly improve energy efficiency and can lead to a lower carbon lifestyle for our
community.
The “must-do” item for new building is – daylighting, but is there any system(s) other than using window and light well that can improve the daylight efficiency of the building?
The artificial lighting system was marked by rapid development of solid state lighting (SSL) technology. However, different companies have their own specifications on retrofit lamp source and light engine. It causes great problems of comparing and replacing products of different companies. The inducting consortium “Zhaga” provides a solution to the problems and it starts a revolution on LEDs lighting utilization. Other than LEDs, is there any lighting technology that gives high luminous intensity for high level and area lighting applications?
Diffusing materials are widely used on different kind of luminaires to re-distribute the light and reduce the glare generated by the lamp source, especially for uni-directional light source – “LED”. With the introduction of materials of better transmission and diffusion characteristics, both the Light Output Ratio (LOR) and Unified Glare Ratio (UGR) of luminaires are improved. As a result, lighting becomes more effective.
To verify whether the new designs are energy-efficient and complied with illuminance level (lux) and lighting power density (W/m2) requirements or not, computer simulation of the lighting comes to place. The latest lighting simulation software has the following functions: lighting scenarios setting, daylight X artificial light energy consumption, high resolution rendering picture and 2D/3D videos. All these interactive and visual outputs help designers to verify their designs on numerical aspect and also a better realization of their designs by visualization.
- 5.2 -
Latest Technologies of Lighting Design to Achieve Low Carbon Living
In brief, the lighting industries have a number of latest technologies on both hardware and software driving at better lighting quality and leading to lower carbon emission.
2. INTERACTIVE DAYLIGHTING SYSTEM
Daylighting is the use of natural lighting for illumination of an indoor space wherein openings such as windows and skylights are made use of allowing daylight to enter into the building. Windows are the most common type of day lighting system. Many rooms have windows on one side only. As a result, the light level of the natural lighting falls off quickly as one move away from the window.
Architectural apertures such as skylight, saw-tooth, monitor and light well are the most common types of “daylight collector” which architects frequently apply in their building designs. Other than these, other methodologies to introduce daylight are also considered by architects. Direct light gives strong light in a given area but less general light in the surrounding area. It is good when strong light is required in an area for works requiring high lighting intensity such as painting. Diffuse Light is good for lighting over a large area with minimal shadows. Diffuse light is usually used in most industrial, commercial and sporting facilities.
The best way to incorporate daylighting in a design depends on the climate and the design aspect. South-facing windows are most advantageous for day lighting and for moderating seasonal temperatures. North-facing windows admit relatively even, natural light, producing little glare and let in almost no unwanted summer heat gain. The east- and west-facing windows provide good daylight penetration in the morning and evening but they may cause glare, admit a lot of heat during the summer, and contribute little to solar heating during the winter.
Is there any interactive daylighting system to improve the daylight efficiency?
A German luminaire manufacturer introduced
the daylight systems which are designed to allow “cool” diffuse daylight to penetrate the building, whilst reflecting the high thermal content of direct light back into the atmosphere. The blocked area is oriented towards the direct sunlight path and the allowable areas of the panel towards the sky. Both prismatic and louver systems are used for optimum results and these can be either fitted within a glazed system or installed in front of them. The orientation and construction of the chosen system depends upon the building’s location and geographical alignment. Four types of “Interactive Lighting Systems” are discussed below:
• Static prism system – a transparent sun protection system for glass roof that prevents the ingress of the solar heat into the interior of the building and at the same time, allows a maximum of diffuse daylight illuminating the area. Sunlight protection is based on directional reflection and transmission with a pre-defined blocking and transmission span. The blocking area of the system reflects incident sunlight. The transmission area is designed so that a maximum level of diffuse daylight can enter into the interior.
Figure 1 Magdeburg University – Library Atrium’s Skywindow Installed with Static Prism System.
- 5.3 -
Latest Technologies of Lighting Design to Achieve Low Carbon Living
• CombiSol Sun & Glare Protection Louvre reflects direct sunlight incident from defined angles outwards but allows diffuse daylight from all other directions passing through. The CombiSol louvre prevents the 'hot' light
PaperNo. 5
• Moveable Prism System – a transparent sun protection system for façades and glass roofs that prevents the ingress of the solar heat into the interior of the building and at the same time lets through a maximum of diffuse daylight. It consists of non-seculars prismatic plates that reflect incident light entering from a direction perpendicular to the longitudinal axis of the prismatic structures according to the law of total reflection. Diffuse daylight coming from all other directions is almost completely let through.
Figure 2&3 Bonn Plenary Building: Conference Hall was Installed with the Moveable Prism. Library Atrium’s Skywindow was Installed with Static Prism System.
from the sun entering the interior space, reduces effects of glare from the sun and at the same time allows a maximum of 'cool' diffuse daylight illuminating the area.
• Micro Sun Shielding Louvre reflects direct sunlight incident from particular directions outwards but allows diffuse daylight from all other directions passing through. The micro sun shielding louvre prevents the 'hot' solar radiation from entering the interior space, reduces of glare from sunlight and at the same time allows most 'cool' diffuse daylight to enter. It is also an insulating glass unit which can be used for glazed roofs to provide solar-control and glare-free daylight. The relation of the blocking admission area of the louvre to the daylight hemisphere is due to the special construction coupled with the exact setting of the louvre blades to the orbit of the sun.
Figure 4 The Sectional Construction of Micro Sun Shielding Louvre
Figure 5 Operating Principle of the Micro Sun Shielding Louvre
- 5.4 -
Latest Technologies of Lighting Design to Achieve Low Carbon Living
These daylighting systems are used to overcome imperfect location and orientation regarding daylighting of the buildings. They can also improve both the quality and efficiency of daylighting by reducing radiant heat of the natural light. It is an effective method to reduce the carbon emission of buildings.
3. ZHAGA – UTILIZE THE MEMBERS OF LED’S MODULES
The application of LED has been evolving alongside with the rapid technological development. From low power & low light emitting diode for indication purpose, to higher lumen output with colour changing for larger area decorative purpose, and then the invention of blue LED for directional light, and to the use of LED for general lighting, the use of LED surpasses traditional light bulbs which consume a much larger portion of power in heat emission instead of light output. With the global trend to pursue more energy saving product, LED is the first choice for residential and commercial lighting. The uses of LED become more and more widespread. An example is the use of new design of LED as replacement for high pressure lamps, the road light.
An LED module consists of several components working together to produce light from a light emitting diode (LED). The components include LEDs packaged on a circuit board, drive electronics, a thermal interface and control electronics, a mechanical interface, and an electrical interface. A module is best to work with tailor-made luminaire to ensure a particular light distribution with built-in accessory, e.g. reflector, diffuser, glare shield...etc. Meanwhile, many LED modules are not interchangeable with products of other brands. It thus limits the use of individual modules and also causes difficulties for buyers to look for compatible module for a luminaire.
A recognizable standard is needed to guide the design and development of LED modules, and to enable interchangeability of LED light sources made by different manufacturers. Also, it can prevent market fragmentation into incompatible
products. An industry-wide cooperation among companies named “Zhaga” was established in 2010. The consortium creates specifications that cover the physical dimensions, photometric, electrical and thermal behavior of LED light engines.
The rationales behind the industry specification made by the Zhaga consortium include fulfilling expectations of consumers and the drive of production of compatible LED products by different manufacturers for the benefits of the consumers. Since the establishment of the consortium, more and more sophisticated LED makers and luminaire manufacturers are joining it.
Below are some examples of Zhaga compliance modules, from Book 2 to Book 7 (Book 1 is about general description including definitions, principles and electronic control, gear dimensions).
• Book 2 – Socketable LED light engine with integrated electric control gear, for example, Fortimo Twisable, Tecoh CFX, etc.
• Book 3 – Spot LED light engine with separate electronic control gear, for example, Cetero Spot Light Module, PrevaLED, etc.
• Book 4 – Flat emitter LED light engine for street lighting with separated electronic control gear, example, Fortimo HBM, HPML, etc.
• Book 5 – Socketable LED light engine with separate electric control gear,
• Book 6 – Compact socketable LED lighting engine with integrated electric control gear.
Figure 6 Zhaga Book 2-7 Showing the Generic Form and Shape of LED Modules
- 5.5 -
Latest Technologies of Lighting Design to Achieve Low Carbon Living
PaperNo. 5
LEDs complying with the standards are interchangeable with any brands in the same “Zhaga book’. On top of the ongoing global trend to retrofit less energy efficient Compact Fluorescent Lamp or incandescent lighting equipment with LEDs, the standardization of LED modules enables the direct and suitable physical replacement. In the earlier stage of LED development, there was confusion in the market with diverse forms of LED lamp sources which could not fit in with luminaires other than those tailor-made. Standardization of LED modules benefits the buyers. It streamlines the whole market from chaos of an experimental period to a sophisticated and professional market.
4. LEP – ELECTROLESS COMPACT METAL HALIDE
Have you heard of “Light Emitting Plasma (LEP)”? It is a species of Solid State Lighting (SSL) belonging to the same category of products of “LED”. It is an electrodeless lamp bulb and is filled with metal halide gas in extremely compact size.
Why LEP is better than LED? Firstly, we have to know its construction and how it generates light. Sealed quartz bulb that contains metal halide materials and other gases is the “heart” of the LEP which is immersed into the “Puck” which is a ceramic resonator connected to the radio frequency (RF) power amplifier.
Figure 7 Sealed Quartz Bulb (the Middle Glass Tube) Immersed into the Puck to Form LEP’s Source.
The plasma light generation is started by the radio frequency (RF) power amplifier that converts electrical power to RF power. This causes ionization of the gases and evaporation of the metal halide forming an intense plasma column within the lamp which gives out extremely bright light.
The performance characteristics of LEP are better than that of LED because:
• High Intensity Package – How can you double the lumen intensity of a LED luminaire? You can only double the quantity of LED luminaires to give the double intensity. For LEP, one can use the original luminaire but changing the bulb to a bigger one with a higher power amplifier. Because the LEP size is compact when compared with the illumination optics, the emitter becomes more efficacious and can give a higher optical efficiency at high outputs.
• Full Spectrum of Light – In LEP, light is generated by resonance-ionization of metal halide causing plasma 'arc' which gives a full-spectrum of white light. On the other hand, the “white light” generated by LED requires a secondary phosphor conversion. Therefore, the illumination generated from the LEP source greatly enhances visibility and has a better color appearance compared with that of LED.
• Better Efficiency – LEP sources can be utilized to achieve higher application efficiency than LED because of its directionality and size. The directional source prevents light from being trapped inside the luminaire. Point source optics effectively map the source to the illuminated area, preventing unwanted light spill causing light-pollution.
Referring to the unique advantages of LEP listed above, it offers a better efficiency and better lighting quality solution for high level illumination, high intensity spotting and large area flooding applications which LEDs cannot match with.
- 5.6 -
Latest Technologies of Lighting Design to Achieve Low Carbon Living
5. DIFFUSING MATERIALS – LUMINAIRE’S EFFICIENCY DOMINATOR
Besides improvement of LED lamp source, there are ways in improving performance by choosing proper material of the lamp to achieve lower carbon emission, including material that improves light output and the application of recyclable material.
Improving light output ratio (LOR) of luminaire helps to reduce energy consumption. Sophisticated luminaire manufacturers have developed high technology materials to fully reflect & refract the emitted light to the area of use. Take an example of the ceiling recessed T8 modules with old-styled aluminum built-in reflectors, an average of 70% to 80% of the original emitted light is localized as usable light. In other words, 20% to 30% of light is lost being trapped in the luminaire and energy wasted.
Patented diffusing materials like Eldacon®
improves light penetration ability through luminaire diffuser. It is able to achieve LOR to about 90%. Also, with breakthrough of material structure, direction of refracted light can now be better controlled to achieve more efficient and glare-free lighting.
Makrolon® is a material designed for LED lamp source. It can combine with LED light (an uni-directional light) to delivering equal light diffusion, transforming direct and glary LED light into general light application. With higher light transmission comparing with traditional materials like PMMA, PVC or even glass diffuser, Makrolon® allows a higher rate of input energy to be transformed to desirable light.
Besides penetration ability, refraction & diffusion quality, the innate character of a material should also be considered in achieving low carbon living. Barrisol® membrane has been a popular light diffusing material for architectural design
because of its elasticity & easy-to-manage decorative diffuser property. Moreover, using light-weight or ultra-thin material like Barrisol®
can save material consumption comparing with old styled ceiling skirting board structured in wood for a similar lighting effect.
Figure 8 Makrolon® Lumen XT Sheet is a Translucent Polycarbonate Product with a Textured Surface on One Side Specifically Designed for Lighting Lenses.
Figure 9 Eldacon® Made Light Plan Turns the LED High Luminous Spots Into an Uniform Glare-free Luminate Surface for General Lighting Applications.
- 5.7 -
Latest Technologies of Lighting Design to Achieve Low Carbon Living
PaperNo. 5
6. LIGHTING SIMULATION SOFTWARE – REALIZATION OF LIGHTING DESIGN
Lighting design is inter-related with environmental design. For higher result accuracy, it is essential to have our lighting design first simulated in computer before construction. Several world renowned lighting simulation softwares such as ReluxPro and Dialux are free for download. Designers or architects can generate 3D virtual spaces with any forms, unique materials, colours, texture, assign reflection ability, selection of luminaire & light source...etc. The software allows rendering of lighting effect and putting all special requirements into scientific calculation. The lighting softwares allow the calculation of daylight into numerical and scientific result, helping professionals to present trust-worthy and realistic lighting proposals.
Eyes-appealing simulations are only a reference tool for designers to visualize their ideas, which can greatly facilitate the presentation of proposal to the clients. More importantly, the numerical calculation is the soul of a simulation. It consolidates useful information like illuminance levels at any particular surface including the minimum, maximum and average, glare rating (UGR), contrast ratio, object luminance, and especially total power consumption and power density which are required by building service departments for checking compliance with green building laws/requirements. The software, with the ability to combine calculation of daylight and artificial light, can produce results with accuracy of 80% or higher.
The various ways of daylighting in architecture including the use of windows, apertures, to the more advanced daylight systems and use of advanced materials can be included in a lighting simulation for refined calculation results.
The following are some office scenarios showing how the software can combine artificial lighting with daylight to create the visualization and numerical results.
Figure 10 Scene 1 – 08:00 @ Swiss, Daylight X Artificial Light Rendering Shown. Actual Power Used is 0.72kW with Working Table Illuminance Level of 508lux; If This Setting is Used for Whole Day, the Energy Consumption is 6.5kWh with CO2
Emission of 0.18kg.
Figure 11 Scene 2 – 16:00 @ Swiss, Daylight Rendering with Working Table Illuminance Level of 677lux; Hence No Electricity is Consumed.
Figure 12 Scene 3 – 21:00 @ Swiss, Artificial Light Rendering Shown. Actual Power Used is 1.82kW with Working Table Iluminance Level of 547lux. This Lighting Scene is Generated by Making Use of Direct/indirect Pendent Light Fittings with Wallwash Downlighters. You can also Adjust the Output or Switch Off Fittings Using the Control Panel.
- 5.8 -
Latest Technologies of Lighting Design to Achieve Low Carbon Living
7. CONCLUSION
The above description shows that our lighting industry is having some rapid technological developments recently including:
• the improvement of the reliability and efficiency of daylighting by introducing reflective system and tracking control system
• the emergence of high power solid state modules with “Zhaga” consortium; as a result, SSL luminaires can have more extensive applications
• The life time and efficiency of the traditional discharge lamp can be enhanced by making use of electromagnetic induction with frequency amplifier
• the introduction of higher transmission ratio diffusing materials to increase light output ratio of luminaire with less energy loss
• the design of lighting is facilitated by sophisticated lighting simulation software to be more accurate and realistic; daylighting and dimming can be easily integrated in the design stage.
All of the above can work independently on specific lighting application to improve the operation efficiency. On the other hand, they can work together to maximize energy efficiency, such as using lighting simulation software in doing lighting design together with mixed lighting solution (i.e. daylight X artificial light) in estimating the cost and the amount of carbon emission. It is true that continual development of lighting industry provides one of the effective ways to achieve low carbon sustainable living for our community.
REFERENCES
http://www.siteco.com/en/products/daylight-and-daylight-systems.html
http://www.zhagastandard.org/
http://www.lighting.philips.com/gb_en/subsites/oem/
http://www.terraluxillumination.com/technology/what-is-an-led-module/
http://voices.yahoo.com/an-introduction-led-module-technology-456497.html
http://www.lighting.co.uk
http://www.luxim.com/
http://www.materia.nl
http://www.curbellplastics.com
http://en.barrisol.com/
http://www.plexiglas.net/
http://www.relux.biz

- Notes and Questions -

- Notes and Questions -
Paper No. 6
FULLY AUTOMATIC OPERATION (FAO) SYSTEM DESIGNIN SOUTH ISLAND LINE (EAST) PROJECT
Speaker : Ir C.L. LeungChief E&M EngineerProjects DivisionMTR Corporation Limited
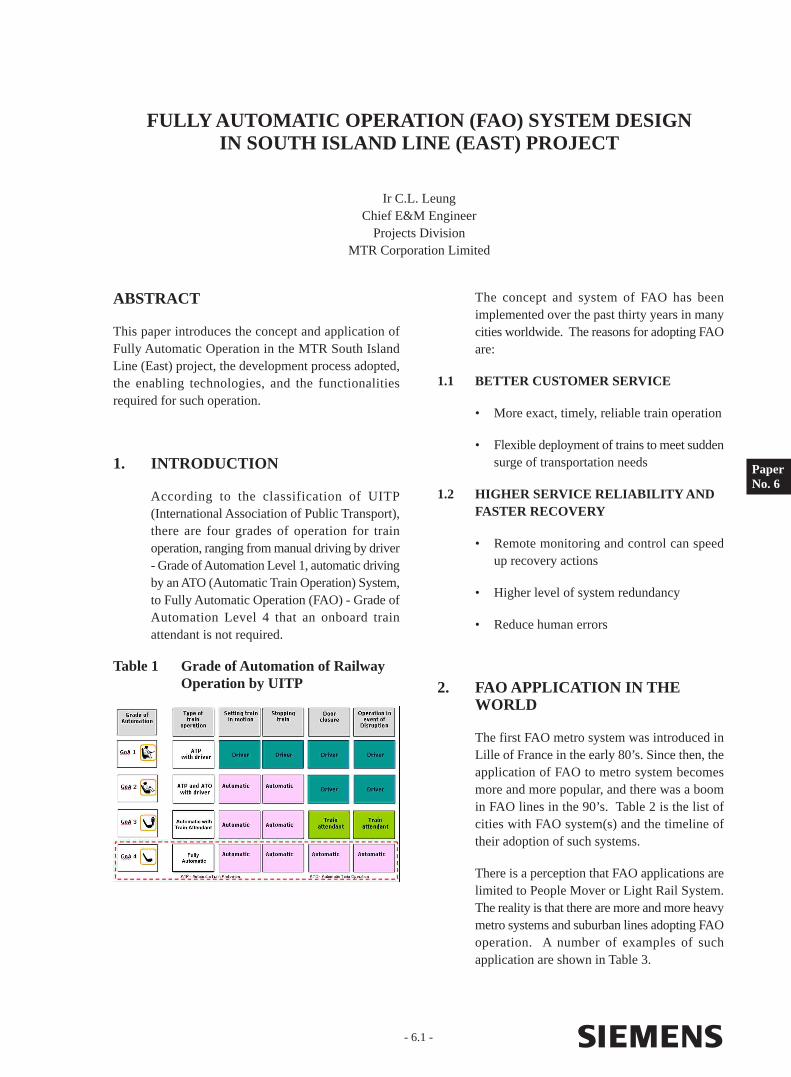
- 6.1 -
FULLY AUTOMATIC OPERATION (FAO) SYSTEM DESIGNIN SOUTH ISLAND LINE (EAST) PROJECT
Ir C.L. LeungChief E&M Engineer
Projects DivisionMTR Corporation Limited
PaperNo. 6
ABSTRACT
This paper introduces the concept and application of Fully Automatic Operation in the MTR South Island Line (East) project, the development process adopted, the enabling technologies, and the functionalities required for such operation.
1. INTRODUCTION
According to the classification of UITP (International Association of Public Transport), there are four grades of operation for train operation, ranging from manual driving by driver - Grade of Automation Level 1, automatic driving by an ATO (Automatic Train Operation) System, to Fully Automatic Operation (FAO) - Grade of Automation Level 4 that an onboard train attendant is not required.
Table 1 Grade of Automation of Railway Operation by UITP
The concept and system of FAO has been implemented over the past thirty years in many cities worldwide. The reasons for adopting FAO are:
1.1 BETTER CUSTOMER SERVICE
• More exact, timely, reliable train operation
• Flexible deployment of trains to meet sudden surge of transportation needs
1.2 HIGHER SERVICE RELIABILITY AND FASTER RECOVERY
• Remote monitoring and control can speed up recovery actions
• Higher level of system redundancy
• Reduce human errors
2. FAO APPLICATION IN THE WORLD
The first FAO metro system was introduced in Lille of France in the early 80’s. Since then, the application of FAO to metro system becomes more and more popular, and there was a boom in FAO lines in the 90’s. Table 2 is the list of cities with FAO system(s) and the timeline of their adoption of such systems.
There is a perception that FAO applications are limited to People Mover or Light Rail System. The reality is that there are more and more heavy metro systems and suburban lines adopting FAO operation. A number of examples of such application are shown in Table 3.

1981 – 1990 1991 – 2000 2001 onward
Europe France – Lille France – Lyon, Paris, Toulouse, Germany – Nuremberg
UK – London Rennes Denmark – Copenhagen
Switzerland – Lausanne Spain – Barcelona
North America Canada – Vancouver US – Detroit, Miami, Las Vegas Brazil – Sao Paulo
US – New York Airport
Asia Japan – Kobe, Osaka Japan – Tokyo Korea – Busan
Taiwan – Taipei China – Beijing Airport Line
Singapore – Bukit Panjang Singapore – Northeast Line,
Malaysia – KL Circle Line, Downtown Line
HK – Airport, Disney
Line Configuration Daily Ridership
Paris Line 14 6-car, 9km, 9 stations 450K (2007)
105s best headway
Paris Line 1 6-car, 16.6km, 25 stations 725K (Busiest line in Paris)
85s best headway
Singapore North East Line 6-car, 20km, 16 stations 379K (2010)
90s best headway
Taipei Wenhu Line 4-car, 14.8km, 13 stations 180K (2010)
72s best headway
Barcelona Line 9 5-car, 46km, 51 stations 270K (anticipated)
60s best headway
South Korea Sin Bundang Line 6-car, 25 kV 60 Hz, 100s best headway 110K (Suburban Line)
18.5km, 6 stations (in operation)
12.7km, 5 stations (under construction)
- 6.2 -
Fully Automatic Operation (FAO) System Design in South Island Line (East) Project
Table 3 Examples of Medium and Heavy Metro and Sub-urban Lines Adopting FAO
Table 2 Timeline of World-wide Railways Adopting FAO
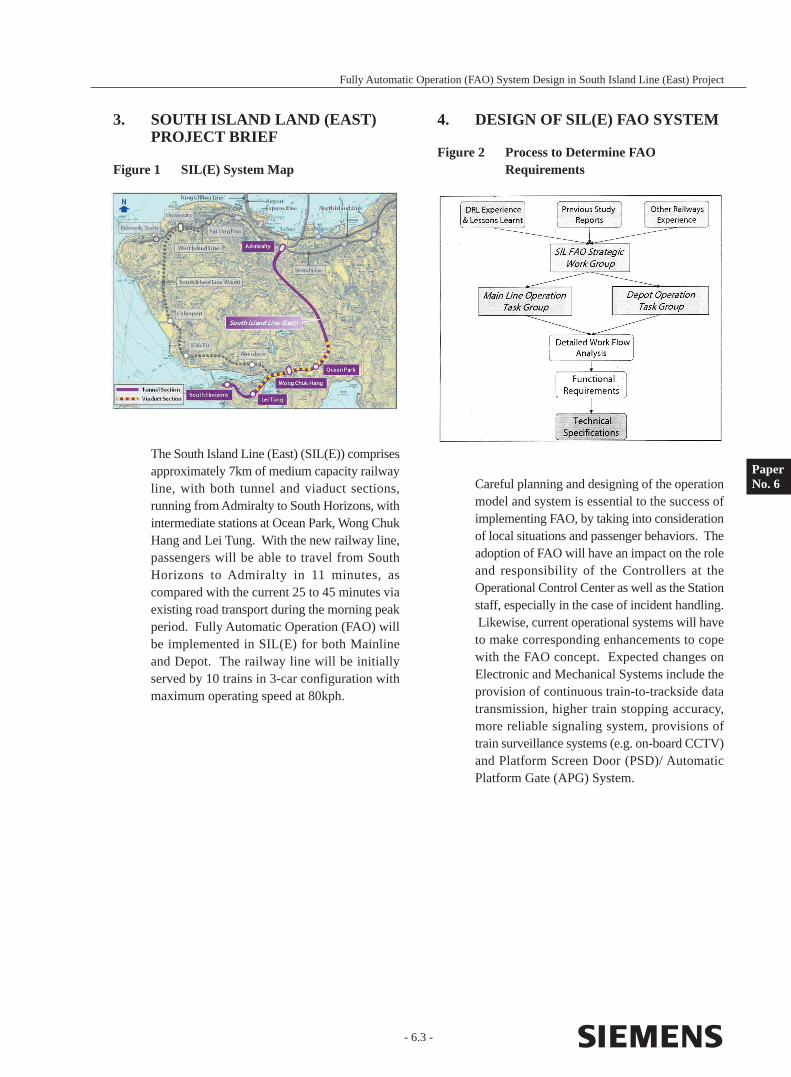
The South Island Line (East) (SIL(E)) comprises approximately 7km of medium capacity railway line, with both tunnel and viaduct sections, running from Admiralty to South Horizons, with intermediate stations at Ocean Park, Wong Chuk Hang and Lei Tung. With the new railway line, passengers will be able to travel from South Horizons to Admiralty in 11 minutes, as compared with the current 25 to 45 minutes via existing road transport during the morning peak period. Fully Automatic Operation (FAO) will be implemented in SIL(E) for both Mainline and Depot. The railway line will be initially served by 10 trains in 3-car configuration with maximum operating speed at 80kph.
Careful planning and designing of the operation model and system is essential to the success of implementing FAO, by taking into consideration of local situations and passenger behaviors. The adoption of FAO will have an impact on the role and responsibility of the Controllers at the Operational Control Center as well as the Station staff, especially in the case of incident handling. Likewise, current operational systems will have to make corresponding enhancements to cope with the FAO concept. Expected changes on Electronic and Mechanical Systems include the provision of continuous train-to-trackside data transmission, higher train stopping accuracy, more reliable signaling system, provisions of train surveillance systems (e.g. on-board CCTV) and Platform Screen Door (PSD)/ Automatic Platform Gate (APG) System.
- 6.3 -
Fully Automatic Operation (FAO) System Design in South Island Line (East) Project
3. SOUTH ISLAND LAND (EAST) PROJECT BRIEF
Figure 1 SIL(E) System Map
PaperNo. 6
4. DESIGN OF SIL(E) FAO SYSTEM
Figure 2 Process to Determine FAO Requirements
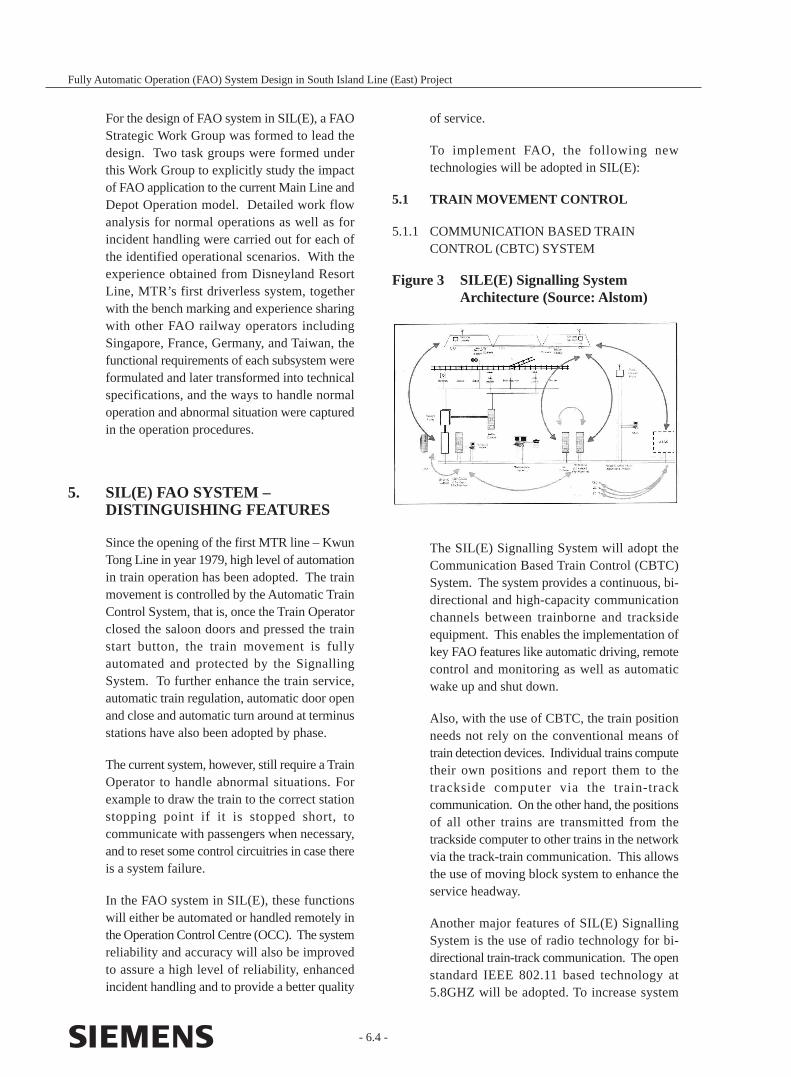
The SIL(E) Signalling System will adopt the Communication Based Train Control (CBTC) System. The system provides a continuous, bi-directional and high-capacity communication channels between trainborne and trackside equipment. This enables the implementation of key FAO features like automatic driving, remote control and monitoring as well as automatic wake up and shut down.
Also, with the use of CBTC, the train position needs not rely on the conventional means of train detection devices. Individual trains compute their own positions and report them to the trackside computer via the train-track communication. On the other hand, the positions of all other trains are transmitted from the trackside computer to other trains in the network via the track-train communication. This allows the use of moving block system to enhance the service headway.
Another major features of SIL(E) Signalling System is the use of radio technology for bi-directional train-track communication. The open standard IEEE 802.11 based technology at 5.8GHZ will be adopted. To increase system
- 6.4 -
Fully Automatic Operation (FAO) System Design in South Island Line (East) Project
For the design of FAO system in SIL(E), a FAO Strategic Work Group was formed to lead the design. Two task groups were formed under this Work Group to explicitly study the impact of FAO application to the current Main Line and Depot Operation model. Detailed work flow analysis for normal operations as well as for incident handling were carried out for each of the identified operational scenarios. With the experience obtained from Disneyland Resort Line, MTR’s first driverless system, together with the bench marking and experience sharing with other FAO railway operators including Singapore, France, Germany, and Taiwan, the functional requirements of each subsystem were formulated and later transformed into technical specifications, and the ways to handle normal operation and abnormal situation were captured in the operation procedures.
5. SIL(E) FAO SYSTEM – DISTINGUISHING FEATURES
Since the opening of the first MTR line – Kwun Tong Line in year 1979, high level of automation in train operation has been adopted. The train movement is controlled by the Automatic Train Control System, that is, once the Train Operator closed the saloon doors and pressed the train start button, the train movement is fully automated and protected by the Signalling System. To further enhance the train service, automatic train regulation, automatic door open and close and automatic turn around at terminus stations have also been adopted by phase.
The current system, however, still require a Train Operator to handle abnormal situations. For example to draw the train to the correct station stopping point if it is stopped short, to communicate with passengers when necessary, and to reset some control circuitries in case there is a system failure.
In the FAO system in SIL(E), these functions will either be automated or handled remotely in the Operation Control Centre (OCC). The system reliability and accuracy will also be improved to assure a high level of reliability, enhanced incident handling and to provide a better quality
of service.
To implement FAO, the following new technologies will be adopted in SIL(E):
5.1 TRAIN MOVEMENT CONTROL
5.1.1 COMMUNICATION BASED TRAIN CONTROL (CBTC) SYSTEM
Figure 3 SILE(E) Signalling System Architecture (Source: Alstom)
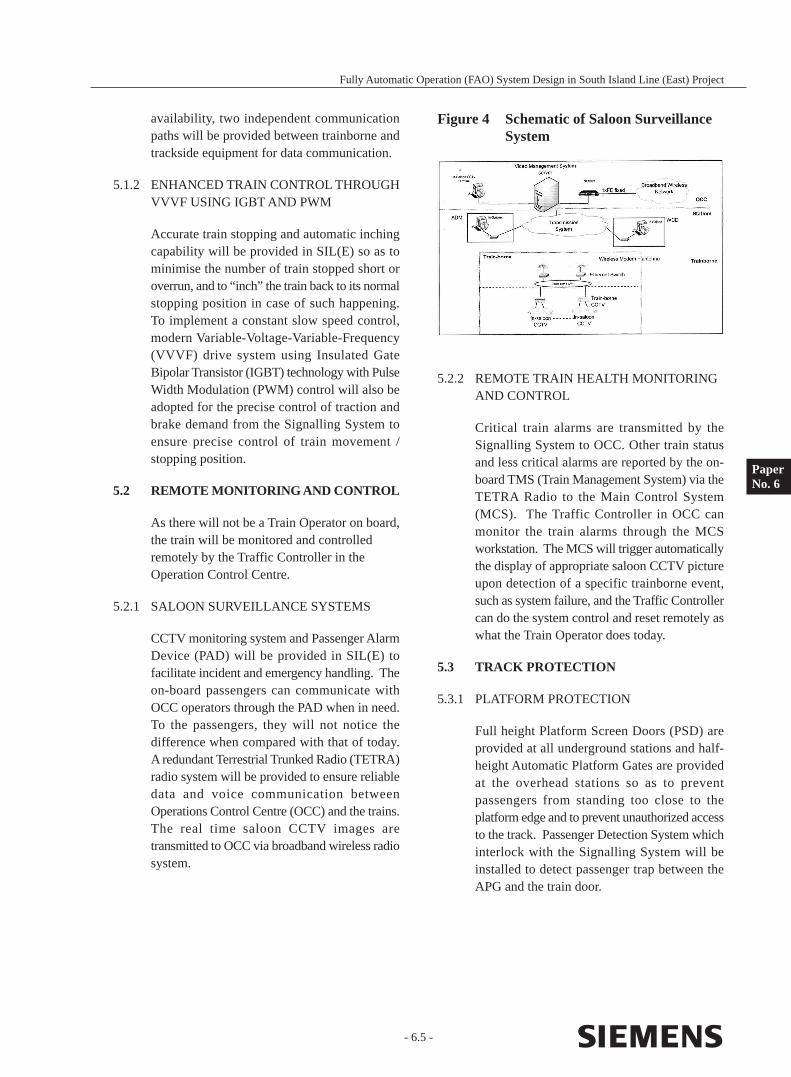
Figure 4 Schematic of Saloon Surveillance System
- 6.5 -
Fully Automatic Operation (FAO) System Design in South Island Line (East) Project
availability, two independent communication paths will be provided between trainborne and trackside equipment for data communication.
5.1.2 ENHANCED TRAIN CONTROL THROUGH VVVF USING IGBT AND PWM
Accurate train stopping and automatic inching capability will be provided in SIL(E) so as to minimise the number of train stopped short or overrun, and to “inch” the train back to its normal stopping position in case of such happening. To implement a constant slow speed control, modern Variable-Voltage-Variable-Frequency (VVVF) drive system using Insulated Gate Bipolar Transistor (IGBT) technology with Pulse Width Modulation (PWM) control will also be adopted for the precise control of traction and brake demand from the Signalling System to ensure precise control of train movement / stopping position.
5.2 REMOTE MONITORING AND CONTROL
As there will not be a Train Operator on board, the train will be monitored and controlled remotely by the Traffic Controller in the Operation Control Centre.
5.2.1 SALOON SURVEILLANCE SYSTEMS
CCTV monitoring system and Passenger Alarm Device (PAD) will be provided in SIL(E) to facilitate incident and emergency handling. The on-board passengers can communicate with OCC operators through the PAD when in need. To the passengers, they will not notice the difference when compared with that of today. A redundant Terrestrial Trunked Radio (TETRA) radio system will be provided to ensure reliable data and voice communication between Operations Control Centre (OCC) and the trains. The real time saloon CCTV images are transmitted to OCC via broadband wireless radio system.
PaperNo. 6
5.2.2 REMOTE TRAIN HEALTH MONITORING AND CONTROL
Critical train alarms are transmitted by the Signalling System to OCC. Other train status and less critical alarms are reported by the on-board TMS (Train Management System) via the TETRA Radio to the Main Control System (MCS). The Traffic Controller in OCC can monitor the train alarms through the MCS workstation. The MCS will trigger automatically the display of appropriate saloon CCTV picture upon detection of a specific trainborne event, such as system failure, and the Traffic Controller can do the system control and reset remotely as what the Train Operator does today.
5.3 TRACK PROTECTION
5.3.1 PLATFORM PROTECTION
Full height Platform Screen Doors (PSD) are provided at all underground stations and half-height Automatic Platform Gates are provided at the overhead stations so as to prevent passengers from standing too close to the platform edge and to prevent unauthorized access to the track. Passenger Detection System which interlock with the Signalling System will be installed to detect passenger trap between the APG and the train door.
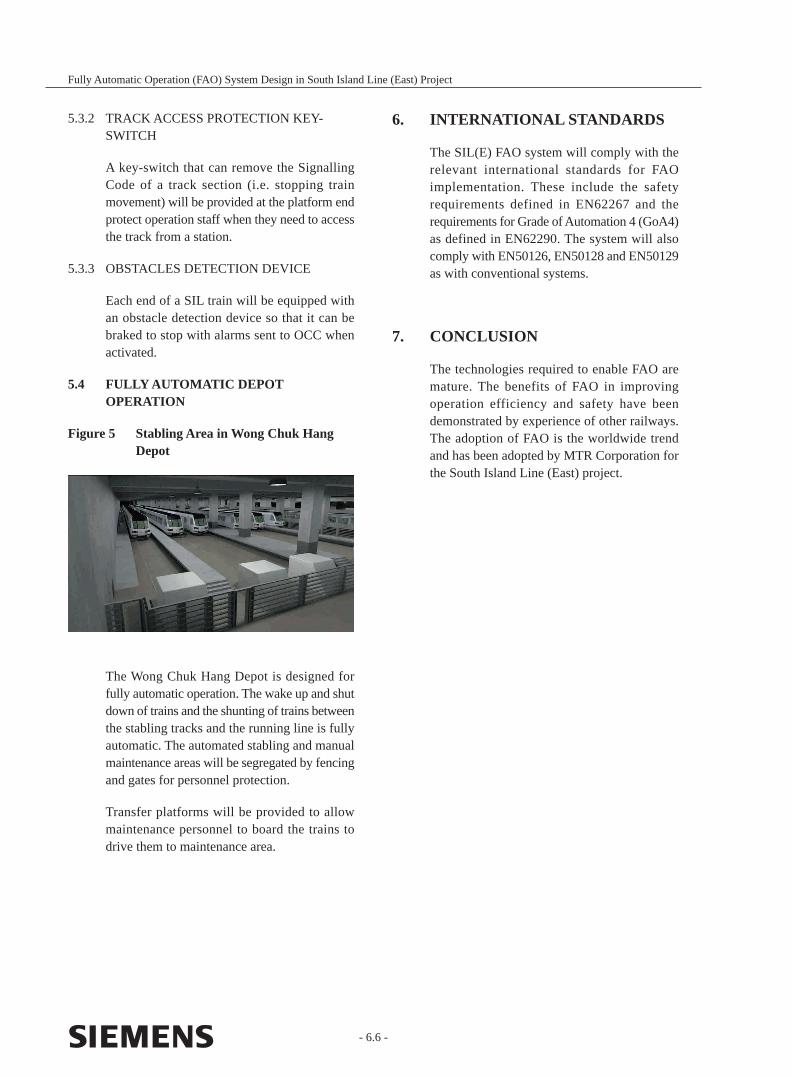
The Wong Chuk Hang Depot is designed for fully automatic operation. The wake up and shut down of trains and the shunting of trains between the stabling tracks and the running line is fully automatic. The automated stabling and manual maintenance areas will be segregated by fencing and gates for personnel protection.
Transfer platforms will be provided to allow maintenance personnel to board the trains to drive them to maintenance area.
- 6.6 -
Fully Automatic Operation (FAO) System Design in South Island Line (East) Project
5.3.2 TRACK ACCESS PROTECTION KEY-SWITCH
A key-switch that can remove the Signalling Code of a track section (i.e. stopping train movement) will be provided at the platform end protect operation staff when they need to access the track from a station.
5.3.3 OBSTACLES DETECTION DEVICE
Each end of a SIL train will be equipped with an obstacle detection device so that it can be braked to stop with alarms sent to OCC when activated.
5.4 FULLY AUTOMATIC DEPOT OPERATION
Figure 5 Stabling Area in Wong Chuk Hang Depot
6. INTERNATIONAL STANDARDS
The SIL(E) FAO system will comply with the relevant international standards for FAO implementation. These include the safety requirements defined in EN62267 and the requirements for Grade of Automation 4 (GoA4) as defined in EN62290. The system will also comply with EN50126, EN50128 and EN50129 as with conventional systems.
7. CONCLUSION
The technologies required to enable FAO are mature. The benefits of FAO in improving operation efficiency and safety have been demonstrated by experience of other railways. The adoption of FAO is the worldwide trend and has been adopted by MTR Corporation for the South Island Line (East) project.

- Notes and Questions -

- Notes and Questions -

Paper No. 7
DESIGN CONSIDERATIONS FOR HIGH SPEED TRAIN
Speakers : Ir C.S. Chan, Acting Project Manager – Rolling StockMs Sha Wong, Engineering Manager – Rolling Stock & SignallingProjects DivisionMTR Corporation Limited
- 7.1 -
DESIGN CONSIDERATIONS FOR HIGH SPEED TRAIN
Ir C.S. Chan, Acting Project Manager – Rolling StockMs Sha Wong, Engineering Manager – Rolling Stock & Signalling
Projects DivisionMTR Corporation Limited
PaperNo. 7
ABSTRACT
This paper highlights some specific design considerations, as compared with that for metro type service, for high speed trains include the traction system, air tightness, aerodynamic consideration, interior passenger seating layout, provision of luggage racks and toilet, sewage and water supply system, for discussion.
1. INTRODUCTION
Design considerations for high speed rail or intercity rail are different than those for metro type system. As the train would be operated at speed of 200km/h or higher, the requirements on power supply, traction package, braking, carbody, and air tightness would be more stringent than those for metro system.
Meanwhile, as high speed trains would be travelled at a high speed and for a longer distance, the expectation for passenger comfort and services are of more demanding as well when comparing with that for metro system.
This paper will highlight the major design considerations.
2. HIGH SPEED TRAIN CONFIGURATIONS
2.1 TRAIN CONSIST
In general, passenger trains can be defined into two major categories, namely those with centralized motive power and those with distributed motive power, symbolized by traditional high speed trains designed by French (TGV) and Japanese (Shinkansen) respectively. A centralized motive power trainset usually is
referred to as locomotive type with the motive power car as the front car without passenger carrying facility. A distributed type motive train is referred to as Electric Multiple Unit (EMU), with self-propelled engine and passenger (i.e. payload) carrying provision, this self-power unit is called “motor” car whilst those without motive power is called “trailer” car.
Although both types have been adopted for high speed rail systems world-wide, the latter is gaining more acceptances nowadays due to a number of advantages over the centralized one.
The most advantage of EMU type train is of its higher reliability. Due to its multiple motive unit design, train can still operate to some extend even with a percentage of failure. For example, with an eight-car train design, the motor to trailer car ratio can be 3:5, 4:4, 5:3, or 6:2 depending on the journey time, operating speed, gradient, degraded operation and recovery capabilities under system failure required for a specific line. In the case of one motor fails, the remaining motive power for the 8-car train would be 67%, 75%, 80%, and 83% whilst the residue motor-to-trailer car ratio would be 2:6, 3:5, 4:4, and 5:3 respectively for each motor-to-trailer ratio given. Of course, residue power would be worsen if in the case of two motors failure, a 3:5 or 4:4 motor-to-trailer ratio would leave 50% or less motive effort which may have difficulty (e.g. unable to haul the rest of the train or only operate under very low speed) in propelling the concerned train to the next station for a more safe evacuation and without having major adverse impact on (e.g. blocking) other train service.
The higher ratio of motor car will certainly provide higher overall reliability and recovery capacity for the system as a whole. Therefore,
- 7.2 -
Design Considerations for High Speed Train
it is very important during design stage to determine a proper motor-to-trailer car ratio for the train in order to meet the service requirement as well as to provide necessary degraded and recovery capacity.
Meanwhile, instead of having a very heavy locomotive as a front car, EMU offers more even out weight distribution on individual units hence reducing maximum weight as otherwise would be required by the locomotive car. This will be of benefit to lower the axle load requirement which in turn will allow a better and more cost-effect design for build and maintenance of tracks. The lower weight on front car and more balance weight on each car unit would also result a better wheel/track adhesion, which reduces the chance of wheel slip/slide, and less wear out on tracks.
In addition, due to its distributed motive power arrangement, the entire train can be designed as composition of individual units with combination of “motor” and “trailer” cars, again, depending on the motor-to-trailer ratio required. The benefit of this unit design is flexibility in reforming train consist as per the operational and maintenance requirement.
2.2 TRACTION POWER POWER SUPPLY & OVERHEAD LINE SYSTEM
25kV single phase AC traction power supply system is adopted to meet the high power demand of high speed trains. 132/25kV traction transformers installed in traction substations will provide the 25kV AC traction supply. Redundancy is included in the design such that full train services can be maintained under single traction transformer failure scenario.
The overhead line system is a simple catenary system to transmit the 25kV traction power to the trains through the roof mounted pantograph. The tension, size and material of overhead line wires are determined to suit for trains operating at 200km/h and higher. The 150mm2 copper-silver type contact wire with tension of 20kN can be adopted for operating speed of 200km/h. For operating speed of 300km/h, 150mm2
copper-tin type contact wire with tension of 25kN will need to be adopted.
2.3 NEUTRAL SECTION
Neutral Section is a standard design for 25kV AC type power supply system as a means to prevent the risk of out-of-phase supplies mixing; hence sections of line fed from different feeder stations must be kept strictly isolated. On high speed railway line with operating speed of 200km/h and higher, the length of the neutral section separating 2 electric sections is as much as 110m, comparing with just 5m for suburban line. In order for the trainborne Vacuum Circuit Breaker (VCB) to be opened before entering the neutral section, command to open the VCB has to be triggered well before reaching the neutral section. And the VCB has to be close after all the pantograph(s) of the train has left the neutral section. As a result, the train has to coast through almost 150m without power when passing through the neutral section. For suburban trains, the control of VCB is usually activated by trackside markers which transmit the command to the train. For high speed trains, an alternative approach is to have the command triggered through the signaling system instead.
2.4 TRACTION SYSTEM
The design of traction system would be line specific to meet requirements such as operating speed, journey time, degraded operation, and recovery capacity. Established technologies such as Variable Voltage & Variable Frequency (VVVF) drive using Insulated Gate Bipolar Transistor (IGBT) and regenerative braking would be adopted.
For example of an eight-car train includes 6 motor (M) cars and 2 trailer (T) cars, i.e. a 6M2T composition. The motor cars can be divided into 3 power units. Each power unit is composed of 1 traction transformer,
2 traction converters and 8 traction motors. That is, each traction converter controls 4 traction motors. There are two pantographs supplied for each train on Car #3 (M2) and Car #5 (M4) respectively. Figure 1 indicates the system block diagram of such design.
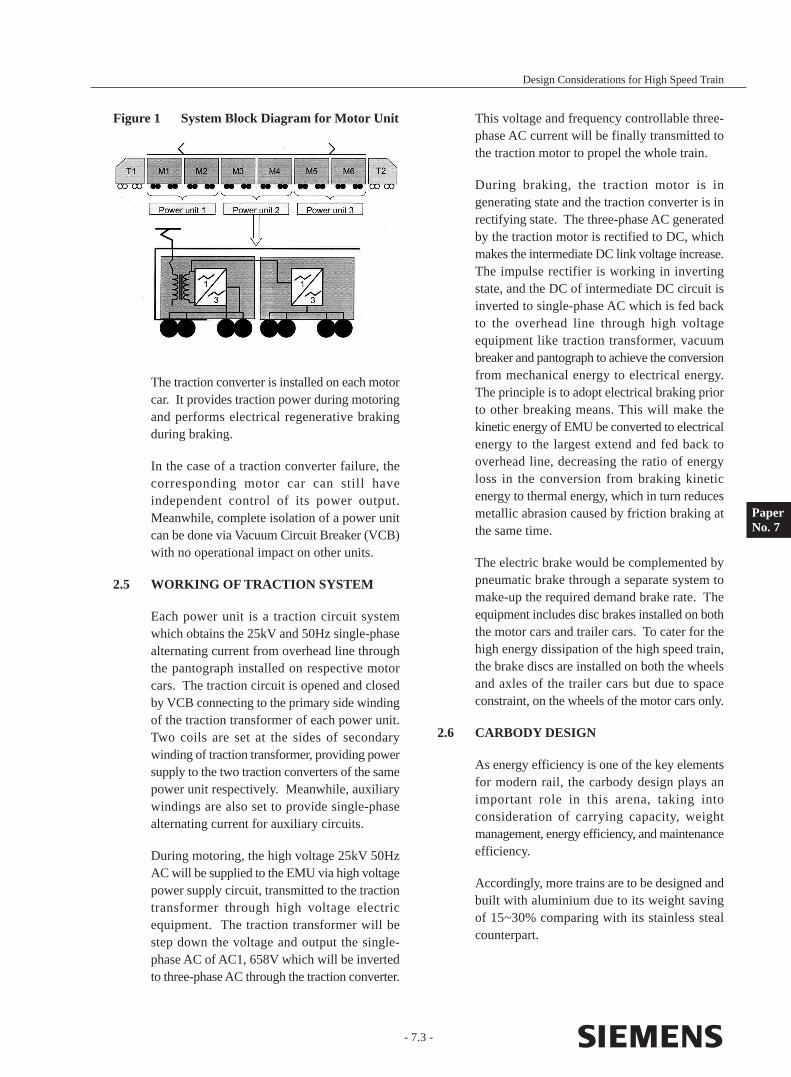
- 7.3 -
Design Considerations for High Speed Train
Figure 1 System Block Diagram for Motor Unit
PaperNo. 7
This voltage and frequency controllable three-phase AC current will be finally transmitted to the traction motor to propel the whole train.
During braking, the traction motor is in generating state and the traction converter is in rectifying state. The three-phase AC generated by the traction motor is rectified to DC, which makes the intermediate DC link voltage increase. The impulse rectifier is working in inverting state, and the DC of intermediate DC circuit is inverted to single-phase AC which is fed back to the overhead line through high voltage equipment like traction transformer, vacuum breaker and pantograph to achieve the conversion from mechanical energy to electrical energy. The principle is to adopt electrical braking prior to other breaking means. This will make the kinetic energy of EMU be converted to electrical energy to the largest extend and fed back to overhead line, decreasing the ratio of energy loss in the conversion from braking kinetic energy to thermal energy, which in turn reduces metallic abrasion caused by friction braking at the same time.
The electric brake would be complemented by pneumatic brake through a separate system to make-up the required demand brake rate. The equipment includes disc brakes installed on both the motor cars and trailer cars. To cater for the high energy dissipation of the high speed train, the brake discs are installed on both the wheels and axles of the trailer cars but due to space constraint, on the wheels of the motor cars only.
2.6 CARBODY DESIGN
As energy efficiency is one of the key elements for modern rail, the carbody design plays an important role in this arena, taking into consideration of carrying capacity, weight management, energy efficiency, and maintenance efficiency.
Accordingly, more trains are to be designed and built with aluminium due to its weight saving of 15~30% comparing with its stainless steal counterpart.
The traction converter is installed on each motor car. It provides traction power during motoring and performs electrical regenerative braking during braking.
In the case of a traction converter failure, the corresponding motor car can still have independent control of its power output. Meanwhile, complete isolation of a power unit can be done via Vacuum Circuit Breaker (VCB) with no operational impact on other units.
2.5 WORKING OF TRACTION SYSTEM
Each power unit is a traction circuit system which obtains the 25kV and 50Hz single-phase alternating current from overhead line through the pantograph installed on respective motor cars. The traction circuit is opened and closed by VCB connecting to the primary side winding of the traction transformer of each power unit. Two coils are set at the sides of secondary winding of traction transformer, providing power supply to the two traction converters of the same power unit respectively. Meanwhile, auxiliary windings are also set to provide single-phase alternating current for auxiliary circuits.
During motoring, the high voltage 25kV 50Hz AC will be supplied to the EMU via high voltage power supply circuit, transmitted to the traction transformer through high voltage electric equipment. The traction transformer will be step down the voltage and output the single-phase AC of AC1, 658V which will be inverted to three-phase AC through the traction converter.

- 7.4 -
Design Considerations for High Speed Train
2.7 CONSIDERATIONS FOR CAB DESIGN
For trains operating at 200~300km/h speed range, air resistance is a critical consideration for energy saving. The front of high speed train will be designed with as much aerodynamic shape as possible, similar to the one presented in Figure 2 (source from internet) to minimize air resistance. Considerations for such kind of design include aerodynamic performance parameters, structural constraints, balance between the nose part and the other seating space of cab car, driver’s viewing ability, cab layout, spatial limitation as well as manufacturing process, in particular on the joint of two dimensional surfaces.
Figure 2 Illustration of Nose Type Train Front
Meanwhile, regulations of pressure pulse during tunnel entrance/exist is as important as well. Before a high speed train enters a tunnel section, the dampers in the air duct to the saloon will be closed to minimise the variations of the pressure changes inside the saloon pulse and vice versa as the train exists from the tunnel.
3. PASSENGER FACILITIES
3.1 OVERALL TRAIN LAYOUT & FACILITY
Other major differences when comparing with the service provided by high speed train and that of the usual metro type rolling stock are that there are generally assumed seating passengers (instead of majority standing passengers for mass metro type service) and usually with
by nickel sulfide.
Saloon windows which are flush with car surface adopt the hidden type elastic installation structure. Integrated with hollow glass, the window sash will be fixed on the carbody by the upper and lower platen. Sealant will be adopted between window sash, platen and car body to guarantee the seal performance of windows. Figure 3 below illustrates the principle of sealing for air tightness.
Figure 3 Window Design for Air Tightness
It is important to note that driving performance have to be guaranteed by providing a good vision and operating space with certain net height and net clearance of the cab.
2.8 AIR TIGHTNESS DESIGN
One major challenge for the design of high speed train is the minimization of change on saloon air pressure especially during in/out of tunnel section and train passing each other in opposite direction to ensure the ride comfort of passengers. Special design considerations are given in the window design as well as the regulation of pressure pulse.
The vehicle window air strength is usually designed to stand for high pressure (e.g. ±6kPa). Physically toughened window glass is to be treated evenly according to relevant international standard to control self-explosion of glass caused

- 7.5 -
Design Considerations for High Speed Train
PaperNo. 7
and lifted into position when it is to be installed on the train. The size of the sewage tank is calculated based on the water discharged from the toilets and washing basins per operating hour and the maximum operating hours between sewage extractions in depot, symbolized by the following formula –
Tank size = (Water from basin + water from toilet) x No. of Toilets x Usage per hour x Operating hours
For example of an 48-hour operating cycle, the size of the tank would be estimated to be 700 litres for 2 toilets, each one being used in every 9 minutes interval. Water is taken to be discharged from basin and toilet at 0.5 litre and 0.3 litre respectively.
4. FACILITIES FOR TRAIN CREW
In addition to the cab provision to facilitate the train operation by driver, there will also be a crew room and a mechanic room provisioned for each high speed train.
Different from metro type operation, the train driver will concentrate on driving function whilst these facilities will be available for train crew and mechanist on board to take care of the rest of the train services:
• Communication equipment (control ampli f ier) , wi th headphones, for communication with train operator and passengers.
• Control device for control and monitoring of passenger information system and entertainment system, including server for automatic broadcast unit, automatic display unit, audio and video controller.
• Control device for control and monitoring of smoke and fire alarm system, including smoke detector (crew room), smoke and fire alarm unit (mechanist room).
The crew room is an area for the crew to work and rest, provision with control amplifier, control amplifier, server for automatic broadcast unit,
different class of seats (i.e. business class and ordinary class) available, depending on the length and nature of a specific line.
In average, each car of a high speed train may host around 80~90 passengers depending on the seating arrangement, e.g. provision of passenger facilities, leg rooms, and disable facilities. For EMU type train, since the cab car will have driving facilities as well as pay-load passenger seats, hence the passenger capacity will be less than that of intermediate car.
For example, in the case of an 8-car train, the two end cars can be for business class with 2+2 type seating arrangement. A sight seeing area can be available behind the cabs having 1+2 business seats inside.
Special area for wheelchair in passenger compartment is included in the design specification to cater for person with disabilities.
3.2 LUGGAGE FACILITIES
For high speed train, luggage is expected. Hence there will usually be luggage racks distributed symmetrically along the longitudinal direction on both sides of the carbody.
In addition, large luggage room will normally be provided at both sides of each passenger compartment for passenger service.
From engineering point of view, stainless steel support should be equipped in the middle of large luggage room to allow for the loading of around 300kg. The guard plate on both sides of large luggage room should be made of laminated safety glass with certain toughness to bear sufficient weight, say 40kg.
3.3 TOILETS AND DRINKING WATER
To cater for travel in distance and better service, both drinking water and toilet facilities are usually provided for high speed trains.
The design of toilet is similar to that for aeroplane, which is based on vacuum suction principle. The toilet is constructed as module, including the toilet seat, washing basin, underfloor sewage tank as well as other amenities
- 7.6 -
Design Considerations for High Speed Train
emergency braking switch, crew switch, monitoring loud speaker, smoke detector, 220V AC electric socket, movable seat, and office table.
The mechanic room is an working area for onboard mechanist, provision with control amplifier, automatic broadcasting device, audio and video controller, emergency braking switch, crew switch, loud speaker monitor, smoke and fire alarm unit, vehicle information display, movable seat, office table, and 220V AC electric socket.
5. CONCLUSION
This paper highlights some unique features usually provided for high speed trains as different from that of normal metro type trains. Main considerations for high speed trains are on service, degraded and recovery specific requirements, as well as the enhanced ride comfort and passenger services to meet the expectation of high speed train such as more seats, toilets, luggage facilities, etc.

- Notes and Questions -

- Notes and Questions -

Paper No. 8
NEW BASELINE ON ENERGY EFFICIENCY OFELECTRICAL INSTALLATIONS FOR
LOW CARBON DEVELOPMENT
Speakers : Ir Dominic S.K. Lau, Senior EngineerIr David W.H. Li, EngineerElectrical and Mechanical Services DepartmentThe Government of the HKSAR
- 8.1 -
NEW BASELINE ON ENERGY EFFICIENCY OFELECTRICAL INSTALLATIONS FOR
LOW CARBON DEVELOPMENT
Ir Dominic S.K. Lau, Senior EngineerIr David W.H. Li, Engineer
Electrical and Mechanical Services DepartmentThe Government of the HKSAR
PaperNo. 8
ABSTRACT
Taking a major step towards low carbon economy aiming at raising energy efficiency performance of buildings, the Buildings Energy Efficiency Ordinance (Cap 610) (Ordinance) came into full operation on 21 September 2012. The Ordinance governs energy efficiency standards of building services installations in buildings, requiring the compliance with the Building Energy Code (BEC) for new construction and major retrotitting works, and the conduction of energy audit for central building services installations in commercial buildings in accordance with the Energy Audit Code (EAC). This paper introduces the legislative framework of the Ordinance with brief highlights on the new baseline on energy efficiency standards on lighting and electrical installations as stipulated in the Codes, and in coupling with the wider use of innovative energy efficient devices and systems, the anticipated benefits that would be brought about.
1. INTRODUCTION
Being an international metropolitan, Hong Kong (HK) is characterized by many high rise buildings to render the spaces needed for our work, living and recreation, and with these landscape buildings in HK account for a significant portion of our carbon footprint. Energy use has been globally identified as the culprit of climate change, and to this end HK buildings are a major energy consumer, notably consuming some 90% of HK’s electricity. To combat climate change, the reduction of our buildings’ carbon footprint would likely top our agenda in the years to come with aspiration towards a vision of low carbon development with state of the art energy efficient
building designs that would generate green business opportunities for environmental industries and flourish a low carbon economy essential for sustainable development.
With this vision, the Electrical and Mechanical Services Department (EMSD) of the Government of HK Special Administrative Region (HKSAR) is tasked to promote building energy efficiency. Targeting at reducing building energy consumption, the Ordinance was enacted in late 2010 and comes into full operation with EMSD as the enforcing department on 21 September 2012. Building services installations which are governed under the Ordinance include lighting installation, air-conditioning installation, electrical installation, and lift and escalator installation. The Ordinance establishes the energy efficiency standards of a building for its design and introduces the means to evaluate its energy efficiency performance in operation. For building design, the BEC governs the design standards in respect of energy efficiency of building services installations, whereas for building operation, the EAC governs the steps in conducting energy audit of its central building services installations (which refer to the building services installations not solely serving an individual unit of the building).
2. SCOPE OF COVERAGE OF ORDINANCE
2.1 TYPES OF BUILDINGS
The Ordinance governs most types of buildings in private and government sectors, including
- 8.2 -
New Baseline on Energy Efficiency of Electrical Installations for Low Carbon Development
buildings for commercial (office, shopping complex etc.), hotel, municipal, community, education, hospital, railway station, airport passenger terminal usages etc., in respect of BEC compliance. For industrial buildings, residential buildings and composite buildings, the common area and the portion not for residential or industrial use are governed. Residential units are not governed, to avoid undue disturbance to the general public. Industrial units, which are normally compelled to remain in competitiveness through efficiency gains, are not governed, so as to avoid undue disturbance to industrial operations that may require specific energy inputs.
2.2 NEWLY CONSTRUCTED BUILDINGS AND EXISTING BUILDINGS
The building services installations in a newly constructed building i.e. a building in respect of which a consent to the commencement of building works for superstructure construction is given after 21 September 2012, should comply with the requirements of the BEC. As for an existing building, i.e. a building in respect of which a consent to the commencement of building works for superstructure construction is given on or before 21 September 2012, the BEC requirements have to be complied with only for major retrofitting works.
2.3 MAJOR RETROFITTING WORKS
Major retrofitting works include the addition or replacement of a building services installation in retrofitting works covering a floor area of aggregated 500m2 or above (under the same series of works within 12 months) in a common area or a unit, or the addition or replacement of a main component of the central building services installations (including a chiller at rating 350 kW or above, or a complete electrical circuit at rating 400A or above, or motor drive and mechanical drive of a lift or escalator).
2.4 ENERGY AUDIT
The Ordinance requires energy audit to be carried out for the central building services installations of commercial buildings and commercial portions of composite buildings once every 10 years in
accordance with the steps specified in the EAC. After the audit, the building’s energy utilization index (EUI, in Mega Joule/m2/annum) that reflects the building’s energy intensity or energy performance is to be identified and exhibited.
3. COMPLIANCE HIERARCHY OF ORDINANCE
The Ordinance prescribes the responsibilities of the developer, owner or responsible person of a building or a unit of the building, and the Registered Energy Assessor (REA), with compliance hierarchy involving the submissions and certifications to demonstrate the compliance at different stages of the building, from design to occupation approval and during normal course of operation.
3.1 COMPLIANCE WITH BEC
The BEC requirements are the energy efficiency standards at the corresponding design conditions, and not the actual operational settings such as lighting level, air-conditioning room temperature etc., which are left to the discretion of building operators to suit the operational needs of individual buildings and installations.
The developer of a building, at building design stage (within 2 months after obtaining the aforesaid consent to the commencement of building works issued by the Building Authority of the HKSAR), is required to:
• submit to EMSD a “stage one declaration” certified by an REA to declare that the building services installations to be provided by the developer are designed and will be installed and completed in accordance with the BEC.
Subsequently at the occupation approval stage (within 4 months after obtaining of an “occupation permit” issued by the Building Authority when the building is ready for occupation), the developer is further required to:
• submit to EMSD a “stage two declaration”
- 8.3 -
New Baseline on Energy Efficiency of Electrical Installations for Low Carbon Development
certified by an REA to declare that the building services installations provided by the developer in the building, at or before the time when the declaration is made, have been designed, installed and completed in accordance with the BEC; and
• apply for a Certificate of Compliance Registration (COCR) from EMSD for the building.
The declarations are to be in specified forms and be accompanied by supporting documents specified in the forms. Based on merits of the declarations, EMSD will issue accordingly the COCR to the developer and maintains a register of COCR.
The aforesaid COCR for newly constructed buildings is subject to renewal every 10 years, and for the renewal the owner of the building is required to:
• engage an REA to certify that
- the design (but not the operational performance) in respect of energy efficiency of the central building services installations (no need to include the installation only serving an individual unit) is maintained at a level not lower than the standard in the BEC version applicable to the COCR (issued by EMSD 10 years ago) of the building, and
- if major retrofitting works have been undertaken for certain portions of the central building services installations, the design of the installation is maintained to a standard not lower than the latest BEC version applied to this part of the installation; and
• submit an application to EMSD for renewal of the COCR.
For all prescribed buildings under the Ordinance, irrespective of newly constructed or existing buildings, the owner of central building services installations in the building, and the responsible person of a unit or a common area in the building, within 2 months after completion of major
PaperNo. 8
retrofitting works, are required to:
• engage an REA to certify that the replaced or additional installations in the major retrofitting works comply with the latest BEC; and
• obtain a Form of Compliance (FOC) from the REA for the said works.
In the course of operation of a building with COCR (i.e. a newly constructed building), the owner of the central building services installations (usually the owner of the building) and the responsible person (usually the owner or tenant) of a unit or a common area in the building are required to ensure that when a building services installation is replaced or added (even it is not major retrofitting works), its design shall comply with standards which are not lower than that applied in the original BEC for the installation.
3.2 ENERGY AUDIT
The owner of a prescribed building must, in respect of the central building services installations of the building, cause an energy audit to be carried out in accordance with the EAC at least once every 10 years.
The first energy audit for the central building services installations of a building issued with a COCR (i.e. a newly constructed building) is to be carried out within 10 years after the issue of COCR.
For existing buildings, the first energy audit for the central building services installations is to be carried out according to the timetable within 4 years from 21 September 2012 as specified in Schedule 5 of the Ordinance.
The owner of the building is required to:
• engage an REA to conduct the energy audit;
• obtain from the REA an Energy Audit Form and an energy audit report (with recommendations of energy management opportunities (EMO) identified in the audit); and
- 8.4 -
New Baseline on Energy Efficiency of Electrical Installations for Low Carbon Development
• exhibit the valid Energy Audit Form bearing the building’s EUI at the main entrance of the building.
By the disclosure of the EUI, it is expected a benchmarking effect will be exerted on building operators to improve the building’s energy efficiency, as the building’s energy performance can be easily compared with that of other similar buildings. As for the EMO, the implementation will not be mandatory, in consideration of the wide variety of EMO in terms of scope and cost. Nevertheless, the REA’s analysis and recommendations of the EMO in the energy audit report will be conducive to the implementation of part or all of these EMO, as the energy saving from EMO is itself a paramount incentive.
3.3 REGISTERED ENERGY ASSESSOR (REA)
The Ordinance opens up a new role of professional engineers who upon appointment by the developer, owner or responsible person have the obligation to:
• certify the compliance with the BEC for application of COCR or issue of FOC;
• issue FOC to the relevant owner or responsible person of a building or a unit in a building;
• conduct energy audit and issue the Energy Audit Form and energy audit report to the building owner; and
• send a copy of the FOC, Energy Audit Form and energy audit report to EMSD for record.
3.4 PENALTIES
Penalties will mainly be in the form of monetary fine imposed on developers, building owners, responsible persons or REAs for non-compliance under the Ordinance. Imprisonment penalty will only be applied to a person who is liable for obstructing an authorized officer in exercising the power under the Ordinance or who provides any false or misleading information and documents required under the Ordinance.
4. ENERGY EFFICIENCY REQUIREMENTS OF LIGHTING AND ELECTRICAL INSTALLATIONS
In preparing the contents of the BEC, reference had been made to the development of energy efficiency technologies & products and good engineering practices in respect of design and operation of building services installations, both local and aboard. The building energy codes in other countries and Mainland China had also been referenced, which include ASHRAE 90.1 of USA, BCA 2010 of Australia, SS530 of Singapore, Approved Document L2A of UK, GB 50189 of Mainland China etc. With these references and the adjustments to suit local situations, it is aimed that the HK approach on building energy efficiency tallies with international practices. Locally, it is hoped that the mandatory BEC can, having its requirements above the average common norm, serve to pull up sub-standard designs, and by not entailing excessive cost in implementation, be widely acceptable to the stakeholders. The BEC requirements on lighting installation and electrical installation are summarized below for a quick appreciation.
4.1 LIGHTING INSTALLATION
• Max allowable lighting power density (LPD)
• Min allowable no. of lighting control points (i.e. switching devices) for office space
• Lighting control points for lighting to which the Ordinance is applicable to be independent from those for lighting to which the Ordinance is not applicable
• Not applicable to lighting exterior to building, lighting not of fixed type, signage lighting and lighting solely for decoration
4.2 ELECTRICAL INSTALLATION
• Allowable power distribution loss (e.g. max allowable circuit copper loss)
• Allowable motor efficiency
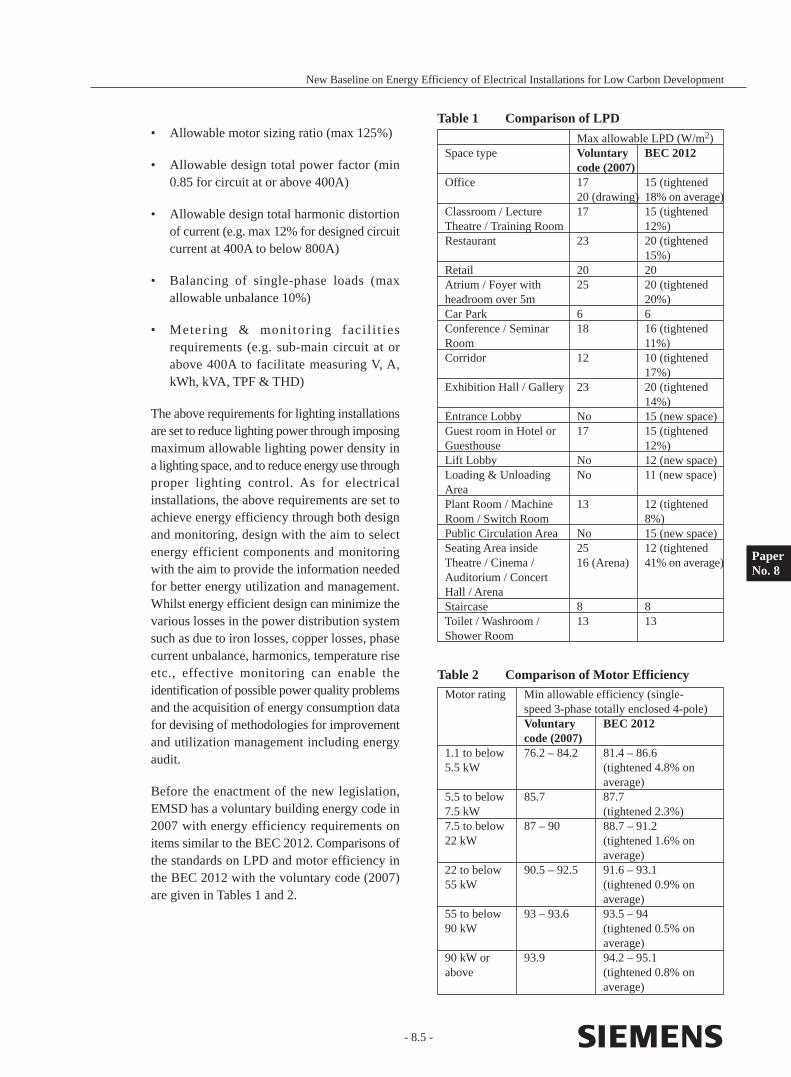
Table 1 Comparison of LPD
Table 2 Comparison of Motor Efficiency
Max allowable LPD (W/m2)Space type Voluntary BEC 2012
code (2007)Office 17 15 (tightened
20 (drawing) 18% on average)Classroom / Lecture 17 15 (tightenedTheatre / Training Room 12%)Restaurant 23 20 (tightened
15%)Retail 20 20Atrium / Foyer with 25 20 (tightenedheadroom over 5m 20%)Car Park 6 6Conference / Seminar 18 16 (tightenedRoom 11%)Corridor 12 10 (tightened
17%)Exhibition Hall / Gallery 23 20 (tightened
14%) Entrance Lobby No 15 (new space)Guest room in Hotel or 17 15 (tightenedGuesthouse 12%)Lift Lobby No 12 (new space)Loading & Unloading No 11 (new space)AreaPlant Room / Machine 13 12 (tightenedRoom / Switch Room 8%)Public Circulation Area No 15 (new space)Seating Area inside 25 12 (tightenedTheatre / Cinema / 16 (Arena) 41% on average)Auditorium / ConcertHall / ArenaStaircase 8 8Toilet / Washroom / 13 13Shower Room
Motor rating Min allowable efficiency (single-speed 3-phase totally enclosed 4-pole)Voluntary BEC 2012code (2007)
1.1 to below 76.2 – 84.2 81.4 – 86.65.5 kW (tightened 4.8% on
average)5.5 to below 85.7 87.77.5 kW (tightened 2.3%)7.5 to below 87 – 90 88.7 – 91.222 kW (tightened 1.6% on
average)22 to below 90.5 – 92.5 91.6 – 93.155 kW (tightened 0.9% on
average)55 to below 93 – 93.6 93.5 – 9490 kW (tightened 0.5% on
average)90 kW or 93.9 94.2 – 95.1above (tightened 0.8% on
average)
- 8.5 -
New Baseline on Energy Efficiency of Electrical Installations for Low Carbon Development
• Allowable motor sizing ratio (max 125%)
• Allowable design total power factor (min 0.85 for circuit at or above 400A)
• Allowable design total harmonic distortion of current (e.g. max 12% for designed circuit current at 400A to below 800A)
• Balancing of single-phase loads (max allowable unbalance 10%)
• Metering & monitoring faci l i t ies requirements (e.g. sub-main circuit at or above 400A to facilitate measuring V, A, kWh, kVA, TPF & THD)
The above requirements for lighting installations are set to reduce lighting power through imposing maximum allowable lighting power density in a lighting space, and to reduce energy use through proper lighting control. As for electrical installations, the above requirements are set to achieve energy efficiency through both design and monitoring, design with the aim to select energy efficient components and monitoring with the aim to provide the information needed for better energy utilization and management. Whilst energy efficient design can minimize the various losses in the power distribution system such as due to iron losses, copper losses, phase current unbalance, harmonics, temperature rise etc., effective monitoring can enable the identification of possible power quality problems and the acquisition of energy consumption data for devising of methodologies for improvement and utilization management including energy audit.
Before the enactment of the new legislation, EMSD has a voluntary building energy code in 2007 with energy efficiency requirements on items similar to the BEC 2012. Comparisons of the standards on LPD and motor efficiency in the BEC 2012 with the voluntary code (2007) are given in Tables 1 and 2.
PaperNo. 8
- 8.6 -
New Baseline on Energy Efficiency of Electrical Installations for Low Carbon Development
It can be seen from Table 1 that the LPD standard in the BEC 2012 under the Ordinance has much improvement over the 2007 voluntary standard. Nevertheless the 2012 standard is not as assertive as similar standards in ASHRAE 90.1 or BCA. A moderate level of stringency is set at the kick-in of the Ordinance, given the prevailing preference of HK’s general public for a brighter environment, and that indoor spaces in buildings in HK, being a city crowded with tall buildings, have lower daylight penetration and have to rely more on compensation with electrical lighting.
For the motor efficiency standard in Table 2, the 2007 standard is tightened to the mandatory IE2 efficiency level of IEC60034-30 which is commonly adopted in Europe.
5. BENEFITS OF ORDINANCE
Energy efficient technologies are continuously introduced and adopted in HK irrespective of whether or not the Ordinance is in place, given the pursue of such technologies already being a worldwide trend to counteract global warming. The Ordinance serves, however, as a catalyst to speed up the adoption of such technologies. The Ordinance first of all draws the attention of its various stakeholders, building owners, operators, designers, contractors, suppliers etc., on the minimum energy efficiency requirements and triggers the building up of the capacity of these stakeholders both on energy efficient technologies and the compliance hierarchy of the Ordinance. Of these stakeholders, while a few conservative ones would choose to move from not meeting to just meeting the minimum requirements, some assertive ones would go for standards above the bare minimums. In particular suppliers of energy efficient technologies would see the Ordinance as a green opportunity for them to promote products satisfying the minimum requirements and above all products with energy performances above the bare minimums.
The Ordinance having established the minimum requirements would pull up sub-standard designs to meet the minimum requirements, and at the same time generate a baseline against which
assertive stakeholders could have their building designs benchmarked with the view to out-perform the minimum requirement.
In addition, the Ordinance having speeded up the adoption of energy efficient technologies also serves to cultivate the preparedness and capacity among the stakeholders for higher baseline standards, and based on the preparedness and capacity, EMSD may tighten at an opportune time the minimum requirements such as LPD and motor efficiency to achieve more energy saving.
6. WAY FOWARD
Of the energy efficient technologies, studies have indicated that much energy saving can be achieved through building energy management system, BEMS in short. A BEMS is characterized by an information network through which a building’s central control system supported with distributed localized controllers can communicate with the building’s various energy-related components, the major energy consuming building services equipment in particular, in respect of energy management. Through the information network, the building operator’s intention on how the building should operate, as reflected in the software programs input to the central control system and local controllers, is communicated to the modulation devices such as dampers, valves, on-off switches etc. of the building’s various energy-related components, and likewise the feedbacks from the various sensing devices that monitor the relevant performance parameters such as levels of temperature, pressure, illumination etc. are communicated to the central control system and local controllers. Depending on the intelligence or capability of the central control system and its local controllers, these feedbacks are consolidated and analysed and constitute the base in commanding the modulation devices to respectively maintain the levels of performance or to effect the necessary changes for better energy performance. A BEMS with good logical control and supplemented with adequate and suitable sensing devices and modulating devices can harvest much energy saving through
optimizing equipment operating hours, levels of operation, fresh air supply, operation temperatures etc. Adding to the benefit, software programs may be loaded to enable the logging of various operation parameters with the view to identify the more energy efficient modes of operating set points of time, illumination, temperature, pressure etc. based on the logged historical data. The requirements in the BEC of automatic control and energy metering of chillers and chiller plant, and of energy metering of electrical circuits can also be integrated in the BEMS. Needless to say, energy efficient lighting control can be integrated with the BEMS.
For lighting, the BEC has kicked off the requirement for an office space of adequate quantity of control points to switch off a certain zone of lighting when the zone is not in use in order to achieve energy saving. Apart from conventional manual lighting switches, smart controls such as occupancy sensors or photo sensors may be accepted as lighting control points in the BEC provided that they can automatically switch off the target lighting when not in use. Designers and suppliers may take the opportunity to promote these various smart lighting control technologies, which include multi-way switching that enables the occupant to control the lighting at more than one spot, photo sensor that turns off the lighting when sunlight is abundant, daylight sensor coupled with dimming that can gradually reduce the output from electric lighting when sunlight is gradually dominating, timer that can turn off the lighting at daytime, occupancy sensor that can turn off the lighting when there are no occupants, and digital lighting point control. Digital lighting control can interface with photo sensors, dimmers, timers and occupancy sensors etc. to effect different lighting scenes characterized by the different levels of illumination and grouping of operating luminaires to suit the different functions being performed in the lighting space. The integration of BEMS with digital lighting control offers more flexibility in the determination of the different lighting scenes, which constitute the “character” of the space in providing to its occupants its different functions.
- 8.7 -
New Baseline on Energy Efficiency of Electrical Installations for Low Carbon Development
EMSD will regularly review the minimum energy efficiency standards under the BEC with reference to the latest international standards and the advancement of relevant technologies. This is in line with the recommendation including the tightening of BEC standard, and the promotion of energy audit and BEMS made in the report of a public engagement on combating climate change published in 2012 by the Council for Sustainable Development of HK.
In respect of energy audit, the report also points out that it is believed that “what gets measured gets managed”, and that the audit will help to provide a baseline against which future performance can be benchmarked, and facilitate as a tool to identify measures to reduce energy consumption and associated costs. In addition, the data collected through the mandatory audit may help establish a benchmarking tool for buildings in HK.
7. CONCLUSION
With the full implementation of the Ordinance to capture the above benefits, more energy efficient technologies would be introduced and adopted in HK to promote a low carbon economy. The mandatory approach will reinforce the roothold of the minimum energy efficiency standards in the BEC and the minimum energy audit requirements in the EAC, and pave the way for further enhancement of the standards. EMSD will review and tighten the standards at suitable time intervals, and the tightening will further trigger a new baseline of building services installations for low carbon development.
ACKNOWLEDGMENT
Sincere thanks are extended to members (including the Electrical Division of HKIE) of the Technical Taskforce on Mandatory Implementation of the BEC and its working groups in offering their expertise advice and support in the development of the BEC and EAC.
PaperNo. 8
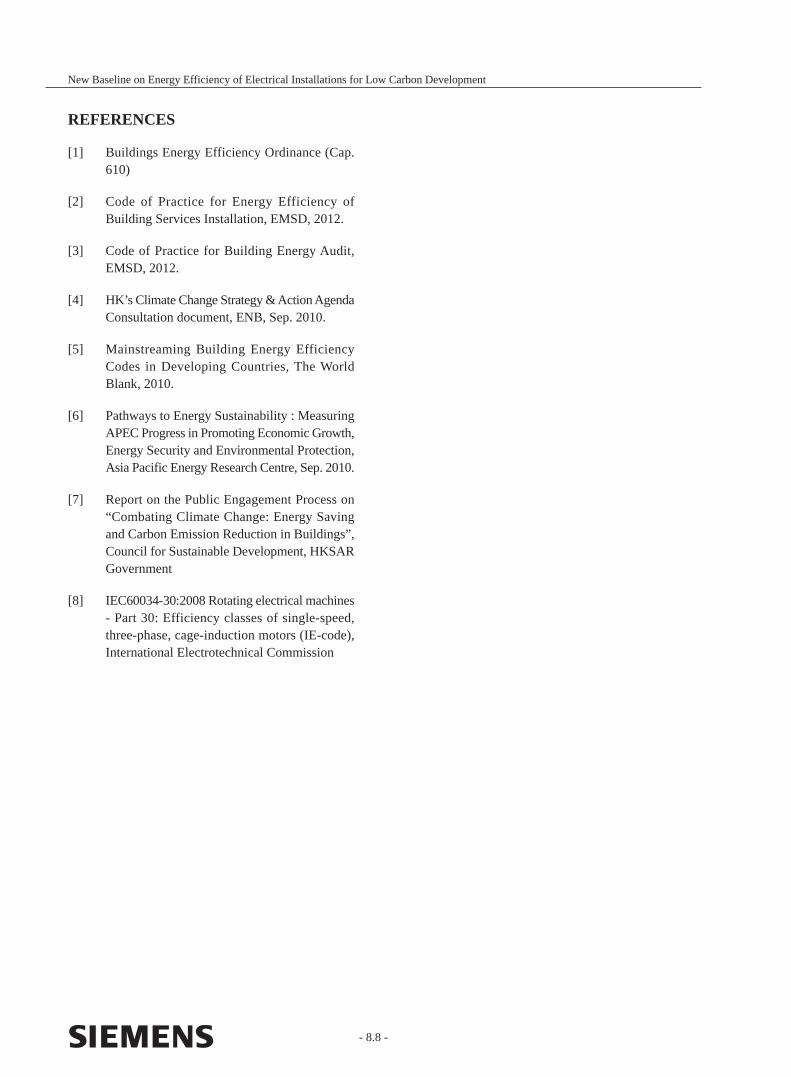
- 8.8 -
New Baseline on Energy Efficiency of Electrical Installations for Low Carbon Development
REFERENCES
[1] Buildings Energy Efficiency Ordinance (Cap. 610)
[2] Code of Practice for Energy Efficiency of Building Services Installation, EMSD, 2012.
[3] Code of Practice for Building Energy Audit, EMSD, 2012.
[4] HK’s Climate Change Strategy & Action Agenda Consultation document, ENB, Sep. 2010.
[5] Mainstreaming Building Energy Efficiency Codes in Developing Countries, The World Blank, 2010.
[6] Pathways to Energy Sustainability : Measuring APEC Progress in Promoting Economic Growth, Energy Security and Environmental Protection, Asia Pacific Energy Research Centre, Sep. 2010.
[7] Report on the Public Engagement Process on “Combating Climate Change: Energy Saving and Carbon Emission Reduction in Buildings”, Council for Sustainable Development, HKSAR Government
[8] IEC60034-30:2008 Rotating electrical machines - Part 30: Efficiency classes of single-speed, three-phase, cage-induction motors (IE-code), International Electrotechnical Commission

- Notes and Questions -

- Notes and Questions -
Paper No. 9
INTRODUCING CARBON AUDITFOR GREENER GOVERNMENT
SEWAGE TREATMENT FACILITIESIN HONG KONG
Speaker : Dr Daniel T.W. TangSenior ChemistDrainage Services DepartmentThe Government of the HKSAR
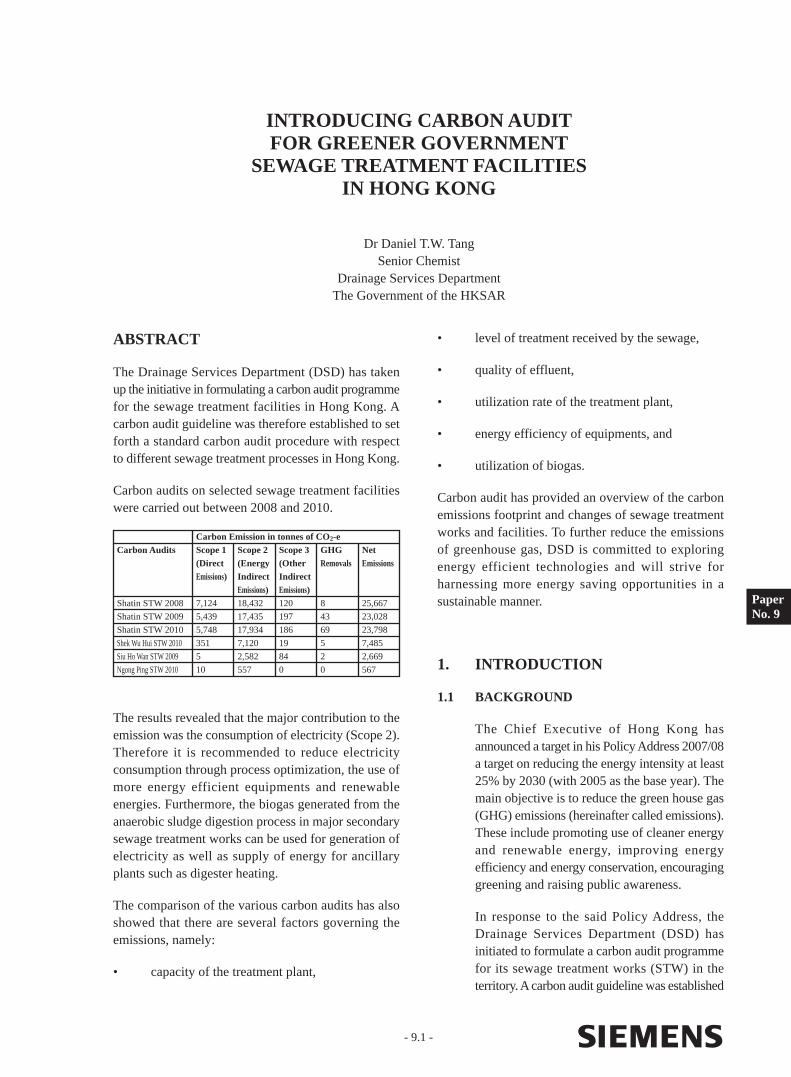
Carbon Emission in tonnes of CO2-eCarbon Audits Scope 1 Scope 2 Scope 3 GHG Net
(Direct (Energy (Other Removals EmissionsEmissions) Indirect Indirect
Emissions) Emissions)Shatin STW 2008 7,124 18,432 120 8 25,667
Shatin STW 2009 5,439 17,435 197 43 23,028
Shatin STW 2010 5,748 17,934 186 69 23,798
Shek Wu Hui STW 2010 351 7,120 19 5 7,485
Siu Ho Wan STW 2009 5 2,582 84 2 2,669
Ngong Ping STW 2010 10 557 0 0 567
- 9.1 -
INTRODUCING CARBON AUDITFOR GREENER GOVERNMENT
SEWAGE TREATMENT FACILITIESIN HONG KONG
Dr Daniel T.W. TangSenior Chemist
Drainage Services DepartmentThe Government of the HKSAR
ABSTRACT
The Drainage Services Department (DSD) has taken up the initiative in formulating a carbon audit programme for the sewage treatment facilities in Hong Kong. A carbon audit guideline was therefore established to set forth a standard carbon audit procedure with respect to different sewage treatment processes in Hong Kong.
Carbon audits on selected sewage treatment facilities were carried out between 2008 and 2010.
• level of treatment received by the sewage,
• quality of effluent,
• utilization rate of the treatment plant,
• energy efficiency of equipments, and
• utilization of biogas.
Carbon audit has provided an overview of the carbon emissions footprint and changes of sewage treatment works and facilities. To further reduce the emissions of greenhouse gas, DSD is committed to exploring energy efficient technologies and will strive for harnessing more energy saving opportunities in a sustainable manner.
1. INTRODUCTION
1.1 BACKGROUND
The Chief Executive of Hong Kong has announced a target in his Policy Address 2007/08 a target on reducing the energy intensity at least 25% by 2030 (with 2005 as the base year). The main objective is to reduce the green house gas (GHG) emissions (hereinafter called emissions). These include promoting use of cleaner energy and renewable energy, improving energy efficiency and energy conservation, encouraging greening and raising public awareness.
In response to the said Policy Address, the Drainage Services Department (DSD) has initiated to formulate a carbon audit programme for its sewage treatment works (STW) in the territory. A carbon audit guideline was established
PaperNo. 9
The results revealed that the major contribution to the emission was the consumption of electricity (Scope 2). Therefore it is recommended to reduce electricity consumption through process optimization, the use of more energy efficient equipments and renewable energies. Furthermore, the biogas generated from the anaerobic sludge digestion process in major secondary sewage treatment works can be used for generation of electricity as well as supply of energy for ancillary plants such as digester heating.
The comparison of the various carbon audits has also showed that there are several factors governing the emissions, namely:
• capacity of the treatment plant,

- 9.2 -
Introducing Carbon Audit for Greener Government Sewage Treatment Facilities in Hong Kong
so as to set forth a standard carbon audit procedure.
1.2 OUTLINE OF REPORT
This report aims to provide an overview of the carbon audit guideline established by DSD and the results from the carbon audits conducted in various sewage treatment facilities.
The report details the following:
• Carbon Audit Guideline;
• Brief description on plant information;
• Results and analysis, which includes the findings from various carbon audits conducted between 2008 and 2010;
• Recommendations of measures to reduce GHG emissions.
2. CARBON AUDIT GUIDELINE
2.1 GENERAL DESCRIPTION
Carbon audit is a tool used to identify, examine and report the amount of GHG being emitted. In order to set forth a standard carbon audit procedure, DSD has established a carbon audit guideline, namely “Carbon Audit Guideline for Accounting and Reporting of Greenhouse Gas Emissions for Sewage Treatment Works in Hong Kong” [1] (hereinafter named as the Carbon Audit Guideline). An extract is shown in Appendix 1.
2.2 OBJECTIVE OF CARBON AUDIT GUIDELINE
The Carbon Audit Guideline aims to assist DSD to conduct carbon audits for the STW as operated and maintained by the DSD in Hong Kong. It enables DSD to:
• conduct and complete carbon audit and report carbon emissions in terms of GHG emissions for all sewage treatment works and facilities through step-by-step guidance approaches,
• keep track of the carbon emissions footprint
and changes of various sewage treatment works and facilities within the operation and physical boundaries,
• establish baselines for the existing facilities and to account for the major contributing factor for the emissions periodically,
• keep track of the direct carbon emissions by the treatment processes,
• keep track of the indirect carbon emissions due to respective energy consuming system within the boundaries and by others, and
• keep track of carbon emissions avoided through energy and material recovery and sludge handling.
2.3 SCOPE OF CARBON AUDIT GUIDELINE
The method in carrying out carbon audit for sewage treatment facilities is equally applicable to the carbon audit for general building, except for special emphasis on waste treatment such as sludge and wastewater. Along this line, the emissions arising for the STWs could be classified into three scopes according to the guideline in Appendix 1:
• Scope 1 – Direct Emission from sources and removal from sinks,
• Scope 2 – Energy indirect emission, and
• Scope 3 – Other indirect emission.
2.3.1 SCOPE 1 – DIRECT EMISSION FROM SOURCES AND REMOVAL FROM SINKS
• Combustion of fuels in stationary sources to generate electricity, heat, or steam, e.g. diesel, biogas, etc.
• Combustion of fuels in mobile sources (cars, trucks) e.g. diesel, unleaded petroleum, etc.
• Intentional or unintentional GHG releases from equipment (overhaul of digesters, refrigerators etc.) and sewage treatment process (nitrification and denitrification).
• Assimilation of CO2 into biomass through
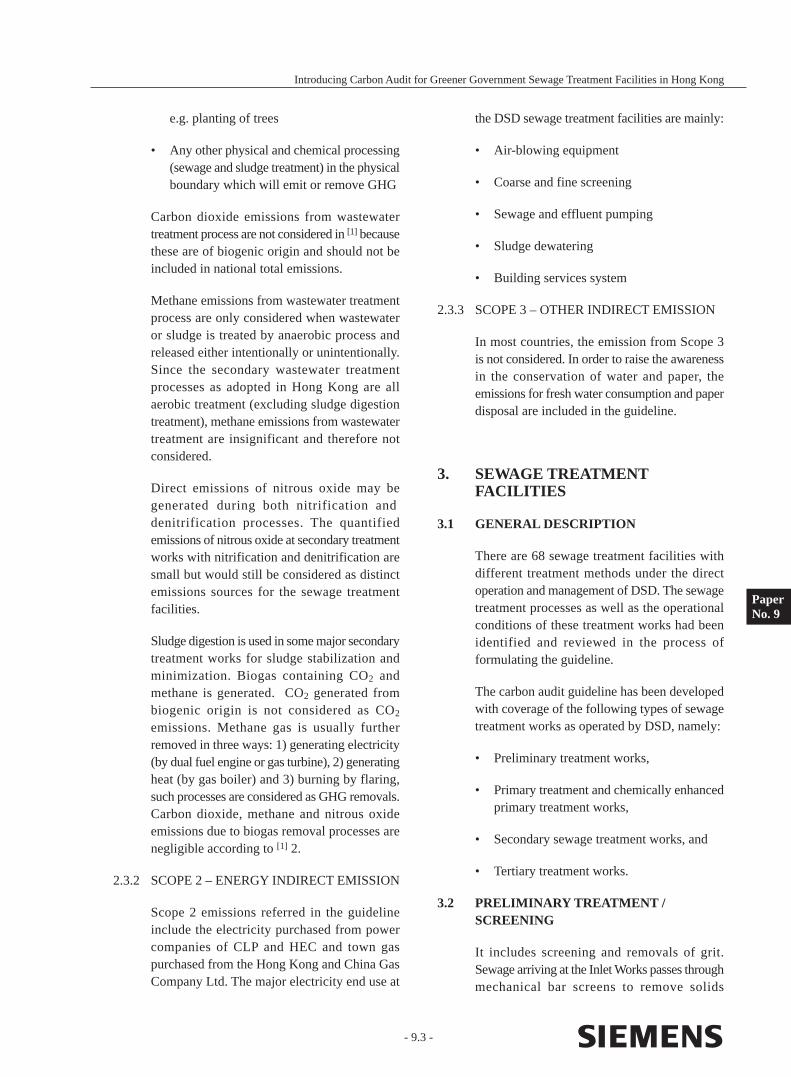
- 9.3 -
Introducing Carbon Audit for Greener Government Sewage Treatment Facilities in Hong Kong
e.g. planting of trees
• Any other physical and chemical processing (sewage and sludge treatment) in the physical boundary which will emit or remove GHG
Carbon dioxide emissions from wastewater treatment process are not considered in [1] because these are of biogenic origin and should not be included in national total emissions.
Methane emissions from wastewater treatment process are only considered when wastewater or sludge is treated by anaerobic process and released either intentionally or unintentionally. Since the secondary wastewater treatment processes as adopted in Hong Kong are all aerobic treatment (excluding sludge digestion treatment), methane emissions from wastewater treatment are insignificant and therefore not considered.
Direct emissions of nitrous oxide may be generated �during both nitrification and denitrification processes. The quantified emissions of nitrous oxide at secondary treatment works with nitrification and denitrification are small but would still be considered as distinct emissions sources for the sewage treatment facilities.
Sludge digestion is used in some major secondary treatment works for sludge stabilization and minimization. Biogas containing CO2 and methane is generated. CO2 generated from biogenic origin is not considered as CO2
emissions. Methane gas is usually further removed in three ways: 1) generating electricity (by dual fuel engine or gas turbine), 2) generating heat (by gas boiler) and 3) burning by flaring, such processes are considered as GHG removals. Carbon dioxide, methane and nitrous oxide emissions due to biogas removal processes are negligible according to [1] 2.
2.3.2 SCOPE 2 – ENERGY INDIRECT EMISSION
Scope 2 emissions referred in the guideline include the electricity purchased from power companies of CLP and HEC and town gas purchased from the Hong Kong and China Gas Company Ltd. The major electricity end use at
the DSD sewage treatment facilities are mainly:
• Air-blowing equipment
• Coarse and fine screening
• Sewage and effluent pumping
• Sludge dewatering
• Building services system
2.3.3 SCOPE 3 – OTHER INDIRECT EMISSION
In most countries, the emission from Scope 3 is not considered. In order to raise the awareness in the conservation of water and paper, the emissions for fresh water consumption and paper disposal are included in the guideline.
3. SEWAGE TREATMENT FACILITIES
3.1 GENERAL DESCRIPTION
There are 68 sewage treatment facilities with different treatment methods under the direct operation and management of DSD. The sewage treatment processes as well as the operational conditions of these treatment works had been identified and reviewed in the process of formulating the guideline.
The carbon audit guideline has been developed with coverage of the following types of sewage treatment works as operated by DSD, namely:
• Preliminary treatment works,
• Primary treatment and chemically enhanced primary treatment works,
• Secondary sewage treatment works, and
• Tertiary treatment works.
3.2 PRELIMINARY TREATMENT / SCREENING
It includes screening and removals of grit. Sewage arriving at the Inlet Works passes through mechanical bar screens to remove solids
PaperNo. 9
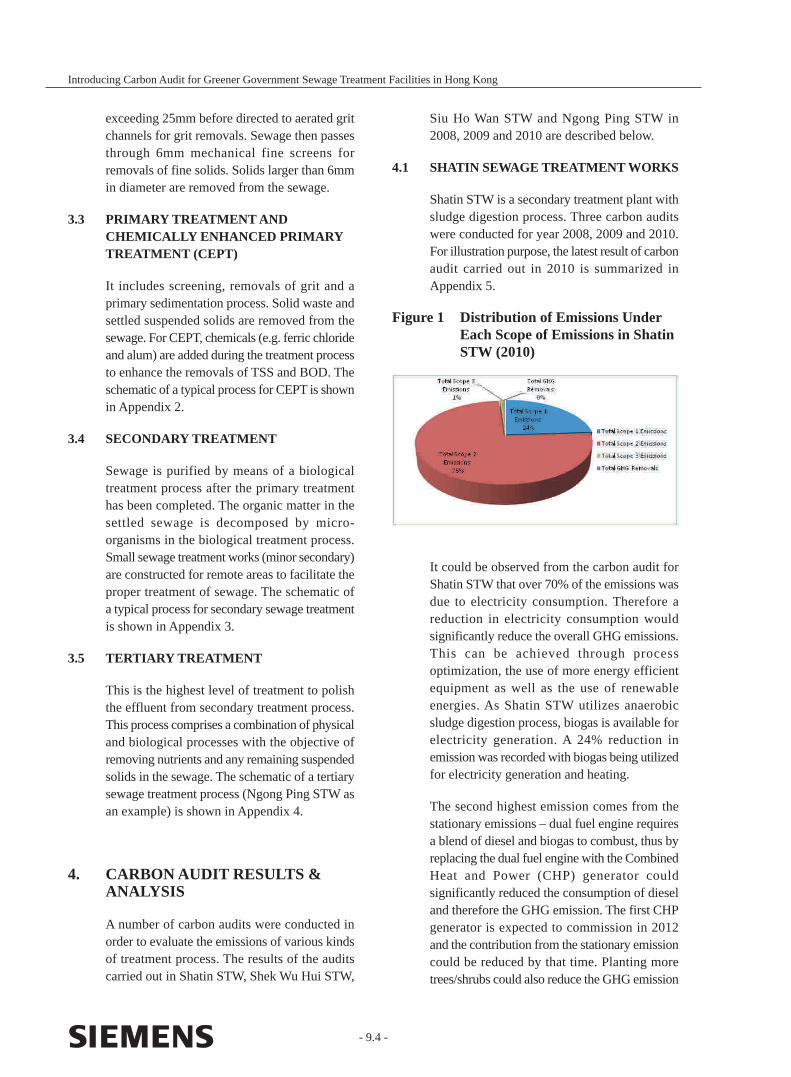
- 9.4 -
Introducing Carbon Audit for Greener Government Sewage Treatment Facilities in Hong Kong
Siu Ho Wan STW and Ngong Ping STW in 2008, 2009 and 2010 are described below.
4.1 SHATIN SEWAGE TREATMENT WORKS
Shatin STW is a secondary treatment plant with sludge digestion process. Three carbon audits were conducted for year 2008, 2009 and 2010. For illustration purpose, the latest result of carbon audit carried out in 2010 is summarized in Appendix 5.
Figure 1 Distribution of Emissions Under Each Scope of Emissions in Shatin STW (2010)
exceeding 25mm before directed to aerated grit channels for grit removals. Sewage then passes through 6mm mechanical fine screens for removals of fine solids. Solids larger than 6mm in diameter are removed from the sewage.
3.3 PRIMARY TREATMENT AND CHEMICALLY ENHANCED PRIMARY TREATMENT (CEPT)
It includes screening, removals of grit and a primary sedimentation process. Solid waste and settled suspended solids are removed from the sewage. For CEPT, chemicals (e.g. ferric chloride and alum) are added during the treatment process to enhance the removals of TSS and BOD. The schematic of a typical process for CEPT is shown in Appendix 2.
3.4 SECONDARY TREATMENT
Sewage is purified by means of a biological treatment process after the primary treatment has been completed. The organic matter in the settled sewage is decomposed by micro-organisms in the biological treatment process. Small sewage treatment works (minor secondary) are constructed for remote areas to facilitate the proper treatment of sewage. The schematic of a typical process for secondary sewage treatment is shown in Appendix 3.
3.5 TERTIARY TREATMENT
This is the highest level of treatment to polish the effluent from secondary treatment process. This process comprises a combination of physical and biological processes with the objective of removing nutrients and any remaining suspended solids in the sewage. The schematic of a tertiary sewage treatment process (Ngong Ping STW as an example) is shown in Appendix 4.
4. CARBON AUDIT RESULTS & ANALYSIS
A number of carbon audits were conducted in order to evaluate the emissions of various kinds of treatment process. The results of the audits carried out in Shatin STW, Shek Wu Hui STW,
It could be observed from the carbon audit for Shatin STW that over 70% of the emissions was due to electricity consumption. Therefore a reduction in electricity consumption would significantly reduce the overall GHG emissions. This can be achieved through process optimization, the use of more energy efficient equipment as well as the use of renewable energies. As Shatin STW utilizes anaerobic sludge digestion process, biogas is available for electricity generation. A 24% reduction in emission was recorded with biogas being utilized for electricity generation and heating.
The second highest emission comes from the stationary emissions – dual fuel engine requires a blend of diesel and biogas to combust, thus by replacing the dual fuel engine with the Combined Heat and Power (CHP) generator could significantly reduced the consumption of diesel and therefore the GHG emission. The first CHP generator is expected to commission in 2012 and the contribution from the stationary emission could be reduced by that time. Planting more trees/shrubs could also reduce the GHG emission
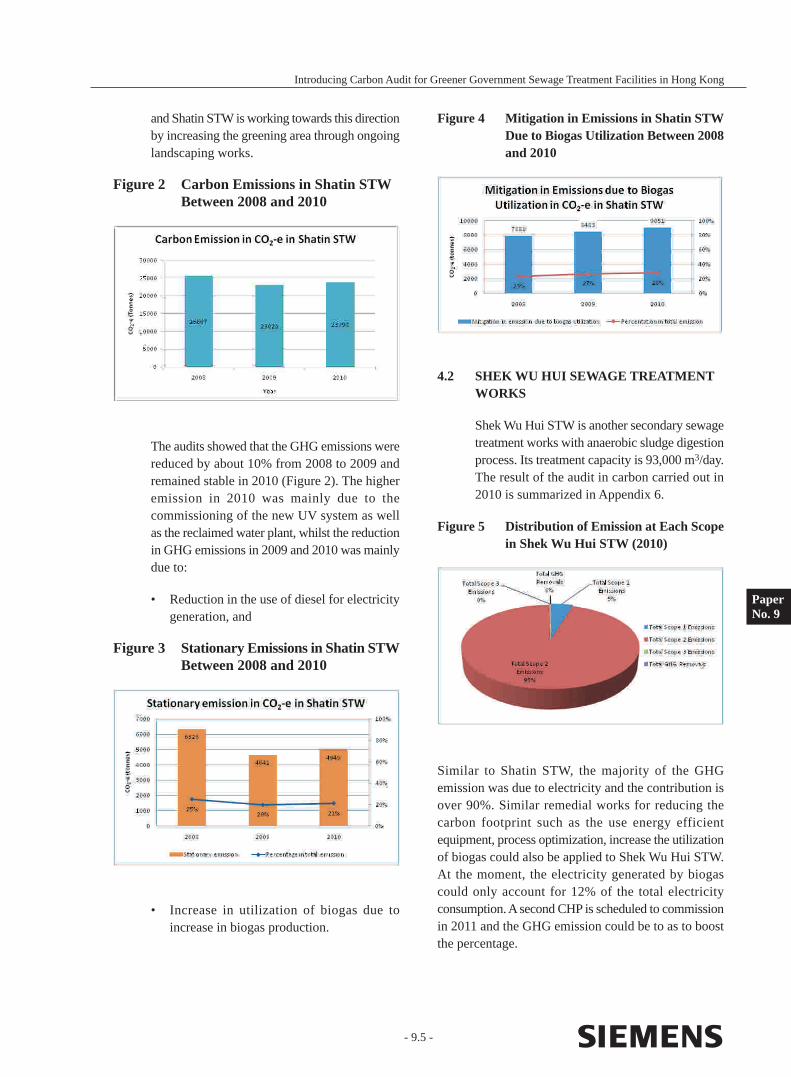
- 9.5 -
Introducing Carbon Audit for Greener Government Sewage Treatment Facilities in Hong Kong
and Shatin STW is working towards this direction by increasing the greening area through ongoing landscaping works.
Figure 2 Carbon Emissions in Shatin STW Between 2008 and 2010
Figure 4 Mitigation in Emissions in Shatin STW Due to Biogas Utilization Between 2008 and 2010
Similar to Shatin STW, the majority of the GHG emission was due to electricity and the contribution is over 90%. Similar remedial works for reducing the carbon footprint such as the use energy efficient equipment, process optimization, increase the utilization of biogas could also be applied to Shek Wu Hui STW. At the moment, the electricity generated by biogas could only account for 12% of the total electricity consumption. A second CHP is scheduled to commission in 2011 and the GHG emission could be to as to boost the percentage.
PaperNo. 9
4.2 SHEK WU HUI SEWAGE TREATMENT WORKS
Shek Wu Hui STW is another secondary sewage treatment works with anaerobic sludge digestion process. Its treatment capacity is 93,000 m3/day. The result of the audit in carbon carried out in 2010 is summarized in Appendix 6.
Figure 5 Distribution of Emission at Each Scope in Shek Wu Hui STW (2010)
The audits showed that the GHG emissions were reduced by about 10% from 2008 to 2009 and remained stable in 2010 (Figure 2). The higher emission in 2010 was mainly due to the commissioning of the new UV system as well as the reclaimed water plant, whilst the reduction in GHG emissions in 2009 and 2010 was mainly due to:
• Reduction in the use of diesel for electricity generation, and
Figure 3 Stationary Emissions in Shatin STW Between 2008 and 2010
• Increase in utilization of biogas due to increase in biogas production.
Carbon audit Carbon emission in Co2-e kg Co2-e/m3
Shatin STW 2008 25667 0.25
Shatin STW 2009 23028 0.278
Shatin STW 2010 23798 0.289
Shek Wu Hui STW 2010 7485 0.255�
Siu Ho Wan STW 2009 2668 0.167
Ngong Ping STW 2010 567 432
- 9.6 -
Introducing Carbon Audit for Greener Government Sewage Treatment Facilities in Hong Kong
As the plant does not have any biogas production, therefore it is not surprising that most of the GHG emissions were due electricity consumption for sewage pumping and sludge dewatering.
4.4 NGONG PING SEWAGE TREATMENT WORKS
Ngong Ping is a small sewage treatment work with tertiary treatment. Its treatment capacity is about 450 m3/day. The findings from 2010 carbon audit are summarized in Appendix 8.
Figure 7 Distribution of Emission at Each Scope in Ngong Ping STW (2010)
4.5 COMPARISON OF TREATMENT PROCESS
In order to better represent the amount of emissions due to the treatment process, a ratio indicator of GHG emission per cubic meter sewage treated is being used, as shown in Table 1.
Table 1 Normalized GHG Emissions from Various Carbon Audits
Almost all the GHG emission was due to electricity consumption. As Ngong Ping STW is a tertiary treatment plant and part of its treated effluent is used for toilet flushing nearby, thus there was an avoidance of 1% due to water recycling.
4.3 SIU HO WAN SEWAGE TREATMENT WORKS
Siu Ho Wan STW is a chemical enhanced primary treatment plant, the findings from 2009 carbon audit is summarized in Appendix 7.
Figure 6 Distribution of Emission at Each Scope in Siu Ho Wan STW (2009)
It should be noted that it would be difficult to compare the performances between different sewage treatment works due to their different treatment process, emission factors and plant arrangements. Therefore this comparison is on a macro perspective and based on the information available.
Both Shatin STW and Shek Wu Hui STW are secondary treatment works and it appears that the GHG emissions for treating each cubic metre of sewage are lower for Shek Wu Hui STW. However, the higher emission in Shatin STW is mainly due to the pumping of the treated effluent of both Shatin STW and Taipo STW to Kai Tak Nullah. Thus, GHG emission of Shatin STW could be reduced to 0.208kg CO2-e/m3 if the emissions due to effluent pumping between both STW via a submarine pipeline are removed. When comparing this 0.208kg CO2-e/m3 with Shek Wu Hui STW’s 0.255kg CO2-e/m3, the lower GHG emissions for Shatin STW are probably due to:
• Less stringent discharge requirement for Shatin STW;
• The use of less energy efficient UV system in Shek Wu Hui STW;
• Higher biogas utilization rate in Shatin STW.
When comparing GHG emissions per cubic

- 9.7 -
Introducing Carbon Audit for Greener Government Sewage Treatment Facilities in Hong Kong
PaperNo. 9
meter of sewage treated between Shatin STW and Siu Ho Wan STW, the emission by Shatin STW is only higher than Shek Wu Hui STW by 25%. The difference could be reduced with the commissioning of the CHP generator in Shatin STW after 2012. The GHG emission for Shatin STW could be further reduced if the discharge requirement could be revised to without nutrient removal. Therefore it could be concluded that secondary treatment produces slightly more GHG emissions than CEPT process but with a much better effluent quality.
Ngong Ping STW is a small package plant with tertiary treatment. It has the highest emissions and is properly due to:
• The scale of the plant is small;
• The utilization rate is low with only 20%;
• Tertiary treatment.
5. RECOMMENDATIONS
The main emissions arising from operation of STWs were due to electricity consumption. Therefore reducing the electricity consumption would significantly reduce the GHG emissions. The reduction of electricity consumption would be achieved through process optimization, the use of more energy efficient equipment as well as the use of renewable energies.
For major secondary sewage treatment works with anaerobic sludge digestion process, biogas can be used for electricity generation. Therefore, maximizing the utilization of biogas to its full extent would be our goal for the coming years.
6. CONCLUSION
It could be concluded that the treatment capacity of the secondary treatment plant has played a key contributing factor in GHG emissions. The higher the capacity, the more efficient would be the electricity utilization and the lower the GHG emissions for treating one cubic metre of the sewage. The more stringent the discharge
requirement, the higher the emissions as more energy is required to achieve effluent standard.
Secondary treatment produces slightly more GHG emission than CEPT process but with a much better effluent quality.
To achieve reduction of electricity consumption, DSD has been implementing various energy saving measures in our plants. Some recent examples for the means of reduction of electricity consumption include:
• the installation and replacement of energy-efficient pumps, motors and blowers,
• the use of variable speed drive to match the operation of pumps with the flow pattern,
• the application of energy efficient lightings such as T5 fluorescent tubes and LEDs,
• process optimizations in sludge treatment and sewage pumping,
• greenings, and
• the use of renewable energies such as solar photovoltaic panels and wind turbine generators.
In conclusion, DSD is committed to exploring energy efficient technologies and will strive for harnessing more energy saving opportunities in a sustainable manner.
REFERENCES
[1] IPCC (2006), “2006 IPCC Guidelines for National Greenhouse Gas Inventories, Prepared by the National Greenhouse Gas Inventories Programme”, Eggleston H.S., Buendia L., Miwa K., Ngara T. and Tanabe K. (eds). Published: IGES, Japan
[2] WRI / WBCSD (2004), “The Greenhouse Gas Protocol: A Corporate Accounting and Reporting Standard (revised edition)”, World Resources Institute and World Business Council for Sustainable Development
- 9.8 -
Introducing Carbon Audit for Greener Government Sewage Treatment Facilities in Hong Kong
ACKNOWLEDGEMENTS
I would like to thank the Drainage Services Department for giving me the permission to commission the carbon audit. Thanks are due to all those who supported in completing the paper, including my audit team members, Miss Jessica JOR, Mr. CHU Tak-ming, Mr. NG Chit-san, Mr. LEUNG Wang-yip, Mr. IP Kin-ping, Mr. LEE Chi-fai, Mr. LAW Kwok-wah, Mr. CHIANG Chi-keung, Mr. FUNG Shu-wun, Mr. NG Kwok-keung, Dr. LAW Yuen-chi, Mr. LEUNG Chi-to and Mr. MAO Shu-lung, and Miss Katie LEE for assisting in the compilation of the paper.
[3] ISO (2006), “International Standard on Greenhouse Gases- Part 1: Specification with guidance at the organization level for quantification and reporting of greenhouse gas emissions and removals”, ISO 14064-1:2006, International Standard Organization
[4] Michael Gillenwater, Environmental Resources Trust (2005), “Calculation Tool for Direct Emissions from Stationary Combustion”, World Resources and World Business Council for Sustainable Development
[5] WRI / WBCSD (2005), “Calculating CO2 Emissions from Mobile Sources- Guidance to calculation worksheets”, World Resources Institute and World Business Council for Sustainable Development
[6] WRI / WBCSD (2005), “Calculating HFC and PFC Emissions from the Manufacturing, Installation, Operation and Disposal of Refrigeration & Air-conditioning Equipment (Version 1.0) - Guide to calculation worksheets”, World Resources Institute and World Business Council for Sustainable Development
[7] WRI /WBCSD (2007),“Indirect COB2B Emissions from the Consumption of Purchased Electricity, Heat, and / or Steam - Guide to calculation worksheets v1.2”, World Resources Institute and World Business Council for Sustainable Development
[8] EMSD/EPD (2008), “Guidelines to Account for and Report on Greenhouse Gas Emissions and Removals for buildings (Commercial, Residential or Institutional Purpose) in Hong Kong”, http://www.epd.gov.hk/epd/english/climate_change/ files/CAGuidelines_Eng.pdf, July 2008

APPENDICES
Appendix 1 : Extract from “Carbon Audit Guideline for Accounting and Reporting of Greenhouse Gas Emissions for Sewage Treatment Works in Hong Kong”
- 9.9 -
Introducing Carbon Audit for Greener Government Sewage Treatment Facilities in Hong Kong
Appendix 3 : Typical Process Schematic for Secondary Treatment Works
PaperNo. 9
Appendix 2 : Typical Process Schematic for CEPT Plant
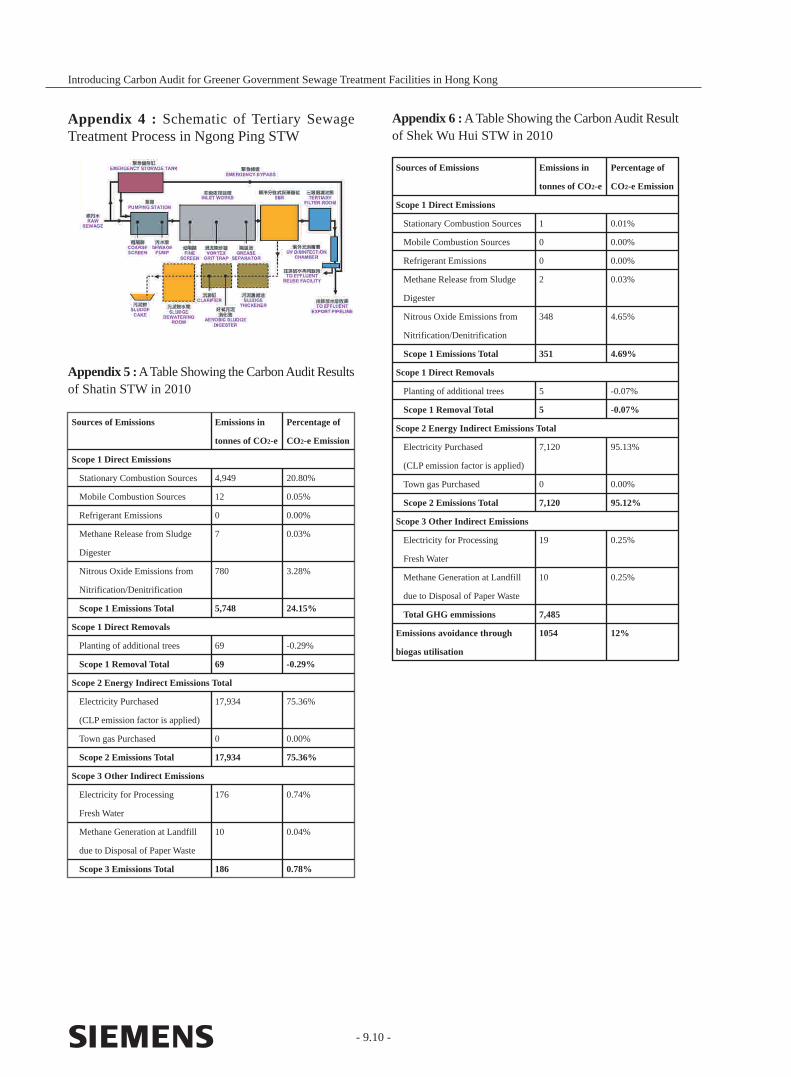
Sources of Emissions Emissions in Percentage of
tonnes of CO2-e CO2-e Emission
Scope 1 Direct Emissions
Stationary Combustion Sources 4,949 20.80%
Mobile Combustion Sources 12 0.05%
Refrigerant Emissions 0 0.00%
Methane Release from Sludge 7 0.03%
Digester
Nitrous Oxide Emissions from 780 3.28%
Nitrification/Denitrification
Scope 1 Emissions Total 5,748 24.15%
Scope 1 Direct Removals
Planting of additional trees 69 -0.29%
Scope 1 Removal Total 69 -0.29%
Scope 2 Energy Indirect Emissions Total
Electricity Purchased 17,934 75.36%
(CLP emission factor is applied)
Town gas Purchased 0 0.00%
Scope 2 Emissions Total 17,934 75.36%
Scope 3 Other Indirect Emissions
Electricity for Processing 176 0.74%
Fresh Water
Methane Generation at Landfill 10 0.04%
due to Disposal of Paper Waste
Scope 3 Emissions Total 186 0.78%
Sources of Emissions Emissions in Percentage of
tonnes of CO2-e CO2-e Emission
Scope 1 Direct Emissions
Stationary Combustion Sources 1 0.01%
Mobile Combustion Sources 0 0.00%
Refrigerant Emissions 0 0.00%
Methane Release from Sludge 2 0.03%
Digester
Nitrous Oxide Emissions from 348 4.65%
Nitrification/Denitrification
Scope 1 Emissions Total 351 4.69%
Scope 1 Direct Removals
Planting of additional trees 5 -0.07%
Scope 1 Removal Total 5 -0.07%
Scope 2 Energy Indirect Emissions Total
Electricity Purchased 7,120 95.13%
(CLP emission factor is applied)
Town gas Purchased 0 0.00%
Scope 2 Emissions Total 7,120 95.12%
Scope 3 Other Indirect Emissions
Electricity for Processing 19 0.25%
Fresh Water
Methane Generation at Landfill 10 0.25%
due to Disposal of Paper Waste
Total GHG emmissions 7,485
Emissions avoidance through 1054 12%
biogas utilisation
- 9.10 -
Introducing Carbon Audit for Greener Government Sewage Treatment Facilities in Hong Kong
Appendix 4 : Schematic of Tertiary Sewage Treatment Process in Ngong Ping STW
Appendix 5 : A Table Showing the Carbon Audit Results of Shatin STW in 2010
Appendix 6 : A Table Showing the Carbon Audit Result of Shek Wu Hui STW in 2010
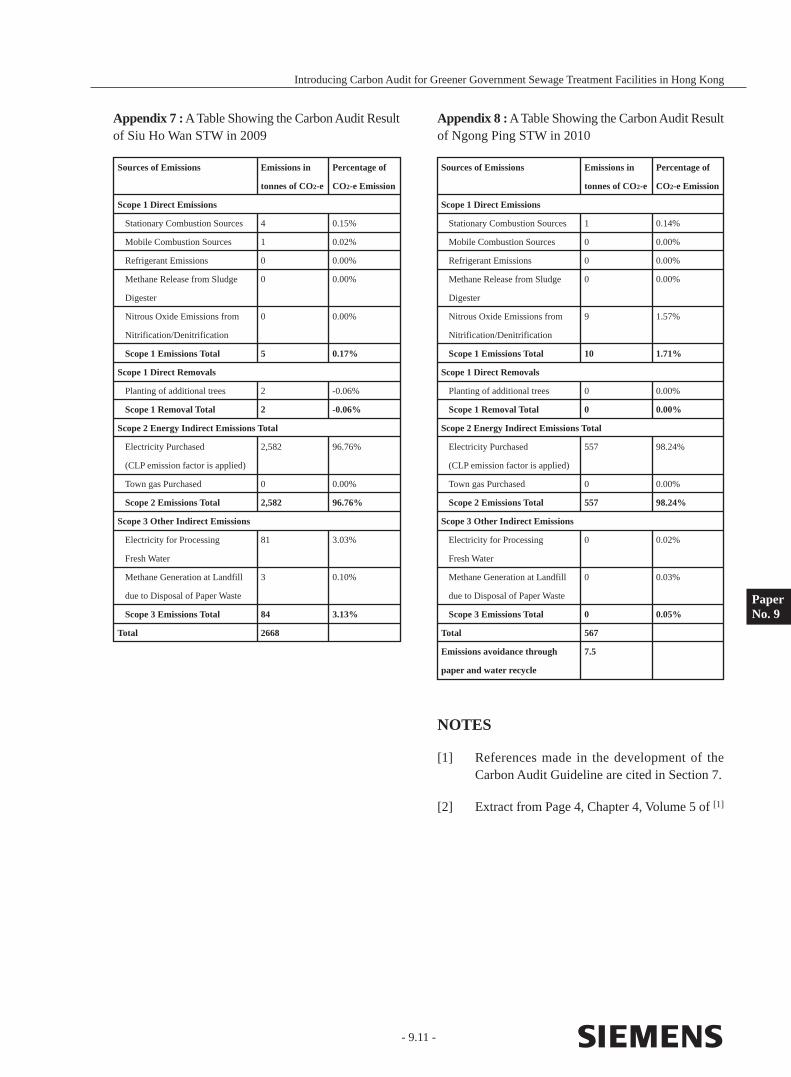
Sources of Emissions Emissions in Percentage of
tonnes of CO2-e CO2-e Emission
Scope 1 Direct Emissions
Stationary Combustion Sources 4 0.15%
Mobile Combustion Sources 1 0.02%
Refrigerant Emissions 0 0.00%
Methane Release from Sludge 0 0.00%
Digester
Nitrous Oxide Emissions from 0 0.00%
Nitrification/Denitrification
Scope 1 Emissions Total 5 0.17%
Scope 1 Direct Removals
Planting of additional trees 2 -0.06%
Scope 1 Removal Total 2 -0.06%
Scope 2 Energy Indirect Emissions Total
Electricity Purchased 2,582 96.76%
(CLP emission factor is applied)
Town gas Purchased 0 0.00%
Scope 2 Emissions Total 2,582 96.76%
Scope 3 Other Indirect Emissions
Electricity for Processing 81 3.03%
Fresh Water
Methane Generation at Landfill 3 0.10%
due to Disposal of Paper Waste
Scope 3 Emissions Total 84 3.13%
Total 2668
NOTES
[1] References made in the development of the Carbon Audit Guideline are cited in Section 7.
[2] Extract from Page 4, Chapter 4, Volume 5 of [1]
Sources of Emissions Emissions in Percentage of
tonnes of CO2-e CO2-e Emission
Scope 1 Direct Emissions
Stationary Combustion Sources 1 0.14%
Mobile Combustion Sources 0 0.00%
Refrigerant Emissions 0 0.00%
Methane Release from Sludge 0 0.00%
Digester
Nitrous Oxide Emissions from 9 1.57%
Nitrification/Denitrification
Scope 1 Emissions Total 10 1.71%
Scope 1 Direct Removals
Planting of additional trees 0 0.00%
Scope 1 Removal Total 0 0.00%
Scope 2 Energy Indirect Emissions Total
Electricity Purchased 557 98.24%
(CLP emission factor is applied)
Town gas Purchased 0 0.00%
Scope 2 Emissions Total 557 98.24%
Scope 3 Other Indirect Emissions
Electricity for Processing 0 0.02%
Fresh Water
Methane Generation at Landfill 0 0.03%
due to Disposal of Paper Waste
Scope 3 Emissions Total 0 0.05%
Total 567
Emissions avoidance through 7.5
paper and water recycle
- 9.11 -
Introducing Carbon Audit for Greener Government Sewage Treatment Facilities in Hong Kong
PaperNo. 9
Appendix 8 : A Table Showing the Carbon Audit Result of Ngong Ping STW in 2010
Appendix 7 : A Table Showing the Carbon Audit Result of Siu Ho Wan STW in 2009

- Notes and Questions -

BIOGRAPHY
Mr Liam G. O’SullivanKeynote Speaker
Mr Liam G. O’Sullivan is currently the Project Director for UK Power Network’s inspiring and ambitious Low Carbon London Programme – a diverse, stimulating and challenging project to trial various commercial techniques and pioneering technologies – engineering, customer and commercial innovation – helping to enable and ready UKPN’s distribution network to meet the challenge of a low carbon economy and transition to the electrification of heat and transport.
Before that, Mr O’Sullivan was the Transmission Construction Director & Engineering Manager for the London 2012 Olympic Games, responsible for the design and delivery, commercial, health and safety aspects of the 132kV distribution network programme over the last 5 years – involving the design and build of 4 new 132kV primary substations, a new Supergrid intake to London from National Grid (with a capacity total of 480MVA), and a deep underground cable tunnel – removing 132kV power lines across the now Olympic Park area to support the London 2012 Olympics Games – powering the event to be a resounding success, which is a multi-million (c. £200m) multi – disciplined engineering project to construct and operate the electricity transmission infrastructure for the London 2012 Olympic Games.
The role involved the successful management and delivery of a number of key organisations, interfaces and skills across a range of direct and contract staff; engineering and specialist services consultants; contractors, equipment suppliers, internal and external stakeholders.
The works incorporate the design, procurement, construction, commissioning and energisation of electricity transmission assets and infrastructure including: the construction of deep underground tunnels and substation buildings; substations & equipment to 132kV (132,000 volts) sourced from the around the world – for example large power transformers from Australia; switchgear from Germany; power cables from France.
Mr O’Sullivan studied and read for a Bachelor of Engineering (Hons) Degree in Engineering and having obtained a 1st Class Honours degree, he has worked in the UK power industry, in the London region, since 1997; and has fulfilled a variety of design, project engineering and management roles on a number of diverse and multi-million pound infrastructure projects.
He is a member of the IET (Institution of Engineering & Technology), and of the APM (Association of Project Management), and led the team in winning the APM's Project of the Year Award 2009 and the RIBA Building of the Year Award Category for Industrial & Commercial Building of the Year 2010; the Brick Awards in addition to one or two other prestigious accolades, most recently the ODA’s Health & Safety Manager of the Year 2010. He was also shortlisted to the last 3 for the APM's Project Manager of the Year Award.

BIOGRAPHY
Ir F. Chan, JPSpeaker of Closing Address
Ir Chan is the Director of the Electrical and Mechanical Services Department of the HKSAR Government, overseeing the safety regulation of electricity, gas, lift and escalator, amusement ride, ropeway, tramway and railway, as well as energy efficiency in Hong Kong. Besides, he also manages an E&M engineering service portfolio with an annual turnover exceeding $4 billion in the capacity of the General Manager of the Electrical and Mechanical Services Trading Fund.
He received his BSc and MBA from the University of Hong Kong, and MSc from the University of Aberdeen, UK. He is also a graduate of the Advanced Management Program of the Harvard Business School as well as an alumnus of the Tsing Hua University, the Chinese Academy of Governance and the Harvard Kennedy School of Government.
Mr Chan is a Fellow of the Hong Kong Institution of Engineers (HKIE), and the Institution of Mechanical Engineers, a Chartered Engineer as well as a Registered Professional Engineer. He is currently a member of the Council of the HKIE, and the Vice Chairman of the Engineers Registration Board.
Mr Chan’s community service record spans over 30 years, being Founding Chairman of the Association for Engineering and Medical Volunteer Services. He served as Vice Chairman of the Community Chest’s Admission, Budget and Allocations Committee and Steering Committee Chairman of the Growing Partners Project.
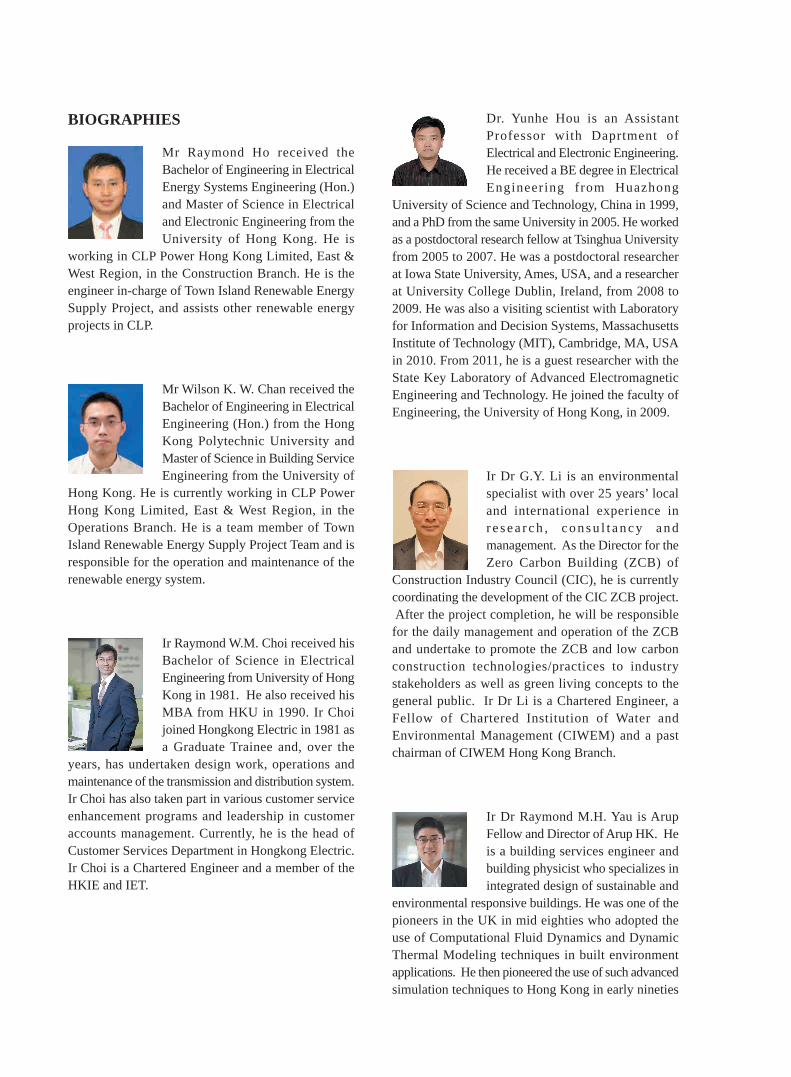
BIOGRAPHIES
Mr Raymond Ho received the Bachelor of Engineering in Electrical Energy Systems Engineering (Hon.) and Master of Science in Electrical and Electronic Engineering from the University of Hong Kong. He is
working in CLP Power Hong Kong Limited, East & West Region, in the Construction Branch. He is the engineer in-charge of Town Island Renewable Energy Supply Project, and assists other renewable energy projects in CLP.
Mr Wilson K. W. Chan received the Bachelor of Engineering in Electrical Engineering (Hon.) from the Hong Kong Polytechnic University and Master of Science in Building Service Engineering from the University of
Hong Kong. He is currently working in CLP Power Hong Kong Limited, East & West Region, in the Operations Branch. He is a team member of Town Island Renewable Energy Supply Project Team and is responsible for the operation and maintenance of the renewable energy system.
Ir Raymond W.M. Choi received his Bachelor of Science in Electrical Engineering from University of Hong Kong in 1981. He also received his MBA from HKU in 1990. Ir Choi joined Hongkong Electric in 1981 as a Graduate Trainee and, over the
years, has undertaken design work, operations and maintenance of the transmission and distribution system. Ir Choi has also taken part in various customer service enhancement programs and leadership in customer accounts management. Currently, he is the head of Customer Services Department in Hongkong Electric. Ir Choi is a Chartered Engineer and a member of the HKIE and IET.
Dr. Yunhe Hou is an Assistant Professor with Daprtment of Electrical and Electronic Engineering. He received a BE degree in Electrical Engineering from Huazhong
University of Science and Technology, China in 1999, and a PhD from the same University in 2005. He worked as a postdoctoral research fellow at Tsinghua University from 2005 to 2007. He was a postdoctoral researcher at Iowa State University, Ames, USA, and a researcher at University College Dublin, Ireland, from 2008 to 2009. He was also a visiting scientist with Laboratory for Information and Decision Systems, Massachusetts Institute of Technology (MIT), Cambridge, MA, USA in 2010. From 2011, he is a guest researcher with the State Key Laboratory of Advanced Electromagnetic Engineering and Technology. He joined the faculty of Engineering, the University of Hong Kong, in 2009.
Ir Dr G.Y. Li is an environmental specialist with over 25 years’ local and international experience in r e s e a r c h , c o n s u l t a n c y a n d management. As the Director for the Zero Carbon Building (ZCB) of
Construction Industry Council (CIC), he is currently coordinating the development of the CIC ZCB project. After the project completion, he will be responsible for the daily management and operation of the ZCB and undertake to promote the ZCB and low carbon construction technologies/practices to industry stakeholders as well as green living concepts to the general public. Ir Dr Li is a Chartered Engineer, a Fellow of Chartered Institution of Water and Environmental Management (CIWEM) and a past chairman of CIWEM Hong Kong Branch.
Ir Dr Raymond M.H. Yau is Arup Fellow and Director of Arup HK. He is a building services engineer and building physicist who specializes in integrated design of sustainable and
environmental responsive buildings. He was one of the pioneers in the UK in mid eighties who adopted the use of Computational Fluid Dynamics and Dynamic Thermal Modeling techniques in built environment applications. He then pioneered the use of such advanced simulation techniques to Hong Kong in early nineties
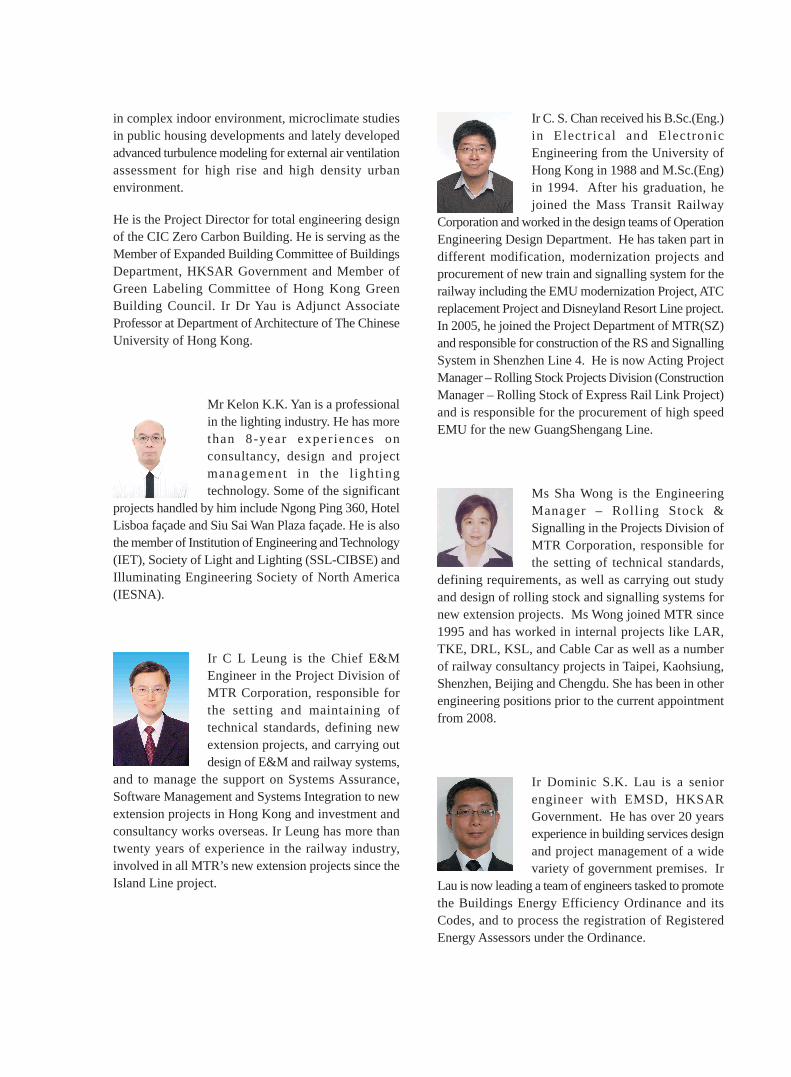
in complex indoor environment, microclimate studies in public housing developments and lately developed advanced turbulence modeling for external air ventilation assessment for high rise and high density urban environment.
He is the Project Director for total engineering design of the CIC Zero Carbon Building. He is serving as the Member of Expanded Building Committee of Buildings Department, HKSAR Government and Member of Green Labeling Committee of Hong Kong Green Building Council. Ir Dr Yau is Adjunct Associate Professor at Department of Architecture of The Chinese University of Hong Kong.
Mr Kelon K.K. Yan is a professional in the lighting industry. He has more than 8-year experiences on consultancy, design and project management in the l ighting technology. Some of the significant
projects handled by him include Ngong Ping 360, Hotel Lisboa façade and Siu Sai Wan Plaza façade. He is also the member of Institution of Engineering and Technology (IET), Society of Light and Lighting (SSL-CIBSE) and Illuminating Engineering Society of North America (IESNA).
Ir C L Leung is the Chief E&M Engineer in the Project Division of MTR Corporation, responsible for the setting and maintaining of technical standards, defining new extension projects, and carrying out design of E&M and railway systems,
and to manage the support on Systems Assurance, Software Management and Systems Integration to new extension projects in Hong Kong and investment and consultancy works overseas. Ir Leung has more than twenty years of experience in the railway industry, involved in all MTR’s new extension projects since the Island Line project.
Ir C. S. Chan received his B.Sc.(Eng.) in Electrical and Electronic Engineering from the University of Hong Kong in 1988 and M.Sc.(Eng) in 1994. After his graduation, he joined the Mass Transit Railway
Corporation and worked in the design teams of Operation Engineering Design Department. He has taken part in different modification, modernization projects and procurement of new train and signalling system for the railway including the EMU modernization Project, ATC replacement Project and Disneyland Resort Line project. In 2005, he joined the Project Department of MTR(SZ) and responsible for construction of the RS and Signalling System in Shenzhen Line 4. He is now Acting Project Manager – Rolling Stock Projects Division (Construction Manager – Rolling Stock of Express Rail Link Project) and is responsible for the procurement of high speed EMU for the new GuangShengang Line.
Ms Sha Wong is the Engineering Manager – Rolling Stock & Signalling in the Projects Division of MTR Corporation, responsible for the setting of technical standards,
defining requirements, as well as carrying out study and design of rolling stock and signalling systems for new extension projects. Ms Wong joined MTR since 1995 and has worked in internal projects like LAR, TKE, DRL, KSL, and Cable Car as well as a number of railway consultancy projects in Taipei, Kaohsiung, Shenzhen, Beijing and Chengdu. She has been in other engineering positions prior to the current appointment from 2008.
Ir Dominic S.K. Lau is a senior engineer with EMSD, HKSAR Government. He has over 20 years experience in building services design and project management of a wide variety of government premises. Ir
Lau is now leading a team of engineers tasked to promote the Buildings Energy Efficiency Ordinance and its Codes, and to process the registration of Registered Energy Assessors under the Ordinance.

Ir David W.H. Li is an engineer with EMSD. He has over 20 years experience in building services design and project management of a wide variety of government premises. Ir Li has actively involved over the past
few years in technically supporting the development of the Buildings Energy Efficiency Ordinance (BEEO), served the Technical Taskforce for developing the Building Energy Code (BEC) and Energy Audit Code (EAC), and played a prominent role in soliciting and consolidating views from Taskforce members and the public in finalizing the contents of the BEEO and the Codes. In addition, Ir Li has conducted researches & studies of overseas codes, and has published papers & conducted technical talks on the BEEO and the Codes.
Dr. Daniel T.W. Tang graduated from the University of Hong Kong in 1979 and obtained the Ph. D in 1982. He joined Drainage Service Department (DSD) in 1993 and his main duty was on the process monitoring for the major secondary
sewage treatment works in DSD. He was a member of DSD’s Research & Development Team between 2002 and 2009 specializing in odour control, sewage treatment process and effluent reuse. Dr. Tang took charge to develop the carbon audit guideline for DSD and the subsequent carbon audit for the sewage treatment facilities. He is the Senior Chemist in DSD.