innovest strategic value advisors, inc. energy efficiency screening enhances investor returns green...
Post on 19-Dec-2015
221 views
TRANSCRIPT

InnovestStrategic Value Advisors, Inc.
Energy Efficiency Screening Enhances Investor Returns
www.innovestgroup.com
Green Mountain SRI Summit
Stowe, VT, September 10, 2002
Frank DixonManaging Director
4 Times Square, 3rd Floor New York, N.Y. 10036
Tel. 1 212 421 2000 [email protected]

Agenda
• Challenges of Measuring Energy Efficiency
• Overcoming Challenges -- EcoValue’21™
• Energy Efficiency Performance in the
Retail Food and Real Estate Sectors
I N N O V E S T Strategic Value
Advisors

The Major Barrier to Providing Accurate Analysis of
Energy Efficiency Performance is Poor Data Quality
Data is often:
• Lagged
• Missing
• Inaccurate
• Biased
I N N O V E S T Strategic Value
Advisors

A leading-edge, specialized international financial information services firm with offices in New York, Toronto, and London.
Now have 30+ staff with backgrounds in finance, industry and sustainability
Over $3.5 billion in funds managed with Innovest research
Forward-looking, alpha generating investment approach
Proprietary EcoValueEcoValue'21™
and IVA™
performance rating systems focus on competitive risks and opportunities driven by environmental and social trends
Leveraging research into private equity, specialized funds, custom advisory work and more
Innovest BackgroundI N N O V E S T Strategic Value
Advisors

Historical Contingent Liabilities:- Superfund
- State and hazardous waste sites
- RCRA
- Toxic torts
Strategic Management Capacity:- Strategic corporate governance
capability
- Environmental management
systems strength
- Environmental audit/accounting
capacity
- Social issues performance
- Supply chain management
- Stakeholder relations
Operating Risk Exposure:- Toxic emissions
- Product risk liabilities
- Hazardous waste disposal
- Waste discharges
- Supply chain management risk
Sustainability Risk:- Energy intensity and efficiency
- Resource use efficiency and intensity
- Product life-cycle durability and recyclability
- Exposure to shifts in consumer values
- Social/community “license to operate”
EcoValueEcoValue'21
RATING
Sustainable Profit Opportunities:- ability to profit from
environmentally and socially -
driven industry and market trends
Multi-factor EcoValue’EcoValue’2121 algorithms integrate over 60 key data points, including:
EcoValue’21 Overlay I N N O V E S T Strategic Value
Advisors

Research Process
Framing the Sector
Contacting the Company
Reviewing Third-Party Data
Reviewing Company Data
Interviewing the Company
Completing the Rating Process
Writing Company Reports
I N N O V E S T Strategic Value
Advisors
-2
-1
0
1
2
3
4
5
6
Pe
rce
nt
100 bp
75 bp
50 bp
25 bp
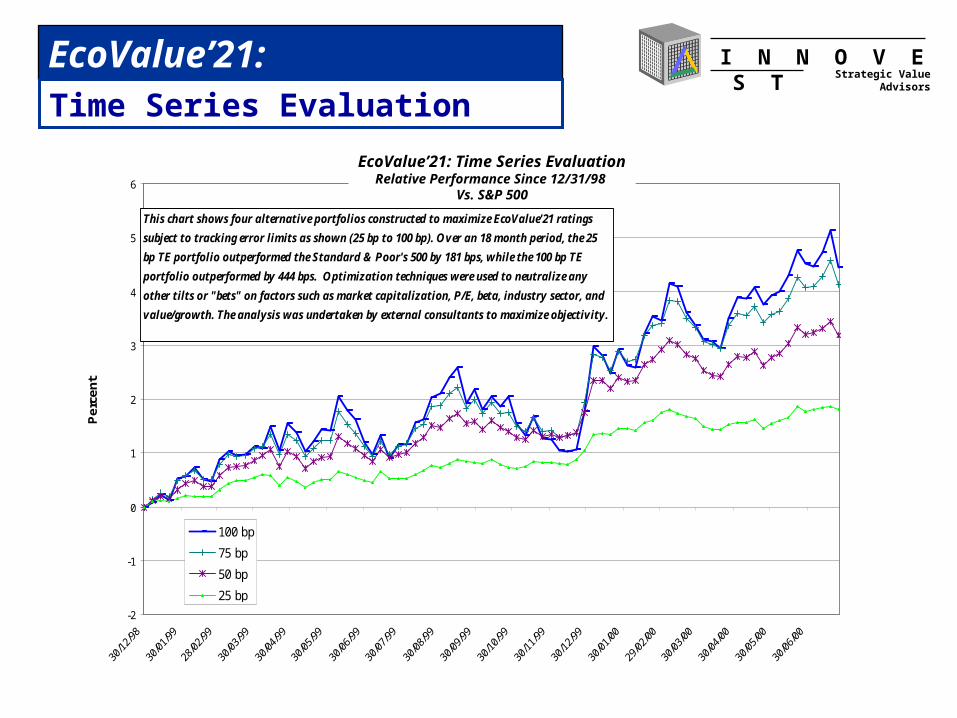
This chart shows four alternative portfolios constructed to maximize EcoValue'21 ratings
subject to tracking error limits as shown (25 bp to 100 bp). Over an 18 month period, the 25
bp TE portfolio outperformed the Standard & Poor's 500 by 181 bps, while the 100 bp TE
portfolio outperformed by 444 bps. Optimization techniques were used to neutralize any
other tilts or "bets" on factors such as market capitalization, P/E, beta, industry sector, and
value/growth. The analysis was undertaken by external consultants to maximize objectivity.
EcoValue’21: Time Series EvaluationRelative Performance Since 12/31/98
Vs. S&P 500
EcoValue’21:Time Series Evaluation
I N N O V E S T Strategic Value
Advisors

-10%
0%
10%
20%
30%
40%
50%
60%
Jan
-97
Ma
r-9
7
Ma
y-9
7
Jul-
97
Se
p-9
7
No
v-9
7
Jan
-98
Ma
r-9
8
Ma
y-9
8
Jul-
98
Se
p-9
8
No
v-9
8
Jan
-99
Ma
r-9
9
Ma
y-9
9
Jul-
99
Se
p-9
9
No
v-9
9
Jan
-00
Ma
r-0
0
Ma
y-0
0
Jul-
00
Se
p-0
0
No
v-0
0
Jan
-01
-50%
-40%
-30%
-20%
-10%
0%
10%
20%
30%
40%
50%
Fe
b-9
8
Ma
y-9
8
Au
g-9
8
No
v-9
8
Fe
b-9
9
Ma
y-9
9
Au
g-9
9
No
v-9
9
Fe
b-0
0
Ma
y-0
0
Au
g-0
0
No
v-0
0
Fe
b-0
1
-80%
-60%
-40%
-20%
0%
20%
40%
60%
Au
g-9
7
No
v-97
Feb
-98
May
-98
Au
g-9
8
No
v-98
Feb
-99
May
-99
Au
g-9
9
No
v-99
Feb
-00
May
-00
Au
g-0
0
No
v-00
Feb
-01
Petroleum SectorTop Half Outperforms by 16%
Mining SectorTop Half Outperforms by 23%
Steel SectorTop Half Outperforms by 38%
Alpha Generation
-100%
0%
100%
200%
300%
400%
500%
600%
700%
Jan
-98
Apr
-98
Jul-
98
Oct
-98
Jan
-99
Apr
-99
Jul-
99
Oct
-99
Jan
-00
Apr
-00
Jul-
00
Oct
-00
Jan
-01
Semiconductor Sector
Top Half Outperforms by 27%
I N N O V E S T Strategic Value
Advisors

Electric Utilities
-20%
0%
20%
40%
60%
80%
100%Fe
b199
9
Apr
1999
Jun1
999
Aug
1999
Oct
1999
Dec
1999
Feb2
000
Apr
2000
Jun2
000
Aug
2000
Oct
2000
Dec
2000
Feb2
001
Apr
2001
Jun2
001
Aug
2001
Oct
2001
Dec
2001
Feb2
002
Difference Top Half Average Bottom Half Average
I N N O V E S T Strategic Value
Advisors
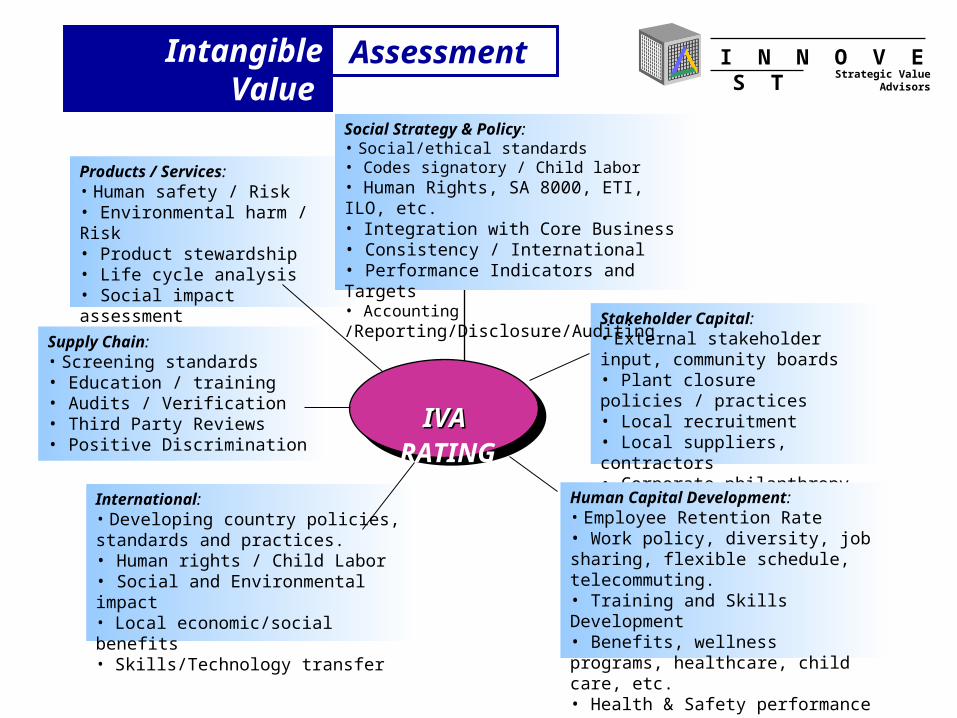
Stakeholder Capital:• External stakeholder input, community boards• Plant closure policies / practices• Local recruitment• Local suppliers, contractors• Corporate philanthropy
Human Capital Development:• Employee Retention Rate• Work policy, diversity, job sharing, flexible schedule, telecommuting.• Training and Skills Development• Benefits, wellness programs, healthcare, child care, etc.• Health & Safety performance
Products / Services:• Human safety / Risk• Environmental harm / Risk• Product stewardship• Life cycle analysis• Social impact assessment• Respect of local culture
Supply Chain:• Screening standards• Education / training• Audits / Verification• Third Party Reviews• Positive Discrimination
International:• Developing country policies, standards and practices.• Human rights / Child Labor• Social and Environmental impact• Local economic/social benefits• Skills/Technology transfer
IVAIVA
RATING
Social Strategy & Policy:• Social/ethical standards• Codes signatory / Child labor• Human Rights, SA 8000, ETI, ILO, etc.• Integration with Core Business• Consistency / International• Performance Indicators and Targets• Accounting /Reporting/Disclosure/Auditing
Intangible Value Assessment I N N O V E S T Strategic Value
Advisors

Carbon Policy and Strategy:- Climate Change Policy
- Mitigation and Innovation Measures
- Emission Trading Competence
- Voluntary Charters and Working Groups
Carbon Risks:- Direct Carbon Risks
(from in house operations)
- Indirect Carbon Risks (from suppliers)
- Carbon Liability (embedded in products)
- Financial Exposure (calculated)
CarbonValueCarbonValue'21
RATING
Strategic Carbon Opportunities:
- Project Involvement (JI, CDM, etc.)
- Geographic Involvement
- Phase-Out Risk of Products and Services
due to Climate Change
- Carbon Improvement Potential
- Involvement in Carbonless Businesses
or Products
CarbonValue’CarbonValue’2121 algorithms integrate over 25 key data points, including:
CarbonValue’21 Overlay I N N O V E S T Strategic Value
Advisors

Company Risk Exposure
Results of recent benchmarking exercise in the US energy sector…...
0.00%
10.00%
20.00%
30.00%
40.00%
50.00%
60.00%
70.00%
DY
N
AE
P NI
RE
I
SO
WM
B
TXU
CM
S
EIX
EP
G
ETR D
FP
L
PC
G
AE
S
DU
K
EXC
PE
G
EN
E
Expected Carbon Exposure as a % of Market Cap.
Light
High
Kyoto
I N N O V E S T Strategic Value
Advisors

Energy Efficiency Research Objectives
• Determine whether or not superior energy management adds value for investors
• If value is added, raise financial community awareness
• Encourage investors to consider corporate energy efficiency performance
I N N O V E S T Strategic Value
Advisors

Barriers
• Poor Data Quality and Availability
• Limited Reliability of Existing Research
• Low Financial Relevance of Energy Costs in Many Sectors
I N N O V E S T Strategic Value
Advisors

Overcoming Barriers
• Multi-factor Analysis
• Independent Energy Efficiency Rankings
• High Credibility
I N N O V E S T Strategic Value
Advisors

Research Methodology
• Develop Models
• Analyze and Rate Companies
• Analyze Correlations to Financial Performance
I N N O V E S T Strategic Value
Advisors
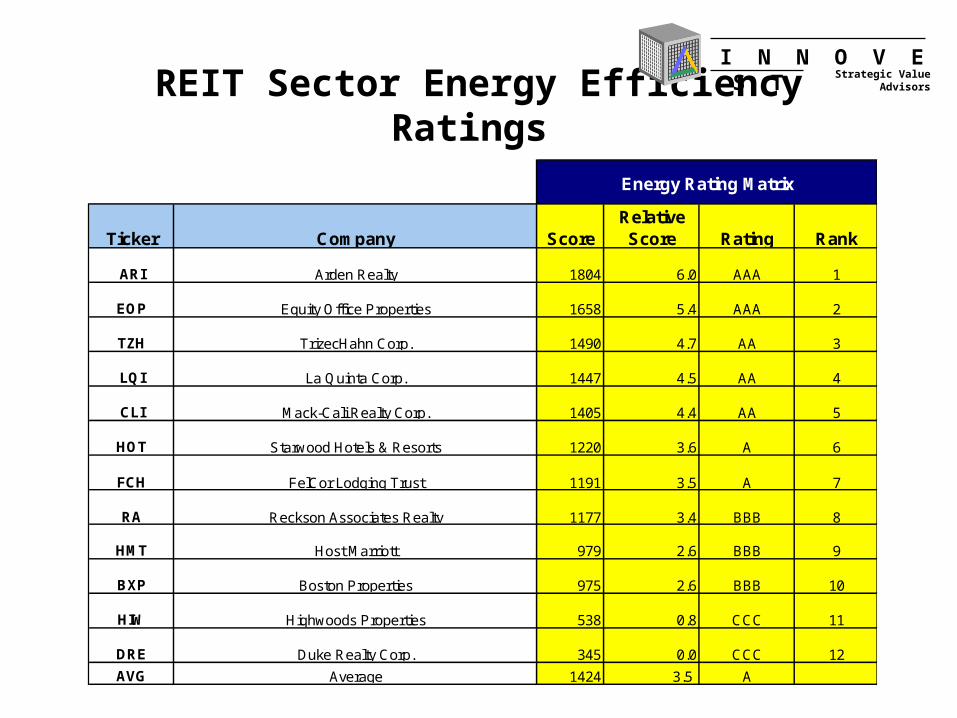
REIT Sector Energy Efficiency Ratings
Ticker Company ScoreRelativeScore Rating Rank
ARI Arden Realty 1804 6.0 AAA 1
EOP Equity Office Properties 1658 5.4 AAA 2
TZH TrizecHahn Corp. 1490 4.7 AA 3
LQI La Quinta Corp. 1447 4.5 AA 4
CLI Mack-Cali Realty Corp. 1405 4.4 AA 5
HOT Starwood Hotels & Resorts 1220 3.6 A 6
FCH FelCor Lodging Trust 1191 3.5 A 7
RA Reckson Associates Realty 1177 3.4 BBB 8
HMT Host Marriott 979 2.6 BBB 9
BXP Boston Properties 975 2.6 BBB 10
HIW Highwoods Properties 538 0.8 CCC 11
DRE Duke Realty Corp. 345 0.0 CCC 12
AVG Average 1424 3.5 A
Energy Rating Matrix
I N N O V E S T Strategic Value
Advisors

Stock Market Performance of
Top Half vs. Bottom Half REITs
I N N O V E S T Strategic Value
Advisors
-30%
-20%
-10%
0%
10%
20%
30%
40%
50%
Jun-
00
Jul-0
0
Aug
-00
Sep
-00
Oct
-00
Nov
-00
Dec
-00
Jan-
01
Feb-
01
Mar
-01
Apr
-01
May
-01
Jun-
01
Jul-0
1
Aug
-01
Sep
-01
Oct
-01
Nov
-01
Dec
-01
Jan-
02
Feb-
02
Mar
-02
Apr
-02
May
-02
Jun-
02
Difference 0.0% -0.3% 5.1% 7.8% 6.1% 2.9% 11.2% 11.0% 14.2% 17.1% 23.4% 25.2% 24.9% 26.5% 30.5% 32.6% 30.9% 32.6% 39.5% 33.8% 34.3% 35.6% 37.2% 36.5% 34.8%
Top Half Average 0.0% -4.7% 3.9% 0.4% 1.4% 6.0% 14.2% 10.0% 10.0% 15.8% 22.3% 26.7% 22.8% 25.3% 15.0% 14.2% 20.8% 24.8% 33.7% 31.2% 39.2% 40.5% 40.4% 39.1% 30.3%
Bottom Half Average 0.0% -4.3% -1.1% -7.4% -4.6% 3.1% 3.0% -1.0% -4.3% -1.4% -1.2% 1.5% -2.1% -1.2% -15.5% -18.4% -10.1% -7.8% -5.9% -2.6% 4.9% 4.9% 3.2% 2.6% -4.6%
Jun-00 Jul-00 Aug-00 Sep-00 Oct-00 Nov-00 Dec-00 Jan-01 Feb-01 Mar-01 Apr-01May-
01Jun-01 Jul-01 Aug-01 Sep-01 Oct-01 Nov-01 Dec-01 Jan-02 Feb-02 Mar-02 Apr-02
May-
02Jun-02
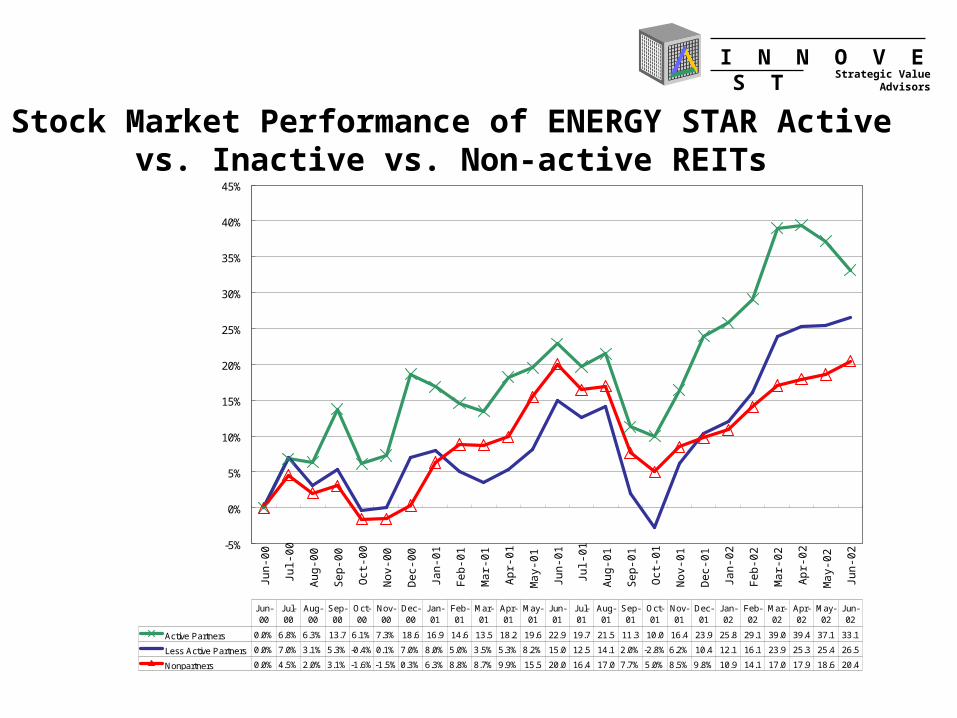
Stock Market Performance of ENERGY STAR Activevs. Inactive vs. Non-active REITs
I N N O V E S T Strategic Value
Advisors
-5%
0%
5%
10%
15%
20%
25%
30%
35%
40%
45%
Jun-
00
Jul-0
0
Aug
-00
Sep
-00
Oct
-00
Nov
-00
Dec
-00
Jan-
01
Feb
-01
Mar
-01
Apr
-01
May
-01
Jun-
01
Jul-0
1
Aug
-01
Sep
-01
Oct
-01
Nov
-01
Dec
-01
Jan-
02
Feb
-02
Mar
-02
Apr
-02
May
-02
Jun-
02
Active Partners 0.0% 6.8% 6.3% 13.7 6.1% 7.3% 18.6 16.9 14.6 13.5 18.2 19.6 22.9 19.7 21.5 11.3 10.0 16.4 23.9 25.8 29.1 39.0 39.4 37.1 33.1
Less Active Partners 0.0% 7.0% 3.1% 5.3% -0.4% 0.1% 7.0% 8.0% 5.0% 3.5% 5.3% 8.2% 15.0 12.5 14.1 2.0% -2.8% 6.2% 10.4 12.1 16.1 23.9 25.3 25.4 26.5
Nonpartners 0.0% 4.5% 2.0% 3.1% -1.6% -1.5% 0.3% 6.3% 8.8% 8.7% 9.9% 15.5 20.0 16.4 17.0 7.7% 5.0% 8.5% 9.8% 10.9 14.1 17.0 17.9 18.6 20.4
Jun-00
Jul-00
Aug-00
Sep-00
Oct-00
Nov-00
Dec-00
Jan-01
Feb-01
Mar-01
Apr-01
May-01
Jun-01
Jul-01
Aug-01
Sep-01
Oct-01
Nov-01
Dec-01
Jan-02
Feb-02
Mar-02
Apr-02
May-02
Jun-02

Tobin’s Q Performance of ENERGY STAR Activevs. Inactive vs. Non-active REITs
I N N O V E S T Strategic Value
Advisors
0.99
1.17
0.91
0.00 0.20 0.40 0.60 0.80 1.00 1.20 1.40
ACTIVE PARTNERS
AVERAGE
LESS ACTIVE PARTNERS
AVERAGE
NON-PARTNERS AVERAGE

Business Case - REITs
• Reduced Operating Costs
• Enhanced Property Values
• Increased Productivity and Potential Labor Cost Savings
• Enhanced Tenant/Guest Satisfaction
• Improved Image as a Responsible Corporate Citizen
• Enhanced Image as a Well-Managed Company
• Greater Appeal to Socially-Responsible Investors
I N N O V E S T Strategic Value
Advisors

Symbol Company Name Ranking Rating
Top Half GroupSBRY.L J. SAINSBURY PLC 1 AAAAHLN KONINKLIJKE AHOLD NV- ADR 2 AAAABS ALBERTSON'S, INCORPORATED 3 AAA
DELB ETABLIS. DELHAIZE FRERES & CIE LE LION 4 AAAOATS WILD OATS MARKETS, INC 5 AWFMI WHOLE FOODS MARKET, INC. 6 BBB
Bottom Half GroupSWY SAFEWAY INC. 7 BBBGAP GREAT ATLANTIC & PACIFIC TEA CO., INC. 8 BBBWIN WINN-DIXIE STORES, INC. 9 BBSVU SUPERVALU INC. 10 BB
NAFC NASH FINCH 11 CCCKR KROGER CO. (THE) 12 CCC
Retail Food Sector Energy Efficiency Ratings
I N N O V E S T Strategic Value
Advisors

-50.00%
-40.00%
-30.00%
-20.00%
-10.00%
0.00%
10.00%
20.00%
30.00%
40.00%
Dec
1998
Mar
1999
May
1999
Jul1
999
Sep
1999
Nov
1999
Jan2
000
Mar
2000
May
2000
Jul2
000
Sep
2000
Nov
2000
Jan2
001
Mar
2001
May
2001
Jul2
001
Sep
2001
Nov
2001
Top Half
Bottom Half
Difference
Stock Market Performance of
Top Half vs. Bottom Half Food Companies
I N N O V E S T Strategic Value
Advisors

Price Earnings Ratio
16.18
26.46
0.00 5.00 10.00 15.00 20.00 25.00 30.00
Price - Book Ratio
1.44
4.39
0.00 0.50 1.00 1.50 2.00 2.50 3.00 3.50 4.00 4.50 5.00
Return On Equity Per Share
3.28
16.90
0.00 2.00 4.00 6.00 8.00 10.00 12.00 14.00 16.00 18.00
Return On Assets
5.92
7.07
0.00 1.00 2.00 3.00 4.00 5.00 6.00 7.00 8.00
Return On Invested Capital
9.76
10.45
0.00 2.00 4.00 6.00 8.00 10.00 12.00
Tobin's Q
1.55
1.68
0.00 0.20 0.40 0.60 0.80 1.00 1.20 1.40 1.60 1.80
Top Half Group Bottom Half Group
Financial Performance of
Top Half vs. Bottom Half Food Companies
I N N O V E S T Strategic Value
Advisors

-20%
-10%
0%
10%
20%
30%
40%
50%
Feb
-00
Mar
-00
Apr
-00
May
-00
Jun-
00
Jul-0
0
Aug
-00
Sep
-00
Oct
-00
Nov
-00
Dec
-00
Jan-
01
Feb
-01
Mar
-01
Apr
-01
May
-01
Jun-
01
Jul-0
1
Aug
-01
Sep
-01
Oct
-01
Nov
-01
Dec
-01
Jan-
02
Feb
-02
Difference 0.0% 0.3% 1.2% 5.4% 7.5% 2.1% 0.9% 0.7% 4.7% 10.4 13.8 9.0% 13.5 11.4 19.0 18.1 20.6 27.2 22.3 26.8 19.4 19.5 9.9% 20.2 18.9
Retail ENERGY STAR Partners 0.0% 7.2% 6.2% 8.2% 6.5% 0.0% -0.9% -1.8% 0.7% 1.3% 3.1% 14.5 21.9 21.0 26.7 28.9 33.0 38.0 30.4 21.8 14.0 19.8 14.3 37.0 32.9
DJ BroadLine Retail Index 0.0% 6.9% 5.0% 2.7% -1.0% -2.1% -1.8% -2.5% -4.1% -9.1% -10.7 5.5% 8.4% 9.6% 7.8% 10.8 12.5 10.8 8.1% -5.0% -5.4% 0.3% 4.4% 16.8 14.0
Feb-00
Mar-00
Apr-00
May-00
Jun-00
Jul-00
Aug-00
Sep-00
Oct-00
Nov-00
Dec-00
Jan-01
Feb-01
Mar-01
Apr-01
May-01
Jun-01
Jul-01
Aug-01
Sep-01
Oct-01
Nov-01
Dec-01
Jan-02
Feb-02
ENERGY STAR Companies vs. Broadline Index
I N N O V E S T Strategic Value
Advisors

Business Case - Retail Food
• Reduced Costs
• Increased Productivity and Sales
• Reduced Regulatory Exposure
• Reduced Vulnerability to Energy Price Fluctuations
• Improved Image as a Responsible Corporate Citizen
• Enhanced Image as a Well-Managed Company
• Greater Appeal to Socially-Responsible Investors
I N N O V E S T Strategic Value
Advisors