inspire 2015 - kpmg: using alteryx and qlik for data discovery and visualization
TRANSCRIPT
#inspire15
Using Alteryx and Qlik for Data Discovery and VisualizationThomas Haslam
Tuesday, May 19th
Director of Innovation
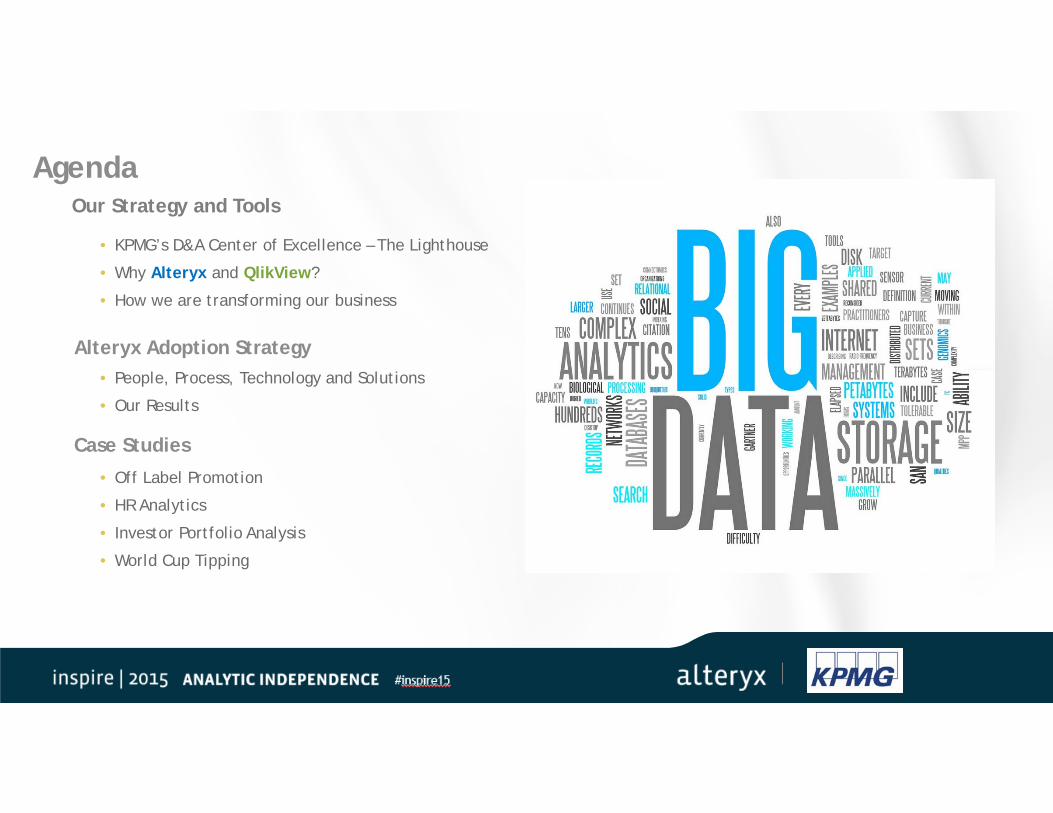
Our Strategy and Tools
• KPMG’s D&A Center of Excellence – The Lighthouse
• Why Alteryx and QlikView?
• How we are transforming our business
Agenda
Alteryx Adoption Strategy• People, Process, Technology and Solutions
• Our Results
Case Studies
• Off Label Promotion
• HR Analytics
• Investor Portfolio Analysis
• World Cup Tipping
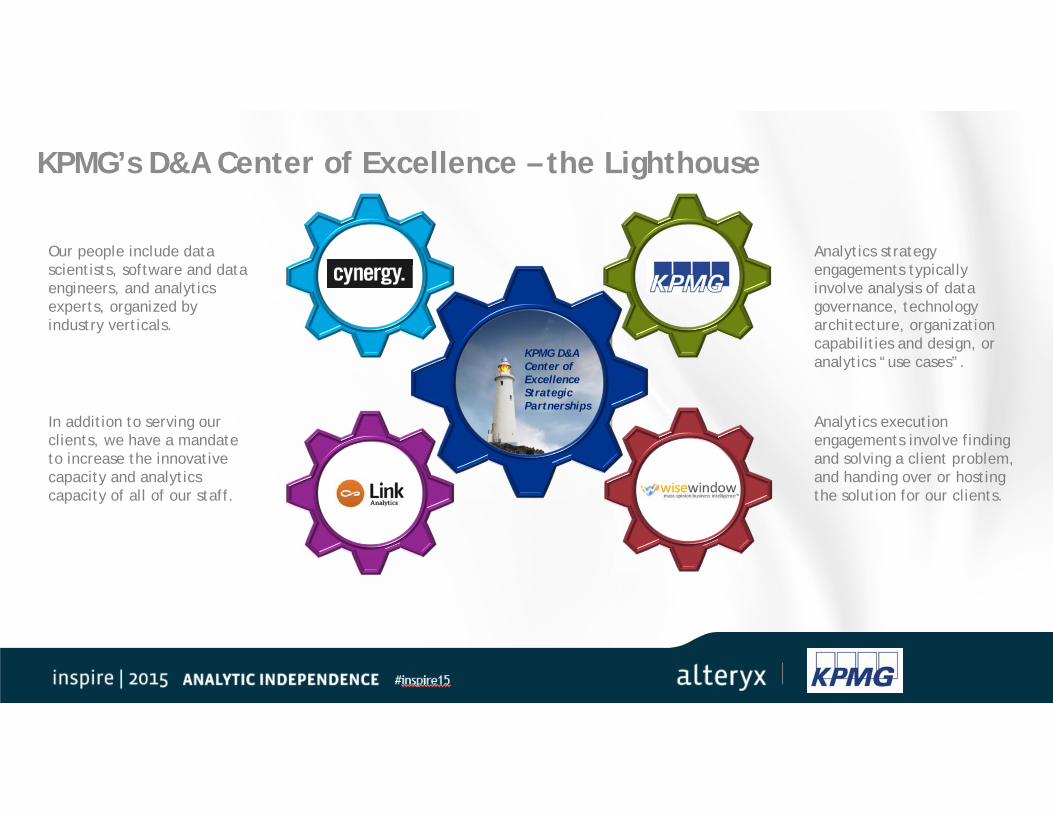
KPMG’s D&A Center of Excellence – the Lighthouse
KPMG D&A Center of Excellence Strategic Partnerships
Our people include data scientists, software and data engineers, and analytics experts, organized by industry verticals.
In addition to serving our clients, we have a mandate to increase the innovative capacity and analytics capacity of all of our staff.
Analytics strategy engagements typically involve analysis of data governance, technology architecture, organization capabilities and design, or analytics “use cases”.
Analytics execution engagements involve finding and solving a client problem, and handing over or hosting the solution for our clients.
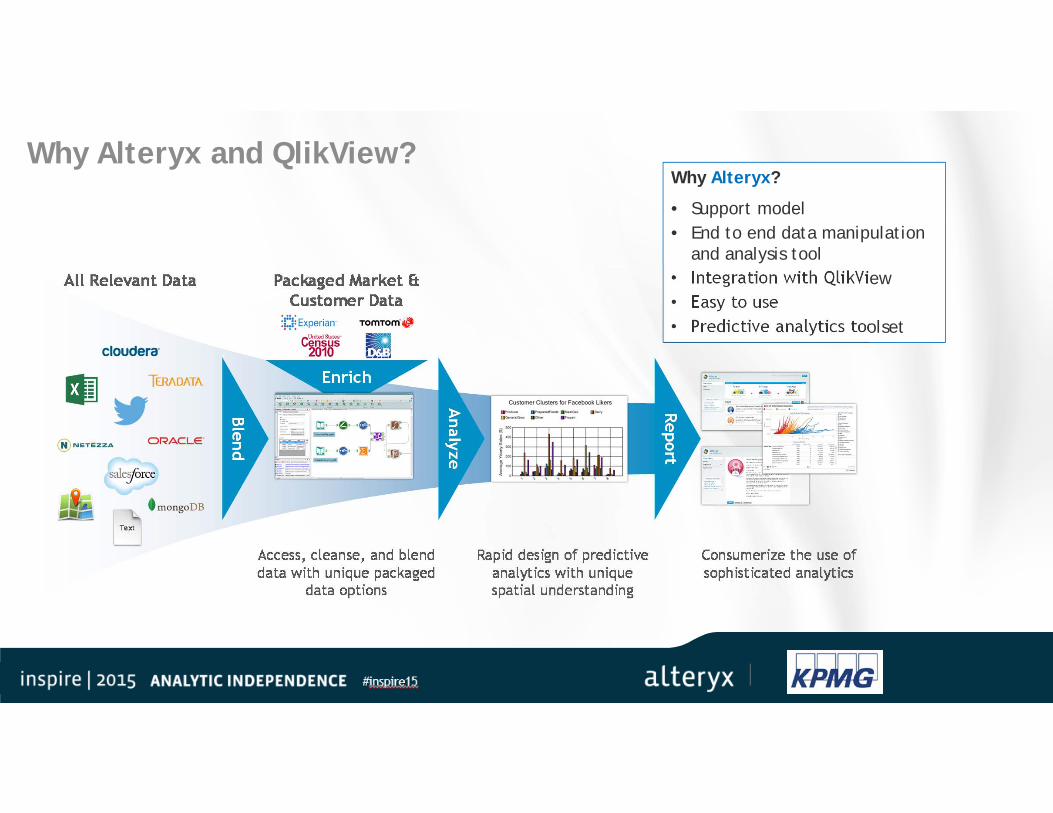
Why Alteryx and QlikView?Why Alteryx?
• Support model• End to end data manipulation
and analysis tool• Integration with QlikView• Easy to use• Predictive analytics toolset
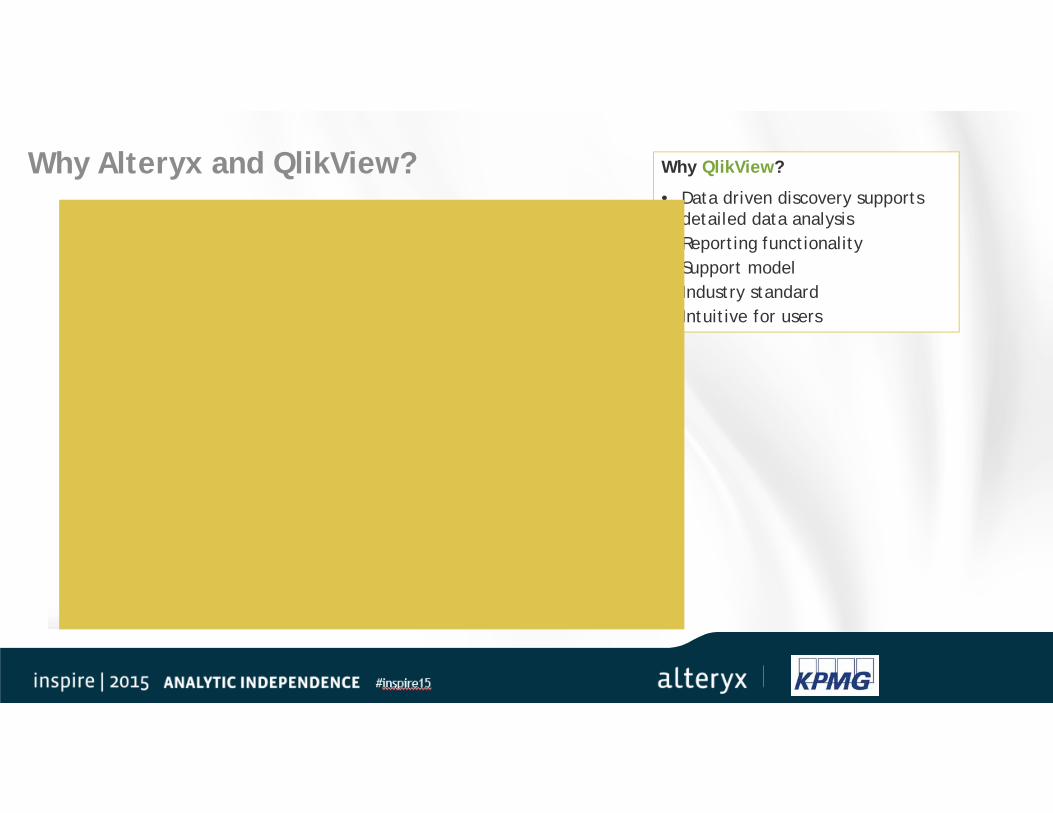
Why Alteryx and QlikView? Why QlikView?
• Data driven discovery supports detailed data analysis
• Reporting functionality• Support model• Industry standard• Intuitive for users
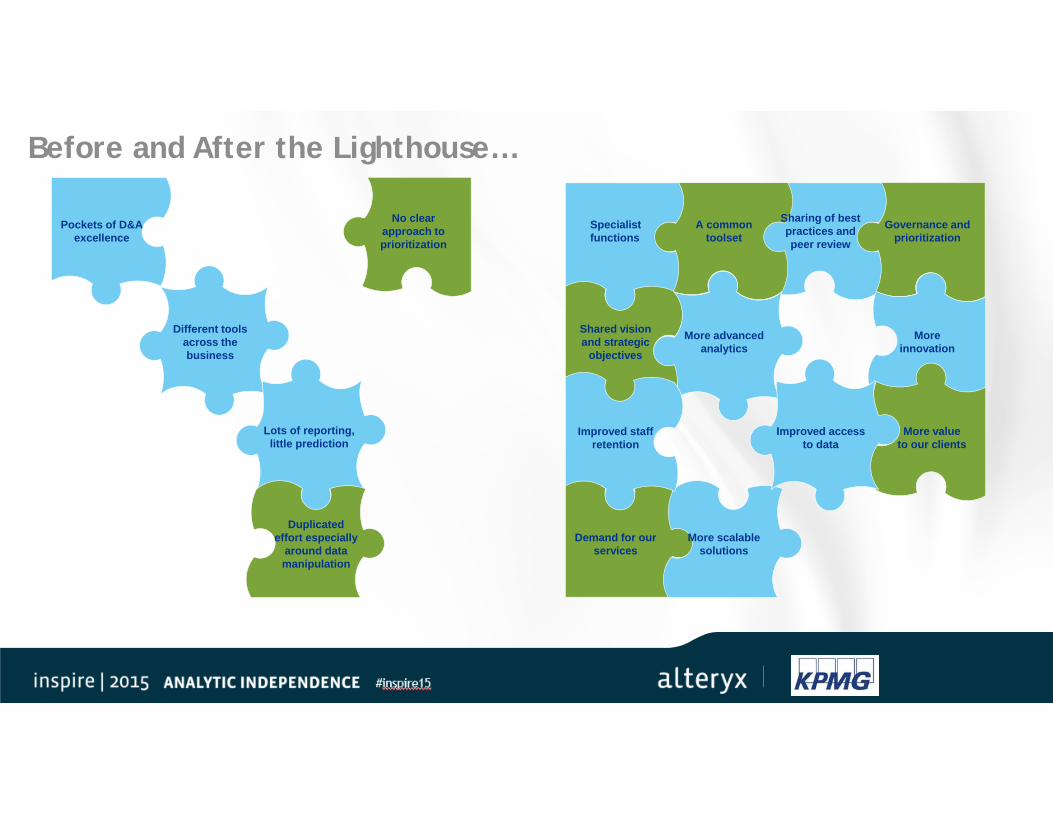
Before and After the Lighthouse…
Pockets of D&A excellence
Different tools across the business
No clear approach to prioritization
title
Duplicated effort especially
around data manipulation
Lots of reporting, little prediction
Demand for our services
Shared vision and strategic
objectives
Specialist functions
More advanced analytics
A common toolset
Governance and prioritization
More scalable solutions
More innovation
Sharing of best practices and peer review
Improved staff retention titleImproved access
to dataMore value
to our clients
#inspire15
Alteryx Adoption Strategy

You need a plan…
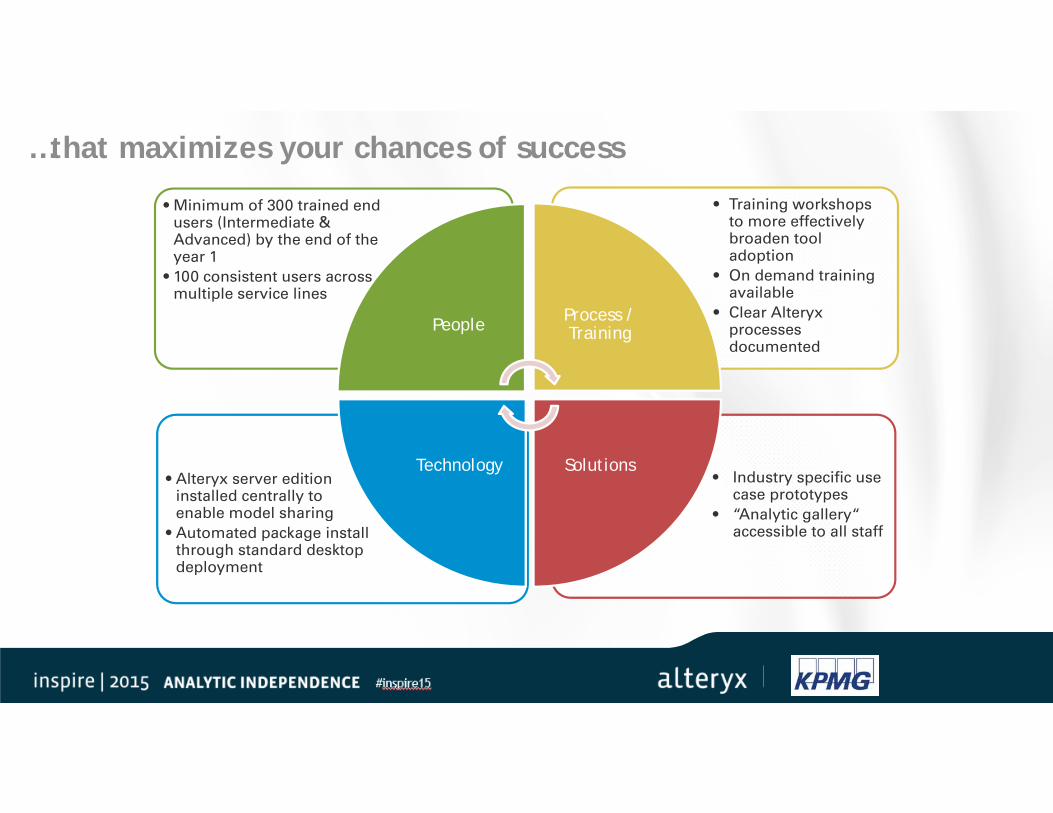
…that maximizes your chances of success
• Industry specific use case prototypes
• “Analytic gallery“ accessible to all staff
• Alteryx server edition installed centrally to enable model sharing
• Automated package install through standard desktop deployment
• Training workshops to more effectively broaden tool adoption
• On demand training available
• Clear Alteryx processes documented
• Minimum of 300 trained end users (Intermediate & Advanced) by the end of the year 1
• 100 consistent users across multiple service lines
People Process / Training
SolutionsTechnology
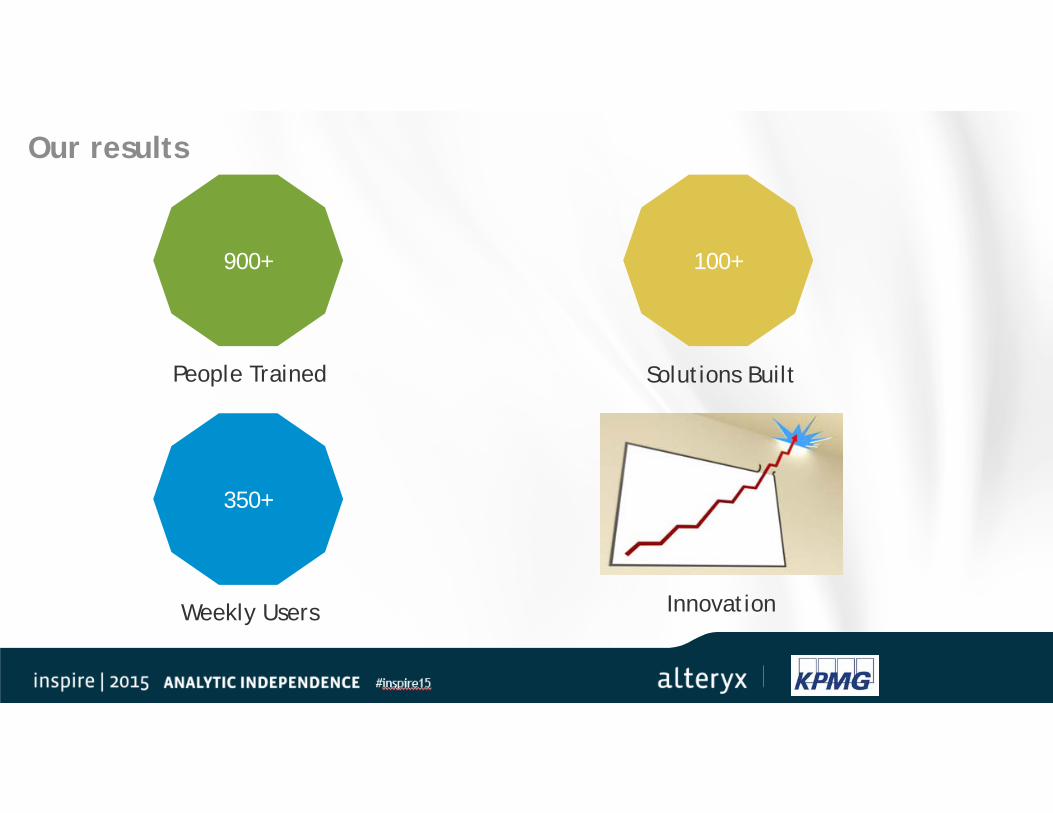
Our results
900+
People Trained
100+
Solutions Built
350+
Weekly Users Innovation
#inspire15
Case Study 1: Off Label Promotion
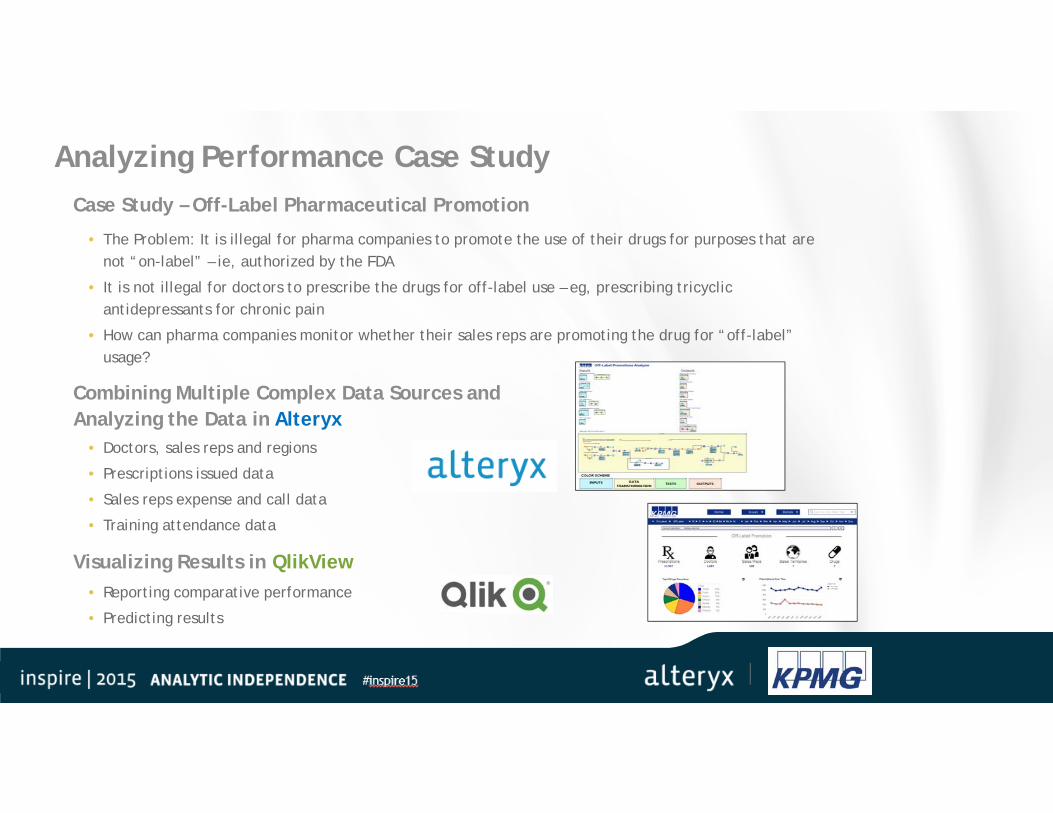
Analyzing Performance Case StudyCase Study – Off-Label Pharmaceutical Promotion
• The Problem: It is illegal for pharma companies to promote the use of their drugs for purposes that are not “on-label” – ie, authorized by the FDA
• It is not illegal for doctors to prescribe the drugs for off-label use – eg, prescribing tricyclic antidepressants for chronic pain
• How can pharma companies monitor whether their sales reps are promoting the drug for “off-label” usage?
Combining Multiple Complex Data Sources and Analyzing the Data in Alteryx
• Doctors, sales reps and regions
• Prescriptions issued data
• Sales reps expense and call data
• Training attendance data
Visualizing Results in QlikView• Reporting comparative performance
• Predicting results
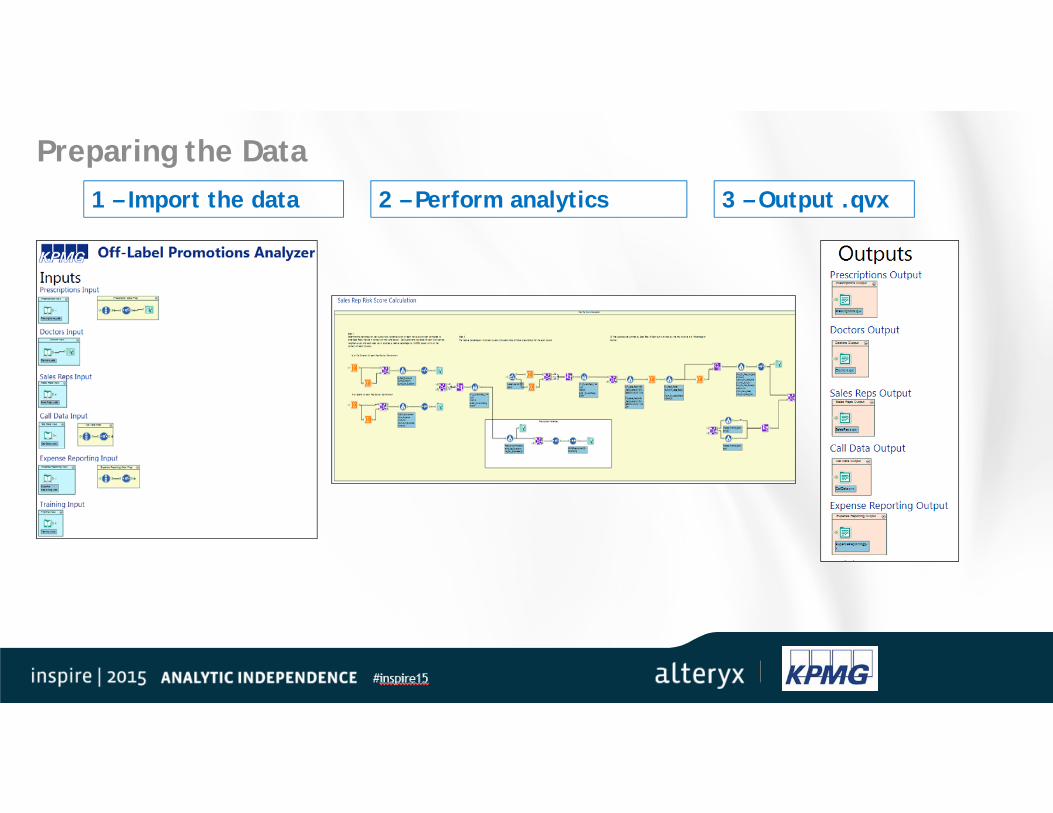
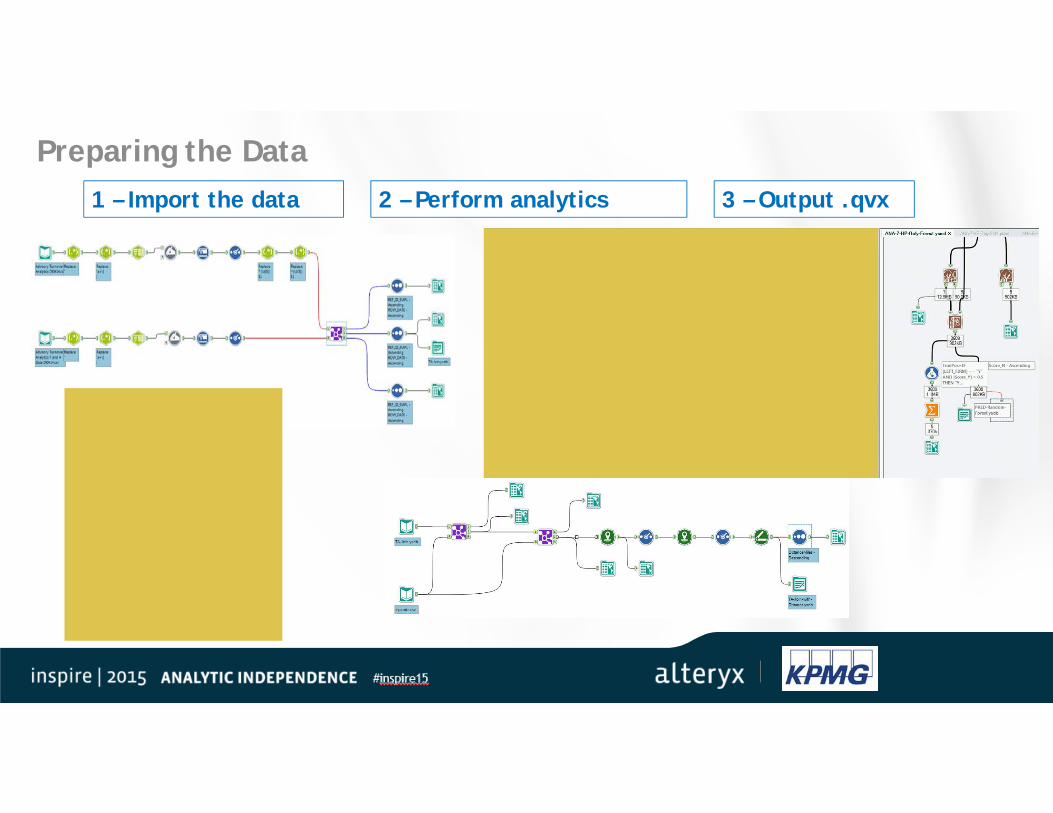
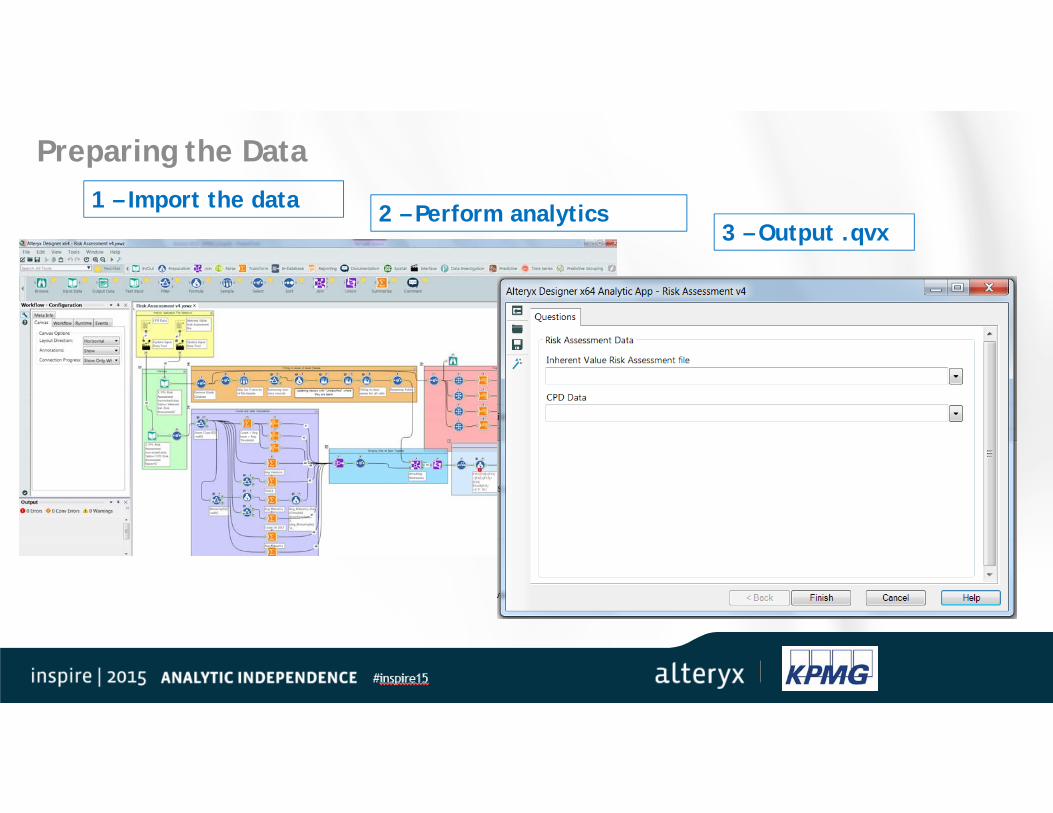
Preparing the Data1 – Import the data 2 – Perform analytics 3 – Output .qvx
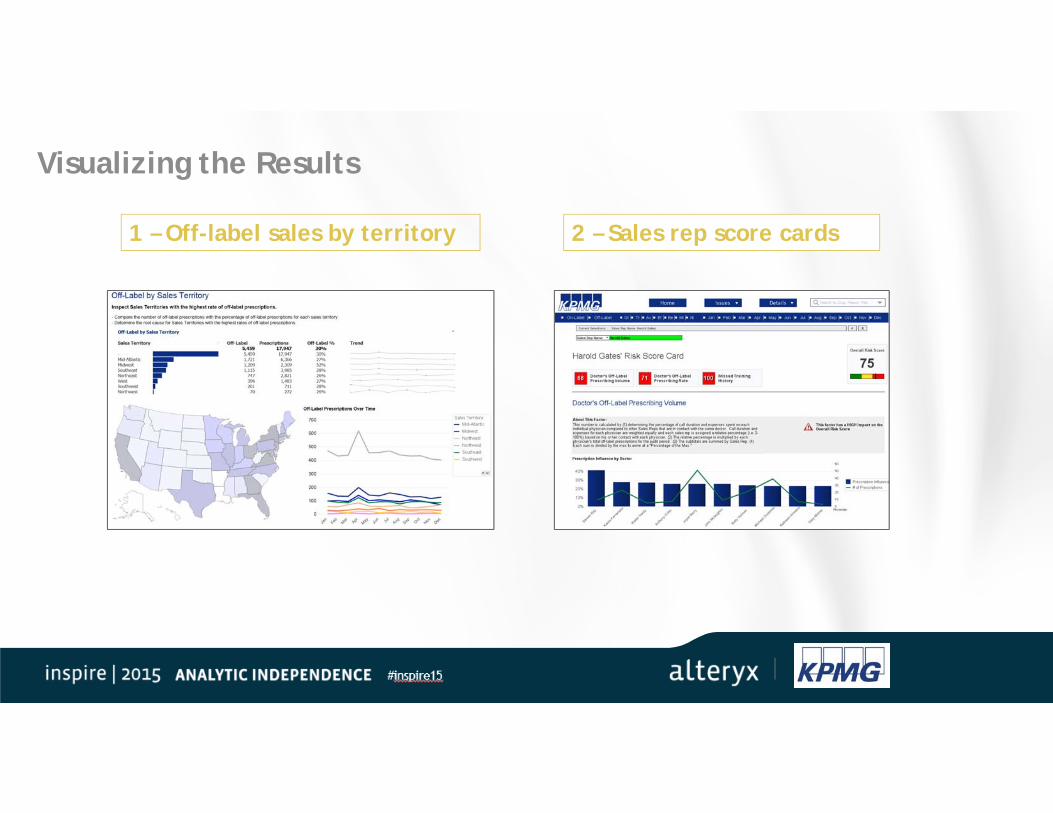
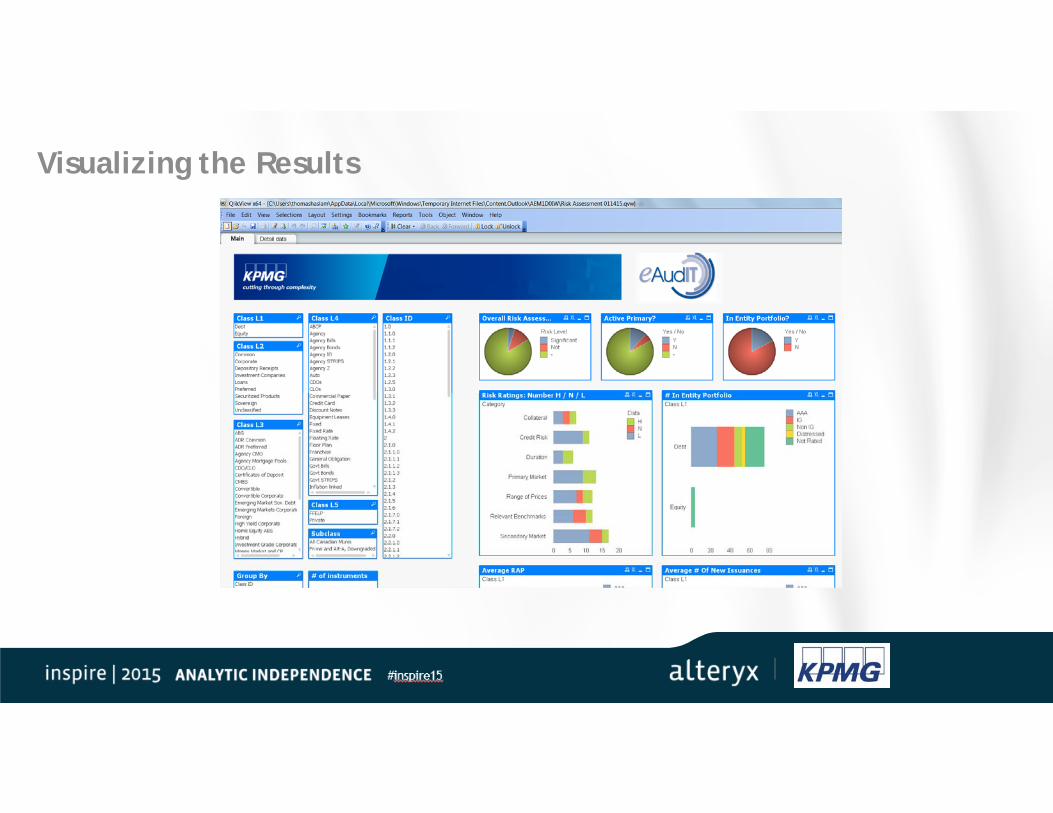
Visualizing the Results
1 – Off-label sales by territory 2 – Sales rep score cards
#inspire15
Case Study 2: HR Analytics
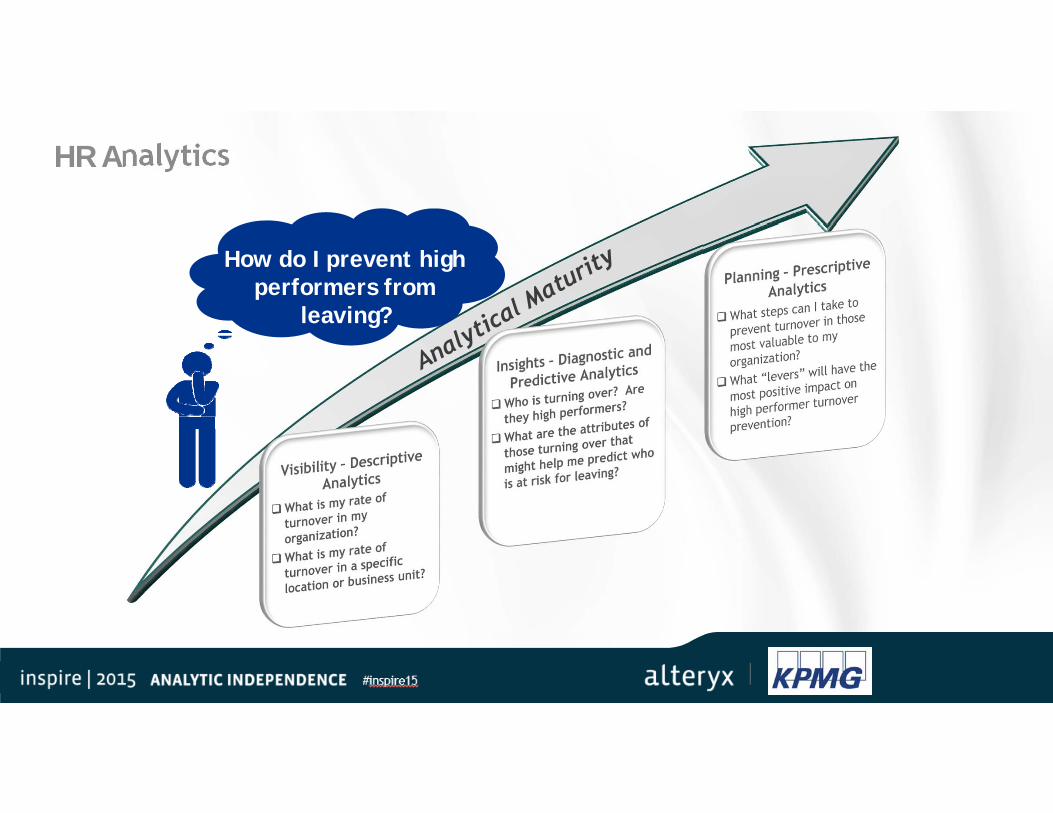
HR Analytics
How do I prevent high performers from
leaving?
Preparing the Data1 – Import the data 2 – Perform analytics 3 – Output .qvx
The Variables contributing to the overall turnover of high performers include the following attributes:• Salary• Office Commute• Years service• CAGR• Years in Business Unit• Fiscal Year• Job Level• Vesting in 401k• Ethnicity• Hire Type• Improvement in Review Score• Gender• Increased Bonus• Last Raise Higher > CAGR• Diversity• Remote from Home Office
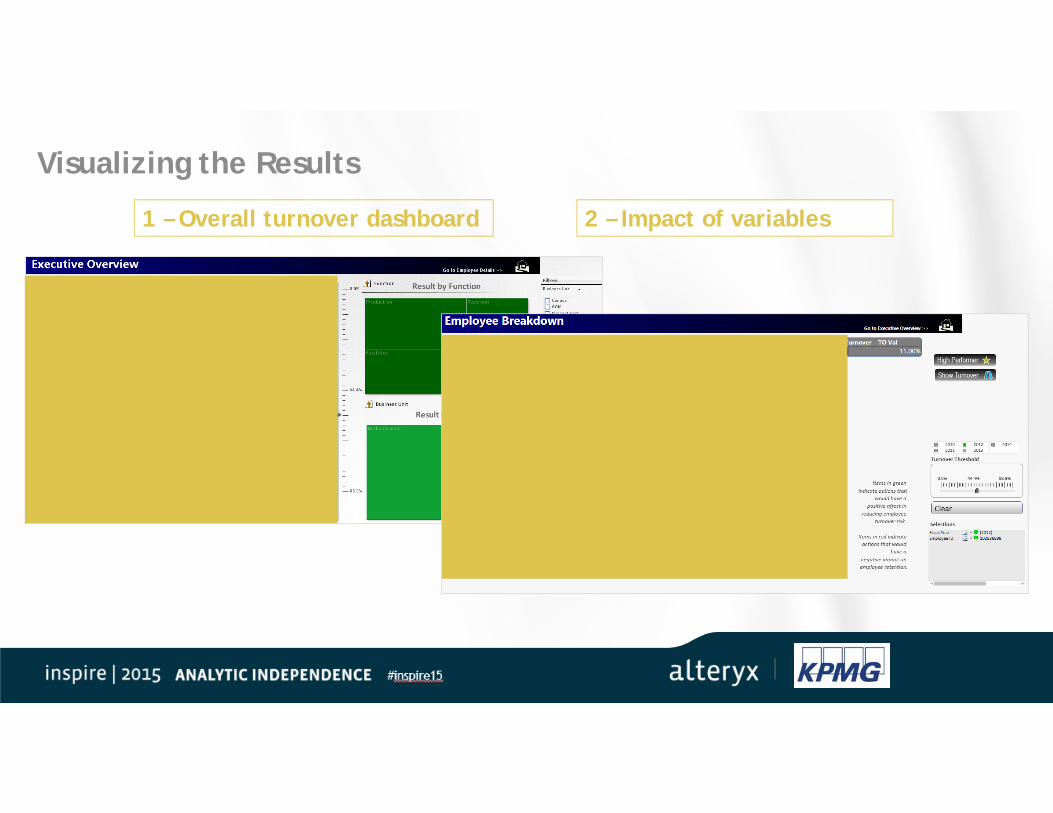
Visualizing the Results
1 – Overall turnover dashboard 2 – Impact of variables
#inspire15
Case Study 3: Investor Portfolio Analysis
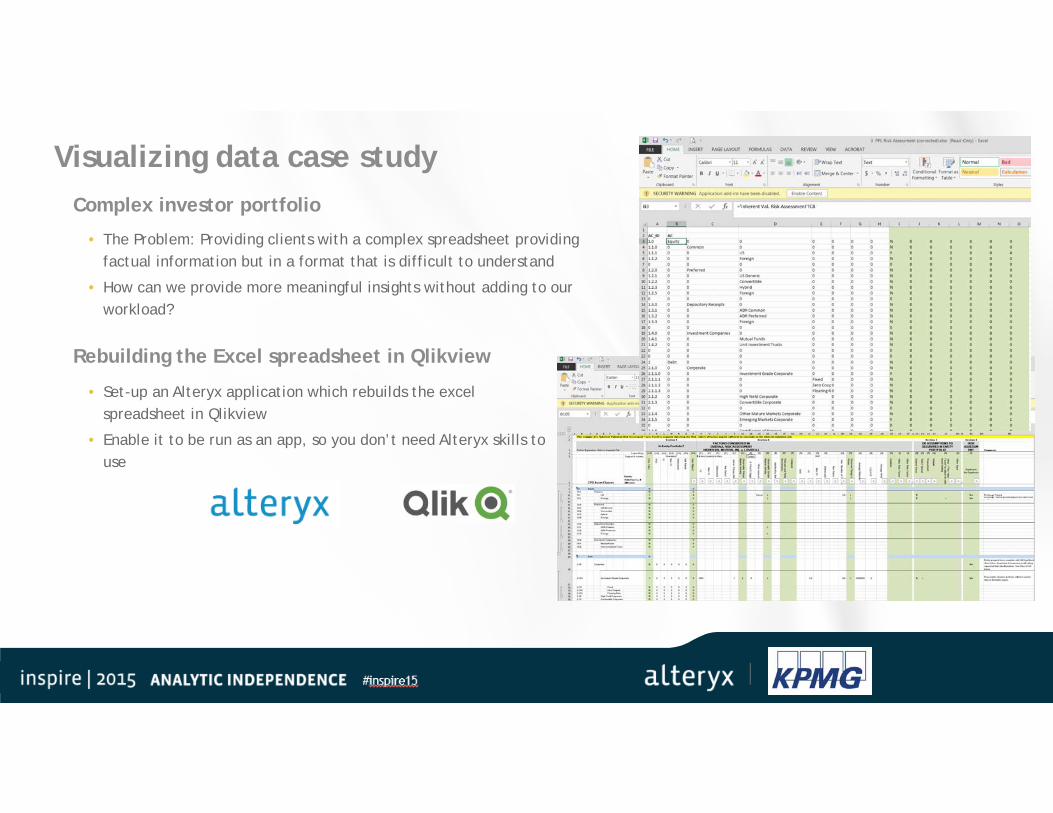
Visualizing data case studyComplex investor portfolio
• The Problem: Providing clients with a complex spreadsheet providing factual information but in a format that is difficult to understand
• How can we provide more meaningful insights without adding to our workload?
Rebuilding the Excel spreadsheet in Qlikview
• Set-up an Alteryx application which rebuilds the excel spreadsheet in Qlikview
• Enable it to be run as an app, so you don’t need Alteryx skills to use
Preparing the Data1 – Import the data 2 – Perform analytics
3 – Output .qvx
Visualizing the Results
#inspire15
Case Study 4: World Cup Tipping
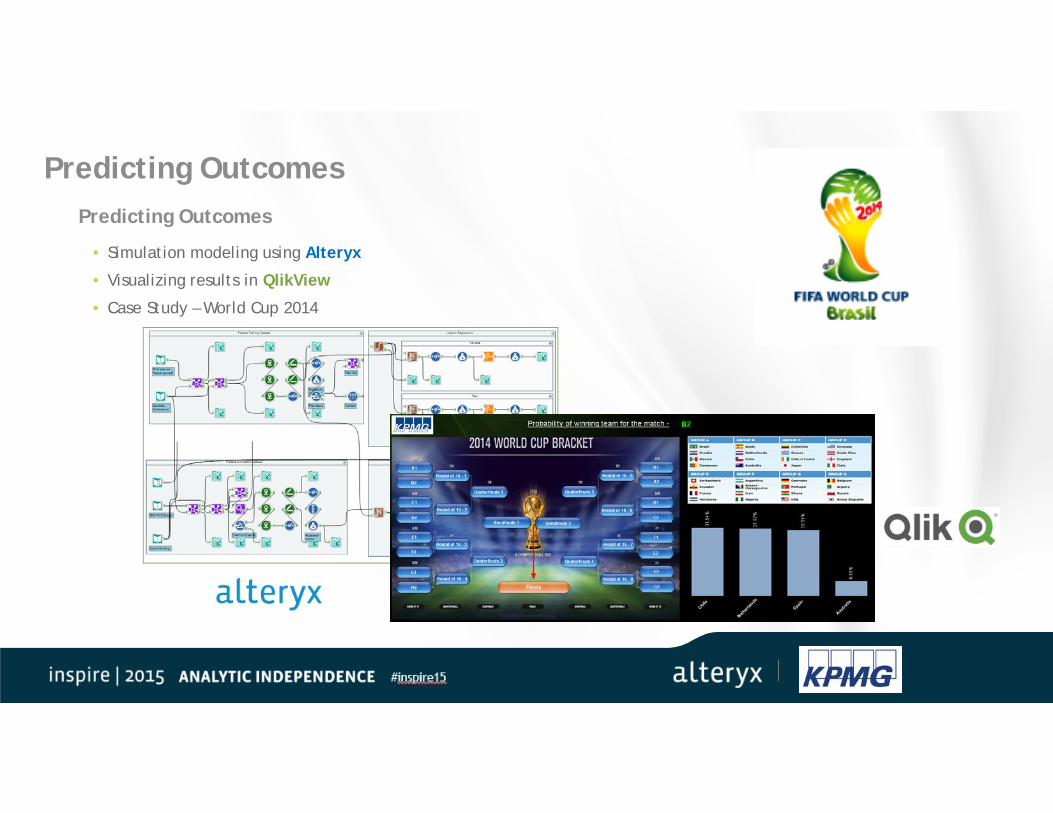
Predicting OutcomesPredicting Outcomes
• Simulation modeling using Alteryx
• Visualizing results in QlikView
• Case Study – World Cup 2014
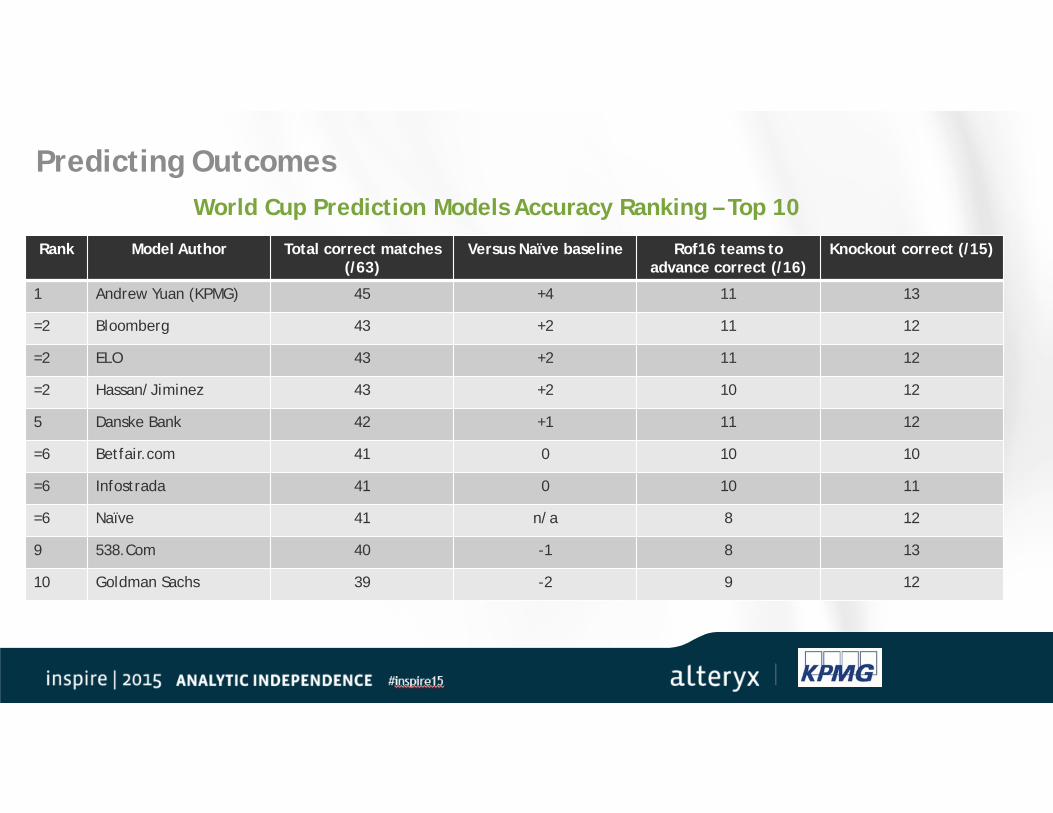
Predicting OutcomesWorld Cup Prediction Models Accuracy Ranking – Top 10
Rank Model Author Total correct matches (/63)
Versus Naïve baseline Rof16 teams to advance correct (/16)
Knockout correct (/15)
1 Andrew Yuan (KPMG) 45 +4 11 13
=2 Bloomberg 43 +2 11 12
=2 ELO 43 +2 11 12
=2 Hassan/Jiminez 43 +2 10 12
5 Danske Bank 42 +1 11 12
=6 Betfair.com 41 0 10 10
=6 Infostrada 41 0 10 11
=6 Naïve 41 n/a 8 12
9 538.Com 40 -1 8 13
10 Goldman Sachs 39 -2 9 12