institu tion al e quities ioc - business standard
TRANSCRIPT

3 February 2021
In s t itu tio n a l E q u it ie s
IOC
3QF
Y21
Res
ult U
pdat
e
Reuters: IOC.NS; Bloomberg: IOCL IN
Marketing and petchem aid beat We maintain Buy on Indian Oil Corp (IOC) after raising FY22E/FY23E estimates and TP a tad, while raising FY21E by 19.7% based on YTD results. Our Buy call is based on: (i) stable outlook for retail margins under sub US$40-50/bbl (ii) healthy petchem margin and volume growth despite near term risk of volatility (iii) refining could revive from trough margins over the next 1-2 years based on likely closure of capacities and (iii) compelling valuations post the 9% fall in the stock price in the last one year. IOC’s 3QFY21 adjusted standalone PAT at Rs49.2bn was a massive 65% beat vs. NBIE/street estimate of Rs29.8bn/Rs47.01bn. This was mainly due to the positive surprise in Marketing/Petchem segments’ EBIDTA at ~Rs71.3bn/Rs19.5bn vs. NB estimates of Rs39.14bn/Rs12.1bn. GRM reported, including refining inventory gain of Rs9.2bn, came in at US$2.19/bbl vs. our estimate of US$3.0/bbl. Normal GRM stood at US$1.24/bbl vs. our estimate of US$1.0/bbl. Revenue was down 14.7% YoY but beat our estimate by 29%, likely due to higher-than-expected realisations in Petchem/Marketing and the beat on volume. PAT rose by 110% YoY.
Attractive fundamentals and valuations: We see prospects of 10% EPS CAGR that will support RoE expansion over FY21-22E. The reduction of debt and lower interest expense is expected to improve the balance sheet. The stock is trading at 0.71x its book value vs. FY23E RoE of 14.9%. The Rs7.5/share interim dividend offers 7.5% yield - an added tailwind.
3QFY21 standalone EBITDA (excluding other income) was up 40.57% YoY at Rs96.22bn. This was driven by 82%/10%/163% YoY surge in reported EBITDA (including other income) in marketing/pipeline/petchem segments. Refining segment reported a loss of Rs3.26bn while marketing/pipeline/petchem segments saw profit of Rs71.3bn/Rs16.99bn/Rs19.54bn. Refining/pipeline volume grew by 2.1%/4.3% YoY while marketing volume dipped 1.5%. Petchem revenue was up 32.8% YoY with 25%/7.8% growth in volume/price YoY. IOC’s EBITDA margin improved by 356bps to 9.05%, driven by 91%/117% YoY surge in unit margins in marketing/petchem – the latter supported by improved spreads vs. the 10-year low in 3QFY20.
Gross standalone debt dropped from Rs1.16trn to Rs986bn QoQ due to lower working capital needs and reduced cooking fuel subsidy dues - down from Rs110bn to Rs91bn.
Capex aimed at supply chain gains and future growth: The management hopes to achieve Rs262.3bn capex for FY21 vs. 64% done by Dec’20. IOC aims to start the Rs56.54bn MEG plant of 0.357mn te by Oct’21
On stake sale in oil/product pipelines, the management said it was still early days. IOC is exploring options, including sale to InvIT and may do a test sale of a small stake.
BUY
Sector: Oil and Gas
CMP: Rs99
Target Price: Rs122
Upside: 23.5%
Ramesh Sankaranarayanan Research Analyst [email protected] +91-22-6273 8145
Key Data
Current Shares O/S (mn) 9,414.2
Mkt Cap (Rsbn/US$bn) 930.1/12.7
52 Wk H / L (Rs) 118/71
Daily Vol. (3M NSE Avg.) 25,952,490
Price Performance (%)
1-M 6-M 1-Y
IOC 8.0 14.6 (8.6)
Nifty Index 4.5 34.5 25.1
Source: Bloomberg
Y/E March (Rsmn) 3Q FY20 3Q FY21 Ch YoY 2Q FY21 Ch QoQ % 3Q FY21E Var. (%)
Net sales 12,46,299 10,63,365 -14.68 8,56,105 24.21 8,22,723 29.25
Cost of goods 10,68,915 8,53,706 -20.13 6,53,234 30.69 6,38,962 33.61
% of Sales 85.8 80.3 -548 76.3 398 77.7 262
Contribution 1,77,383 2,09,658 18.20 2,02,871 3.35 1,83,762 14.09
Gross Margin% 14.2 19.7 548 23.7 -398 22.3 -262
Employee benefits expenses 20,570 28,823 40.12 24,904 15.74 22,570 27.70
% of Sales 1.7 2.7 106 2.9 -20 2.7 -3
Other expenses 88,366 84,616 -4.24 83,696 1.10 86,196 -1.83
% of Sales 7.1 8.0 87 9.8 -182 10.5 -252
EBITDA 68,448 96,219 40.57 94,272 2.07 74,996 28.30
EBITDAM (%) 5.49 9.05 356 11.01 -196 9.12 -7
Depreciation 21,862 24,667 12.83 24,036 2.62 24,862 -0.78
Other income 5,573 8,997 61.45 8,654 3.97 5,197 73.12
Interest expenses 13,117 6,286 -52.08 2,211 184.29 13,750 -54.29
Profit/loss on foreign exchange -1,820 3,698 6,720 -
Adjusted PBT 37,222 77,962 109.45 83,398 -6.52 41,581 87.49
Reported Tax 13,832 28,796 108.19 21,125 36.31 11,780 144.44
Effective tax rate% 37.2 36.9 -22 25.3 1161 28.3 861
PAT adjusted 23,390 49,166 110.20 62,273 -21.05 29,801 64.98
NPM (%) 1.88 4.62 275 7.27 -265 3.62 100.14
Source: Company, Nirmal Bang Institutional Equities Research

In s t itu tio n a l E q u it ie s
2 IOC
Risks: Downside risks from (i) volatility in GRMs and currency (ii) lower-than-expected volume in all segments (iii) govt. policy diktats on higher dividend payout, buying out government stake in other PSUs (iv) increase in competition in MS and HSD retailing and from substitutes (v) requirement to fund CPCL for refinancing its debt and working capital if refining margins fall below our estimates. In the near term, there is the risk of inventory impact hurting the company as Brent crude price appears to have touched an interim peak.
Valuation
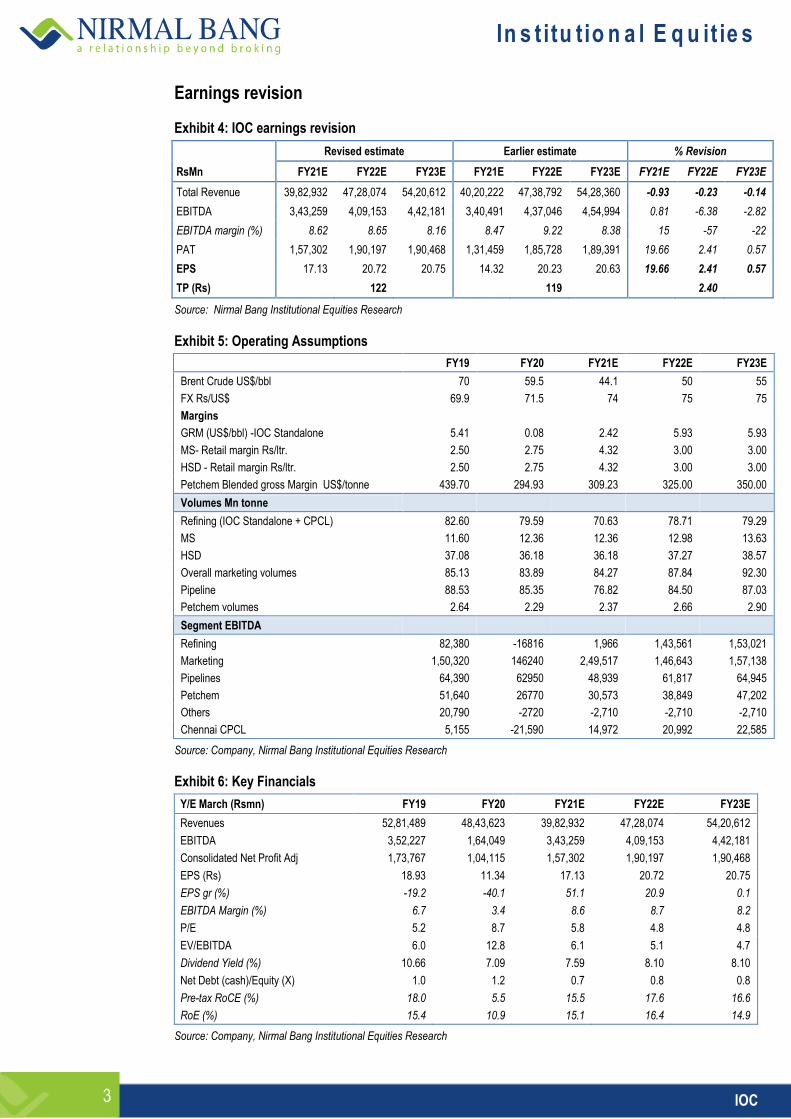
We have raised FY21E-23E earnings and our TP from Rs119 to Rs122 post the 3QFY21 results call based on our SOTP-based valuation - Refining & Marketing and Petchem segments on EV/E multiple of 3.5/5.0x and the Pipeline segment on DCF method as it offers steady annuity-like cash flows. This implies a PE of 5.9x on FY23E EPS, which compares with IOC’s 5-year median PE of 7.5x.
Exhibit 1: IOC SOTP valuation
Segment EBITDA FY23E EV/EBITDA
Multiple EV Net Debt FY22 Equity Value Target price
IOC Oil and Gas- Refining, Marketing 310158 3.5 1085555
CPCL 22585 2.6 59287
Pipeline (DCF value)# 64945 9.3 605219
Petchem 47202 5.0 236012
#Total 444891 4.5 1986072 9,79,383 10,06,689 110
Key equity holdings
12
IOC TP - SOTP method
122
Source: Nirmal Bang Institutional Equities Research, Note: # EV/E is implied for pipelines and total value
Exhibit 2: EV/ RETAIL OUTLET -IOC
EV/pump FY20 FY21 FY22 FY23
No of outlets ( ROs) 29085 29585 30585 31585
EV US$bn 27988.2 22170.3 25152.9 26490.6
Market Cap US$bn 12094 12094 12094 12094
EV/RO US$mn 1.0 0.7 0.8 0.8
EV/RO Rsmn 72.2 56.2 61.7 62.9
Source: Bloomberg, Nirmal Bang Institutional Equities Research
Exhibit 3: 5-year forward P/E
Source: Nirmal Bang Institutional Equities Research
0
2
4
6
8
10
12
14
16
Oct
-14
Jan-
15
Apr
-15
Jul-1
5
Oct
-15
Jan-
16
Apr
-16
Jul-1
6
Oct
-16
Jan-
17
Apr
-17
Jul-1
7
Oct
-17
Jan-
18
Apr
-18
Jul-1
8
Oct
-18
Jan-
19
Apr
-19
Jul-1
9
Oct
-19
Jan-
20
Apr
-20
Jul-2
0
Oct
-20
Jan-
21
Forward P/E median PE SD +1 SD -1
Median P/E = 7.5
In s t itu tio n a l E q u it ie s
3 IOC
Earnings revision
Exhibit 4: IOC earnings revision
Revised estimate Earlier estimate % Revision
RsMn FY21E FY22E FY23E FY21E FY22E FY23E FY21E FY22E FY23E
Total Revenue 39,82,932 47,28,074 54,20,612 40,20,222 47,38,792 54,28,360 -0.93 -0.23 -0.14
EBITDA 3,43,259 4,09,153 4,42,181 3,40,491 4,37,046 4,54,994 0.81 -6.38 -2.82
EBITDA margin (%) 8.62 8.65 8.16 8.47 9.22 8.38 15 -57 -22
PAT 1,57,302 1,90,197 1,90,468 1,31,459 1,85,728 1,89,391 19.66 2.41 0.57
EPS 17.13 20.72 20.75 14.32 20.23 20.63 19.66 2.41 0.57
TP (Rs)
122
119
2.40
Source: Nirmal Bang Institutional Equities Research
Exhibit 5: Operating Assumptions
FY19 FY20 FY21E FY22E FY23E
Brent Crude US$/bbl 70 59.5 44.1 50 55
FX Rs/US$ 69.9 71.5 74 75 75
Margins
GRM (US$/bbl) -IOC Standalone 5.41 0.08 2.42 5.93 5.93
MS- Retail margin Rs/ltr. 2.50 2.75 4.32 3.00 3.00
HSD - Retail margin Rs/ltr. 2.50 2.75 4.32 3.00 3.00
Petchem Blended gross Margin US$/tonne 439.70 294.93 309.23 325.00 350.00
Volumes Mn tonne
Refining (IOC Standalone + CPCL) 82.60 79.59 70.63 78.71 79.29
MS 11.60 12.36 12.36 12.98 13.63
HSD 37.08 36.18 36.18 37.27 38.57
Overall marketing volumes 85.13 83.89 84.27 87.84 92.30
Pipeline 88.53 85.35 76.82 84.50 87.03
Petchem volumes 2.64 2.29 2.37 2.66 2.90
Segment EBITDA
Refining 82,380 -16816 1,966 1,43,561 1,53,021
Marketing 1,50,320 146240 2,49,517 1,46,643 1,57,138
Pipelines 64,390 62950 48,939 61,817 64,945
Petchem 51,640 26770 30,573 38,849 47,202
Others 20,790 -2720 -2,710 -2,710 -2,710
Chennai CPCL 5,155 -21,590 14,972 20,992 22,585
Source: Company, Nirmal Bang Institutional Equities Research
Exhibit 6: Key Financials
Y/E March (Rsmn) FY19 FY20 FY21E FY22E FY23E
Revenues 52,81,489 48,43,623 39,82,932 47,28,074 54,20,612
EBITDA 3,52,227 1,64,049 3,43,259 4,09,153 4,42,181
Consolidated Net Profit Adj 1,73,767 1,04,115 1,57,302 1,90,197 1,90,468
EPS (Rs) 18.93 11.34 17.13 20.72 20.75
EPS gr (%) -19.2 -40.1 51.1 20.9 0.1
EBITDA Margin (%) 6.7 3.4 8.6 8.7 8.2
P/E 5.2 8.7 5.8 4.8 4.8
EV/EBITDA 6.0 12.8 6.1 5.1 4.7
Dividend Yield (%) 10.66 7.09 7.59 8.10 8.10
Net Debt (cash)/Equity (X) 1.0 1.2 0.7 0.8 0.8
Pre-tax RoCE (%) 18.0 5.5 15.5 17.6 16.6
RoE (%) 15.4 10.9 15.1 16.4 14.9
Source: Company, Nirmal Bang Institutional Equities Research

In s t itu tio n a l E q u it ie s
4 IOC
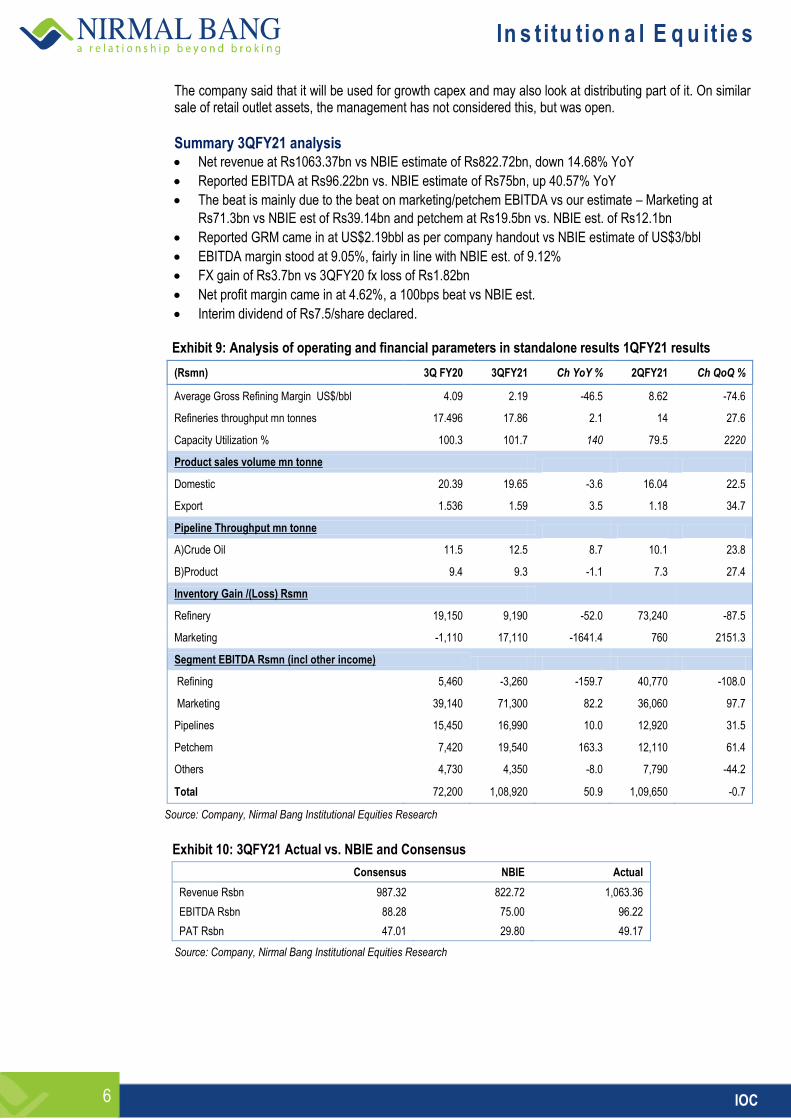
Key highlights from IOC conference-call
3QFY21 results were supported by high inventory gains of Rs26.3bn, including Rs17.11bn in marketing. Marketing and Petchem earnings were the key drivers. The management said this trend is sustainable. Petchem business based on regaining volume lost last year. PP units are running at 52-55% due to feed shortage amid diversion of feed stream for gasoline blending and the FCCU being shut down for some time in 3QFY21. Petroleum business volume Refining improved to 101.7% in 3QFY21 vs 79% in 2QFY21 and 100% a year ago. Petrol volume rose 3% in Oct’20 and 8% in Dec’20 YoY. HSD was up 3% in Oct’20, but down 9%/5% in Nov/Dec’20
3QFY21 operating details YoY: 3QFY21 utilisation at 101.7% at 17.9mn tonne vs 17.5mn tonne a year ago Distillate yield 79.5%, fuel and loss 9.1% and sour crude (high suplhur) at 58.8%. 3QFY21 spreads US$/bbl:
Crude price – US$44.65, up 4% QoQ but down 29% YoY; MS and HSD cracks weak.
But have improved recently to US$3/US$4.5 per bbl, indicating recovery in refining margins.
GRMs in 3QFY21 stood at US$2.19/bbl; Core GRM (excluding inventory gain) was US$1.24/bbl vs. Singapore GRM US$1.22/bbl.
Inventory: IOC had 15mn tonne of inventory as of Dec’20 vs. 19mn a year ago – 7mn of crude and the rest in products. Its crude inventory is valued at US$47.2/bbl; this compares with US$43.7/bbl as of Sept’20 end, and US$32.4/bbl in June’20. Exhibit 7: Reported GRM vs Brent price trend
Source: Nirmal Bang Institutional Equities Research
4.32
7.98
12.32
9.12 10.21
6.79
1.15
4.09 4.69
1.28
4.09
(9.64)
(1.98)
8.62
2.19
0
10
20
30
40
50
60
70
80
-15
-10
-5
0
5
10
15
1QF
Y18
2QF
Y18
3QF
Y18
4QF
Y18
1QF
Y19
2QF
Y19
3QF
Y19
4QF
Y19
1QF
Y20
2QF
Y20
3QF
Y20
4QF
Y20
1QF
Y21
2QF
Y21
3QF
Y21
IOC GRM (US$/BBL) Brent crude price (US$/bbl)- RHS

In s t itu tio n a l E q u it ie s
5 IOC
Exhibit 8: Brent price and total inventory gain/loss trend
Source: Nirmal Bang Institutional Equities Research; note: inventory gain in refining
Petchem
Petchem volume was up 25% from 0.632 mn tonne to 0.79mn tonne; segment EBITDA was up 163.3% at Rs19.54bn. Paradip PP plant operating at 52-55% of capacity (640,000 tpa capacity) Polymer delta up 54% YoY – US$651/TE PX-PTA spread was up 25% QoQ at US$146/TE but was down 21% from year ago MEG spread was up 33% QoQ and 59% YoY IOC is looking at importing propylene feed to increase PP capacity utilisation at Paradip. Started with one parcel NB view: We are surprised that the IOC management is talking of feed shortage for a project conceived as an integrated project. While technical aspects were not discussed, our view is that the management is adopting a flexible strategy to switch between captive and imported propylene depending on the economics.
Marketing The management expects oil prices to weaken as demand is weak. It expects no challenges in maintaining margins despite the high excise duty.
Capex Capex maintained at Rs262.33bn for FY21 – 9MFY21 spend at 64% or Rs167.9bn and 1HFY21 spend at Rs75bn The Board has approved IOC’s JV with subsidiary Chennai Petroleum for 9mn tpa refinery at Nagapattinam at a cost of Rs315bn. This is pending DIPAM and Niti Ayog approval. The equity will be funded 25% each by IOC/CPCL while the rest will be raised from outside investors. Phase II envisages Petchem and PP project to the extent of 5-5.5% conversion of oil to chemicals to make it viable. NB view – This hinges on how GRMs and Petchem spreads shape up over the next few years; India may need additional refining and petchem capacity for meeting domestic growth, which is the basis for PSU projects. The management is looking at investment options in petchem, gas, hydrogen and other renewables that meet viability criteria.
Balance sheet standalone Gross debt is down at Rs724.51bn in Dec’ 20 vs. Rs915bn as of end Sept’20 vs Rs1.16trn in March’20. The debt includes lease of Rs77.6bn The subsidy receivables are down at Rs43bn in Dec’20 vs. Rs91bn in Sept’20 and Rs72bn in Oct’20. There are no worries on this going up despite recent increase in LPG prices due to winter demand. The subsidy is mainly on far flung areas and on freight, which is likely to be settled in time. Use of pipeline stake sale proceeds:
(40.42)
10.56
63.03
34.42
78.66
44.08
(107.44)
26.42 12.33
(11.78)
18.04
(184.75)
(31.96)
74.00
26.30
0
10
20
30
40
50
60
70
80
(200)
(150)
(100)
(50)
-
50
100
1QF
Y18
2QF
Y18
3QF
Y18
4QF
Y18
1QF
Y19
2QF
Y19
3QF
Y19
4QF
Y19
1QF
Y20
2QF
Y20
3QF
Y20
4QF
Y20
1QF
Y21
2QF
Y21
3QF
Y21
Total Inventory gain/(Loss) - (Rsbn) Brent crude price (US$/bbl)- RHS
In s t itu tio n a l E q u it ie s
6 IOC
The company said that it will be used for growth capex and may also look at distributing part of it. On similar sale of retail outlet assets, the management has not considered this, but was open.
Summary 3QFY21 analysis Net revenue at Rs1063.37bn vs NBIE estimate of Rs822.72bn, down 14.68% YoY
Reported EBITDA at Rs96.22bn vs. NBIE estimate of Rs75bn, up 40.57% YoY
The beat is mainly due to the beat on marketing/petchem EBITDA vs our estimate – Marketing at
Rs71.3bn vs NBIE est of Rs39.14bn and petchem at Rs19.5bn vs. NBIE est. of Rs12.1bn
Reported GRM came in at US$2.19bbl as per company handout vs NBIE estimate of US$3/bbl
EBITDA margin stood at 9.05%, fairly in line with NBIE est. of 9.12%
FX gain of Rs3.7bn vs 3QFY20 fx loss of Rs1.82bn
Net profit margin came in at 4.62%, a 100bps beat vs NBIE est.
Interim dividend of Rs7.5/share declared.
Exhibit 9: Analysis of operating and financial parameters in standalone results 1QFY21 results
(Rsmn) 3Q FY20 3QFY21 Ch YoY % 2QFY21 Ch QoQ %
Average Gross Refining Margin US$/bbl 4.09 2.19 -46.5 8.62 -74.6
Refineries throughput mn tonnes 17.496 17.86 2.1 14 27.6
Capacity Utilization % 100.3 101.7 140 79.5 2220
Product sales volume mn tonne
Domestic 20.39 19.65 -3.6 16.04 22.5
Export 1.536 1.59 3.5 1.18 34.7
Pipeline Throughput mn tonne
A)Crude Oil 11.5 12.5 8.7 10.1 23.8
B)Product 9.4 9.3 -1.1 7.3 27.4
Inventory Gain /(Loss) Rsmn
Refinery 19,150 9,190 -52.0 73,240 -87.5
Marketing -1,110 17,110 -1641.4 760 2151.3
Segment EBITDA Rsmn (incl other income)
Refining 5,460 -3,260 -159.7 40,770 -108.0
Marketing 39,140 71,300 82.2 36,060 97.7
Pipelines 15,450 16,990 10.0 12,920 31.5
Petchem 7,420 19,540 163.3 12,110 61.4
Others 4,730 4,350 -8.0 7,790 -44.2
Total 72,200 1,08,920 50.9 1,09,650 -0.7
Source: Company, Nirmal Bang Institutional Equities Research
Exhibit 10: 3QFY21 Actual vs. NBIE and Consensus
Consensus NBIE Actual
Revenue Rsbn 987.32 822.72 1,063.36
EBITDA Rsbn 88.28 75.00 96.22
PAT Rsbn 47.01 29.80 49.17
Source: Company, Nirmal Bang Institutional Equities Research
In s t itu tio n a l E q u it ie s
7 IOC
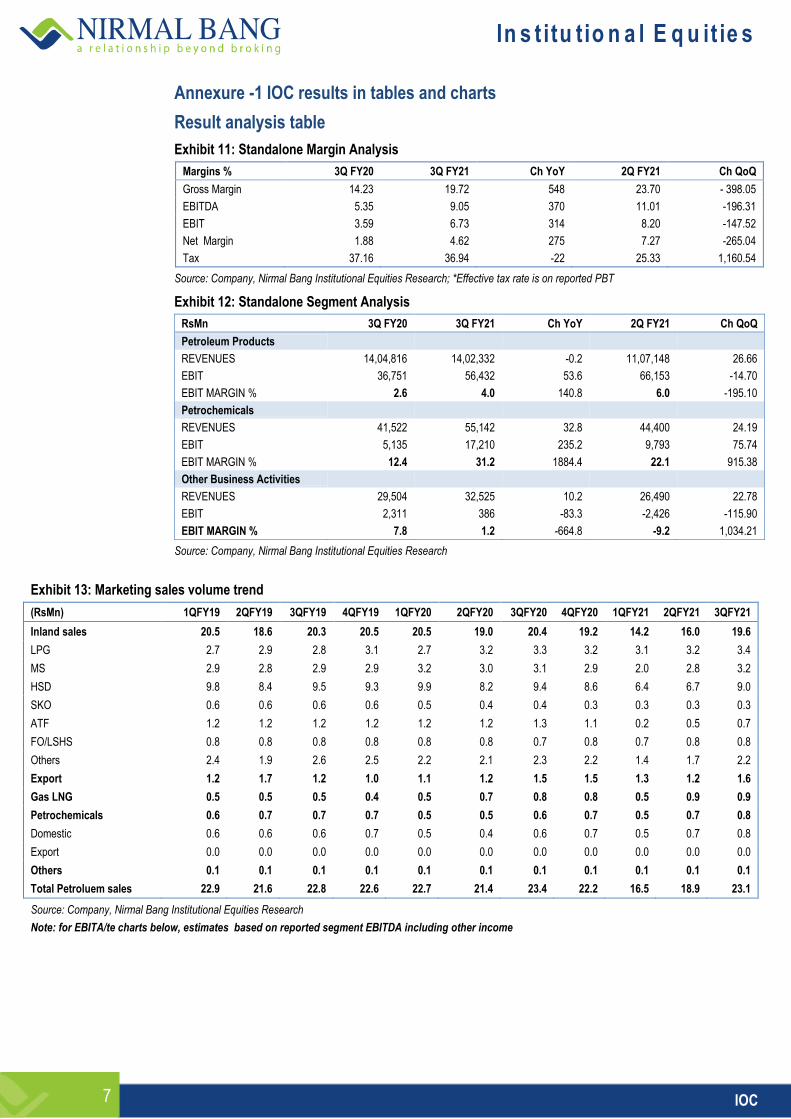
Annexure -1 IOC results in tables and charts
Result analysis table
Exhibit 11: Standalone Margin Analysis
Margins % 3Q FY20 3Q FY21 Ch YoY 2Q FY21 Ch QoQ
Gross Margin 14.23 19.72 548 23.70 - 398.05
EBITDA 5.35 9.05 370 11.01 -196.31
EBIT 3.59 6.73 314 8.20 -147.52
Net Margin 1.88 4.62 275 7.27 -265.04
Tax 37.16 36.94 -22 25.33 1,160.54
Source: Company, Nirmal Bang Institutional Equities Research; *Effective tax rate is on reported PBT
Exhibit 12: Standalone Segment Analysis
RsMn 3Q FY20 3Q FY21 Ch YoY 2Q FY21 Ch QoQ
Petroleum Products
REVENUES 14,04,816 14,02,332 -0.2 11,07,148 26.66
EBIT 36,751 56,432 53.6 66,153 -14.70
EBIT MARGIN % 2.6 4.0 140.8 6.0 -195.10
Petrochemicals
REVENUES 41,522 55,142 32.8 44,400 24.19
EBIT 5,135 17,210 235.2 9,793 75.74
EBIT MARGIN % 12.4 31.2 1884.4 22.1 915.38
Other Business Activities
REVENUES 29,504 32,525 10.2 26,490 22.78
EBIT 2,311 386 -83.3 -2,426 -115.90
EBIT MARGIN % 7.8 1.2 -664.8 -9.2 1,034.21
Source: Company, Nirmal Bang Institutional Equities Research
Exhibit 13: Marketing sales volume trend
(RsMn) 1QFY19 2QFY19 3QFY19 4QFY19 1QFY20 2QFY20 3QFY20 4QFY20 1QFY21 2QFY21 3QFY21
Inland sales 20.5 18.6 20.3 20.5 20.5 19.0 20.4 19.2 14.2 16.0 19.6
LPG 2.7 2.9 2.8 3.1 2.7 3.2 3.3 3.2 3.1 3.2 3.4
MS 2.9 2.8 2.9 2.9 3.2 3.0 3.1 2.9 2.0 2.8 3.2
HSD 9.8 8.4 9.5 9.3 9.9 8.2 9.4 8.6 6.4 6.7 9.0
SKO 0.6 0.6 0.6 0.6 0.5 0.4 0.4 0.3 0.3 0.3 0.3
ATF 1.2 1.2 1.2 1.2 1.2 1.2 1.3 1.1 0.2 0.5 0.7
FO/LSHS 0.8 0.8 0.8 0.8 0.8 0.8 0.7 0.8 0.7 0.8 0.8
Others 2.4 1.9 2.6 2.5 2.2 2.1 2.3 2.2 1.4 1.7 2.2
Export 1.2 1.7 1.2 1.0 1.1 1.2 1.5 1.5 1.3 1.2 1.6
Gas LNG 0.5 0.5 0.5 0.4 0.5 0.7 0.8 0.8 0.5 0.9 0.9
Petrochemicals 0.6 0.7 0.7 0.7 0.5 0.5 0.6 0.7 0.5 0.7 0.8
Domestic 0.6 0.6 0.6 0.7 0.5 0.4 0.6 0.7 0.5 0.7 0.8
Export 0.0 0.0 0.0 0.0 0.0 0.0 0.0 0.0 0.0 0.0 0.0
Others 0.1 0.1 0.1 0.1 0.1 0.1 0.1 0.1 0.1 0.1 0.1
Total Petroluem sales 22.9 21.6 22.8 22.6 22.7 21.4 23.4 22.2 16.5 18.9 23.1
Source: Company, Nirmal Bang Institutional Equities Research
Note: for EBITA/te charts below, estimates based on reported segment EBITDA including other income

In s t itu tio n a l E q u it ie s
8 IOC
Exhibit 14: Refining EBITDA/tonne quarterly trend
Source: Company, Nirmal Bang Institutional Equities Research
Exhibit 15: Marketing EBITDA/tonne quarterly trend
Source: Company, Nirmal Bang Institutional Equities Research
Exhibit 16: Pipeline EBITDA/tonne quarterly trend
Source: Company, Nirmal Bang Institutional Equities Research
-8,000
-6,000
-4,000
-2,000
-
2,000
4,000
6,000
1QF
Y18
2QF
Y18
3QF
Y18
4QF
Y18
1QF
Y19
2QF
Y19
3QF
Y19
4QF
Y19
1QF
Y20
2QF
Y20
3QF
Y20
4QF
Y20
1QF
Y21
2QF
Y21
3QF
Y21
Refining EBITDA Rs/tonne
-1,000
-
1,000
2,000
3,000
4,000
5,000
1QF
Y18
2QF
Y18
3QF
Y18
4QF
Y18
1QF
Y19
2QF
Y19
3QF
Y19
4QF
Y19
1QF
Y20
2QF
Y20
3QF
Y20
4QF
Y20
1QF
Y21
2QF
Y21
3QF
Y21
Marketing EBITDA Rs/tonne
640
660
680
700
720
740
760
780
800
1QF
Y18
2QF
Y18
3QF
Y18
4QF
Y18
1QF
Y19
2QF
Y19
3QF
Y19
4QF
Y19
1QF
Y20
2QF
Y20
3QF
Y20
4QF
Y20
1QF
Y21
2QF
Y21
3QF
Y21
Pipeline EBITDA Rs/tonne
In s t itu tio n a l E q u it ie s
9 IOC
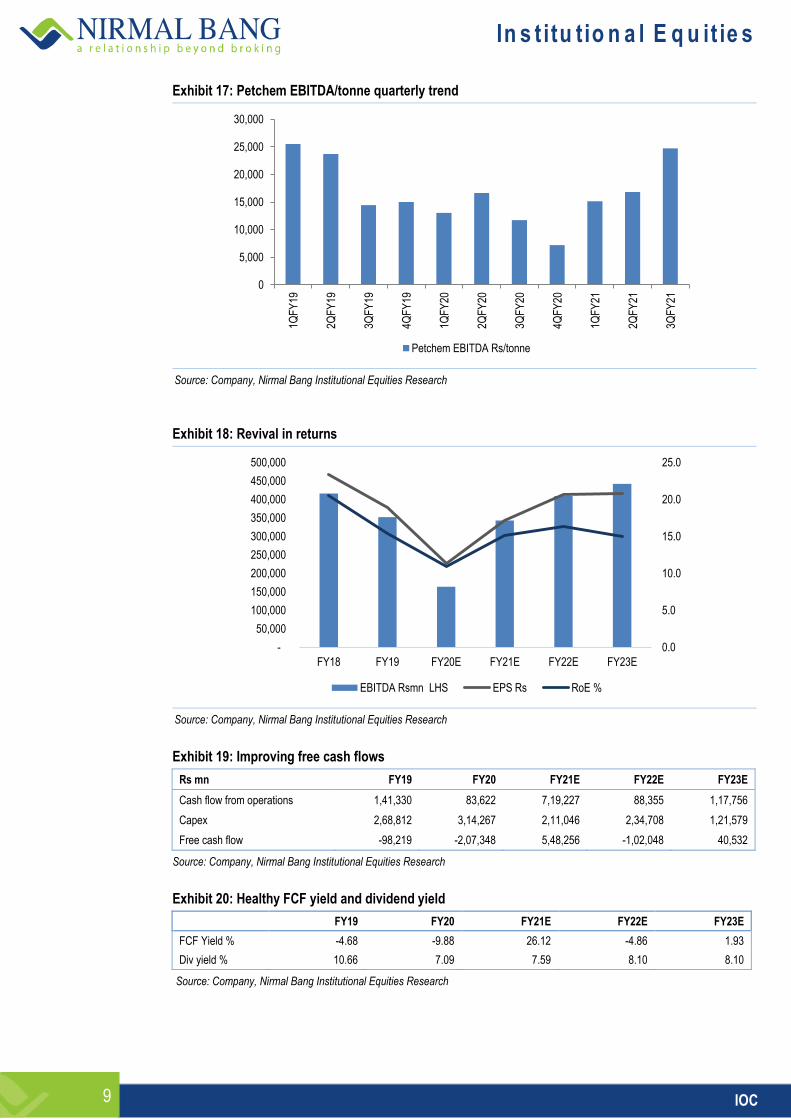
Exhibit 17: Petchem EBITDA/tonne quarterly trend
Source: Company, Nirmal Bang Institutional Equities Research
Exhibit 18: Revival in returns
Source: Company, Nirmal Bang Institutional Equities Research
Exhibit 19: Improving free cash flows
Rs mn FY19 FY20 FY21E FY22E FY23E
Cash flow from operations 1,41,330 83,622 7,19,227 88,355 1,17,756
Capex 2,68,812 3,14,267 2,11,046 2,34,708 1,21,579
Free cash flow -98,219 -2,07,348 5,48,256 -1,02,048 40,532
Source: Company, Nirmal Bang Institutional Equities Research
Exhibit 20: Healthy FCF yield and dividend yield
FY19 FY20 FY21E FY22E FY23E
FCF Yield % -4.68 -9.88 26.12 -4.86 1.93
Div yield % 10.66 7.09 7.59 8.10 8.10
Source: Company, Nirmal Bang Institutional Equities Research
0
5,000
10,000
15,000
20,000
25,000
30,000
1QF
Y19
2QF
Y19
3QF
Y19
4QF
Y19
1QF
Y20
2QF
Y20
3QF
Y20
4QF
Y20
1QF
Y21
2QF
Y21
3QF
Y21
Petchem EBITDA Rs/tonne
0.0
5.0
10.0
15.0
20.0
25.0
-
50,000
100,000
150,000
200,000
250,000
300,000
350,000
400,000
450,000
500,000
FY18 FY19 FY20E FY21E FY22E FY23E
EBITDA Rsmn LHS EPS Rs RoE %

In s t itu tio n a l E q u it ie s
10 IOC
Financials -Consolidated
Exhibit 21: Income statement
Y/E March (Rsmn) FY19 FY20 FY21E FY22E FY23E
Net Revenue 52,81,489 48,43,623 39,82,932 47,28,074 54,20,612
y/y 25.30 -8.29 -17.77 18.71 14.65
Raw Material Expenses 44,20,968 41,51,295 31,61,927 38,26,064 44,70,010
RM/Sales % 83.7 85.7 79.4 80.9 82.5
Employee cost 1,15,963 93,369 96,170 99,055 1,02,027
Other expenses 3,92,332 4,34,910 3,81,576 3,93,801 4,06,393
EBITDA 3,52,227 1,64,049 3,43,259 4,09,153 4,42,181
y/y -15.39 -53.43 109.24 19.20 8.07
Depreciation 85,065 98,549 1,08,594 1,22,127 1,35,154
EBIT 2,67,162 65,500 2,34,664 2,87,026 3,07,027
Interest Expense 48,880 65,787 43,052 48,203 67,406
Other Income 27,143 27,903 25,914 28,644 28,194
PBT (adjusted) 2,45,425 27,615 2,17,527 2,67,467 2,67,816
Income Tax Expense 86,531 (53,007) 71,784 88,264 88,379
Associates inc/loss(+/-) 13,844 13,661 14,161 15,661 16,161
Minority Interest - 1,029
- 9,832
2,601 4,667 5,129
Consolidated Net Profit Adj 1,73,767 1,04,115 1,57,302 1,90,197 1,90,468
EPS (Rs) 18.93 11.34 17.13 20.72 20.75
y/y -19.15 -40.08 51.09 20.91 0.14
Source: Company, Nirmal Bang Institutional Equities Research
Exhibit 23: Balance sheet
Y/E March (Rsmn) FY19 FY20 FY21E FY22E FY23E
Equity Share Capital 91,810 91,810 91,810 91,810 91,810
Reserves and Surplus 10,32,882 8,62,169 9,50,613 10,67,362 11,84,382
Networth 11,24,692 9,53,979 10,42,424 11,59,172 12,76,192
Non controlling interests 18,774 8,763 11,364 16,031 21,160
Long Term Borrowings 3,91,525 5,60,706 4,95,632 5,64,382 7,14,382
Other Financial Liab 6,160 7,896 7,896 7,896 7,896
Other long term liab. 2,03,212 1,50,846 1,50,846 1,50,846 1,50,846
Short Term Borrowings 5,35,593 6,98,974 3,59,044 5,09,044 4,59,044
Other. Fin Liab 1,14,855 3,81,174 3,81,174 3,81,174 3,81,174
Trade Payables 4,11,941 2,76,035 3,27,364 3,88,609 4,45,530
Other curr liab 5,44,799 2,58,995 1,96,419 2,33,165 2,67,318
Total Capital And Liabilities
33,51,551 32,97,368 29,72,163 34,10,319 37,23,542
Total Asset plus WIP 16,07,745 17,98,670 19,01,121 20,13,702 20,00,127
Investments – JVs/Assoc. 1,18,934 1,35,722 1,35,722 1,35,722 1,35,722
Non-Current Investments 2,36,174 1,37,075 1,37,075 1,37,075 1,37,075
Other Non-Current Assets 90,938 1,19,657 1,19,657 1,19,657 1,19,657
Current Investments 84,169 82,912 82,912 82,912 82,912
Inventories 7,71,265 6,70,108 3,27,364 6,47,681 8,91,059
Trade Receivables 1,57,977 1,32,595 54,561 64,768 1,48,510
Cash and Cash Equivalents 9,333 14,346 7,466 2,518 2,195
Bank balances 1,314 8,614 8,614 8,614 8,614
Other financial assets 2,04,905 1,41,707 1,41,707 1,41,707 1,41,707
Other Current Assets 68,797 55,964 55,964 55,964 55,964
Total Assets 33,51,551 32,97,368 29,72,163 34,10,319 37,23,542
Source: Company, Nirmal Bang Institutional Equities Research
Exhibit 22: Cash flow
Y/E March (Rsmn) FY19 FY20E FY21E FY22E FY23E
PBT 2,59,269 -71,770 2,17,527 2,67,467 2,67,816
Add depreciation 85,074 1,02,745 1,08,594 1,22,127 1,35,154
Other expenses 3,279 24,773 17,138 19,559 39,212
Change in W/C-inc/(dec) 1,50,581 -49,378 -4,47,753 2,32,533 2,36,046
Opg cashflow after W/C 1,97,040 1,05,127 7,91,011 1,76,620 2,06,135
Income tax 55,710 21,505 71,784 88,264 88,379
Cash flow from Op (A) 1,41,330 83,622 7,19,227 88,355 1,17,756
Capex -2,68,812 -3,14,267 -2,11,046 -2,34,708 -1,21,579
Other Investments 29,263 23,297 40,075 44,305 44,355
Opg Free cash -98,219 -2,07,348 5,48,256 -1,02,048 40,532
Cash flow from Inv (B) -2,39,549 -2,90,970 -1,70,971 -1,90,403 -77,224
Inc/(Dec) in borrowings 3,09,764 3,26,531 -4,43,227 2,18,750 1,00,000
Dividends (incl tax) -1,16,790 -58,029 -68,858 -73,448 -73,448
Other Expenses -88,609 -59,051 -43,052 -48,203 -67,406
Cash flow from Fin (C) 1,04,365 2,09,450 -5,55,136 97,099 -40,854
Chg in Cash 6,146 5,013 -6,880 -4,949 -322
opening cash 3,187 9,333 14,346 7,466 2,518
closing cash 9,333 14,346 7,466 2,518 2,195
Source: Company, Nirmal Bang Institutional Equities Research
Exhibit 24: Key ratios
Y/E March (Rsmn) FY19 FY20 FY21E FY22E FY23E
Profitability ratios
EBITDA margin (%) 6.7 3.4 8.6 8.7 8.2
EBIT margin (%) 5.1 1.4 5.9 6.1 5.7
Net profit margin (%) 3.3 2.1 3.9 4.0 3.5
RoE (%) 15.4 10.9 15.1 16.4 14.9
Pre-tax RoCE (%) 18.0 5.5 15.5 17.6 16.6
RoIC (%) 12.8 1.9 12.2 13.8 12.0
Working cap ratios
Receivables (days) 9.2 10.9 5.0 5.0 10.0
Inventory (days) 61 63 30 50 60
Payables (days) 27 26 30 30 30
Cash conversion cycle 43.2 48.4 5.0 25.0 40.0
Leverage ratios
Net debt (Rsmn) 11,50,607 11,92,031 7,55,685 9,79,383 10,79,705
Net Debt/Equity (X) 1.02 1.25 0.72 0.84 0.85
Net Debt/EBITDA 3.27 7.27 2.20 2.39 2.44
Valuation ratios
EV/sales (x) 0.40 0.43 0.53 0.44 0.39
EV/EBITDA (x) 5.96 12.80 6.12 5.13 4.75
EV/FCF -21.37 -10.12 3.83 -20.57 51.79
P/E (x) 5.22 8.71 5.77 4.77 4.76
P/BV (x) 0.81 0.95 0.87 0.78 0.71
FCF Yield (%) -4.68 -9.88 26.12 -4.86 1.93
Dividend Yield (%) 10.66 7.09 7.59 8.10 8.10
Per share ratios
EPS 18.93 11.34 17.13 20.72 20.75
Cash EPS 28.19 22.07 28.96 34.02 35.47
BVPS 122.50 103.91 113.54 126.26 139.00
DPS 10.53 7.00 7.50 8.00 8.00
Source: Company, Nirmal Bang Institutional Equities Research

In s t itu tio n a l E q u it ie s
11 IOC
Rating track Date Rating Market price Target price (Rs)
12 May 2017 Sell 425 396
29 May 2017 Sell 425 396
4 August 2017 Sell 388 357
31 October 2017 Sell 414 357
1 February 2018 Accumulate 418 414
24 May 2018* Sell 154 137
13 August 2018 Sell 161 137
5 November 2018 Under Review 148 -
31January 2019 Sell 135 112
21 May 2019 Sell 158 112
2 August 2019 Sell 137 112
4 November 2019 Accumulate 143 147
3 February 2020 Buy 109 136
7 April 2020 Buy 80 137
7 May 2020 Buy 77 137
26 June 2020 Buy 85 148
5 August 2020 Buy 87 146
23 September 2020 Buy 76 145
3 November 2020 Buy 78 146
9 January 2021 Buy 95 119
3 February 2021 Buy 99 122
*Price after 1:1 bonus issue
Rating track graph
60
80
100
120
140
160
180
200
220
240
Apr
-17
May
-17
Jun-
17A
ug-1
7S
ep-1
7N
ov-1
7D
ec-1
7Ja
n-18
Mar
-18
Apr
-18
Jun-
18Ju
l-18
Sep
-18
Oct
-18
Nov
-18
Jan-
19F
eb-1
9A
pr-1
9M
ay-1
9Ju
n-19
Aug
-19
Sep
-19
Nov
-19
Dec
-19
Jan-
20M
ar-2
0A
pr-2
0Ju
n-20
Jul-2
0S
ep-2
0O
ct-2
0N
ov-2
0Ja
n-21
Not Covered Covered

In s t itu tio n a l E q u it ie s
12 IOC
DISCLOSURES
This Report is published by Nirmal Bang Equities Private Limited (hereinafter referred to as “NBEPL”) for private circulation. NBEPL is a registered Research Analyst under SEBI (Research Analyst) Regulations, 2014 having Registration no. INH000001436. NBEPL is also a registered Stock Broker with National Stock Exchange of India Limited and BSE Limited in cash and derivatives segments. NBEPL has other business divisions with independent research teams separated by Chinese walls, and therefore may, at times, have different or contrary views on stocks and markets. NBEPL or its associates have not been debarred / suspended by SEBI or any other regulatory authority for accessing / dealing in securities Market. NBEPL, its associates or analyst or his relatives do not hold any financial interest in the subject company. NBEPL or its associates or Analyst do not have any conflict or material conflict of interest at the time of publication of the research report with the subject company. NBEPL or its associates or Analyst or his relatives do not hold beneficial ownership of 1% or more in the subject company at the end of the month immediately preceding the date of publication of this research report. NBEPL or its associates / analyst has not received any compensation / managed or co-managed public offering of securities of the company covered by Analyst during the past twelve months. NBEPL or its associates have not received any compensation or other benefits from the company covered by Analyst or third party in connection with the research report. Analyst has not served as an officer, director or employee of Subject Company and NBEPL / analyst has not been engaged in market making activity of the subject company. Analyst Certification: I, Ramesh Sankaranarayanan, research analyst the author of this report, hereby certify that the views expressed in this research report accurately reflects my personal views about the subject securities, issuers, products, sectors or industries. It is also certified that no part of the compensation of the analyst was, is, or will be directly or indirectly related to the inclusion of specific recommendations or views in this research. The analyst is principally responsible for the preparation of this research report and has taken reasonable care to achieve and maintain independence and objectivity in making any recommendations.

In s t itu tio n a l E q u it ie s
13 IOC
Disclaimer
Stock Ratings Absolute Returns
BUY > 15%
ACCUMULATE -5% to15%
SELL < -5%
This report is for the personal information of the authorized recipient and does not construe to be any investment, legal or taxation advice to you. NBEPL is not soliciting any action based upon it. Nothing in this research shall be construed as a solicitation to buy or sell any security or product, or to engage in or refrain from engaging in any such transaction. In preparing this research, we did not take into account the investment objectives, financial situation and particular needs of the reader.
This research has been prepared for the general use of the clients of NBEPL and must not be copied, either in whole or in part, or distributed or redistributed to any other person in any form. If you are not the intended recipient you must not use or disclose the information in this research in any way. Though disseminated to all the customers simultaneously, not all customers may receive this report at the same time. NBEPL will not treat recipients as customers by virtue of their receiving this report. This report is not directed or intended for distribution to or use by any person or entity resident in a state, country or any jurisdiction, where such distribution, publication, availability or use would be contrary to law, regulation or which would subject NBEPL & its group companies to registration or licensing requirements within such jurisdictions.
The report is based on the information obtained from sources believed to be reliable, but we do not make any representation or warranty that it is accurate, complete or up-to-date and it should not be relied upon as such. We accept no obligation to correct or update the information or opinions in it. NBEPL or any of its affiliates or employees shall not be in any way responsible for any loss or damage that may arise to any person from any inadvertent error in the information contained in this report. NBEPL or any of its affiliates or employees do not provide, at any time, any express or implied warranty of any kind, regarding any matter pertaining to this report, including without limitation the implied warranties of merchantability, fitness for a particular purpose, and non-infringement. The recipients of this report should rely on their own investigations.
This information is subject to change without any prior notice. NBEPL reserves its absolute discretion and right to make or refrain from making modifications and alterations to this statement from time to time. Nevertheless, NBEPL is committed to providing independent and transparent recommendations to its clients, and would be happy to provide information in response to specific client queries.
Before making an investment decision on the basis of this research, the reader needs to consider, with or without the assistance of an adviser, whether the advice is appropriate in light of their particular investment needs, objectives and financial circumstances. There are risks involved in securities trading. The price of securities can and does fluctuate, and an individual security may even become valueless. International investors are reminded of the additional risks inherent in international investments, such as currency fluctuations and international stock market or economic conditions, which may adversely affect the value of the investment. Opinions expressed are subject to change without any notice. Neither the company nor the director or the employees of NBEPL accept any liability whatsoever for any direct, indirect, consequential or other loss arising from any use of this research and/or further communication in relation to this research. Here it may be noted that neither NBEPL, nor its directors, employees, agents or representatives shall be liable for any damages whether direct or indirect, incidental, special or consequential including lost revenue or lost profit that may arise from or in connection with the use of the information contained in this report.
Copyright of this document vests exclusively with NBEPL.
Our reports are also available on our website www.nirmalbang.com
Access all our reports on Bloomberg, Thomson Reuters and Factset.
Team Details:
Name Email Id Direct Line
Rahul Arora CEO [email protected] -
Girish Pai Head of Research [email protected] +91 22 6273 8017 / 18
Dealing
Ravi Jagtiani Dealing Desk [email protected] +91 22 6273 8230, +91 22 6636 8833
Michael Pillai Dealing Desk [email protected] +91 22 6273 8102/8103, +91 22 6636 8830
Nirmal Bang Equities Pvt. Ltd.
Correspondence Address
B-2, 301/302, Marathon Innova,
Nr. Peninsula Corporate Park,
Lower Parel (W), Mumbai-400013.
Board No. : 91 22 6273 8000/1; Fax. : 022 6273 8010