institu tion al e quities oil & gas sector · for bpcl over this period, with hpcl topping the...
TRANSCRIPT
In s t itu tio n a l E q u it ie s
Oil & Gas Sector
Sec
tor
Upd
ate
HPCL to lead tactical rally in OMCs despite refining woes
We maintain Buy on IOC and upgrade BPCL and HPCL from Accumulate to Buy following revised earnings and TP, which we have rolled over to FY22E. We see PSU refining majors (OMCs) delivering double-digit returns in the next 6-12 months based on the upside leverage to marketing margins under low oil prices below US$40-50/bbl. We believe that these stocks are poised to enter the blue sky phase last seen during FY14-17, when the steep fall in oil price from US$107 to US$47-50/bbl boosted marketing margins and earnings for the OMCs. As a result, IOC and BPCL delivered compounded returns of 39% and 40%, respectively while HPCL’s stock price witnessed a CAGR of 70% over April 2014-March 2017. This is likely to offset the risk to earnings from pressure on GRMs (tough to predict), inventory losses and the hit on refining and marketing volume (due to the COVID-19 lockdown). We have raised earnings for the OMC trio assuming about 10% hit on volume in 1QFY21, weak GRMs and Rs3/lit upside in retail margins in FY21. These are subject to change as and when we get official confirmation on the lockdown impact. The INR/USD depreciation, while negative for MTM impact in fx loans, is overall a tailwind assuming that the combined spread in refining and marketing remains +ve. We have raised our TP for HPCL by 43.9% to Rs353 and for IOC a tad to Rs137. We are cutting the TP for BPCL by 22.6% to Rs414 based on our reduced target multiple - from 10.9x (10% premium to SD+1 on 5 year median) to 6.1x (SD-1), as the stake sale tailwind is likely to wane until the COVID-19 related uncertainty ends.
Key risks: Volatility in oil markets can lead to massive unpredictable swings in refining and marketing earnings. Reduction in volume below breakeven levels - a rare occurrence for OMCs - can lead to losses. If demand contraction in oil persists for more than a year, the pressure on refining margins could hurt cash flows and increase the leverage risk as the Net debt/EBITDA could spike.
Low sub-US$50/bbl oil price to support upswing in earnings despite weak GRMs: We see retail MS and HSD margins rising from Rs2/lit to Rs5.25/litre in FY21 based a US$29/bbl decline in Brent crude to US$30/bbl in FY21E. This is after considering the latest hike of Rs3 in government levies, and potential future increase in excise duty. The three OMCs enjoy an upside in EPS of 19% to 69% for every Rs1/lit increase in retail margin, which is based on Rs0.55/lit upside in retail margin for USD1/bbl fall in oil price. Our stress analysis shows that a Rs1/lit increase in retail margin offsets a US$1/bbl fall in GRM, resulting in about 10% upside in EPS.
Lower oil price also potentially boosts RoCE on rising marketing margins: We believe that the decline in the overall price table for refining industry reduces the topline as well as the value of inventory and receivables, thereby reducing working capital. This reduces the overall capital employed, while the higher marketing margin/unit translates into higher EBIDTA margin on revenue. This should support RoCE expansion as long as low oil prices and high retail margins can sustain. We saw the OMCs deliver higher earnings and RoCE between FY15 and FY17 when we had the last big correction in oil prices from triple digits to US$54/bbl.
COVID-19 lockdown impact on volume a key worry: Our analysis reveals that OMC earnings are sensitive to cuts in refining and retail volume and this impact could get magnified in 1QFY21 due to inventory losses and MTM hit on fx loans if oil keeps falling to below US$20/bbl as many global consultants predict. A 10% cut in volume to 90% of normal run-rate in both refining and marketing implies 29.4%, 21.8%, 77.5% hit in FY21E EPS for HPCL, BPCL and IOC respectively. We estimate the FY21E breakeven run-rate at 54.3%, 68%, 87.5% of normal volume for HPCL, BPCL and IOC, respectively. This is unchartered waters for Indian OMCs as cutting volume due to demand contraction has been a rare occurrence.
Improved retail margins to partly offset inventory losses in 4QFY20E: We expect the OMCs to report a decline in standalone PAT of 70% to 80% in 4QFY20E, in part due to the high base a year ago. Our 4QFY20E show that GRMs could be minus US$0.5-1/bbl, including inventory loss of around US$8/bbl, based on the sharp fall in oil price to below US$30/bbl in March. However, the cheaper oil will likely result in higher marketing margins. We expect MS and HSD retail margins at Rs2.5-3/litre in 4QFY20E vs industry indication of Rs1.8-2/litre for April–Dec19, and at least Rs4-5/lit a year ago. In IOC, we have further cause for worry on petchem segment (15% of EBITDA) due to likely hit on volume, and margins already at 10-year lows, especially in polyester intermediates paraxylene, PTA and MEG where demand erosion is much more acute as compared to polymers.
Amit Agarwal Research Analyst [email protected] +91-22-6273 8145
CMP (Rs)
Mcap (US$Bn)
TP (Rs)
Rating
BPCL 317 9.68 414 BUY
HPCL 182 3.94 353 BUY
IOC 80 10.5 137 BUY
7 April 2020
In s t itu tio n a l E q u it ie s
Oil & Gas Sector 2
Rating rationale
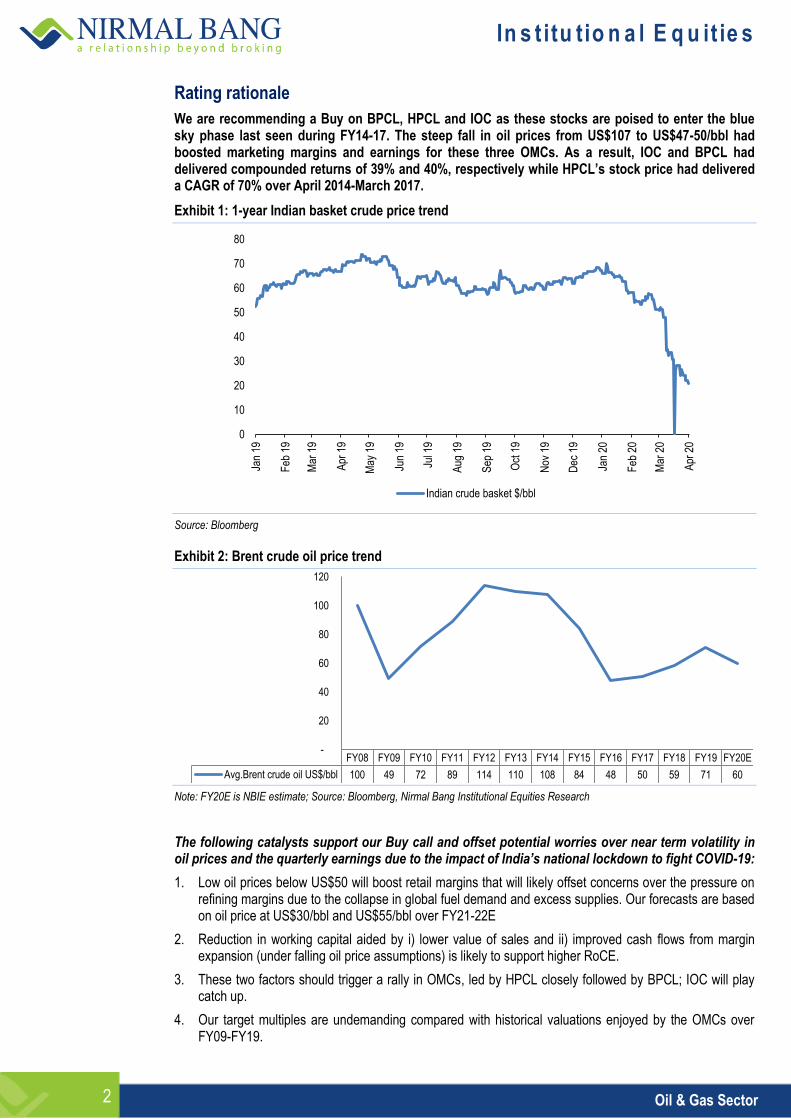
We are recommending a Buy on BPCL, HPCL and IOC as these stocks are poised to enter the blue sky phase last seen during FY14-17. The steep fall in oil prices from US$107 to US$47-50/bbl had boosted marketing margins and earnings for these three OMCs. As a result, IOC and BPCL had delivered compounded returns of 39% and 40%, respectively while HPCL’s stock price had delivered a CAGR of 70% over April 2014-March 2017.
Exhibit 1: 1-year Indian basket crude price trend
Source: Bloomberg
Exhibit 2: Brent crude oil price trend
Note: FY20E is NBIE estimate; Source: Bloomberg, Nirmal Bang Institutional Equities Research
The following catalysts support our Buy call and offset potential worries over near term volatility in oil prices and the quarterly earnings due to the impact of India’s national lockdown to fight COVID-19:
1. Low oil prices below US$50 will boost retail margins that will likely offset concerns over the pressure on refining margins due to the collapse in global fuel demand and excess supplies. Our forecasts are based on oil price at US$30/bbl and US$55/bbl over FY21-22E
2. Reduction in working capital aided by i) lower value of sales and ii) improved cash flows from margin expansion (under falling oil price assumptions) is likely to support higher RoCE.
3. These two factors should trigger a rally in OMCs, led by HPCL closely followed by BPCL; IOC will play catch up.
4. Our target multiples are undemanding compared with historical valuations enjoyed by the OMCs over FY09-FY19.
0
10
20
30
40
50
60
70
80
Jan
19
Feb
19
Mar
19
Apr
19
May
19
Jun
19
Jul 1
9
Aug
19
Sep
19
Oct
19
Nov
19
Dec
19
Jan
20
Feb
20
Mar
20
Apr
20
Indian crude basket $/bbl
FY08 FY09 FY10 FY11 FY12 FY13 FY14 FY15 FY16 FY17 FY18 FY19 FY20E
Avg.Brent crude oil US$/bbl 100 49 72 89 114 110 108 84 48 50 59 71 60
-
20
40
60
80
100
120
In s t itu tio n a l E q u it ie s
Oil & Gas Sector 3
5. The correction in oil from triple digits over FY15-17 (from US$108 to US$54/bbl) saw a surge in earnings and RoCE for the OMCs that resulted in the three stocks delivering returns of 177% for IOC and 182% for BPCL over this period, with HPCL topping the list with a return of 409%.. Please see exhibits given below for the three OMCs titled - “Historical analysis of earnings and valuations vs. oil price”.
6. The current situation that has seen oil collapse more than 55% YoY to below US$30/bbl as on date is similar to beginning of the above period that saw OMC stocks sustain investor interest based on the sharp spurt in earnings. We would also like to point out that prevailing worries over excess capacity in refining was an overhang during the above blue sky phase too, though to a lesser degree. .
7. We also see current valuations on P/BV compelling as this is a good proxy for replacement cost based valuations as earnings for the sector could show sharp swings until global markets stabilize.
8. Capacity rationalization and expansion in sweet-sour spreads could aid long term growth in complex GRMs (please see discussion on this in the latter section of the report)
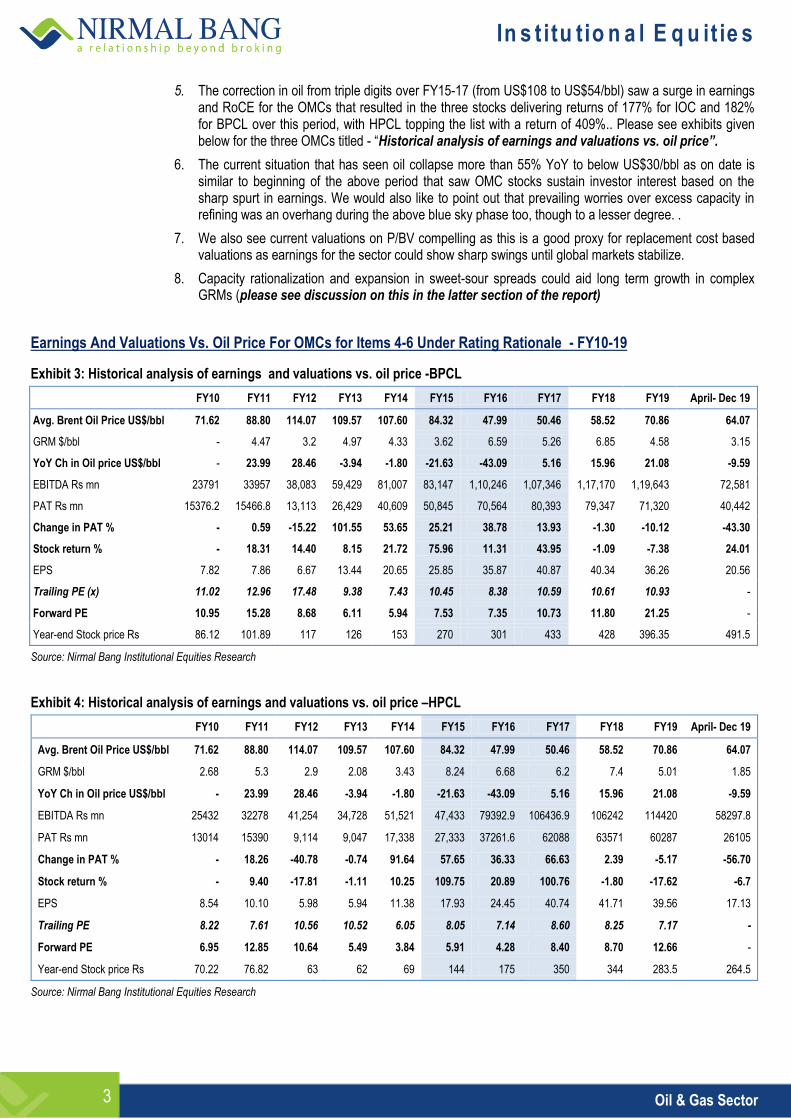
Earnings And Valuations Vs. Oil Price For OMCs for Items 4-6 Under Rating Rationale - FY10-19
Exhibit 3: Historical analysis of earnings and valuations vs. oil price -BPCL
FY10 FY11 FY12 FY13 FY14 FY15 FY16 FY17 FY18 FY19 April- Dec 19
Avg. Brent Oil Price US$/bbl 71.62 88.80 114.07 109.57 107.60 84.32 47.99 50.46 58.52 70.86 64.07
GRM $/bbl - 4.47 3.2 4.97 4.33 3.62 6.59 5.26 6.85 4.58 3.15
YoY Ch in Oil price US$/bbl - 23.99 28.46 -3.94 -1.80 -21.63 -43.09 5.16 15.96 21.08 -9.59
EBITDA Rs mn 23791 33957 38,083 59,429 81,007 83,147 1,10,246 1,07,346 1,17,170 1,19,643 72,581
PAT Rs mn 15376.2 15466.8 13,113 26,429 40,609 50,845 70,564 80,393 79,347 71,320 40,442
Change in PAT % - 0.59 -15.22 101.55 53.65 25.21 38.78 13.93 -1.30 -10.12 -43.30
Stock return % - 18.31 14.40 8.15 21.72 75.96 11.31 43.95 -1.09 -7.38 24.01
EPS 7.82 7.86 6.67 13.44 20.65 25.85 35.87 40.87 40.34 36.26 20.56
Trailing PE (x) 11.02 12.96 17.48 9.38 7.43 10.45 8.38 10.59 10.61 10.93 -
Forward PE 10.95 15.28 8.68 6.11 5.94 7.53 7.35 10.73 11.80 21.25 -
Year-end Stock price Rs 86.12 101.89 117 126 153 270 301 433 428 396.35 491.5
Source: Nirmal Bang Institutional Equities Research
Exhibit 4: Historical analysis of earnings and valuations vs. oil price –HPCL
FY10 FY11 FY12 FY13 FY14 FY15 FY16 FY17 FY18 FY19 April- Dec 19
Avg. Brent Oil Price US$/bbl 71.62 88.80 114.07 109.57 107.60 84.32 47.99 50.46 58.52 70.86 64.07
GRM $/bbl 2.68 5.3 2.9 2.08 3.43 8.24 6.68 6.2 7.4 5.01 1.85
YoY Ch in Oil price US$/bbl - 23.99 28.46 -3.94 -1.80 -21.63 -43.09 5.16 15.96 21.08 -9.59
EBITDA Rs mn 25432 32278 41,254 34,728 51,521 47,433 79392.9 106436.9 106242 114420 58297.8
PAT Rs mn 13014 15390 9,114 9,047 17,338 27,333 37261.6 62088 63571 60287 26105
Change in PAT % - 18.26 -40.78 -0.74 91.64 57.65 36.33 66.63 2.39 -5.17 -56.70
Stock return % - 9.40 -17.81 -1.11 10.25 109.75 20.89 100.76 -1.80 -17.62 -6.7
EPS 8.54 10.10 5.98 5.94 11.38 17.93 24.45 40.74 41.71 39.56 17.13
Trailing PE 8.22 7.61 10.56 10.52 6.05 8.05 7.14 8.60 8.25 7.17 -
Forward PE 6.95 12.85 10.64 5.49 3.84 5.91 4.28 8.40 8.70 12.66 -
Year-end Stock price Rs 70.22 76.82 63 62 69 144 175 350 344 283.5 264.5
Source: Nirmal Bang Institutional Equities Research
In s t itu tio n a l E q u it ie s
Oil & Gas Sector 4
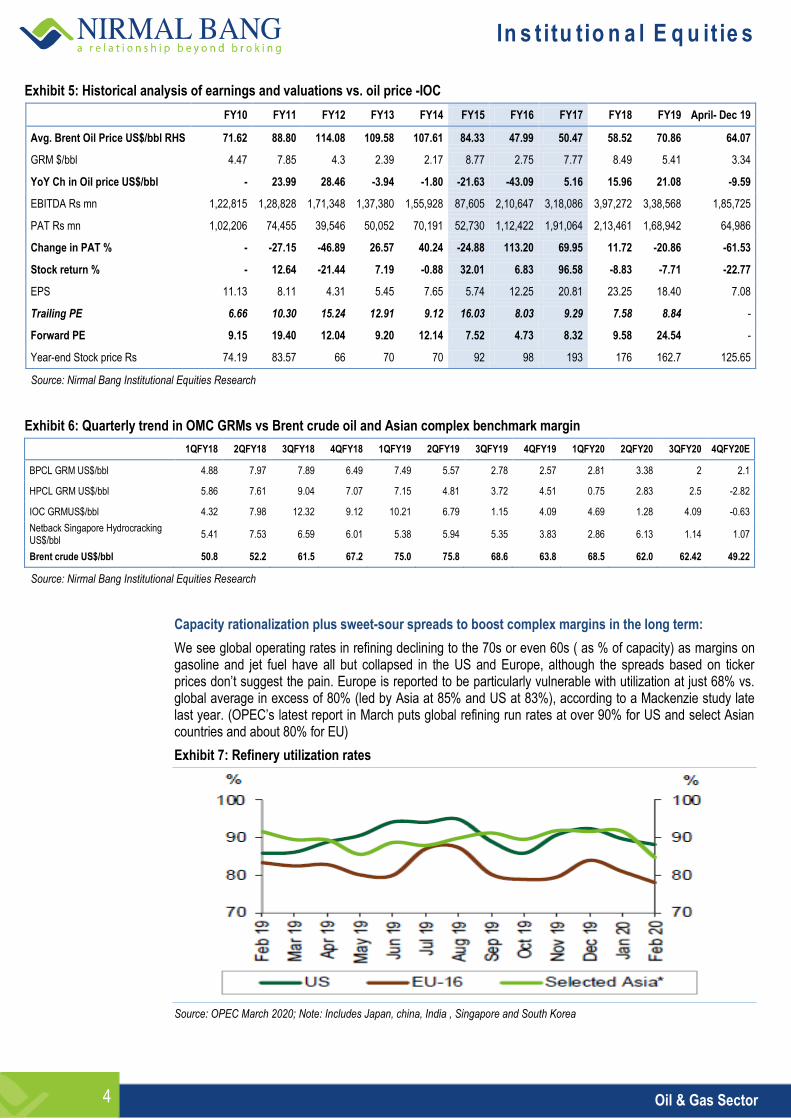
Exhibit 5: Historical analysis of earnings and valuations vs. oil price -IOC
FY10 FY11 FY12 FY13 FY14 FY15 FY16 FY17 FY18 FY19 April- Dec 19
Avg. Brent Oil Price US$/bbl RHS 71.62 88.80 114.08 109.58 107.61 84.33 47.99 50.47 58.52 70.86 64.07
GRM $/bbl 4.47 7.85 4.3 2.39 2.17 8.77 2.75 7.77 8.49 5.41 3.34
YoY Ch in Oil price US$/bbl - 23.99 28.46 -3.94 -1.80 -21.63 -43.09 5.16 15.96 21.08 -9.59
EBITDA Rs mn 1,22,815 1,28,828 1,71,348 1,37,380 1,55,928 87,605 2,10,647 3,18,086 3,97,272 3,38,568 1,85,725
PAT Rs mn 1,02,206 74,455 39,546 50,052 70,191 52,730 1,12,422 1,91,064 2,13,461 1,68,942 64,986
Change in PAT % - -27.15 -46.89 26.57 40.24 -24.88 113.20 69.95 11.72 -20.86 -61.53
Stock return % - 12.64 -21.44 7.19 -0.88 32.01 6.83 96.58 -8.83 -7.71 -22.77
EPS 11.13 8.11 4.31 5.45 7.65 5.74 12.25 20.81 23.25 18.40 7.08
Trailing PE 6.66 10.30 15.24 12.91 9.12 16.03 8.03 9.29 7.58 8.84 -
Forward PE 9.15 19.40 12.04 9.20 12.14 7.52 4.73 8.32 9.58 24.54 -
Year-end Stock price Rs 74.19 83.57 66 70 70 92 98 193 176 162.7 125.65
Source: Nirmal Bang Institutional Equities Research
Exhibit 6: Quarterly trend in OMC GRMs vs Brent crude oil and Asian complex benchmark margin
1QFY18 2QFY18 3QFY18 4QFY18 1QFY19 2QFY19 3QFY19 4QFY19 1QFY20 2QFY20 3QFY20 4QFY20E
BPCL GRM US$/bbl 4.88 7.97 7.89 6.49 7.49 5.57 2.78 2.57 2.81 3.38 2 2.1
HPCL GRM US$/bbl 5.86 7.61 9.04 7.07 7.15 4.81 3.72 4.51 0.75 2.83 2.5 -2.82
IOC GRMUS$/bbl 4.32 7.98 12.32 9.12 10.21 6.79 1.15 4.09 4.69 1.28 4.09 -0.63
Netback Singapore Hydrocracking US$/bbl
5.41 7.53 6.59 6.01 5.38 5.94 5.35 3.83 2.86 6.13 1.14 1.07
Brent crude US$/bbl 50.8 52.2 61.5 67.2 75.0 75.8 68.6 63.8 68.5 62.0 62.42 49.22
Source: Nirmal Bang Institutional Equities Research
Capacity rationalization plus sweet-sour spreads to boost complex margins in the long term:
We see global operating rates in refining declining to the 70s or even 60s ( as % of capacity) as margins on gasoline and jet fuel have all but collapsed in the US and Europe, although the spreads based on ticker prices don’t suggest the pain. Europe is reported to be particularly vulnerable with utilization at just 68% vs. global average in excess of 80% (led by Asia at 85% and US at 83%), according to a Mackenzie study late last year. (OPEC’s latest report in March puts global refining run rates at over 90% for US and select Asian countries and about 80% for EU)
Exhibit 7: Refinery utilization rates
Source: OPEC March 2020; Note: Includes Japan, china, India , Singapore and South Korea
In s t itu tio n a l E q u it ie s
Oil & Gas Sector 5
Global consultants see room for 3-5mn bpd of refining capacity rationalization led by Europe, although the process could be long and painful. The study also adds that the capacities that close down may not necessarily be that of cost laggards, which could delay the recovery in margins one normally expects from capacity rationalization.
In our view, the industry may see significant capacity closure over the next few years that could set the tone for structural upswing in GRMs, once we put the current global economic recession behind us.
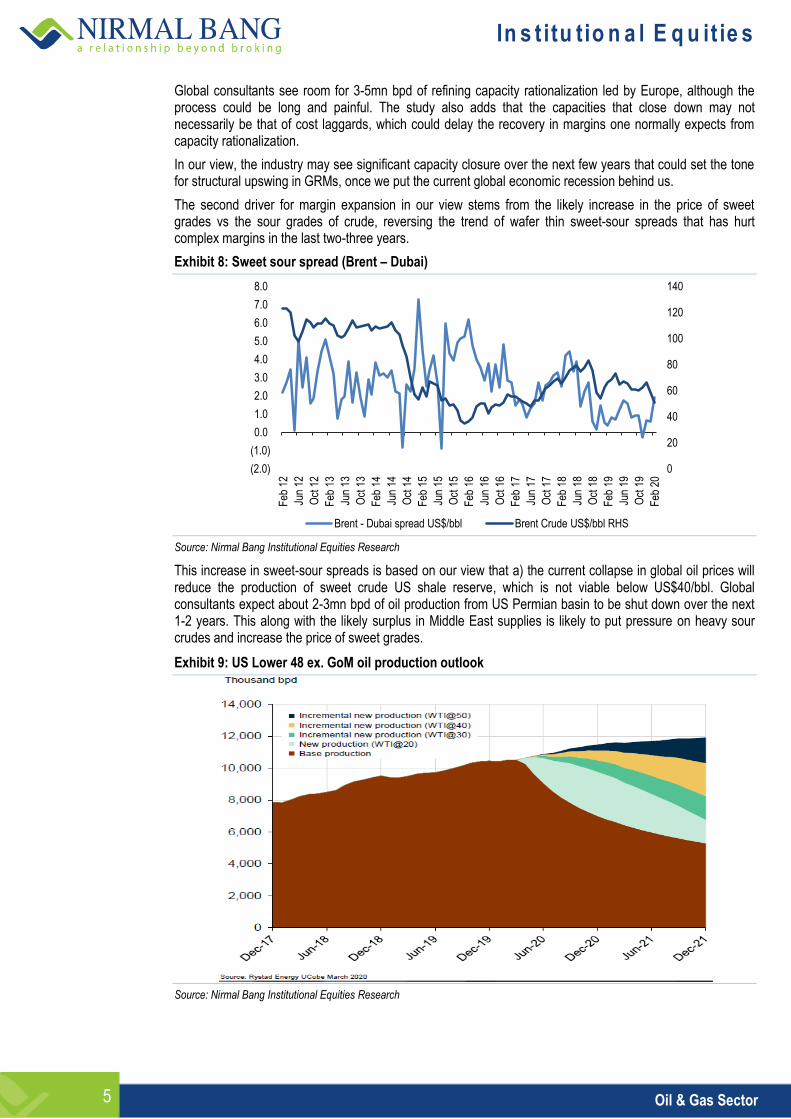
The second driver for margin expansion in our view stems from the likely increase in the price of sweet grades vs the sour grades of crude, reversing the trend of wafer thin sweet-sour spreads that has hurt complex margins in the last two-three years.
Exhibit 8: Sweet sour spread (Brent – Dubai)
Source: Nirmal Bang Institutional Equities Research
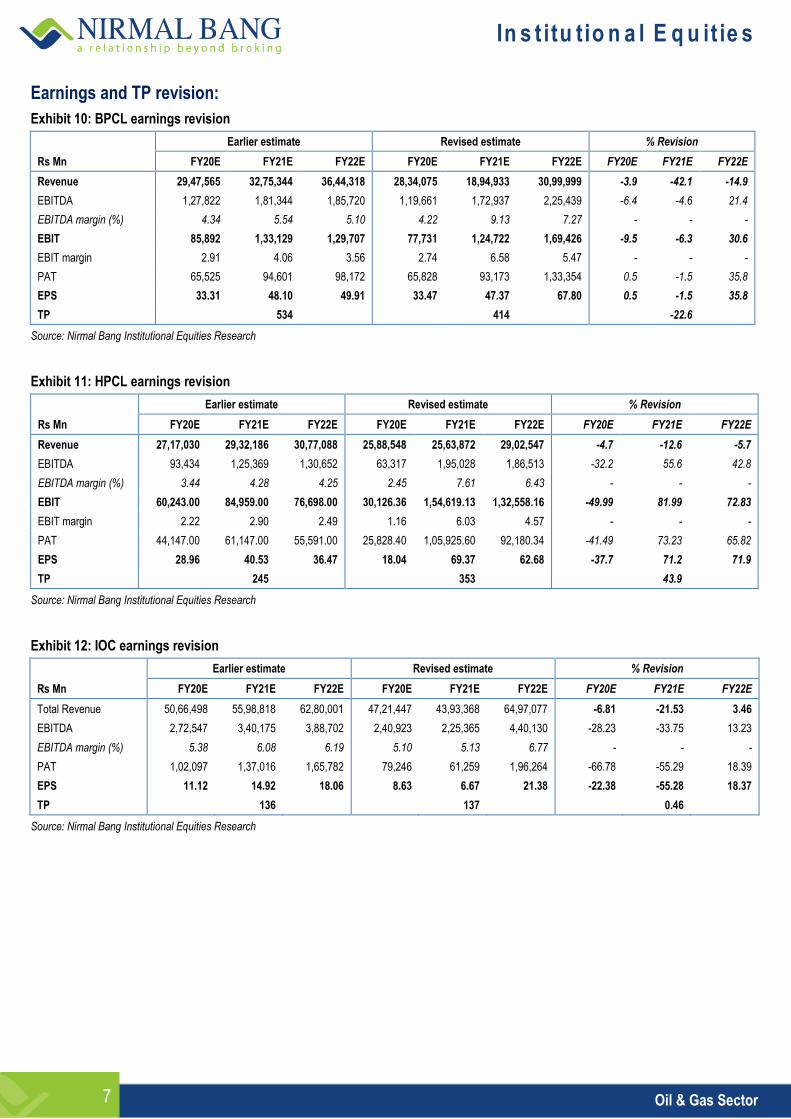
This increase in sweet-sour spreads is based on our view that a) the current collapse in global oil prices will reduce the production of sweet crude US shale reserve, which is not viable below US$40/bbl. Global consultants expect about 2-3mn bpd of oil production from US Permian basin to be shut down over the next 1-2 years. This along with the likely surplus in Middle East supplies is likely to put pressure on heavy sour crudes and increase the price of sweet grades.
Exhibit 9: US Lower 48 ex. GoM oil production outlook
Source: Nirmal Bang Institutional Equities Research
0
20
40
60
80
100
120
140
(2.0)
(1.0)
0.0
1.0
2.0
3.0
4.0
5.0
6.0
7.0
8.0 F
eb 1
2
Jun
12
Oct
12
Feb
13
Jun
13
Oct
13
Feb
14
Jun
14
Oct
14
Feb
15
Jun
15
Oct
15
Feb
16
Jun
16
Oct
16
Feb
17
Jun
17
Oct
17
Feb
18
Jun
18
Oct
18
Feb
19
Jun
19
Oct
19
Feb
20
Brent - Dubai spread US$/bbl Brent Crude US$/bbl RHS

In s t itu tio n a l E q u it ie s
Oil & Gas Sector 6
Demand for light sweet crude is also likely to increase in the next few quarters as refiners focus on reducing the production of high sulphur fuel oil, in line with the IMTO norms mandating lower sulphur emission norms for marine fuel. Admittedly the option of scrubbers enabling ships to use high sulphur fuel oil and the improving crack spreads for fuel oil over crude in the last few months has defeated this argument and in fact led to a perverse situation where simple refiners were better off in 4QCY19 and early this year.
However, eventually once global trade normalizes and the shipping industry settles down we expect a fair share of the marine fuel market moving away from scrubbers and using low sulphur bunker oil or VLSFO.
This transition may take two to three years and will eventually lead to the sweet-sour spread improving by US$2-3/bbl that should swing the tide in favour of complex refiners, including Indian OMCs.
These structural factors could take time to play out and depends on many imponderables, including the movement in oil prices over the next one year and the strategy adopted by OPEC plus on their production.
In s t itu tio n a l E q u it ie s
Oil & Gas Sector 7
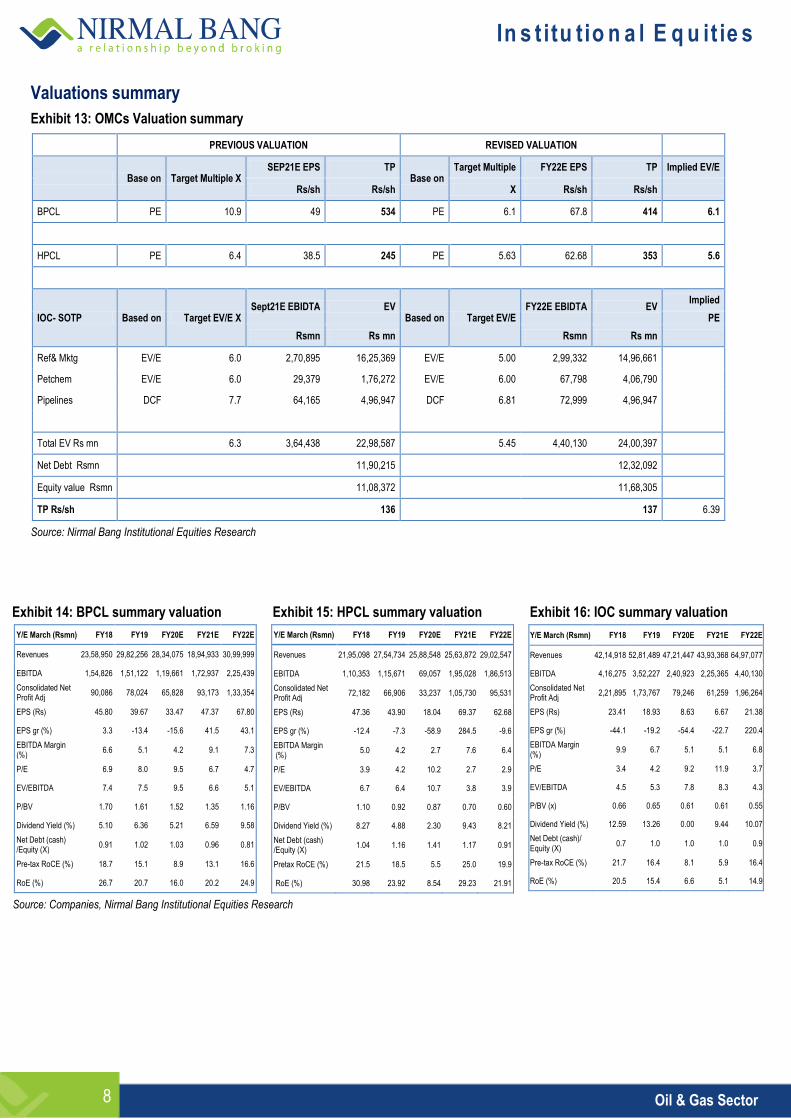
Earnings and TP revision:
Exhibit 10: BPCL earnings revision
Earlier estimate Revised estimate % Revision
Rs Mn FY20E FY21E FY22E FY20E FY21E FY22E FY20E FY21E FY22E
Revenue 29,47,565 32,75,344 36,44,318 28,34,075 18,94,933 30,99,999 -3.9 -42.1 -14.9
EBITDA 1,27,822 1,81,344 1,85,720 1,19,661 1,72,937 2,25,439 -6.4 -4.6 21.4
EBITDA margin (%) 4.34 5.54 5.10 4.22 9.13 7.27 - - -
EBIT 85,892 1,33,129 1,29,707 77,731 1,24,722 1,69,426 -9.5 -6.3 30.6
EBIT margin 2.91 4.06 3.56 2.74 6.58 5.47 - - -
PAT 65,525 94,601 98,172 65,828 93,173 1,33,354 0.5 -1.5 35.8
EPS 33.31 48.10 49.91 33.47 47.37 67.80 0.5 -1.5 35.8
TP
534
414
-22.6
Source: Nirmal Bang Institutional Equities Research
Exhibit 11: HPCL earnings revision
Earlier estimate Revised estimate % Revision
Rs Mn FY20E FY21E FY22E FY20E FY21E FY22E FY20E FY21E FY22E
Revenue 27,17,030 29,32,186 30,77,088 25,88,548 25,63,872 29,02,547 -4.7 -12.6 -5.7
EBITDA 93,434 1,25,369 1,30,652 63,317 1,95,028 1,86,513 -32.2 55.6 42.8
EBITDA margin (%) 3.44 4.28 4.25 2.45 7.61 6.43 - - -
EBIT 60,243.00 84,959.00 76,698.00 30,126.36 1,54,619.13 1,32,558.16 -49.99 81.99 72.83
EBIT margin 2.22 2.90 2.49 1.16 6.03 4.57 - - -
PAT 44,147.00 61,147.00 55,591.00 25,828.40 1,05,925.60 92,180.34 -41.49 73.23 65.82
EPS 28.96 40.53 36.47 18.04 69.37 62.68 -37.7 71.2 71.9
TP
245
353
43.9
Source: Nirmal Bang Institutional Equities Research
Exhibit 12: IOC earnings revision
Earlier estimate Revised estimate % Revision
Rs Mn FY20E FY21E FY22E FY20E FY21E FY22E FY20E FY21E FY22E
Total Revenue 50,66,498 55,98,818 62,80,001 47,21,447 43,93,368 64,97,077 -6.81 -21.53 3.46
EBITDA 2,72,547 3,40,175 3,88,702 2,40,923 2,25,365 4,40,130 -28.23 -33.75 13.23
EBITDA margin (%) 5.38 6.08 6.19 5.10 5.13 6.77 - - -
PAT 1,02,097 1,37,016 1,65,782 79,246 61,259 1,96,264 -66.78 -55.29 18.39
EPS 11.12 14.92 18.06 8.63 6.67 21.38 -22.38 -55.28 18.37
TP
136
137
0.46
Source: Nirmal Bang Institutional Equities Research
In s t itu tio n a l E q u it ie s
Oil & Gas Sector 8
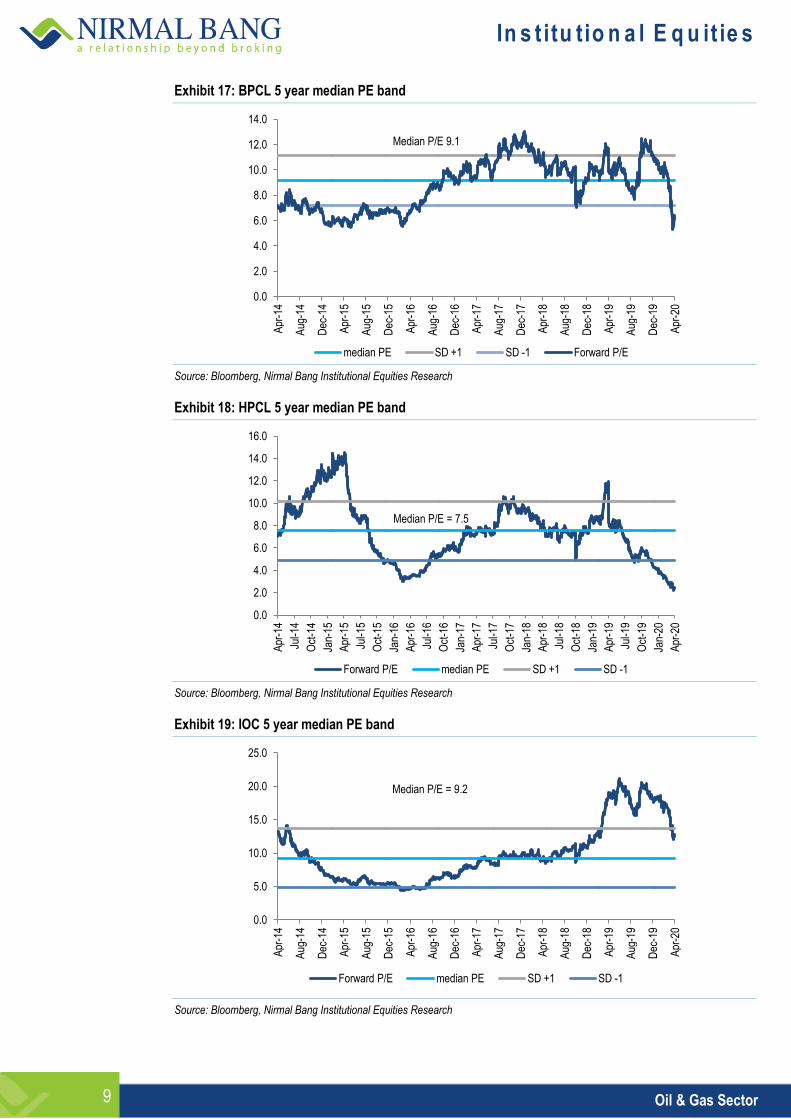
Valuations summary
Exhibit 13: OMCs Valuation summary
PREVIOUS VALUATION REVISED VALUATION
Base on Target Multiple X SEP21E EPS TP
Base on Target Multiple FY22E EPS TP Implied EV/E
Rs/sh Rs/sh X Rs/sh Rs/sh
BPCL PE 10.9 49 534 PE 6.1 67.8 414 6.1
HPCL PE 6.4 38.5 245 PE 5.63 62.68 353 5.6
IOC- SOTP Based on Target EV/E X Sept21E EBIDTA EV
Based on Target EV/E FY22E EBIDTA EV
Implied
PE
Rsmn Rs mn Rsmn Rs mn
Ref& Mktg EV/E 6.0 2,70,895 16,25,369 EV/E 5.00 2,99,332 14,96,661
Petchem EV/E 6.0 29,379 1,76,272 EV/E 6.00 67,798 4,06,790
Pipelines DCF 7.7 64,165 4,96,947 DCF 6.81 72,999 4,96,947
Total EV Rs mn 6.3 3,64,438 22,98,587 5.45 4,40,130 24,00,397
Net Debt Rsmn
11,90,215
12,32,092
Equity value Rsmn 11,08,372 11,68,305
TP Rs/sh 136 137 6.39
Source: Nirmal Bang Institutional Equities Research
Exhibit 14: BPCL summary valuation Exhibit 15: HPCL summary valuation Exhibit 16: IOC summary valuation
Y/E March (Rsmn) FY18 FY19 FY20E FY21E FY22E
Revenues 23,58,950 29,82,256 28,34,075 18,94,933 30,99,999
EBITDA 1,54,826 1,51,122 1,19,661 1,72,937 2,25,439
Consolidated Net Profit Adj
90,086 78,024 65,828 93,173 1,33,354
EPS (Rs) 45.80 39.67 33.47 47.37 67.80
EPS gr (%) 3.3 -13.4 -15.6 41.5 43.1
EBITDA Margin (%)
6.6 5.1 4.2 9.1 7.3
P/E 6.9 8.0 9.5 6.7 4.7
EV/EBITDA 7.4 7.5 9.5 6.6 5.1
P/BV 1.70 1.61 1.52 1.35 1.16
Dividend Yield (%) 5.10 6.36 5.21 6.59 9.58
Net Debt (cash) /Equity (X)
0.91 1.02 1.03 0.96 0.81
Pre-tax RoCE (%) 18.7 15.1 8.9 13.1 16.6
RoE (%) 26.7 20.7 16.0 20.2 24.9
Y/E March (Rsmn) FY18 FY19 FY20E FY21E FY22E
Revenues 21,95,098 27,54,734 25,88,548 25,63,872 29,02,547
EBITDA 1,10,353 1,15,671 69,057 1,95,028 1,86,513
Consolidated Net Profit Adj
72,182 66,906 33,237 1,05,730 95,531
EPS (Rs) 47.36 43.90 18.04 69.37 62.68
EPS gr (%) -12.4 -7.3 -58.9 284.5 -9.6
EBITDA Margin (%)
5.0 4.2 2.7 7.6 6.4
P/E 3.9 4.2 10.2 2.7 2.9
EV/EBITDA 6.7 6.4 10.7 3.8 3.9
P/BV 1.10 0.92 0.87 0.70 0.60
Dividend Yield (%) 8.27 4.88 2.30 9.43 8.21
Net Debt (cash) /Equity (X)
1.04 1.16 1.41 1.17 0.91
Pretax RoCE (%) 21.5 18.5 5.5 25.0 19.9
RoE (%) 30.98 23.92 8.54 29.23 21.91
Y/E March (Rsmn) FY18 FY19 FY20E FY21E FY22E
Revenues 42,14,918 52,81,489 47,21,447 43,93,368 64,97,077
EBITDA 4,16,275 3,52,227 2,40,923 2,25,365 4,40,130
Consolidated Net Profit Adj
2,21,895 1,73,767 79,246 61,259 1,96,264
EPS (Rs) 23.41 18.93 8.63 6.67 21.38
EPS gr (%) -44.1 -19.2 -54.4 -22.7 220.4
EBITDA Margin (%)
9.9 6.7 5.1 5.1 6.8
P/E 3.4 4.2 9.2 11.9 3.7
EV/EBITDA 4.5 5.3 7.8 8.3 4.3
P/BV (x) 0.66 0.65 0.61 0.61 0.55
Dividend Yield (%) 12.59 13.26 0.00 9.44 10.07
Net Debt (cash)/ Equity (X)
0.7 1.0 1.0 1.0 0.9
Pre-tax RoCE (%) 21.7 16.4 8.1 5.9 16.4
RoE (%) 20.5 15.4 6.6 5.1 14.9
Source: Companies, Nirmal Bang Institutional Equities Research
In s t itu tio n a l E q u it ie s
Oil & Gas Sector 9
Exhibit 17: BPCL 5 year median PE band
Source: Bloomberg, Nirmal Bang Institutional Equities Research
Exhibit 18: HPCL 5 year median PE band
Source: Bloomberg, Nirmal Bang Institutional Equities Research
Exhibit 19: IOC 5 year median PE band
Source: Bloomberg, Nirmal Bang Institutional Equities Research
0.0
2.0
4.0
6.0
8.0
10.0
12.0
14.0
Apr
-14
Aug
-14
Dec
-14
Apr
-15
Aug
-15
Dec
-15
Apr
-16
Aug
-16
Dec
-16
Apr
-17
Aug
-17
Dec
-17
Apr
-18
Aug
-18
Dec
-18
Apr
-19
Aug
-19
Dec
-19
Apr
-20
median PE SD +1 SD -1 Forward P/E
Median P/E 9.1
0.0
2.0
4.0
6.0
8.0
10.0
12.0
14.0
16.0
Apr
-14
Jul-1
4
Oct
-14
Jan-
15
Apr
-15
Jul-1
5
Oct
-15
Jan-
16
Apr
-16
Jul-1
6
Oct
-16
Jan-
17
Apr
-17
Jul-1
7
Oct
-17
Jan-
18
Apr
-18
Jul-1
8
Oct
-18
Jan-
19
Apr
-19
Jul-1
9
Oct
-19
Jan-
20
Apr
-20
Forward P/E median PE SD +1 SD -1
Median P/E = 7.5
0.0
5.0
10.0
15.0
20.0
25.0
Apr
-14
Aug
-14
Dec
-14
Apr
-15
Aug
-15
Dec
-15
Apr
-16
Aug
-16
Dec
-16
Apr
-17
Aug
-17
Dec
-17
Apr
-18
Aug
-18
Dec
-18
Apr
-19
Aug
-19
Dec
-19
Apr
-20
Forward P/E median PE SD +1 SD -1
Median P/E = 9.2
In s t itu tio n a l E q u it ie s
Oil & Gas Sector 10
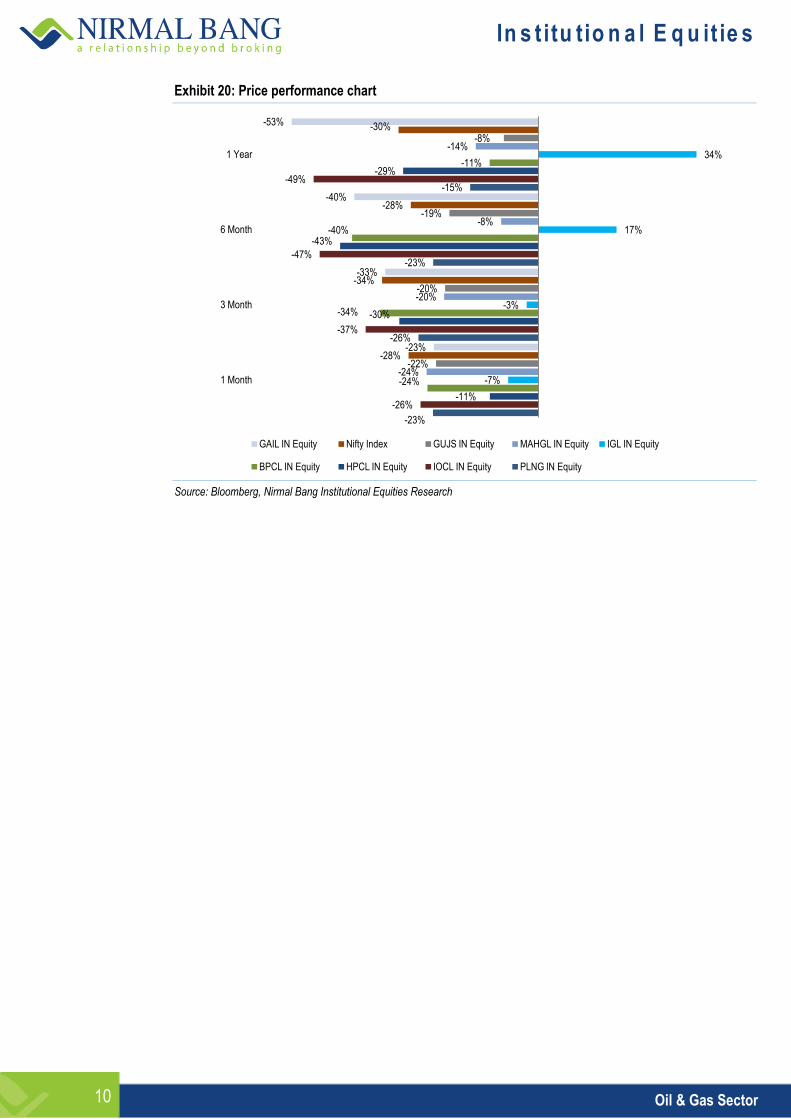
Exhibit 20: Price performance chart
Source: Bloomberg, Nirmal Bang Institutional Equities Research
-23%
-26%
-23%
-15%
-26%
-37%
-47%
-49%
-11%
-30%
-43%
-29%
-24%
-34%
-40%
-11%
-7%
-3%
17%
34%
-24%
-20%
-8%
-14%
-22%
-20%
-19%
-8%
-28%
-34%
-28%
-30%
-23%
-33%
-40%
-53%
1 Month
3 Month
6 Month
1 Year
GAIL IN Equity Nifty Index GUJS IN Equity MAHGL IN Equity IGL IN Equity
BPCL IN Equity HPCL IN Equity IOCL IN Equity PLNG IN Equity
In s t itu tio n a l E q u it ie s
Oil & Gas Sector 11
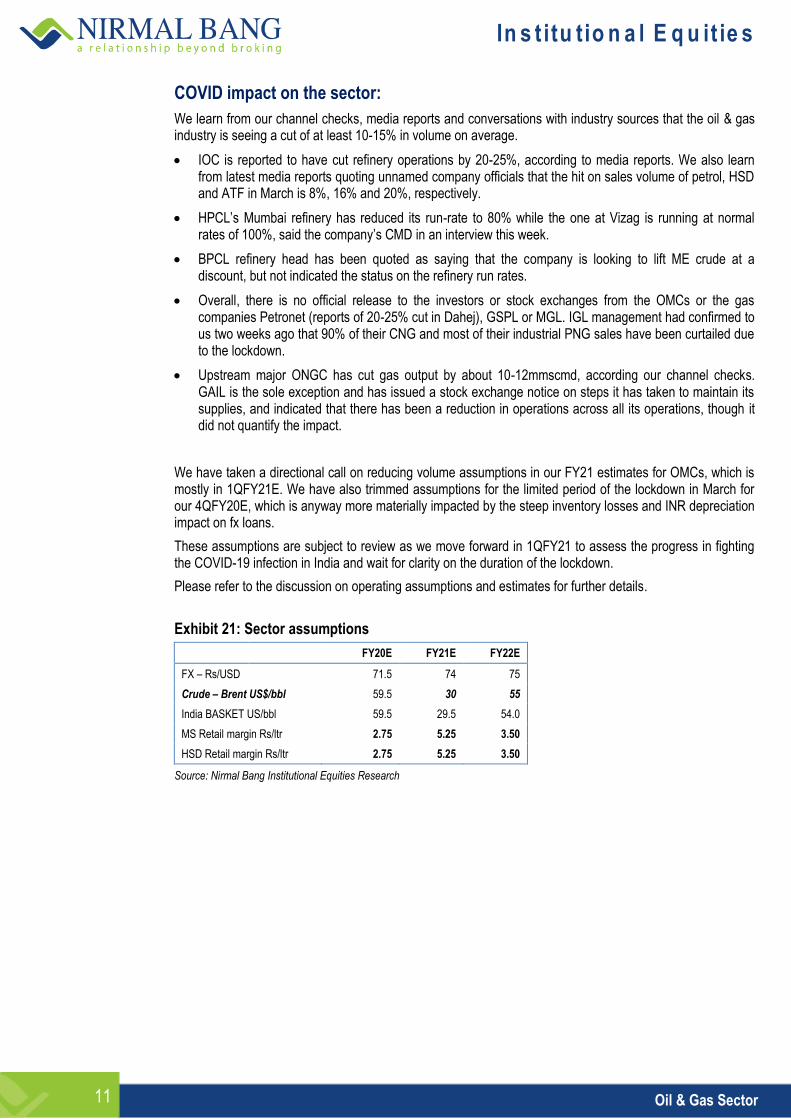
COVID impact on the sector:
We learn from our channel checks, media reports and conversations with industry sources that the oil & gas industry is seeing a cut of at least 10-15% in volume on average.
IOC is reported to have cut refinery operations by 20-25%, according to media reports. We also learn from latest media reports quoting unnamed company officials that the hit on sales volume of petrol, HSD and ATF in March is 8%, 16% and 20%, respectively.
HPCL’s Mumbai refinery has reduced its run-rate to 80% while the one at Vizag is running at normal rates of 100%, said the company’s CMD in an interview this week.
BPCL refinery head has been quoted as saying that the company is looking to lift ME crude at a discount, but not indicated the status on the refinery run rates.
Overall, there is no official release to the investors or stock exchanges from the OMCs or the gas companies Petronet (reports of 20-25% cut in Dahej), GSPL or MGL. IGL management had confirmed to us two weeks ago that 90% of their CNG and most of their industrial PNG sales have been curtailed due to the lockdown.
Upstream major ONGC has cut gas output by about 10-12mmscmd, according our channel checks. GAIL is the sole exception and has issued a stock exchange notice on steps it has taken to maintain its supplies, and indicated that there has been a reduction in operations across all its operations, though it did not quantify the impact.
We have taken a directional call on reducing volume assumptions in our FY21 estimates for OMCs, which is mostly in 1QFY21E. We have also trimmed assumptions for the limited period of the lockdown in March for our 4QFY20E, which is anyway more materially impacted by the steep inventory losses and INR depreciation impact on fx loans.
These assumptions are subject to review as we move forward in 1QFY21 to assess the progress in fighting the COVID-19 infection in India and wait for clarity on the duration of the lockdown.
Please refer to the discussion on operating assumptions and estimates for further details.
Exhibit 21: Sector assumptions
FY20E FY21E FY22E
FX – Rs/USD 71.5 74 75
Crude – Brent US$/bbl 59.5 30 55
India BASKET US/bbl 59.5 29.5 54.0
MS Retail margin Rs/ltr 2.75 5.25 3.50
HSD Retail margin Rs/ltr 2.75 5.25 3.50
Source: Nirmal Bang Institutional Equities Research
In s t itu tio n a l E q u it ie s
Oil & Gas Sector 12
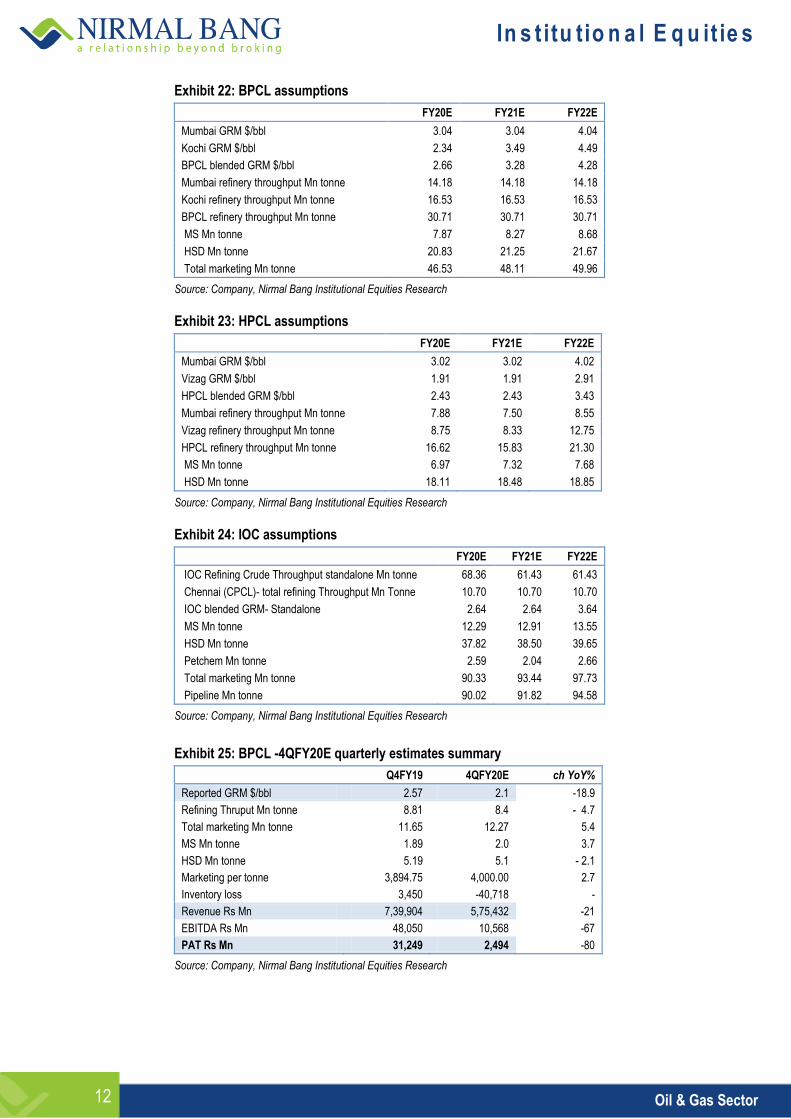
Exhibit 22: BPCL assumptions
FY20E FY21E FY22E
Mumbai GRM $/bbl 3.04 3.04 4.04
Kochi GRM $/bbl 2.34 3.49 4.49
BPCL blended GRM $/bbl 2.66 3.28 4.28
Mumbai refinery throughput Mn tonne 14.18 14.18 14.18
Kochi refinery throughput Mn tonne 16.53 16.53 16.53
BPCL refinery throughput Mn tonne 30.71 30.71 30.71
MS Mn tonne 7.87 8.27 8.68
HSD Mn tonne 20.83 21.25 21.67
Total marketing Mn tonne 46.53 48.11 49.96
Source: Company, Nirmal Bang Institutional Equities Research
Exhibit 23: HPCL assumptions
FY20E FY21E FY22E
Mumbai GRM $/bbl 3.02 3.02 4.02
Vizag GRM $/bbl 1.91 1.91 2.91
HPCL blended GRM $/bbl 2.43 2.43 3.43
Mumbai refinery throughput Mn tonne 7.88 7.50 8.55
Vizag refinery throughput Mn tonne 8.75 8.33 12.75
HPCL refinery throughput Mn tonne 16.62 15.83 21.30
MS Mn tonne 6.97 7.32 7.68
HSD Mn tonne 18.11 18.48 18.85
Source: Company, Nirmal Bang Institutional Equities Research
Exhibit 24: IOC assumptions
FY20E FY21E FY22E
IOC Refining Crude Throughput standalone Mn tonne 68.36 61.43 61.43
Chennai (CPCL)- total refining Throughput Mn Tonne 10.70 10.70 10.70
IOC blended GRM- Standalone 2.64 2.64 3.64
MS Mn tonne 12.29 12.91 13.55
HSD Mn tonne 37.82 38.50 39.65
Petchem Mn tonne 2.59 2.04 2.66
Total marketing Mn tonne 90.33 93.44 97.73
Pipeline Mn tonne 90.02 91.82 94.58
Source: Company, Nirmal Bang Institutional Equities Research
Exhibit 25: BPCL -4QFY20E quarterly estimates summary
Q4FY19 4QFY20E ch YoY%
Reported GRM $/bbl 2.57 2.1 -18.9
Refining Thruput Mn tonne 8.81 8.4 - 4.7
Total marketing Mn tonne 11.65 12.27 5.4
MS Mn tonne 1.89 2.0 3.7
HSD Mn tonne 5.19 5.1 - 2.1
Marketing per tonne 3,894.75 4,000.00 2.7
Inventory loss 3,450 -40,718 -
Revenue Rs Mn 7,39,904 5,75,432 -21
EBITDA Rs Mn 48,050 10,568 -67
PAT Rs Mn 31,249 2,494 -80
Source: Company, Nirmal Bang Institutional Equities Research
In s t itu tio n a l E q u it ie s
Oil & Gas Sector 13
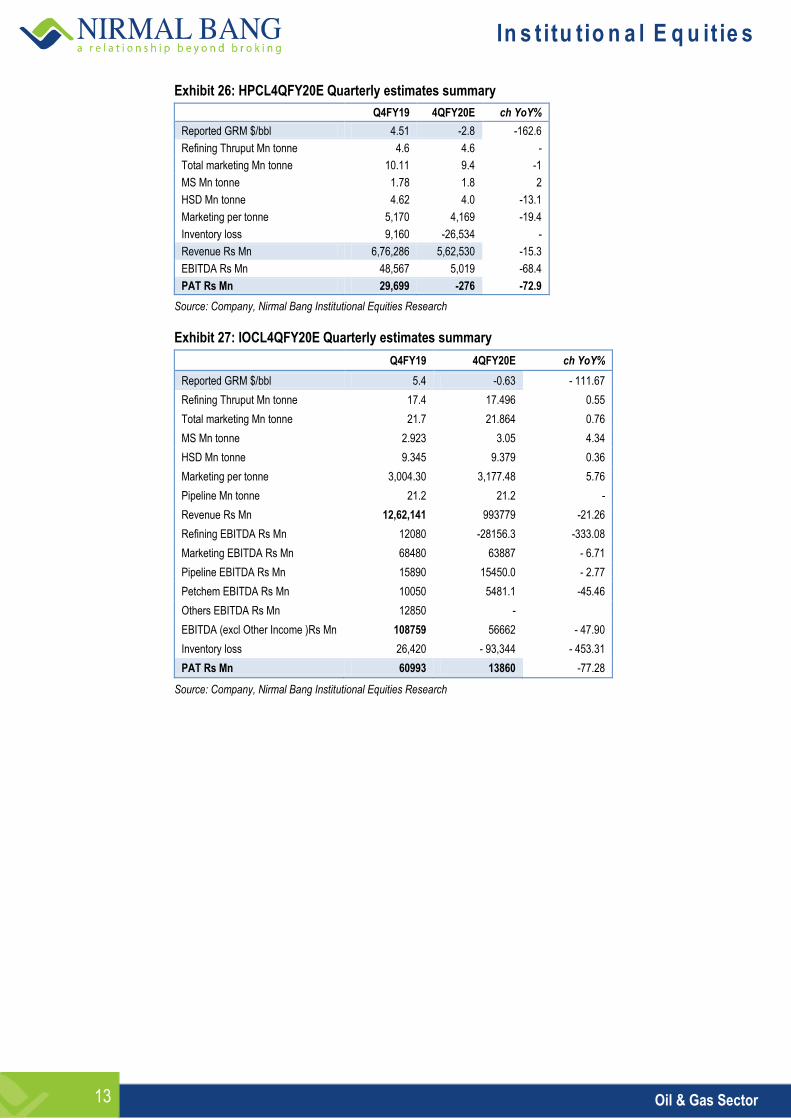
Exhibit 26: HPCL4QFY20E Quarterly estimates summary
Q4FY19 4QFY20E ch YoY%
Reported GRM $/bbl 4.51 -2.8 -162.6
Refining Thruput Mn tonne 4.6 4.6 -
Total marketing Mn tonne 10.11 9.4 -1
MS Mn tonne 1.78 1.8 2
HSD Mn tonne 4.62 4.0 -13.1
Marketing per tonne 5,170 4,169 -19.4
Inventory loss 9,160 -26,534 -
Revenue Rs Mn 6,76,286 5,62,530 -15.3
EBITDA Rs Mn 48,567 5,019 -68.4
PAT Rs Mn 29,699 -276 -72.9
Source: Company, Nirmal Bang Institutional Equities Research
Exhibit 27: IOCL4QFY20E Quarterly estimates summary
Q4FY19 4QFY20E ch YoY%
Reported GRM $/bbl 5.4 -0.63 - 111.67
Refining Thruput Mn tonne 17.4 17.496 0.55
Total marketing Mn tonne 21.7 21.864 0.76
MS Mn tonne 2.923 3.05 4.34
HSD Mn tonne 9.345 9.379 0.36
Marketing per tonne 3,004.30 3,177.48 5.76
Pipeline Mn tonne 21.2 21.2 -
Revenue Rs Mn 12,62,141 993779 -21.26
Refining EBITDA Rs Mn 12080 -28156.3 -333.08
Marketing EBITDA Rs Mn 68480 63887 - 6.71
Pipeline EBITDA Rs Mn 15890 15450.0 - 2.77
Petchem EBITDA Rs Mn 10050 5481.1 -45.46
Others EBITDA Rs Mn 12850 -
EBITDA (excl Other Income )Rs Mn 108759 56662 - 47.90
Inventory loss 26,420 - 93,344 - 453.31
PAT Rs Mn 60993 13860 -77.28
Source: Company, Nirmal Bang Institutional Equities Research
In s t itu tio n a l E q u it ie s
Oil & Gas Sector 14
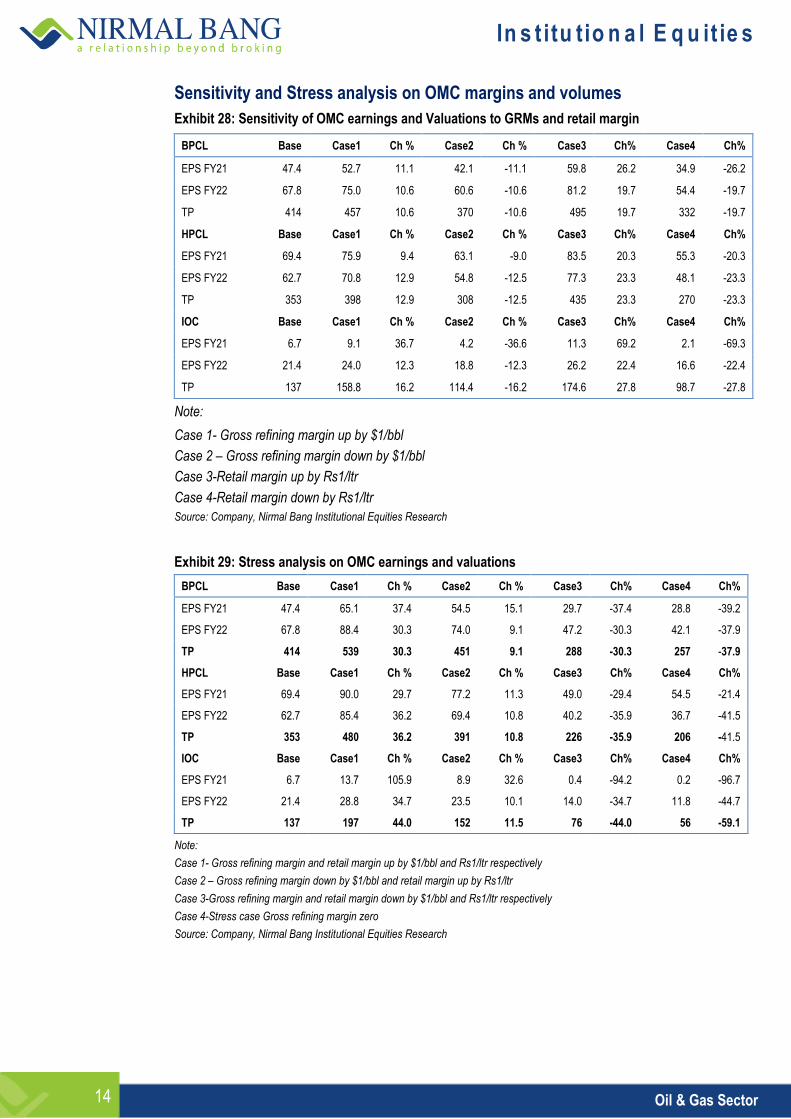
Sensitivity and Stress analysis on OMC margins and volumes
Exhibit 28: Sensitivity of OMC earnings and Valuations to GRMs and retail margin
BPCL Base Case1 Ch % Case2 Ch % Case3 Ch% Case4 Ch%
EPS FY21 47.4 52.7 11.1 42.1 -11.1 59.8 26.2 34.9 -26.2
EPS FY22 67.8 75.0 10.6 60.6 -10.6 81.2 19.7 54.4 -19.7
TP 414 457 10.6 370 -10.6 495 19.7 332 -19.7
HPCL Base Case1 Ch % Case2 Ch % Case3 Ch% Case4 Ch%
EPS FY21 69.4 75.9 9.4 63.1 -9.0 83.5 20.3 55.3 -20.3
EPS FY22 62.7 70.8 12.9 54.8 -12.5 77.3 23.3 48.1 -23.3
TP 353 398 12.9 308 -12.5 435 23.3 270 -23.3
IOC Base Case1 Ch % Case2 Ch % Case3 Ch% Case4 Ch%
EPS FY21 6.7 9.1 36.7 4.2 -36.6 11.3 69.2 2.1 -69.3
EPS FY22 21.4 24.0 12.3 18.8 -12.3 26.2 22.4 16.6 -22.4
TP 137 158.8 16.2 114.4 -16.2 174.6 27.8 98.7 -27.8
Note:
Case 1- Gross refining margin up by $1/bbl
Case 2 – Gross refining margin down by $1/bbl
Case 3-Retail margin up by Rs1/ltr
Case 4-Retail margin down by Rs1/ltr
Source: Company, Nirmal Bang Institutional Equities Research
Exhibit 29: Stress analysis on OMC earnings and valuations
BPCL Base Case1 Ch % Case2 Ch % Case3 Ch% Case4 Ch%
EPS FY21 47.4 65.1 37.4 54.5 15.1 29.7 -37.4 28.8 -39.2
EPS FY22 67.8 88.4 30.3 74.0 9.1 47.2 -30.3 42.1 -37.9
TP 414 539 30.3 451 9.1 288 -30.3 257 -37.9
HPCL Base Case1 Ch % Case2 Ch % Case3 Ch% Case4 Ch%
EPS FY21 69.4 90.0 29.7 77.2 11.3 49.0 -29.4 54.5 -21.4
EPS FY22 62.7 85.4 36.2 69.4 10.8 40.2 -35.9 36.7 -41.5
TP 353 480 36.2 391 10.8 226 -35.9 206 -41.5
IOC Base Case1 Ch % Case2 Ch % Case3 Ch% Case4 Ch%
EPS FY21 6.7 13.7 105.9 8.9 32.6 0.4 -94.2 0.2 -96.7
EPS FY22 21.4 28.8 34.7 23.5 10.1 14.0 -34.7 11.8 -44.7
TP 137 197 44.0 152 11.5 76 -44.0 56 -59.1
Note:
Case 1- Gross refining margin and retail margin up by $1/bbl and Rs1/ltr respectively
Case 2 – Gross refining margin down by $1/bbl and retail margin up by Rs1/ltr
Case 3-Gross refining margin and retail margin down by $1/bbl and Rs1/ltr respectively
Case 4-Stress case Gross refining margin zero
Source: Company, Nirmal Bang Institutional Equities Research
In s t itu tio n a l E q u it ie s
Oil & Gas Sector 15
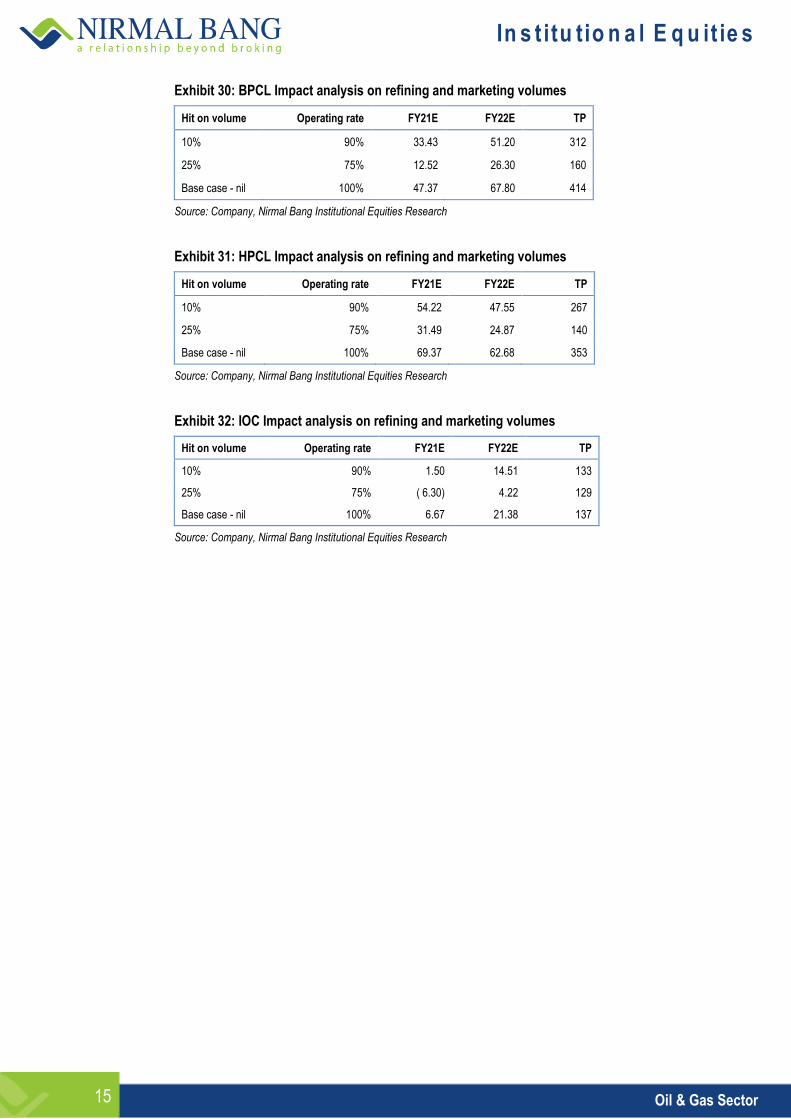
Exhibit 30: BPCL Impact analysis on refining and marketing volumes
Hit on volume Operating rate FY21E FY22E TP
10% 90% 33.43 51.20 312
25% 75% 12.52 26.30 160
Base case - nil 100% 47.37 67.80 414
Source: Company, Nirmal Bang Institutional Equities Research
Exhibit 31: HPCL Impact analysis on refining and marketing volumes
Hit on volume Operating rate FY21E FY22E TP
10% 90% 54.22 47.55 267
25% 75% 31.49 24.87 140
Base case - nil 100% 69.37 62.68 353
Source: Company, Nirmal Bang Institutional Equities Research
Exhibit 32: IOC Impact analysis on refining and marketing volumes
Hit on volume Operating rate FY21E FY22E TP
10% 90% 1.50 14.51 133
25% 75% ( 6.30) 4.22 129
Base case - nil 100% 6.67 21.38 137
Source: Company, Nirmal Bang Institutional Equities Research
In s t itu tio n a l E q u it ie s
Oil & Gas Sector 16
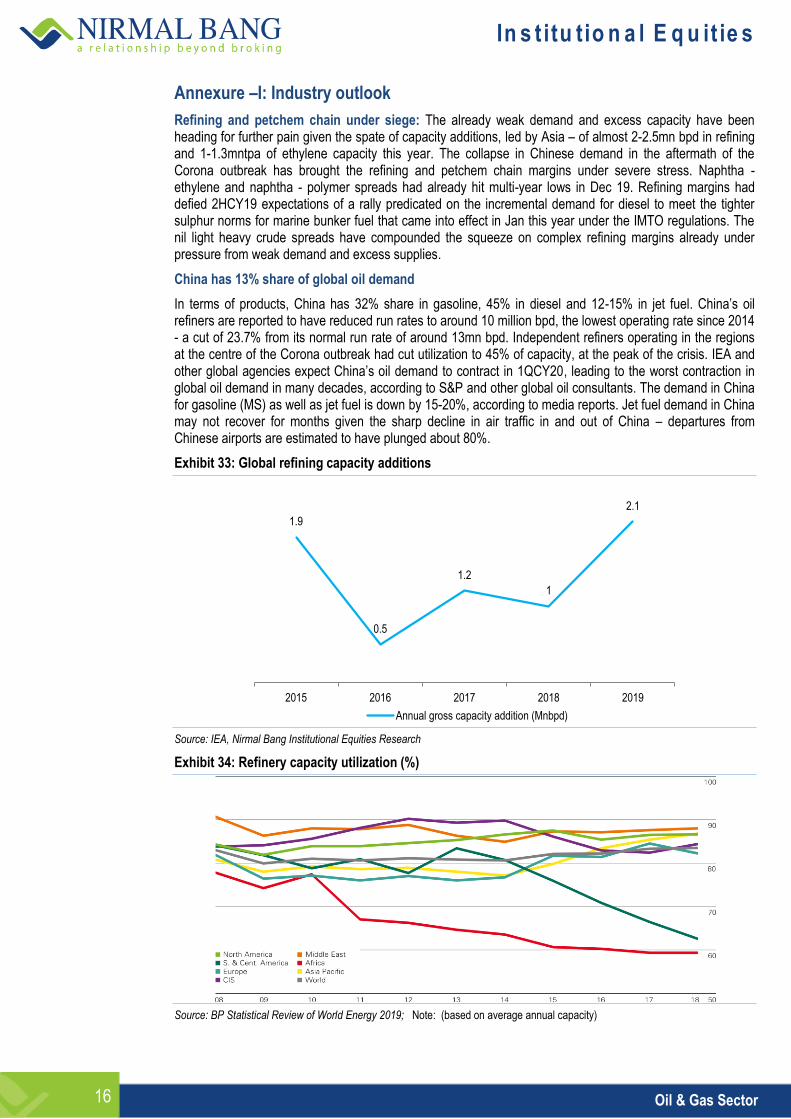
Annexure –I: Industry outlook
Refining and petchem chain under siege: The already weak demand and excess capacity have been heading for further pain given the spate of capacity additions, led by Asia – of almost 2-2.5mn bpd in refining and 1-1.3mntpa of ethylene capacity this year. The collapse in Chinese demand in the aftermath of the Corona outbreak has brought the refining and petchem chain margins under severe stress. Naphtha - ethylene and naphtha - polymer spreads had already hit multi-year lows in Dec 19. Refining margins had defied 2HCY19 expectations of a rally predicated on the incremental demand for diesel to meet the tighter sulphur norms for marine bunker fuel that came into effect in Jan this year under the IMTO regulations. The nil light heavy crude spreads have compounded the squeeze on complex refining margins already under pressure from weak demand and excess supplies.
China has 13% share of global oil demand
In terms of products, China has 32% share in gasoline, 45% in diesel and 12-15% in jet fuel. China’s oil refiners are reported to have reduced run rates to around 10 million bpd, the lowest operating rate since 2014 - a cut of 23.7% from its normal run rate of around 13mn bpd. Independent refiners operating in the regions at the centre of the Corona outbreak had cut utilization to 45% of capacity, at the peak of the crisis. IEA and other global agencies expect China’s oil demand to contract in 1QCY20, leading to the worst contraction in global oil demand in many decades, according to S&P and other global oil consultants. The demand in China for gasoline (MS) as well as jet fuel is down by 15-20%, according to media reports. Jet fuel demand in China may not recover for months given the sharp decline in air traffic in and out of China – departures from Chinese airports are estimated to have plunged about 80%.
Exhibit 33: Global refining capacity additions
Source: IEA, Nirmal Bang Institutional Equities Research
Exhibit 34: Refinery capacity utilization (%)
Source: BP Statistical Review of World Energy 2019; Note: (based on average annual capacity)
1.9
0.5
1.2
1
2.1
2015 2016 2017 2018 2019
Annual gross capacity addition (Mnbpd)
In s t itu tio n a l E q u it ie s
Oil & Gas Sector 17
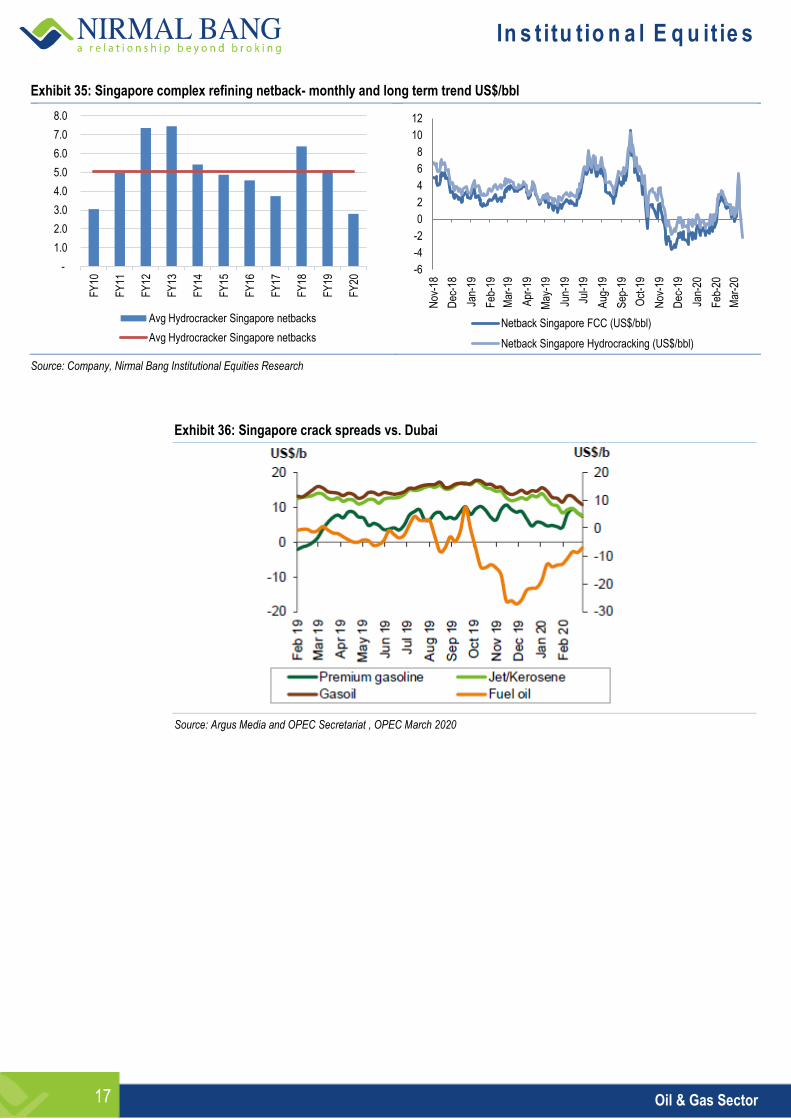
Exhibit 35: Singapore complex refining netback- monthly and long term trend US$/bbl
Source: Company, Nirmal Bang Institutional Equities Research
Exhibit 36: Singapore crack spreads vs. Dubai
Source: Argus Media and OPEC Secretariat , OPEC March 2020
-
1.0
2.0
3.0
4.0
5.0
6.0
7.0
8.0
FY
10
FY
11
FY
12
FY
13
FY
14
FY
15
FY
16
FY
17
FY
18
FY
19
FY
20
Avg Hydrocracker Singapore netbacks
Avg Hydrocracker Singapore netbacks
-6
-4
-2
0
2
4
6
8
10
12
Nov
-18
Dec
-18
Jan-
19
Feb
-19
Mar
-19
Apr
-19
May
-19
Jun-
19
Jul-1
9
Aug
-19
Sep
-19
Oct
-19
Nov
-19
Dec
-19
Jan-
20
Feb
-20
Mar
-20
Netback Singapore FCC (US$/bbl)
Netback Singapore Hydrocracking (US$/bbl)
In s t itu tio n a l E q u it ie s
Oil & Gas Sector 18
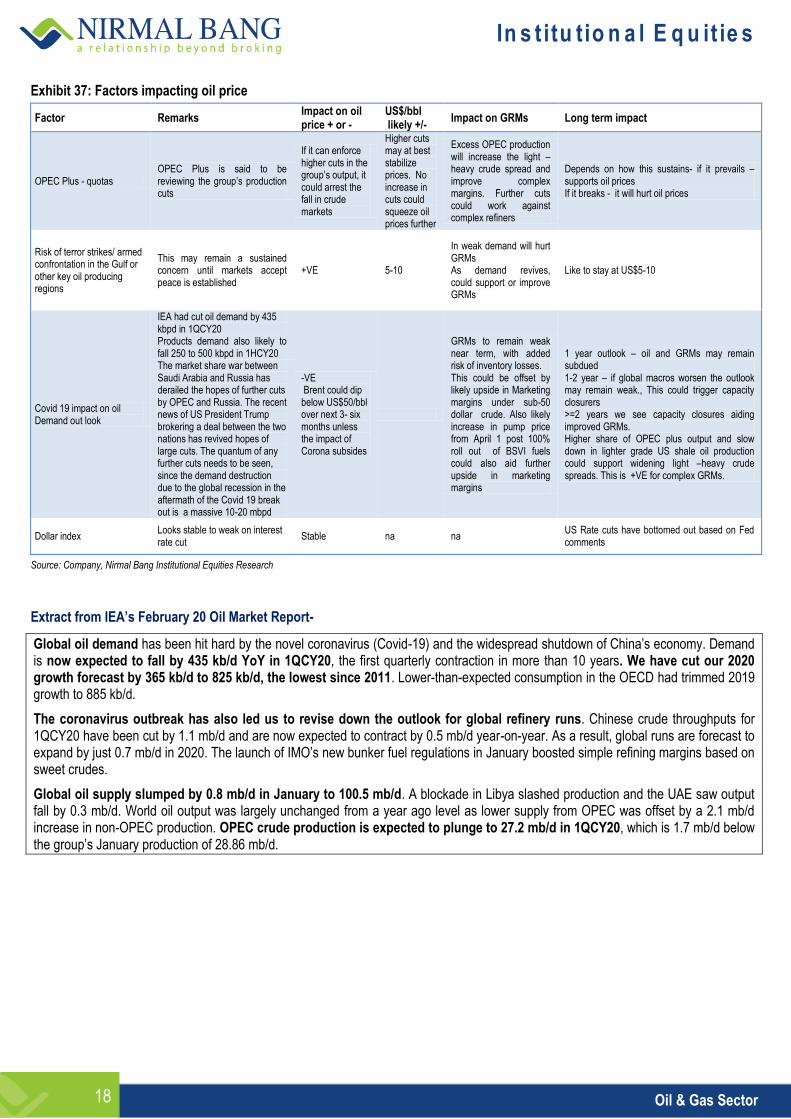
Exhibit 37: Factors impacting oil price
Factor Remarks Impact on oil price + or -
US$/bbl likely +/-
Impact on GRMs Long term impact
OPEC Plus - quotas OPEC Plus is said to be reviewing the group’s production cuts
If it can enforce higher cuts in the group’s output, it could arrest the fall in crude markets
Higher cuts may at best stabilize prices. No increase in cuts could squeeze oil prices further
Excess OPEC production will increase the light –heavy crude spread and improve complex margins. Further cuts could work against complex refiners
Depends on how this sustains- if it prevails – supports oil prices If it breaks - it will hurt oil prices
Risk of terror strikes/ armed confrontation in the Gulf or other key oil producing regions
This may remain a sustained concern until markets accept peace is established
+VE 5-10
In weak demand will hurt GRMs As demand revives, could support or improve GRMs
Like to stay at US$5-10
Covid 19 impact on oil Demand out look
IEA had cut oil demand by 435 kbpd in 1QCY20 Products demand also likely to fall 250 to 500 kbpd in 1HCY20
-VE Brent could dip below US$50/bbl over next 3- six months unless the impact of Corona subsides
GRMs to remain weak near term, with added risk of inventory losses. This could be offset by likely upside in Marketing margins under sub-50 dollar crude. Also likely increase in pump price from April 1 post 100% roll out of BSVI fuels could also aid further upside in marketing margins
1 year outlook – oil and GRMs may remain subdued 1-2 year – if global macros worsen the outlook may remain weak., This could trigger capacity closurers >=2 years we see capacity closures aiding improved GRMs. Higher share of OPEC plus output and slow down in lighter grade US shale oil production could support widening light –heavy crude spreads. This is +VE for complex GRMs.
The market share war between Saudi Arabia and Russia has derailed the hopes of further cuts by OPEC and Russia. The recent news of US President Trump brokering a deal between the two nations has revived hopes of large cuts. The quantum of any further cuts needs to be seen, since the demand destruction due to the global recession in the aftermath of the Covid 19 break out is a massive 10-20 mbpd
Dollar index Looks stable to weak on interest rate cut
Stable na na US Rate cuts have bottomed out based on Fed comments
Source: Company, Nirmal Bang Institutional Equities Research
Extract from IEA’s February 20 Oil Market Report-
Global oil demand has been hit hard by the novel coronavirus (Covid-19) and the widespread shutdown of China’s economy. Demand is now expected to fall by 435 kb/d YoY in 1QCY20, the first quarterly contraction in more than 10 years. We have cut our 2020 growth forecast by 365 kb/d to 825 kb/d, the lowest since 2011. Lower-than-expected consumption in the OECD had trimmed 2019 growth to 885 kb/d.
The coronavirus outbreak has also led us to revise down the outlook for global refinery runs. Chinese crude throughputs for 1QCY20 have been cut by 1.1 mb/d and are now expected to contract by 0.5 mb/d year-on-year. As a result, global runs are forecast to expand by just 0.7 mb/d in 2020. The launch of IMO’s new bunker fuel regulations in January boosted simple refining margins based on sweet crudes.
Global oil supply slumped by 0.8 mb/d in January to 100.5 mb/d. A blockade in Libya slashed production and the UAE saw output fall by 0.3 mb/d. World oil output was largely unchanged from a year ago level as lower supply from OPEC was offset by a 2.1 mb/d increase in non-OPEC production. OPEC crude production is expected to plunge to 27.2 mb/d in 1QCY20, which is 1.7 mb/d below the group’s January production of 28.86 mb/d.
In s t itu tio n a l E q u it ie s
Oil & Gas Sector 19
Annexure– II: Global refining in charts
Refining capacity
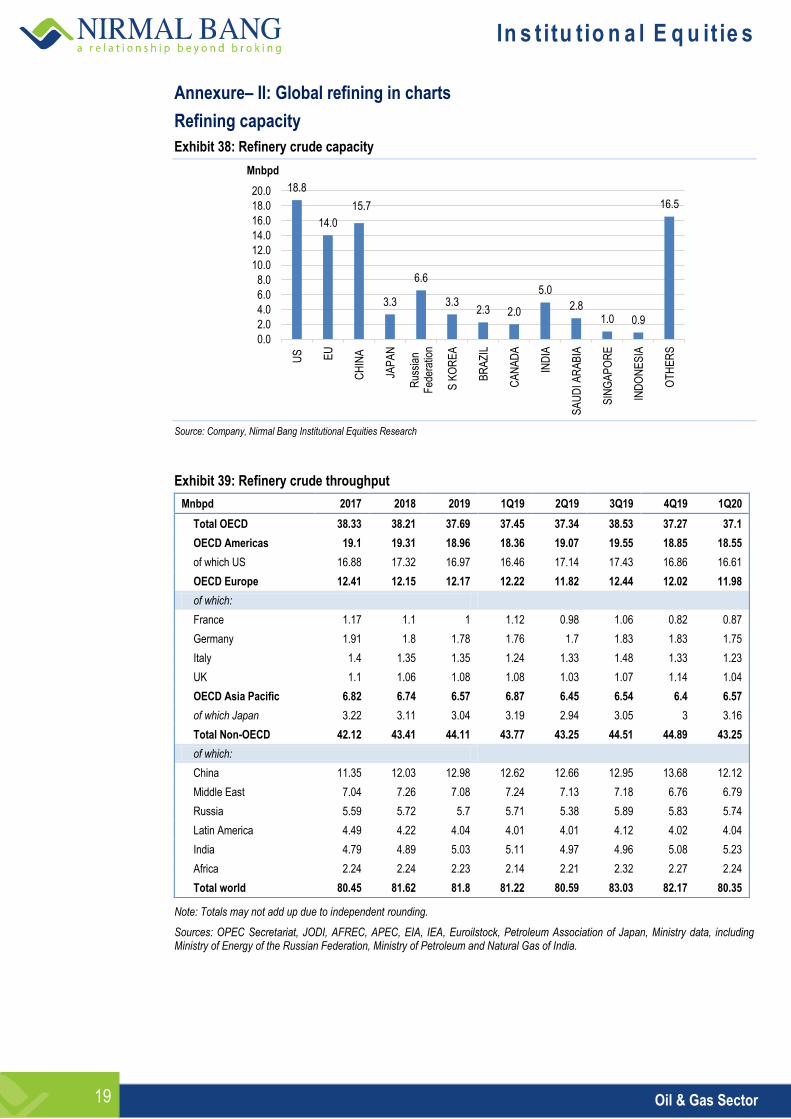
Exhibit 38: Refinery crude capacity
Source: Company, Nirmal Bang Institutional Equities Research
Exhibit 39: Refinery crude throughput
Mnbpd 2017 2018 2019 1Q19 2Q19 3Q19 4Q19 1Q20
Total OECD 38.33 38.21 37.69 37.45 37.34 38.53 37.27 37.1
OECD Americas 19.1 19.31 18.96 18.36 19.07 19.55 18.85 18.55
of which US 16.88 17.32 16.97 16.46 17.14 17.43 16.86 16.61
OECD Europe 12.41 12.15 12.17 12.22 11.82 12.44 12.02 11.98
of which:
France 1.17 1.1 1 1.12 0.98 1.06 0.82 0.87
Germany 1.91 1.8 1.78 1.76 1.7 1.83 1.83 1.75
Italy 1.4 1.35 1.35 1.24 1.33 1.48 1.33 1.23
UK 1.1 1.06 1.08 1.08 1.03 1.07 1.14 1.04
OECD Asia Pacific 6.82 6.74 6.57 6.87 6.45 6.54 6.4 6.57
of which Japan 3.22 3.11 3.04 3.19 2.94 3.05 3 3.16
Total Non-OECD 42.12 43.41 44.11 43.77 43.25 44.51 44.89 43.25
of which:
China 11.35 12.03 12.98 12.62 12.66 12.95 13.68 12.12
Middle East 7.04 7.26 7.08 7.24 7.13 7.18 6.76 6.79
Russia 5.59 5.72 5.7 5.71 5.38 5.89 5.83 5.74
Latin America 4.49 4.22 4.04 4.01 4.01 4.12 4.02 4.04
India 4.79 4.89 5.03 5.11 4.97 4.96 5.08 5.23
Africa 2.24 2.24 2.23 2.14 2.21 2.32 2.27 2.24
Total world 80.45 81.62 81.8 81.22 80.59 83.03 82.17 80.35
Note: Totals may not add up due to independent rounding.
Sources: OPEC Secretariat, JODI, AFREC, APEC, EIA, IEA, Euroilstock, Petroleum Association of Japan, Ministry data, including Ministry of Energy of the Russian Federation, Ministry of Petroleum and Natural Gas of India.
18.8
14.0
15.7
3.3
6.6
3.3 2.3 2.0
5.0
2.8 1.0 0.9
16.5
0.0
2.0
4.0
6.0
8.0
10.0
12.0
14.0
16.0
18.0
20.0
US
EU
CH
INA
JAP
AN
Rus
sian
F
eder
atio
n
S K
OR
EA
BR
AZ
IL
CA
NA
DA
IND
IA
SA
UD
I AR
AB
IA
SIN
GA
PO
RE
IND
ON
ES
IA
OT
HE
RS
Mnbpd
In s t itu tio n a l E q u it ie s
Oil & Gas Sector 20
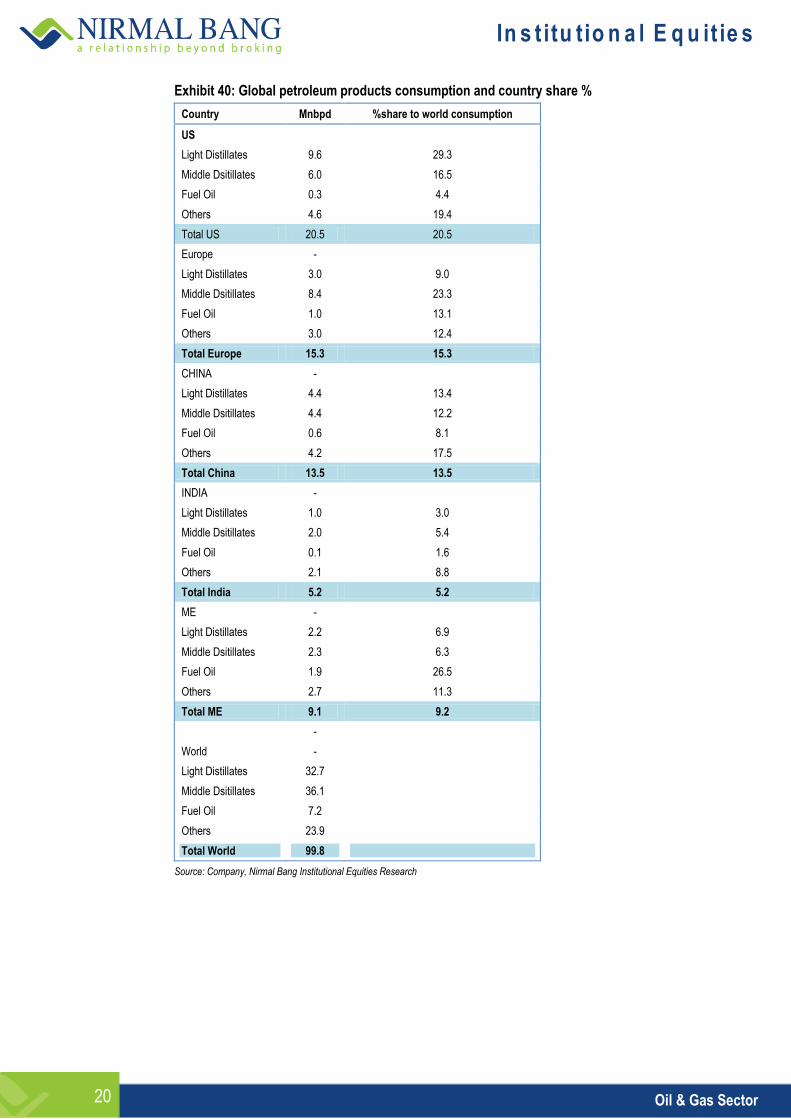
Exhibit 40: Global petroleum products consumption and country share %
Country Mnbpd %share to world consumption
US
Light Distillates 9.6 29.3
Middle Dsitillates 6.0 16.5
Fuel Oil 0.3 4.4
Others 4.6 19.4
Total US 20.5 20.5
Europe -
Light Distillates 3.0 9.0
Middle Dsitillates 8.4 23.3
Fuel Oil 1.0 13.1
Others 3.0 12.4
Total Europe 15.3 15.3
CHINA -
Light Distillates 4.4 13.4
Middle Dsitillates 4.4 12.2
Fuel Oil 0.6 8.1
Others 4.2 17.5
Total China 13.5 13.5
INDIA -
Light Distillates 1.0 3.0
Middle Dsitillates 2.0 5.4
Fuel Oil 0.1 1.6
Others 2.1 8.8
Total India 5.2 5.2
ME -
Light Distillates 2.2 6.9
Middle Dsitillates 2.3 6.3
Fuel Oil 1.9 26.5
Others 2.7 11.3
Total ME 9.1 9.2
-
World -
Light Distillates 32.7
Middle Dsitillates 36.1
Fuel Oil 7.2
Others 23.9
Total World 99.8
Source: Company, Nirmal Bang Institutional Equities Research
In s t itu tio n a l E q u it ie s
Oil & Gas Sector 21
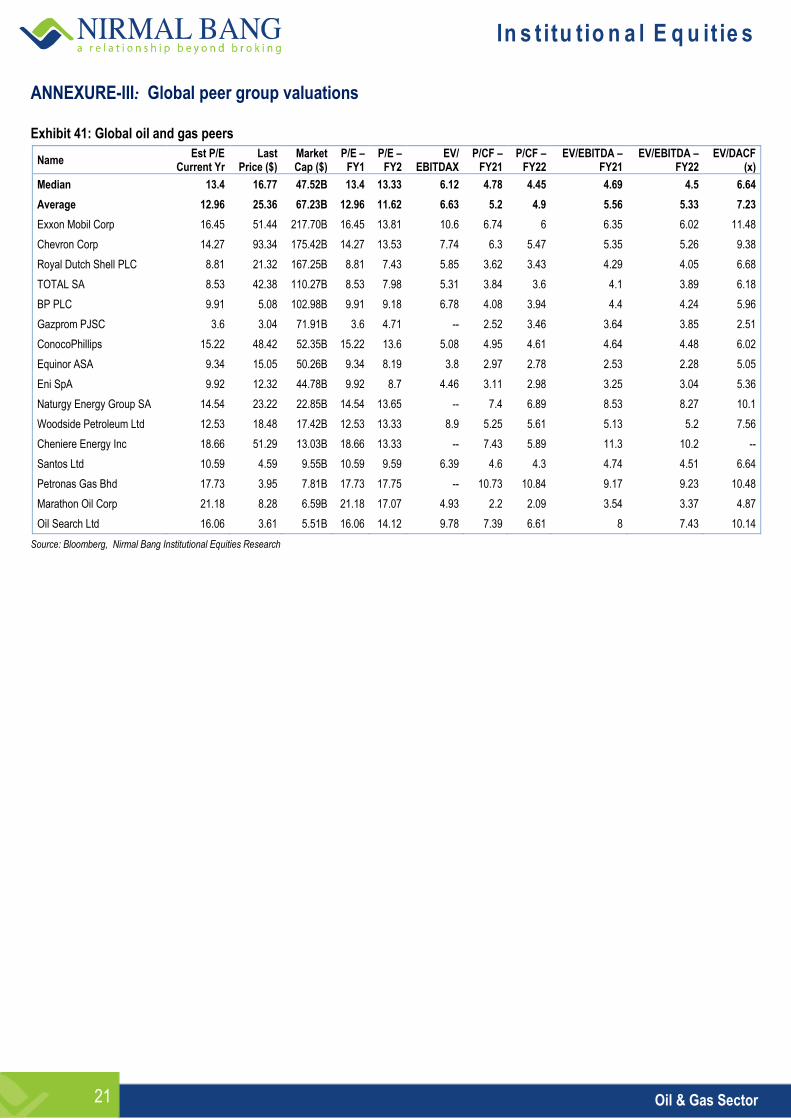
ANNEXURE-III: Global peer group valuations Exhibit 41: Global oil and gas peers
Name Est P/E
Current Yr Last
Price ($) Market Cap ($)
P/E – FY1
P/E – FY2
EV/ EBITDAX
P/CF – FY21
P/CF – FY22
EV/EBITDA – FY21
EV/EBITDA – FY22
EV/DACF (x)
Median 13.4 16.77 47.52B 13.4 13.33 6.12 4.78 4.45 4.69 4.5 6.64
Average 12.96 25.36 67.23B 12.96 11.62 6.63 5.2 4.9 5.56 5.33 7.23
Exxon Mobil Corp 16.45 51.44 217.70B 16.45 13.81 10.6 6.74 6 6.35 6.02 11.48
Chevron Corp 14.27 93.34 175.42B 14.27 13.53 7.74 6.3 5.47 5.35 5.26 9.38
Royal Dutch Shell PLC 8.81 21.32 167.25B 8.81 7.43 5.85 3.62 3.43 4.29 4.05 6.68
TOTAL SA 8.53 42.38 110.27B 8.53 7.98 5.31 3.84 3.6 4.1 3.89 6.18
BP PLC 9.91 5.08 102.98B 9.91 9.18 6.78 4.08 3.94 4.4 4.24 5.96
Gazprom PJSC 3.6 3.04 71.91B 3.6 4.71 -- 2.52 3.46 3.64 3.85 2.51
ConocoPhillips 15.22 48.42 52.35B 15.22 13.6 5.08 4.95 4.61 4.64 4.48 6.02
Equinor ASA 9.34 15.05 50.26B 9.34 8.19 3.8 2.97 2.78 2.53 2.28 5.05
Eni SpA 9.92 12.32 44.78B 9.92 8.7 4.46 3.11 2.98 3.25 3.04 5.36
Naturgy Energy Group SA 14.54 23.22 22.85B 14.54 13.65 -- 7.4 6.89 8.53 8.27 10.1
Woodside Petroleum Ltd 12.53 18.48 17.42B 12.53 13.33 8.9 5.25 5.61 5.13 5.2 7.56
Cheniere Energy Inc 18.66 51.29 13.03B 18.66 13.33 -- 7.43 5.89 11.3 10.2 --
Santos Ltd 10.59 4.59 9.55B 10.59 9.59 6.39 4.6 4.3 4.74 4.51 6.64
Petronas Gas Bhd 17.73 3.95 7.81B 17.73 17.75 -- 10.73 10.84 9.17 9.23 10.48
Marathon Oil Corp 21.18 8.28 6.59B 21.18 17.07 4.93 2.2 2.09 3.54 3.37 4.87
Oil Search Ltd 16.06 3.61 5.51B 16.06 14.12 9.78 7.39 6.61 8 7.43 10.14
Source: Bloomberg, Nirmal Bang Institutional Equities Research
In s t itu tio n a l E q u it ie s
Oil & Gas Sector 22
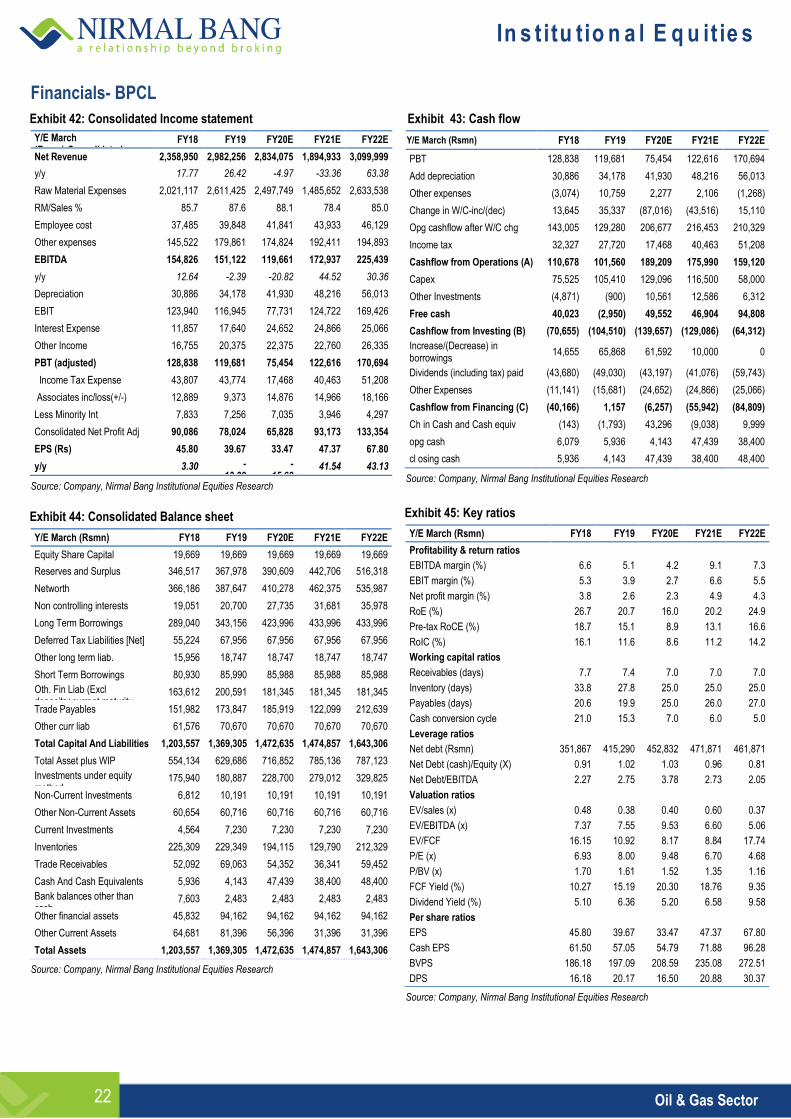
Financials- BPCL Exhibit 42: Consolidated Income statement
Y/E March (Rsmn):Consolidated
FY18 FY19 FY20E FY21E FY22E
Net Revenue 2,358,950 2,982,256 2,834,075 1,894,933 3,099,999
y/y 17.77 26.42 -4.97 -33.36 63.38
Raw Material Expenses 2,021,117 2,611,425 2,497,749 1,485,652 2,633,538
RM/Sales % 85.7 87.6 88.1 78.4 85.0
Employee cost 37,485 39,848 41,841 43,933 46,129
Other expenses 145,522 179,861 174,824 192,411 194,893
EBITDA 154,826 151,122 119,661 172,937 225,439
y/y 12.64 -2.39 -20.82 44.52 30.36
Depreciation 30,886 34,178 41,930 48,216 56,013
EBIT 123,940 116,945 77,731 124,722 169,426
Interest Expense 11,857 17,640 24,652 24,866 25,066
Other Income 16,755 20,375 22,375 22,760 26,335
PBT (adjusted) 128,838 119,681 75,454 122,616 170,694
Income Tax Expense 43,807 43,774 17,468 40,463 51,208
Associates inc/loss(+/-) 12,889 9,373 14,876 14,966 18,166
Less Minority Int 7,833 7,256 7,035 3,946 4,297
Consolidated Net Profit Adj 90,086 78,024 65,828 93,173 133,354
EPS (Rs) 45.80 39.67 33.47 47.37 67.80
y/y 3.30 - 13.39
- 15.63
41.54 43.13
Source: Company, Nirmal Bang Institutional Equities Research
Exhibit 44: Consolidated Balance sheet
Y/E March (Rsmn) FY18 FY19 FY20E FY21E FY22E
Equity Share Capital 19,669 19,669 19,669 19,669 19,669
Reserves and Surplus 346,517 367,978 390,609 442,706 516,318
Networth 366,186 387,647 410,278 462,375 535,987
Non controlling interests 19,051 20,700 27,735 31,681 35,978
Long Term Borrowings 289,040 343,156 423,996 433,996 433,996
Deferred Tax Liabilities [Net] 55,224 67,956 67,956 67,956 67,956
Other long term liab. 15,956 18,747 18,747 18,747 18,747
Short Term Borrowings 80,930 85,990 85,988 85,988 85,988
Oth. Fin Liab (Excl deposits+current maturity-debt)
163,612 200,591 181,345 181,345 181,345
Trade Payables 151,982 173,847 185,919 122,099 212,639
Other curr liab 61,576 70,670 70,670 70,670 70,670
Total Capital And Liabilities 1,203,557 1,369,305 1,472,635 1,474,857 1,643,306
Total Asset plus WIP 554,134 629,686 716,852 785,136 787,123
Investments under equity method
175,940 180,887 228,700 279,012 329,825
Non-Current Investments 6,812 10,191 10,191 10,191 10,191
Other Non-Current Assets 60,654 60,716 60,716 60,716 60,716
Current Investments 4,564 7,230 7,230 7,230 7,230
Inventories 225,309 229,349 194,115 129,790 212,329
Trade Receivables 52,092 69,063 54,352 36,341 59,452
Cash And Cash Equivalents 5,936 4,143 47,439 38,400 48,400
Bank balances other than cash
7,603 2,483 2,483 2,483 2,483
Other financial assets 45,832 94,162 94,162 94,162 94,162
Other Current Assets 64,681 81,396 56,396 31,396 31,396
Total Assets 1,203,557 1,369,305 1,472,635 1,474,857 1,643,306
Source: Company, Nirmal Bang Institutional Equities Research
Exhibit 43: Cash flow
Y/E March (Rsmn) FY18 FY19 FY20E FY21E FY22E
PBT 128,838 119,681 75,454 122,616 170,694
Add depreciation 30,886 34,178 41,930 48,216 56,013
Other expenses (3,074) 10,759 2,277 2,106 (1,268)
Change in W/C-inc/(dec) 13,645 35,337 (87,016) (43,516) 15,110
Opg cashflow after W/C chg 143,005 129,280 206,677 216,453 210,329
Income tax 32,327 27,720 17,468 40,463 51,208
Cashflow from Operations (A) 110,678 101,560 189,209 175,990 159,120
Capex 75,525 105,410 129,096 116,500 58,000
Other Investments (4,871) (900) 10,561 12,586 6,312
Free cash 40,023 (2,950) 49,552 46,904 94,808
Cashflow from Investing (B) (70,655) (104,510) (139,657) (129,086) (64,312)
Increase/(Decrease) in borrowings
14,655 65,868 61,592 10,000 0
Dividends (including tax) paid (43,680) (49,030) (43,197) (41,076) (59,743)
Other Expenses (11,141) (15,681) (24,652) (24,866) (25,066)
Cashflow from Financing (C) (40,166) 1,157 (6,257) (55,942) (84,809)
Ch in Cash and Cash equiv (143) (1,793) 43,296 (9,038) 9,999
opg cash 6,079 5,936 4,143 47,439 38,400
cl osing cash 5,936 4,143 47,439 38,400 48,400
Source: Company, Nirmal Bang Institutional Equities Research
Exhibit 45: Key ratios
Y/E March (Rsmn) FY18 FY19 FY20E FY21E FY22E
Profitability & return ratios
EBITDA margin (%) 6.6 5.1 4.2 9.1 7.3
EBIT margin (%) 5.3 3.9 2.7 6.6 5.5
Net profit margin (%) 3.8 2.6 2.3 4.9 4.3
RoE (%) 26.7 20.7 16.0 20.2 24.9
Pre-tax RoCE (%) 18.7 15.1 8.9 13.1 16.6
RoIC (%) 16.1 11.6 8.6 11.2 14.2
Working capital ratios
Receivables (days) 7.7 7.4 7.0 7.0 7.0
Inventory (days) 33.8 27.8 25.0 25.0 25.0
Payables (days) 20.6 19.9 25.0 26.0 27.0
Cash conversion cycle 21.0 15.3 7.0 6.0 5.0
Leverage ratios
Net debt (Rsmn) 351,867 415,290 452,832 471,871 461,871
Net Debt (cash)/Equity (X) 0.91 1.02 1.03 0.96 0.81
Net Debt/EBITDA 2.27 2.75 3.78 2.73 2.05
Valuation ratios
EV/sales (x) 0.48 0.38 0.40 0.60 0.37
EV/EBITDA (x) 7.37 7.55 9.53 6.60 5.06
EV/FCF 16.15 10.92 8.17 8.84 17.74
P/E (x) 6.93 8.00 9.48 6.70 4.68
P/BV (x) 1.70 1.61 1.52 1.35 1.16
FCF Yield (%) 10.27 15.19 20.30 18.76 9.35
Dividend Yield (%) 5.10 6.36 5.20 6.58 9.58
Per share ratios
EPS 45.80 39.67 33.47 47.37 67.80
Cash EPS 61.50 57.05 54.79 71.88 96.28
BVPS 186.18 197.09 208.59 235.08 272.51
DPS 16.18 20.17 16.50 20.88 30.37
Source: Company, Nirmal Bang Institutional Equities Research
In s t itu tio n a l E q u it ie s
Oil & Gas Sector 23
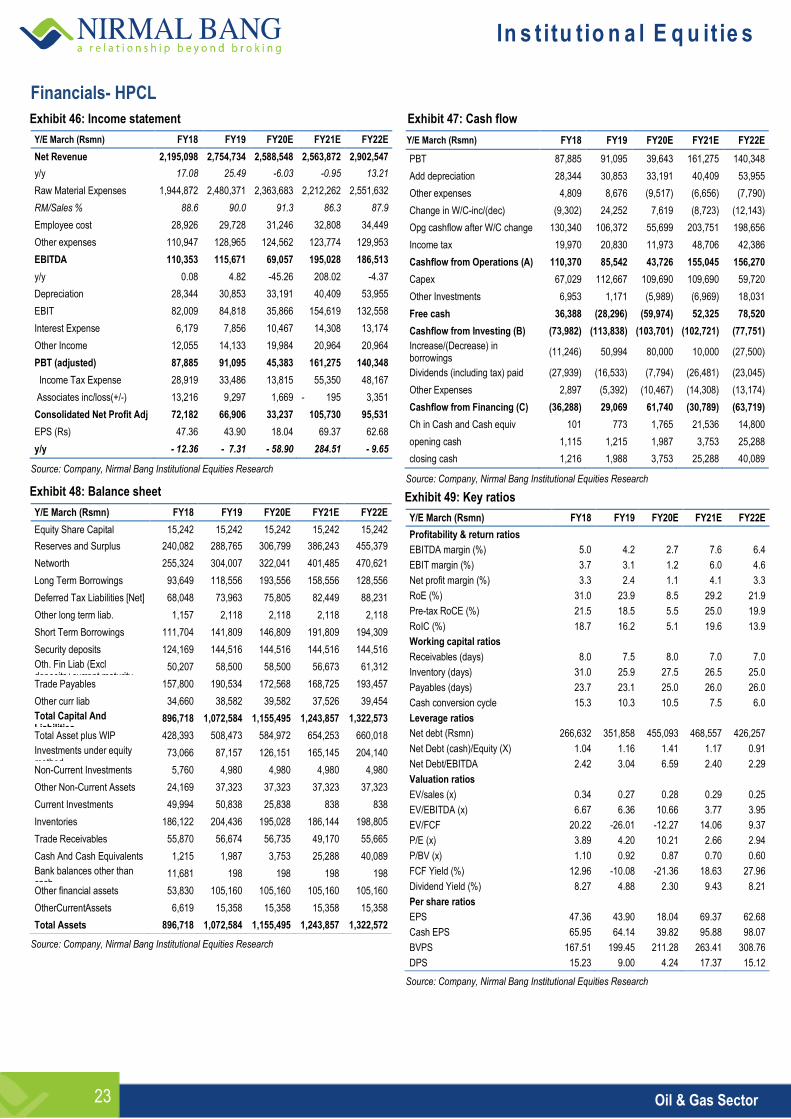
Financials- HPCL Exhibit 46: Income statement
Y/E March (Rsmn) FY18 FY19 FY20E FY21E FY22E
Net Revenue 2,195,098 2,754,734 2,588,548 2,563,872 2,902,547
y/y 17.08 25.49 -6.03 -0.95 13.21
Raw Material Expenses 1,944,872 2,480,371 2,363,683 2,212,262 2,551,632
RM/Sales % 88.6 90.0 91.3 86.3 87.9
Employee cost 28,926 29,728 31,246 32,808 34,449
Other expenses 110,947 128,965 124,562 123,774 129,953
EBITDA 110,353 115,671 69,057 195,028 186,513
y/y 0.08 4.82 -45.26 208.02 -4.37
Depreciation 28,344 30,853 33,191 40,409 53,955
EBIT 82,009 84,818 35,866 154,619 132,558
Interest Expense 6,179 7,856 10,467 14,308 13,174
Other Income 12,055 14,133 19,984 20,964 20,964
PBT (adjusted) 87,885 91,095 45,383 161,275 140,348
Income Tax Expense 28,919 33,486 13,815 55,350 48,167
Associates inc/loss(+/-) 13,216 9,297 1,669 - 195 3,351
Consolidated Net Profit Adj 72,182 66,906 33,237 105,730 95,531
EPS (Rs) 47.36 43.90 18.04 69.37 62.68
y/y - 12.36 - 7.31 - 58.90 284.51 - 9.65
Source: Company, Nirmal Bang Institutional Equities Research
Exhibit 48: Balance sheet
Y/E March (Rsmn) FY18 FY19 FY20E FY21E FY22E
Equity Share Capital 15,242 15,242 15,242 15,242 15,242
Reserves and Surplus 240,082 288,765 306,799 386,243 455,379
Networth 255,324 304,007 322,041 401,485 470,621
Long Term Borrowings 93,649 118,556 193,556 158,556 128,556
Deferred Tax Liabilities [Net] 68,048 73,963 75,805 82,449 88,231
Other long term liab. 1,157 2,118 2,118 2,118 2,118
Short Term Borrowings 111,704 141,809 146,809 191,809 194,309
Security deposits 124,169 144,516 144,516 144,516 144,516
Oth. Fin Liab (Excl deposits+current maturity-debt)
50,207 58,500 58,500 56,673 61,312
Trade Payables 157,800 190,534 172,568 168,725 193,457
Other curr liab 34,660 38,582 39,582 37,526 39,454
Total Capital And Liabilities
896,718 1,072,584 1,155,495 1,243,857 1,322,573
Total Asset plus WIP 428,393 508,473 584,972 654,253 660,018
Investments under equity method
73,066 87,157 126,151 165,145 204,140
Non-Current Investments 5,760 4,980 4,980 4,980 4,980
Other Non-Current Assets 24,169 37,323 37,323 37,323 37,323
Current Investments 49,994 50,838 25,838 838 838
Inventories 186,122 204,436 195,028 186,144 198,805
Trade Receivables 55,870 56,674 56,735 49,170 55,665
Cash And Cash Equivalents 1,215 1,987 3,753 25,288 40,089
Bank balances other than cash
11,681 198 198 198 198
Other financial assets 53,830 105,160 105,160 105,160 105,160
OtherCurrentAssets 6,619 15,358 15,358 15,358 15,358
Total Assets 896,718 1,072,584 1,155,495 1,243,857 1,322,572
Source: Company, Nirmal Bang Institutional Equities Research
Exhibit 47: Cash flow
Y/E March (Rsmn) FY18 FY19 FY20E FY21E FY22E
PBT 87,885 91,095 39,643 161,275 140,348
Add depreciation 28,344 30,853 33,191 40,409 53,955
Other expenses 4,809 8,676 (9,517) (6,656) (7,790)
Change in W/C-inc/(dec) (9,302) 24,252 7,619 (8,723) (12,143)
Opg cashflow after W/C change 130,340 106,372 55,699 203,751 198,656
Income tax 19,970 20,830 11,973 48,706 42,386
Cashflow from Operations (A) 110,370 85,542 43,726 155,045 156,270
Capex 67,029 112,667 109,690 109,690 59,720
Other Investments 6,953 1,171 (5,989) (6,969) 18,031
Free cash 36,388 (28,296) (59,974) 52,325 78,520
Cashflow from Investing (B) (73,982) (113,838) (103,701) (102,721) (77,751)
Increase/(Decrease) in borrowings
(11,246) 50,994 80,000 10,000 (27,500)
Dividends (including tax) paid (27,939) (16,533) (7,794) (26,481) (23,045)
Other Expenses 2,897 (5,392) (10,467) (14,308) (13,174)
Cashflow from Financing (C) (36,288) 29,069 61,740 (30,789) (63,719)
Ch in Cash and Cash equiv 101 773 1,765 21,536 14,800
opening cash 1,115 1,215 1,987 3,753 25,288
closing cash 1,216 1,988 3,753 25,288 40,089
Source: Company, Nirmal Bang Institutional Equities Research
Exhibit 49: Key ratios
Y/E March (Rsmn) FY18 FY19 FY20E FY21E FY22E
Profitability & return ratios
EBITDA margin (%) 5.0 4.2 2.7 7.6 6.4
EBIT margin (%) 3.7 3.1 1.2 6.0 4.6
Net profit margin (%) 3.3 2.4 1.1 4.1 3.3
RoE (%) 31.0 23.9 8.5 29.2 21.9
Pre-tax RoCE (%) 21.5 18.5 5.5 25.0 19.9
RoIC (%) 18.7 16.2 5.1 19.6 13.9
Working capital ratios
Receivables (days) 8.0 7.5 8.0 7.0 7.0
Inventory (days) 31.0 25.9 27.5 26.5 25.0
Payables (days) 23.7 23.1 25.0 26.0 26.0
Cash conversion cycle 15.3 10.3 10.5 7.5 6.0
Leverage ratios
Net debt (Rsmn) 266,632 351,858 455,093 468,557 426,257
Net Debt (cash)/Equity (X) 1.04 1.16 1.41 1.17 0.91
Net Debt/EBITDA 2.42 3.04 6.59 2.40 2.29
Valuation ratios
EV/sales (x) 0.34 0.27 0.28 0.29 0.25
EV/EBITDA (x) 6.67 6.36 10.66 3.77 3.95
EV/FCF 20.22 -26.01 -12.27 14.06 9.37
P/E (x) 3.89 4.20 10.21 2.66 2.94
P/BV (x) 1.10 0.92 0.87 0.70 0.60
FCF Yield (%) 12.96 -10.08 -21.36 18.63 27.96
Dividend Yield (%) 8.27 4.88 2.30 9.43 8.21
Per share ratios
EPS 47.36 43.90 18.04 69.37 62.68
Cash EPS 65.95 64.14 39.82 95.88 98.07
BVPS 167.51 199.45 211.28 263.41 308.76
DPS 15.23 9.00 4.24 17.37 15.12
Source: Company, Nirmal Bang Institutional Equities Research
In s t itu tio n a l E q u it ie s
Oil & Gas Sector 24
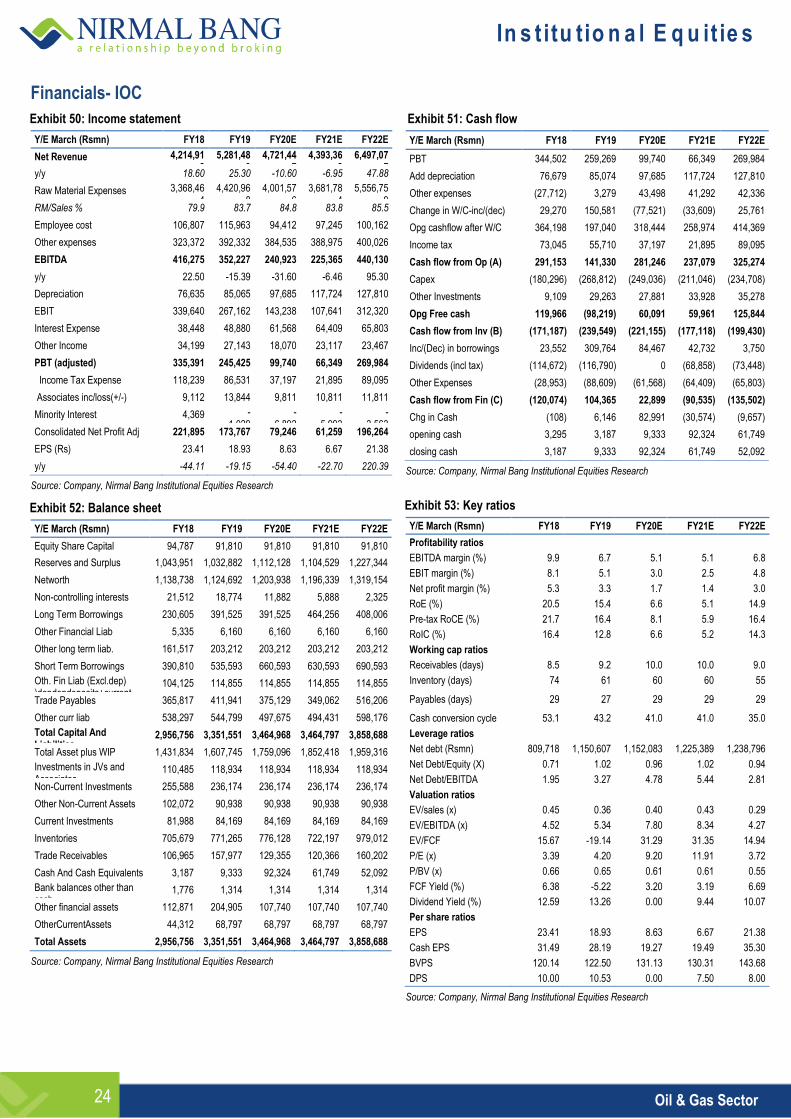
Financials- IOC Exhibit 50: Income statement
Y/E March (Rsmn) FY18 FY19 FY20E FY21E FY22E
Net Revenue 4,214,918
5,281,489
4,721,447
4,393,368
6,497,077
y/y 18.60 25.30 -10.60 -6.95 47.88
Raw Material Expenses 3,368,464
4,420,968
4,001,576
3,681,784
5,556,759
RM/Sales % 79.9 83.7 84.8 83.8 85.5
Employee cost 106,807 115,963 94,412 97,245 100,162
Other expenses 323,372 392,332 384,535 388,975 400,026
EBITDA 416,275 352,227 240,923 225,365 440,130
y/y 22.50 -15.39 -31.60 -6.46 95.30
Depreciation 76,635 85,065 97,685 117,724 127,810
EBIT 339,640 267,162 143,238 107,641 312,320
Interest Expense 38,448 48,880 61,568 64,409 65,803
Other Income 34,199 27,143 18,070 23,117 23,467
PBT (adjusted) 335,391 245,425 99,740 66,349 269,984
Income Tax Expense 118,239 86,531 37,197 21,895 89,095
Associates inc/loss(+/-) 9,112 13,844 9,811 10,811 11,811
Minority Interest 4,369 - 1,029
- 6,892
- 5,993
- 3,563
Consolidated Net Profit Adj 221,895 173,767 79,246 61,259 196,264
EPS (Rs) 23.41 18.93 8.63 6.67 21.38
y/y -44.11 -19.15 -54.40 -22.70 220.39
Source: Company, Nirmal Bang Institutional Equities Research
Exhibit 52: Balance sheet
Y/E March (Rsmn) FY18 FY19 FY20E FY21E FY22E
Equity Share Capital 94,787 91,810 91,810 91,810 91,810
Reserves and Surplus 1,043,951 1,032,882 1,112,128 1,104,529 1,227,344
Networth 1,138,738 1,124,692 1,203,938 1,196,339 1,319,154
Non-controlling interests 21,512 18,774 11,882 5,888 2,325
Long Term Borrowings 230,605 391,525 391,525 464,256 408,006
Other Financial Liab 5,335 6,160 6,160 6,160 6,160
Other long term liab. 161,517 203,212 203,212 203,212 203,212
Short Term Borrowings 390,810 535,593 660,593 630,593 690,593
Oth. Fin Liab (Excl.dep) )depdepdeposits+current maturity-debt)
104,125 114,855 114,855 114,855 114,855
Trade Payables 365,817 411,941 375,129 349,062 516,206
Other curr liab 538,297 544,799 497,675 494,431 598,176
Total Capital And Liabilities
2,956,756 3,351,551 3,464,968 3,464,797 3,858,688
Total Asset plus WIP 1,431,834 1,607,745 1,759,096 1,852,418 1,959,316
Investments in JVs and Associates
110,485 118,934 118,934 118,934 118,934
Non-Current Investments 255,588 236,174 236,174 236,174 236,174
Other Non-Current Assets 102,072 90,938 90,938 90,938 90,938
Current Investments 81,988 84,169 84,169 84,169 84,169
Inventories 705,679 771,265 776,128 722,197 979,012
Trade Receivables 106,965 157,977 129,355 120,366 160,202
Cash And Cash Equivalents 3,187 9,333 92,324 61,749 52,092
Bank balances other than cash
1,776 1,314 1,314 1,314 1,314
Other financial assets 112,871 204,905 107,740 107,740 107,740
OtherCurrentAssets 44,312 68,797 68,797 68,797 68,797
Total Assets 2,956,756 3,351,551 3,464,968 3,464,797 3,858,688
Source: Company, Nirmal Bang Institutional Equities Research
Exhibit 51: Cash flow
Y/E March (Rsmn) FY18 FY19 FY20E FY21E FY22E
PBT 344,502 259,269 99,740 66,349 269,984
Add depreciation 76,679 85,074 97,685 117,724 127,810
Other expenses (27,712) 3,279 43,498 41,292 42,336
Change in W/C-inc/(dec) 29,270 150,581 (77,521) (33,609) 25,761
Opg cashflow after W/C 364,198 197,040 318,444 258,974 414,369
Income tax 73,045 55,710 37,197 21,895 89,095
Cash flow from Op (A) 291,153 141,330 281,246 237,079 325,274
Capex (180,296) (268,812) (249,036) (211,046) (234,708)
Other Investments 9,109 29,263 27,881 33,928 35,278
Opg Free cash 119,966 (98,219) 60,091 59,961 125,844
Cash flow from Inv (B) (171,187) (239,549) (221,155) (177,118) (199,430)
Inc/(Dec) in borrowings 23,552 309,764 84,467 42,732 3,750
Dividends (incl tax) (114,672) (116,790) 0 (68,858) (73,448)
Other Expenses (28,953) (88,609) (61,568) (64,409) (65,803)
Cash flow from Fin (C) (120,074) 104,365 22,899 (90,535) (135,502)
Chg in Cash (108) 6,146 82,991 (30,574) (9,657)
opening cash 3,295 3,187 9,333 92,324 61,749
closing cash 3,187 9,333 92,324 61,749 52,092
Source: Company, Nirmal Bang Institutional Equities Research
Exhibit 53: Key ratios
Y/E March (Rsmn) FY18 FY19 FY20E FY21E FY22E
Profitability ratios
EBITDA margin (%) 9.9 6.7 5.1 5.1 6.8
EBIT margin (%) 8.1 5.1 3.0 2.5 4.8
Net profit margin (%) 5.3 3.3 1.7 1.4 3.0
RoE (%) 20.5 15.4 6.6 5.1 14.9
Pre-tax RoCE (%) 21.7 16.4 8.1 5.9 16.4
RoIC (%) 16.4 12.8 6.6 5.2 14.3
Working cap ratios
Receivables (days) 8.5 9.2 10.0 10.0 9.0
Inventory (days) 74 61 60 60 55
Payables (days) 29 27 29 29 29
Cash conversion cycle 53.1 43.2 41.0 41.0 35.0
Leverage ratios
Net debt (Rsmn) 809,718 1,150,607 1,152,083 1,225,389 1,238,796
Net Debt/Equity (X) 0.71 1.02 0.96 1.02 0.94
Net Debt/EBITDA 1.95 3.27 4.78 5.44 2.81
Valuation ratios
EV/sales (x) 0.45 0.36 0.40 0.43 0.29
EV/EBITDA (x) 4.52 5.34 7.80 8.34 4.27
EV/FCF 15.67 -19.14 31.29 31.35 14.94
P/E (x) 3.39 4.20 9.20 11.91 3.72
P/BV (x) 0.66 0.65 0.61 0.61 0.55
FCF Yield (%) 6.38 -5.22 3.20 3.19 6.69
Dividend Yield (%) 12.59 13.26 0.00 9.44 10.07
Per share ratios
EPS 23.41 18.93 8.63 6.67 21.38
Cash EPS 31.49 28.19 19.27 19.49 35.30
BVPS 120.14 122.50 131.13 130.31 143.68
DPS 10.00 10.53 0.00 7.50 8.00
Source: Company, Nirmal Bang Institutional Equities Research
In s t itu tio n a l E q u it ie s
Oil & Gas Sector 25
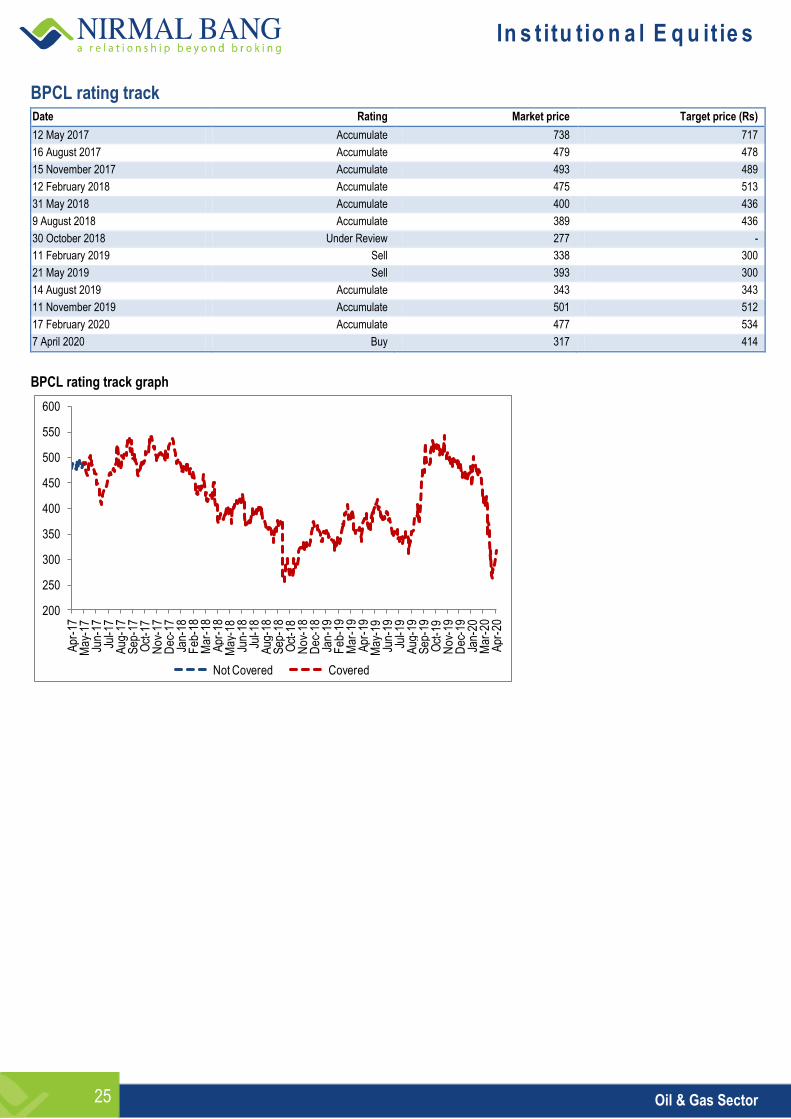
BPCL rating track Date Rating Market price Target price (Rs)
12 May 2017 Accumulate 738 717
16 August 2017 Accumulate 479 478
15 November 2017 Accumulate 493 489
12 February 2018 Accumulate 475 513
31 May 2018 Accumulate 400 436
9 August 2018 Accumulate 389 436
30 October 2018 Under Review 277 -
11 February 2019 Sell 338 300
21 May 2019 Sell 393 300
14 August 2019 Accumulate 343 343
11 November 2019 Accumulate 501 512
17 February 2020 Accumulate 477 534
7 April 2020 Buy 317 414
BPCL rating track graph
200
250
300
350
400
450
500
550
600
Apr
-17
May
-17
Jun-
17Ju
l-17
Aug
-17
Sep
-17
Oct
-17
Nov
-17
Dec
-17
Jan-
18F
eb-1
8M
ar-1
8A
pr-1
8M
ay-1
8Ju
n-18
Jul-1
8A
ug-1
8S
ep-1
8O
ct-1
8N
ov-1
8D
ec-1
8Ja
n-19
Feb
-19
Mar
-19
Apr
-19
May
-19
Jun-
19Ju
l-19
Aug
-19
Sep
-19
Oct
-19
Nov
-19
Dec
-19
Jan-
20M
ar-2
0A
pr-2
0
Not Covered Covered
In s t itu tio n a l E q u it ie s
Oil & Gas Sector 26
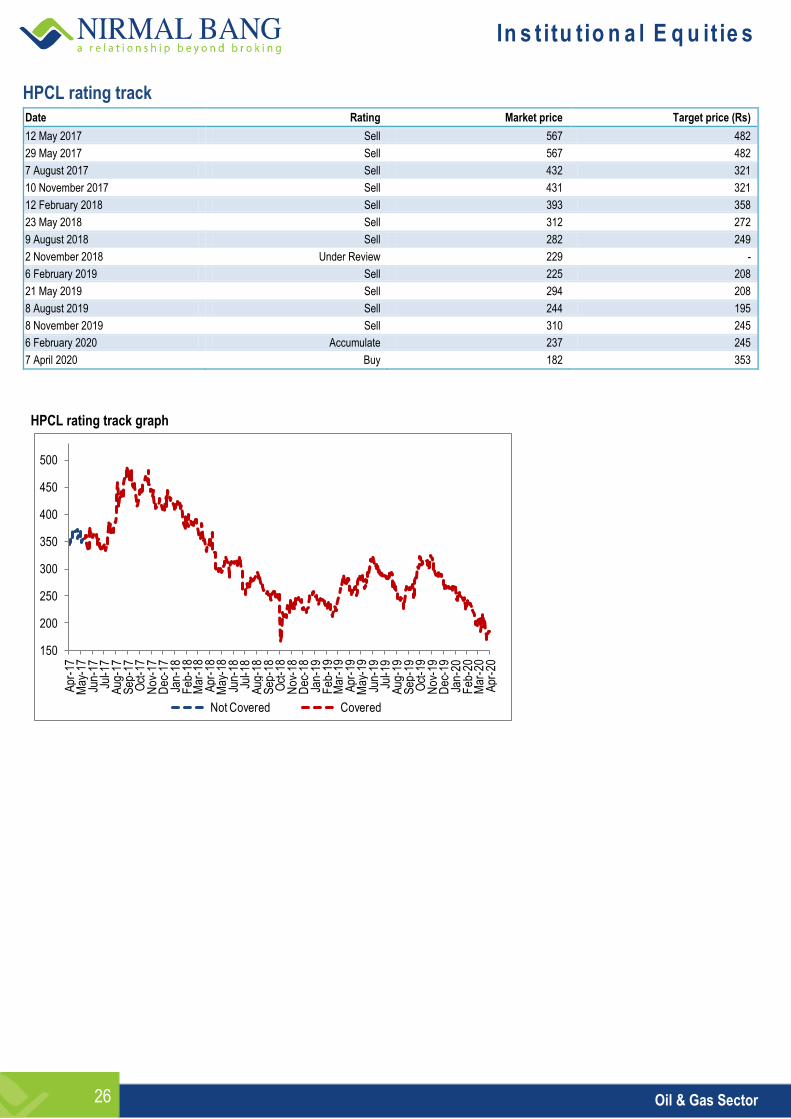
HPCL rating track
Date Rating Market price Target price (Rs)
12 May 2017 Sell 567 482
29 May 2017 Sell 567 482
7 August 2017 Sell 432 321
10 November 2017 Sell 431 321
12 February 2018 Sell 393 358
23 May 2018 Sell 312 272
9 August 2018 Sell 282 249
2 November 2018 Under Review 229 -
6 February 2019 Sell 225 208
21 May 2019 Sell 294 208
8 August 2019 Sell 244 195
8 November 2019 Sell 310 245
6 February 2020 Accumulate 237 245
7 April 2020 Buy 182 353
HPCL rating track graph
150
200
250
300
350
400
450
500
Apr
-17
May
-17
Jun-
17Ju
l-17
Aug
-17
Sep
-17
Oct
-17
Nov
-17
Dec
-17
Jan-
18F
eb-1
8M
ar-1
8A
pr-1
8M
ay-1
8Ju
n-18
Jul-1
8A
ug-1
8S
ep-1
8O
ct-1
8N
ov-1
8D
ec-1
8Ja
n-19
Feb
-19
Mar
-19
Apr
-19
May
-19
Jun-
19Ju
l-19
Aug
-19
Sep
-19
Oct
-19
Nov
-19
Dec
-19
Jan-
20F
eb-2
0M
ar-2
0A
pr-2
0
Not Covered Covered
In s t itu tio n a l E q u it ie s
Oil & Gas Sector 27
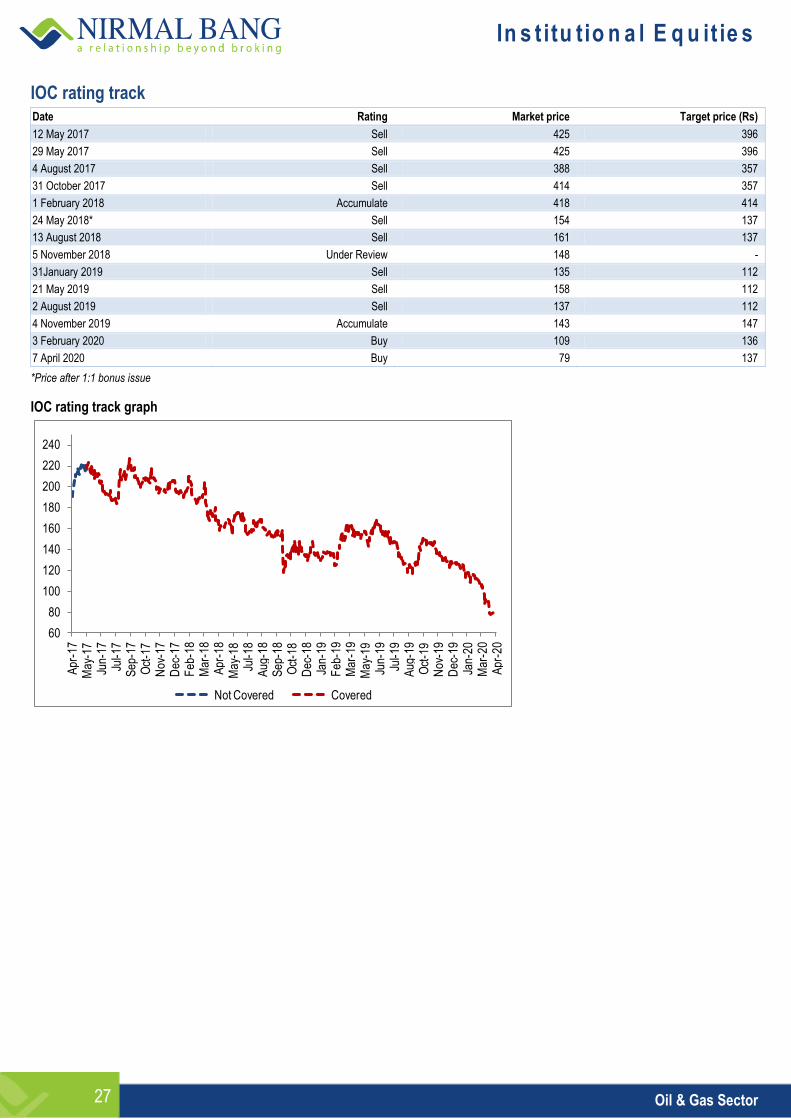
IOC rating track Date Rating Market price Target price (Rs)
12 May 2017 Sell 425 396
29 May 2017 Sell 425 396
4 August 2017 Sell 388 357
31 October 2017 Sell 414 357
1 February 2018 Accumulate 418 414
24 May 2018* Sell 154 137
13 August 2018 Sell 161 137
5 November 2018 Under Review 148 -
31January 2019 Sell 135 112
21 May 2019 Sell 158 112
2 August 2019 Sell 137 112
4 November 2019 Accumulate 143 147
3 February 2020 Buy 109 136
7 April 2020 Buy 79 137
*Price after 1:1 bonus issue
IOC rating track graph
60
80
100
120
140
160
180
200
220
240
Apr
-17
May
-17
Jun-
17Ju
l-17
Sep
-17
Oct
-17
Nov
-17
Dec
-17
Feb
-18
Mar
-18
Apr
-18
May
-18
Jul-1
8A
ug-1
8S
ep-1
8O
ct-1
8D
ec-1
8Ja
n-19
Feb
-19
Mar
-19
May
-19
Jun-
19Ju
l-19
Aug
-19
Oct
-19
Nov
-19
Dec
-19
Jan-
20M
ar-2
0A
pr-2
0
Not Covered Covered
In s t itu tio n a l E q u it ie s
Oil & Gas Sector 28
DISCLOSURES
This Report is published by Nirmal Bang Equities Private Limited (hereinafter referred to as “NBEPL”) for private circulation. NBEPL is a registered Research Analyst under SEBI (Research Analyst) Regulations, 2014 having Registration no. INH000001436. NBEPL is also a registered Stock Broker with National Stock Exchange of India Limited and BSE Limited in cash and derivatives segments. NBEPL has other business divisions with independent research teams separated by Chinese walls, and therefore may, at times, have different or contrary views on stocks and markets. NBEPL or its associates have not been debarred / suspended by SEBI or any other regulatory authority for accessing / dealing in securities Market. NBEPL, its associates or analyst or his relatives do not hold any financial interest in the subject company. NBEPL or its associates or Analyst do not have any conflict or material conflict of interest at the time of publication of the research report with the subject company. NBEPL or its associates or Analyst or his relatives do not hold beneficial ownership of 1% or more in the subject company at the end of the month immediately preceding the date of publication of this research report. NBEPL or its associates / analyst has not received any compensation / managed or co-managed public offering of securities of the company covered by Analyst during the past twelve months. NBEPL or its associates have not received any compensation or other benefits from the company covered by Analyst or third party in connection with the research report. Analyst has not served as an officer, director or employee of Subject Company and NBEPL / analyst has not been engaged in market making activity of the subject company. Analyst Certification: I, Amit Agarwal, research analyst the author of this report, hereby certify that the views expressed in this research report accurately reflects my personal views about the subject securities, issuers, products, sectors or industries. It is also certified that no part of the compensation of the analyst was, is, or will be directly or indirectly related to the inclusion of specific recommendations or views in this research. The analyst is principally responsible for the preparation of this research report and has taken reasonable care to achieve and maintain independence and objectivity in making any recommendations.
In s t itu tio n a l E q u it ie s
Oil & Gas Sector 29
Disclaimer
Stock Ratings Absolute Returns
BUY > 15%
ACCUMULATE -5% to15%
SELL < -5%
This report is for the personal information of the authorized recipient and does not construe to be any investment, legal or taxation advice to you. NBEPL is not soliciting any action based upon it. Nothing in this research shall be construed as a solicitation to buy or sell any security or product, or to engage in or refrain from engaging in any such transaction. In preparing this research, we did not take into account the investment objectives, financial situation and particular needs of the reader.
This research has been prepared for the general use of the clients of NBEPL and must not be copied, either in whole or in part, or distributed or redistributed to any other person in any form. If you are not the intended recipient you must not use or disclose the information in this research in any way. Though disseminated to all the customers simultaneously, not all customers may receive this report at the same time. NBEPL will not treat recipients as customers by virtue of their receiving this report. This report is not directed or intended for distribution to or use by any person or entity resident in a state, country or any jurisdiction, where such distribution, publication, availability or use would be contrary to law, regulation or which would subject NBEPL & its group companies to registration or licensing requirements within such jurisdictions.
The report is based on the information obtained from sources believed to be reliable, but we do not make any representation or warranty that it is accurate, complete or up-to-date and it should not be relied upon as such. We accept no obligation to correct or update the information or opinions in it. NBEPL or any of its affiliates or employees shall not be in any way responsible for any loss or damage that may arise to any person from any inadvertent error in the information contained in this report. NBEPL or any of its affiliates or employees do not provide, at any time, any express or implied warranty of any kind, regarding any matter pertaining to this report, including without limitation the implied warranties of merchantability, fitness for a particular purpose, and non-infringement. The recipients of this report should rely on their own investigations.
This information is subject to change without any prior notice. NBEPL reserves its absolute discretion and right to make or refrain from making modifications and alterations to this statement from time to time. Nevertheless, NBEPL is committed to providing independent and transparent recommendations to its clients, and would be happy to provide information in response to specific client queries.
Before making an investment decision on the basis of this research, the reader needs to consider, with or without the assistance of an adviser, whether the advice is appropriate in light of their particular investment needs, objectives and financial circumstances. There are risks involved in securities trading. The price of securities can and does fluctuate, and an individual security may even become valueless. International investors are reminded of the additional risks inherent in international investments, such as currency fluctuations and international stock market or economic conditions, which may adversely affect the value of the investment. Opinions expressed are subject to change without any notice. Neither the company nor the director or the employees of NBEPL accept any liability whatsoever for any direct, indirect, consequential or other loss arising from any use of this research and/or further communication in relation to this research. Here it may be noted that neither NBEPL, nor its directors, employees, agents or representatives shall be liable for any damages whether direct or indirect, incidental, special or consequential including lost revenue or lost profit that may arise from or in connection with the use of the information contained in this report.
Copyright of this document vests exclusively with NBEPL.
Our reports are also available on our website www.nirmalbang.com
Access all our reports on Bloomberg, Thomson Reuters and Factset.
Team Details:
Name Email Id Direct Line
Rahul Arora CEO [email protected] -
Girish Pai Head of Research [email protected] +91 22 6273 8017 / 18
Dealing
Ravi Jagtiani Dealing Desk [email protected] +91 22 6273 8230, +91 22 6636 8833
Michael Pillai Dealing Desk [email protected] +91 22 6273 8102/8103, +91 22 6636 8830
Nirmal Bang Equities Pvt. Ltd.
Correspondence Address
B-2, 301/302, Marathon Innova,
Nr. Peninsula Corporate Park,
Lower Parel (W), Mumbai-400013.
Board No. : 91 22 6273 8000/1; Fax. : 022 6273 8010