institute for transport studies faculty of earth and environment when to invest in high speed rail...
TRANSCRIPT

Institute for Transport StudiesFACULTY OF EARTH AND ENVIRONMENT
When to invest in High Speed Rail Links and Networks
Chris Nash
Research Professor

Outline
1.History and Objectives
2.Impact on mode split
3.Costs and benefits
4.Ex post appraisals
5.Generalisation
6.Network effects
7.Pricing Policy
8.Conclusions
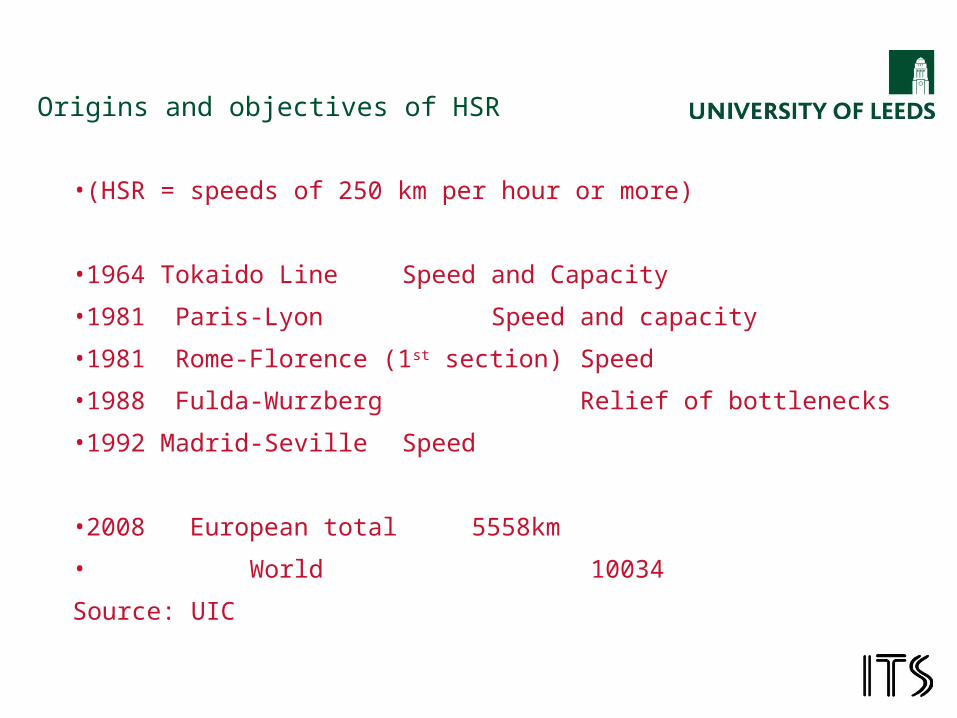
Origins and objectives of HSR
•(HSR = speeds of 250 km per hour or more)
•1964 Tokaido Line Speed and Capacity
•1981 Paris-Lyon Speed and capacity
•1981 Rome-Florence (1st section) Speed
•1988 Fulda-Wurzberg Relief of bottlenecks
•1992 Madrid-Seville Speed
•2008 European total 5558km
• World 10034
Source: UIC

Before and After High Speed Market Shares
TGV Sud-Est AVE Madrid-SevilleBefore After Before After
Plane 31% 7% 40% 13%Train 40% 72% 16% 51%Car and Bus 29% 21% 44% 36%
Source: COST318 (1996).

Costs and Benefits
COSTS
•Capital costs
•Net Operating costs
•Net External costs (environment, safety)
BENEFITS
•Time savings
•Additional capacity
•Diversion from other modes
•Generated traffic
•Wider economic benefits
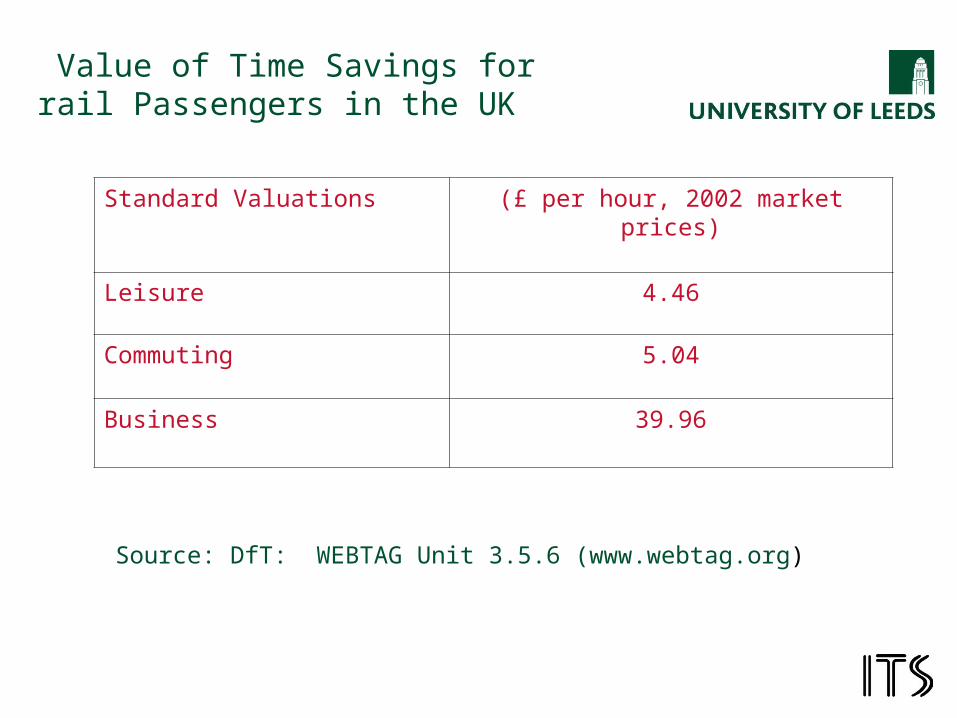
Value of Time Savings for rail Passengers in the UK
Standard Valuations (£ per hour, 2002 market prices)
Leisure 4.46
Commuting 5.04
Business 39.96
Source: DfT: WEBTAG Unit 3.5.6 (www.webtag.org)
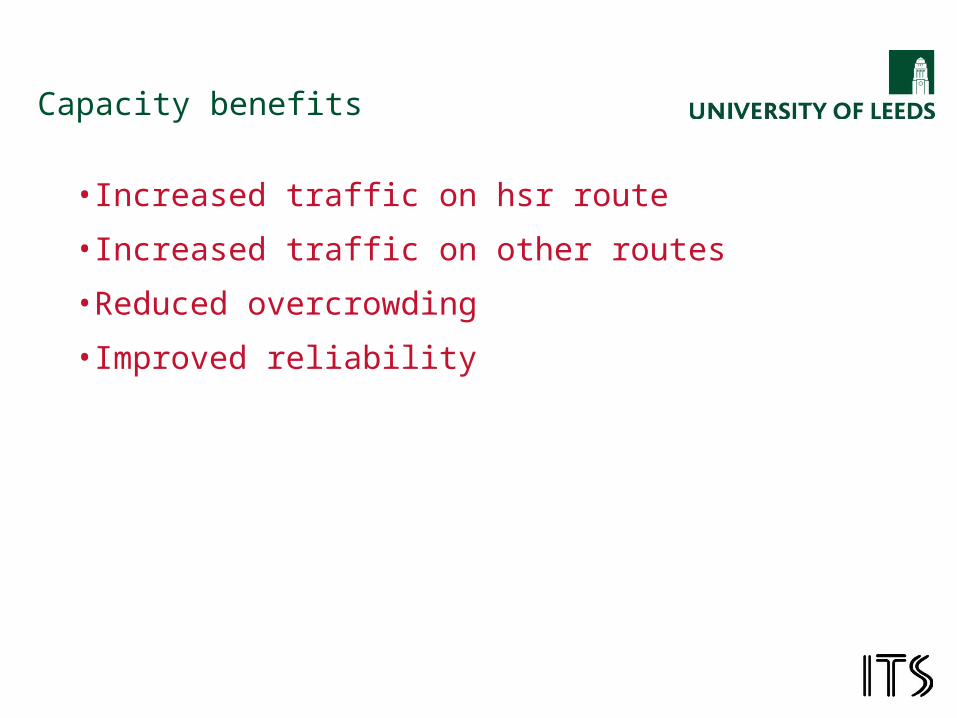
Capacity benefits
•Increased traffic on hsr route
•Increased traffic on other routes
•Reduced overcrowding
•Improved reliability
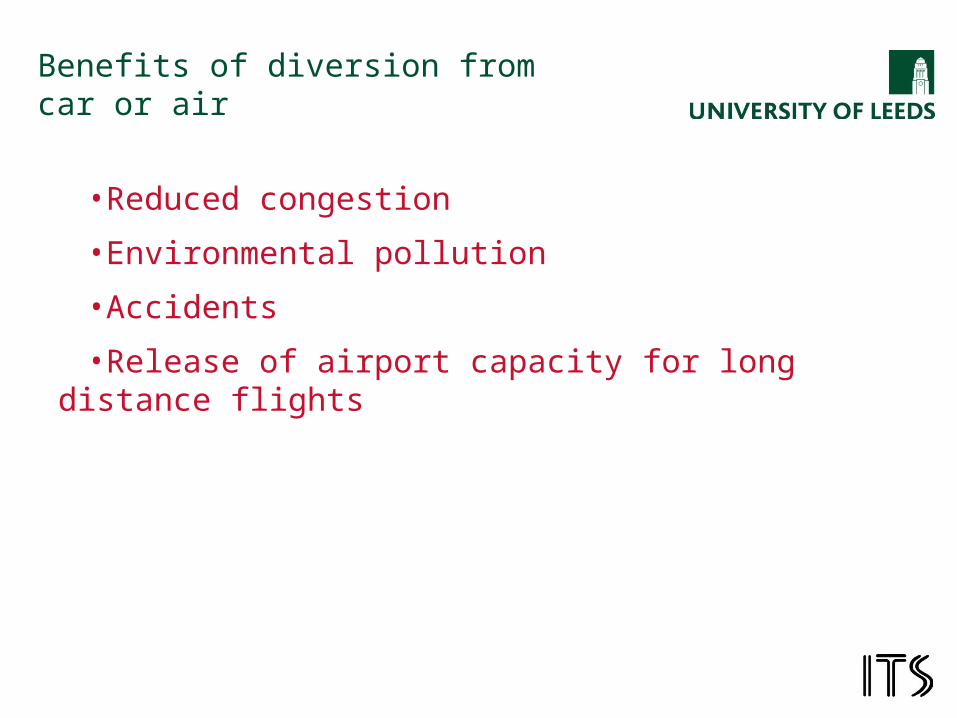
Benefits of diversion from car or air
•Reduced congestion
•Environmental pollution
•Accidents
•Release of airport capacity for long distance flights

Energy consumption by mode (MJ per pass km)
•Inter city train at 44% load 0.5
•High speed train at 49% load 1.08
•High speed train at 70% load 0.76
•Air (500km flight) at 70% load 2.57
•Diesel car on motorway at 36% load 0.94
Source CE Delft (2003)

External Costs (eurocents per km)
External Cost Charge
Car peak 16.1 – 24.4 7.8 – 15.6
Off peak 4.4 – 5.6 7.8 – 15.6
Air <500km per passenger km 1.5 -
Source: GRACE (200?) INFRAS/IWW (200?)
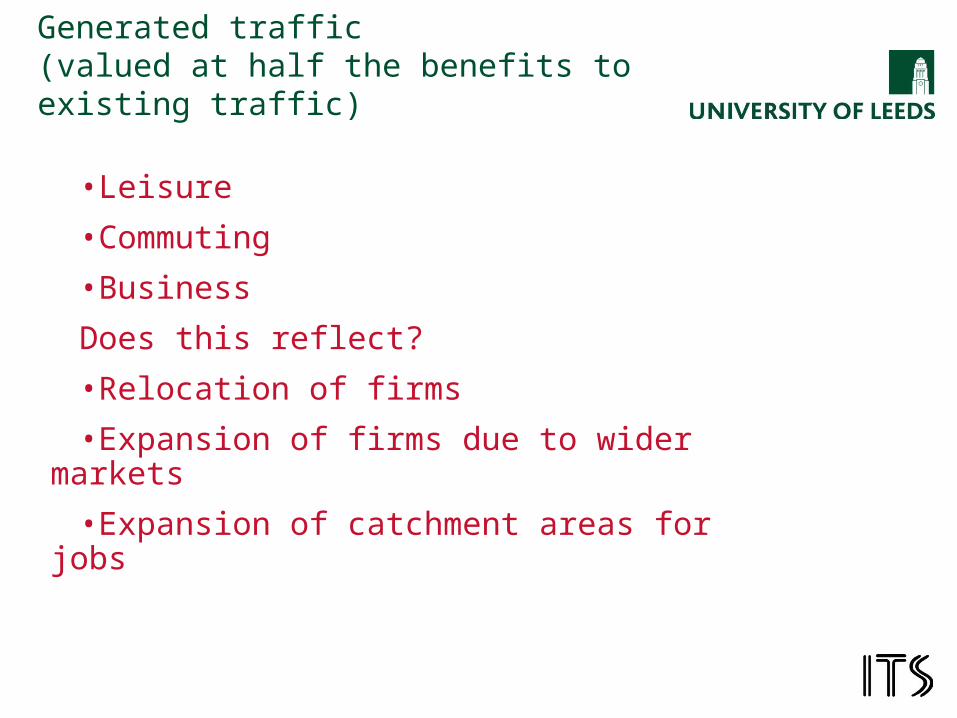
Generated traffic(valued at half the benefits to existing traffic)
•Leisure
•Commuting
•Business
Does this reflect?
•Relocation of firms
•Expansion of firms due to wider markets
•Expansion of catchment areas for jobs
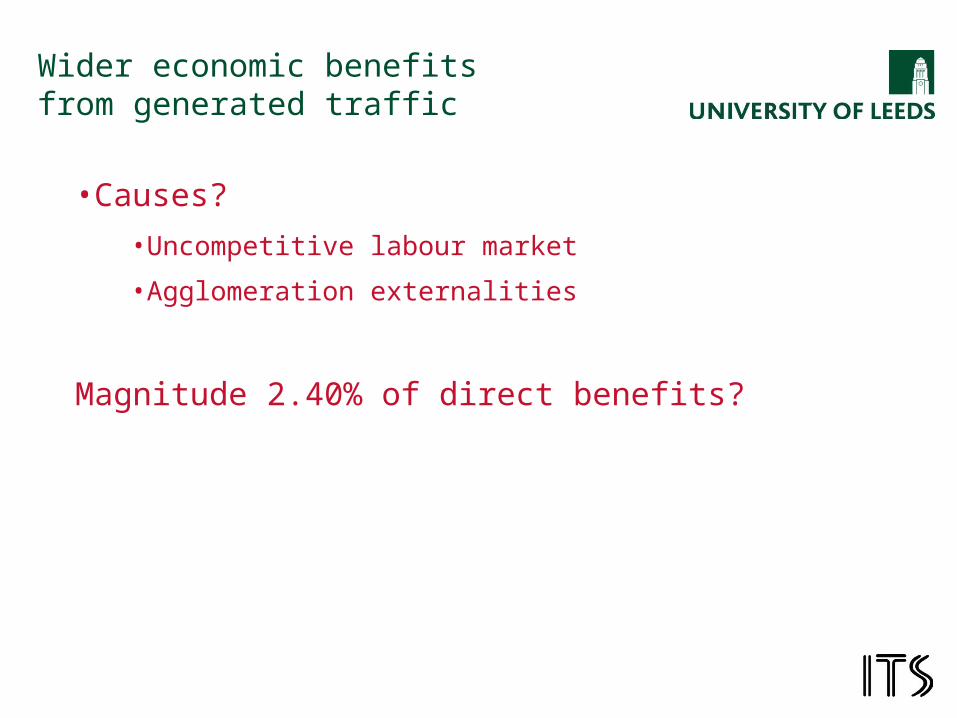
Wider economic benefitsfrom generated traffic
•Causes?
•Uncompetitive labour market
•Agglomeration externalities
Magnitude 2.40% of direct benefits?
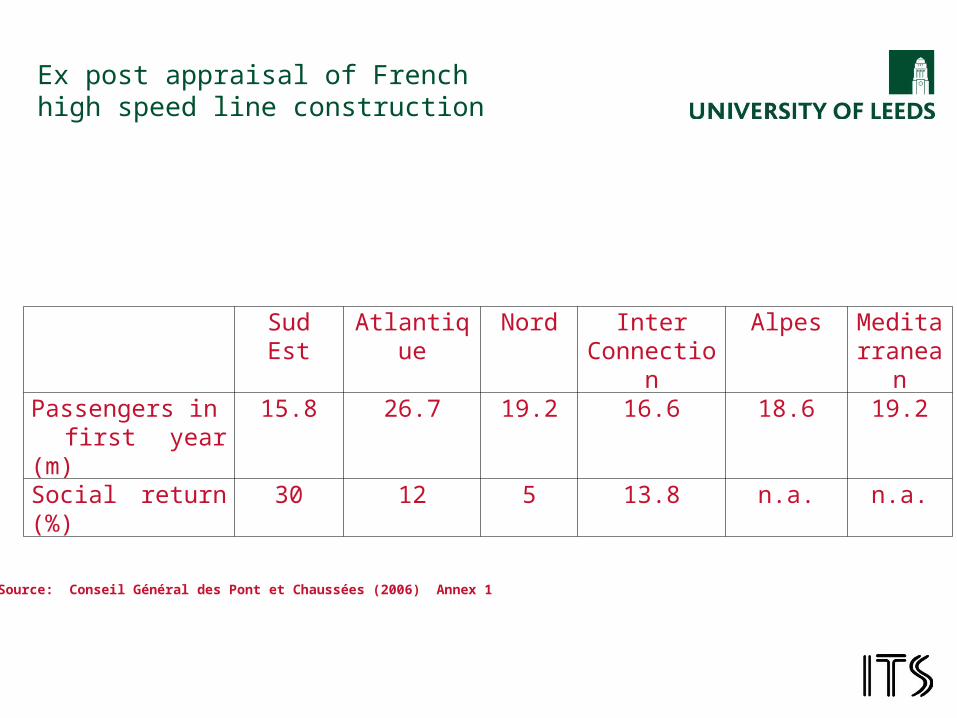
Ex post appraisal of French high speed line construction
Sud Est Atlantique Nord Inter Connection
Alpes Meditarranean
Passengers in first year (m)
15.8 26.7 19.2 16.6 18.6 19.2
Social return (%) 30 12 5 13.8 n.a. n.a.
Source: Conseil Général des Pont et Chaussées (2006) Annex 1

Benefits of high-speed train in Spain (millions of 1987 pesetas)
Social benefit of HST*
COSTS
Infrastructure -237.761
Residual Value 17.636
Trains -58.128
Maintenance -41.410
Operation -135.265
Net present value of HST -258.329
* Project life (30 years), GDP growth (2.5%), social discount rate (6%)
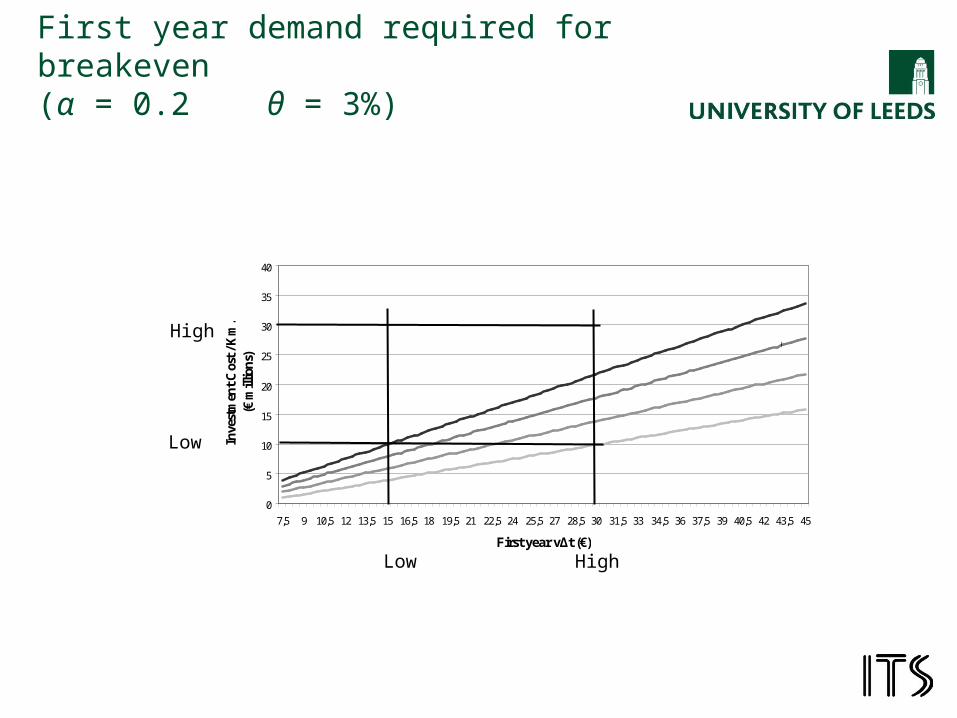
First year demand required for breakeven(α = 0.2 θ = 3%)
0
5
10
15
20
25
30
35
40
7,5 9 10,5 12 13,5 15 16,5 18 19,5 21 22,5 24 25,5 27 28,5 30 31,5 33 34,5 36 37,5 39 40,5 42 43,5 45
First year vΔt (€)
Inve
stm
ent
Cos
t / K
m.
(€ m
illio
ns)
Q d = 12 (Q t = 14.4)
Q d = 10 (Q t = 12)
Q d = 8 (Q t =9.6)
Q d = 6 (Q t = 7.2)
α = 0.2θ = 3%
Low High
High
Low
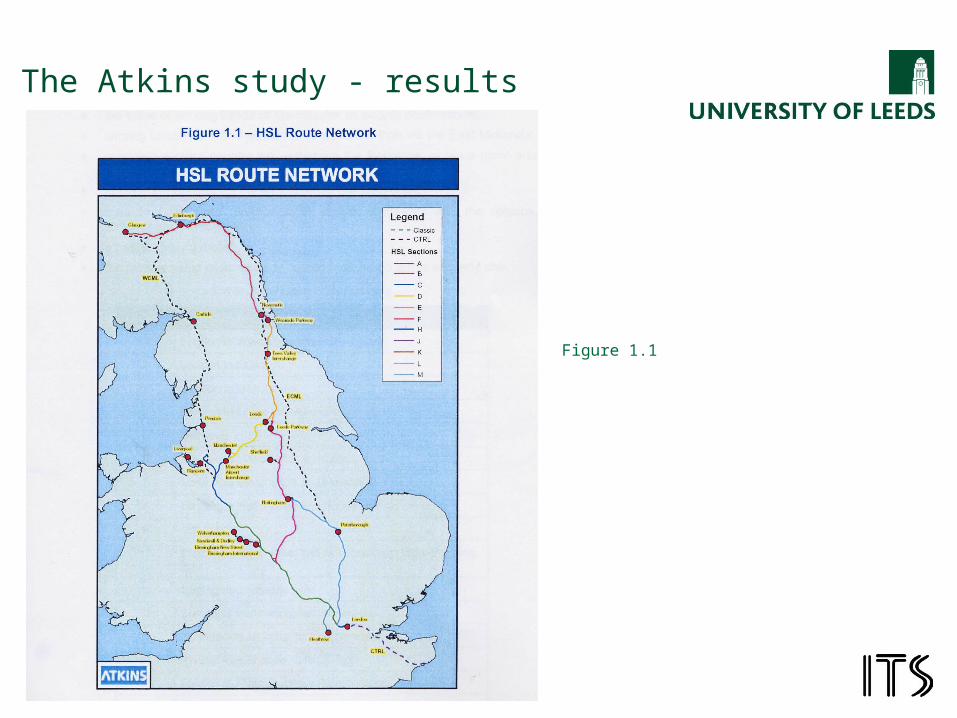
Figure 1.1
The Atkins study - results
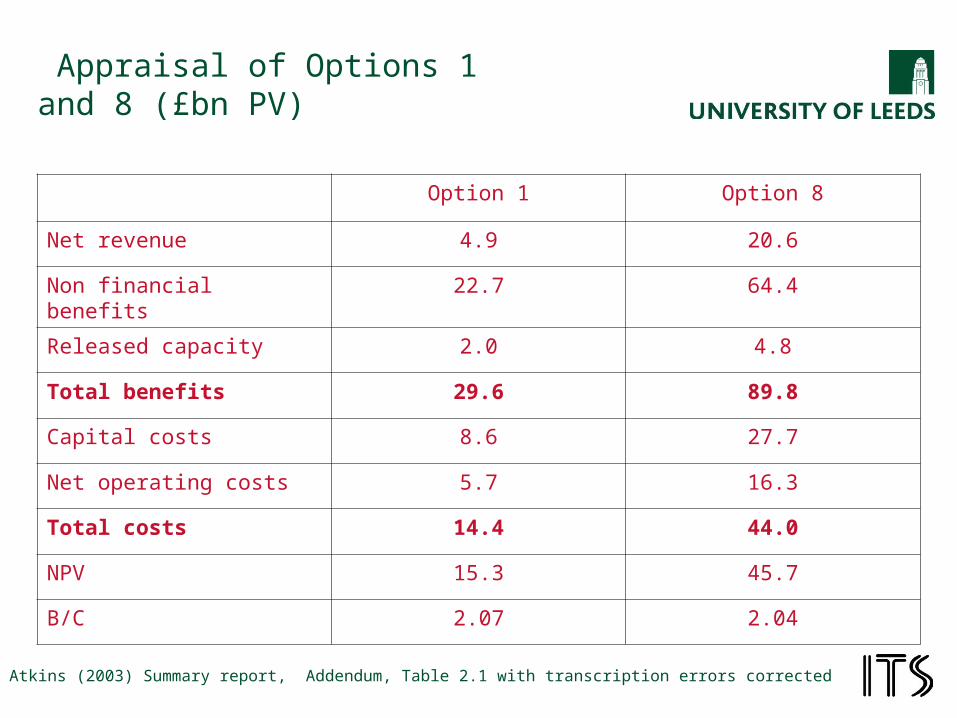
Appraisal of Options 1 and 8 (£bn PV)
Option 1 Option 8
Net revenue 4.9 20.6
Non financial benefits 22.7 64.4
Released capacity 2.0 4.8
Total benefits 29.6 89.8
Capital costs 8.6 27.7
Net operating costs 5.7 16.3
Total costs 14.4 44.0
NPV 15.3 45.7
B/C 2.07 2.04
Source Atkins (2003) Summary report, Addendum, Table 2.1 with transcription errors corrected

Unit Costs and Revenues
Option Train km Capital cost per train km
Net revenue per train km
1 55474 2.58 1.47
8 162067 2.85 2.12

Typical Access Charges for high speed passenger trains € per train-km in 2008
Source: ITF (2008), based on the approach of ECMT (2005)

Conclusions
•The costs of high speed rail can be justified in terms of time savings
•But this depends on construction costs, amount of time saved and traffic volume
•In the most favourable conditions, 6m trips p.a. are needed; more commonly 12m
•High speed rail also provide extra capacity and environmental benefits by diverting traffic from air and road
•Wider economic benefits are more uncertain

Reading
Nash, Chris (2009) When to invest in high-speed rail links and networks?Paper presented at the 18th International Transport Forum Symposium on Transport Economics, The Future of Inter Urban Passenger Transport, Madrid, Nov 2009.(www.oecd.org/transport)
SDG (2004) High Speed Rail: International Comparisons, Final report. Commission for Integrated Transport (see www.cfit.gov.uk)
Union Internationales des Chemins de Fer (2008) High speed rail. Fast track to sustainable mobility. UIC, Paris.
Union Internationales des Chemins de Fer (2008) Infrastructure Charges for High Performance Passenger Services in Europe. UIC, Paris.
(for both above see www.uic.org)