institute of innovation research hitotsubashi...
TRANSCRIPT

HitotsubashiU
niversityInstitute of Innovation R
esearch
Institute of Innovation ResearchHitotsubashi University
Tokyo, Japanhttp://www.iir.hit-u.ac.jp

0
Does file sharing reduce music CD sales?: A case of Japan
version 0.1
December, 13, 2004 Conference on IT innovation Hitotsubashi University, Tokyo
Tatsuo TANAKA
[email protected] Faculty of Economics, Keio University
Abstract
File sharing systems such as Napster and KaZaA are accused by the recording industry of
causing declines in sales of music CDs, and recently users of these systems are under lawsuit attack.
However, there is not sufficient evidence that file sharing systems are responsible for the recent
decline in music CD sales. Two previous studies examined micro data of sales and downloads and
found mixed results regarding the connection between file sharing and CD sales (Blackburn, 2004;
Oberholzer and Strumpf, 2004).
The current essay estimated the effect of file sharing systems on music CD sales using micro
data from Japan in 2004. Japan’s file sharing system (“Winny”) is almost completely decentralized
and highly anonymous compared with ones addressed in the two previous studies, thus Japanese
users can download music files with less concern about lawsuits. The goal of this research is to
examine the effect of file sharing on music CD sales in such an illegal-copy-friendly file sharing
system.
Based on micro data of CD sales and numbers of downloads, we found that there was very little
evidence that file sharing reduces music CD sales in Japan. We controlled simultaneous bias between
sales and downloads by instrumental variables, but did not find correlation between CD sales and
numbers of downloads. Although there were large differences in the numbers of downloads among
CD titles, these differences did not affect CD sales. We also carried out a user survey on file sharing
and CD purchases with consideration to the potential bias of respondents trying to understate their
illegal copying activity. This survey also showed that file sharing had very limited influence on CD
purchases.
JEL Classification: O34 Intellectual Property Rights, L82 Entertainment; Media
Keyword: Copyright, File sharing, P-to-P, Intellectual Property Rights, Music, Entertainment
Industry
Main part of this research is funded by the Mobile Society Research Institute.

1
1. Framework of optimal protection level
The goal of intellectual property rights is to give creators incentive for development
of information goods. Information goods such as technologies, music and movies can be
copied without additional cost. Thus it is optimal to price such goods at zero after the
goods are developed. However, nobody will provide information goods if they know
that the price is zero. To give incentive for development, intellectual property rights
such as the patent system and copyright were introduced. Therefore we should adjust
the strength of intellectual property rights to balance two factors--benefit of use and
benefit of incentive for development.
Let x be the strength of intellectual property rights. X can be protection periods,
scope of patents, strong law enforcement against piracy, etc. As x increases, revenue
of creators increases and encourages the development of new information goods. We
denote this benefit of new information goods as g(revenue(x)). Note that g is a function
of intermediary variable revenue. On the other hand, larger x decreases users’ benefit
because users become less free to copy information goods. Note that users include
creators (or inventors) who want to use information goods (e.g. patents) to develop their
own new information goods. We represent users’ benefit as f(x), which is a decreasing
function of x. Total benefit is a sum of users’ benefit and benefit of incentive for new
development, that is, f(x) + g(revenue(x)).
Figure 1 shows these functions. Users’ benefit f(x) is a decreasing function of x and
benefit of incentive g(revenue(x) is an increasing function of x. When we assume that
both curves are concave, the total benefit has an inverted-U form and there is a social
optimum protection level x*. If we are under this level x* we should strengthen the
protection level of property rights. But if we are beyond this level we should weaken
protection. Perfect protection of intellectual property rights is not optimal.
Figure 1
This is well understood regarding the patent system because there are many studies
that consider the function f(x) or g(revenue(x)) and argue against the too-strong patent
system. For example, Merge and Nelson (1990), based on the history of innovation,
insist that a wider scope of patents is harmful to next stage innovation. Heller and
Eisenberg (1998) reported a “tragedy of anti-commons” in the biotechnology industry--
that is, too many patent holders prevent efficient use of technology. These two studies

2
indicate that stronger patent protection could lead to welfare loss, suggesting that f(x)
has negative slope. On the other hand, Cohen, Nelson and Walsh (2000) reported that a
patent is not primarily a tool to protect intellectual property; rather, lead time of
development is more important. Lerner (2002) analyzed empirically whether stronger
patent systems encouraged the number of patents, and obtained mixed results. These
two studies are interpreted to examine whether or not g(revenue(x)) has positive slope.
In summary, as far as the patent system is concerned, it is recognized that perfect
protection is not optimal.
Regarding copyrights, however, people tend to insist on perfect protection. For
example, it is illegal to put one page of a book on a personal website or to write lyric
lines on a BBS, although these acts are unlikely to decrease creator revenue. The
European Union tried to pass a tough anti-piracy law and the Recording Industry
Association of America began suing individual P2P software users as piracy criminals.
In Japan some recording companies introduced copy-controlled compact discs that
cannot be copied to any digital media. On top of this, a programmer of file sharing
software was arrested by Japanese police. There seems to be no consideration given to
users’ benefit of copying and sharing information goods. 1
But do these illegal copying activities reduce creator revenue? In other words,
does copying reduce the sales of original information goods? If file sharing does not
reduce sales of music CDs, we should say that file sharing improves economic welfare.
Recently this is a hot topic in the music industry, especially focusing on peer to peer file
sharing. For example, Oberholzer and Strumpf, (2004) estimated the effect of file
sharing on music CD sales using individual music title data, and found no clear
correlation between sales and downloads. Blackburn (2004) also estimated the effect of
file sharing using micro data and reported that file sharing reduced the sales of big titles
of famous artists but increased the sales of many other minor titles of ordinary artists.
This paper estimated the effect of file sharing systems on music CD sales using
micro data from Japan in 2004. Japan’s file sharing system (“Winny”) is almost
completely decentralized and highly anonymous compared with ones looked at in the
two previous studies, thus Japanese users can download music files with less concern
about lawsuits. The goal of this research is to examine the effect of file sharing on music
CD sales in such an illegal copy-friendly file sharing system. Based on micro data of
CD sales and numbers of downloads, we found that there was very little evidence that
file sharing reduces music CD sales in Japan. We controlled simultaneous bias between
sales and downloads by instrumental variables, but did not find correlation between CD
sales and numbers of downloads.
1 Although a few scholars such as Lessig (2001) are against strong copyright protection, they are minorities in the
business world.

3
2. File sharing and data collection
“Winny” is the most popular file sharing system in Japan. Winny is almost
completely decentralized and does not have a central server. Since file names and
locations are decoded, users do not know from where they are downloading. Winny also
scatters intermediate files randomly in users’ hard drives, thus it is difficult to identify
the initial user who first put any particular file on the Winny network. These
characteristics account for why police in Japan consider Winny to be illegal. It is said
that this is a reason why Japanese police arrested the programmer of Winny rather than
users.
Figure 3 shows the Winny user interface. Users input the file name keyword, which
is usually a CD title or an artist’s name. Then Winny searches the files in the Winny user
network that include the keyword, and shows such files as candidates for download.
Users choose the targeted file and download begins. Fortunately, Winny displays three
useful pieces of file information: file size, referenced quantity, and hash. Hash is a
unique file code that allows identification of the file without double counting.
Referenced quantity is, approximately speaking, total downloaded quantity.2 Thus
we can estimate the number of downloads by dividing the referenced quantity by the file
size.
Figure 2
Data collection was done every weekend from June 2004 to November 2004. The
collection procedure was as follows:
(1) Obtained weekly, 30 best-selling music CD titles from Original Confidence
(albums and singles separately)
(2) Four or five researchers searched titles in the Winny user network
and obtained file data. This search was done usually on weekends.
(3) Files were identified the by the hash, and double counted ones were deleted.
(4) The number of downloads as (referenced quantity)/(file size) was
calculated.
2 Referenced quantity could increase not only by downloading, for example, but also by pure transfer triggered by Winny software or accidentally disconnected download.
4
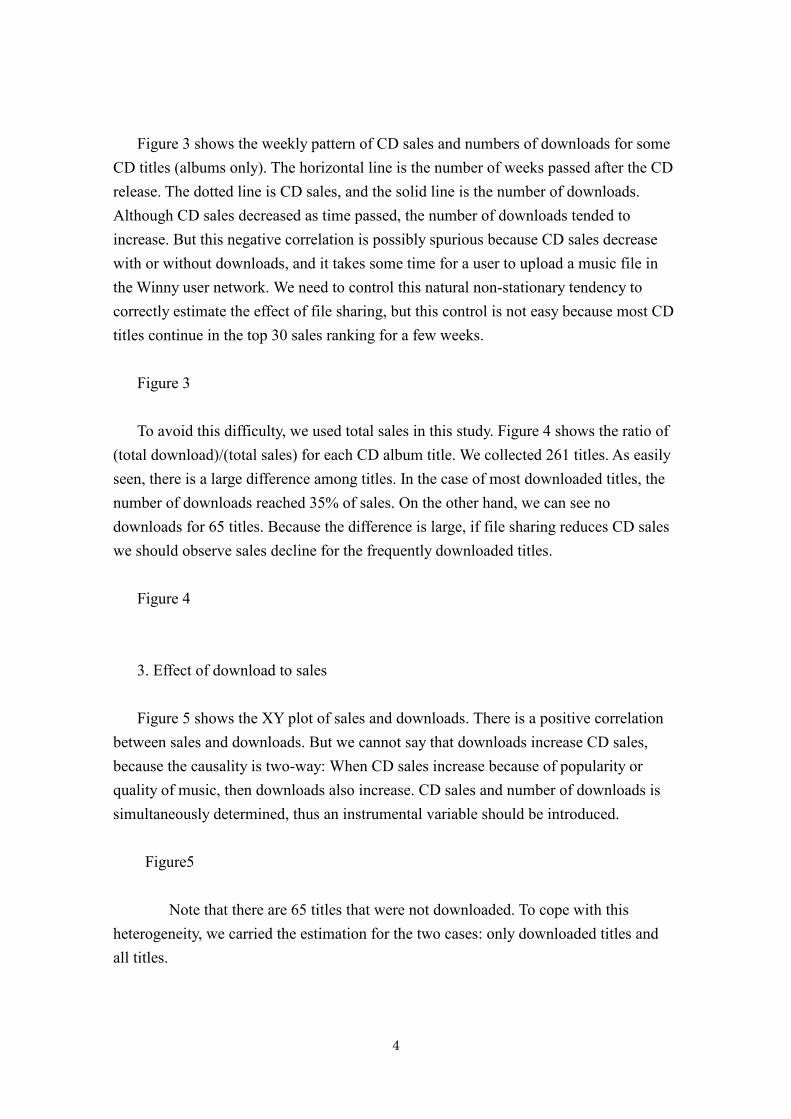
Figure 3 shows the weekly pattern of CD sales and numbers of downloads for some
CD titles (albums only). The horizontal line is the number of weeks passed after the CD
release. The dotted line is CD sales, and the solid line is the number of downloads.
Although CD sales decreased as time passed, the number of downloads tended to
increase. But this negative correlation is possibly spurious because CD sales decrease
with or without downloads, and it takes some time for a user to upload a music file in
the Winny user network. We need to control this natural non-stationary tendency to
correctly estimate the effect of file sharing, but this control is not easy because most CD
titles continue in the top 30 sales ranking for a few weeks.
Figure 3
To avoid this difficulty, we used total sales in this study. Figure 4 shows the ratio of
(total download)/(total sales) for each CD album title. We collected 261 titles. As easily
seen, there is a large difference among titles. In the case of most downloaded titles, the
number of downloads reached 35% of sales. On the other hand, we can see no
downloads for 65 titles. Because the difference is large, if file sharing reduces CD sales
we should observe sales decline for the frequently downloaded titles.
Figure 4
3. Effect of download to sales
Figure 5 shows the XY plot of sales and downloads. There is a positive correlation
between sales and downloads. But we cannot say that downloads increase CD sales,
because the causality is two-way: When CD sales increase because of popularity or
quality of music, then downloads also increase. CD sales and number of downloads is
simultaneously determined, thus an instrumental variable should be introduced.
Figure5
Note that there are 65 titles that were not downloaded. To cope with this
heterogeneity, we carried the estimation for the two cases: only downloaded titles and
all titles.

5
(1) Primary variables (endogenous variables)
Ln (sale): Natural logarithm of the sale of CDs. CD titles were collected from weekly,
30 best sellers from June 2004 to November 2004.3 Thus our sample covers CD titles
that have reached the best 30 sales at least once. Sample size is 261 for albums and 289
for single CDs. In this paper we show the estimation result for album case. Since sales
data are cumulative sales just before the titles disappear from the best 30 lists, there is
small negative bias to long-selling songs.
Ln(down): Natural logarithm of the number of downloads of CDs. Since the search
corresponds to the top 30 sales in CD titles each week, there is also small negative bias
for long-time downloaded songs. We can see no downloads for 65 of 261 titles.
(2) Explanatory variables (exogenous variables) for CD sales
Ln(psale): Natural logarithm of the artists’ previous CD sales. It is well known that
music listeners tend to continue buying the same artists’ CDs. Thus an artist’s previous
CD sales are a good predictor of current sales. The expected sign is positive.
Unfortunately, previous CD sales are available for only 149 of all CD titles. Thus we
introduce the dummy variable Npresale, which describes a case in which previous CD
sales are not available.
Npresale: dummy equal to 1 if there are no previous sales.
CCCD: Dummy variable for copy-controlled CDs. If the CD is copy-controlled,
variable CCCD is one. Whether the CD is copy-controlled or not is determined by CD
catalog data on the web site. If the CCCD prevents the casual copying of CD discs,
CCCD will increase CD sales. If users do not like CCCD because of quality loss, CCCD
may decrease CD sales. Therefore, the expected sign is unknown.
(2) Explanatory variables (exogenous variables) for number of downloads
EFK: dummy for Enka (Japanese traditional songs), family songs (such as kids exercise
records) and Korean TV songs. Listeners of these genres are middle-age and not main
users of file sharing software. Therefore, CDs of these genres are downloaded less
frequently. The expected sign is negative.
Anime: dummy for anime and video game songs. File sharing users are intensive
computer users, and tend to be anime fun or video gamers, so called otaku. If this
3 Data source is Original Confidence which is a major Japanese research company about CD sales
6
connection is large, the expected sign is positive. On the other hand, main users of
anime or game songs are children. If this connection is dominant, the expected sign is
negative.
West: dummy for western origin music. We classify the CD title as western origin music
if the language is not Japanese (or Korean). For example, a CD of Utada Hikaru is
classified as of western origin when she sings in English. We expect that listeners of
western origin music tend not to be computer intensive (otaku) users. Thus the expected
sign is negative.
D3: dummy when the title continues on the top ten list for more than three weeks
and the initial week’s sale is over 50% of total sales within the top 30 listings. Because
the download is slow-started as shown in figure 1, higher sales concentration during the
initial week may reduce the harm of downloading. The expected sign is negative.
Table 1 shows the estimation result. Case 0 is the case of simple ordinary least
squares, showing that the signs of the coefficients are as expected.
Table 1
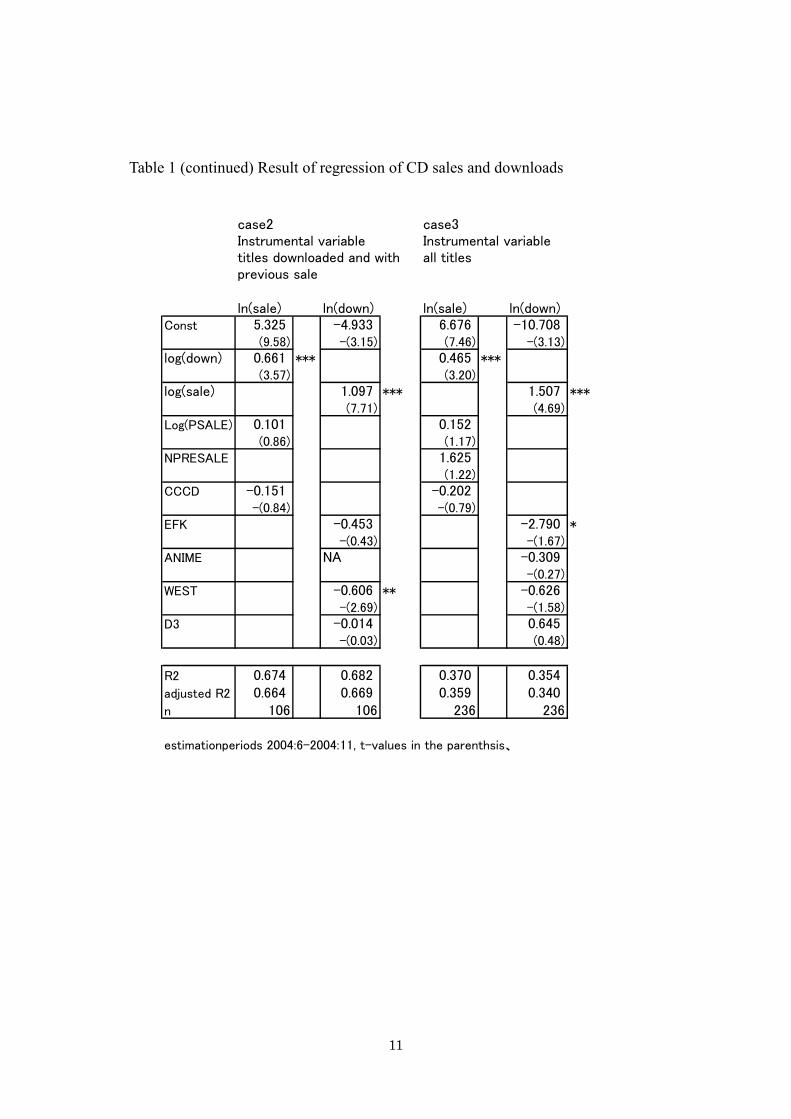
Case 1-2 is the estimation result using the instrumental variable method to cope with
simultaneous bias. In case 1 we omit 65 non-downloaded titles and use downloaded
titles only. Adding to this we omit CD titles without previous sales for case 2. Case 3
includes all CD titles.
Coefficients of ln (down) is always positive and significant. Thus downloads do not
reduce CD sales. To check the robustness of this result we tried all combinations of
explanatory variables for case 1. Since there are three combinations of explanatory
variables for ln(sale) regression and 15 combinations for ln(down) regression, we have
45 combinations of explanatory variables. Figure 6 is the distribution of estimated
coefficients of ln(down) and its t-values. T-values never reach the negatively significant
level. Therefore, this result is robust as far as these explanatory variables are concerned.
Figure 6
This regression lacks some natural explanatory variables such as a price or
advertising. But I suppose it is not likely that the coefficient of ln(down) changes
inversely; that is, becomes significantly negative even if we include other explanatory

7
variables, because there are large differences in download/sale ratio as shown in figure 4,
and the instrument variables in the ln(down) regression seem to work well.
4 Students survey on copied CDs
We conducted a student survey about illegal copying activity and CD sales. Students
were asked to profile their history of music CD purchases and file sharing and copied
CD activity from the first grade of high school to the current university grade. Students
have 5 to 8 school years, so data is unbalanced panel data. Time t is measured by school
years; that is, H1, H2, H3 (for high school grades 1, 2 and 3), and U1, U2, U3 (for
university grades 1, 2 and 3). Sample size was 501, and the number of total observations
was 2,165. Recall that students were asked to remember their CD purchase history and
file sharing and copied CD activity. Thus the reliability of this data depends on the
accuracy of students’ memories. Sample students were chosen from an undergraduate
course at Keio University in 2003 and 2004.
(1) Explained variable
CDpurchaseit : number of music CDs that survey participant purchased per year at
school year t.
(2) Primary explanatory variable
PtoPit: dummy variable equal to one after survey participant started using PtoP software.
If file sharing reduces CD purchases as the recoding industry insists, the sign of this
variable would be negative.
(3) Other explanatory variables: control variables
CopyCDit: dummy variable equal to one after survey participant started using copied
CDs. If use of copied CDs reduces CD purchases, the sign would be negative.
Mphoneit: mobile phone expenditure per month. Unit is 1000 yen. Expenditure on
mobile phones has increased rapidly during the past five years, along with the decline in
CD sales. The expected sign is negative.
CDRit: dummy variable equal to one after survey participant bought a CDR drive. Since
a CDR drive is used to make copied CDs, the sign of this variable could be negative if

8
copied CDs reduces CD purchases.
U3it: dummy variable equal to one when time t is the third grade of university. Share of
data of third grade university students is only a few percent, but their CD purchase
activity is unexpectedly low. This is caused by sampling bias. This dummy variable is
introduced to cope with this outlier effect. Omitting this variable does not change the
major conclusion of this paper, it only reduces the fitting (R square) slightly.
The panel regression result is shown in table 2. Cases (1) (2) and (3) are the fixed
effect model, and case (4) is the random effect model. Coefficient of PtoP is 1.747 in the
fixed effect model and 2.065 in the random effect model, and significant at 10% and 5%
respectively. To check the robustness of this result we omitted control variables, COPY
CDR and U3 respectively and found that the result is the same.
This result indicates that use of file sharing software increases CD purchases. This
may be surprising, but we have several explanations for this result. First, this positive
correlation is caused by students’ changing demand for music. If a student suddenly
gets interested in music, he or she starts to buy more CDs, but at the same time he or she
may start using file sharing to listen to much music at no charge. In this case, the
positive correlation between purchase and the use of file sharing is spurious and there
still can be negative correlation between file sharing and CD purchases if we control
this simultaneous bias. Second, users can use file sharing as a search tool to find
favorite music. This is a kind of effect network discussed by Takeyama (1994). If this
effect is large, illegal file sharing could raise CD purchases. In this case, file sharing
truly has a positive effect on CD purchases.
5. Conclusion
This research is very preliminary because we have not yet tried sufficient
instrumental variables. Therefore, we cannot commit to a decisive conclusion. However,
it is worth reporting that we did not find any negative effect of file sharing on CD sales.
Specifically, according to micro download data, downloads do not reduce CD sales and
student surveys show that use of file sharing does not reduce CD purchases.
Let us assume that we accept this result and go back to Figure 1. What is the policy
implication? Let the change from x 1 to x 2 in figure 1 be an introduction of file sharing
software. Then as far as this change in concerned, g(revenu(x)) does not decrease. Since
9
users’ benefit f(x) surely increases by the use of file sharing software, total benefit
f(x)+g(revenue(x)) increases by file sharing software. Therefore, bans on file sharing
software should be blocked from the perspective of economic welfare.
References
Blackburn, David. 2004, “Does File Sharing Affects Record Sales?” Conference paper,
International Industrial organization, April 2004, Chicago.
Cohen, Wesley M, Richard R. Nelson, John P. Walsh, 2000, "Protecting Their
Intellectual Assets: Appropriability Conditions and Why U.S. Manufacturing firms
Patent (or Not)," NBER Working Paper 7552.
Heller, A. Michael and Rebecca S. Eisenberg, 1998, "Can Patents Deter Innovation?
-The Anticommons in Biomedical Research," Science 280.
Lerner, Josh, 2002, "Patent Protection and Innovation over 150 years," NBER Working
paper No 8977.
Lessig, L. 2001, The Future of Ideas, Random House.
Merges, Robert P. and Richard R. Nelson, 1990,"On the Complex Economics of Patent
Scope," Columbia Law Review, Vol.90 (May, 1).
Oberholzer, Felix and Koleman Strumpf, 2004, "The Effect of File Sharing on Record
Sales: An Empirical Analysis," Working paper,
http://www.unc.edu/~cigar/papers/FileSharing_March2004.pdf
Takeyama, N. Lisa, 1994, "The Welfare Implications of Unauthorized Reproduction of
Intellectual Property in the Presence of Demand Network Externalities," The Journal
of Industrial Economics, Vol. 42, No. 2. (Jun., 1994), pp. 155-166.

10
Table 1 Result of regression of CD sales and downloads
case0 case1Ordinary least square Instrumental variabledownloaded titles only downloaded titles only
ln(sale) ln(down) ln(sale) ln(down)Const 5.394 -3.070 5.278 -5.369
(8.82) -(4.32) (8.14) -(3.03)ln(down) 0.539 *** 0.714 ***
(12.38) (4.20)ln(sale) 0.923 *** 1.136 ***
(14.26) (6.99)Ln(PSALE) 0.170 ** 0.070
(2.77) (0.62)NPRESALE 1.770 ** 0.714
(2.63) (0.59)CCCD -0.027 -0.089
-(0.16) -(0.49)EFK -1.49 *** -1.200
-(2.85) -(1.39)ANIME -0.071 0.237
-(0.15) (0.40)WEST -0.589 *** -0.496 **
-(3.13) -(2.47)D3 0.432 -0.104
(1.05) -(0.18)
R2 0.571 0.575 0.562 0.574adjusted R2 0.561 0.564 0.552 0.561n 177 196 177 177
estimationperiods 2004:6-2004:11, t-values in the parenthsis、
11
Table 1 (continued) Result of regression of CD sales and downloads
case2 case3Instrumental variable Instrumental variabletitles downloaded and with all titlesprevious sale
ln(sale) ln(down) ln(sale) ln(down)Const 5.325 -4.933 6.676 -10.708
(9.58) -(3.15) (7.46) -(3.13)log(down) 0.661 *** 0.465 ***
(3.57) (3.20)log(sale) 1.097 *** 1.507 ***
(7.71) (4.69)Log(PSALE) 0.101 0.152
(0.86) (1.17)NPRESALE 1.625
(1.22)CCCD -0.151 -0.202
-(0.84) -(0.79)EFK -0.453 -2.790 *
-(0.43) -(1.67)ANIME NA -0.309
-(0.27)WEST -0.606 ** -0.626
-(2.69) -(1.58)D3 -0.014 0.645
-(0.03) (0.48)
R2 0.674 0.682 0.370 0.354adjusted R2 0.664 0.669 0.359 0.340n 106 106 236 236
estimationperiods 2004:6-2004:11, t-values in the parenthsis、

12
Table 2 Student survey: Panel regression
pooled between within random
C 7.158 *** 6.431 *** 7.995 ***
(13.01) (4.89) (11.38)
MP 0.104 0.177 0.036 0.042
(1.22) (0.87) (0.44) (0.56)
COPY 0.683 1.733 -0.188 0.069
(0.80) (0.88) -(0.23) (0.07)
RW 0.434 1.256 0.199 0.222
(0.50) (0.59) (0.25) (0.30)
NY 3.300 ** 4.261 1.747 * 2.065 **
(3.03) (1.63) (1.76) (2.24)
UNIV3 -4.221 * -13.514 -1.894 -2.248
-(1.83) -(1.07) -(1.26) -(1.51)
R2 0.0096 0.0166 0.7288 0.0092
adjustedR2 0.0073 0.0067 0.6463 0.0069
n 501 501 501 501
# of obs 2156 2156 2156 2156
Hausman test: Chi(5)=5.014 (P-value=0.4141)

13
Figure 1 Optimum protection level of Intellectual property rights
Users’ benefit.
(Users include next stage innovators)
f(x) g(revenue(x))
f(x) g(revenue(x))
Total benefit
fx) + (revenue(x))
weak Protection of IPR strong
Incentive for development
x2 � x1

14
Figure 2 User interface of Winny
Size(byte) (e.g. 5,719,857)
Referred Quantity (Mbyte) (e.g. 1,447)
Example 1447/5.719857 = 252.978 times referred

15
Figure 3 CD sales and number of downloads in every week after CD release
Horizontal line is number of weeks after CD release.
夏雲ノイズ
0
10000
20000
30000
40000
50000
60000
1 2 3 4 5 6 7
0.0
1000.0
2000.0
3000.0
4000.0
5000.0
6000.0
7000.0
8000.0
oricon Winny
新たなる香辛料を求めて
0
5000
10000
15000
20000
25000
30000
35000
1 2 3 4 5 6 7 8
0.0
5000.010000.0
15000.0
20000.0
25000.030000.0
35000.0
40000.0
oricon Winny
Kevin Little
0
2000
4000
6000
8000
10000
12000
1 2 3 4 5 6 7 8
0.0200.0400.0600.0800.01000.01200.01400.01600.0
oricon Winny
05000
100001500020000250003000035000
1 2 3 4 5 6 7 8 9
0.05000.010000.015000.020000.025000.030000.035000.0
oricon Winny
冬の恋歌 国内盤
0
10000
20000
30000
40000
50000
1 2 3 4 5 6 7 8 9
0.0
2000.0
4000.0
6000.0
8000.0
oricon Winny
1st CONTACT
0
2000
4000
6000
8000
10000
1 2 3 4 5 6
0.0
2000.0
4000.0
6000.0
8000.0
10000.0
12000.0
14000.0
oricon Winny

16
Figure 4 Downloads/sales ratio
Figure 5 Sales vs Downloads
Sales vs
Downloads
1000
1000 0
1000 00
1000 000
1000 000 0
1 10 100 1000 1000 0 1000 00
dow nloads
sal
es
Note :
log(download+1 )
download/sales (unit=%)
0.000
5.000
10.000
15.000
20.000
25.000
30.000
35.000
40.000
1
11
21
31
41
51
61
71
81
91
101
111
121
131
141
151
161
171
181
191
201
211
221
231
241
251
261
rank
dow
nlo
ad/sa
les(
%)
zero-downloaded for 65 titles

17
Figure 6
Distrib
utio
n of co
efficient an
d t-v
alues :
For all co
mbinatio
ns o
f explan
atory variab
les
Distribu
tion o
f t-valu
e
0 2 4 6 8
10
12
~-1
-1~-0.5
-0.5~0.0
0.0~0.5
0.5~1.0
1.0~1.5
1.5~2.0
2.0~2.5
2.5~3.0
3.0~3.5
3.5~4.0
4.0~4.5
4.5~5.0
5.0~5.5
5.5~6.0
t-valu
es
frequency
Distribu
tion o
f coeffic
ents o
f log(do
wnlo
ad)
0 5
10
15
20
25
~-1
-1~-0.6
-0.6~-0.2
-0.2~0.2
0.2~0.6
0.6~1.0
1.0~1.4
1.4~1.8
1.8~2.2
2.2~2.6
2.6~3.0
3.0~3.4
3.4~3.8
3.8~4.2
4.2~4.6
coeffie
nts o
f log (do
wnlo
ad)
frequency