richard baldwin background paper - hitotsubashi university
TRANSCRIPT
1
UnveilingtheevolvingsourcesofvalueaddedinexportsRichard Baldwin, Rikard Forslid and Tadashi Ito
Draft: February 2015
1. INTRODUCTION
Export growth has long been considered an essential aspect of nations’ prosperity. Traditionally, exports were broken down into primary goods, manufactured goods and services – with a great emphasis on manufactured exports given the critical role of industry in technological progress and GDP growth. Changes in recent years – known as ‘servicification’ in Europe and the ‘smile curve’ in Asia (Baldwin, Ito and Sato 2014) – have blurred these categories.
Servicification and smile-curve analysis refer to changes in the sources of value in manufacturing – specifically the increased role of services in manufactured goods. The importance of this change has long been noted in policy and business (Kimura 2003). The basic point was popularised with the well-known example of Apple’s iPod where the lion’s share of this manufactured goods was actually created in the service sector; most of the value-added in an iPod comes from services produced in the US, not fabrication in China (Linden, Kraemer and Dedrick (2009).
Such anecdotes have recently been supplemented by more systemic empirical evidence due to the breakthrough came with the development of ‘value added trade’ concepts (Koopman, Wang and Wei 2014, Timmer et al 2014). These enabled and encourage the implementation in large multinational input-output tables such as World Input-Output Database (WIOD) and the Trade in Value Added (TIVA) database, which added many North American and European nations to the nation-coverage that existed hereto in the Asian Input-Output (AIO) table (maintained by IDE-JETRO since the 1970s). These new ways of thinking about exports and new data sets have allowed economists to trace out the true origin of value added in exports by nation and by sector. The results are striking.
1.1. SERVICIFICATION OF MANUFACTURING The value added in a given dollar of manufactured exports can be decomposed into shares of value that are added in the primary sector (e.g. the cost of raw materials), in the manufacturing sector (e.g. fabrication), and in the service sector. The latter consist of services that are necessary to make and export the manufactured goods such as R&D, transportation, business services, and retail and wholesale services. OECD (2014) has shown that properly accounting for the service-sector origin of manufactured value added indicates that services accounts for about half the EU’s and US’s exports. Pilat (2005), Pilat et al. (2008) have shown that the service sector share has risen steeply in OECD nations. Lodefalk (2013) shows that the share of services in total Swedish inputs doubled between 1975 and 2005. He also shows that services embed in Swedish manufactured goods account for a major share of Sweden’s Centre for Economic Policy Research, Graduate Institute, Geneva, and University of Oxford Centre for Economic Policy Research and University of Stockholm Institute of Developing Economics, Japan External Trade Organisation
2
service exports. Similar studies show the same trend in other individual European nations (Boddin and Henze 2014, Crozet and Milet 2014, Kelle 2013, Kelle and Kleinert 2010). Baldwin, Ito and Sato (2014) show that the share of value added in manufactured products has shifted decisively away from manufacturing and towards services since the 1990s in Asia using the AIO tables.
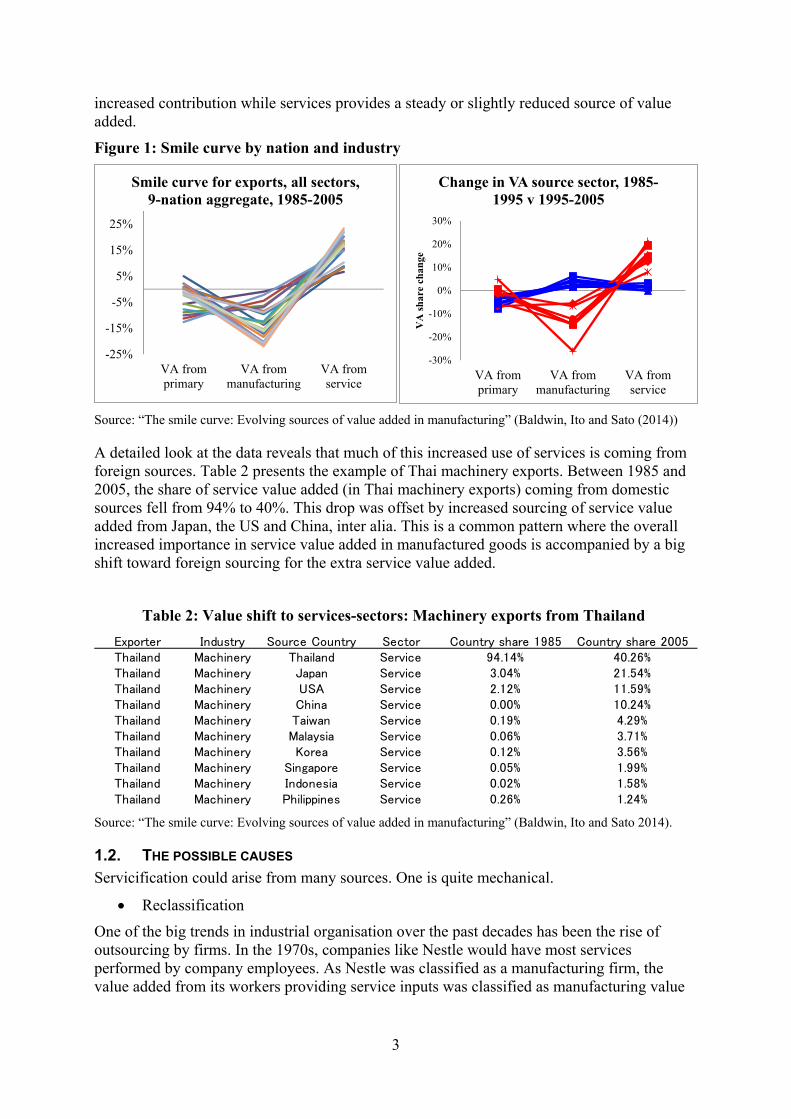
The left panel of Figure 1 illustrates the magnitude of the effect using a 22-sector breakdown of exports. The chart plots one line for each of the 22 sectors (which range from livestock to trade and transport services).1 Each line displays three shares: the change, between 1985 and 2005, in the share of export value added that ultimately originates in the primary, manufacturing or service sectors. For example for machinery exports, the three-way allocation of value added input shares was 5.3%, 83.4% and 11.3% (for primary, manufacturing and services) in 1985 (Table 1). This shifted to 4.7%, 62.2% and 33.1% by 2005. Figure 1 plots the changes in the shares, namely -0.6, -21.2 and +21.8 percentage points.
Table 1: Example of economy wide smile curve: Machinery exports
VA source‐sector: VA share 1985 VA share 2005 Change
Primary 5.3% 4.7% ‐0.6%
Manufacturing 83.4% 62.2% ‐21.2%
Service 11.3% 33.1% 21.8%
Source: “The smile curve: Evolving sources of value added in manufacturing” (Baldwin, Ito and Sato (2014).
The key point that comes out of Figure 1 (left panel) is that the service value-added content of all exports has risen substantially, while the manufacturing share has decreased substantially.
The right panel of Figure 1 shows the pattern is also pervasive when we slice the data by exporting nations rather than exporting sectors. Again each line show three changes in value added source-sector shares. The red lines show the changes for all the Asian nations in our sample over the 1995 to 2005 period. Plainly the servicification of manufacturing is clear in the sense that services are more important in export value added for all the nations and manufacturing is a less important source of value added.
The remarkable point here is that the pattern does not differ substantially between developed and developing nations.2 For almost all of the 9 Asian nations in the AIO database, the increase in services as the value added source is on the order of twenty percentage points. Another key point is that – somewhat surprisingly – the pattern of servicification is quite similar for high-technology nations like Japan and Korea, and low-wage nations like the Philippines.
The second remarkable fact emerging from the right panel of Figure 1 is that the smile curve seems to be a relatively recent phenomenon. Looking at the 1985 to 1995 period, which are shown by blue lines, we see the mirror image pattern with manufacturing providing an
1 Specifically, the sectors are Paddy, Other agricultural products, Livestock, Forestry, Fishery, Crude petroleum and natural gas, Other mining, Food, beverage and tobacco, Textile, leather, and the products thereof, Timber and wooden products, Pulp, paper and printing, Chemical products, Petroleum and petrol products, Rubber products, Non‐metallic mineral products, Metal products, Machinery, Transport equipment, Other manufacturing products, Electricity, gas, and water supply, Construction, and Trade and transport. 2 The lines are not labelled by nation (to avoid cluttering the chart).
3
increased contribution while services provides a steady or slightly reduced source of value added.
Figure 1: Smile curve by nation and industry
Source: “The smile curve: Evolving sources of value added in manufacturing” (Baldwin, Ito and Sato (2014))
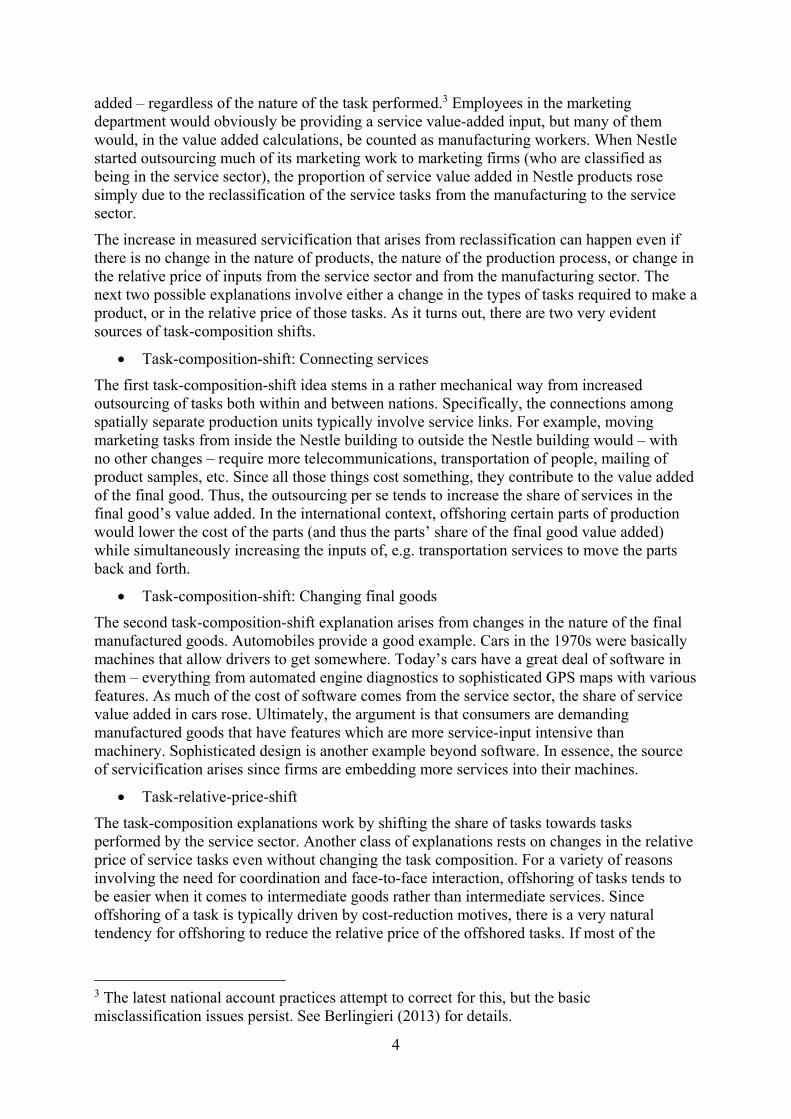
A detailed look at the data reveals that much of this increased use of services is coming from foreign sources. Table 2 presents the example of Thai machinery exports. Between 1985 and 2005, the share of service value added (in Thai machinery exports) coming from domestic sources fell from 94% to 40%. This drop was offset by increased sourcing of service value added from Japan, the US and China, inter alia. This is a common pattern where the overall increased importance in service value added in manufactured goods is accompanied by a big shift toward foreign sourcing for the extra service value added.
Table 2: Value shift to services-sectors: Machinery exports from Thailand
Source: “The smile curve: Evolving sources of value added in manufacturing” (Baldwin, Ito and Sato 2014).
1.2. THE POSSIBLE CAUSES Servicification could arise from many sources. One is quite mechanical.
Reclassification
One of the big trends in industrial organisation over the past decades has been the rise of outsourcing by firms. In the 1970s, companies like Nestle would have most services performed by company employees. As Nestle was classified as a manufacturing firm, the value added from its workers providing service inputs was classified as manufacturing value
-25%
-15%
-5%
5%
15%
25%
VA fromprimary
VA frommanufacturing
VA fromservice
Smile curve for exports, all sectors, 9-nation aggregate, 1985-2005
-30%
-20%
-10%
0%
10%
20%
30%
VA fromprimary
VA frommanufacturing
VA fromservice
VA
sha
re c
hang
e
Change in VA source sector, 1985-1995 v 1995-2005
Exporter Industry Source Country Sector Country share 1985 Country share 2005Thailand Machinery Thailand Service 94.14% 40.26%Thailand Machinery Japan Service 3.04% 21.54%Thailand Machinery USA Service 2.12% 11.59%Thailand Machinery China Service 0.00% 10.24%Thailand Machinery Taiwan Service 0.19% 4.29%Thailand Machinery Malaysia Service 0.06% 3.71%Thailand Machinery Korea Service 0.12% 3.56%Thailand Machinery Singapore Service 0.05% 1.99%Thailand Machinery Indonesia Service 0.02% 1.58%Thailand Machinery Philippines Service 0.26% 1.24%
4
added – regardless of the nature of the task performed.3 Employees in the marketing department would obviously be providing a service value-added input, but many of them would, in the value added calculations, be counted as manufacturing workers. When Nestle started outsourcing much of its marketing work to marketing firms (who are classified as being in the service sector), the proportion of service value added in Nestle products rose simply due to the reclassification of the service tasks from the manufacturing to the service sector.
The increase in measured servicification that arises from reclassification can happen even if there is no change in the nature of products, the nature of the production process, or change in the relative price of inputs from the service sector and from the manufacturing sector. The next two possible explanations involve either a change in the types of tasks required to make a product, or in the relative price of those tasks. As it turns out, there are two very evident sources of task-composition shifts.
Task-composition-shift: Connecting services
The first task-composition-shift idea stems in a rather mechanical way from increased outsourcing of tasks both within and between nations. Specifically, the connections among spatially separate production units typically involve service links. For example, moving marketing tasks from inside the Nestle building to outside the Nestle building would – with no other changes – require more telecommunications, transportation of people, mailing of product samples, etc. Since all those things cost something, they contribute to the value added of the final good. Thus, the outsourcing per se tends to increase the share of services in the final good’s value added. In the international context, offshoring certain parts of production would lower the cost of the parts (and thus the parts’ share of the final good value added) while simultaneously increasing the inputs of, e.g. transportation services to move the parts back and forth.
Task-composition-shift: Changing final goods
The second task-composition-shift explanation arises from changes in the nature of the final manufactured goods. Automobiles provide a good example. Cars in the 1970s were basically machines that allow drivers to get somewhere. Today’s cars have a great deal of software in them – everything from automated engine diagnostics to sophisticated GPS maps with various features. As much of the cost of software comes from the service sector, the share of service value added in cars rose. Ultimately, the argument is that consumers are demanding manufactured goods that have features which are more service-input intensive than machinery. Sophisticated design is another example beyond software. In essence, the source of servicification arises since firms are embedding more services into their machines.
Task-relative-price-shift
The task-composition explanations work by shifting the share of tasks towards tasks performed by the service sector. Another class of explanations rests on changes in the relative price of service tasks even without changing the task composition. For a variety of reasons involving the need for coordination and face-to-face interaction, offshoring of tasks tends to be easier when it comes to intermediate goods rather than intermediate services. Since offshoring of a task is typically driven by cost-reduction motives, there is a very natural tendency for offshoring to reduce the relative price of the offshored tasks. If most of the
3 The latest national account practices attempt to correct for this, but the basic misclassification issues persist. See Berlingieri (2013) for details.
5
offshored tasks are things performed by the manufacturing sector, the offshoring would – in very mechanical way raise service value added in final manufactured goods.
The point can be illustrated with a numerical example. Suppose that a car is made with three things: oil, assembly workers and designers. Initially all three are combined inside a factory in, say, the US and – to be concrete – the oil costs $20 per car, the assembly worker costs $20 per car, and the design services cost $20. The total value added of the car is $60 with a third come from the primary sector (oil), a third from the manufacturing sector (assembly) and a third from the service sector (design services). If the assembly is offshored to Mexico and its cost falls to $10, the car will appear to have been servicified – even if there is no reclassification, no shift in task-composition. Now, because of the shift in task relative prices, the service value added share is 20/50, which is higher than the pre-offshoring share of 20/60.
2. A SIMPLE MODEL OF OUTSOURCING AND SERVICIFICATION
This section presents a very simple model that illustrates how outsourcing could produce the servicification of manufacturing.
In the model, the production of one unit of a manufacturing good is associated with a fixed set of tasks that are either performed inside the firm by a (composite) factor of production, L, or outsourced.4 The size of tasks is normalized so that one unit of L is required for one task, and the range of tasks is normalized to the interval [0,1]. Tasks can be undertaken within the firm or outsourced; we denote n as the numbers of tasks outsourced so 1-n are done within the firm. The tasks are not ordered, so this is a ‘spider’ production process rather than a sequential ‘snake’ process in the terms of Baldwin and Venables (2014).
Outsourcing involves costs in terms of transportation services, services of intermediaries etc. The cost of outsourcing varies among tasks, and we order tasks in increasing cost of outsourcing, so tasks with a higher index involve higher outsourcing costs. The extra units of service required when outsourcing tasks from i = 0 to i = n is given by g(n), with g’(n)>0, g’’(n)>0. We denote the (constant) unit cost of service as c so the total extra service cost is cg(n).
The cost of producing one task within the firm is w. Its cost when outsourced is w*, where w*<w (this provides incentives for outsourcing). We do not, in this model, distinguish between domestic and foreign outsourcing, since we are trying to illustrate the logic of servicification overall. In this set up, the simple cost minimization outsourcing problem facing a typical firm is:
)(*)1(min ngcnwnwn
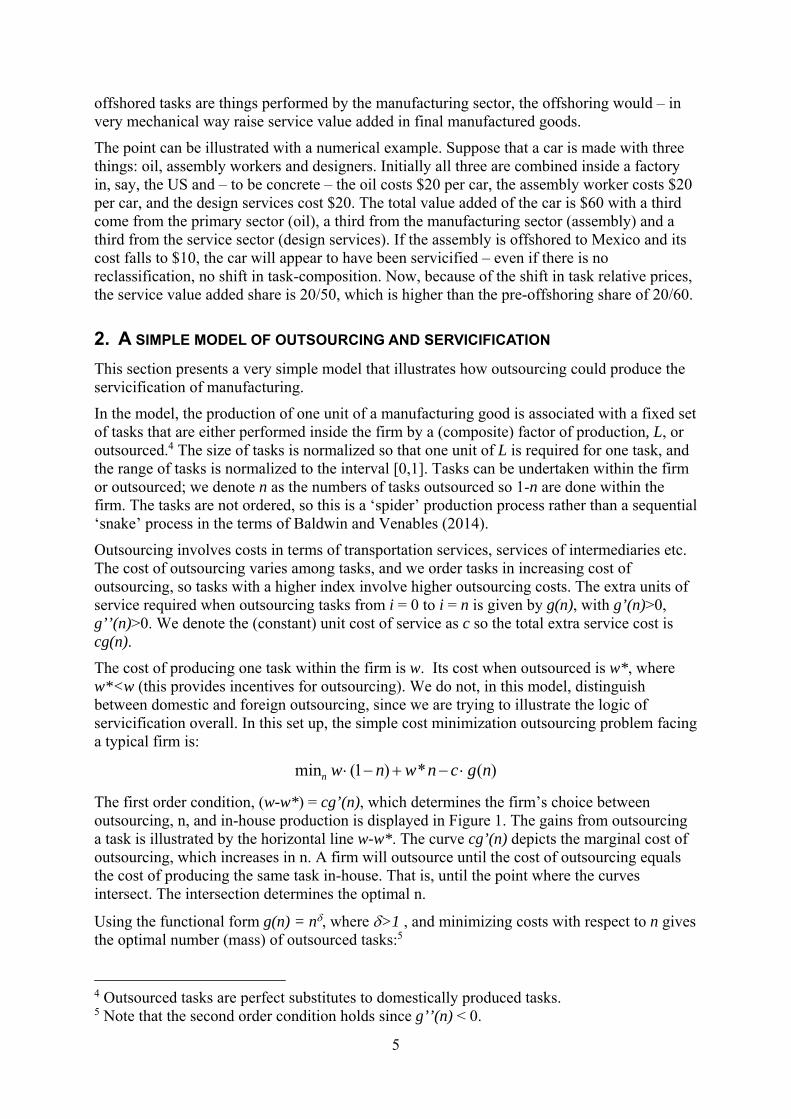
The first order condition, (w-w*) = cg’(n), which determines the firm’s choice between outsourcing, n, and in-house production is displayed in Figure 1. The gains from outsourcing a task is illustrated by the horizontal line w-w*. The curve cg’(n) depicts the marginal cost of outsourcing, which increases in n. A firm will outsource until the cost of outsourcing equals the cost of producing the same task in-house. That is, until the point where the curves intersect. The intersection determines the optimal n.
Using the functional form g(n) = n, where >1 , and minimizing costs with respect to n gives the optimal number (mass) of outsourced tasks:5
4 Outsourced tasks are perfect substitutes to domestically produced tasks. 5 Note that the second order condition holds since g’’(n) < 0.
6
)1/(1*
'
c
wwn (1)
Figure 1: Optimal outsourcing
Source: Authors’ elaboration.
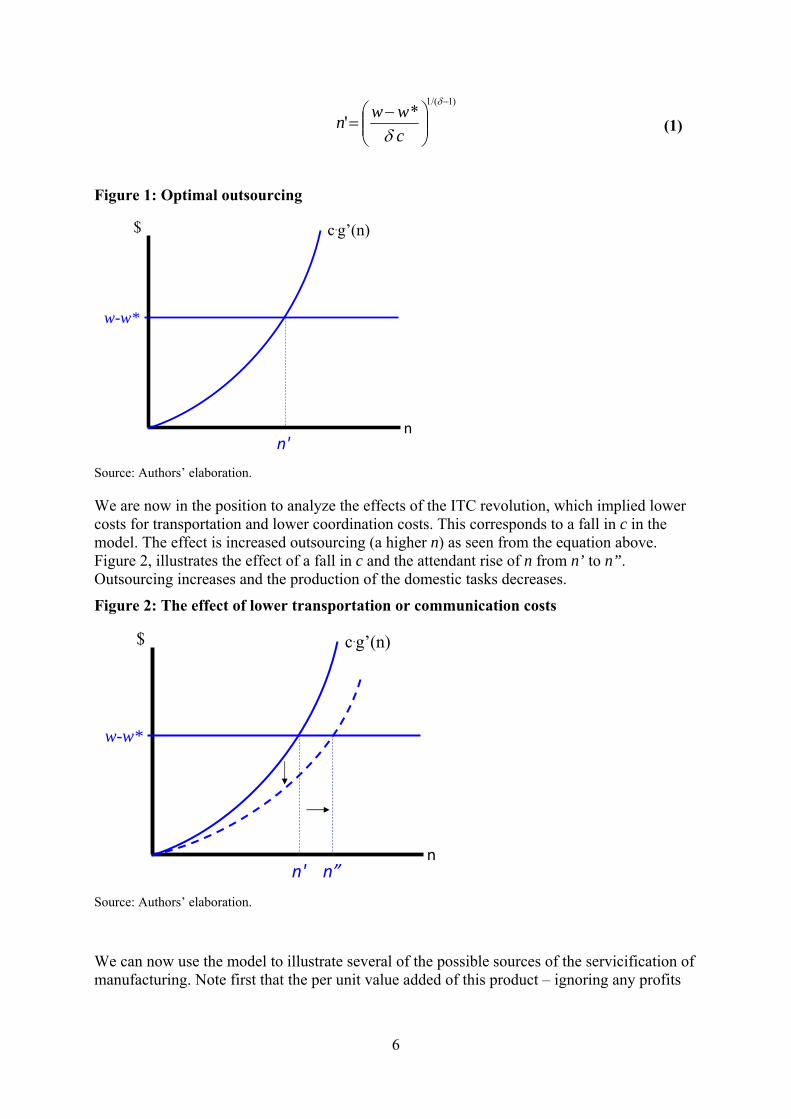
We are now in the position to analyze the effects of the ITC revolution, which implied lower costs for transportation and lower coordination costs. This corresponds to a fall in c in the model. The effect is increased outsourcing (a higher n) as seen from the equation above. Figure 2, illustrates the effect of a fall in c and the attendant rise of n from n’ to n”. Outsourcing increases and the production of the domestic tasks decreases.
Figure 2: The effect of lower transportation or communication costs
Source: Authors’ elaboration.
We can now use the model to illustrate several of the possible sources of the servicification of manufacturing. Note first that the per unit value added of this product – ignoring any profits
n'
$
w-w*
c.g’(n)
n
$
w-w*
c.g’(n)
nn' n”
7
since we are working with perfect competition – is just the costs, namely )(*)1( ncgnwnwVA . The service value added share is
)()*)((
)(*shareVA Service
21
1
ncgnnwww
ncgnw
(2)
where n1 and n2 are the outsourced tasks that are reclassified as service tasks and those that are not (respectively). In our simple set up, the service value-added share was zero so (2) gives the change in the service value added share for this product.
The two terms in the numerator show two sources of servicification. First, outsourced tasks (n1) which are service tasks that were previously misclassified as manufacturing tasks raise the service value added share. Here outsourcing involves a reclassification where tasks that previously were performed by a manufacturing firm, and therefore where classified as manufacturing value added, now become reclassified as service value added. Second, while the outsourcing saving money for the producer (it is cost-minimizing), extra connection services are required. This is a task-composition-shift related to connecting services, where the service share of export increases.
The denominator shows the task-relative-price-shift effect. As all the outsourced tasks involve lower costs, i.e. w* instead of w, the outsourcing (i.e. higher n) tends to boost the service value added share. Since the cost of the connecting services is unaffected by the choice of n, the impact is seen for both reclassified (n1) and un-reclassified tasks (n2), but it is strongest for the un-reclassified ones.
3. EVIDENCE SUGGESTING AN EMPIRICAL STRATEGY
When thinking about which causes of pervasive servicification are likely to be important, two additional questions arise immediately:
Which service sectors are most important in supplying the extra service value added to exports?
Which nations provided the heightened service value added to exports?
An advantage of AIO table is its detailed industry classification, which makes it a suitable data set to analyse the source of service value added by sector and by supplying country.
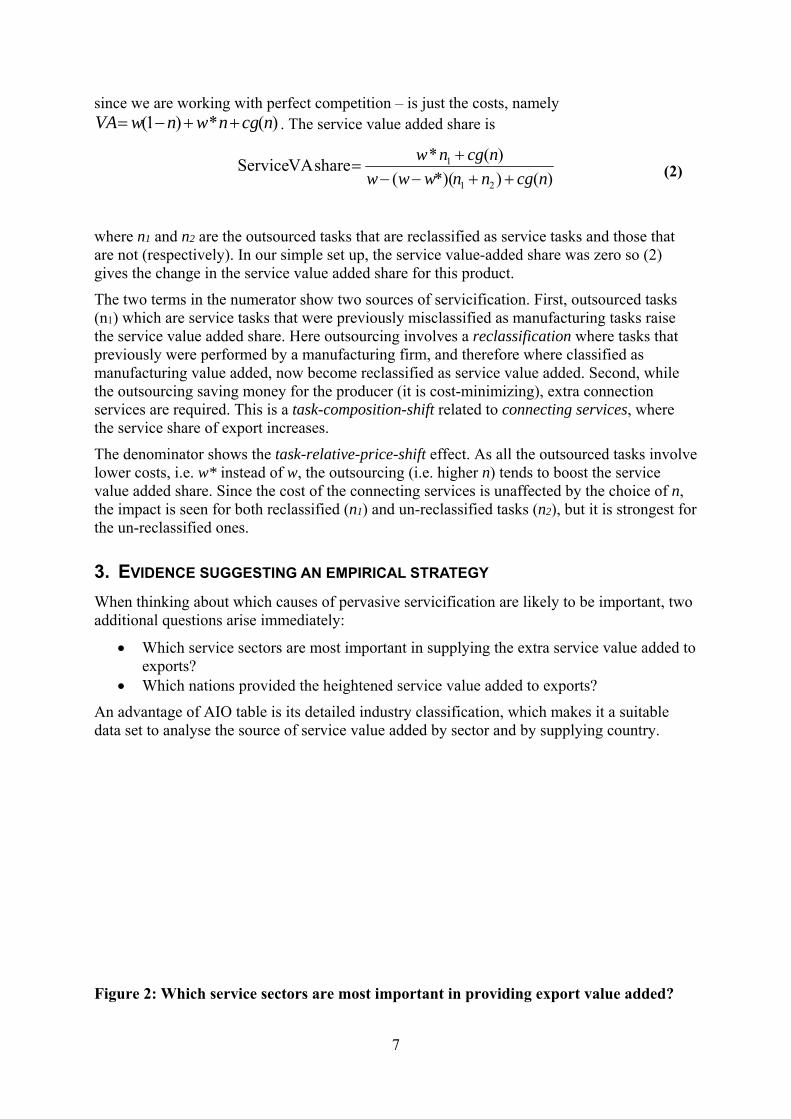
Figure 2: Which service sectors are most important in providing export value added?
8
Source: Authors’ calculations on IDE-JETRO AIO database.
Figure 2 shows the contribution of the various service industries to export value-added from 1990. The top left panel shows the aggregate for all nine Asian nations in our sample, namely the three big nations (Japan, Korea and China), five ASEAN nations (Malaysia, Indonesia, Thailand, Philippines and Singapore), and Taiwan. Plainly the rise in service value added contributions to export value is concentrated in just three service industries, namely Transportation services, Retail and Wholesale services, and Other services. Consider these in turn.
The rise in the cost share of transportation services – recall that a supplying industry’s value added share in exports is also its cost share – is perfectly in line with the ‘Task-composition-shift: Connecting services’ explanation discussed above. As manufacturing firms spatially disperse production, goods that used to be shipped only once from one factory to consumers are now shipped among factories before being shipped to consumers.
The augmented role of Retail and Wholesale services is suggestive of the same cause. International production networks are not all organised inside the same firm (Gereffi 2014). In this case, more ‘middle men’ could be expected to be involved in the ‘connecting services’. Along the same lines, it is also possible that some of the change is down to reclassification. To the extent that good ICT lowers transaction costs and thus lowers the benefits of organising things inside a single firm, we could expect that one of the things that might be
Building
Retail & Wholesale
Transport
Telecom
FinInsur
Other Services
Govt
Unclass
-
0.5
1.0
1.5
2.0
2.5All 9 countries
Building
Retail & Wholesale
Transport
Telecom
FinInsur
Other Services
Govt
Unclass
-
0.2
0.4
0.6
0.8
1.0Japan
Building
Retail & Wholesale
Transport
Telecom
FinInsur
Other Services
Govt
Unclass
-
0.1
0.2
0.3
0.4
0.5China
Building
Retail & Wholesale
Transport
Telecom
FinInsur
Other Services
Govt
Unclass
-
0.0
0.0
0.1
0.1
0.1Thailand
9
outsourced from the original manufacturing firms is service task such as shepherding the shipping of parts and components along the supply chain.
There are also indications that some manufacturing value added is being reclassified as wholesale activity due to extreme production unbundling. Bernard and Fort (2013) use US establishment activities to show that some service sector value added really should be considered as manufacturing value added. In particular, some firms in the wholesale sector are actually heavily involved in activities related to the production of manufactured goods. These so-called ‘factoryless goods producers’ – such as the vacuum firm Dyson – design the goods and coordinate the production activities without actually owning factories. This is not a small scale anomaly. Reclassifying ‘factoryless goods producers’ back to the manufacturing sector (where they arguable belong) would shift between 0.6 and 1.3 million US workers wholesale to manufacturing, in 2002, and between 0.4 and 1.9 million in 2007. To the extent that this issue plagues the statistical practices of Asian nations, the rapid rise in Retail and Wholesale service inputs may partly reflect a misclassification of value added from manufacturing to services.
The prominent role for ‘other services’ probably indicates other factors are at play. Other services includes: Real estate, Medical and health service, Restaurants, Hotel, etc. This list suggests that reclassification may be important. For example, if a factory runs a guest house and canteen in 1990 but outsources these tasks to an independent service provider in the 2000s, we would see an increase in the sourcing of value added from manufacturing to services.
The second natural question when tracing down the origin of servicification is:
Where is the extra service value-added being sourced from?
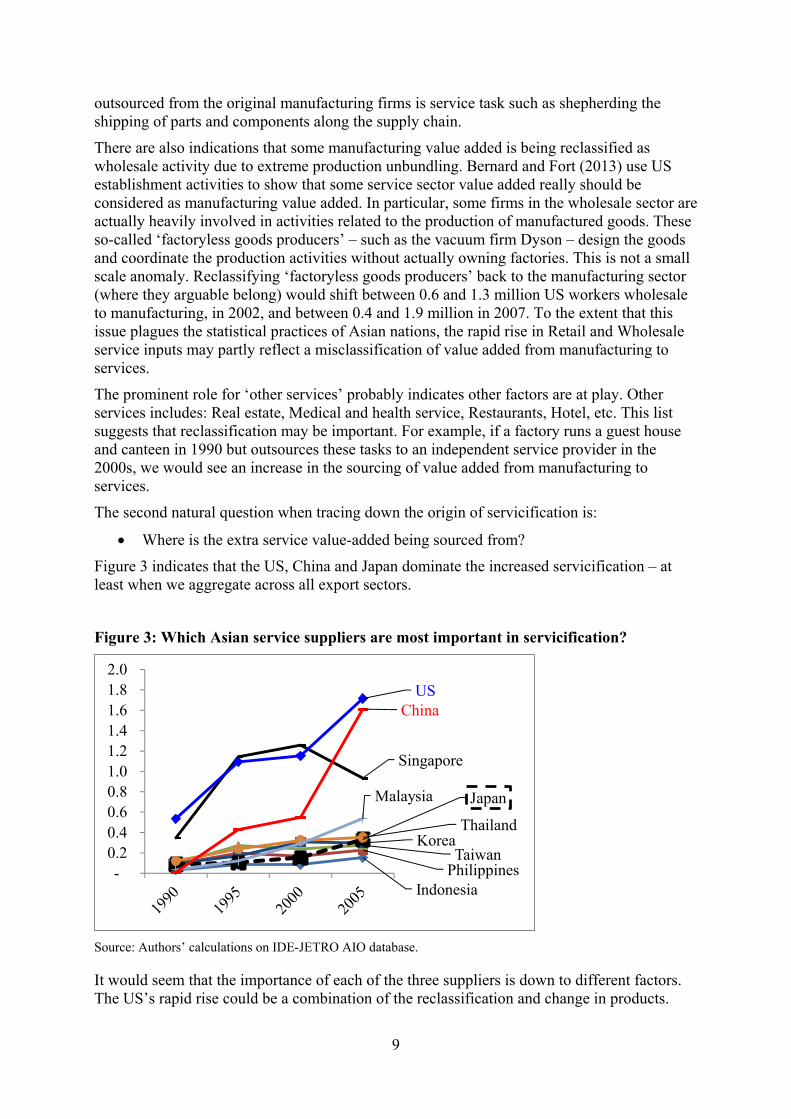
Figure 3 indicates that the US, China and Japan dominate the increased servicification – at least when we aggregate across all export sectors.
Figure 3: Which Asian service suppliers are most important in servicification?
Source: Authors’ calculations on IDE-JETRO AIO database.
It would seem that the importance of each of the three suppliers is down to different factors. The US’s rapid rise could be a combination of the reclassification and change in products.
IndonesiaPhilippinesTaiwan
Korea
Japan
Thailand
Malaysia
Singapore
ChinaUS
- 0.2 0.4 0.6 0.8 1.0 1.2 1.4 1.6 1.8 2.0
10
The outsource of services has advanced rapidly in the US, following the advice of Harvard professor Michael Porter that firms should stick to what they do best and outsource the rest – i.e. competitive advantage. To the extent that US firms pursued this, the service content of most intermediate goods sourced from the US would contain a rising share of service value added – even with no change in the products or production methods. The trend towards embodying services in manufactured goods (software, design, etc) would also explain the rise. For China the story is likely to be different. Since China’s role as a supplier of value added has risen so rapidly across the board, it is not surprising that it is also an important source of service value added. To the extent that Chinese intermediate goods include services (e.g. with the reclassification of jobs discussed above), the rapid rise in sourcing intermediate goods from China would also imply a rapid rise in Chinese service value added in nation’s exports.
The result for Singapore is not surprising given its role as a trade entrepôt in Southeast Asia. A great deal of Southeast Asian trade is transhipped through Singapore and Singapore’s firms often provide additional connect services such as pre-shipment inspection, customs handling, etc.
While all the sectors experienced servicification when averaged across nations – there is more variability across sectors for particular nations. Moreover, the degree of GVC participation varies quite a lot across nations and sectors, as is shown in the next section.
4. DATA AND EMPIRICAL STRATEGY
4.1. DATA An Asian Input-Output (AIO) table has been constructed by the Institute of Developing Economies, Japan External Trade Organization (IDE-JETRO). The data sets are available from 1985 every 5 years to 2005. From 1990 onwards, 76 to 78 industries are covered, which is larger than 35 industries of World Input Output Database.6 This feature of higher disaggregation allows us to better analyse the service value-added. The data set is focused on Asian nations (Indonesia, Malaysia, Philippines, Singapore, Thailand, China, Taiwan, Korea, Japan and the US). It includes the US since the US is the major trading partner for almost all Asian countries. Partner countries other than the Asian countries and the US are aggregated as the Rest of the World (ROW).
4.1.1. Computation of export value-added It is important to note that one cannot simply read off the numbers we are after. From the AIO table, we can decompose a nation’s exports of, say, transport equipment into direct value added in the nation’s transport equipment sector and the sector’s intermediate-input purchases. The purchased inputs may be from primary, secondary or tertiary sectors, but each of these inputs themselves use purchased inputs. Thus we have to iteratively trace all the value added to its origin. The recursive use of information in an international IO table enables us to determine the source of value added in every dollar of exports. The key is that simple accounting identity that states the sale-value of a product equals the cost of intermediate inputs and the direct value-added of the industry producing the good. Here value-added refers the cost of primary inputs such as capital, labour, etc. The same identity applies to the
6 AIO table has slightly different codes between 1990, 1995 data and 2000, 2005 data. To enable across industry analyses over the whole period, we have made a concordance between the two. To keep the complete consistency of the industry codes over the whole period, some industries are aggregated and the number of industries after the concordance is 64, as is shown in the list of industries in the appendix.

11
intermediate goods used as inputs, so a recursive application can generate a full map of where all a product’s value was added.
4.1.2. Methodology The iteration process described above yields the export value-added. However, a handy tool using the matrix algebra to make the above computation is available. Koopman et al. (2011) proposes a methodology based on Leontief inverse matrix. Johnson and Noguera (2012), Timmer et al. (2014), or De Backer and Miroudot (2014) use the same methodology. We
follow suit. Essentially, the value-added in exports are computed as 1VAE v I A E
,
where I is an identity matrix, A a global intermediate input coefficients matrix, 1I A
the Leontief inverse matrix, v is a matrix (or a stacked vector, depending on the level of disaggregation one aims to obtain) of the ‘direct’ value-added share of the total production value for each exporter/industry, E is a matrix (or a stacked vector, depending on the level of disaggregation one aims to obtain) of gross exports. Intuitively put, pre-multiplying the gross exports E by the Leontief inverse and the ‘direct’ value-added share, we incorporate both ‘direct’ and ‘indirect’ contribution.
4.1.3. Measures of GVC participation The profession has not yet settled on the best measure of GVC participation so we rely on a variety of measures that have been used in the literature. This section describes the measures and considers some of the differences among them.
By way of introduction, it is worth noting that these concepts strike many – including many international economists – as rather complex, perhaps over complicated. The source of this impression is the centuries-long tradition of ignoring imported intermediates. In the trade models that virtually every economist in the world has studied (Ricardian model, Heckscher-Ohlin model, etc.) a nation’s exports are 100% made at home and all of its exports are final goods so there is no issue of the exports moving on to third nations. This basic idea is also cooked into standard international macroeconomics in the sense that the models assume that the home nation’s imports depend only on its GDP and relative prices. They do not account for the fact that the Thailand nation may be importing, e.g. engines from Japan, to produce cars that are sold to the Philippines. In the latter case, the Philippines’s income would affect its demand for Thai cars which would then affect Japan’s exports of engines.
Given the massive rise in the internationalisation of production, the upshot is that trade concepts in the 21st century are inevitably more complex than those studied by most economists when they were in university. The complexity is unavoidable. It can, however, be made more straightforward than is often the case.
As Baldwin and Lopez-Gonzales (2014) point out: ”While the terms for supply-chain trade are numerous, the essential concepts are universal. There are three basic supply-chain trade concepts: (i) importing to produce, (ii) importing to export, and (iii) value-added trade.” For all three, it is critical to distinguish between participation on the ‘sourcing’ side, i.e. buying-in foreign parts and services, and the ‘selling’ side, i.e. selling parts and services to foreigners.
Typically, developing nations are engaged in both as they import intermediate goods and process them further. The resulting good may be sold domestically or exported (sometimes called re-exported). Developed nations can also participate on both the sourcing and selling sides as in the case of US-Mexico Maquiladora trade where US companies send parts to Mexico for labour-intensive processing then bring them back for final processing and either local sale or export sale.

12
I2P, I2E, E2P, E2P and E2R: Gross trade measures
One of the broadest measures of GVC participation is called Importing-to-Produce (I2P) which is simply the total usage of foreign intermediate goods measured in ‘gross’ (i.e. traditional) terms. This looks at how important imported intermediates are to the importing nation’s industrial production. It is a broad measure of the internationalisation of production since some goods produced in, say, Germany are relying on the production of other nations.
As the name suggests, I2P is most naturally viewed as a ‘sourcing’ side measure (e.g. Japan’s imports of rubber that are used in making Japanese goods). However, every import is an export for some other nation. Thus we can easily turn I2P into a selling-side measure. For example, summing up – across all the importing countries in the sample – the I2P that comes from Japan will yield Japan’s exports of intermediate goods and services. This concept might logically be called exporting-to-produce or E2P. In Figure 4 it is the total of exports in box #2.
All these measures based on gross trade flows can be normalised by total imports (for I2P) or exports (for E2P) when comparing across nations, or by the world total of I2P or E2P.
Figure 4: GVC measures based on traditional (gross) trade flows: Sales side.
Source: Authors’ elaboration.
The I2P and E2P concepts fail to distinguish between imported intermediates that are put into goods that are then sold locally and those that are put into goods that are then sold abroad. The next refinement of GVC participation measurement focuses on intermediates used in export, rather than in all production as is the case for I2P and E2P. These measures focuses only on imported intermediates that are embedded into goods and services that are subsequently exported. This is closer to popular conceptions of ‘global value chains’. Here the importing nation can be thought of as a node in an international production network. The key feature is that foreign intermediates are used to produce goods and services that are subsequently exported.
Following the namely logic, these GVC trade flows could be called importing-to-export, or I2E. The OECD’s Trade in Value Added (TiVA) database publishes a statistic related to this called REI, which is the share of a nation’s imported intermediate inputs that are exported.7
As with I2P and E2P, there is a sourcing and sales side of the I2E concept. That is, some of a nation’s intermediate exports are embodied in foreign goods that are then exported. Our
7 Although it is not clear whether REI is based on value-added import flows or gross import flows. I2E is constructed with gross trade data.
13
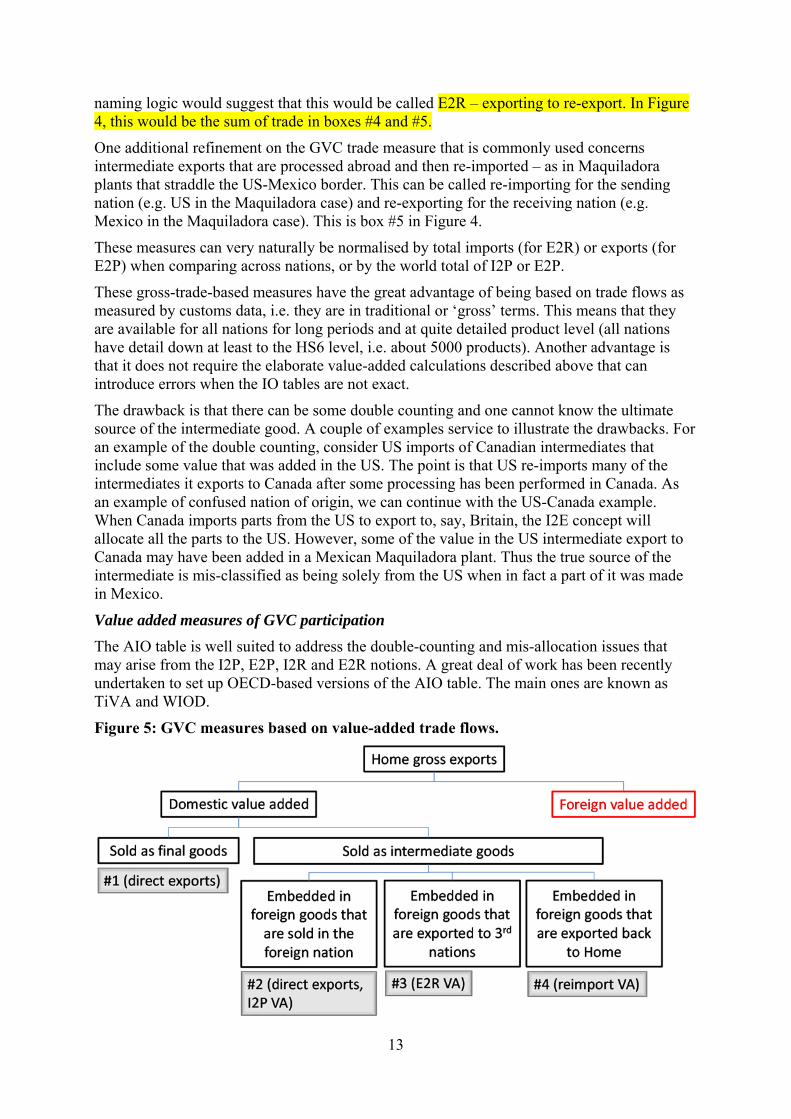
naming logic would suggest that this would be called E2R – exporting to re-export. In Figure 4, this would be the sum of trade in boxes #4 and #5.
One additional refinement on the GVC trade measure that is commonly used concerns intermediate exports that are processed abroad and then re-imported – as in Maquiladora plants that straddle the US-Mexico border. This can be called re-importing for the sending nation (e.g. US in the Maquiladora case) and re-exporting for the receiving nation (e.g. Mexico in the Maquiladora case). This is box #5 in Figure 4.
These measures can very naturally be normalised by total imports (for E2R) or exports (for E2P) when comparing across nations, or by the world total of I2P or E2P.
These gross-trade-based measures have the great advantage of being based on trade flows as measured by customs data, i.e. they are in traditional or ‘gross’ terms. This means that they are available for all nations for long periods and at quite detailed product level (all nations have detail down at least to the HS6 level, i.e. about 5000 products). Another advantage is that it does not require the elaborate value-added calculations described above that can introduce errors when the IO tables are not exact.
The drawback is that there can be some double counting and one cannot know the ultimate source of the intermediate good. A couple of examples service to illustrate the drawbacks. For an example of the double counting, consider US imports of Canadian intermediates that include some value that was added in the US. The point is that US re-imports many of the intermediates it exports to Canada after some processing has been performed in Canada. As an example of confused nation of origin, we can continue with the US-Canada example. When Canada imports parts from the US to export to, say, Britain, the I2E concept will allocate all the parts to the US. However, some of the value in the US intermediate export to Canada may have been added in a Mexican Maquiladora plant. Thus the true source of the intermediate is mis-classified as being solely from the US when in fact a part of it was made in Mexico.
Value added measures of GVC participation
The AIO table is well suited to address the double-counting and mis-allocation issues that may arise from the I2P, E2P, I2R and E2R notions. A great deal of work has been recently undertaken to set up OECD-based versions of the AIO table. The main ones are known as TiVA and WIOD.
Figure 5: GVC measures based on value-added trade flows.
14
Source: Authors’ elaboration.
As part of this recent effort, a number of GVC measures have been developed that can be thought of as the value-added version of the gross trade measures of GVC participation. The basic concepts can be seen in Figure 5. Here Home exports (‘gross exports’) are decomposed into value that is added inside Home, domestic value added, and value that is added in other nations, foreign value added. As explained above, gross exports exactly equal the sum of domestic and foreign value added. The easiest concept is the domestic value added in final good exports. In this case, Home’s value added goes directly to foreign end users and stays there. Some of Home’s domestic value added, however, will be embodied in intermediate goods so the domestic value added may end up somewhere other than the initial importer.
If the domestic value added is used in foreign goods that are sold in the importing nation, this is the value-added equivalent of E2P; domestic value added is used to produce locally absorbed goods. This occurs in the box #2. If the imported value added is used in the importing nation’s exports, then we have a concept akin to E2R, as shown in box #3. If the value added ends up on a good that is sent back to Home, it is the value added equivalent of reimports.
In this analysis, we only break down domestic export value added since the exercise is undertaken for each nation and the ‘foreign value added’ will be traced out as part of the exercise for the foreign nation.
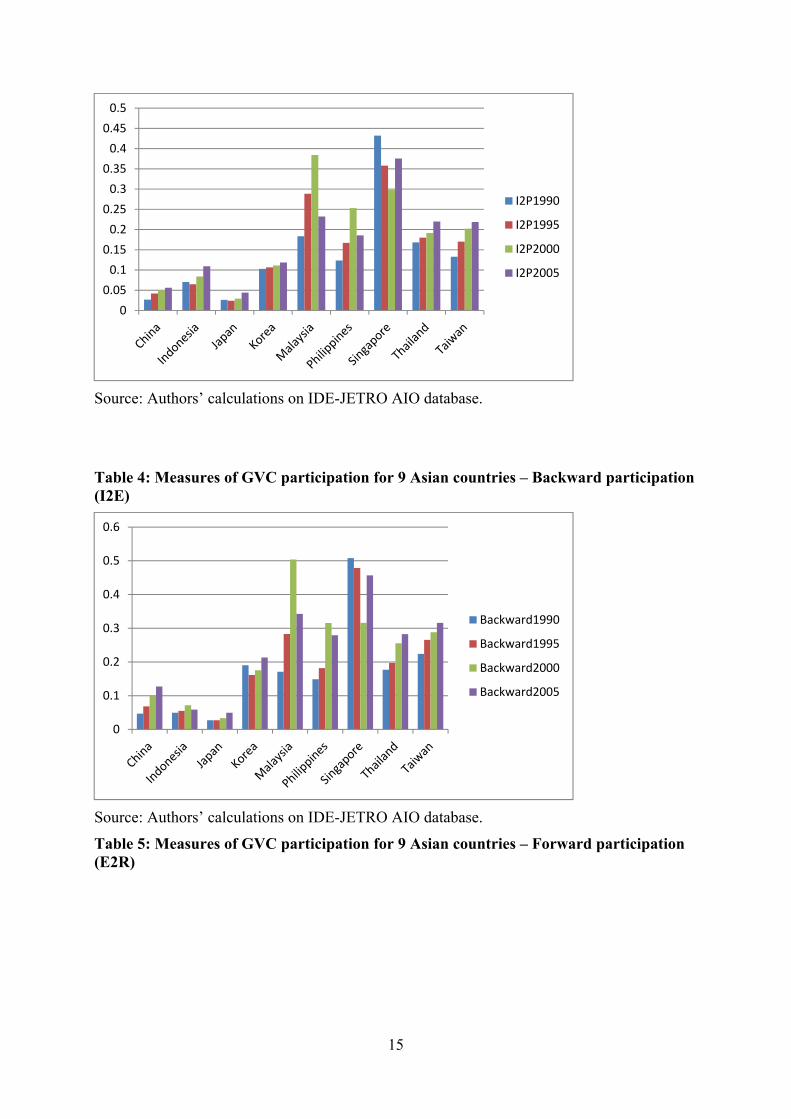
GVC participation of 9 Asian countries is shown in Table 3,
Table 4 and Table 5, in terms of Import-to-produce, backward participation and forward participation, respectively. These graphs show a general trend for deeper GVC participation from 1990 to 2005. As is expected, Import-to-produce has a similar picture with backward participation because both are similar concepts. The difference is whether it is computed based on gross export values or on value-added exports. In levels, China, Indonesia and Japan have relatively low GVC participation, whereas Malaysia and Singapore have relatively high GVC participation. Forward participation shows a notably different picture than the former two. Except China, all the other countries have similar level of GVC participation. Japan and Korea, the two “head-quarter” economies have much higher level than the case in backward participation. Japan and Korea produce key components and send them to the developing countries and then these components are assembled and exported to third countries.
Table 3: Measures of GVC participation for 9 Asian countries – Import to produce (I2P)
15
Source: Authors’ calculations on IDE-JETRO AIO database.
Table 4: Measures of GVC participation for 9 Asian countries – Backward participation (I2E)
Source: Authors’ calculations on IDE-JETRO AIO database.
Table 5: Measures of GVC participation for 9 Asian countries – Forward participation (E2R)
0
0.05
0.1
0.15
0.2
0.25
0.3
0.35
0.4
0.45
0.5
I2P1990
I2P1995
I2P2000
I2P2005
0
0.1
0.2
0.3
0.4
0.5
0.6
Backward1990
Backward1995
Backward2000
Backward2005

16
Source: Authors’ calculations on IDE-JETRO AIO database.
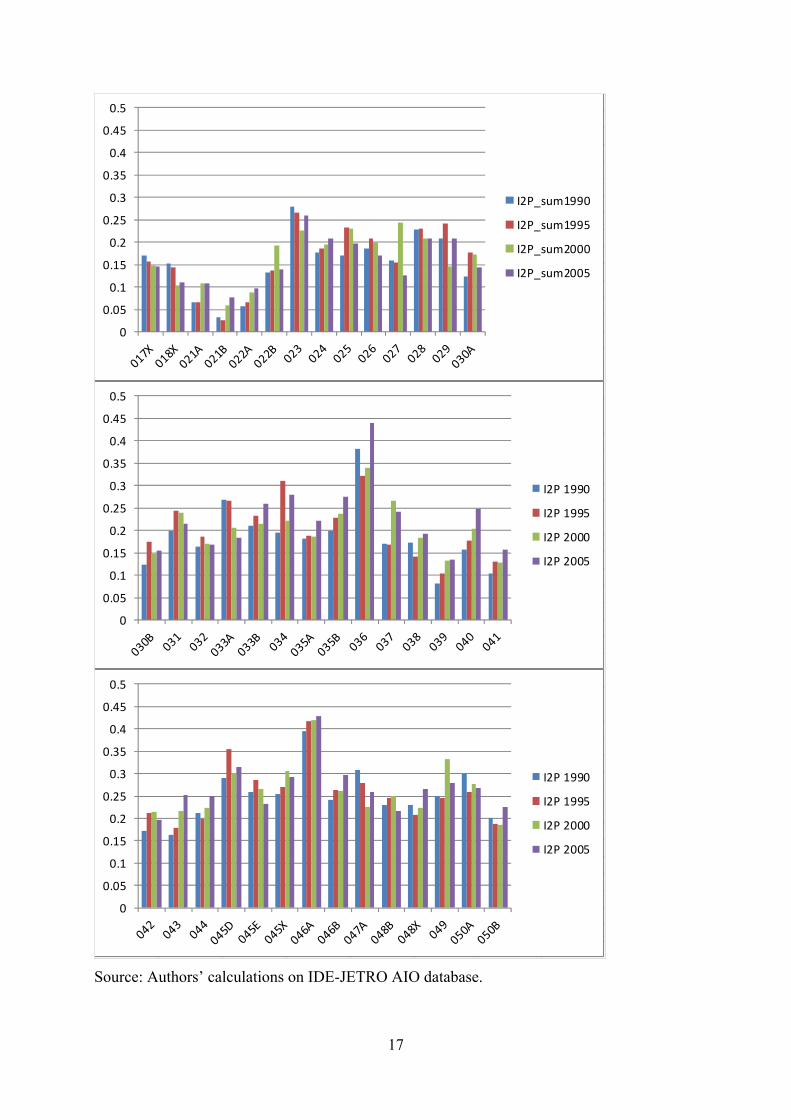
It is also worth looking at differences of these GVC measures by industries.
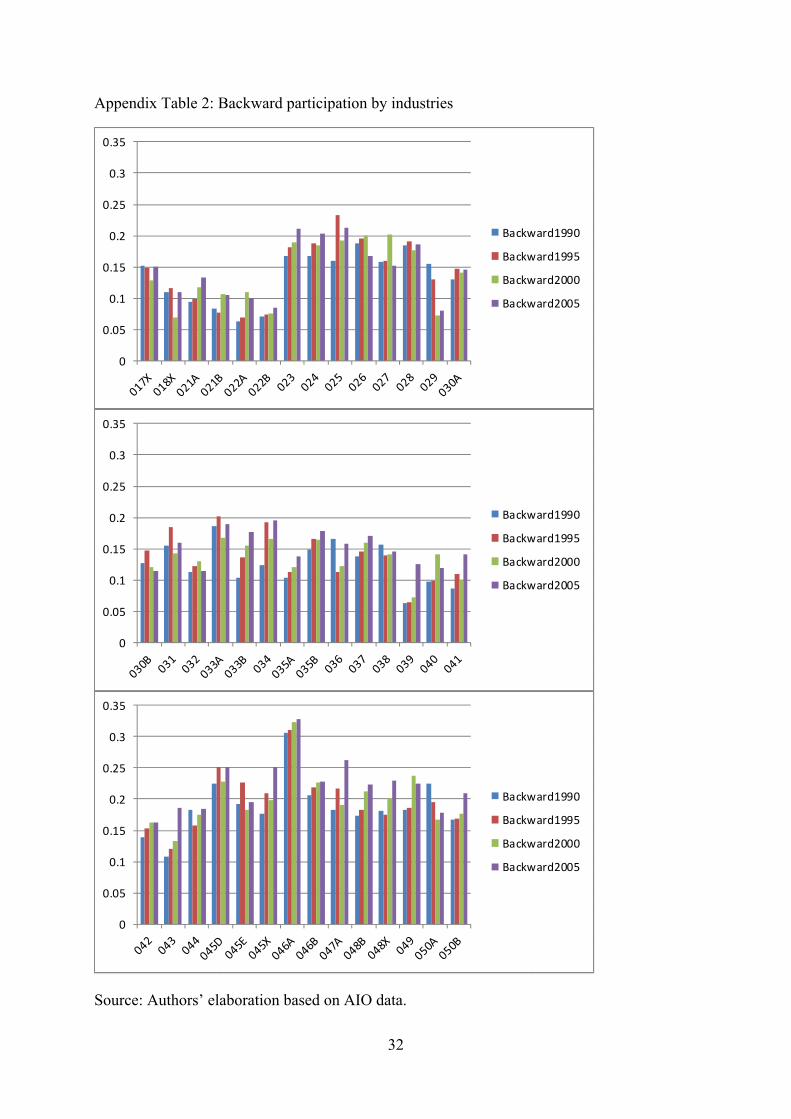
Table 6 shows the simple mean values of the import-to-produce index by industries for the manufacturing sector. Industries such as, 034: Chemical fertilizers and pesticides, 036: Refined petroleum and its products, 045D: Heavy electric machinery, 046A: Electronics and electronic products have relatively higher import-to-produce index. Backward participation index and Forward participation index by industries are in appendix.
Table 6: Import-to-produce, averages across countries by industries
0
0.05
0.1
0.15
0.2
0.25
0.3
Forward1990
Forward1995
Forward2000
Forward2005
17
Source: Authors’ calculations on IDE-JETRO AIO database.
0
0.05
0.1
0.15
0.2
0.25
0.3
0.35
0.4
0.45
0.5
I2P_sum1990
I2P_sum1995
I2P_sum2000
I2P_sum2005
0
0.05
0.1
0.15
0.2
0.25
0.3
0.35
0.4
0.45
0.5
I2P 1990
I2P 1995
I2P 2000
I2P 2005
0
0.05
0.1
0.15
0.2
0.25
0.3
0.35
0.4
0.45
0.5
I2P 1990
I2P 1995
I2P 2000
I2P 2005
18
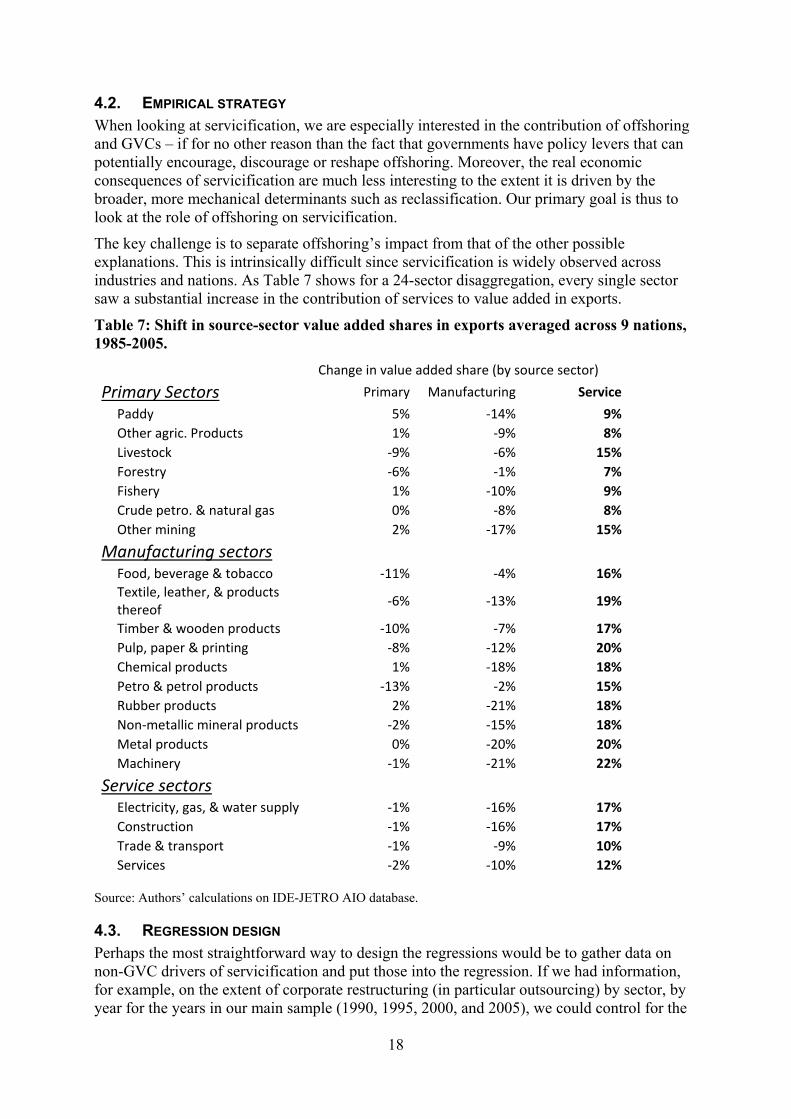
4.2. EMPIRICAL STRATEGY When looking at servicification, we are especially interested in the contribution of offshoring and GVCs – if for no other reason than the fact that governments have policy levers that can potentially encourage, discourage or reshape offshoring. Moreover, the real economic consequences of servicification are much less interesting to the extent it is driven by the broader, more mechanical determinants such as reclassification. Our primary goal is thus to look at the role of offshoring on servicification.
The key challenge is to separate offshoring’s impact from that of the other possible explanations. This is intrinsically difficult since servicification is widely observed across industries and nations. As Table 7 shows for a 24-sector disaggregation, every single sector saw a substantial increase in the contribution of services to value added in exports.
Table 7: Shift in source-sector value added shares in exports averaged across 9 nations, 1985-2005.
Change in value added share (by source sector)
Primary Sectors Primary Manufacturing Service
Paddy 5% ‐14% 9%
Other agric. Products 1% ‐9% 8%
Livestock ‐9% ‐6% 15%
Forestry ‐6% ‐1% 7%
Fishery 1% ‐10% 9%
Crude petro. & natural gas 0% ‐8% 8%
Other mining 2% ‐17% 15%
Manufacturing sectors
Food, beverage & tobacco ‐11% ‐4% 16%
Textile, leather, & products thereof
‐6% ‐13% 19%
Timber & wooden products ‐10% ‐7% 17%
Pulp, paper & printing ‐8% ‐12% 20%
Chemical products 1% ‐18% 18%
Petro & petrol products ‐13% ‐2% 15%
Rubber products 2% ‐21% 18%
Non‐metallic mineral products ‐2% ‐15% 18%
Metal products 0% ‐20% 20%
Machinery ‐1% ‐21% 22%
Service sectors
Electricity, gas, & water supply ‐1% ‐16% 17%
Construction ‐1% ‐16% 17%
Trade & transport ‐1% ‐9% 10%
Services ‐2% ‐10% 12% Source: Authors’ calculations on IDE-JETRO AIO database.
4.3. REGRESSION DESIGN Perhaps the most straightforward way to design the regressions would be to gather data on non-GVC drivers of servicification and put those into the regression. If we had information, for example, on the extent of corporate restructuring (in particular outsourcing) by sector, by year for the years in our main sample (1990, 1995, 2000, and 2005), we could control for the
19
impact of reclassification by including this proxy. Unfortunately, such measures are not available for the nations in our sample – especially for the developing nations such as the ASEAN nations. Our solution is to instead use fixed effects to control for unobservable that do not vary by sector, by year, and by nation.
The first regressions to run involve ‘total servicification’, i.e. the increase between 1990 and 2005 of service sector inputs into exports in all 64 sectors. The regressor of interest is various measures of changes in GVC participation. The test is to see if GVC participation helps explain total servicification once we have controlled for common industry and country factors using fixed effects. Note that since we are working with changes in the key variables, the fixed effects taking out common trends by industry, exporting nation and time period (i.e. 1990 to 1995, 1995 to 2000, etc).
4.3.1. Total servicification Specifically, we estimate the following equation by Ordinary Least Squares:
jti
jti00jti
effects fixed
Partic GVC shareVA Service
where ‘Service VA share’ is the five year change in the share of export value added that stems from the service sector (regardless of origin nation), and ‘GVC Partic’ is the change in one of several proxies for GVC participation by the exporting sector. The observations are by nation (nine nations), by sector (64 sectors) and three time periods (1990-95, 1995-00, 2000-05).
4.3.2. Foreign-sourced servicification We also run a more pointed set of regression that changes the focus from total servicification to foreign servicification. That is to say, we seek to explain the increase in foreign-service value-added in nations’ exports – again by export sector, by exporting nation and by time period. The underlying thinking is that GVC participation may be particularly conducive to source service-value-added from abroad.
This is possible since the granularity of our data allows us to distinguish increases in service value added by country of origin. Given our interest in the role of GVC participation in the servicification, one very natural regression focuses on increases in service value added embodied in exports that stem from foreign sources. The idea here is that such service value added is most likely to be associated with GVC participation.
This regression design has the additional merit of allowing us to use the change in domestic service value added as a control. That is, we suppose that the by export sector, by exporting nation, by period change in domestic service value added is picking up non-GVC related changes such as reclassification, changes in the nature of products and production processes, etc.
Thus we estimate the following equation by Ordinary Least Squares.
jtijti
jti00jti
effects fixedshareVA rviceDomesticSe
Partic GVC shareVA viceForeignSer
where ‘ForeignService VA share’ is the change in foreign service value-added shares of exporter country i industry j at time period t .Thus, we have three periods. ∆ is
20
our variable of interest, which represents the change in Global Value Chain index for exporter country i industry j at time period t .
As discussed above, a part of the increase of foreign service value-added shares could be attributed to general trends (such as reclassification). To control this general trend, ‘DomesticService VA share’ is added as a control variable, which represents the change in domestic service value-added shares of exporter country i industry j at time period .
5. RESULTS
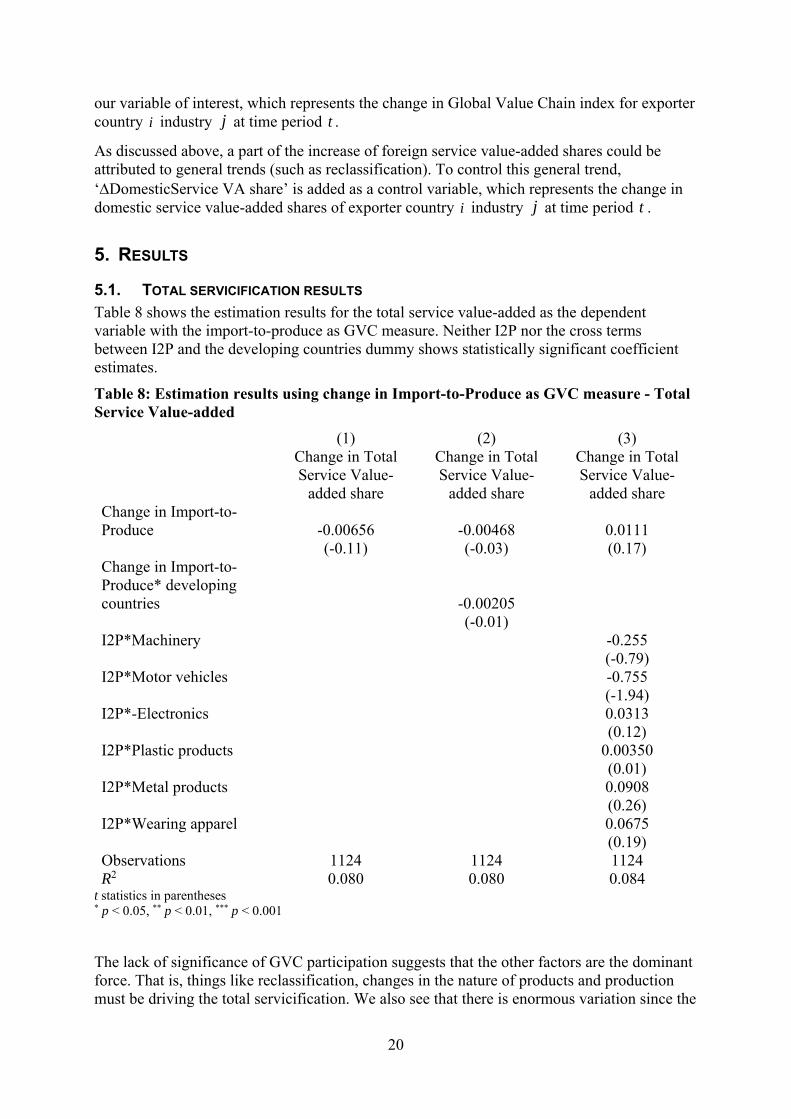
5.1. TOTAL SERVICIFICATION RESULTS Table 8 shows the estimation results for the total service value-added as the dependent variable with the import-to-produce as GVC measure. Neither I2P nor the cross terms between I2P and the developing countries dummy shows statistically significant coefficient estimates.
Table 8: Estimation results using change in Import-to-Produce as GVC measure - Total Service Value-added
(1) (2) (3) Change in Total
Service Value-added share
Change in Total Service Value-
added share
Change in Total Service Value-
added share Change in Import-to-Produce -0.00656 -0.00468 0.0111 (-0.11) (-0.03) (0.17) Change in Import-to-Produce* developing countries
-0.00205 (-0.01) I2P*Machinery -0.255 (-0.79) I2P*Motor vehicles -0.755 (-1.94) I2P*-Electronics 0.0313 (0.12) I2P*Plastic products 0.00350 (0.01) I2P*Metal products 0.0908 (0.26) I2P*Wearing apparel 0.0675 (0.19) Observations 1124 1124 1124 R2 0.080 0.080 0.084
t statistics in parentheses * p < 0.05, ** p < 0.01, *** p < 0.001
The lack of significance of GVC participation suggests that the other factors are the dominant force. That is, things like reclassification, changes in the nature of products and production must be driving the total servicification. We also see that there is enormous variation since the
t

21
R2 is so low. The I2P measure is insignificant with or without allowing interactions for the level of development (column 2), or industries interactions (column 3).
The results for the more pointed proxies for GVC participation – namely importing to export (the sourcing side participation) and exporting to re-export (the sales side participation) – are not as universally insignificant. When we put in only the I2E and I2R measures, we find both are negative, but only the former is significant.
Table 9: Estimation results using changes in GVC I2E and E2R participation as GVC measure - Total Service Value-added
Column 1 Column 2 Column 3
Change in GVC I2E participation -0.0228*** -0.0629 -0.104***
(-3.59) (-1.62) (-7.69)
I2EChange*developing 0.0412 -1.05
I2EChange*Machinery 0.0596 -0.63
I2EChange*Motor vehicles 0.138*** -4.49
I2EChange*Electronics 0.108*
-2.25
I2EChange*Plastic products -0.144 (-1.27)
I2EChange*Metal products 0.0427 -0.36
I2EChange*Wearing apparel 0.106***
-6.79
Change in GVC E2R participation -0.0822 0.0126 -0.139** (-1.93) -0.11 (-3.22)
E2RChange*developing -0.113 (-0.92)
E2RChange*Machinery 0.225 -0.59
E2RChange*Motor vehicles -1.913***
(-3.32)
E2RChange*Electronics 0.195 -0.61
E2RChange*Plastic products 0.907**
-3.29
E2RChange*Metal products 0.499 -0.94
E2RChange*Wearing apparel -0.56 (-0.34)
Observations 1124 1124 1124
R2 0.094 0.096 0.156
22
t statistics in parentheses * p < 0.05, ** p < 0.01, *** p < 0.001
As our theory section illustrated, outsource/offshoring almost mechanically raises the total service value added via the reclassification, composition, and/or relative prices effects. The negative coefficients are thus not in line with the theory.
This suggests that the theory would have to be stretched to understand the negative coefficients. One possibility is the selection effect – i.e. a change in the types of goods a particular nation exports within the broad categories we are using.
For example, inside the Motor Vehicle sector, some goods are intrinsically more service-task intensive and some are intrinsically more manufacturing-task intensive.
What may be happening is that GVC participation – especially on the sourcing side – is leading nations to concentrate their exports more on those that are more manufacturing-task intensive.
This would explain how the overall servicification would be less marked for nations participating more vigorously in GVC activities.
The Column 2 results provide weak support for this interpretation. Here we see that the servicification is negative overall (the point estimate is -0.06) but less negative for developing nations (the interaction term is +0.04). Although none of the estimates are statistically significant, they are in line with the idea that outsourcing is particularly important in sectors that are manufacturing-task intensive – especially for developed nations. In other words, this interpretation views the negative sign not as an indicator that GVC participation is leading to less servicification, but rather that GVC activity is prevalent in manufacturing-task intensive products.
Looking at Column 3, we see the story is even more complex when we allow GVC participation (on both the sales and source side) to affect total servicification differently by sector. For instance, I2E in Motor vehicles, has a positive impact on servicification, while more E2R has a strong negative impact. This lines up with the selection interpretation. The products and countries where there is a great deal of I2E are the ones where the GVC participation involves a lot of imported parts and limited local processing in developing nations. As these are likely to be fabrication intensive, we see a positive coefficient. When thinking about nations where there is a lot of E2R, it may well be products that are design or service-task intensive.
5.2. FOREIGN SERVICIFICATION RESULTS We now turn to the second specification that concentrates on foreign-service value-added in exports. The estimation results with the import-to-produce index are in Table 10.
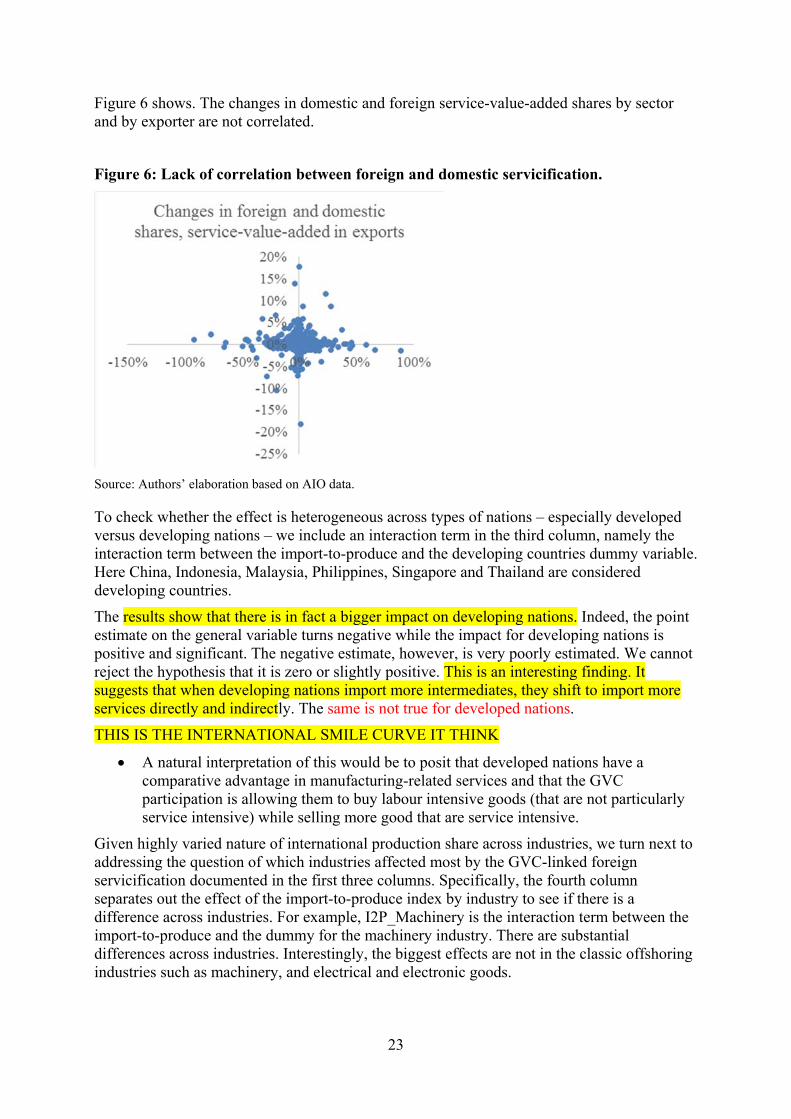
The first column shows the benchmark case where we include only the change in the I2P measure of GVC participation and fixed effects. The result is encouraging in the sense that the impact of heightened GVC participation shows statistically significant positive coefficient estimate. To control for general trends, the second column includes Change in Domestic Service Value-added share. The point estimate is positive, however, it is statistically insignificant. Importantly, the estimated impact of greater I2P is unaffected by its inclusion.
As it turns out, there is little correlation between the foreign-service value-added share change and the domestic one, as
23
Figure 6 shows. The changes in domestic and foreign service-value-added shares by sector and by exporter are not correlated.
Figure 6: Lack of correlation between foreign and domestic servicification.
Source: Authors’ elaboration based on AIO data.
To check whether the effect is heterogeneous across types of nations – especially developed versus developing nations – we include an interaction term in the third column, namely the interaction term between the import-to-produce and the developing countries dummy variable. Here China, Indonesia, Malaysia, Philippines, Singapore and Thailand are considered developing countries.
The results show that there is in fact a bigger impact on developing nations. Indeed, the point estimate on the general variable turns negative while the impact for developing nations is positive and significant. The negative estimate, however, is very poorly estimated. We cannot reject the hypothesis that it is zero or slightly positive. This is an interesting finding. It suggests that when developing nations import more intermediates, they shift to import more services directly and indirectly. The same is not true for developed nations.
THIS IS THE INTERNATIONAL SMILE CURVE IT THINK
A natural interpretation of this would be to posit that developed nations have a comparative advantage in manufacturing-related services and that the GVC participation is allowing them to buy labour intensive goods (that are not particularly service intensive) while selling more good that are service intensive.
Given highly varied nature of international production share across industries, we turn next to addressing the question of which industries affected most by the GVC-linked foreign servicification documented in the first three columns. Specifically, the fourth column separates out the effect of the import-to-produce index by industry to see if there is a difference across industries. For example, I2P_Machinery is the interaction term between the import-to-produce and the dummy for the machinery industry. There are substantial differences across industries. Interestingly, the biggest effects are not in the classic offshoring industries such as machinery, and electrical and electronic goods.

24
Table 10: Estimation results using change in Import-to-Produce as GVC measure
Change in Foreign service value-added share Column 1 Column 2 Column 3 Column 4
Change in Import-to-Produce 0.0206* 0.0206* -0.0278 0.0105
(2.45) (2.44) (-1.19) (1.16)
Change in Import-to-Produce*developing countries 0.0528*
2.23
Change in Domestic Service Value-added share -0.000822 -0.000723 -0.000384
(-0.19) (-0.16) (-0.09)
I2P*Machinery 0.0182
(0.4)
I2P*Motor vehicles 0.0116
(0.21)
I2P*Electronics -0.00493
(-0.14)
I2P*Plastic products 0.123***
(3.42)
I2P*Metal products 0.208***
(4.17)
I2P*Wearing apparel -0.00761
(-0.15)
Observations 1124 1124 1124 1124
R2 0.046 0.046 0.05 0.071
t statistics in parentheses * p < 0.05, ** p < 0.01, *** p < 0.001
As discussed above, there are many measures of GVC participation. The next set of regressions considers where our main results are robust to the use of different measures. In particular, estimation results using backward/forward participation as the GVC measure are in
25
Table 11.
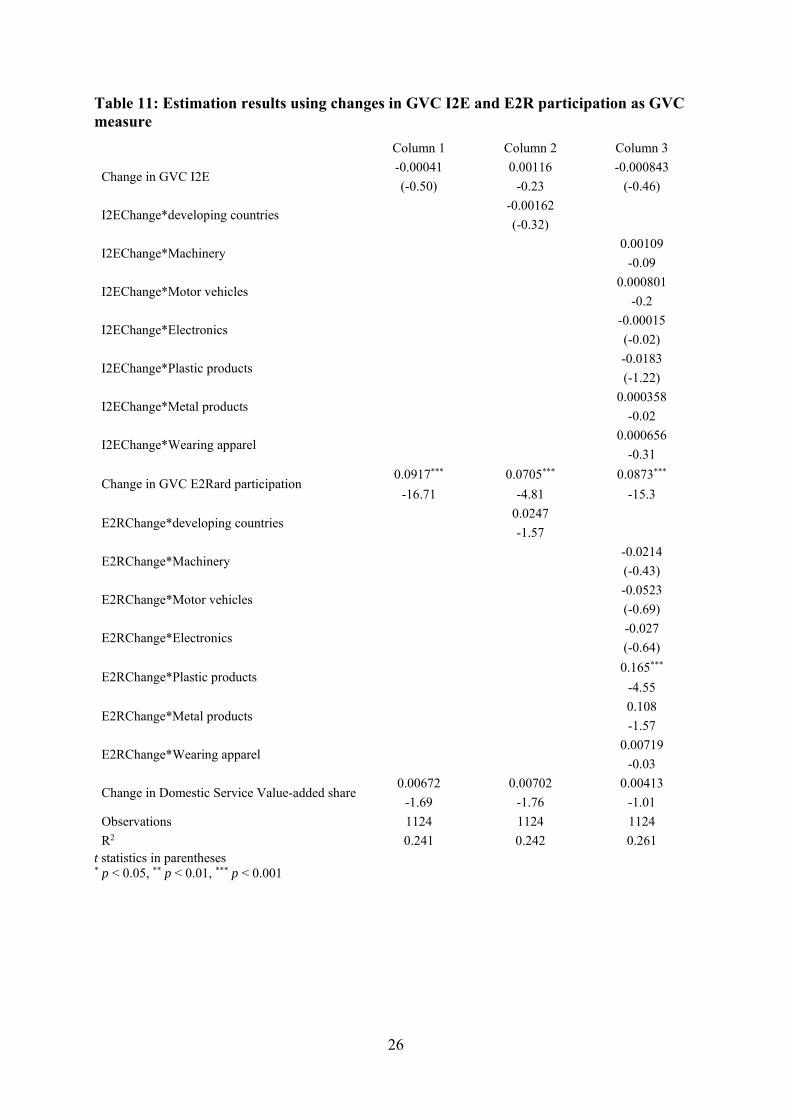
Whereas GVC forward participation shows a highly statistically significant coefficient estimate, GVC backward participation is insignificant. It means that the more involved a country/industry is as a supplier of third countries’ exports, the more dependent the country/industry is on foreign-service value-added. For example, parts and components produced in Thailand which are exported to Indonesia for further processing receives much service inputs from Japan. The cross-term with the developing country dummy is introduced in the second column. The result indicates no difference by country groups. In the third column, the cross-terms between Backward change and the industry dummies and also Forward change and the industry dummies are introduced. Similar to the case of the import-to-produce, there is substantial industry difference in the effect of the global value chains.
26
Table 11: Estimation results using changes in GVC I2E and E2R participation as GVC measure
Column 1 Column 2 Column 3
Change in GVC I2E -0.00041 0.00116 -0.000843
(-0.50) -0.23 (-0.46)
I2EChange*developing countries -0.00162
(-0.32)
I2EChange*Machinery 0.00109
-0.09
I2EChange*Motor vehicles 0.000801
-0.2
I2EChange*Electronics -0.00015
(-0.02)
I2EChange*Plastic products -0.0183
(-1.22)
I2EChange*Metal products 0.000358
-0.02
I2EChange*Wearing apparel 0.000656
-0.31
Change in GVC E2Rard participation 0.0917*** 0.0705*** 0.0873***
-16.71 -4.81 -15.3
E2RChange*developing countries 0.0247
-1.57
E2RChange*Machinery -0.0214
(-0.43)
E2RChange*Motor vehicles -0.0523
(-0.69)
E2RChange*Electronics -0.027
(-0.64)
E2RChange*Plastic products 0.165***
-4.55
E2RChange*Metal products 0.108
-1.57
E2RChange*Wearing apparel 0.00719
-0.03
Change in Domestic Service Value-added share 0.00672 0.00702 0.00413
-1.69 -1.76 -1.01
Observations 1124 1124 1124
R2 0.241 0.242 0.261 t statistics in parentheses * p < 0.05, ** p < 0.01, *** p < 0.001

27
Column 1 Column 2
Change in GVC I2E -0.00041 0.00116
(-0.50) -0.23
I2EChange*developing countries -0.00162
(-0.32)
Change in GVC E2R 0.0917*** 0.0705***
-16.71 -4.81
E2RChange*developing countries 0.0247
-1.57
Change in Domestic Service Value-added share 0.00672 0.00702
-1.69 -1.76
Observations 1124 1124
R2 0.241 0.242
6. CONCLUDING REMARKS AND POSSIBLE POLICY IMPLICATIONS
A great deal of very interesting work has been conducted on GVC using the World Input Output Database (WIOD) and the OECD’s Trade in Value Added (TiVA) data. This has helped unveil the true sources of value added in the world, but much less so in Asia. The problem is that both WIOD and TiVA are based on OECD data that is missing many important Asian nations – especially the large ASEAN nations that are so important in Factory Asia. This lacuna is especially irksome since Asia is considered to have built the most intense and extensive production network. It also started quite early, say in the mid-1980s, while many other regions started later.
This paper uses the IDE-JETRO AIO table to fill some of the missing gaps in the research. The main focus here is on the ‘servicification’ of exports – the increase in the share of value added that stems from service sectors. We document:
1. Which service industries have increased their shares in foreign countries' export value-added?
The answer is somewhat surprising. Most of the boosted service share is coming from just three service sectors: Transportation, Retail and Wholesale, and Other Services, which contains many non-trade services such and medicine, hotels, restaurants, etc.
2. What are the underlying causes of the shift of export value - added from the manufacturing sector to the service sector?
The causes of servicification that we focus on fall into three bins. The first is a simple reclassification of value added from firms that are counted as being in the manufacturing sector (so their value added is counted as coming from this sector) to the service sector. In the 1980s, manufacturing firms often performed many axillary services inside the company that are nowadays outsourced (e.g. cleaning, accounting, transportation, catering, marketing, etc.).
The second involves changes in the nature of production techniques. Automation of production tends to involve more IT and computing services ranging from design to maintenance. Offshoring and outsourcing tend to involve more connection and coordination services such as transportation and telecom. Presumably the cost savings on the offshoring
28
more than compensate for the cost of the extra services, but both sides of that balance service to raise the value added share of services.
The third type of explanation considers changes in the nature of goods. Firms use services, such as embedded software and advanced design and marketing, to enhance value and increase product differentiation.
Our regression result are not able to carefully enumerate the importance of the many possible sources driving this trend, but we are able to show that increases in GVC participation is an important contributing factor in increasing the foreign service value added in a nation’s exports.
6.1. THE IMPLICATIONS AND POLICY ISSUES This servicification of manufacturing is transformative for policy – or at least should be. Governments around the world – but especially in Asia – are heavily invested in promoting development via industrialisation. The linchpin of such policy is the encouragement, promotion and support for exports of manufactured goods. Servicification matters for such policies since it blurs the distinction between manufacturing and service sectors. For example the competitiveness of a nation’s manufactured exports is far more dependent on the local availability of service that have low, quality-adjusted prices. Trying to promote manufactured exports without liberalising the import of services may be self-defeating and this increasingly so as services share in export value added rises.
Second, it means that job creation is subject to more intersectoral linkage than traditionally thought. For example, a trade agreement that expands export opportunities for a nation’s manufacturers will produce job creation well beyond the manufactured sector. Thus looking for evidence of pro-job effects of trade agreements requires looking at the service sector as well as the manufacturing sectors.
Third, it should help refocus industrial policies on a broader range of ‘good jobs’. As manufacturing task are increasingly commoditised by competition from low wage nations on one hand and robots on the other, good manufacturing jobs are increasing those that involve manufacturing-linked service tasks. The extreme of this trend can be seen in the British company Dyson which produces high-end vacuum cleaners. However even though the vacuum cleaners carry the Dyson brand, Dyson owns no factories at all. None of its workers are involved in fabrication. They are engaged in the full range of services necessary to produce the goods, but they don’t actually make the goods.
Moreover it changes – or should change – the way we think about trade policy, development and job creation. On trade policy, it strengthens the need to address trade in service barriers at the same time as trade in goods barriers. There will be a positive feedback effect between trade policies that facilitate the export of goods and the imports of services. For many nations, this means that opening up their markets to direct and embodied foreign services is key to making their manufactured goods competitive. When it comes to development policy, it argues that the classic focus on factories can be misleading. New goods exports will create jobs in the service sectors supplying value added to the goods export sectors – as well as creating jobs directly. Finally on job creation, the pervasive servicification means that attempts to measure the job creating impact of particular policies must look beyond their manufacturing sectors and realise that extra manufactured exports directly creates service sector jobs. Eventually, the topline message is that governments should shift their thinking on industrial policy. On one hand, it is no longer just industry that need to be addressed, and on the other hand, the impact of a successful industrial policy be felt far beyond industry.
29
REFERENCES
Abramovsky, L. and Griffth, R. (2006). Outsourcing and offshoring of business services: How important is ICT? Journal of the European Economic Association, 4, (2-3):594-601.
Baldwin, R. and Lopez-Gonzales, J. (2014). Supply-chain Trade: A Portrait of Global
Baldwin, R., Ito, T., and Sato, H. (2014). Portrait of Factory Asia: Production network in Asia and its implication for growth - the ‘smile curve’, Joint Research Program Series, Institute of Developing Economies, JETRO (http://www.ide.go.jp/English/Publish/Download/Jrp/159.html
Baldwin, Richard & Venables, Anthony J., 2013. "Spiders and snakes: Offshoring and agglomeration in the global economy," Journal of International Economics, vol. 90(2), pages 245-254.
Berlingieri, Giusepp (2013). "Outsourcing and the Rise in Services," CEP Discussion Papers dp1199, Centre for Economic Performance, LSE.
Bernard, Andrew and Teresa Fort (2013). “Factoryless Goods Producers in the US”, NBER Working Paper No. 19396.
Boddin, D. and Henze, P. (2014). International Trade and the Servitization of Manufacturing: Evidence from German Micro Data, Working paper available at http://www.etsg.org/ETSG2014/Papers/186.pdf
Crozet, M and E Milet (2014), "The Servitization of French Manufacturing Firms", CEPII Working Paper 2014-10.
De Backer, K. and Miroudot, S. (2014) “Mapping Global Value Chains”, European Central Bank Working Paper Series, No 1677, May 2014.
Gereffi, Gary (2014). Global value chains in a post-Washington Consensus world, Review of International Political Economy, 21:1, 9-37.
Kelle, M (2013), "Crossing Industry Borders: German Manufacturers as Services Exporters", The World Economy 36(12), 1494-1515. doi: 10.1111/twec.12111
Kelle, M and J Kleinert (2010), "German Firms in Service Trade", Applied Economics Quarterly, 56(1), 51-71.
Kimura, Tatsuya (2003). “The "Smile Curve" Phenomenon in the Japanese Assembly-Type Manufacturing Industry”, Fujitsu Research Institute Paper No.167, June.
Koopman, R., W. Powers, Z. Wang and S.-J. Wei (2010). “Give credit to where credit is due: tracing value added in global production chains”, NBER Working Papers Series 16426, September 2010.
Koopman, R.B., Wang, Z., Wei, S.J. 2014. Tracing Value-Added and Double Counting in Gross Exports. The American Economic Review, 104(2): 459-494.
Linden, G., Kraemer, K.L., Dedrick, J. (2009). “Who captures value in a global innovation network? The case of Apple's iPod.” Communications of the ACM, 52(3), 140-144.
Lodefalk, M (2014), "The role of services for manufacturing firm exports", Review of World Economics, 150(1), 59-82.
Nordås, H K (2010), "Trade in goods and services: Two sides of the same coin?" Economic Modelling, 27(2), 496-506.

30
Nordås, H K and D Rouzet (2014), The Impact of Services Trade Restrictiveness on Trade Flows: First Estimates, OECD Publishing.
OECD (2014), "Global Value Chains: Challenges, Opportunities, and Implications for Policy", Report prepared for submission to the G20 Trade Ministers Meeting Sydney, Australia, 19 July 2014: OECD, WTO, and the World Bank.
Pasadilla, G O, and A Wirjo (2014), "Services and Manufacturing: Patterns of Linkages Policy Brief", APEC: APEC Policy Support Unit.
Patterns and Several Testable Hypotheses, World Economy
Pilat, D (2005), "Measuring the Interaction Between Manufacturing and Services", OECD STI Working Paper. Working Paper Organisation for Economic Co-operation and Development. Paris.
Pilat, D, A Cimper, K Olsen, and C Webb (2008), "The Changing Nature of Manufacturing in OECD Economies", in Co. Organisation for Economic & Development (eds.), Staying Competitive in the Global Economy: Compendium of Studies on Global Value Chains, pp. 103-140: Paris and Washington, D.C.: Organisation for Economic Co-operation and Development.
Timmer, M.P., Erumban, A.A., Los, B., Stehrer, R., De Vries, G.J. 2014. Slicing Up Global Value Chains. Journal of Economic Perspectives, 28(2): 99-118.

31
Appendix
Appendix Table 1
List of industries
Industry code Industry description Sector
001 Paddy007A Other grain002X Cassava, Sugar cane and beet, Oil palm and coconuts, Other food crops003X Natural rubber, Fiber crops, Other commercial crops009 Livestock and poultry010 Forestry011 Fishery012 Crude petroleum and natural gas015A Iron ore010X Copper ore, Tin ore, Other metallic ore016 Non-metallic ore and quarrying018X Milled rice, Other milled grain and flour021A Fish products021B Slaughtering, meat and dairy products017X Oil and fats, Sugar, Other food products022A Beverage022B Tobacco023 Spinning024 Weaving and dyeing025 Knitting026 Wearing apparel027 Other made-up textile products028 Leather and leather products029 Timber030A Furniture030B Other wooden products031 Pulp and paper032 Printing and publishing033A Synthetic resins and fiber033B Other basic industrial chemicals034 Chemical fertilizers and pesticides035A Drugs and medicine035B Other chemical products036 Refined petroleum and its products037 Tires and tubes038 Other rubber products039 Cement and cement products040 Glass and glass products041 Other non-metallic mineral products042 Iron and steel043 Non-ferrous metal044 Metal products045D Heavy electric machinery045E Engines and turbines045X Ordinary industrial machinery, Specialized industrial machinery, Agricultural machinery046A Electronics and electronic products046B Other electric machinery and appliance047A Motor vehicles048B Shipbuilding048X Motor cycles and bicycles (Motor cycles), Motor cycles and bicycles (Bicycles), Aircrafts, Other transport equipment049 Precision machines050A Plastic products050B Other manufacturing products051 Electricity, gas and water supply052A Building construction052B Other construction053A Wholesale and retail trade053B Transportation054A Telephone and telecommunication054B Finance and insurance054C Education and research054D Other service including Real estate, Medical and health service, Restaurants, Hotel056 Unclassified055 Public administration
Prim
ary secto
rM
anufac
turin
g secto
rServic
e se
cto
r
32
Appendix Table 2: Backward participation by industries
Source: Authors’ elaboration based on AIO data.
0
0.05
0.1
0.15
0.2
0.25
0.3
0.35
Backward1990
Backward1995
Backward2000
Backward2005
0
0.05
0.1
0.15
0.2
0.25
0.3
0.35
Backward1990
Backward1995
Backward2000
Backward2005
0
0.05
0.1
0.15
0.2
0.25
0.3
0.35
Backward1990
Backward1995
Backward2000
Backward2005
33
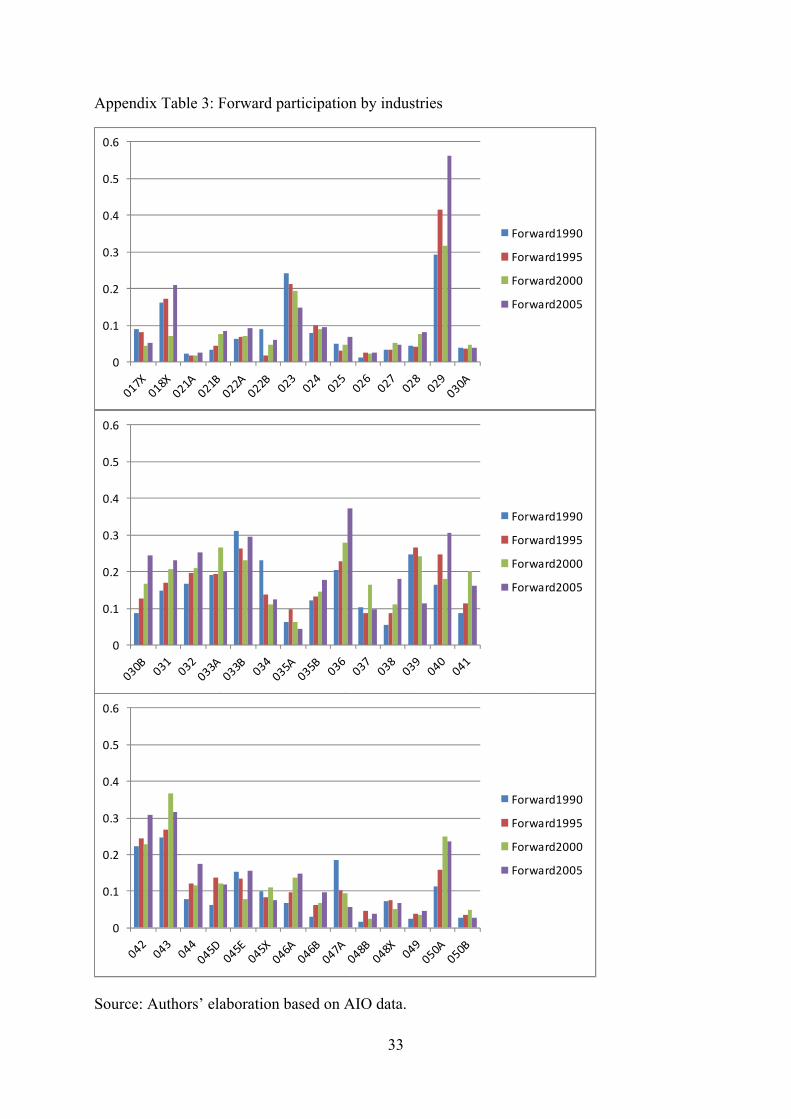
Appendix Table 3: Forward participation by industries
Source: Authors’ elaboration based on AIO data.
0
0.1
0.2
0.3
0.4
0.5
0.6
Forward1990
Forward1995
Forward2000
Forward2005
0
0.1
0.2
0.3
0.4
0.5
0.6
Forward1990
Forward1995
Forward2000
Forward2005
0
0.1
0.2
0.3
0.4
0.5
0.6
Forward1990
Forward1995
Forward2000
Forward2005