institutional and commercial real estate market …groups.haas.berkeley.edu/realestate/execed/conf11...
TRANSCRIPT

Institutional and Commercial Real Estate Market Update -Forecast 2011 -2012
Prepared for
16th Annual Fisher Center Real Estate Conference
Prepared by
Lawrence Souza, CCIM/CRE/RICS
- Johnson Souza Group, Inc.: Principal – Real Estate and Financial Economist, Broker and Advisor.
- Golden Gate University: Adjunct Professor – Real Estate/Finance/Economics; DBA Candidate: Bus Admin. (2011).
The Parc 55 Wyndham Hotel, 55 Cyril Magnin Street, Sa n Francisco, CA 94102
12:45 - 2:00 pm. Tuesday May 24th, 2011
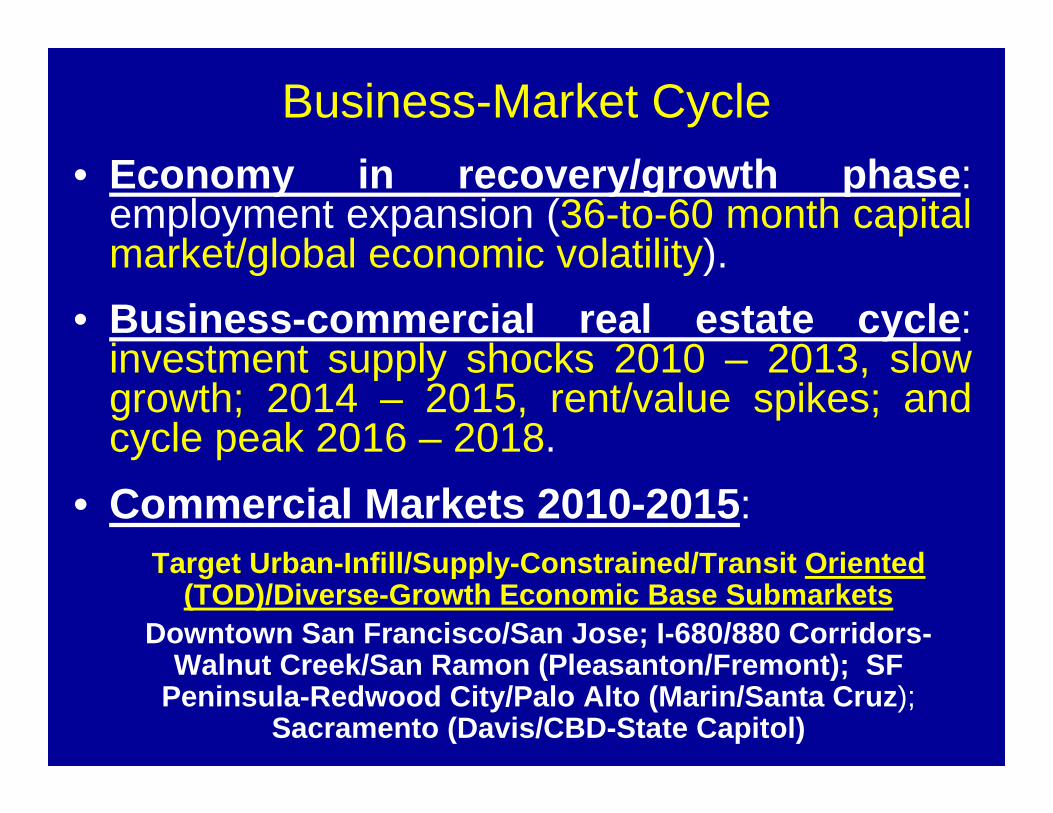
• Economy in recovery/growth phase : employment expansion (36-to-60 month capital market/global economic volatility).
• Business -commercial real estate cycle : investment supply shocks 2010 – 2013, slow growth; 2014 – 2015, rent/value spikes; and cycle peak 2016 – 2018.
• Commercial Markets 2010 -2015:
Business-Market Cycle
Target Urban-Infill/Supply-Constrained/Transit Orie nted (TOD)/Diverse-Growth Economic Base Submarkets
Downtown San Francisco/San Jose; I-680/880 Corridor s-Walnut Creek/San Ramon (Pleasanton/Fremont); SF
Peninsula-Redwood City/Palo Alto (Marin/Santa Cruz ); Sacramento (Davis/CBD-State Capitol)

Geography
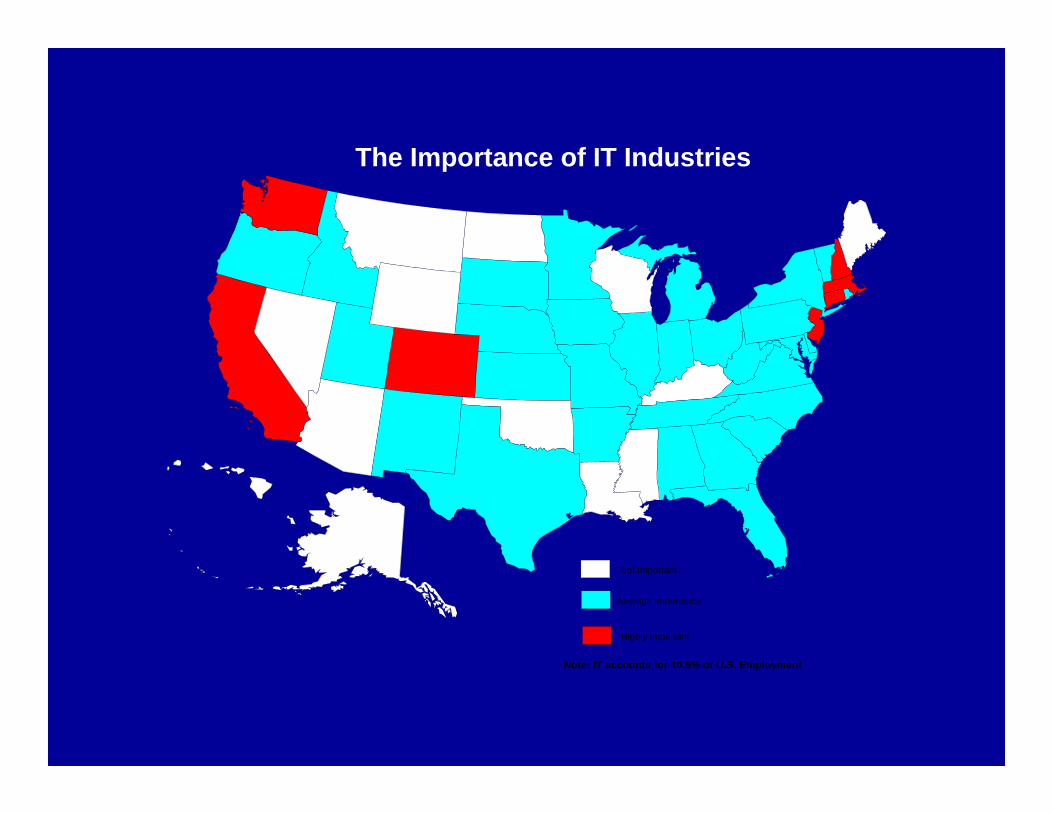
Not Important
Average Importance
Highly Important
Note: IT accounts for 10.5% of U.S. Employment
The Importance of IT Industries
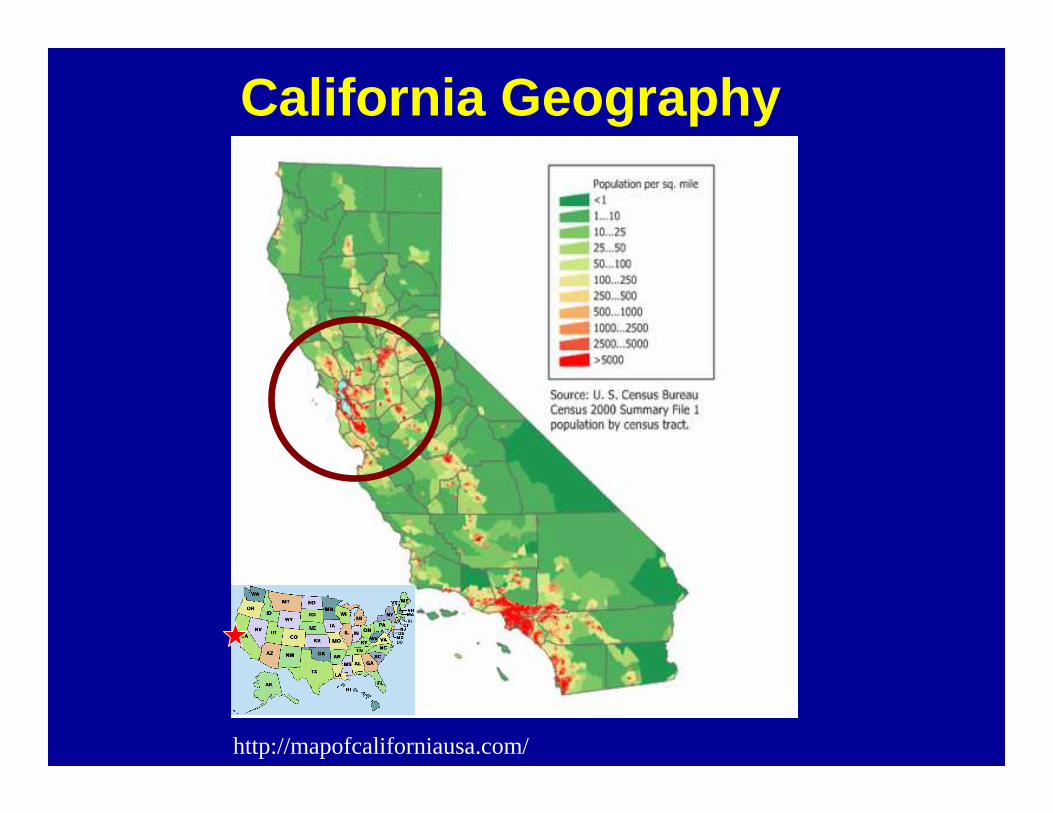
California Geography
http://mapofcaliforniausa.com/
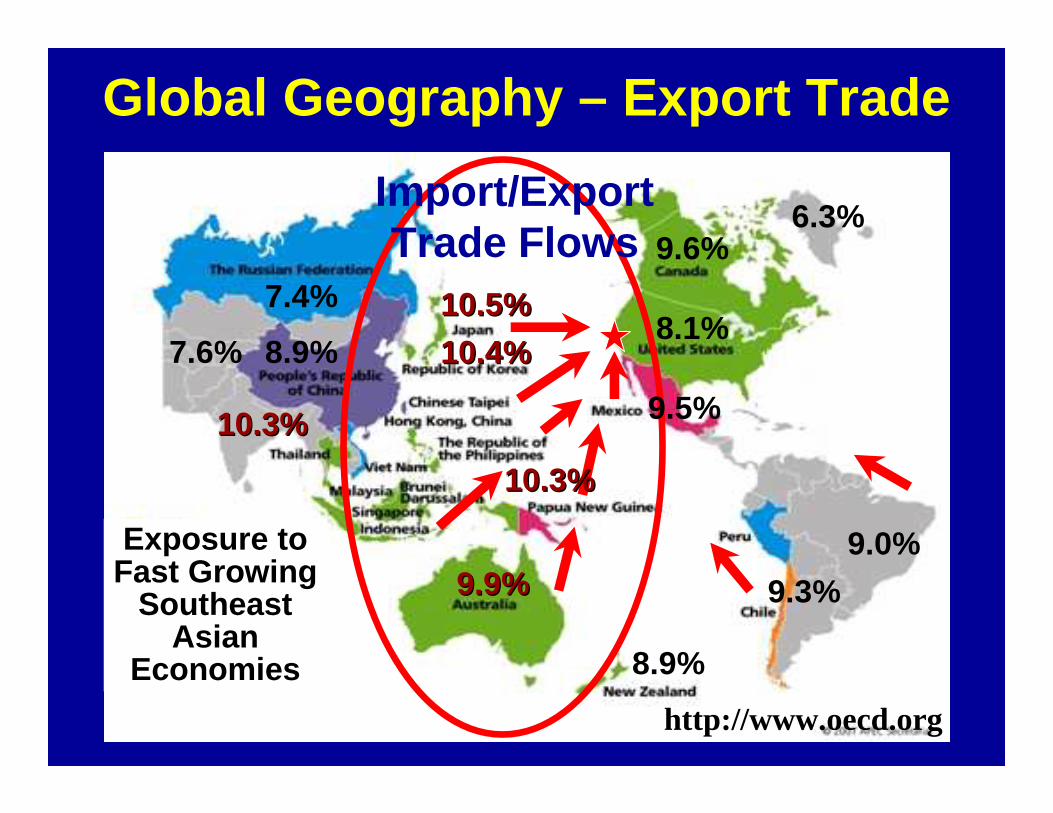
Global Geography – Export Trade
Exposure to Fast Growing
Southeast Asian
Economies
Import/Export Trade Flows
9.3%
http://www.oecd.org
9.0%9.9%9.9%
9.5%
8.1%
9.6%
7.4%
10.3%10.3%
8.9%10.5%10.5%
10.4%10.4%
10.3%10.3%
8.9%
7.6%
6.3%

Transportation Flows
http://www.dot.gov/ http://www.fhwa.dot.gov/environment/freightaq/appendixc.htm
Trucking carriers 64% of interregional freight tonnage, marine vessels 21%, railroads 14%. Ranked second in total intercity freight tonnage and tied for first for greatest volume of intercity truck freight.
One of Most Extensive Networks of Highways and Arterial Streets in U.S. (I- 5/I- 15/I- 40/I- 10)
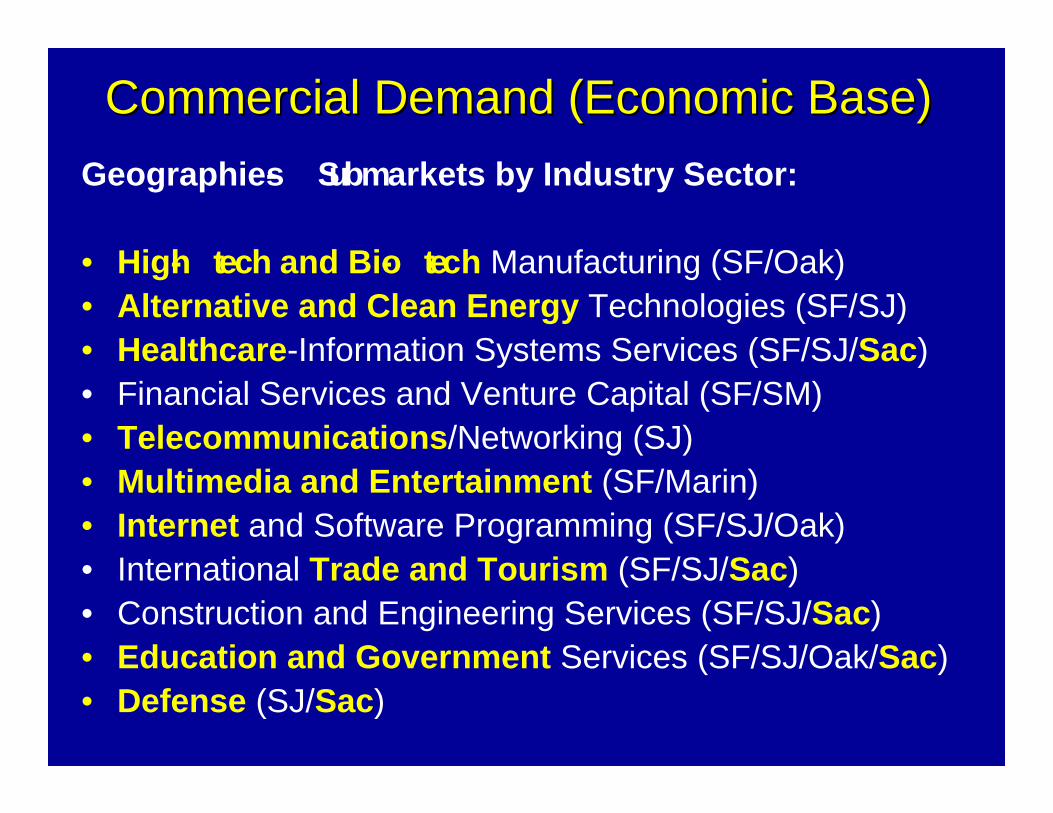
Geographies- Submarkets by Industry Sector:
• High- tech and Bio- tech Manufacturing (SF/Oak)• Alternative and Clean Energy Technologies (SF/SJ)• Healthcare -Information Systems Services (SF/SJ/Sac)• Financial Services and Venture Capital (SF/SM)• Telecommunications /Networking (SJ)• Multimedia and Entertainment (SF/Marin)• Internet and Software Programming (SF/SJ/Oak)• International Trade and Tourism (SF/SJ/Sac)• Construction and Engineering Services (SF/SJ/Sac)• Education and Government Services (SF/SJ/Oak/Sac)• Defense (SJ/Sac)
Commercial Demand (Economic Base)Commercial Demand (Economic Base)

Institutional Commercial Real Estate Analysis
Institutional Foundations for Efficient Capital Markets
“Efficient real estate and securities capital markets require strong public and private sector cooperation, disclosure of government and corporate financial conditions, and institutional and individual investor confidence in financial and political institutions.” Lawrence Souza

Cross Sectional ApproachCommercial Real Estate Investment
“The nature of commercial real estate investment is cross-sectional in nature, taking multiple disciplines and approaches to solving the
valuation equation.”
V REt = THEOLOGY + e^ Linquistics
V REp1 = PHILOSOPHY + e^ Language
V REl = LAW + e^ Psychology
V REp2 = POLITICS + e^ f Sociology
V REtp3 = PUBLIC ADM INISTRATION + e^ Technology
V REte = ECONOM ICS + e^ Telecom
V REtf = FINANCE + e^ Cognition
V REta = ACCOUNTING + e^ Logic

Modern Real Estate Portfolio TheoryModern Real Estate Portfolio Theory-- Benefits of DiversificationBenefits of Diversification --
N#
SYSTEMATIC RISK
NON-DIVERSIFIABLE
NON-SYSTEMATIC RISK
DIVERSIFIABLE
T O T A L
R I S K
σσσσ/ββββ

Modern Real Estate Portfolio TheoryModern Real Estate Portfolio Theory-- Limitations to DiversificationLimitations to Diversification --
N#
SYSTEMATIC RISK
STRUCTURAL RISK
POLITICAL RISK
ECONOMIC RISK
MARKET RISK
NON-DIVERSIFIABLE
NON-SYSTEMATIC RISKDIVERSIFIABLE
T O T A L
R I S K
σσσσ/ββββ

VIX CBOE Mkt Volatility Index - From 2001 to 2010
http://bigcharts.marketwatch.com
Post-Dot Com Bust 9/11 Econ
Decline
Economic Recovery/Growth Stock/Real Estate
Market Price Appreciation
High Volatility
Falling/Low Volatiltiy
High Volatility
Extreme Capital Market
Shocks/Credit Crisis/Recession/Foreclosures/Curren
cy Crisis
Highly Volatile Capital Market Environments Businesses-Consumers Hold Off on Investment-
Consumption Hold Large Precautionary Cash Balances
Making Monetary Policy Ineffective (Liquidity Trap)
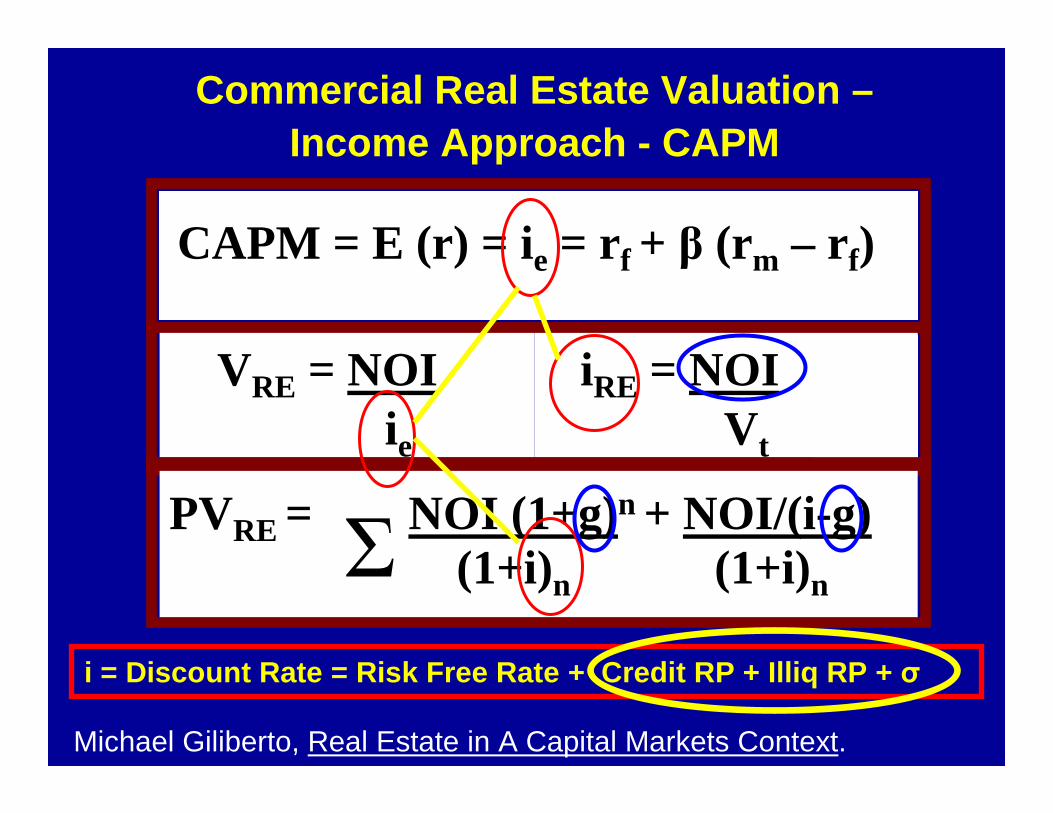
Commercial Real Estate Valuation –Income Approach - CAPM
CAPM = E (r) = ie = r f + β (rm – rf)
VRE = NOIie
iRE = NOIVt
PVRE = NOI (1+g)n + NOI/(i-g)(1+i)n (1+i)n
Σ
Michael Giliberto, Real Estate in A Capital Markets Context.
i = Discount Rate = Risk Free Rate + Credit RP + I lliq RP + σ
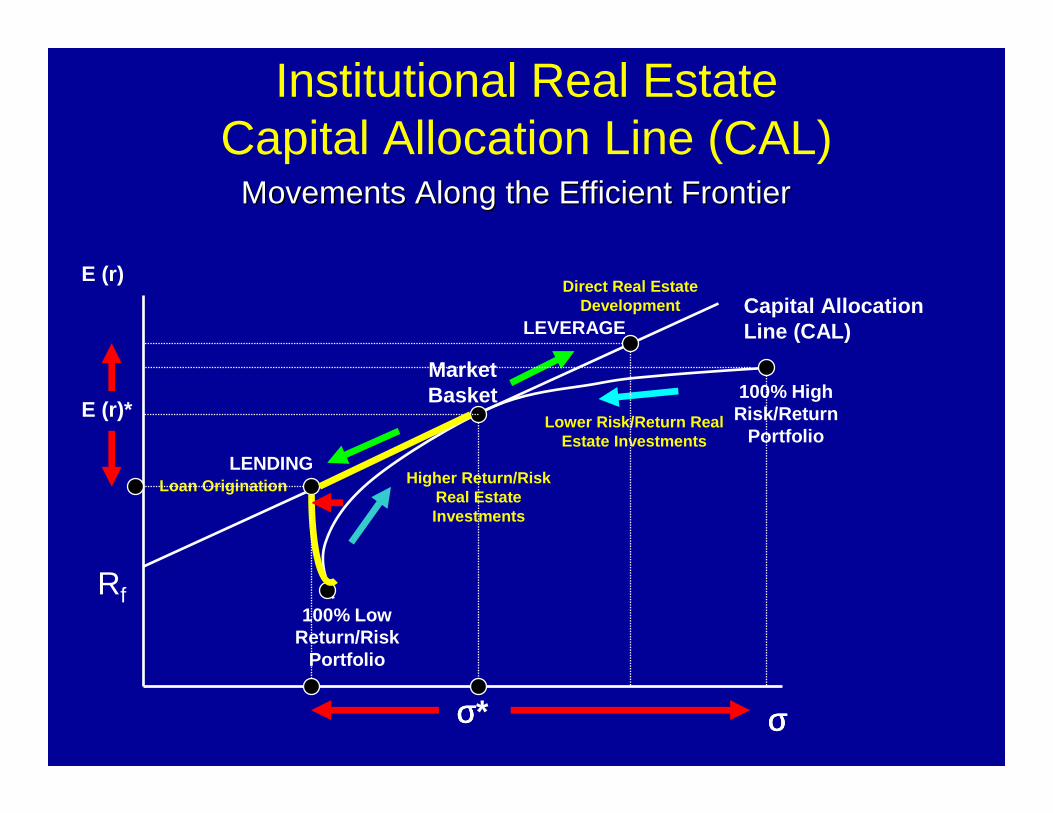
Institutional Real EstateCapital Allocation Line (CAL)
E (r)
σσσσ
Capital Allocation Line (CAL)
LENDING
LEVERAGE
100% High Risk/Return
Portfolio
100% Low Return/Risk
Portfolio
Market Basket
E (r)*
σσσσ*
Higher Return/Risk Real Estate Investments
Lower Risk/Return Real Estate Investments
Loan Origination
Direct Real Estate Development
Movements Along the Efficient FrontierMovements Along the Efficient Frontier
Rf

Institutional Investor Update
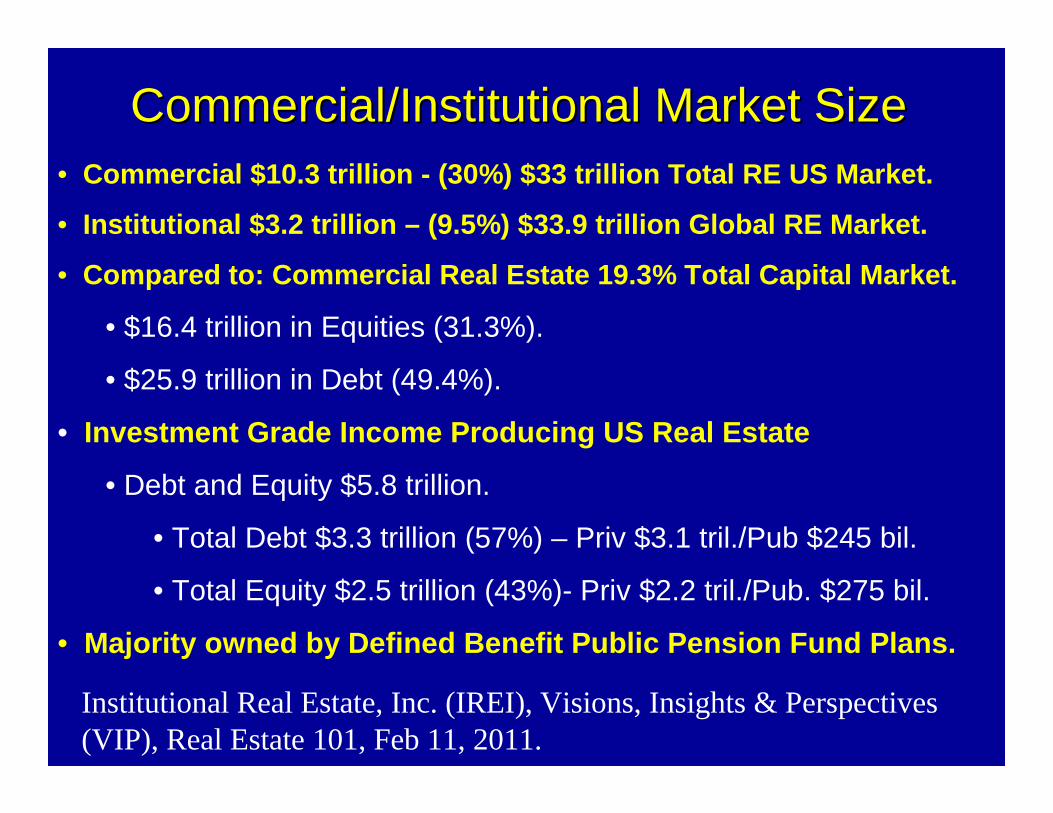
Commercial/Institutional Market SizeCommercial/Institutional Market Size
Institutional Real Estate, Inc. (IREI), Visions, Insights & Perspectives (VIP), Real Estate 101, Feb 11, 2011.
• Commercial $10.3 trillion - (30%) $33 trillion Total RE US Market.
• Institutional $3.2 trillion – (9.5%) $33.9 trillion Global RE Market.
• Compared to: Commercial Real Estate 19.3% Total Cap ital Market.
• $16.4 trillion in Equities (31.3%).
• $25.9 trillion in Debt (49.4%).
• Investment Grade Income Producing US Real Estate
• Debt and Equity $5.8 trillion.
• Total Debt $3.3 trillion (57%) – Priv $3.1 tril./Pub $245 bil.
• Total Equity $2.5 trillion (43%)- Priv $2.2 tril./Pub. $275 bil.
• Majority owned by Defined Benefit Public Pension Fu nd Plans.
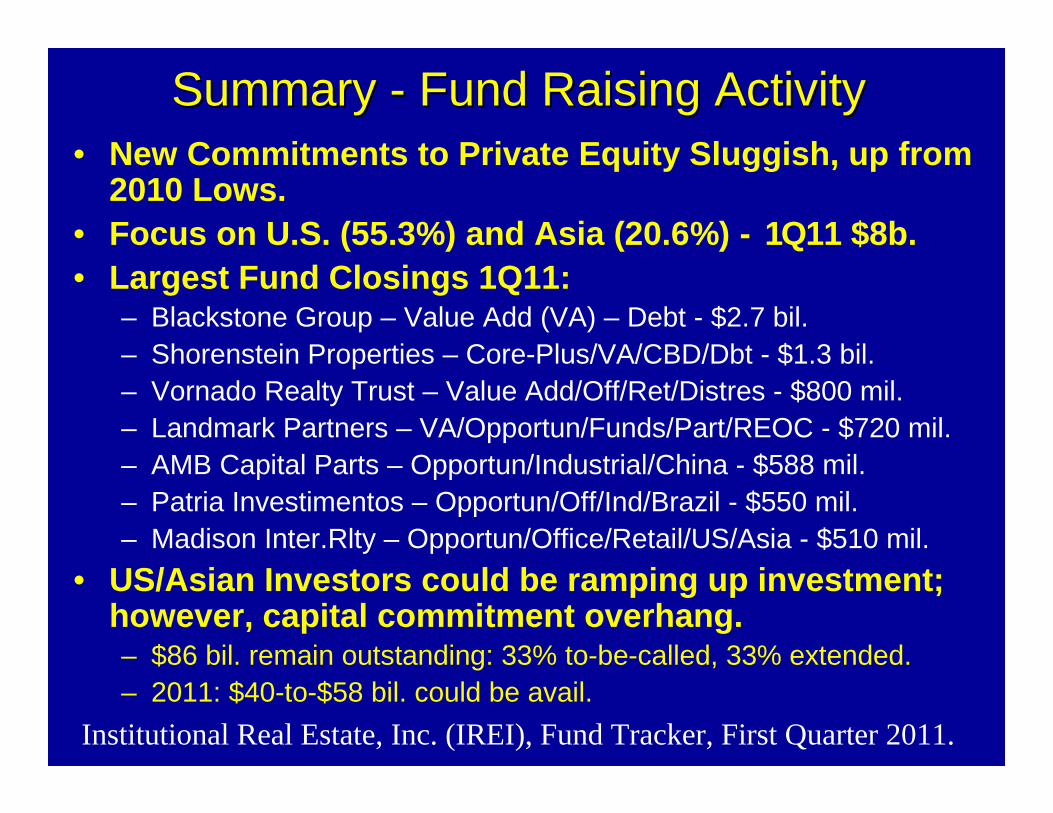
• New Commitments to Private Equity Sluggish, up from 2010 Lows.
• Focus on U.S. (55.3%) and Asia (20.6%) - 1Q11 $8b.• Largest Fund Closings 1Q11:
– Blackstone Group – Value Add (VA) – Debt - $2.7 bil.– Shorenstein Properties – Core-Plus/VA/CBD/Dbt - $1.3 bil.– Vornado Realty Trust – Value Add/Off/Ret/Distres - $800 mil.– Landmark Partners – VA/Opportun/Funds/Part/REOC - $720 mil.– AMB Capital Parts – Opportun/Industrial/China - $588 mil.– Patria Investimentos – Opportun/Off/Ind/Brazil - $550 mil.– Madison Inter.Rlty – Opportun/Office/Retail/US/Asia - $510 mil.
• US/Asian Investors could be ramping up investment; however, capital commitment overhang.– $86 bil. remain outstanding: 33% to-be-called, 33% extended.– 2011: $40-to-$58 bil. could be avail.
Summary Summary -- Fund Raising ActivityFund Raising Activity
Institutional Real Estate, Inc. (IREI), Fund Tracker, First Quarter 2011.
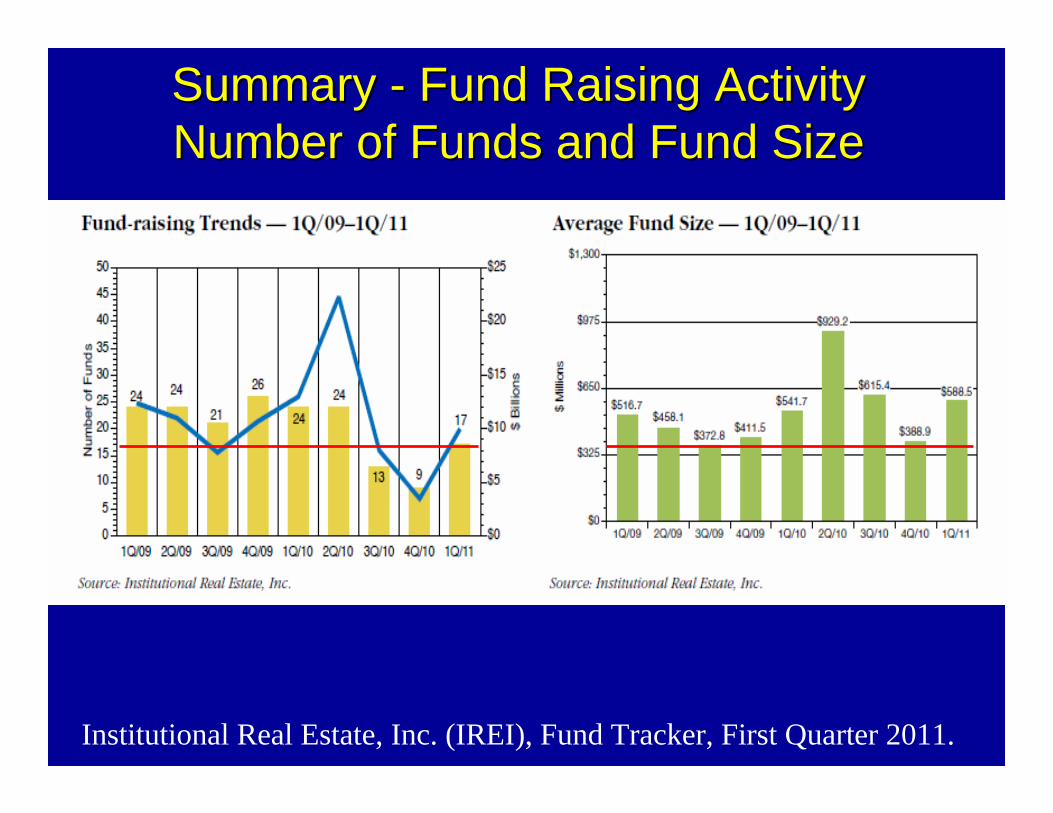
Summary Summary -- Fund Raising ActivityFund Raising ActivityNumber of Funds and Fund SizeNumber of Funds and Fund Size
Institutional Real Estate, Inc. (IREI), Fund Tracker, First Quarter 2011.

Summary Summary -- Fund Raising ActivityFund Raising ActivityGeographic Focus and Investment StyleGeographic Focus and Investment Style
Institutional Real Estate, Inc. (IREI), Fund Tracker, First Quarter 2011.
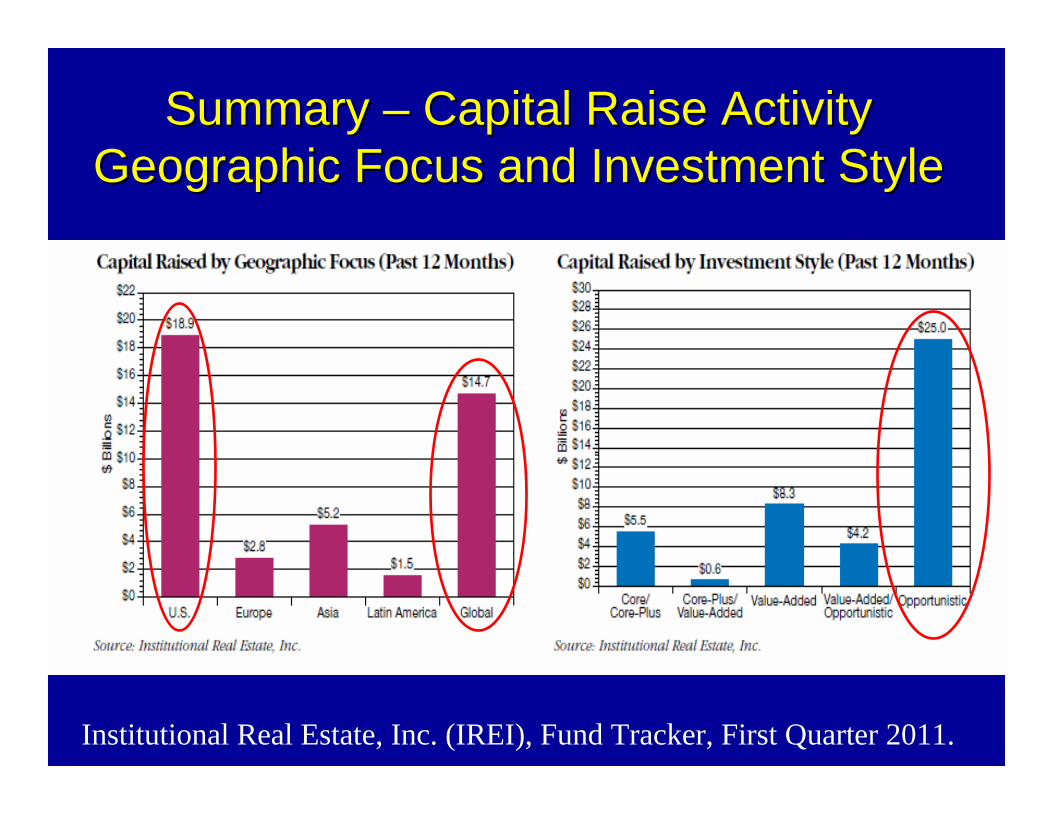
Summary Summary –– Capital Raise ActivityCapital Raise ActivityGeographic Focus and Investment StyleGeographic Focus and Investment Style
Institutional Real Estate, Inc. (IREI), Fund Tracker, First Quarter 2011.

Commercial Market Update
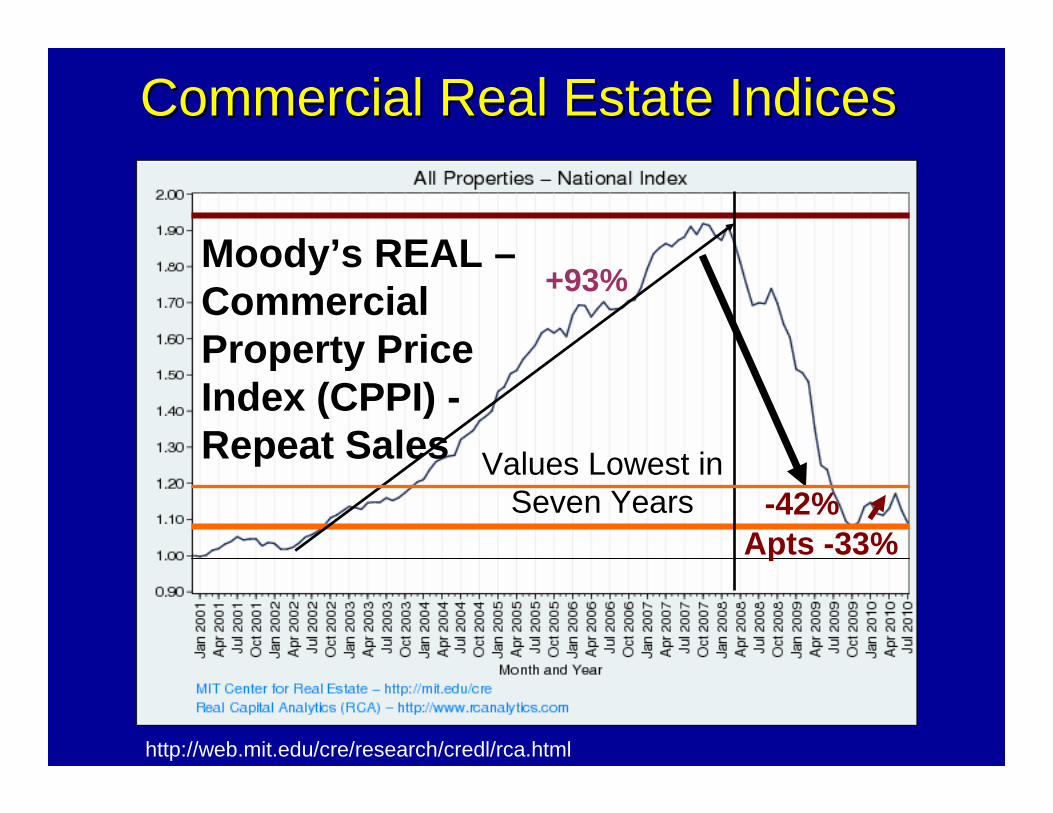
Commercial Real Estate IndicesCommercial Real Estate Indices
-42%
Moody ’s REAL –Commercial Property Price Index (CPPI) -Repeat Sales
+93%
http://web.mit.edu/cre/research/credl/rca.html
Values Lowest in Seven Years
Apts -33%

2010 Acquisition Financing2010 Acquisition Financing
Real Capital Analytics (RCA), US Capital Trends, March 2011.
28%28%28%28%
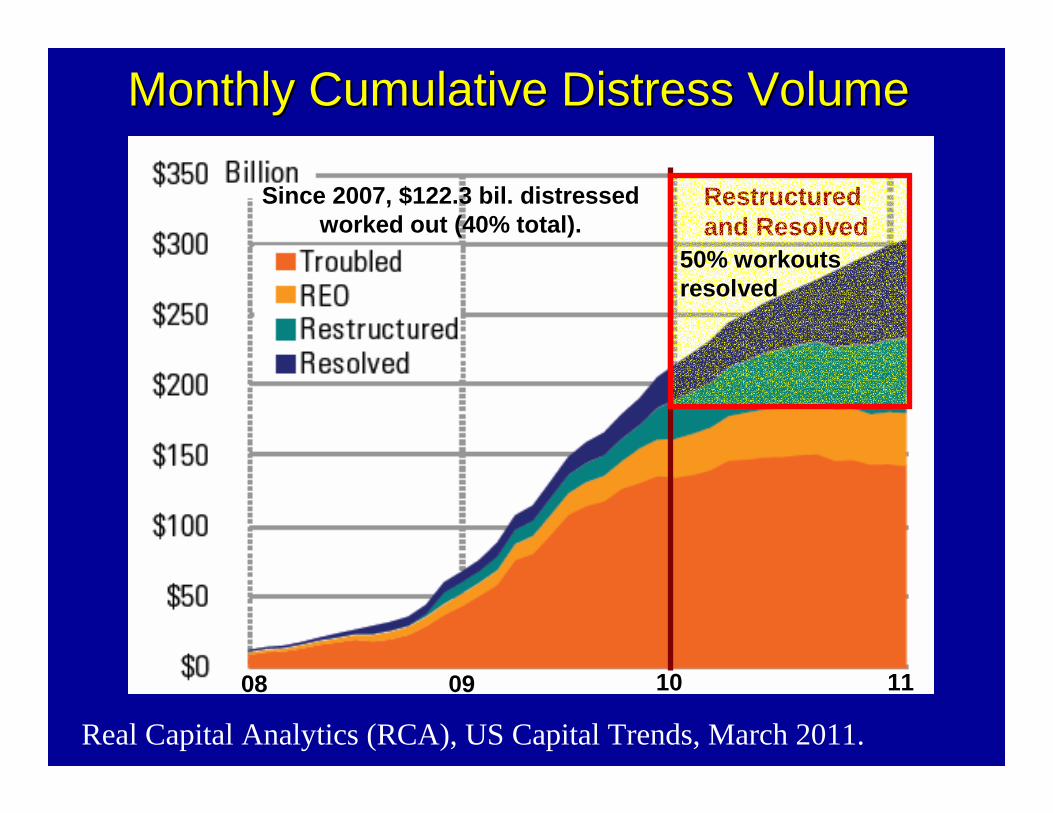
Monthly Cumulative Distress VolumeMonthly Cumulative Distress Volume
Real Capital Analytics (RCA), US Capital Trends, March 2011.
Restructured and Resolved
08 09 10 11
Since 2007, $122.3 bil. distressed worked out (40% total).
50% workouts resolved

2010 Top Lenders2010 Top Lenders
Real Capital Analytics (RCA), US Capital Trends, March 2011.

U.S. Property Sales (2005U.S. Property Sales (2005--2012)2012)
Real Capital Analytics (RCA), US Capital Trends, March 2011.
11 12
2011-2013: $190-to-$250 bil.
2012-2014: $300-to-$400 bil.
Annual Forecast
Most Active Markets : New York, Wash DC, San Francisco; Hotels, Office, Apartments

Most Pressing Challenges to Commercial Market
National Association of Realtors, Commercial Real Estate Quarterly Market Survey, April 2011.

2010 Top Metropolitan Markets2010 Top Metropolitan Markets
Real Capital Analytics (RCA), US Capital Trends, March 2011.
$12b
$7b
$6b$5b
$3b
200%
150%

Average Cap RatesAverage Cap Rates
Real Capital Analytics (RCA), US Capital Trends, March 2011.
-70-to-150 bsp
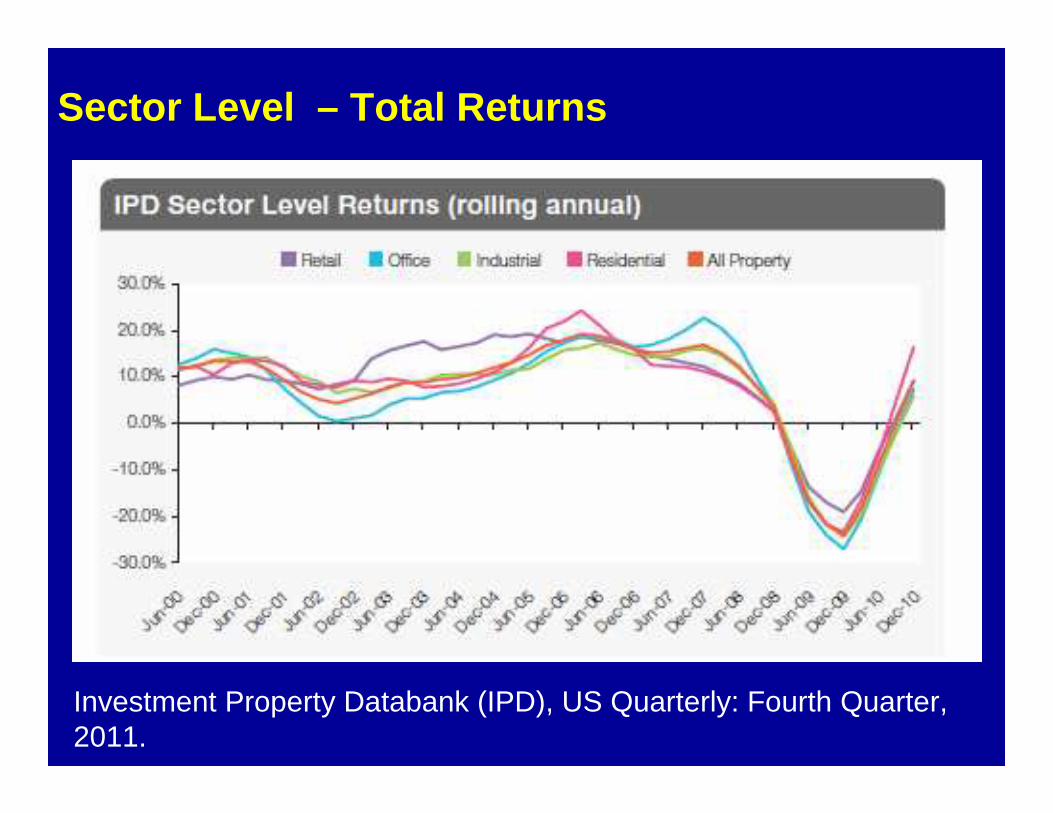
Sector Level – Total Returns
Investment Property Databank (IPD), US Quarterly: Fourth Quarter, 2011.

Institutional Sector – Total Returns
National Council of Real Estate Investment Fiduciaries (NCREIF),Press Release, First Quarter 2011, April 25, 2011.
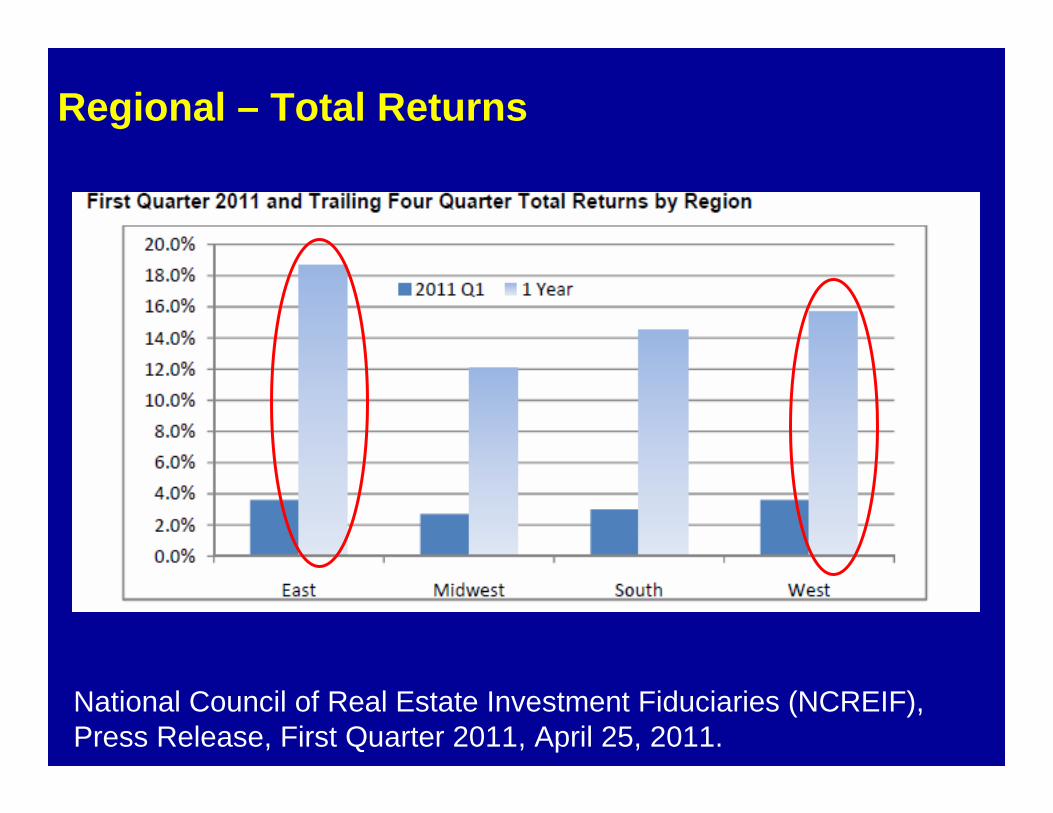
Regional – Total Returns
National Council of Real Estate Investment Fiduciaries (NCREIF),Press Release, First Quarter 2011, April 25, 2011.
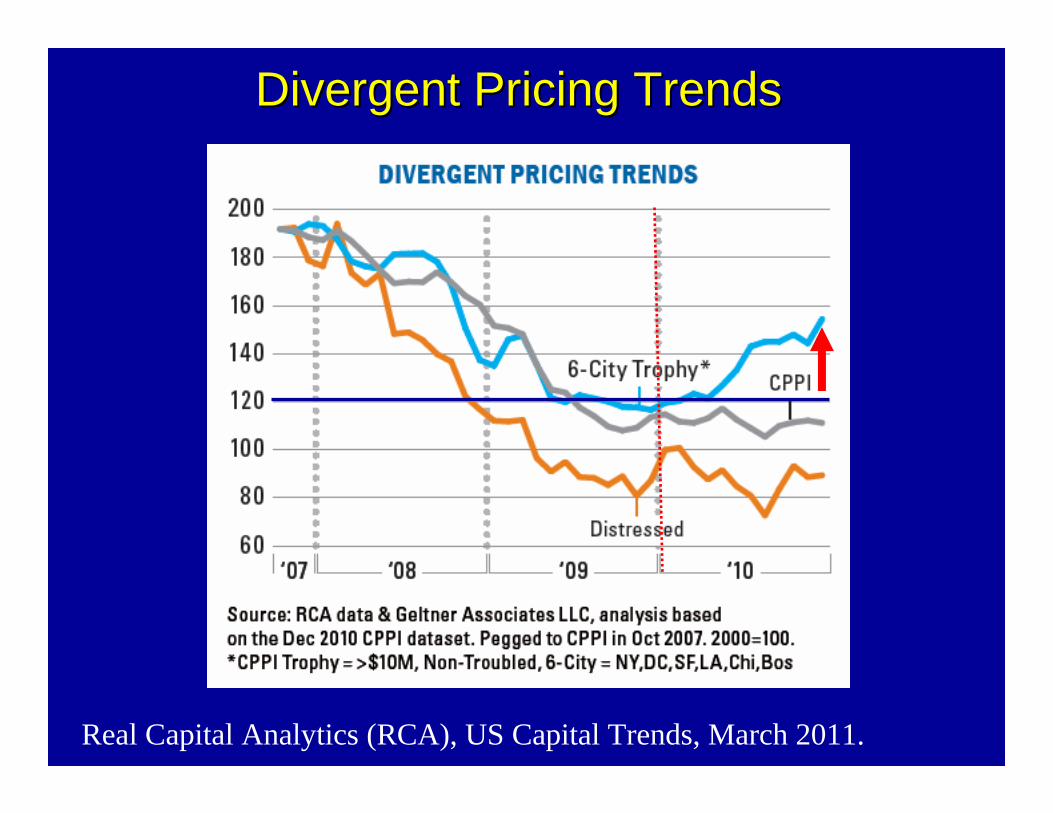
Divergent Pricing TrendsDivergent Pricing Trends
Real Capital Analytics (RCA), US Capital Trends, March 2011.

National Commercial Real Estate Space Market

Gross Domestic Product (GDP)
http://www.bea.gov/newsreleases/national/gdp/gdpnewsrelease.htm
4Q53/1Q58/2Q80/1Q82 = -6.2% / -10.4% / --7.9%7.9% / -6.4%, Worst in 28 yrs.Worst in 28 yrs.
GDP = consumption + gross investment + government s pending + (exports − imports)
4Q/084Q/08’’--6.8%6.8%Avg. 36-to-48 month trough
http://www.bea.gov/briefrm/gdp.htm
2Q/102Q/10’’+1.7%+1.7%
1Q/111Q/11’’+1.8%+1.8%
4Q/094Q/09’’+5.0%+5.0%
20112011--2012f2012f+2.0%+2.0%--toto --3.0%3.0%
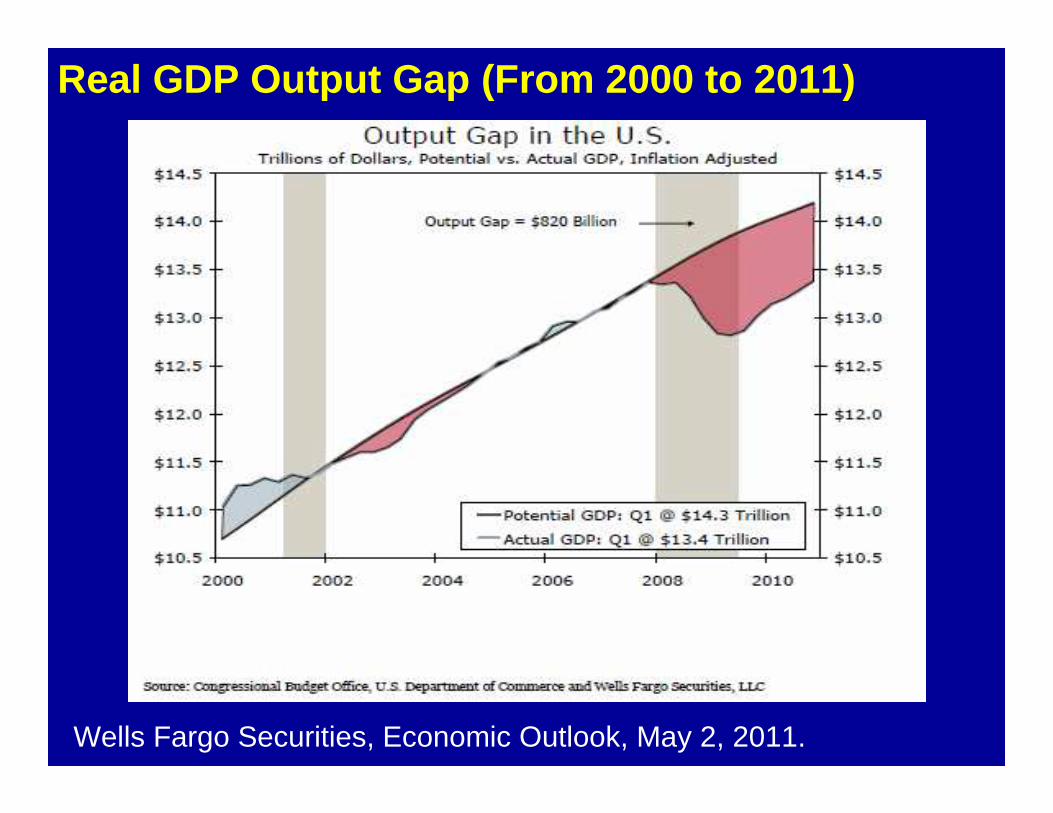
Real GDP Output Gap (From 2000 to 2011)
Wells Fargo Securities, Economic Outlook, May 2, 2011.

Apartment Price, Vacancy, Supply/Demand (2001 to 2011)
Wells Fargo Securities, Economic Outlook, May 2, 2011.

Office Price, Vacancy, Supply/Demand (2001 to 2011)
Wells Fargo Securities, Economic Outlook, May 2, 2011.

Industrial Price, Vacancy, Supply/Demand (2001 to 2011)
Wells Fargo Securities, Economic Outlook, May 2, 2011.
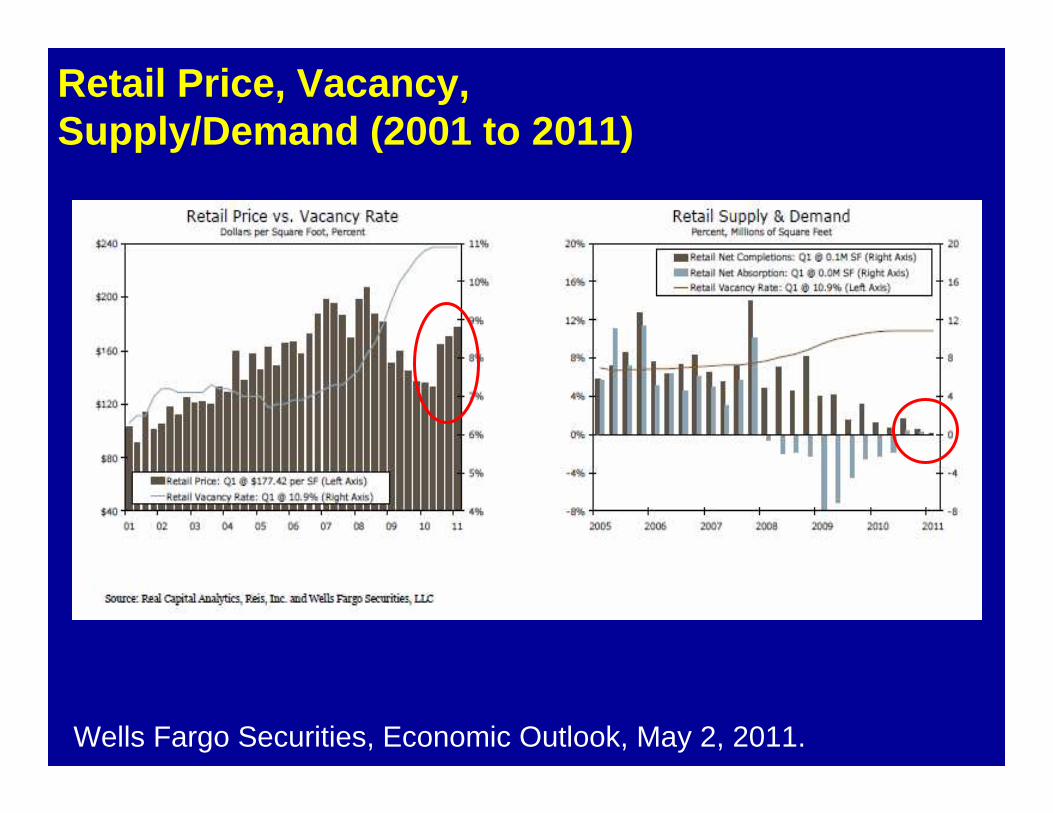
Retail Price, Vacancy, Supply/Demand (2001 to 2011)
Wells Fargo Securities, Economic Outlook, May 2, 2011.

Local Commercial Real Estate Space Market
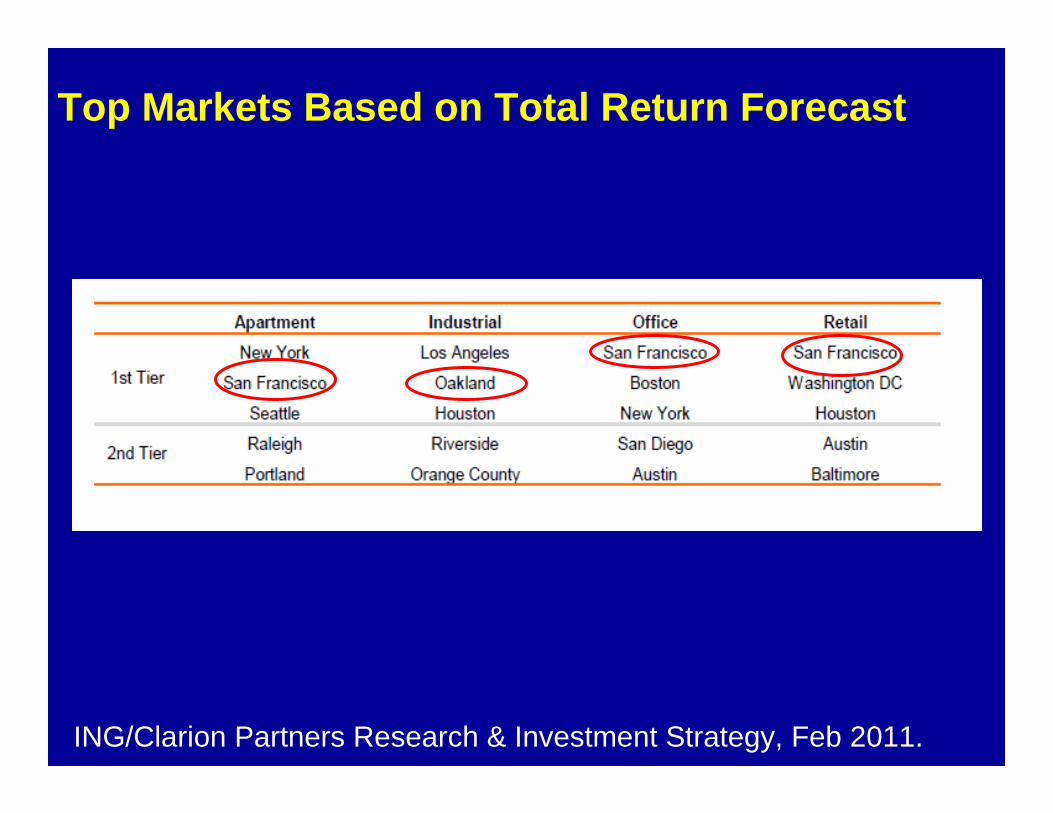
Top Markets Based on Total Return Forecast
ING/Clarion Partners Research & Investment Strategy, Feb 2011.

Office Industrial
SF Bay Area 15.7% 10.7%Los Angeles 18.0% 7.5%
Santa Clara 18.4% 8.7%Sacramento 22.5% 16.1%Riv.-San Co. 23.5% 15.1%Orange Co 17.4% 9.2%San Diego 19.1% 16.4%Chicago 20.2% 11 .1%New York 11.3% 12.0 %
Source: CB Richard Ellis, MarketView, Fourth Quarter, 2010.
Office and Industrial Vacancy/Availability Rates
Commercial Market Comparison
0.174
$34
$28
0%
5%
10%
15%
20%
25%
2000 2001 2002 2003 2004 2005 2006 2007 2008 2009 2010 2011F 2012F$0
$10
$20
$30
$40
$50
$60
$70
$80
$90
Vacancy Class A Rent Class B Rent Asking RentVacancy
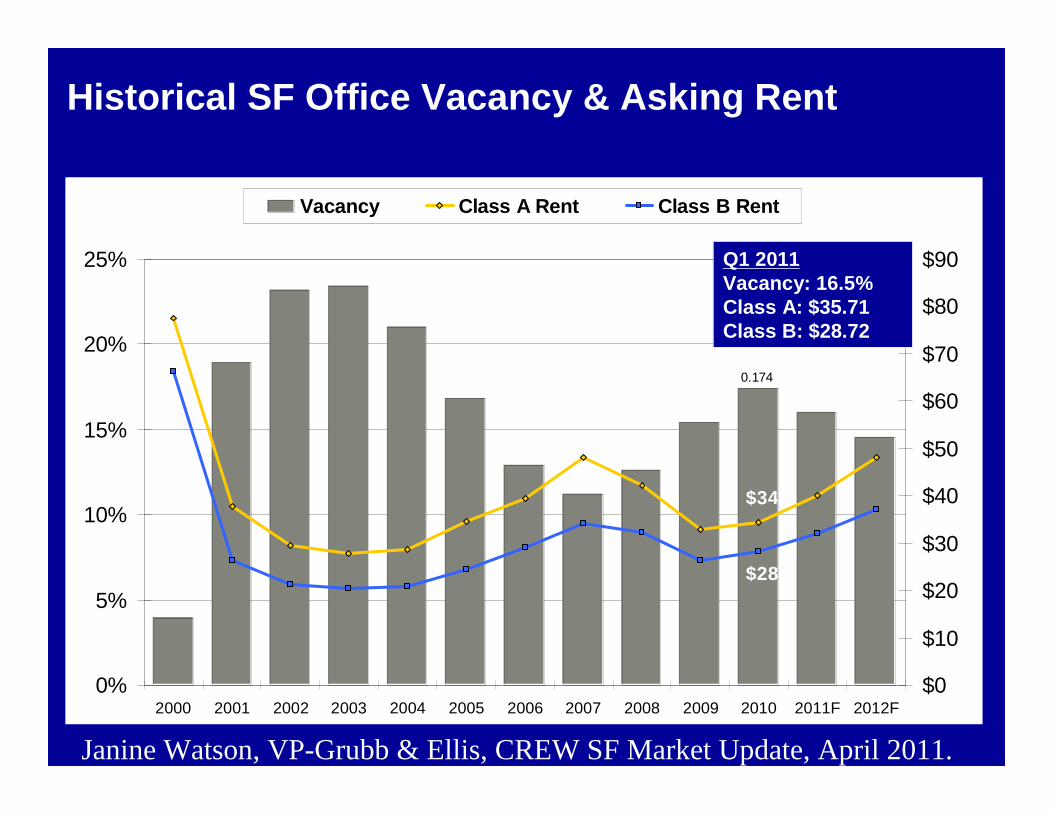
Historical SF Office Vacancy & Asking Rent
Q1 2011Vacancy: 16.5%Class A: $35.71Class B: $28.72
Janine Watson, VP-Grubb & Ellis, CREW SF Market Update, April 2011.

Zynga Online Gaming 650 TownsendZynga Online Gaming 650 Townsend
Twitter Social Media 795 FolsomTwitter Social Media 795 Folsom
Dolby Digital Media 100 PotreroDolby Digital Media 100 Potrero
Wikipedia Online Communities 149 New MontgomeryWikipedia Online Communities 149 New Montgomery
CurrentTV Video Streaming 118 KingCurrentTV Video Streaming 118 King
Macys.com Clicks & Bricks Retail 685 MarketMacys.com Clicks & Bricks Retail 685 Market
Salesforce Cloud Computing 1 Market/Mission BaySalesforce Cloud Computing 1 Market/Mission Bay
Slide Mobile App Developers 301 BrannanSlide Mobile App Developers 301 Brannan
Digital Natives: Major SF Tech Companies
StubHub Online Ticket Sales 199 FremontStubHub Online Ticket Sales 199 Fremont
Janine Watson, VP-Grubb & Ellis, CREW SF Market Update, April 2011.
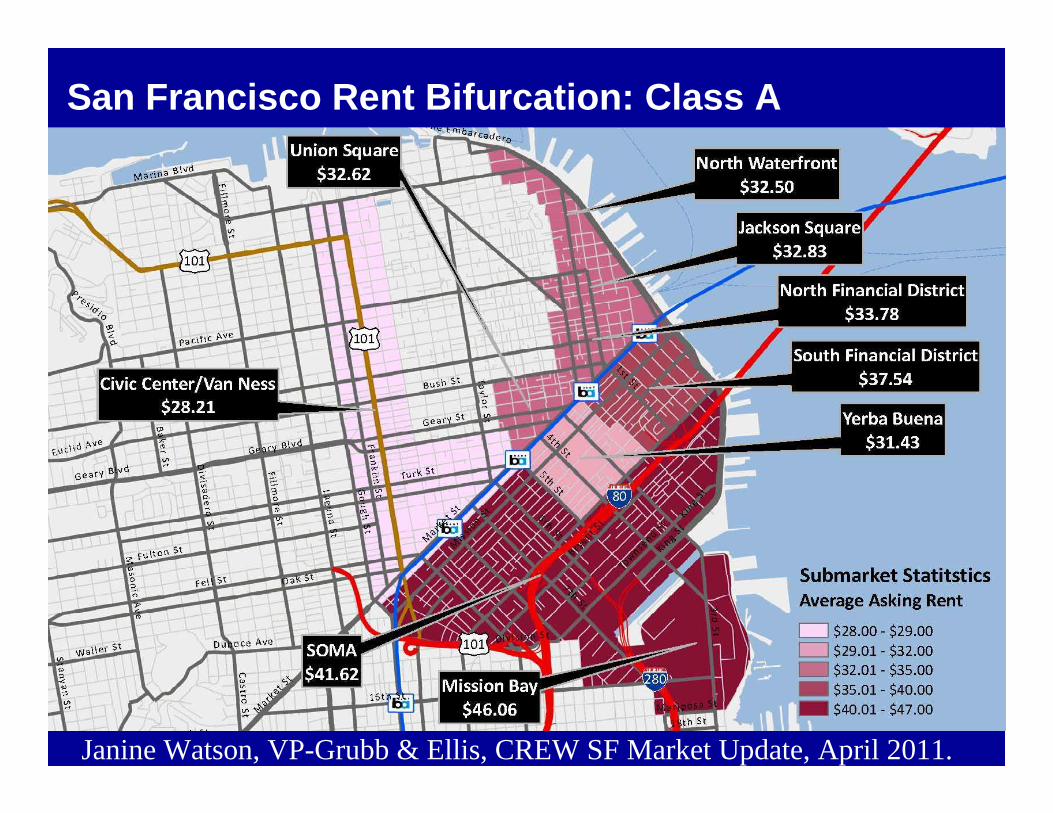
San Francisco Rent Bifurcation: Class A
Janine Watson, VP-Grubb & Ellis, CREW SF Market Update, April 2011.

Global Commercial Real Estate Space Market
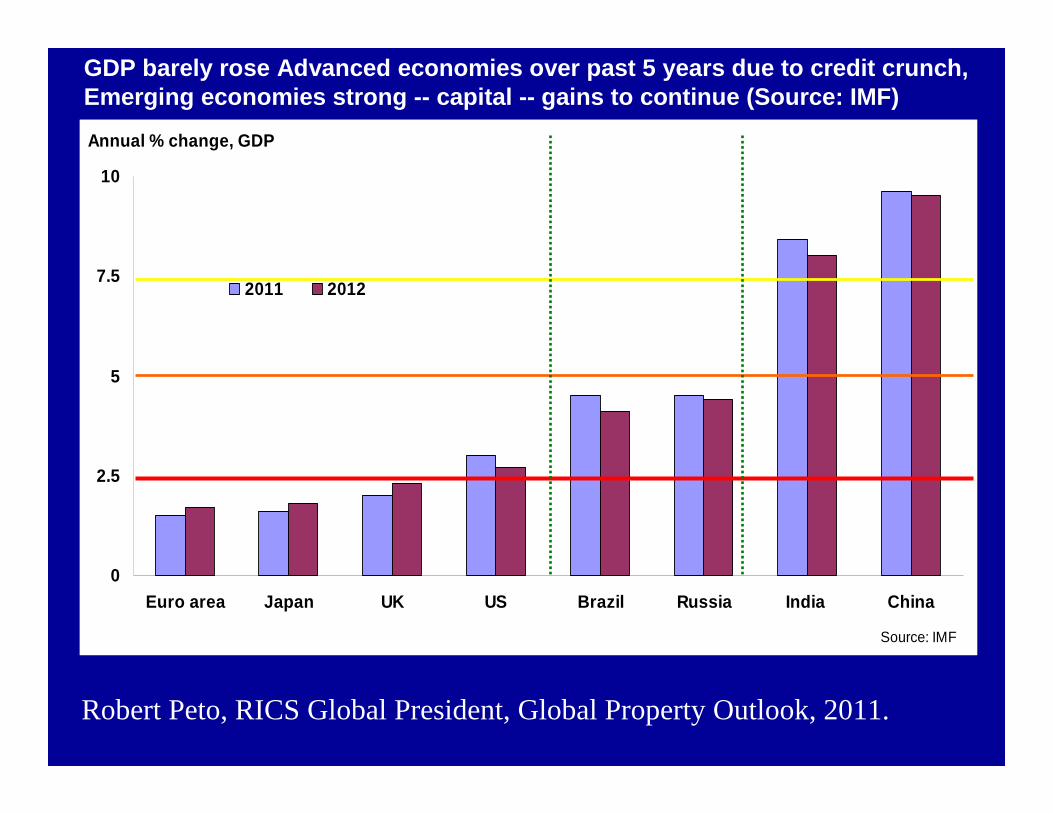
GDP barely rose Advanced economies over past 5 year s due to credit crunch, Emerging economies strong -- capital -- gains to cont inue (Source: IMF)
0
2.5
5
7.5
10
Euro area Japan UK US Brazil Russia India China
2011 2012
Source: IMF
Annual % change, GDP
Robert Peto, RICS Global President, Global Property Outlook, 2011.

The trend in Europe is improving in most countries
-100
-80
-60
-40
-20
0
20
40
60
80
100
2008 2009 2010
RussiaUKEmerging EuropeFranceGermany
Net balance %
Source: RICS Global Commercial Property Survey
Capital value expectations Capital Values are
rising
Capital Values are
falling
Robert Peto, RICS Global President, Global Property Outlook, 2011.
Source: DTZ Research
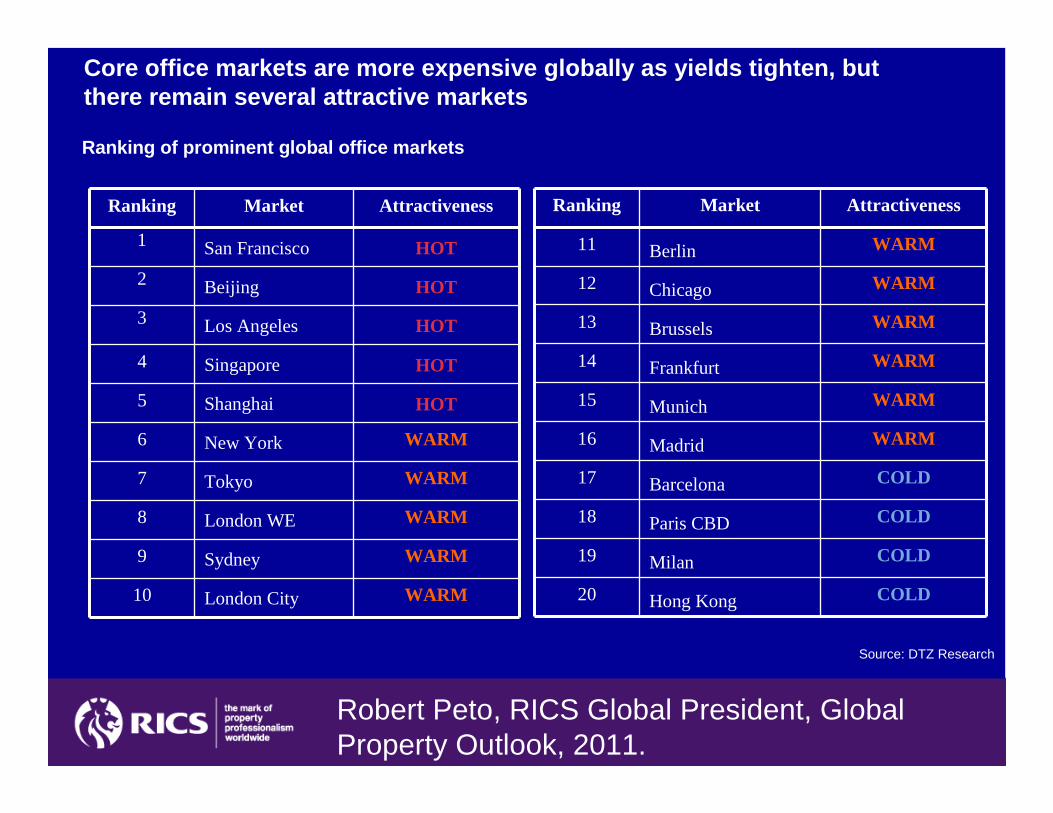
Core office markets are more expensive globally as yields tighten, but there remain several attractive markets
Ranking of prominent global office markets
Ranking Market Attractiveness
1 San Francisco HOT
2 Beijing HOT
3 Los Angeles HOT
4 Singapore HOT
5 Shanghai HOT
6 New York WARM
7 Tokyo WARM
8 London WE WARM
9 Sydney WARM
10 London City WARM
Ranking Market Attractiveness
11 Berlin WARM
12 Chicago WARM
13 Brussels WARM
14 Frankfurt WARM
15 Munich WARM
16 Madrid WARM
17 Barcelona COLD
18 Paris CBD COLD
19 Milan COLD
20 Hong Kong COLD
Robert Peto, RICS Global President, Global Property Outlook, 2011.

ConclusionsConclusions
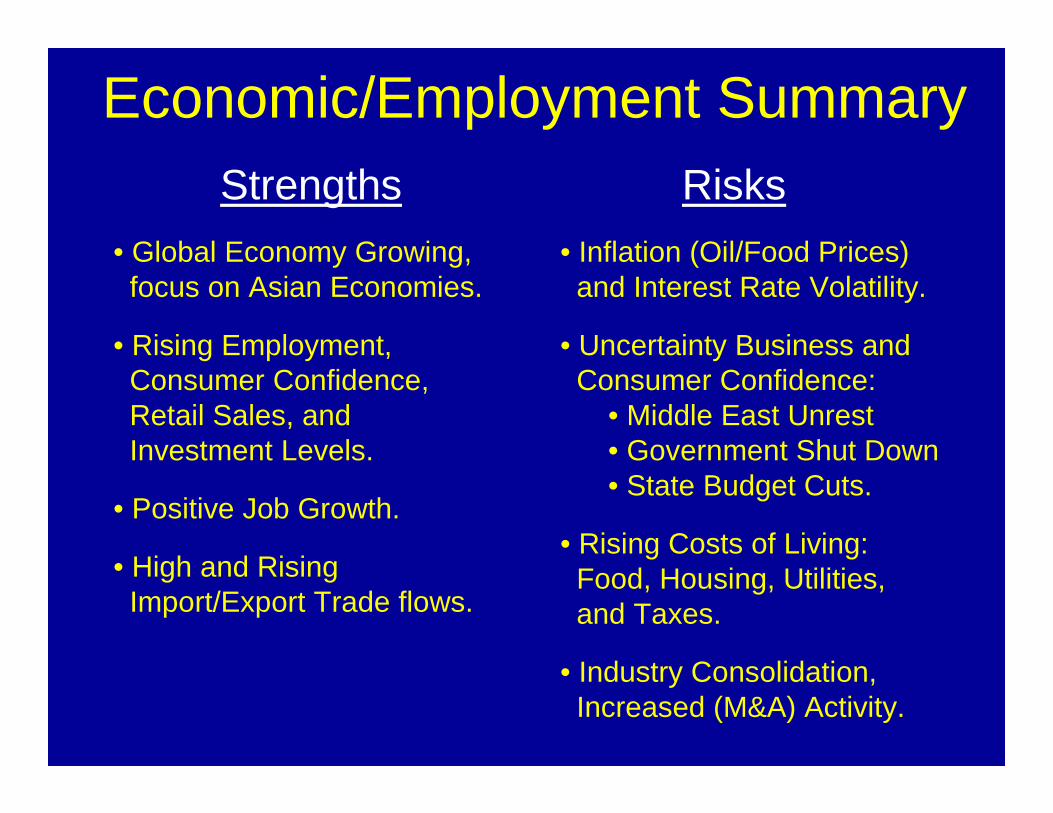
Economic/Employment SummaryStrengths Risks
• Global Economy Growing, focus on Asian Economies.
• Rising Employment, Consumer Confidence, Retail Sales, and Investment Levels.
• Positive Job Growth.
• High and Rising Import/Export Trade flows.
• Inflation (Oil/Food Prices) and Interest Rate Volatility.
• Uncertainty Business and Consumer Confidence:
• Middle East Unrest• Government Shut Down• State Budget Cuts.
• Rising Costs of Living: Food, Housing, Utilities, and Taxes.
• Industry Consolidation, Increased (M&A) Activity.
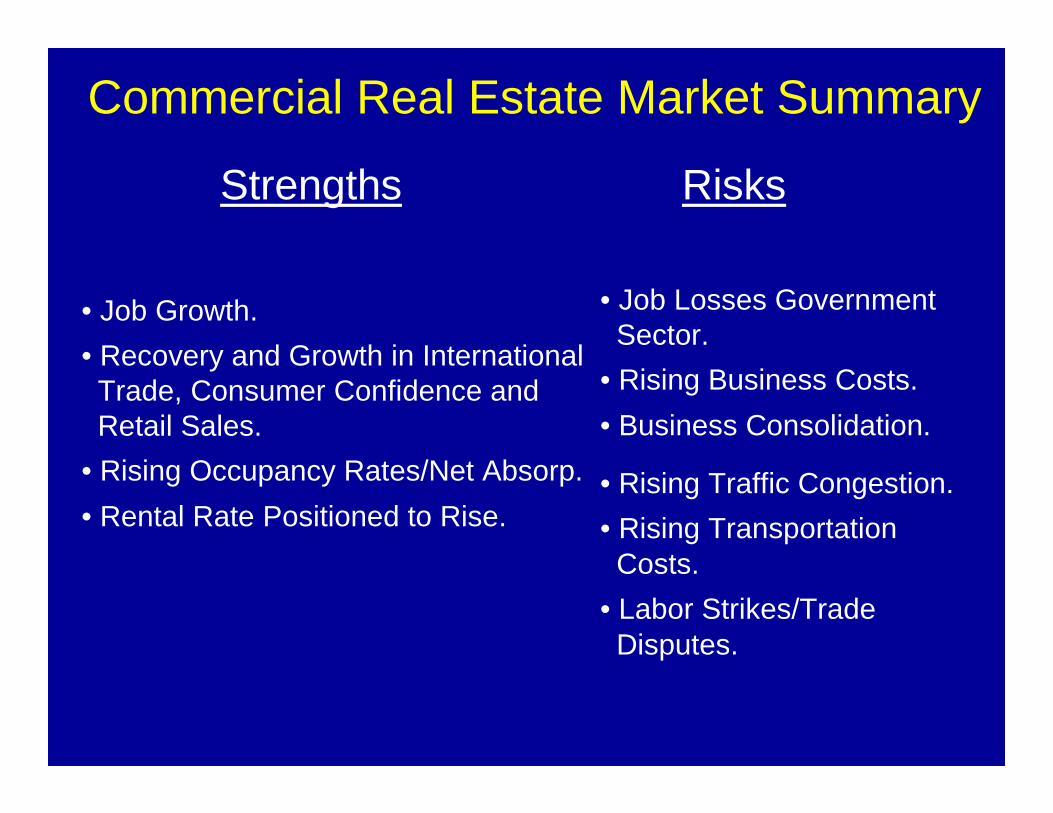
Commercial Real Estate Market Summary
Strengths Risks
• Job Growth.
• Recovery and Growth in International Trade, Consumer Confidence and Retail Sales.
• Rising Occupancy Rates/Net Absorp.
• Rental Rate Positioned to Rise.
• Job Losses Government Sector.
• Rising Business Costs.
• Business Consolidation.
• Rising Traffic Congestion.
• Rising Transportation Costs.
• Labor Strikes/Trade Disputes.

Thank YouThank You

Questions/AnswersQuestions/Answers

AppendixAppendix

Interest (Discount) Rates
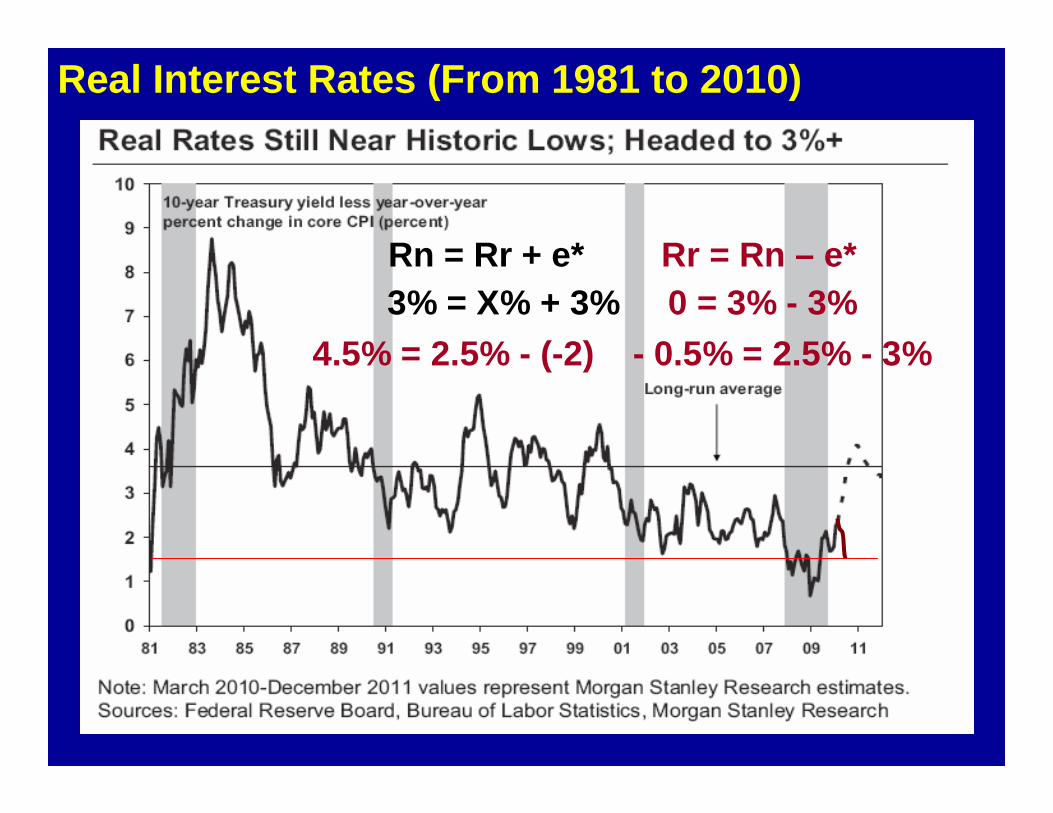
Real Interest Rates (From 1981 to 2010)
-75%~85%
Rn = Rr + e* Rr = Rn – e*3% = X% + 3% 0 = 3% - 3%
4.5% = 2.5% - (-2) - 0.5% = 2.5% - 3%

Inflation ExpectationsInflation ExpectationsU.S. Producer and Consumer Price Index (PPI/CPI)
Source: Bureau of Labor Statistics.http://www.bls.gov/home.htm
Sept Year-Over-Year Change: 5.5% (1950), 0.0% (1960), 3.4% (1970), 13.3% (1980), 5.9% (1990), 3.3% (2000), 8.9% (2008), -
4.8% (2009), 4.0% (9/10)
-6.6%3.5% (1950), 1.4% (1960), 5.6% (1970), 12.8% (1980), 6.2% (1990), 3.5% (2000), 5.0% (2008), -1.3% (2009), 1.1% (9/10)
-1.5%
9.7%
5.5%
Since 1990 , prices up 42% food, 87% healthcare, 88% housing, 70% alcohol, 67% entertainment, 20% tobacco.
http://www.federalreserve.gov/Releases/G17/Current/default.htm
4.0%
1.1%
Sept 10’ YOY% : Energy/Gas 5.8%, Fuel Oil 11.8%, Food 1.4%.
Sept 10’ YOY%: Fin. Goods 4.0%, Intermed Gds 5.6%, Crude Gds 20.3 %.
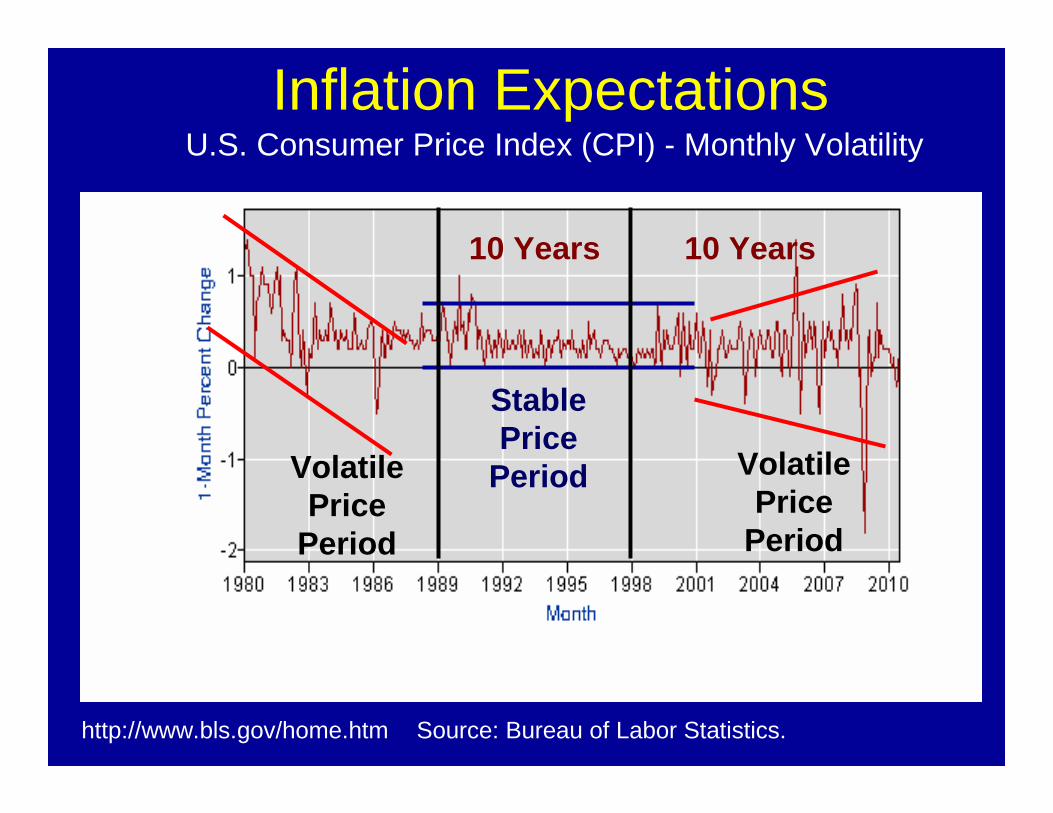
Inflation ExpectationsU.S. Consumer Price Index (CPI) - Monthly Volatility
Source: Bureau of Labor Statistics.http://www.bls.gov/home.htm
Jan YOY%: Gas 12% and Energy 5%.
Volatile Price
Period
Volatile Price
Period
Stable Price
Period
10 Years 10 Years
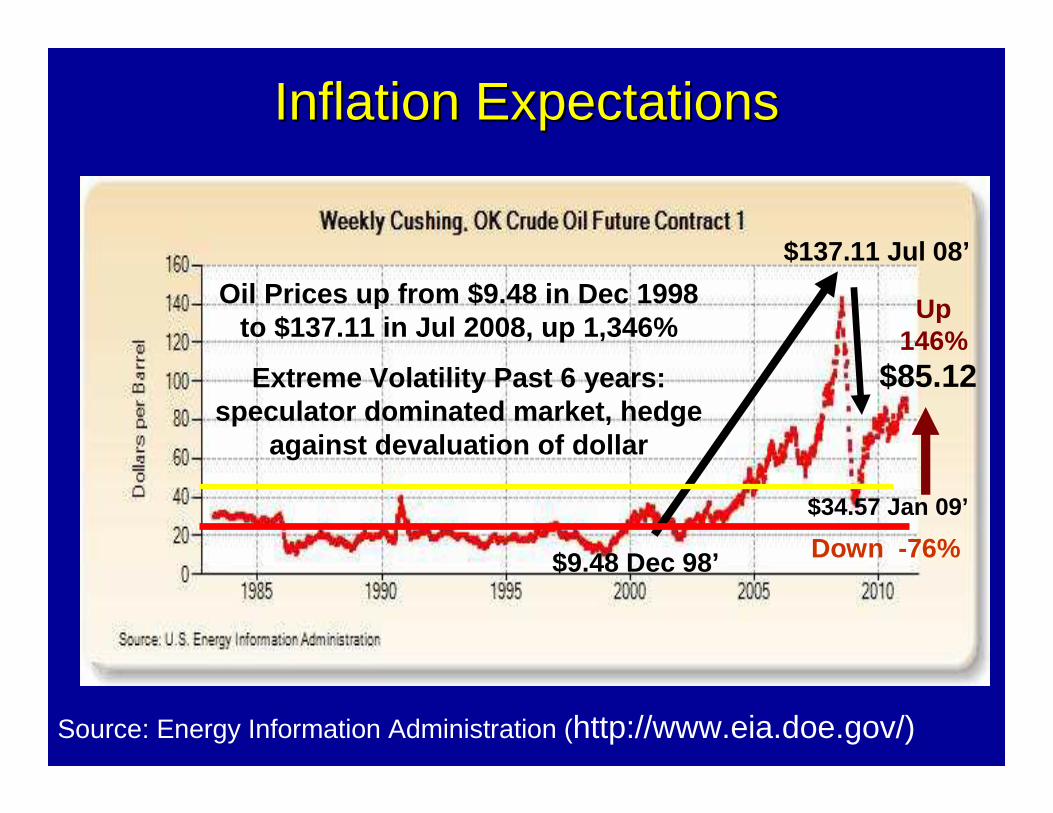
Inflation ExpectationsInflation Expectations
Down -76%
Oil Prices up from $9.48 in Dec 1998 to $137.11 in Jul 2008, up 1,346%
Extreme Volatility Past 6 years: speculator dominated market, hedge
against devaluation of dollar
Source: Energy Information Administration (http://www.eia.doe.gov/)
$137.11 Jul 08’
$34.57 Jan 09’
$85.12
$9.48 Dec 98’
Up 146%
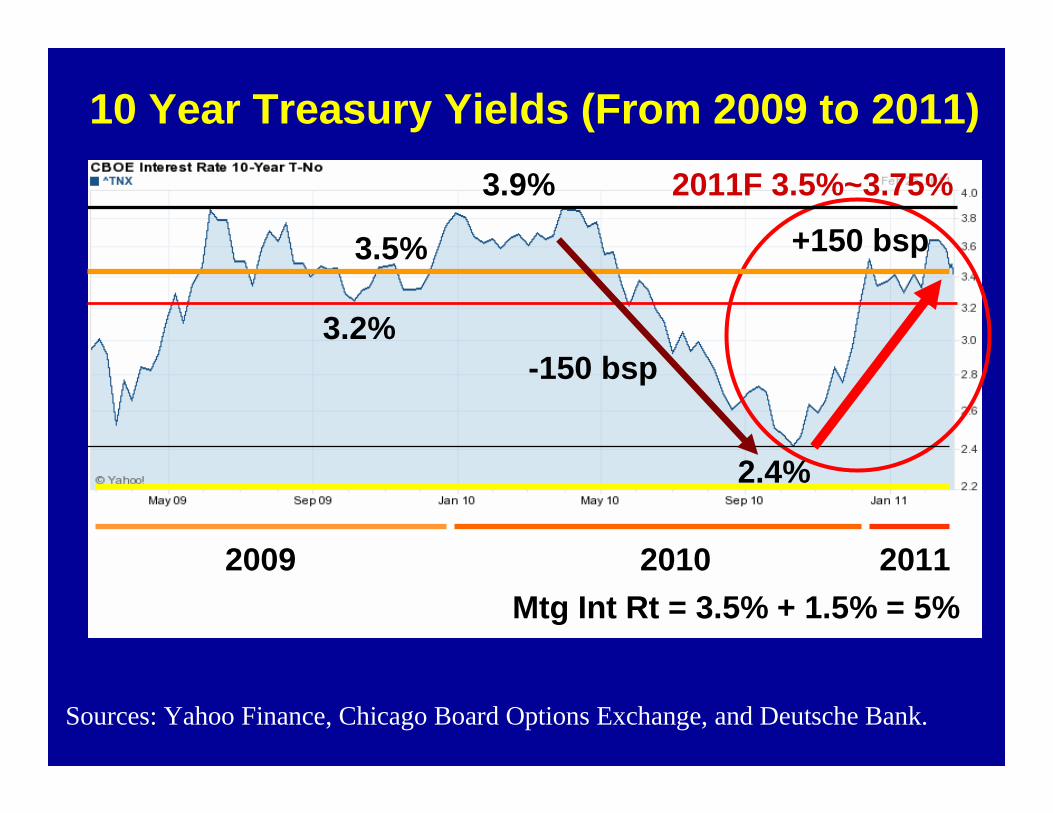
10 Year Treasury Yields (From 2009 to 2011)
+150 bsp
2011F 3.5%~3.75%
Sources: Yahoo Finance, Chicago Board Options Exchange, and Deutsche Bank.
Mtg Int Rt = 3.5% + 1.5% = 5%
-150 bsp
3.9%
2.4%
2010
3.5%
20112009
3.2%
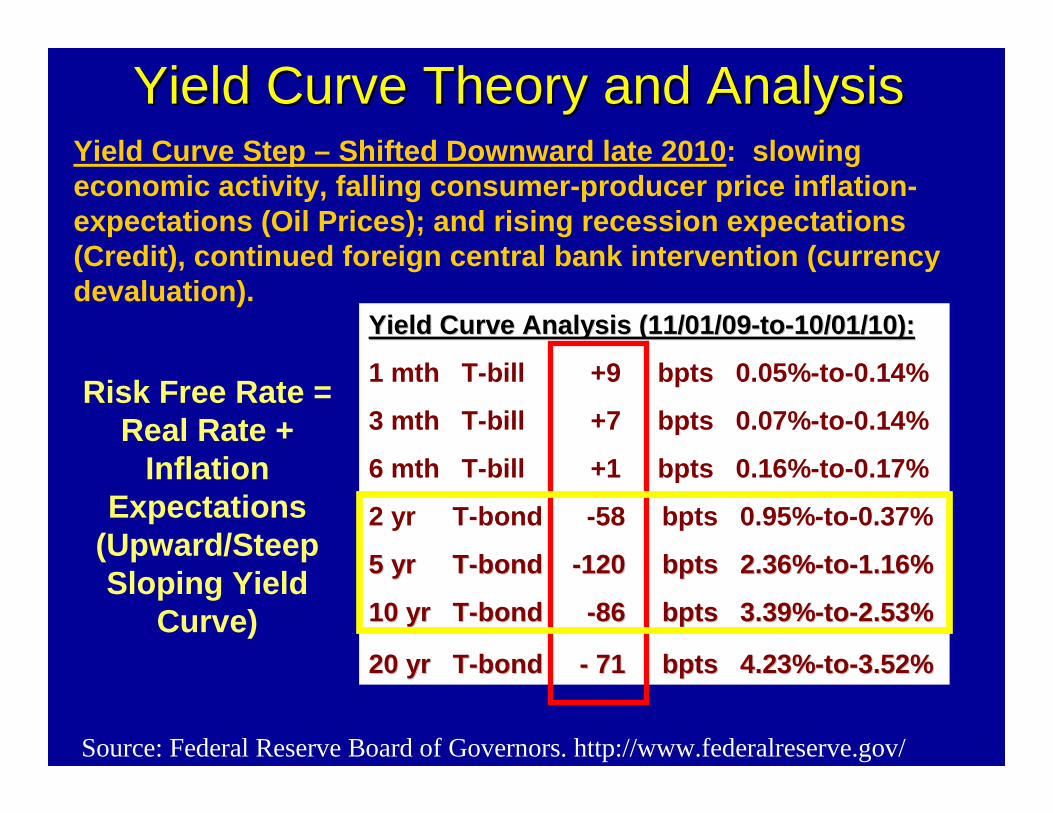
Yield Curve Theory and AnalysisYield Curve Theory and AnalysisYield Curve Step – Shifted Downward late 2010 : slowing economic activity, falling consumer-producer price inflation-expectations (Oil Prices); and rising recession exp ectations (Credit), continued foreign central bank interventi on (currency devaluation).
Yield Curve Analysis (11/01/09Yield Curve Analysis (11/01/09 --toto --10/01/10):10/01/10):
1 mth T-bill +9 bpts 0.05% -to-0.14%
3 mth T-bill +7 bpts 0.07% -to-0.14%
6 mth T-bill +1 bpts 0.16% -to-0.17%
2 yr T-bond -58 bpts 0.95% -to-0.37%
5 yr T5 yr T --bond bond --120 120 bptsbpts 2.36%2.36%--toto --1.16%1.16%
10 yr T10 yr T --bond bond --86 86 bptsbpts 3.39%3.39%--toto --2.53%2.53%
20 yr T20 yr T --bond bond -- 71 71 bptsbpts 4.23%4.23%--toto --3.52%3.52%
Risk Free Rate = Real Rate +
Inflation Expectations
(Upward/Steep Sloping Yield
Curve)
Source: Federal Reserve Board of Governors. http://www.federalreserve.gov/

Yield 10Yield 10--Year TreasuryYear Treasury
Source: Federal Reserve Board of Governors. http://www.federalreserve.gov/
10-Year Treasury Yield down from high of 15.8% in J uly 1981. Since 2006-2007, down from high of 5.2% to 2.1% Dec 2008. Up to 4.0% in 09’, 2.4% in Oct 10’, to 3.5% in Mar 11’.
• High inflation expectations (rising economic growth )• Geo-political default/oil risk (Greece, Spain, Port ugal)• Quantitative Easing/Accommodative Monetary Policy• Flight to Safety (1,000 point drop in Dow Jones May 6th)
10-Year Treasury Yields are the lowest since 1961 a t 3.7%, and forthe same time period are:
• -320 bsp 5.7% (2000)• -620 bsp 8.7% (1990) • -910 bsp 11.6% (1980)• -480 bsp 7.3% (1970)- 582 bsp Avg.
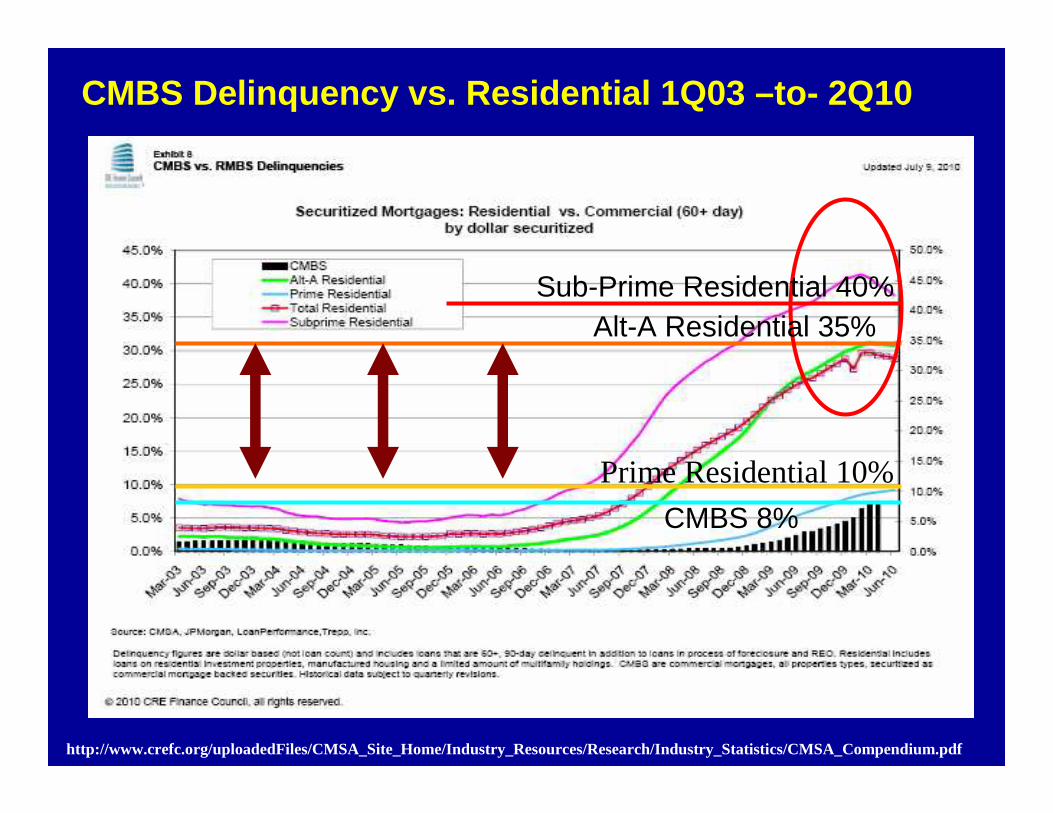
CMBS Delinquency vs. Residential 1Q03 –to- 2Q10
http://www.crefc.org/uploadedFiles/CMSA_Site_Home/Industry_Resources/Research/Industry_Statistics/CMSA_Compendium.pdf
Prime Residential 10%
Sub-Prime Residential 40%Alt-A Residential 35%
CMBS 8%

http://www.mbaa.org/files/Research/DataBooks/2Q10QuarterlyDataBook.pdf
BBB/BBB- +10,000
AA/A +4,000
Junior AAA +2,000
Super Senior AAA +320
Significant Widening of Spreads (Credit/Liquidity R isk)
Commercial Mortgage Backed Securities (CMBS) - Spreads Over SWAP Rates -
Worthless
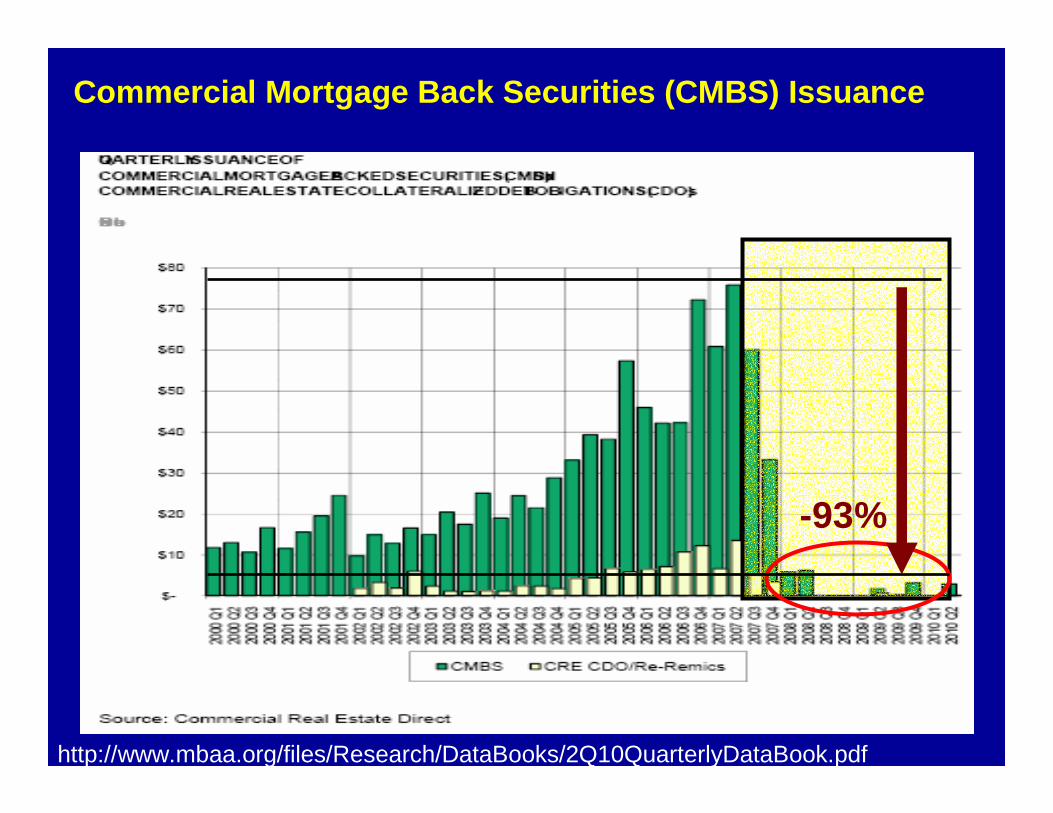
Commercial Mortgage Back Securities (CMBS) Issuance
http://www.mbaa.org/files/Research/DataBooks/2Q10QuarterlyDataBook.pdf
-93%
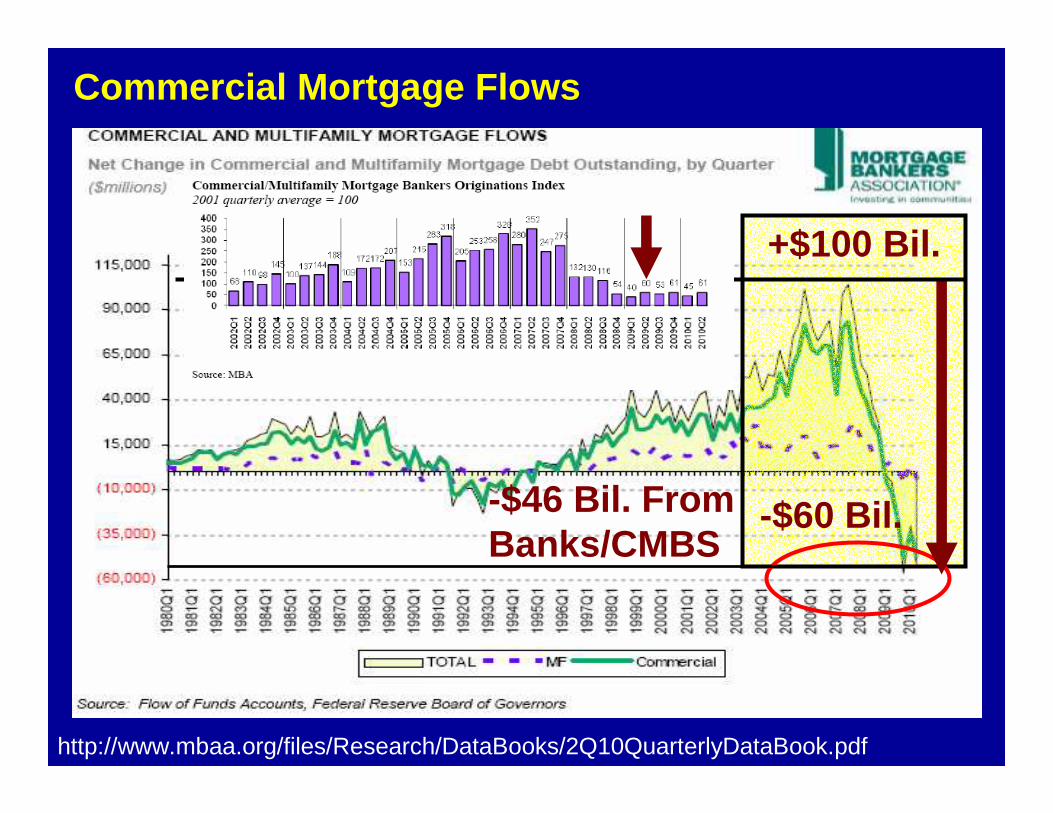
Commercial Mortgage Flows
http://www.mbaa.org/files/Research/DataBooks/2Q10QuarterlyDataBook.pdf
-$60 Bil.
+$100 Bil.
-$46 Bil. From Banks/CMBS
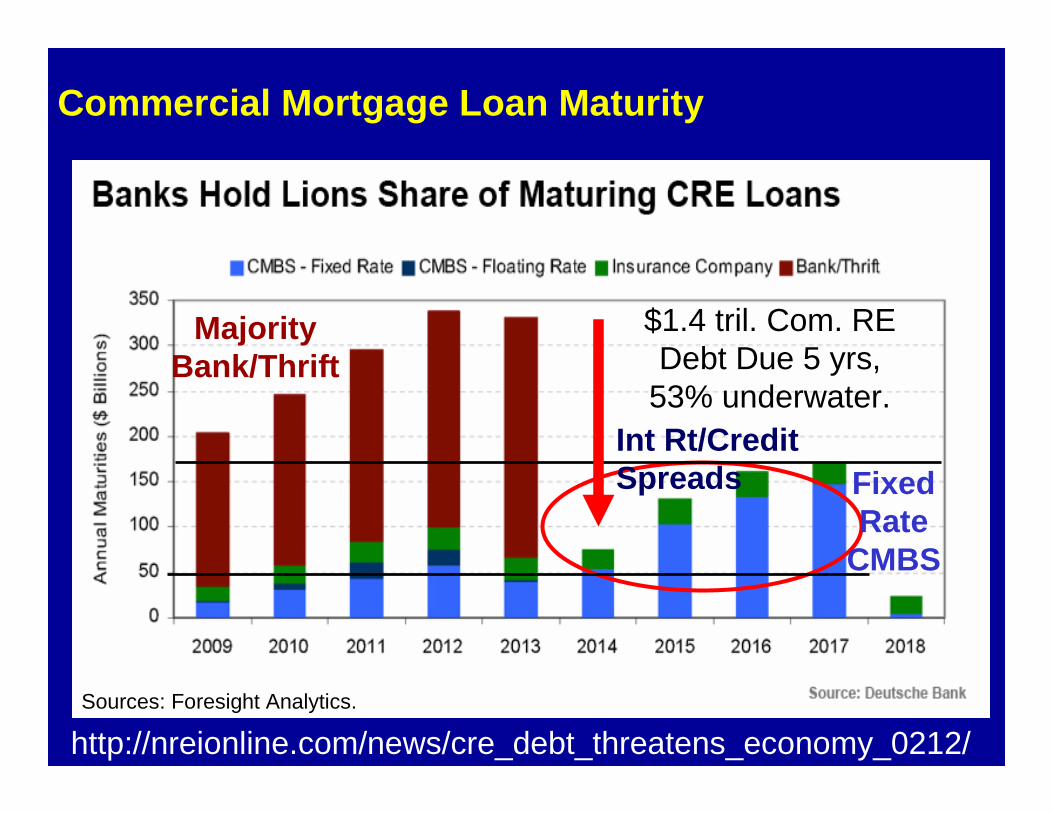
Commercial Mortgage Loan Maturity
http://nreionline.com/news/cre_debt_threatens_economy_0212/Sources: Foresight Analytics.
$1.4 tril. Com. RE Debt Due 5 yrs,
53% underwater.
Majority Bank/Thrift
Fixed Rate
CMBS
Int Rt/Credit Spreads
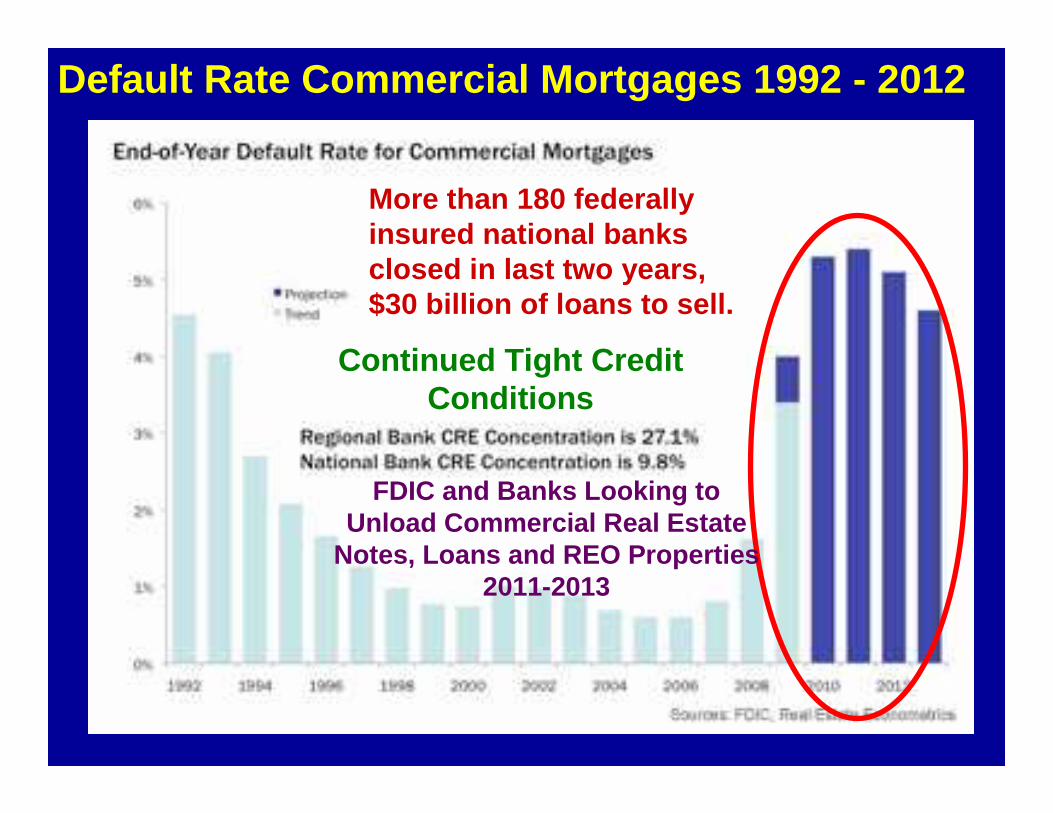
Default Rate Commercial Mortgages 1992 - 2012
-75%~85%
More than 180 federally insured national banks closed in last two years, $30 billion of loans to sell.
Continued Tight Credit Conditions
FDIC and Banks Looking to Unload Commercial Real Estate
Notes, Loans and REO Properties 2011-2013

CMBS Spreads vs. 10 Yr. Treasury YieldsImputed Discount Rate – Band of Investments
http://www.crefc.org/uploadedFiles/CMSA_Site_Home/Industry_Resources/Research/Industry_Statistics/CMSA_Compendium.pdf
Spreads Over 10 Year T-Bills (6/01/10)AAA + 250 bps (2.5%), 1400 bsp peakAA + 2,500 (25.0%), 4000 bsp peakA + 3,250 (33.0%), 5000 bsp peak
BAA2/BBB + 5,500 (55.0%)
IRR* = WACC* = 15% -to - 25%
[25% -to- 35% Imputed Debt Cost of Capital] * 50% + [5% -to- 15% Imputed Equity Cost of Capital] * 50%
Compression in Spreads from Peak

Educational, Training, Certification and Networking

• Randall Lane , The Zeros: My Misadventure in the Decade Wall Street Went Insane .
• David Brooks , Bobos in Paradise : The New Upper Class And How They Got There.
• Dambisa Moyo, How the West Was Lost : Fifty Years of Economic Folly, and the Stark Choices Ahead.
• Andrew Napolitano, A Nation of Sheep .• Robert Reich, Aftershock : The Next Economy and America’s Future.
Robert Scheer, The Great American Stickup : How Reagan Republicans and Clinton Democrats Enriched Wall Street and Mugged Main Street.
• Joseph E. Stiglitz, Freefall : America, Free Markets and the Sinking of the World Economy.
• Suzanne McGee, Chasing Goldman Sachs : How they Melted.• Michael Lewis, The Big Short : Inside the Doomsday Machine.• Simon Johnson, 13 Bankers : The Wall Street Takeover and Next
Financial Meltdown.• Andrew Ross Sorkin, Too Big To Fail .• Frank Portnoy, FIASCO : Blood in the Water on Wall Street.• Liaquat Ahamed, Lords of Finance .• Steve Fraser, Wall Street : Americas Dream Palace.
Recommended ReadingsRecommended Readings
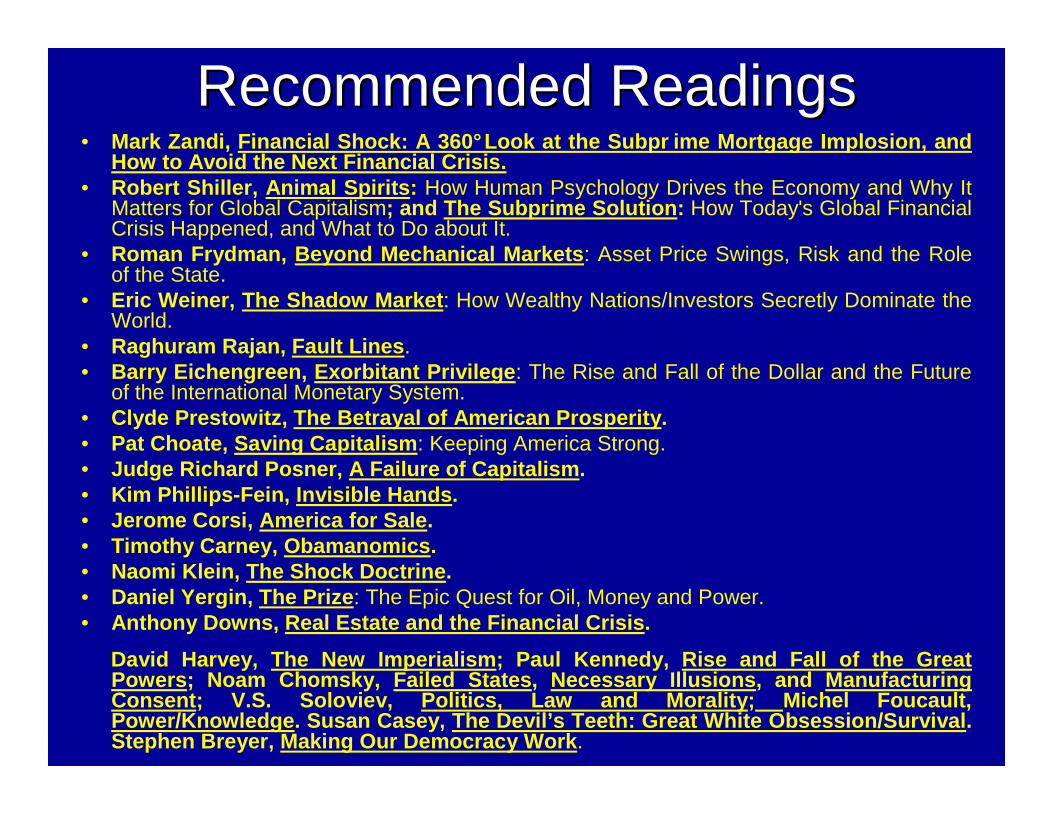
• Mark Zandi, Financial Shock: A 360°Look at the Subpr ime Mortgage Implosion, and How to Avoid the Next Financial Crisis.
• Robert Shiller, Animal Spirits : How Human Psychology Drives the Economy and Why It Matters for Global Capitalism; and The Subprime Solution : How Today's Global Financial Crisis Happened, and What to Do about It.
• Roman Frydman, Beyond Mechanical Markets : Asset Price Swings, Risk and the Role of the State.
• Eric Weiner, The Shadow Market : How Wealthy Nations/Investors Secretly Dominate the World.
• Raghuram Rajan, Fault Lines .• Barry Eichengreen, Exorbitant Privilege : The Rise and Fall of the Dollar and the Future
of the International Monetary System.• Clyde Prestowitz, The Betrayal of American Prosperi ty. • Pat Choate, Saving Capitalism : Keeping America Strong.• Judge Richard Posner, A Failure of Capitalism .• Kim Phillips-Fein, Invisible Hands .• Jerome Corsi, America for Sale .• Timothy Carney, Obamanomics .• Naomi Klein, The Shock Doctrine .• Daniel Yergin, The Prize : The Epic Quest for Oil, Money and Power.• Anthony Downs, Real Estate and the Financial Crisis .
David Harvey, The New Imperialism ; Paul Kennedy, Rise and Fall of the Great Powers ; Noam Chomsky, Failed States , Necessary Illusions , and Manufacturing Consent ; V.S. Soloviev, Politics, Law and Morality ; Michel Foucault, Power/Knowledge . Susan Casey, The Devil’s Teeth: Great White Obses sion/Survival . Stephen Breyer, Making Our Democracy Work .
Recommended ReadingsRecommended Readings
Books - www.amazon.com - www.irei.com
• Real Estate Finance & Investments 12th Ed, William B. Brueggeman, Jeffrey D. Fisher, 2005.
• Commercial Real Estate Analysis and Investments (2nd Ed), David Geltner, Norman G. Miller, 2007.
• Income Property Valuation (2nd Ed), Jeffrey D. Fisher, Robert S. Martin, 2004.
Recommended ReadingsRecommended Readings
- Argus Valuation (Investment/Development) Softwarewww.argussoftware.com
- Loop Net http://www.loopnet.com/- CoStar/Comps http://www.comps.com/comps.asp- Real Capital Analytics (RCA) www.rcanalytics.com- FW Dodge http://www.fwdodge.com/- Marshall & Swift http://www.marshallswift.com/- MP/F Research/Yield Star (Apartment Data)
http://www.realpage.com/yieldstar/- REIS Research, Inc. http://www.reisreports.com/- CB Richard Ellis http://www.cbrichardellis.com/- Marcus & Millichap http://www.mmreibc.com/- SNL Financial http://www.snl.com
Online DataOnline Data
Certifications/Designations/Education- Counselors of Real Estate (CRE)
http://www.cre.org- Royal Institute of Chartered Surveyors (RICS)
http://www.rics.org- Appraisal Institute (AI) – MAI
http://www.appraisalinstitute.org- Certified Commercial Investment Member (CCIM)
http://www.ccim.com- Institute of Real Estate Management (IREM) – CPM
http://www.irem.org/- Urban Land Institute (ULI) – Development
http://www.uli.org/
OrganizationsOrganizations

Professional
- Building Owner Management Association (BOMA)http://www.boma.org
- Commercial Real Estate Women (CREW)http://www.crew.org/
- National Association of Industrial and Office Professionals (NAIOP)http://naiop.org/
- National Association of Realtors – Commercial Division http://www.realtor.org/commercial/
- Society of Industrial and Office Realtorshttp://www.sior.com/
OrganizationsOrganizations
Institutional
- National Association Real Estate Investment Management (NAREIM)http://www.nareim.org/
- National Council of Real Estate Investment Fiduciaries (NAREIF)http://www.ncreif.org/
- National Association of Real Estate Investment Trusts (NAREIT)http://www.nareit.com/
- Pension Real Estate Association (PREA)http://www.prea.org/
OrganizationsOrganizations