institutional effectiveness through strategic analyticscollege, needed to collect performance data,...
TRANSCRIPT

Institutional Effectiveness
Through Strategic Analytics
Tim Beckett, Higher Education
Solutions Manager
John Sulka, Higher Education Solutions
Architect
TAIR - Tuesday, February 12, 2013
Session E7, Ivy 2, 2:15 to 3:05 PM
Through Strategic Analytics
1

What We Want to Share With You
� Information delivery challenges we’ve observed
in higher education
� Information Builders’ customer examples of
solutions to those challenges
2
solutions to those challenges

Challenges Facing You Today
�Our political environment demands results as a
precursor to public investment.
�Improving efficiency is demanded for today’s fiscal
realities.
�The need for quality is ever-present and involves a
clear focus on enrollment, retention, and student clear focus on enrollment, retention, and student
outcomes.
3

Accountability – A Culture of Evidence
�The ability to share best practices and leverage
successes from other higher education
institutions can truly address many of your
challenges.
�Transparency and accountability –
� Longitudinal performance to board, state,
and publicand public
�Empowering end user access to data for
decision-making in real-time is critical to
achieving efficiency and effectiveness of the
organization
Bill Gates in Wall Street Journal, 1-25-2013
�My Plan to Fix the World’s Biggest Problems
“From the fight against polio to fixing education,
what's missing is often good measurement and
a commitment to follow the data. We can do a commitment to follow the data. We can do
better. We have the tools at hand.”
5

Bottom Line
� Your core mission, new requirements from
government place greater demands on your
institution than ever before
� Both public and private institutions are
being encouraged to reconsider their
missionsmissions
� Strategies for improvement need to come
from higher education community

Impact on Staff
� Academic program coordinator shared:� She does academic advising, working one-on-one with
students, & working with student schedules. � To find most likely candidates for the Engineering
Honors program, she would pull transcripts, checking qualifications for scholarships – took 2 weeks of effort
� An institutional research department of 5 people spends a full month each year to create its fact book -- labor that must be re-started annually.� Manually, Excel-based, error-prone
must be re-started annually.� Manually, Excel-based, error-prone
� The provost of Princeton University testified � Renewing accreditation ran over $1 million, hundreds
of hours of staff time.
� Large community college wanted greater accountability, and an information interface suitable for the board � Were planning to invest 3 years into creating a data
warehouse… � And then begin building the dashboard
7

Addressing the Problem
�Use of academic dashboards allow the board to make
the best use of their funds through strategic, data-
driven decisions.
�Use of self-service analytics to functional units and
the public increases efficiency, reduces dependence
on ITon IT
8

Why Us?
Information Builders is the only solution provider that brings it all together. With intelligence, integration, and integrity offerings to help higher educational institutions by:
�Helping You Show Accountability Toward Your Strategic Goals with boardroom-quality dashboards & a comprehensive performance management framework.
�Providing Reporting & Advanced Analytics, that help empower Smarter Decision-Making across all levels & functions.
9
�Providing Reporting & Advanced Analytics, that help empower Smarter Decision-Making across all levels & functions.

Why Us?
� Providing a scalable architecture for deploying wide-scale, Public-Facing Institutional Intelligence applications, such as interactive fact books.
� Solutions for unifying data from diverse sources, with data integrity, to achieve a 360-degree View of Students, teachers, and schools
10
Examples of Customers We’re Helping
11

Provide Institutional Accountability
Houston Community College, an Achieving the Dream Leader
College, needed to collect performance data, analyze it, and
present it in a way that encourages fact-based decision-
making.
Strategy: Give administrators, staff, and the board power to
drill down into the data through graphical dashboards.
Result: The new system helps the college document and Result: The new system helps the college document and
evaluate decisions, measure enrollment, track student
outcomes. It also eases communication, helping the college
to make tough budgetary decisions based on broadly accepted
performance indicators.
Copyright 2007, Information Builders. Slide 12

Let’s go to HCC’s Academic Dashboard now!

On the Intranet

Supporting Instruction

Faculty Ratio

Faculty Ratio

Average class size

Average class size

More Information in One Location
Stephen F. Austin State University wanted to use a dashboard instead of the old Fact Book format. • Users can locate all the elements of data that were available in
the traditional Fact Book with more functionality
• More semesters of data are available for analysis in one location
• Parameters allow the user to focus on a specific area of interest
if desired. if desired.

Let’s go to SFA’s Dashboard now!
21

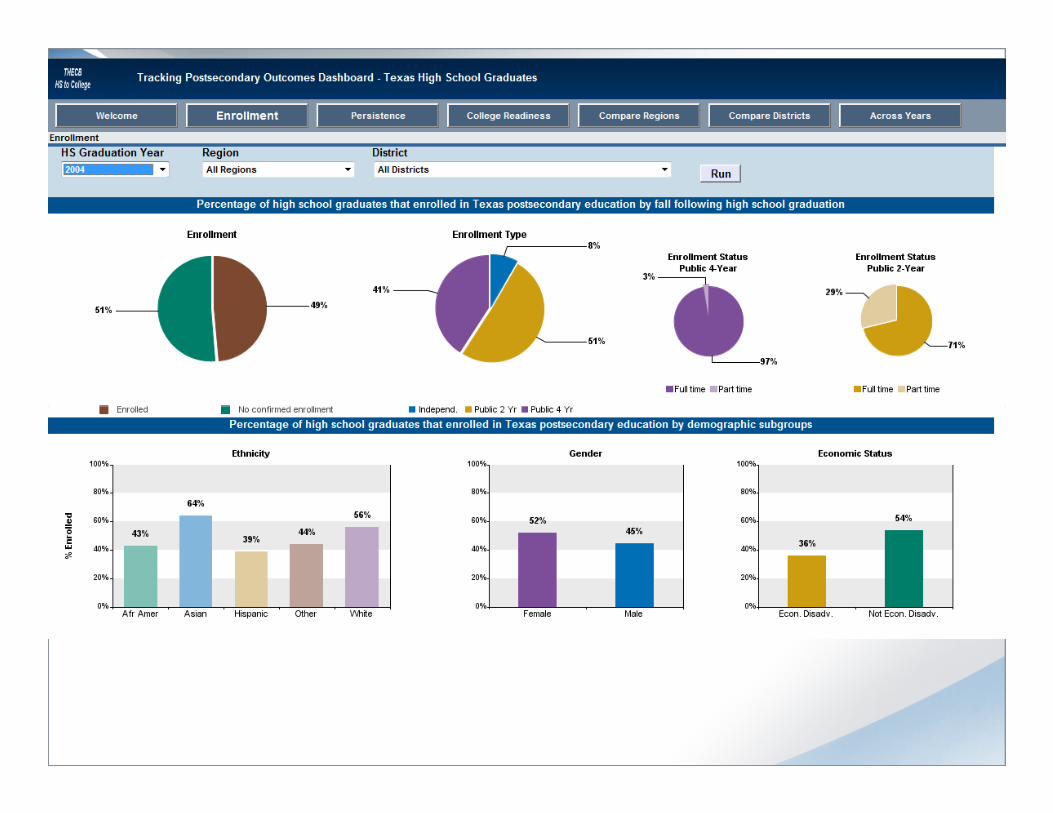
Closing Reporting Gaps
� Texas Higher Education Coordinating Board needed to
� Increase operational efficiency
� Improve the monitoring of key metrics and milestones
� Enhance communication with the public
� Result: By eliminating cumbersome manual reporting
processes and printed reports, and making information
instantly available to users inside and outside the agencyinstantly available to users inside and outside the agency
� THECB has the insight it needs to meet its goals as well as
to increase visibility and accountability.
22

Regional and District Accountability
23

12 Step Program
1. Envision a future
2. Get support from the top
3. Set priorities
4. Have a plan
5. Hire great people
8. Accept help where
needed
9. Keep on task
10. Monitor progress
11. Celebrate successes
along the way5. Hire great people
6. Develop partnerships
7. Use the right tools
along the way
12. Decide what to do next

1. Envision a future
Decision support system is a way to model data
and make quality decisions based upon it.

Key Questions
• Who makes decisions
• What decisions are made
• What information is needed
• How is it organized• How is it organized
• When is it needed

2. Get support from the top
HCC’s 2008-11 Strategic
Plan
Goal 6—Accountability
and Strategic Decision-
makingmaking
Develop an institutional
dashboard to
document and
evaluate the results of
decisions.

SACS Compliance Audit
� General Information about HCC
�2.8 - Faculty
�3.3.1.1 - IE Instructional Programs�3.3.1.1 - IE Instructional Programs

3. Set priorities
Phased implementation
Phase 1: Academic Dashboard (2009-10)
Phase 2: Program Review (2010-11)
Phase 3: Integration with HCC Intranet (2011)Phase 3: Integration with HCC Intranet (2011)
Phase 4: 2012 Strategic Plan (2012)
Phase 5: QEP dashboard (2012-13)

4. Have a plan

Office Whiteboard
5. Hire great people
Trends & Drivers

6. Develop partnerships
External
� Information Builders
Internal
� Decisions makers
� Stakeholders
� IR staff
� IT� IT

7. Use the right tools
8. Accept help where needed
A word about consultants…..

…and training

9. Keep on task

10. Monitor progress

11. Celebrate successes along the way

Public Facing Websites
� Houston Community College - www.hccs.edu/hccs/at-a-glance/district-
offices/institutional-research/academic-dashboard/academic-dashboard
� Tarleton State University - http://www.tarleton.edu/institutionalresearch
� Click on “Texan Facts”
� Texas A&M University Commerce
� http://www.tamu-commerce.edu/approot/public/irfactbook/
� Texas Higher Education Coordinating Board
� http://www.txhighereddata.org/
41
� http://www.txhighereddata.org/
� Link to Tracking Postsecondary Outcomes Dashboard is on the right, 8th
entry under High School to College (p-16).
� Stephen F. Austin State University
� http://jackfacts.sfasu.edu/ibi_apps/bid/ac_mpv

longitudinal studies
comparative enrollment
Intuitive interface for functional usersIntuitive interface for functional users
graduation rates
applicants on a mapdonation trendstracking transfers
admissions
Information Builders
Information Management in Higher Education
advancementculture of evidence
alumni on a map
42
analysis of state
and IPEDS data
graduation rates
budget tracking
admissions
semester credit hours
financial aid
awards
data-driven decisions
Integration with Banner, Colleague, Peoplesoft, SAP, etc.
Integration with Banner, Colleague, Peoplesoft, SAP, etc.
faculty ratios
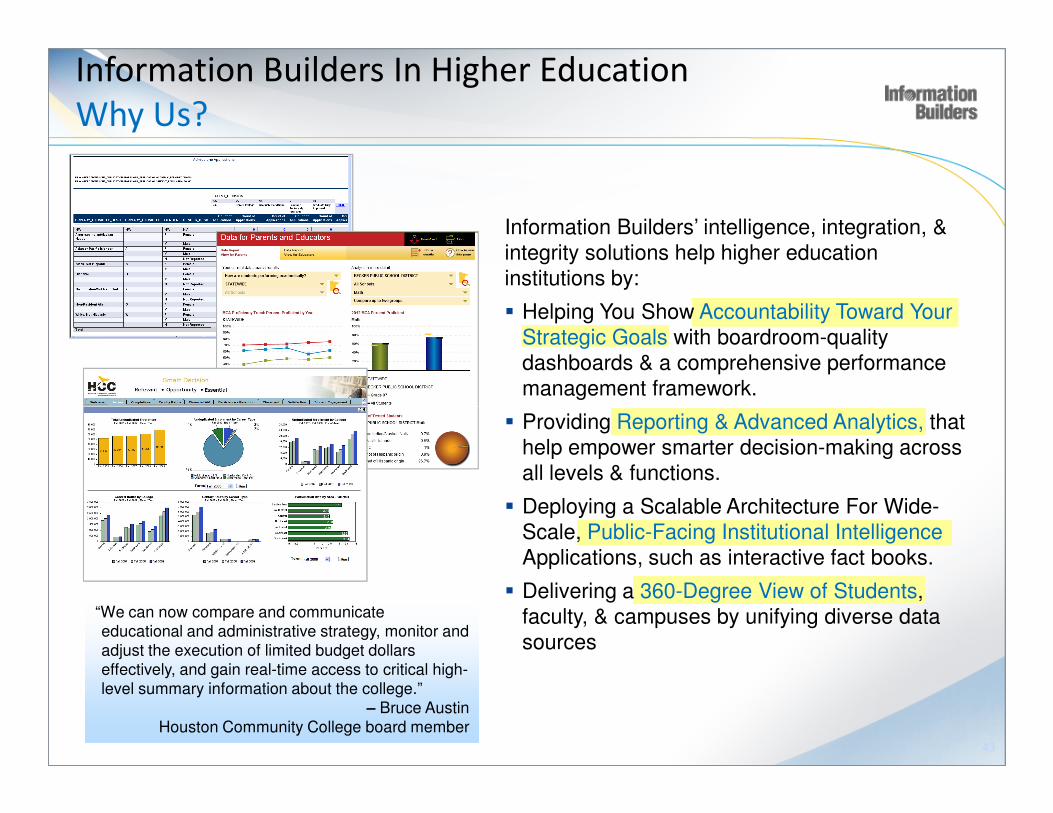
Information Builders In Higher Education
Why Us?
Information Builders’ intelligence, integration, &
integrity solutions help higher education
institutions by:
� Helping You Show Accountability Toward Your
Strategic Goals with boardroom-quality
dashboards & a comprehensive performance
management framework.
43
“We can now compare and communicate
educational and administrative strategy, monitor and
adjust the execution of limited budget dollars
effectively, and gain real-time access to critical high-
level summary information about the college.”
– Bruce Austin
Houston Community College board member
“We can now compare and communicate
educational and administrative strategy, monitor and
adjust the execution of limited budget dollars
effectively, and gain real-time access to critical high-
level summary information about the college.”
– Bruce Austin
Houston Community College board member
� Providing Reporting & Advanced Analytics, that
help empower smarter decision-making across
all levels & functions.
� Deploying a Scalable Architecture For Wide-
Scale, Public-Facing Institutional Intelligence
Applications, such as interactive fact books.
� Delivering a 360-Degree View of Students,
faculty, & campuses by unifying diverse data
sources

Questions
Copyright 2007, Information
Builders. Slide 44

Coming up on April 2
� Join us for Higher Education Virtual User Forum
� Taylor University
� “Student Success Insights From Predictive Analytics”
�Dr. Edwin Welch, Director of Institutional Research / Associate
Registrar
�Will present how predictive analytics is helping his Academic �Will present how predictive analytics is helping his Academic
Enrichment Center make better use of its resources.
�He was also featured in an article in Information Week on
January 28, “To Avoid Nasty Surprises, Higher Ed Turns to
Prediction”
45

Thank you!
Tim Beckett
Higher Education Solutions Manager
832-251-5702
See white paper, video interviews, press releases & success
stories at www.informationbuilders.com/highered