integral - ipart.nsw.gov.au · (. ernst and young | 7 the sres has the following attributes: Ø...
TRANSCRIPT
Market Assessment of Green Cost Allowances Cost Pass-through Application 2010/2011 – 2012/2013 January 2011
Contents
1. Executive summary ............................................................................................. 1
2. Introduction ........................................................................................................ 2
3. Introduction of SRES ........................................................................................... 5
4. Delay in introduction of CPRS ............................................................................ 13
5. Summary .......................................................................................................... 24
© 2011 Ernst & Young Australia.
Liability limited by a scheme approved under Professional Standards Legislation.
Our report may be relied upon by Country Energy pursuant to the terms of our engagement letter dated 10 November 2010. We disclaim all responsibility to any other party for any loss or liability that the other party may suffer or incur arising from or relating to or in any way connected with the contents of our report, the provision of our report to the other party or the reliance upon our report by the other party.
Ernst and Young | 1
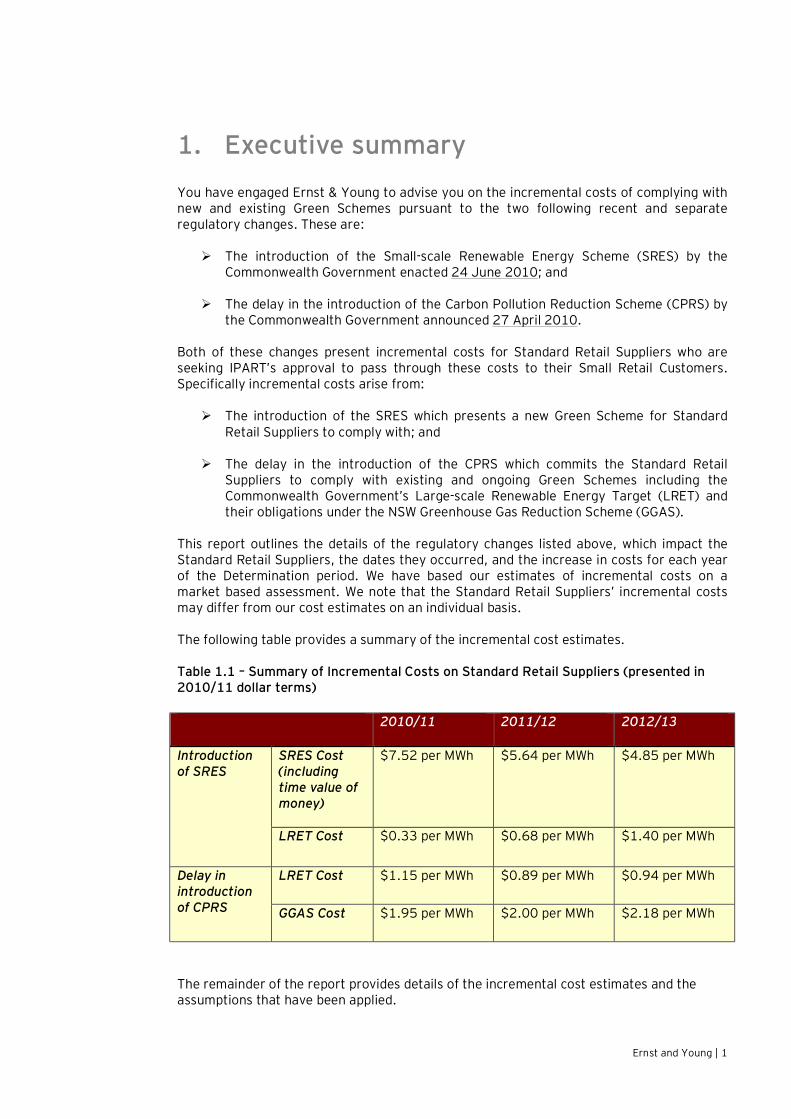
1. Executive summary You have engaged Ernst & Young to advise you on the incremental costs of complying with new and existing Green Schemes pursuant to the two following recent and separate regulatory changes. These are: Ø The introduction of the Small-scale Renewable Energy Scheme (SRES) by the
Commonwealth Government enacted 24 June 2010; and
Ø The delay in the introduction of the Carbon Pollution Reduction Scheme (CPRS) by the Commonwealth Government announced 27 April 2010.
Both of these changes present incremental costs for Standard Retail Suppliers who are seeking IPART’s approval to pass through these costs to their Small Retail Customers. Specifically incremental costs arise from:
Ø The introduction of the SRES which presents a new Green Scheme for Standard Retail Suppliers to comply with; and
Ø The delay in the introduction of the CPRS which commits the Standard Retail Suppliers to comply with existing and ongoing Green Schemes including the Commonwealth Government’s Large-scale Renewable Energy Target (LRET) and their obligations under the NSW Greenhouse Gas Reduction Scheme (GGAS).
This report outlines the details of the regulatory changes listed above, which impact the Standard Retail Suppliers, the dates they occurred, and the increase in costs for each year of the Determination period. We have based our estimates of incremental costs on a market based assessment. We note that the Standard Retail Suppliers’ incremental costs may differ from our cost estimates on an individual basis.
The following table provides a summary of the incremental cost estimates.
Table 1.1 – Summary of Incremental Costs on Standard Retail Suppliers (presented in 2010/11 dollar terms) 2010/11 2011/12 2012/13
Introduction of SRES
SRES Cost (including time value of money)
$7.52 per MWh $5.64 per MWh $4.85 per MWh
LRET Cost $0.33 per MWh $0.68 per MWh $1.40 per MWh
Delay in introduction of CPRS
LRET Cost $1.15 per MWh $0.89 per MWh $0.94 per MWh
GGAS Cost $1.95 per MWh $2.00 per MWh $2.18 per MWh
The remainder of the report provides details of the incremental cost estimates and the assumptions that have been applied.
Ernst and Young | 2
2. Introduction
2.1 Background The Independent Pricing and Regulatory Tribunal (IPART) released its ‘Review of regulated retail tariffs and charges for electricity 2010 – 2013’ Final Determination in March 2010. Standard Retail Suppliers are provided a Green Cost Allowance for the recovery of costs directly associated with purchasing electricity in the National Electricity Market (NEM). These costs involve complying with and meeting obligations under existing Green Schemes including:
Ø The Commonwealth Government’s expanded Renewable Energy Target (RET); and
Ø The NSW Greenhouse Gas Reduction Scheme (GGAS). You have engaged Ernst & Young to advise you on the incremental costs of complying with new and existing Green Schemes pursuant to two recent and separate regulatory changes. These are: Ø The introduction of the SRES by the Commonwealth Government; and
Ø The delay in the introduction of the CPRS by the Commonwealth Government.
In providing our advice and preparing this report we have reviewed the following documentation: Ø ‘Review of regulated retail tariffs and charges for electricity 2010 – 2013’,
Electricity – Final Determination from IPART, March 2010;
Ø ‘Review of regulated retail tariffs and charges for electricity 2010 – 2013’, Electricity – Final Report from IPART, March 2010;
Ø ‘Energy purchase costs’ – A Final Report Prepared for IPART by Frontier Economics, March 2010;
Ø ‘AGL Submission to the Essential Services Commission of SA’, 2010 Review of Retail Electricity Standing Contract Price Path, 19 October 2010;
Ø ‘LRET/SRES updates’ – Office of Renewable Energy Regulator (ORER) website at http://www.orer.gov.au/lret-sres-updates/index.html#liable;
Ø ‘Small-scale technology certificates data modelling for 2011 to 2013’, Green Energy Markets Report to ORER, November 2010;
Ø ‘Small-scale Technology Certificates Data Modelling – Projected take-up of small-scale renewable technologies over calendar years 2011 to 2013’, ACIL Tasman Report prepared for ORER, 15 November 2010;
Ø ‘Small-scale Technology Certificates Data Modelling for 2011 to 2013, SKM-MMA Final Report to ORER, 29 November 2010;
Ernst and Young | 3
Ø ‘Compliance and Operation of the NSW Greenhouse Gas Reduction Scheme during 2009’ – IPART Report to Minister, July 2010;
Ø ‘Annual Report 2009 – Increasing Australia’s renewable electricity generation’ – ORER report;
Ø ‘Fuel resource, new entry and generation costs in the NEM’ – ACIL Tasman 2009 Report Prepared for the Inter-Regional Planning Committee;
Ø ‘The calculation of energy costs in the BRCI for 2010-11’ – ACIL Tasman 2009 Report for the Queensland Competition Authority;
Ø ‘Greenhouse Gas Benchmark Rule (Compliance) No. 1 of 2003’;
Ø ‘AEMO – 2010 Electricity Statement of Opportunities’;
Ø ‘Electricity Supply Amendment (Greenhouse Gas Emission Reduction) Act 2002 No 12’; and
Ø ‘Fact Sheets and Compliance Spreadsheets (GGAS Scheme Website)’ at http://www.greenhousegas.nsw.gov.au/.
We have also informed the report with targeted industry stakeholder consultation to capture the commercial and practical aspects facing electricity retailing operations in the NEM.
2.2 Recent Regulatory Changes There are two recent and separate regulatory changes affecting Green Schemes that Standard Retail Suppliers must comply with. These are:
Ø The introduction of the SRES which presents a new Green Scheme for Standard Retail Suppliers to comply with; and
Ø The delay in the introduction of the CPRS which commits the Standard Retail Suppliers to comply with existing and ongoing Green Schemes including the Commonwealth Government’s LRET and their obligations under the NSW GGAS.
Both of these changes present incremental costs for Standard Retail Suppliers who are seeking IPART’s approval to pass through these costs to Small Retail Customers.
This report outlines the details of the regulatory changes, the dates they occurred, and the increase in costs they imply for each year of the Determination period.
2.3 Structure of this Report
Our report is structured as follows:

Ernst and Young | 4
Ø Section 3 addresses the SRES and the incremental costs of compliance for each year of the Determination period;
Ø Section 4 addresses the impact of the delay in the introduction of the CPRS, and the incremental costs of complying with the existing Commonwealth Government LRET and obligations under the ongoing NSW GGAS for each year of the Determination; and
Ø Section 5 provides a summary.
Ernst and Young | 5
3. Introduction of SRES
3.1 Background - Restoration of Investment Signals for Renewables
The proliferation of small scale renewable generation across the NEM States in the last 18 months is to a large extent a response to State and Commonwealth Government financial incentives for households to install small-scale generation units (SGUs), typically solar Photo-Voltaic (PV) units and solar hot water units. An increasing number of Renewable Energy Certificates (RECs) were registered as a consequence1. In addition, prevailing constraints on capital markets impacted the ability of installers to access working capital and RECs were used as collateral. This ultimately led to a sharp reduction of spot REC prices around mid to late 2009.
The unintended impact of these events had a dampening effect on forward investment signals for large-scale renewable projects (i.e. wind). The Commonwealth Government identified the need to restore these investment signals in order for it to reach the expanded RET by 2020. The impending policy response involved enhancements to the ‘Renewable Energy (Electricity) Bill 2010’. These were enacted into law on 24 June 2010.
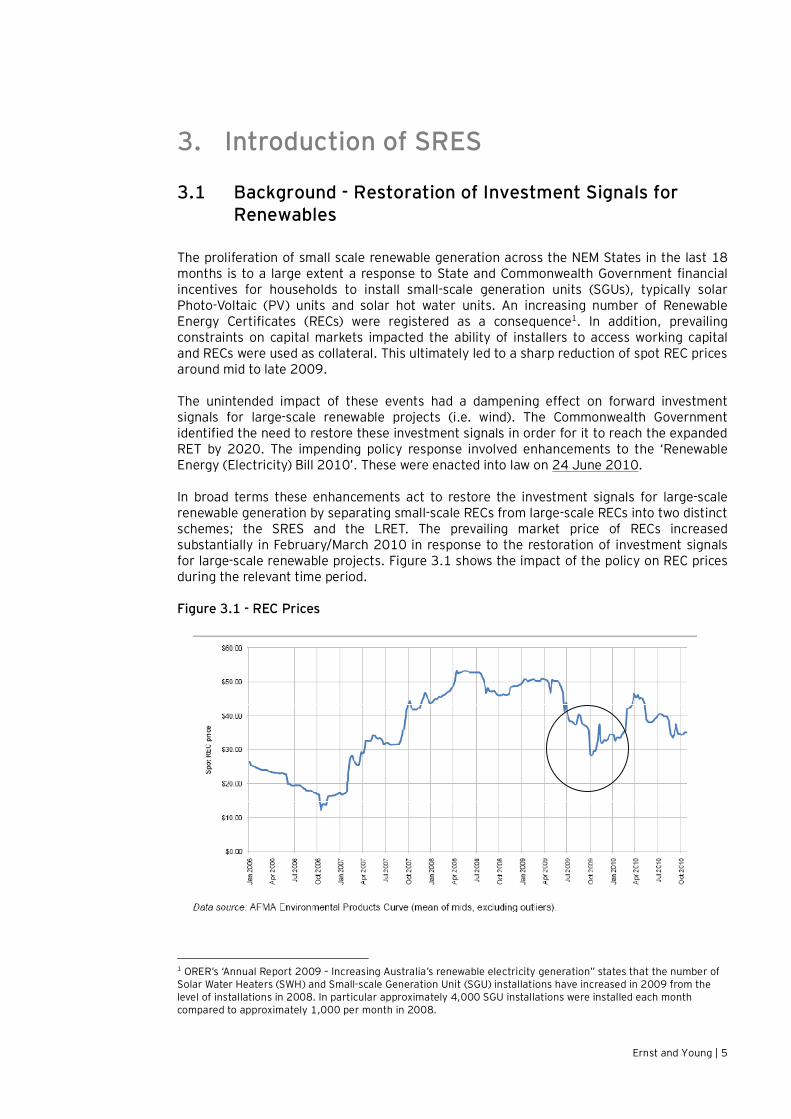
In broad terms these enhancements act to restore the investment signals for large-scale renewable generation by separating small-scale RECs from large-scale RECs into two distinct schemes; the SRES and the LRET. The prevailing market price of RECs increased substantially in February/March 2010 in response to the restoration of investment signals for large-scale renewable projects. Figure 3.1 shows the impact of the policy on REC prices during the relevant time period.
Figure 3.1 - REC Prices
1 ORER’s ‘Annual Report 2009 – Increasing Australia’s renewable electricity generation” states that the number of Solar Water Heaters (SWH) and Small-scale Generation Unit (SGU) installations have increased in 2009 from the level of installations in 2008. In particular approximately 4,000 SGU installations were installed each month compared to approximately 1,000 per month in 2008.
Ernst and Young | 6
The previous legislated expanded RET scheme encompassed both small-scale RECs from SGU’s and solar water heaters and large-scale RECs (e.g. from wind). The new legislation requires compliance under both the SRES and LRET schemes.
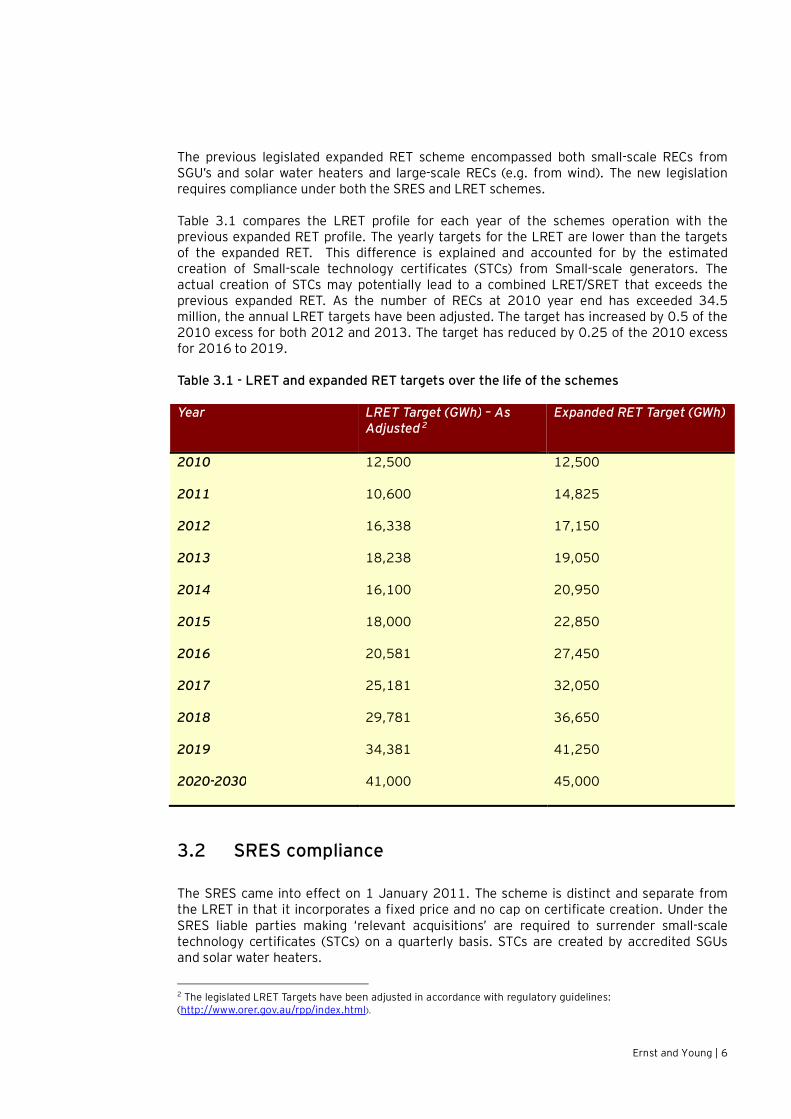
Table 3.1 compares the LRET profile for each year of the schemes operation with the previous expanded RET profile. The yearly targets for the LRET are lower than the targets of the expanded RET. This difference is explained and accounted for by the estimated creation of Small-scale technology certificates (STCs) from Small-scale generators. The actual creation of STCs may potentially lead to a combined LRET/SRET that exceeds the previous expanded RET. As the number of RECs at 2010 year end has exceeded 34.5 million, the annual LRET targets have been adjusted. The target has increased by 0.5 of the 2010 excess for both 2012 and 2013. The target has reduced by 0.25 of the 2010 excess for 2016 to 2019.
Table 3.1 - LRET and expanded RET targets over the life of the schemes
Year LRET Target (GWh) – As Adjusted 2
Expanded RET Target (GWh)
2010 12,500 12,500
2011 10,600 14,825
2012 16,338 17,150
2013 18,238 19,050
2014 16,100 20,950
2015 18,000 22,850
2016 20,581 27,450
2017 25,181 32,050
2018 29,781 36,650
2019 34,381 41,250
2020-2030 41,000 45,000
3.2 SRES compliance The SRES came into effect on 1 January 2011. The scheme is distinct and separate from the LRET in that it incorporates a fixed price and no cap on certificate creation. Under the SRES liable parties making ‘relevant acquisitions’ are required to surrender small-scale technology certificates (STCs) on a quarterly basis. STCs are created by accredited SGUs and solar water heaters.
2 The legislated LRET Targets have been adjusted in accordance with regulatory guidelines: (http://www.orer.gov.au/rpp/index.html).
Ernst and Young | 7
The SRES has the following attributes:
Ø Eligible installations under the SRES create STCs;
Ø There is a fixed price of $40 per STC which may be obtained from the STC clearing house at this fixed STC price or from registered creators of STCs;
Ø Liable parties are required to surrender an amount of STCs in accordance with the quarterly timetable published by the ORER; and
Ø The calculation required by ORER involves the Determination of a Small-scale Technology Percentage (STP) by 31 March each year (2011 figure was released by ORER on 1 December 2010). The STP is determined from:
o An estimate of the number of STCs to be created in the given year (forecasts for 2012 and 2013 have also been released);
o An estimate of electricity acquired under ‘relevant acquisitions’; and
o An estimate of ‘partial exemptions’ for customers operating in Emissions-Intensive Trade Exposed (EITE’s) industries.
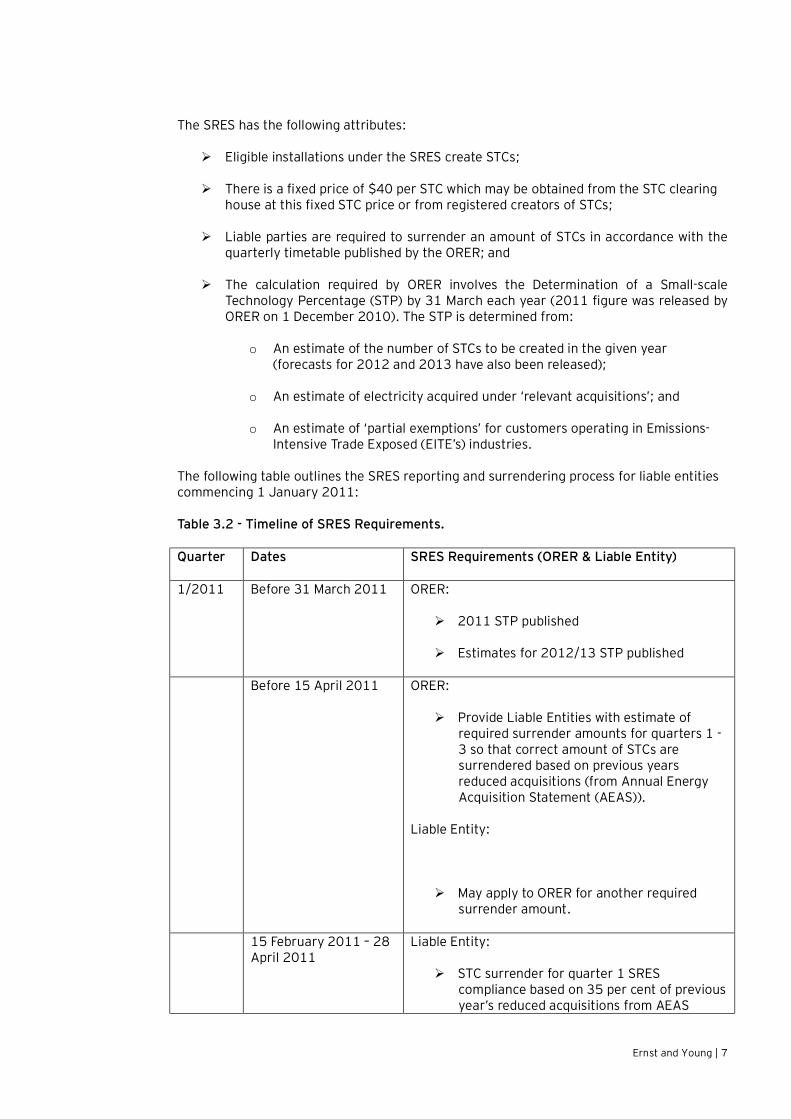
The following table outlines the SRES reporting and surrendering process for liable entities commencing 1 January 2011:
Table 3.2 - Timeline of SRES Requirements.
Quarter Dates SRES Requirements (ORER & Liable Entity)
1/2011 Before 31 March 2011 ORER:
Ø 2011 STP published
Ø Estimates for 2012/13 STP published
Before 15 April 2011 ORER:
Ø Provide Liable Entities with estimate of required surrender amounts for quarters 1 -3 so that correct amount of STCs are surrendered based on previous years reduced acquisitions (from Annual Energy Acquisition Statement (AEAS)).
Liable Entity:
Ø May apply to ORER for another required surrender amount.
15 February 2011 – 28 April 2011
Liable Entity:
Ø STC surrender for quarter 1 SRES compliance based on 35 per cent of previous year’s reduced acquisitions from AEAS
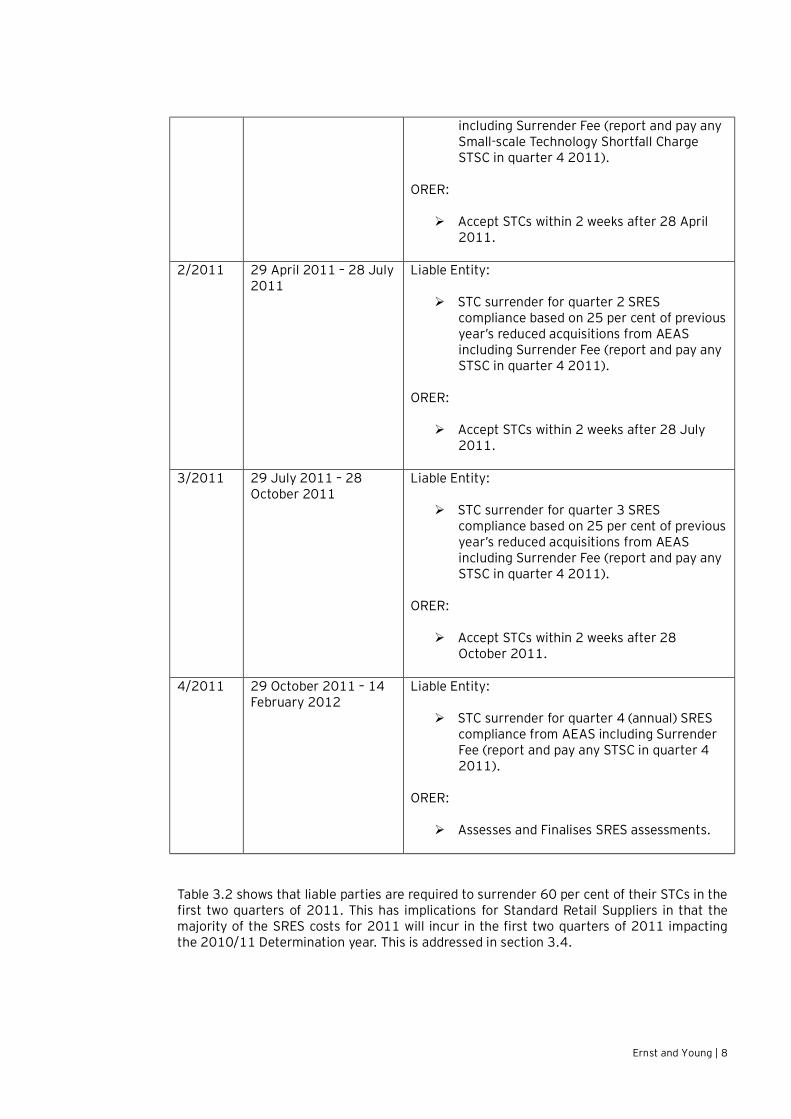
Ernst and Young | 8
including Surrender Fee (report and pay any Small-scale Technology Shortfall Charge STSC in quarter 4 2011).
ORER:
Ø Accept STCs within 2 weeks after 28 April 2011.
2/2011 29 April 2011 – 28 July 2011
Liable Entity:
Ø STC surrender for quarter 2 SRES compliance based on 25 per cent of previous year’s reduced acquisitions from AEAS including Surrender Fee (report and pay any STSC in quarter 4 2011).
ORER:
Ø Accept STCs within 2 weeks after 28 July 2011.
3/2011 29 July 2011 – 28 October 2011
Liable Entity:
Ø STC surrender for quarter 3 SRES compliance based on 25 per cent of previous year’s reduced acquisitions from AEAS including Surrender Fee (report and pay any STSC in quarter 4 2011).
ORER:
Ø Accept STCs within 2 weeks after 28 October 2011.
4/2011 29 October 2011 – 14 February 2012
Liable Entity:
Ø STC surrender for quarter 4 (annual) SRES compliance from AEAS including Surrender Fee (report and pay any STSC in quarter 4 2011).
ORER:
Ø Assesses and Finalises SRES assessments.
Table 3.2 shows that liable parties are required to surrender 60 per cent of their STCs in the first two quarters of 2011. This has implications for Standard Retail Suppliers in that the majority of the SRES costs for 2011 will incur in the first two quarters of 2011 impacting the 2010/11 Determination year. This is addressed in section 3.4.
Ernst and Young | 9
3.3 STC estimates for 2011/12 – 2012/13
ORER commissioned three separate reports to provide estimates of STC creation over 2010, 2011, and 2013. These reports were published on ORER’s website in December 2010. Each report incorporates a unique methodology for estimating STC creation (i.e. uptake of SGU technology and assumptions of STC creation from solar water heaters). The Lower-estimate of STC creation in each report is based on the revised ‘Solar Multiplier’ which reduces to 4 from 5 on 1 July 2012.
The STC estimates using both the historical time series based methodologies and forward looking methodologies of STCs (i.e. pay-back period modelling) rely on the set of assumptions used in each report. Furthermore the inherent uncertainties surrounding State and Commonwealth Government policy responses regarding financial incentives for solar uptake will impact these estimates. For this reason ORER will revise STC estimates at it sees fit going forward.
Section 3.4 incorporates these estimates for determining Standard Retail Suppliers SRES incremental costs for 2011/12 and 2012/13.
3.4 Incremental costs of SRES compliance As a consequence of the introduction of SRES the Standard Retail Suppliers will face incremental costs of compliance in terms of the uplift on STCs. We understand that they will seek to pass these costs on to their Small Retail Customers. This section outlines an estimate of these costs.
On 1 December 2010, the Minister for Climate Change and Energy Efficiency announced a STP of 14.8% for 20113, which is equivalent to 28 million STCs as a proportion of total estimated electricity consumption for 2011.
The uplift for each year of Determination can be calculated as the “STP x Fixed STC Cost x Adjustment Factor4”. Each of these variables is discussed below:
Ø Where available published figures for the STP have been utilised. Otherwise the STP can be estimated using the following approach:
o STP = STC / [Relevant Electricity Acquisitions (REAs) – Partial Exemption Certificates (PECs)];
o The STC (2012) and STC (2013) forecasts are 26,862,250 and 22,636,250, respectively. These forecasts were calculated as an average of the reduced solar multiplier scenario STC modelling outputs published by Green Energy Markets and SKM-MMA (i.e. average of Time Series and DOGMMA approaches) for the respective year. The ACIL Tasman STC modelling output has been excluded from the average, as the outputs from that modelling have been determined using a basis (i.e. best estimate) which differs to the other reports;
o The REAs and PECs for 2012 and 2013 are forecast using the following approach:
3 http://www.climatechange.gov.au/en/minister/greg-combet/2010/media-releases/December/mr20101201.aspx 4 To account for the upfront cost of SRES compliance as explained in table 3.2.
Ernst and Young | 10
§ Source the REAs (2011) and PECs (2011) from the 'AGL Submission to the Essential Services Commission of SA - 2010 Review of Retail Electricity Standing Contract Price Path, 19 October 2010’ report5; and
§ Escalate the 2011 forecasts for both REAs and PECs by the medium energy projections annual growth rate of 2.1% for NEM sourced from the ‘AEMO – 2010 Electricity Statement of Opportunities’ report.
o The calendar STP figures have been averaged6 to account for the fact that the Determination years are in financial years.
Ø Legislated fixed price of $40 per STC across all Determination years; and
Ø An adjustment factor of 120% for the 2010/11 Determination is required to account for the reporting and compliance procedures for SRES as specified in table 3.2. As the SRES will be in effect for the entirety of the 2011/12 and 2012/13 Determination years, no adjustment factors are needed.
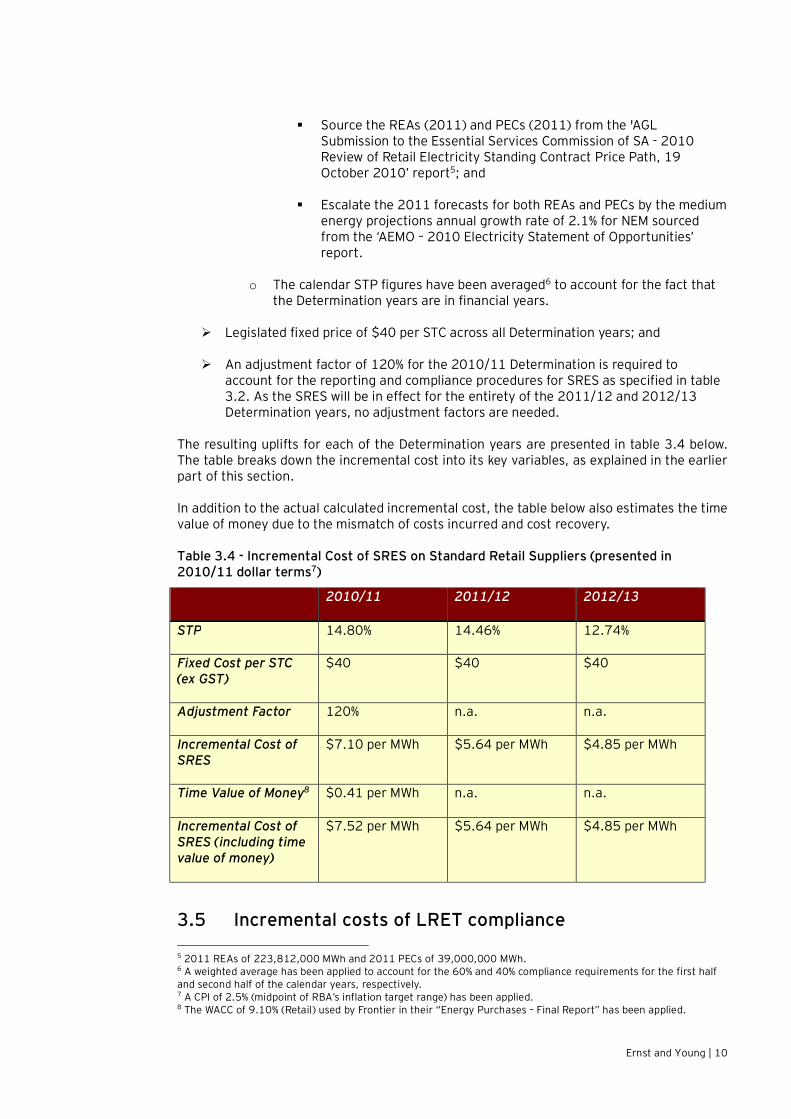
The resulting uplifts for each of the Determination years are presented in table 3.4 below. The table breaks down the incremental cost into its key variables, as explained in the earlier part of this section.
In addition to the actual calculated incremental cost, the table below also estimates the time value of money due to the mismatch of costs incurred and cost recovery.
Table 3.4 - Incremental Cost of SRES on Standard Retail Suppliers (presented in 2010/11 dollar terms7)
2010/11 2011/12 2012/13
STP 14.80% 14.46% 12.74%
Fixed Cost per STC (ex GST)
$40 $40 $40
Adjustment Factor 120% n.a. n.a.
Incremental Cost of SRES
$7.10 per MWh $5.64 per MWh $4.85 per MWh
Time Value of Money8 $0.41 per MWh n.a. n.a.
Incremental Cost of SRES (including time value of money)
$7.52 per MWh $5.64 per MWh $4.85 per MWh
3.5 Incremental costs of LRET compliance 5 2011 REAs of 223,812,000 MWh and 2011 PECs of 39,000,000 MWh. 6 A weighted average has been applied to account for the 60% and 40% compliance requirements for the first half and second half of the calendar years, respectively. 7 A CPI of 2.5% (midpoint of RBA’s inflation target range) has been applied. 8 The WACC of 9.10% (Retail) used by Frontier in their “Energy Purchases – Final Report” has been applied.
Ernst and Young | 11
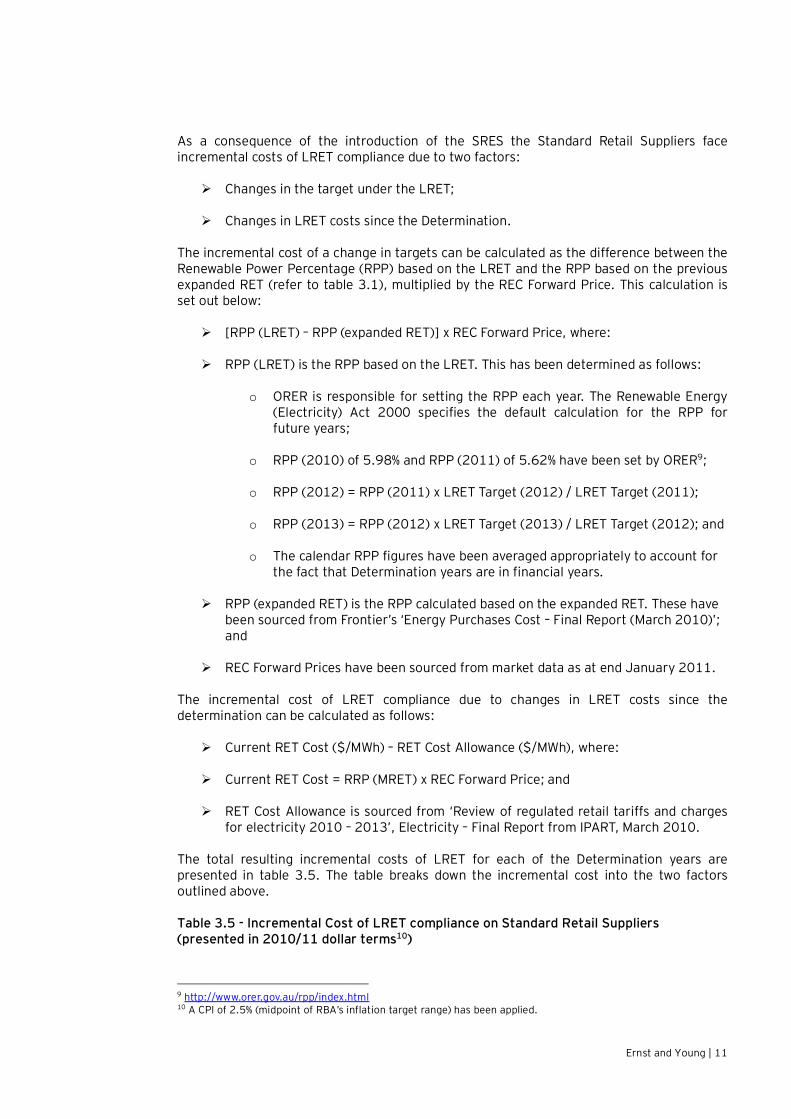
As a consequence of the introduction of the SRES the Standard Retail Suppliers face incremental costs of LRET compliance due to two factors:
Ø Changes in the target under the LRET;
Ø Changes in LRET costs since the Determination.
The incremental cost of a change in targets can be calculated as the difference between the Renewable Power Percentage (RPP) based on the LRET and the RPP based on the previous expanded RET (refer to table 3.1), multiplied by the REC Forward Price. This calculation is set out below:
Ø [RPP (LRET) – RPP (expanded RET)] x REC Forward Price, where:
Ø RPP (LRET) is the RPP based on the LRET. This has been determined as follows:
o ORER is responsible for setting the RPP each year. The Renewable Energy (Electricity) Act 2000 specifies the default calculation for the RPP for future years;
o RPP (2010) of 5.98% and RPP (2011) of 5.62% have been set by ORER9;
o RPP (2012) = RPP (2011) x LRET Target (2012) / LRET Target (2011);
o RPP (2013) = RPP (2012) x LRET Target (2013) / LRET Target (2012); and
o The calendar RPP figures have been averaged appropriately to account for the fact that Determination years are in financial years.
Ø RPP (expanded RET) is the RPP calculated based on the expanded RET. These have been sourced from Frontier’s ‘Energy Purchases Cost – Final Report (March 2010)’; and
Ø REC Forward Prices have been sourced from market data as at end January 2011.
The incremental cost of LRET compliance due to changes in LRET costs since the determination can be calculated as follows:
Ø Current RET Cost ($/MWh) – RET Cost Allowance ($/MWh), where:
Ø Current RET Cost = RRP (MRET) x REC Forward Price; and
Ø RET Cost Allowance is sourced from ‘Review of regulated retail tariffs and charges for electricity 2010 – 2013’, Electricity – Final Report from IPART, March 2010.
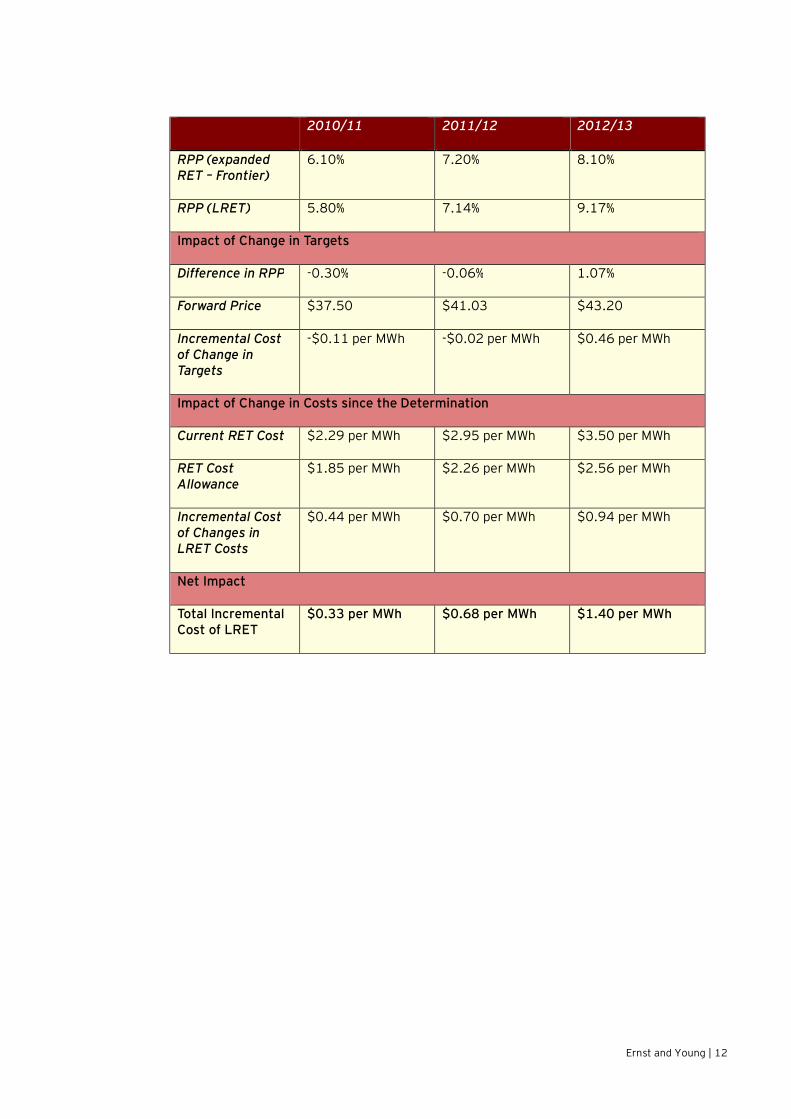
The total resulting incremental costs of LRET for each of the Determination years are presented in table 3.5. The table breaks down the incremental cost into the two factors outlined above.
Table 3.5 - Incremental Cost of LRET compliance on Standard Retail Suppliers (presented in 2010/11 dollar terms10)
9 http://www.orer.gov.au/rpp/index.html 10 A CPI of 2.5% (midpoint of RBA’s inflation target range) has been applied.
Ernst and Young | 12
2010/11 2011/12 2012/13
RPP (expanded RET – Frontier)
6.10% 7.20% 8.10%
RPP (LRET) 5.80% 7.14% 9.17%
Impact of Change in Targets
Difference in RPP -0.30% -0.06% 1.07%
Forward Price $37.50 $41.03 $43.20
Incremental Cost of Change in Targets
-$0.11 per MWh -$0.02 per MWh $0.46 per MWh
Impact of Change in Costs since the Determination
Current RET Cost $2.29 per MWh $2.95 per MWh $3.50 per MWh
RET Cost Allowance
$1.85 per MWh $2.26 per MWh $2.56 per MWh
Incremental Cost of Changes in LRET Costs
$0.44 per MWh $0.70 per MWh $0.94 per MWh
Net Impact
Total Incremental Cost of LRET
$0.33 per MWh $0.68 per MWh $1.40 per MWh
Ernst and Young | 13
4. Delay in introduction of CPRS
4.1 Background – existing/ongoing Green Schemes The delay in the introduction of the Commonwealth Government’s CPRS was announced on 27 April 2010. This delay commits Standard Retail Suppliers to continue complying and meeting the obligations of the following existing and ongoing Green Schemes:
Ø The Commonwealth Government’s LRET; and
Ø The NSW GGAS.
Ongoing compliance with these schemes, brought about by the delay, presents incremental costs for Standard Retail Suppliers because:
Ø The Long Run Marginal Cost (LRMC) Methodology used to estimate Large-scale Generation Certificate (LGC) costs (previously REC costs) for 2010/11 and 2011/12 in the Determination assumes the CPRS will be in place from 1 July 2011 (2012/13 uses the market-based approach). The estimated LGC costs with CPRS in place from 1 July 2011 produce LGC costs for 2010/11 and 2011/12 that are lower than the LGC costs in the absence of CPRS; and
Ø The Green Cost Allowance for NSW GGAS costs in the Determination was zero due to the assumption:
o That the CPRS will be in place and that the NSW GGAS will cease on 1 July 2011; and
o That there was an oversupply of NSW Gas Abatement Certificates (NGACs) in the lead up to 1 July 2011.
The delay implies that NSW GGAS will continue throughout the Determination period and Standard Retail Suppliers will incur ongoing costs of compliance without being provided a Green Cost Allowance to account for the costs.
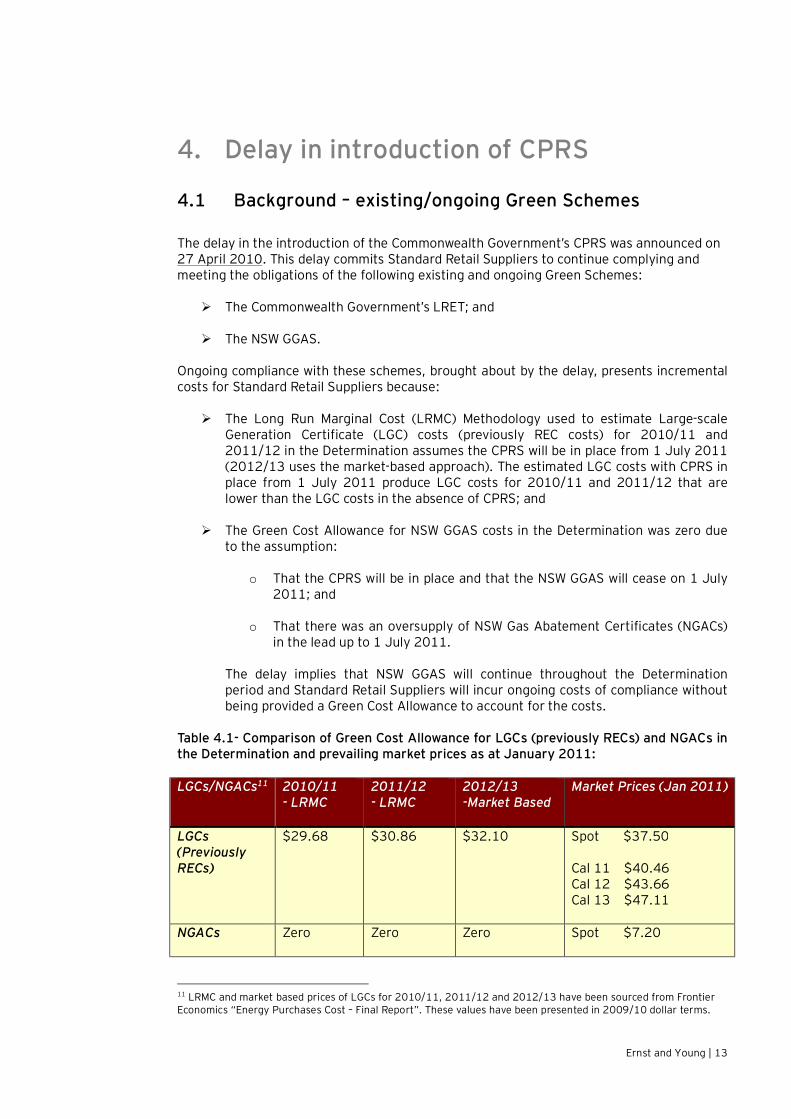
Table 4.1- Comparison of Green Cost Allowance for LGCs (previously RECs) and NGACs in the Determination and prevailing market prices as at January 2011:
LGCs/NGACs11 2010/11 - LRMC
2011/12 - LRMC
2012/13 -Market Based
Market Prices (Jan 2011)
LGCs (Previously RECs)
$29.68 $30.86 $32.10 Spot $37.50
Cal 11 $40.46 Cal 12 $43.66 Cal 13 $47.11
NGACs Zero Zero Zero Spot $7.20
11 LRMC and market based prices of LGCs for 2010/11, 2011/12 and 2012/13 have been sourced from Frontier Economics “Energy Purchases Cost – Final Report”. These values have been presented in 2009/10 dollar terms.
Ernst and Young | 14
Cal 11 $7.31 Cal 12 $8.38 Cal 13 $9.04
Sections 4.2 and 4.3 outline the LRET and the NSW GGAS incremental costs for each year of the Determination.
4.2 LRET Compliance The spot market for LGCs is a compliance market where liable parties surrender an appropriate number of LGCs on an annual basis in accordance with the ORER timetable. LGCs are created from eligible and registered renewable energy power stations as of 1 January 2011 based on 1 MWh of renewable electricity generated above baseline levels of output. Individual LGC liabilities depend on the Renewable Power Percentage (RPP). The RPP determines the number of LGCs to be surrendered by liable parties for compliance with the LRET.
The Green Cost Allowance for LGCs (RECs) for 2010/11 and 2011/12 in the Determination is derived using the co-optimised LRMC methodology assuming CPRS is introduced on 1 July 2011. Using this methodology, the resulting LGC cost estimate for 2010/11 is lower than would prevail in the absence of the CPRS. This is because the estimated LGC cost for 2010/11 in the absence of CPRS does not subsidise the 2010/11 LRET allowance for the Net Present Value (NPV) of carbon passed through in black electricity prices from 1 July 2011. Specifically:
Ø The estimated LGC cost estimate for 2010/11 needs to be adjusted for the $10 per tonne of carbon price assumption for 2011/12. In addition, the incremental carbon price pass through of $26 per tonne of carbon for 2012/2013 should apply to the LGC cost estimate for 2010/11 (i.e. $26 - $10 per tonne of carbon and the assumed pass through rates); and
Ø The incremental carbon price pass through of $26 per tonne of carbon for 2012/2013 should apply to the LGC cost estimate for 2010/11 (i.e. $26 - $10 per tonne of carbon and the assumed pass through rates).
Both of these adjustments are required because the estimated LGC cost allowance in the Determination for 2010/11 and 2011/12 is lower than that would prevail in the absence of CPRS. This subsidy needs to be recovered in a higher LGC LRMC estimate. The difference in the LGC LRMC cost with and without the introduction of the CPRS is the incremental cost.
The allowance for the 2012/13 in the Determination uses the market-based approach and we have provided the difference between this estimate and prevailing REC forward prices for 2012/13 (refer to table 4.2.2).
Finally, the Determination makes note of the bankability and borrowing of LGCs (RECs) to and from future years respectively. Irrespective of bankability and borrowing Standard Retail Suppliers face real costs of compliance with the LRET. This cost is reflected in prevailing market prices for the LGCs. In practice a prudent retailer will incorporate a ‘short-fall’ risk measure of insufficient LGCs within inventory for current year surrender. The worst case scenario of this is the penalty price of LGCs (i.e. $92.86)12 for a short-fall.
12 After adjusting the $65 by the corporate tax rate.
Ernst and Young | 15
Given the Determination uses a non-market based LRMC methodology, the following approach has been used to estimate the incremental costs of the delay in the introduction CPRS on LRET compliance:
Ø Determine the RPP for each year of Determination (refer to section 3.5);
Ø Determine a carbon price for each year of the Determination. The following carbon prices have been sourced from the “Energy Purchase Costs – Final Report” prepared by Frontier Economics:
o Carbon Price (2010/11) = $0 / tCO2-e;
o Carbon Price (2011/12) = $10 / tCO2-e; and
o Carbon Price (2012/13) = $26 / tCO2-e.
Ø Determine the impact of the delay in the introduction of CPRS in terms of the assumed carbon price for each year of the Determination by Frontier (i.e. carbon cost of delay). Based on the assumption of a 1 year delay in the introduction of CPRS, the following can be calculated:
o Carbon Cost of Delay (2010/11) = $25 / tCO2-e. This comprised of $10 / tCO2-e from 2011/12 and $15 / tCO2-e from 2012/13 (i.e. $16 / tCO2-e discounted using Frontier’s Generation WACC of 8.0%); and
o Carbon Cost of Delay (2011/12) = $16 / tCO2-e.
Ø Estimate the level of carbon pass through for each year in the Determination period. The following carbon pass through figures have been approximated13 as follows:
o Carbon Pass Through (2010/11) = 80% (for the purposes of the calculation we have adopted the 2011/12 carbon pass through under the LRMC approach);
o Carbon Pass Through (2011/12) = 80% (under the LRMC approach); and
o The Carbon Pass Through (2012/13) is not needed as the incremental cost is determined from a market based approach.
Ø The incremental LGC cost due to the delay of the introduction of CPRS can be determined as:
o RPP x Carbon Cost of Delay x Carbon Pass Through (for 2010/11 and 2011/12 under the LRMC approach); and
o RPP x [Forward Price – Frontier’s Price] (for 2012/13 under the market based approach).
The resulting incremental cost for each year of the Determination period due to the delay in the introduction of CPRS on LRET compliance is presented in table 4.2.2. The table breaks down the incremental cost into its key variables, as explained in the earlier part of this section.
13 Refer to Chapter 6 of the “Energy Purchase Costs – Final Report” prepared by Frontier Economics.
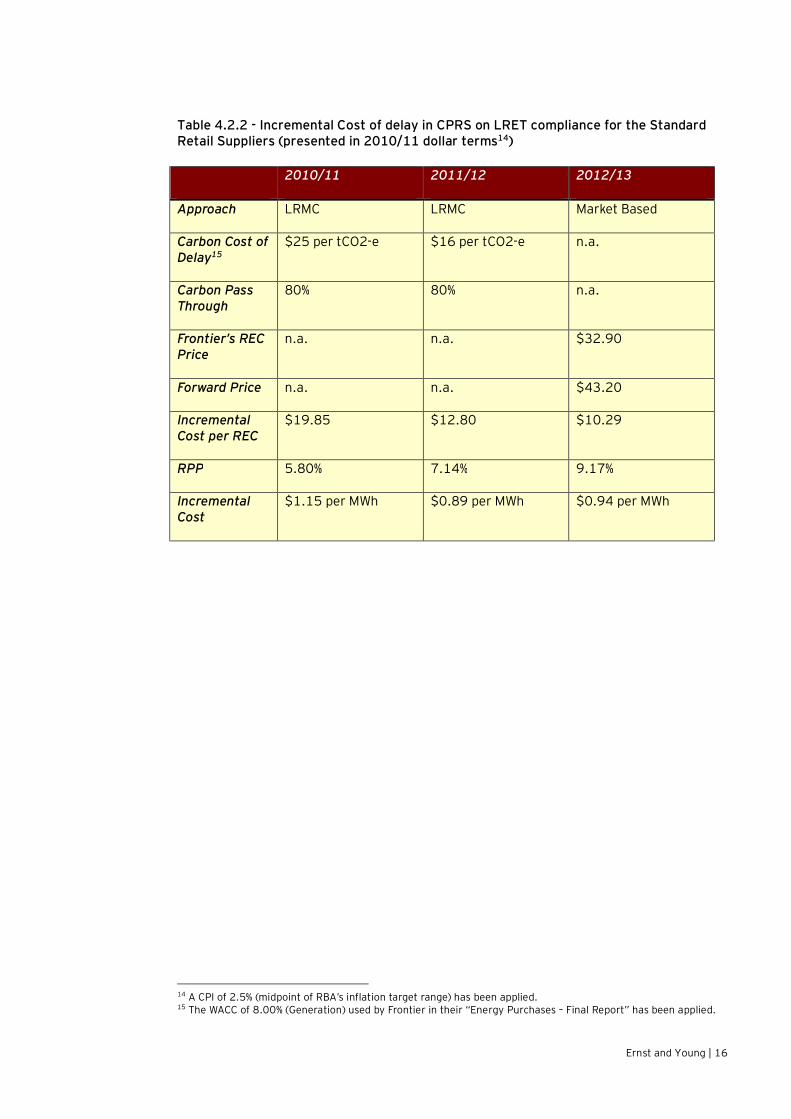
Ernst and Young | 16
Table 4.2.2 - Incremental Cost of delay in CPRS on LRET compliance for the Standard Retail Suppliers (presented in 2010/11 dollar terms14) 2010/11 2011/12 2012/13
Approach LRMC LRMC Market Based
Carbon Cost of Delay15
$25 per tCO2-e $16 per tCO2-e n.a.
Carbon Pass Through
80% 80% n.a.
Frontier’s REC Price
n.a. n.a. $32.90
Forward Price n.a. n.a. $43.20
Incremental Cost per REC
$19.85 $12.80 $10.29
RPP 5.80% 7.14% 9.17%
Incremental Cost
$1.15 per MWh $0.89 per MWh $0.94 per MWh
14 A CPI of 2.5% (midpoint of RBA’s inflation target range) has been applied. 15 The WACC of 8.00% (Generation) used by Frontier in their “Energy Purchases – Final Report” has been applied.
Ernst and Young | 17
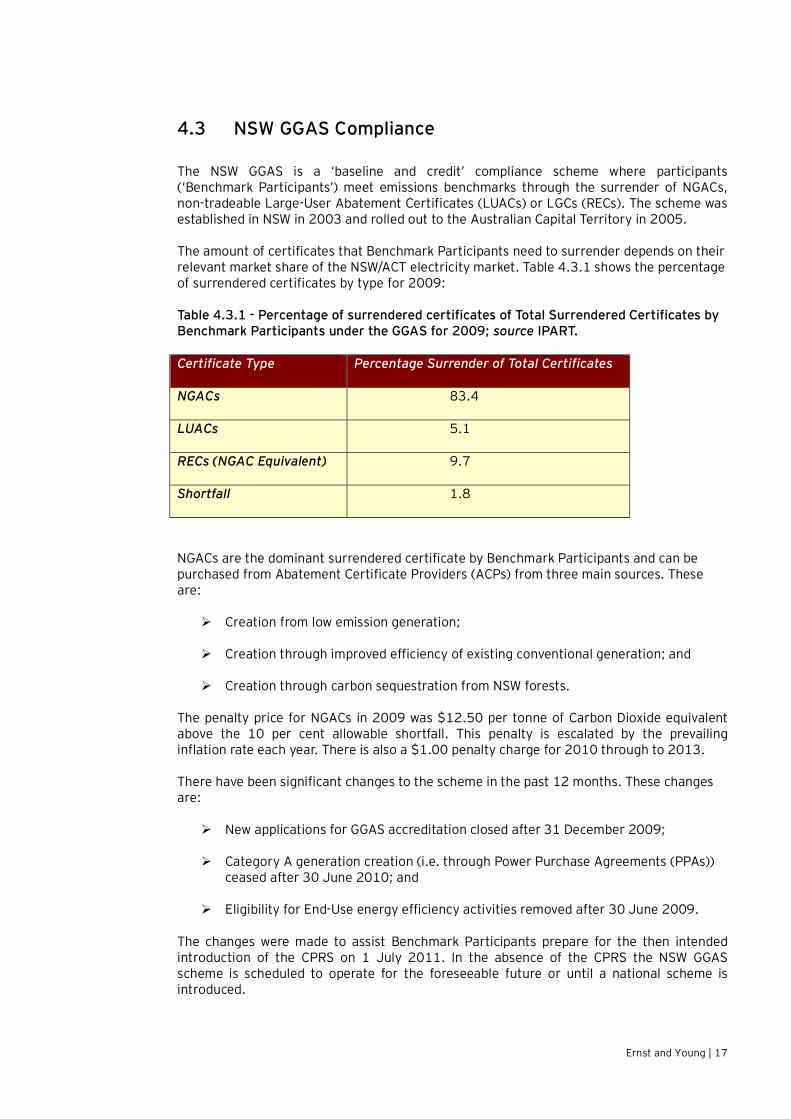
4.3 NSW GGAS Compliance The NSW GGAS is a ‘baseline and credit’ compliance scheme where participants (‘Benchmark Participants’) meet emissions benchmarks through the surrender of NGACs, non-tradeable Large-User Abatement Certificates (LUACs) or LGCs (RECs). The scheme was established in NSW in 2003 and rolled out to the Australian Capital Territory in 2005.
The amount of certificates that Benchmark Participants need to surrender depends on their relevant market share of the NSW/ACT electricity market. Table 4.3.1 shows the percentage of surrendered certificates by type for 2009:
Table 4.3.1 - Percentage of surrendered certificates of Total Surrendered Certificates by Benchmark Participants under the GGAS for 2009; source IPART.
Certificate Type Percentage Surrender of Total Certificates
NGACs 83.4
LUACs 5.1
RECs (NGAC Equivalent) 9.7
Shortfall 1.8
NGACs are the dominant surrendered certificate by Benchmark Participants and can be purchased from Abatement Certificate Providers (ACPs) from three main sources. These are:
Ø Creation from low emission generation;
Ø Creation through improved efficiency of existing conventional generation; and
Ø Creation through carbon sequestration from NSW forests.
The penalty price for NGACs in 2009 was $12.50 per tonne of Carbon Dioxide equivalent above the 10 per cent allowable shortfall. This penalty is escalated by the prevailing inflation rate each year. There is also a $1.00 penalty charge for 2010 through to 2013.
There have been significant changes to the scheme in the past 12 months. These changes are:
Ø New applications for GGAS accreditation closed after 31 December 2009;
Ø Category A generation creation (i.e. through Power Purchase Agreements (PPAs)) ceased after 30 June 2010; and
Ø Eligibility for End-Use energy efficiency activities removed after 30 June 2009.
The changes were made to assist Benchmark Participants prepare for the then intended introduction of the CPRS on 1 July 2011. In the absence of the CPRS the NSW GGAS scheme is scheduled to operate for the foreseeable future or until a national scheme is introduced.
Ernst and Young | 18
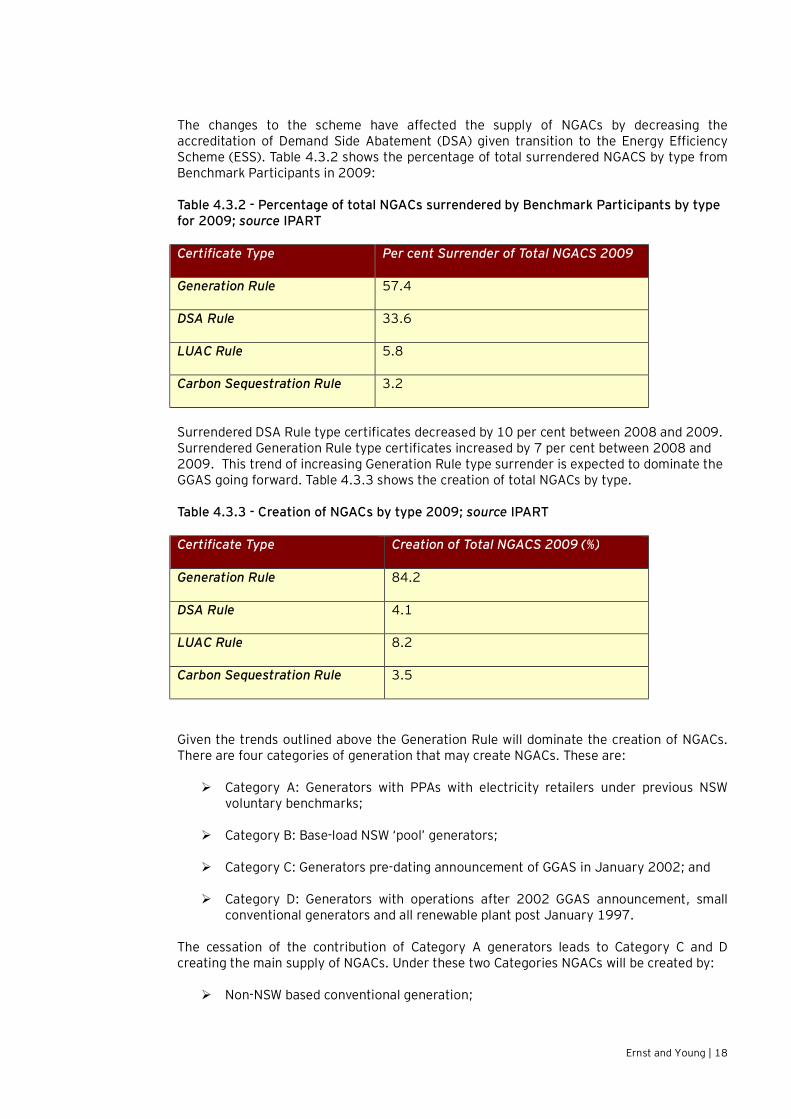
The changes to the scheme have affected the supply of NGACs by decreasing the accreditation of Demand Side Abatement (DSA) given transition to the Energy Efficiency Scheme (ESS). Table 4.3.2 shows the percentage of total surrendered NGACS by type from Benchmark Participants in 2009:
Table 4.3.2 - Percentage of total NGACs surrendered by Benchmark Participants by type for 2009; source IPART
Certificate Type Per cent Surrender of Total NGACS 2009
Generation Rule 57.4
DSA Rule 33.6
LUAC Rule 5.8
Carbon Sequestration Rule 3.2
Surrendered DSA Rule type certificates decreased by 10 per cent between 2008 and 2009. Surrendered Generation Rule type certificates increased by 7 per cent between 2008 and 2009. This trend of increasing Generation Rule type surrender is expected to dominate the GGAS going forward. Table 4.3.3 shows the creation of total NGACs by type.
Table 4.3.3 - Creation of NGACs by type 2009; source IPART
Certificate Type Creation of Total NGACS 2009 (%)
Generation Rule 84.2
DSA Rule 4.1
LUAC Rule 8.2
Carbon Sequestration Rule 3.5
Given the trends outlined above the Generation Rule will dominate the creation of NGACs. There are four categories of generation that may create NGACs. These are:
Ø Category A: Generators with PPAs with electricity retailers under previous NSW voluntary benchmarks;
Ø Category B: Base-load NSW ‘pool’ generators;
Ø Category C: Generators pre-dating announcement of GGAS in January 2002; and
Ø Category D: Generators with operations after 2002 GGAS announcement, small conventional generators and all renewable plant post January 1997.
The cessation of the contribution of Category A generators leads to Category C and D creating the main supply of NGACs. Under these two Categories NGACs will be created by:
Ø Non-NSW based conventional generation;
Ernst and Young | 19
Ø Generation from Landfill Gas Projects (including methane reduction);
Ø Natural Gas Generation; and
Ø Waste Coal Mine Gas;
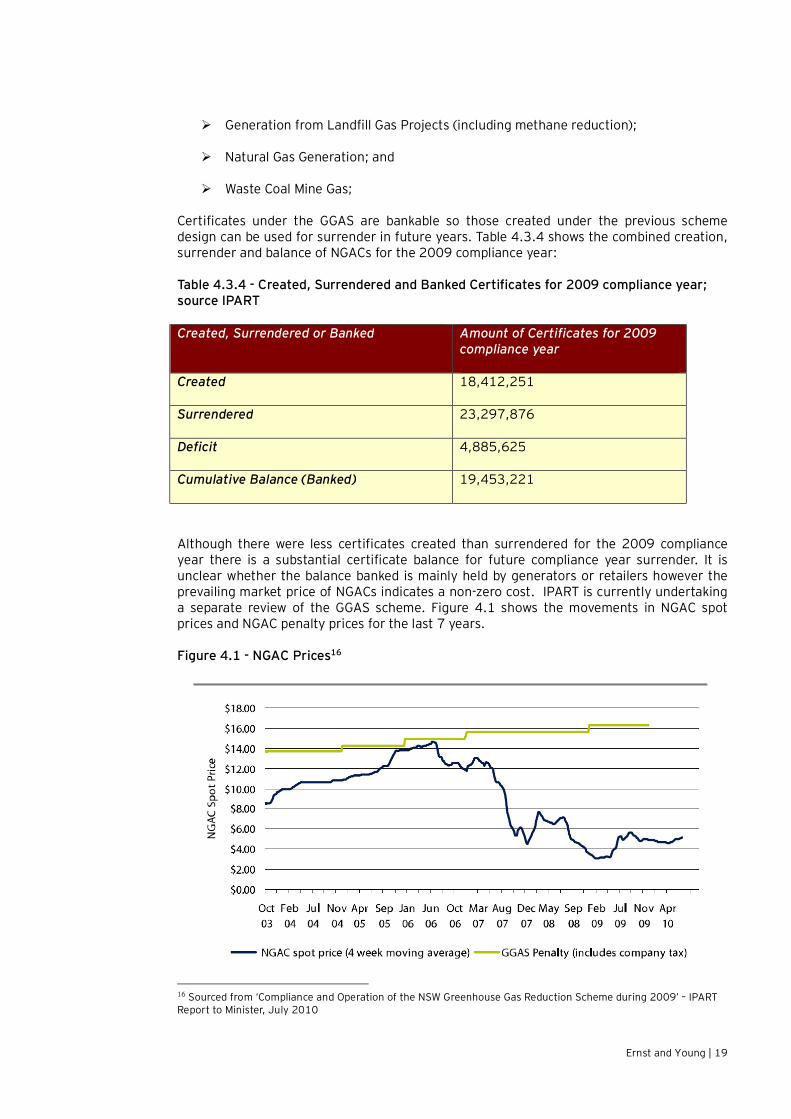
Certificates under the GGAS are bankable so those created under the previous scheme design can be used for surrender in future years. Table 4.3.4 shows the combined creation, surrender and balance of NGACs for the 2009 compliance year:
Table 4.3.4 - Created, Surrendered and Banked Certificates for 2009 compliance year; source IPART
Created, Surrendered or Banked Amount of Certificates for 2009 compliance year
Created 18,412,251
Surrendered 23,297,876
Deficit 4,885,625
Cumulative Balance (Banked) 19,453,221
Although there were less certificates created than surrendered for the 2009 compliance year there is a substantial certificate balance for future compliance year surrender. It is unclear whether the balance banked is mainly held by generators or retailers however the prevailing market price of NGACs indicates a non-zero cost. IPART is currently undertaking a separate review of the GGAS scheme. Figure 4.1 shows the movements in NGAC spot prices and NGAC penalty prices for the last 7 years.
Figure 4.1 - NGAC Prices16
16 Sourced from ‘Compliance and Operation of the NSW Greenhouse Gas Reduction Scheme during 2009’ – IPART Report to Minister, July 2010
Ernst and Young | 20
NGAC prices started to decline in late 2006 due to the creation of a large number of NGACs from energy efficiency activities. Prices subsequently recovered on the announcement that energy efficiency will be separated into its own scheme (i.e. ESS) in mid 2009. The upward trend in NGAC prices has continued since mid 2010 on the announcement of a further delay in the introduction of CPRS (i.e. NGAC spot price as at January 2011 is $7.20).
The Green Cost Allowance for NGACs in the Determination was zero. The reasoning for the zero allowance was based on:
Ø The impending introduction of the Commonwealth Government’s CPRS leading to the cessation of the NSW GGAS; and
Ø The current significant balance of banked NGACs implying the market was oversupplied in the lead-up to the introduction of the CPRS.
This is no longer a relevant basis as the cumulative balance of certificates will not be as large as the annual deficit going forward, as table 4.3.4 indicates. Furthermore, the scheme is expected to continue for the foreseeable future. Therefore, current market prices appear to be the best guide to estimate cost of compliance for GGAS.
There was no estimation of NGAC costs in the Determination using the LRMC methodology for 2010/11 and 2011/12 (nor is there an allowance determined for 2012/13 using the market-based approach as per the LGC (REC) allowance). A LRMC methodology applied to the estimation of NGAC costs could draw on the fact that under the current scheme design the supply of NGACs going forward would be created from Category C and Category D generation. Demand for NGACs in each compliance year is largely driven by the forecast per capita demand growth along with other secondary factors that define the scheme. LRMC estimation would then proceed as per the co-optimised approach used for the LGC (REC) cost estimation with the output showing a cost estimate for NGACs.
In the absence of a cost estimate using the LRMC methodology, and in light of the CPRS delay, we have observed prevailing market price of NGACs and note the spot price of NGACs is $7.20. This suggests a non-zero cost of compliance for Standard Retail Suppliers due to the delay in the introduction of the CPRS.
With established emissions trading schemes such as the NSW GGAS, the scarcity of certificates at the end of the scheme drives prices. Unless forecast emissions targets are met exactly, permit prices either tend to zero (surplus certificates) or to the penalty price (shortage of certificates). This was certainly the case for the first phase of the European Union’s (EU’s) Emissions Trading Scheme where carbon permits were not bankable across phases of the scheme. Phase one permits had no value given they were in surplus at the phase one end date.
The announced end date for the GGAS will have a large bearing on compliance costs for Standard Retail Suppliers. In the absence of an announced end date to the GGAS the non-zero market price of NGACs provides an indication that banked NGACs have a future surrender value which is the compliance cost for the Standard Retail Suppliers.
The incremental costs due to the delay in the introduction CPRS on GGAS compliance can be determined using the following information:
Ø “Greenhouse Gas Benchmark Rule (Compliance) No. 1 of 2003” – This specifies the legislated methodology for calculating GGAS compliance;
Ø “AEMO – 2010 Electricity Statement of Opportunities” – Provides estimates around the:
Ernst and Young | 21
o Total electricity purchased (MWh) for NSW from 2010 to 2013;
o Medium energy projections annual growth rate for NSW; and
o Average forecasted population annual growth rate for NSW.
Ø “AGGBS-Comp-01-2010.xls (GGAS Scheme Website)” – Spreadsheet that specifies the total NSW electricity demand (MWh) and the total NSW population for 2010 and 2011;
Ø “Electricity Supply Amendment (Greenhouse Gas Emission Reduction) Act 2002 No 12” – Specifies the State Greenhouse Gas Benchmark (tCO2-e) for 2010 to 2012;
Ø “Fact Sheet – The NSW Pool Coefficient (GGAS Scheme Website)” – Provides forecasts of the NSW Pool Coefficient (tCO2-e/MWh); and
Ø Market data around NGAC spot price, NGAC forward prices and long term swap yield curves.
The above information combined with additional assumptions can be used to estimate the cost of the delay in the introduction of CPRS on GGAS compliance. This is as follows:
Ø GGAS compliance is determined using the following specified calculations:
o If Attributable Emissions are less than equal to the Greenhouse Gas Benchmark then the participant is compliant. Otherwise the participant is deemed non-compliant;
o In this report, the calculation has been performed on a State wide basis with the assumption that Attributable Emissions are equal to the Greenhouse Gas Benchmark (i.e. State is compliant);
o Attributable Emissions (tCO2-e) = Total Electricity Purchased x NSW Pool Coefficient – NGACs Surrendered – (RECs Counted x NSW Pool Coefficient) – LUACs Surrendered; and
o Greenhouse Gas Benchmark (tCO2-e) = [Total Electricity Sold / Total State Electricity Demand] x Electricity Sector Benchmark.
Ø To perform the above calculations the following necessary information has been sourced or assumed for each of year of the Determination:
o Total Electricity Purchased (MWh) – Is sourced as the medium NSW projections from “AEMO – 2010 Electricity Statement of Opportunities” report;
o NSW Pool Coefficient (tCO2-e/MWh) – Is sourced from “Fact Sheet – The NSW Pool Coefficient (GGAS Scheme Website)”:
§ 2010 is 0.973% (Actual);
§ 2011 is 0.975% (Actual);
§ 2012 is 0.980% (Forecast); and
§ 2013 is 0.982% (Forecast).
Ernst and Young | 22
o Total Electricity Sold (MWh) – Is assumed to be equivalent to “Total Electricity Purchased (MWh)”. On a state wide basis this is considered as a reasonable assumption;
o Total State Electricity Demand (MWh) – The 2010 and 2011 figures are presented in the “AGGBS-Comp-01-2010.xls” compliance spreadsheet found on the GGAS Scheme website17. The 2012 and 2013 Total State Electricity Demand (MWh) is assumed to be equivalent to the 2011 value escalated by the medium energy projections annual growth rate for NSW of 1.8% sourced from “AEMO – 2010 Electricity Statement of Opportunities”;
o Total State Population – The 2010 and 2011 figures are presented in the “AGGBS-Comp-01-2010.xls” compliance spreadsheet found on the GGAS Scheme website. The 2012 and 2013 Total State Population is assumed to be equivalent to the 2011 value escalated by the average forecasted population annual growth rate for NSW of 0.95% sourced from “AEMO – 2010 Electricity Statement of Opportunities”;
o State Greenhouse Gas Benchmark (tCO2-e per capita) – This has been sourced from the “Electricity Supply Amendment (Greenhouse Gas Emission Reduction) Act 2002 No 12” for 2010 to 2012. Due to the absence of a published 2013 figure, it has been assumed that this is equivalent to the 2012 value;
o Electricity Sector Benchmark (tCO2-e) – This is calculated as “Total State Population” multiplied by “State Greenhouse Gas Benchmark”; and
o LUACs Surrendered (tCO2-e), NGACs Surrendered (tCO2-e) and RECs Counted (MWh) – In order to calculate the “Greenhouse Shortfall” (Attributable Emissions less Greenhouse Gas Benchmark) with the assumption that none of these certificates are surrendered for GGAS compliance.
Ø After determining the “Greenhouse Shortfall”:
o It is necessary to average the following variables to account for the financial year basis in the Determination:
§ Total Electricity Purchased (MWh);
§ Greenhouse Shortfall (tCO2-e); and
§ Forward Prices of NGACs ($ per NGAC).
o The number of NGACs or NGAC equivalents required for GGAS compliance is equal to the “Greenhouse Shortfall”; and
o The incremental cost of the delay in the introduction of CPRS on GGAS compliance is calculated as:
[“Number of NGACs Needed for Compliance” x “Market Price ($ per NGAC)”] / “Total Electricity Purchased (MWh)”
17 http://www.greenhousegas.nsw.gov.au/
Ernst and Young | 23
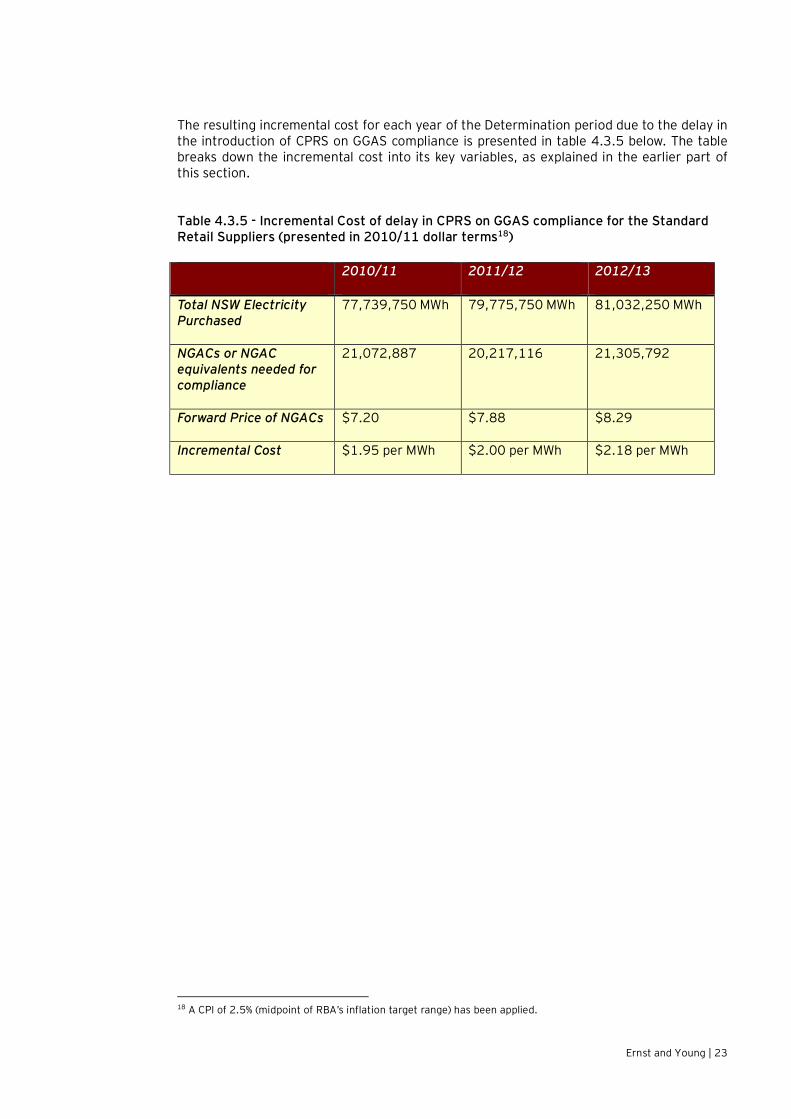
The resulting incremental cost for each year of the Determination period due to the delay in the introduction of CPRS on GGAS compliance is presented in table 4.3.5 below. The table breaks down the incremental cost into its key variables, as explained in the earlier part of this section.
Table 4.3.5 - Incremental Cost of delay in CPRS on GGAS compliance for the Standard Retail Suppliers (presented in 2010/11 dollar terms18) 2010/11 2011/12 2012/13
Total NSW Electricity Purchased
77,739,750 MWh 79,775,750 MWh 81,032,250 MWh
NGACs or NGAC equivalents needed for compliance
21,072,887 20,217,116 21,305,792
Forward Price of NGACs $7.20 $7.88 $8.29
Incremental Cost $1.95 per MWh $2.00 per MWh $2.18 per MWh
18 A CPI of 2.5% (midpoint of RBA’s inflation target range) has been applied.

Ernst and Young | 24
5. Summary Ernst & Young was engaged to advise on the incremental costs of complying with new and existing Green Schemes pursuant to the two following recent and separate regulatory changes: Ø The introduction of the SRES by the Commonwealth Government; and
Ø The delay in the introduction of the CPRS by the Commonwealth Government.
Both of these changes present incremental costs for Standard Retail Suppliers who are seeking IPART’s approval to pass through these costs to their Small Retail Customers. Specifically:
Ø The introduction of the SRES presents a new Green Scheme for Standard Retail Suppliers to comply with; and
Ø The delay in the introduction of the CPRS commits the Standard Retail Suppliers to comply with existing and ongoing Green Schemes including the Commonwealth Government’s LRET and their obligations under the NSW GGAS.
This report has outlined the details of the regulatory changes, the dates they occurred, and the incremental cost estimates they imply for each year of the Determination period.
A summary of incremental costs is presented in the following table. Table 5.1 – Summary on Incremental Costs on Standard Retail Suppliers (presented in 2010/11 dollar terms) 2010/11 2011/12 2012/13
Introduction of SRES
SRES Cost (including time value of money)
$7.52 per MWh $5.64 per MWh $4.85 per MWh
LRET Cost $0.33 per MWh $0.68 per MWh $1.40 per MWh
Delay in introduction of CPRS
LRET Cost $1.15 per MWh $0.89 per MWh $0.94 per MWh
GGAS Cost $1.95 per MWh $2.00 per MWh $2.18 per MWh
Ernst and Young | 25
Ernst & Young
Assurance | Tax | Transactions | Advisory
About Ernst & Young Ernst & Young is a global leader in assurance, tax, transaction and advisory services. Worldwide, our 135,000 people are united by our shared values and an unwavering commitment to quality. We make a difference by helping our people, our clients and our wider communities achieve their potential. For more information, please visit www.ey.com/au © 2011 Ernst & Young Australia.
Liability limited by a scheme approved under Professional Standards Legislation.
Our report may be relied upon by Country Energy pursuant to the terms of our engagement letter dated 10 November 2010. We disclaim all responsibility to any other party for any loss or liability that the other party may suffer or incur arising from or relating to or in any way connected with the contents of our report, the provision of our report to the other party or the reliance upon our report by the other party. Adelaide Ernst & Young Building 121 King William Street Adelaide SA 5000 Tel: +61 8 8417 1600 Fax: +61 8 8417 1775
Brisbane 1 Eagle Street Brisbane QLD 4000 Tel: +61 7 3011 3333 Fax: +61 7 3011 3100
Canberra Ernst & Young House 51 Allara Street Canberra ACT 2600 Tel: +61 2 6267 3888 Fax: +61 2 6246 1500
Gold Coast 12-14 Marine Parade Southport QLD 4215 Tel: +61 7 5571 3000 Fax: +61 7 5571 3033
Melbourne Ernst & Young Building 8 Exhibition Street Melbourne VIC 3000 Tel: +61 3 9288 8000 Fax: +61 3 8650 7777
Perth Ernst & Young Building 11 Mounts Bay Road Perth WA 6000 Tel: +61 8 9429 2222 Fax: +61 8 9429 2436
Sydney Ernst & Young Centre 680 George Street Sydney NSW 2000 Tel: +61 2 9248 5555 Fax: +61 2 9248 5959