integrated development plan for the financial year …
TRANSCRIPT

1
MATJHABENG LOCAL MUNICIPALITY
INTEGRATED DEVELOPMENT PLAN
FOR THE FINANCIAL YEAR 2020/2021

2
TABLE OF CONTENTS
CHAPTER DETAILS
PAGE(S)
CHAPTER ONE INTRODUCTION 3 – 18
CHAPTER TWO SITUATIONAL ANALYSIS 19 – 52
CHAPTER THREE INSTITUTIONAL ARRANGEMENTS 53 – 58
CHAPTER FOUR DEVELOPMENT STRATEGIES 59 – 101
CHAPTER FIVE FINANCIAL PLAN 102 – 116
CHAPTER SIX CAPITAL INFRASTRACTURE INVESTEMENT FRAMEWORK 117 – 194
CHAPTER SEVEN IMPLEMENTATION PLAN 195 – 268
CHAPTER EIGHT HIGH LEVEL SPATIAL DEVELOPMENT FRAMEWORK 269 – 301
CHAPTER NINE FRAMEWORK FOR THE PERFORMANCE MANAGEMENT SYSTEM 302 – 323
CHAPTER TEN SOCIAL AND LABOUR PLANS 324 - 327

3
1.1 BACKGROUND

4
The Local Government: Municipal Systems Act No. 32 of 2000 mandates municipalities to undertake
developmental oriented planning, to ensure that they achieve their constitutional mandates (see
Sections 152 and 153 of the Constitution). To this end, the Matjhabeng Municipality’s Integrated
Development Plan (IDP) serves as a strategic framework that guides its five-year planning and
budgeting. To provide democratic and accountable government for local communities, the
Municipality consulted both internal and external stakeholders in the IDP development process. The
key projects identified for implementation in the IDP were sourced from communities and other
stakeholders through various public participation platforms.
This IDP is informed by national and provincial government development goals and priorities,
emerging socio-economic trends, the ever-increasing demand and social cry of the people of
Matjhabeng for better services and other related issues that provide a framework in which the
Municipality can ensure developmental local government. Municipalities operate in an ever-
changing environment, and the Matjhabeng Municipality, too, is not immune to such changes. The
dynamic nature of local, national and global environments constantly presents local government
with new challenges and new demands. Similarly, the needs and priorities of the communities within
the Matjhabeng municipal area change from year to year.
To ensure close co-ordination and integration amongst projects, programmes and activities, line
function departments within the Municipality seek to work cohesively not only amongst themselves,
but also with external stakeholders (such as the business community and civil society) and
provincial and national government departments. This integration further seeks to promote
integrated service delivery to communities.
The IDP seeks to achieve sustainable development within Matjhabeng. To this end, there is a
balanced approached to economic, environmental and social development: the overarching pillars
of sustainable development. In pursuit of economic growth and the provision of services to its
citizens, the Municipality cannot compromise its responsibility for protecting the natural and built
environment. It is committed to adhere to good governance principles (participation, efficiency,
effectiveness, accountability, transparency, equity, fairness and the rule of law) and Batho Pele
Principles (courtesy and people first, consultation, service excellence, access,
information, openness and transparency, redress and value for money in the provision of services
to residents.
The IDP is implemented through an annual implementation framework (Service Delivery and
Budget Implementation Plan – SDBIP), which links key performance indicators to the annual
budget. Senior Municipal Managers conclude annual performance agreements, which serve as a

5
monitoring tool for departmental performance. The Municipality monitors the implementation of its
SDBIP and the performance of its senior managers through performance management systems
1.2 KEY PERFORMANCE AREAS
The Municipality’s vision and mission are translated into the following five municipal key
performance areas:
KPA1: Good governance
KPA 2: Basic Service delivery
KPA 3: Inclusive economic development and job creation
KPA 4: Institutional Transformation
KPA 5: Financial sustainability and viability
1.3 STRATEGIC OBJECTIVES
The following strategic objectives have been set to deliver on the above stated key
performance areas:
Ensuring access to basic services for all residents;
Developing and sustaining spatial, natural and built environments;
Providing integrated and sustainable human settlements;
Addressing t h e challenges o f poverty, unemployment and social inequality;
Fostering a safe, secure and healthy environment for employees and communities;
Developing a prosperous and diverse economy;
Accelerating service delivery through the acquisition and retention of competent and efficient
human capital;
Ensuring sound financial management and viability.
1.4 LEGISLATIVE FRAMEWORK
6
This IDP is informed by the following legislation:
1.4.1 Constitution of the Republic of South Africa, Act No. 108 of 1996
(Hereinafter referred to as “the Constitution”)
South African local government is, in terms of Chapter 7, Section 152(1) of the Constitution, required
to be democratic and accountable, ensuring sustained service delivery, promoting socio-economic
development and a safe and healthy environment, and encouraging the involvement of
all communities and community organisations in its affairs. In terms of Section 152(2), these
objectives should be achieved within the financial and administrative capacity of a Municipality,
which implies that all its planning and performance management processes must be geared towards
the achievement of these objectives. Chapter 10, Section 195(1) of the Constitution of the Republic
of South Africa outlines the basic values and principles governing public administration. The
Municipality’s IDP is informed by these principles.
1.4.2 Local Government: Municipal Finance Management Act, No. 56 of 2003, (MFMA) and
Regulations
The Municipal Finance Management Act (MFMA) seeks to ensure sound and sustainable financial
management within South African municipalities. Section 21 of the Act makes provision for alignment
between the IDP and the municipal budget. The Service Delivery and Budget Implementation Plan is
an annual contract between the Municipality’s administration, Council and the community, which
ensures that the IDP and the Budget are aligned. The Act makes provision for quarterly and annual
financial and non-financial performance assessments and reporting by municipalities and the entities
under their control. The Municipal Finance Management Act promotes the application of valid and
reliable fiscal norms and standards, to maximize service delivery. To this end, National Treasury
established minimum competencies for municipal officials, accounting officers, chief financial officers,
senior managers, other financial officers and supply chain management managers, in line with
Section 168 of the Municipal Finance Management Act. The MFMA also provides for the discharge
of certain functions and powers by political representatives in municipalities and for contract
management and reporting on the performance of external service providers appointed by
municipalities.
1.4.3 Local Government: Municipal Systems Act, No. 32 of 2000 (MSA)

7
The Municipal Systems Act (MSA) requires municipalities to develop an Integrated Development
Plan and an integral Performance Management System and to, in this process, set performance
indicators and targets, in consultation with the communities they serve. It further mandates
municipalities to monitor and review performance against the set indicators and targets, conduct
internal reviews, assessments and audits, and publish an annual report on their performance over
a specific period.
The Municipal Systems Act underpins the notion of developmental government, since it recognizes
local government as an integral agent in connecting the three spheres of government with the
communities it serves. It strives to bring about the social and economic upliftment of communities
through improved service delivery, by crafting a framework for the establishment of mechanisms and
processes to enhance performance planning and management, resource mobilization and
organizational change.
The Municipal Systems Act outlines the duties to be performed by political office-bearers, municipal
officials and the community. It converses on matters of human resources and public administration,
whilst prescribing community participation throughout, in support of a system of participatory
government.
The Municipal Systems Act also provides for the discharge of certain functions and powers by
political representatives in municipalities and for the establishment of entities by municipalities to
bring about effective and efficient service delivery. In terms of the Act, municipalities must ensure
that performance objectives and indicators are set for the municipal entities under their control and
that these form part of their multi-year business planning and budgeting, in line with the MFMA.
1.4.4 Local Government: Municipal Planning and Performance Management Regulations,
2001
The Local Government: Municipal Planning and Performance Management Regulations (2001) seeks
to enhance the implementation of performance management obligations imposed by legislation and
cultivate uniformity in the application of performance management within the sphere of local
government. The Regulations outline the details to be contained in municipalities’
Integrated Development Plans, as well as the process of amendment. They also provide for the
nature of performance management systems, their adoption, processes for the setting of

8
performance targets, monitoring, measurement, review and the internal auditing of performance
measurements. The Regulations conclude with a section on community participation in respect of
integrated development planning and performance management.
1.4.5 Local Government: Municipal Performance Regulations for Municipal Managers and
Managers directly accountable to Municipal Managers, 2006
In addition to the Local Government: Municipal Planning and Performance Management Regulations
(2001), the Local Government: Municipal Performance Regulations for Municipal Managers and
Managers Directly Accountable to Municipal Managers (2006) were promulgated to regulate the
performance management of municipal managers and managers directly accountable to municipal
managers. The Regulations cover the conclusion of performance agreements, performance
evaluation and the management of performance outcomes.
1.4.6 LOCAL GOVERNMENT: MUNICIPAL STRUCTURES AMENDED ACT, NO. 117 OF 1998
(HEREINAFTER REFERRED TO AS THE “STRUCTURES ACT”)
The Local Government: Municipal Structures Amended Act 117 of 1998 provides for the
establishment of municipalities and defines the various types and categories of municipalities in
South Africa. It also regulates the internal systems, structures and office-bearers of municipalities.
Chapter 4 of the Structures Act makes provision for the establishment of council structures and
committees to exercise oversight over the performance of municipalities, as well as ensure their
accountability.
1.4.7. INTERGOVERNMENTAL RELATIONS FRAMEWORK ACT, NO. 13 OF 2005
(IRFA)
The Intergovernmental Relations Framework Act regulates and facilitates the coordination and
implementation of policy and legislation between the organs of state within the three spheres of
government in South Africa. It promotes co-ordination and collaboration amongst the three spheres
of government in planning and implementation.
1.4.8. WHITE PAPER ON SERVICE DELIVERY (BATHO PELE 1998)

9
Section 195 of the Constitution enshrines the basic democratic values and principles governing
public administration. In 1997, The White Paper on Transforming Service Delivery translated these
constitutional principles and values into what is known today as the Batho Pele Principles, to achieve
improved service delivery in government. These principles are illustrated in Table 1.1 below.
PRINCIPLE DESCRIPTION
Consultation A Municipality’s citizens shall be consulted on service delivery levels and quality and be allowed to participate in decisions that affect the nature, type and quality of services to be delivered to them.
Service
Standards
Service standards should be set and communicated to citizens.
Access All citizens should have access to basic services.
Courtesy All citizens shall be treated with courtesy and consideration. Where service standards have not been met, an apology, explanation and remedial action shall be tendered.
Capacity As a developmentally oriented local government, municipalities must seek to enhance the skills, competencies and knowledge of
their administration, political office-bearers, entities and communities to achieve greater efficiency and effectiveness when delivering services.
Information Full and accurate information regarding services shall be provided to citizens.
Openness
Transparency
and Full and accurate information regarding municipal performance
matters shall be provided to citizens, using appropriate
channels of communication. Redress In implementing municipal projects and programmes, the
eradication of the inequalities of the past shall take priority. An apology, explanation and remedial action shall be tendered in instances where promised service delivery levels and standards are not being met.
Value for Money Services shall be provided economically a n d efficiently,
without compromising standards. TABLE 1.1: Batho Pele Principles
1.4.9 MUNICIPAL PROPERTY RATES ACT 6 OF 2004
The Municipal Property Rates Act 6 of 2004 seeks to regulate the powers of municipalities to levy
rates on property. Rates represent a critical source of own revenue for municipalities to achieve their
constitutional development objectives.
1.5 THE IDP WITHIN CONTEXT OF GLOBAL, REGIONAL, NATIONAL
PROVINCIAL PLANNING

10
The IDP should reflect the integrated planning and development intent of all spheres of government
relevant to a municipal geographic space. The effective implementation of the IDP can be attained
only if government across all spheres is committed to the common goal of rendering quality services;
hence the Inter-Governmental Relations Act seeks to enhance alignment between the spheres of
government. This section reflects the alignment of intergovernmental strategic objectives and
highlights key priority projects and programmes that will be implemented within the municipal space
during the five-year cycle of this IDP.
1.5.1 Global Perspective
1.5.1.1 Sustainable Development Goals
The following are the sustainable development goals, as set by the United
Nations (UNDP, 2015):
Goal 1. End poverty in all its forms everywhere
Goal 2. End hunger, achieve food security and improved nutrition and promote sustainable
agriculture
Goal 3. Ensure healthy lives and promote well-being for all at all ages
Goal 4. Ensure inclusive and equitable quality education and promote lifelong learning
opportunities for all
Goal 5. Achieve gender equality and empower all women and girls
Goal 6. Ensure availability and sustainable management of water and sanitation for all
Goal 7. Ensure access to affordable, reliable, sustainable and modern energy for all
Goal 8. Promote sustained, inclusive and sustainable economic growth, full and productive
employment and decent work for all.
Goal 9. Build resilient infrastructure, promote inclusive and sustainable industrialization and foster
innovation.
Goal 10. Reduce inequality within and among countries.
Goal 11. Make cities and human settlements inclusive, safe, resilient and sustainable.
Goal 12. Ensure sustainable consumption and production patterns
Goal 13. Take urgent action to combat climate change and its impacts
Goal 14. Conserve and sustainably use the oceans, seas and marine resources for sustainable
development

11
Goal 15. Protect, restore and promote sustainable use of terrestrial ecosystems, sustainably
Manage forests, combat desertification, and halt and reverse land degradation and halt
biodiversity loss.
Goal 16. Promote peaceful and inclusive societies for sustainable development, provide access to
justice for all and build effective, accountable and inclusive institutions at all levels.
Goal 17. Strengthen the means of implementation and revitalize the global partnership for stainable
development.
1.5.2 Regional Perspective
1.5.2.1 Africa Strategy 2063
The Africa Strategy 2063 seeks to achieve a prosperous Africa, based on inclusive growth and
sustainable development. It seeks to achieve an integrated continent, politically united and based
on the ideals of Pan Africanism and the vision of an African Renaissance. An Africa with a strong
cultural identity, common heritage, values and ethics, and a continent where development is people-
driven, unleashing the potential of its women and youth, among others, are the key focus areas of
the Africa Strategy 2063.
1.5.3 National Perspective
1.5.3.1. State of the Nation Address (SONA)
The following table indicates a summary of the state of the nation address action plan:
SUMMARY OF ACTIONS / COMMITMENTS FROM PRESIDENT RAMAPHOSA SONA ECONOMIC POLICY Appoint a Presidential Economic Advisory Council. It will draw on the expertise
and capabilities that reside in labour, business, civil society and academia.
JOBS Especially for youth
Jobs Summit within few months
Investment Conference within next three months
Launch Youth Employment Service Initiative next month to place unemployed youth in paid internships in companies across the economy and;
Create millions such internships in the next three years
Establish Youth Working Group
RE-INDUSTRIALIZE / STIMULATE MANUFACTURING
Strategic use of incentives and other measures
Localization programme for products designated for local manufacturing, clothing, furniture, water meters, etc. via our public procurement interventions.

12
TRANSFORMATION Support black industrialist, to build a new generation of black women producers that are able to build enterprises of significant scale and capability
Use competition polity to open markets to new black entrants
Invest in the development of townships and rural enterprises
INFRASTRUCTURE Assemble team to speed up implementation of new projects, particularly water projects, health facilities and road maintenance.
1.5.3.2 National Development Plan, Vision 2030
The National Development Plan (NDP) is a government-initiated plan aimed at eliminating
poverty and reducing inequality by 2030. The Plan presents a long-term strategy to increase
employment through faster economic growth, improvement in the quality of education, skills
development and innovation, and building the capability of the state to play a developmental
and transformative role. The Plan also focuses on upgrading public health facilities and
producing more health professionals, as well as infrastructure development, financed through
tariffs, public-private partnerships, taxes and loans, amongst other things.
1.5.3.3 Government Outcomes
The IDP is developed in line with the 12 Government Outcomes. Each of the Outcomes is
implemented through a delivery agreement, cutting across the three spheres of government.
The achievement of the Outcomes depends on concerted efforts from all key stakeholders
and spheres of government. The Medium-term Strategic Framework Outcomes for the 2014
- 2019 period is indicated as follows:
> Outcome1: Improved quality of basic education.
http://www.gov.za/sites/www.gov.za/files/outcome-1.pdf
> Outcome 2: A long and healthy life for all South Africans.
http://www.gov.za/sites/www.gov.za/files/outcome-2.pdf
> Outcome 3: All people in South Africa are and feel safe.
http://www.gov.za/sites/www.gov.za/files/outcome-3.pdf
> Outcome 4: Decent employment through inclusive economic
growth.
http://www.gov.za/sites/www.gov.za/files/Outcome%204%20Econo
my %20MTSF%20Chapter.pdf

13
> Outcome 5: A skilled and capable workforce to support an inclusive growth
path. http://www.gov.za/sites/www.gov.za/files/outcome5.pdf
> Outcome 6: An efficient, competitive and responsive economic infrastructure
network. http://www.gov.za/sites/www.gov.za/files/outcome6.pdf
> Outcome 7: Vibrant, equitable and sustainable rural communities with food security for
all. http://www.gov.za/sites/www.gov.za/files/outcome7.pdf
> Outcome 8: Sustainable human settlements and improved quality of household life.
http://www.gov.za/sites/www.gov.za/files/outcome-8.pdf
> Outcome 9: A responsive, accountable, effective and efficient local government
system. http://www.gov.za/sites/www.gov.za/files/outcome-9.pdf
> Outcome 10: Environmental assets and natural resources that are well protected and
continually enhanced. http://www.gov.za/sites/www.gov.za/files/outcome-10.pdf
> Outcome 11: Create a better South Africa and contribute to a better and safer
Africa and World. http://www.gov.za/sites/www.gov.za/files/outcome11.pdf
> Outcome 12: An efficient, effective and development oriented public service and an
empowered, fair and inclusive citizenship.
http://www.gov.za/sites/www.gov.za/files/outcome12.pdf
1.5.3.4 National Spatial Development Perspective (NSDP)
The objective of the National Spatial Development Perspective (NSDP) is to promote informed
economic investment profiling to guide regional growth and development planning within a socio-
economic framework. It therefore acts as an indicative planning tool for the three spheres of
government. The National Spatial Development Perspective also informs the Spatial Development
Framework of the Municipality.
1.5.3.5 Local Government Back to Basics Strategy

14
The Back to Basics Strategy is a national initiative aimed at ensuring that municipalities perform their
core mandate of delivering basic services to local communities, as enshrined in Chapter 7 of the
Constitution. The Back to Basics approach is based on five principles, which are:
Putting people first and engaging with the community;
Delivering basic services;
Good Governance;
Sound financial management; and
Building capabilities
The municipality has made a significant progress in infusing and integrating the strategic thrust of
the important programmes.
1.5.4 Provincial Perspective
1.5.4.1. State of the Province Address
The Premier of the Free State Provincial government presented his address with the following
commitments:
1.5.4.1.1. Social transformation
Education
The province will continue making resources available to ensure that children receive better
education. The province will also contribute resources towards higher fee free education.
ICT
There will be an ICT hub (skills academy) established in Maccauvlei for learners, students and
ICT practitioners
Health
In the same manner that government has treated HIV/AIDS, the same is planned for
cancer.
There will be cancer campaigns done in the next three months (April-June 2018).
There will be construction taking place for Kopano MDR unit in Welkom.

15
The Free State will be hosting the National Active Ageing Programme in Mangaung
Metropolitan Municipality.
In commemoration of the lives of Albertina Sisulu, the Free State Provincial government will
be erecting the statues of Albertina Sisulu and Fezile Dabi in Welkom and Parys.
As celebrations of the Centenary of President O.R Tambo and the centenary of the ANC,
stadiums will be built in the coming financial year in areas which include Thabong and
Kutlwanong for Matjhabeng Local Municipality.
Fourth Industrial Revolution
A Free Sate Youth Connect Summit will be held in partnership with BRICS blocks of
countries in September 2018.
The Provincial Government will support 500 000 leaners, youth and adults with ICT Skills
over the next 3 years.
There will be Nelson Mandela Tour arranged for the young people of the province on the
life of the former president.
Youth Unemployment Forums will be established throughout all towns of the province and
located within offices of the youth Development Officers at local government level.
Integrated human settlements
As part of integrated human settlements, the provincial department will install services in
K10 Odendaalsrus and Phokeng in Welkom which will be followed by building of houses.
1.5.4.1.2. Economic Transformation
International Trade and Investment promotion
The provincial government plans to have a Global Investors Trade Bridge for
investment purposes.
There is also a plan in partnership with the Department of Trade and Industry of Free State
Invest SA One Stop Shop.
Manufacturing and Industrialization
Again, the Department of Trade and Industry has agreed to partner with the province for financially
supporting black industrialists.
State procurement

16
In the process of implementing the PPPFMA, Municipalities are encouraged to procure from local
black, women businesses coming mainly from rural and townships. These businesses must
preferably be owned by people with disabilities.
SMMEs and Co-operatives
Increased allocation of funding for youth entrepreneurship, rural enterprises and township
economies.
Provincial government will receive 1200 learnership in different fields such as End User
Computing, Community House Building and Waste water reticulation.
Government will support black game farmers in partnership with established white game
farmers.
Government will continue to support MACUFE as the main tourist attraction strategy of the
province. Including in the tourism strategy will be the Free State Madeira Flower festival,
Ficksburg Cherry Festival and Food Festival.
The Expanded Public Works Programme will continue to receive support as it provides short
term employment to our unemployed youth, women and people with disabilities.
The township revitalization programme remains the provincial flagship programme and will
continue with implementation within 22 towns of the Free State province.
The Contractor Development programme will be implemented through the Departments of
DESTEA, Police, Roads and Transport as well as Public Works. The contractor Development
programme budget for 2018/2019 financial year has been put at R90million.
The grass cutting project will continue in the 2018/2019 financial with a budget of R33 million.
The land belonging to the state will be allocated to black enterprises for both residential,
business and agricultural purposes.
The Free State province intends to commercialise 50 black farmers from 2017/2018 until
2021/2022. The commercialisation process will be achieved through a system called
Comprehensive Agricultural Support Programme (CASP) in partnership with Land Bank,
IDC, DTI and Commodity Groups via Operation PHAKISA.
1.5.4.1.3. Peace and stability
The province will be engaged with conducting of Community Indabas, Taxi Indabas, and
Driving School Indabas.
There will also be child road safety education and door-to-door campaigns.
17
1.5.4.1.4. Capacity of the state
There is a call to Municipalities to employ capable people to strengthen service delivery.
Government must continue to provide capacity to internal staff to increase capacity through
skills transfer and knowledge empowerment.
We must work toward improving audit outcomes. In some instances, the provincial treasury
has been requested to assist and are ready to do just that.
The provincial government endorses the Small-Town Regeneration Programme by South
African Local Government Association (SALGA)
The partnership between the provincial government and SALGA shall implement the Karoo
Regional Development Initiative (KDI), regional economic development programme involving
four provinces of Western Cape, Eastern Cape, Northern Cape and Free State. 33
municipalities, including Matjhabeng have been earmarked to form part of this initiative.
1.5.4.2 Free State Growth and Development Strategy
The provincial government of Free State has developed a Free State Provincial Growth and
Development Strategy (PGDS) Free Sate Vision 2030. The PGDS is the fundamental policy
framework for the Free State Provincial Government. It is the embodiment of the broad strategic
policy goals and objectives of the province in line with national policy objectives.
The Strategy addresses the key and most fundamental issues of development, spanning the social,
economic and political environment. It constantly takes into account annual provincial priorities and
sets broad targets in terms of provincial economic growth and development, service delivery and
public service transformation. The Strategy has identified six priority areas of intervention by the
province, namely;
1. Inclusive Economic growth and sustainable job creation;
2. Education innovation and skills development
3. Improved quality of life
4. Sustainable Rural Development
5. Efficient Administration and Good Governance
6. Building social cohesion

18
FSGDS identifies drivers, strategies and measurable performance targets (five-year, ten-year,
fifteen year and twenty-year targets) to ensure that there is performance in relation to the identified
six priority areas. The Free State Growth and Development Strategy plays an important role in
shaping the Municipality’s IDP. A sustainable future for the Free State rests on a people-centred
development to achieve five related goals.

19

20
1. INTRODUCTION
This chapter presents the status quo analysis of the Matjhabeng Local Municipality. The situational
analysis and statistics presented in this chapter reveal the developmental challenges (such as
poverty, unemployment and service delivery backlogs) facing the Municipality. This analysis is
crucial in providing the Municipality and its social partners with information in respect of local socio-
economic trends and patterns. The programmes and projects captured in the IDP seek to address
the developmental challenges identified through the situational analysis.
Matjhabeng Local Municipality is situated in the Lejweleputswa District Municipality in the Free State.
It is bound by the Nala Local Municipality to the north, Masilonyana Local Municipality to the south,
Tswelopele Local Municipality to the east and Moqhaka Local Municipality to the west. Matjhabeng
represents the hub of mining activity in the Free State province.
1. Demographics
In this section, information on population size, composition and structure of Matjhabeng Local
Municipality will be provided. A caution had to be provided upfront that while the information for
Statistics South African 2016 Community Survey estimates are used much focus is still on 2011
Census for well-known reason.

21
2.1 Population Size
Table 2.1.1: Population and population growth rates per municipality in Lejweleputswa
district – Census 1996, 2001, 2011 and 2016 Community Survey estimates.
Municipality
Total population
Population
Growth Rate
(1996 - 2001)
Total
population
Population
Growth
Rate (2001 -
2011)
Total
population Population
Growth
Rate (2011-
2016)
Census
1996
Census
2001
Census
2011
Community
Survey 2016
Masilonyana 65851 64409 -0.44 63334 -0.17 66 080 0.010
Tokologo 26767 32455 4.25 28986 -1.07 29150 0.008
Tswelopele 51648 53714 0.80 47625 -1.13 47 370 -0.001
Matjhabeng 476763 408170 -2.88 406461 -0.04 428843 0.012
Nala 82141 98264 3.93 81220 -1.73 78 520 -0.008
Lejweleputswa 703170 657012 -1.31 627626 -045 649 964 0.008
Table 2.1.1 above indicates total population of local municipalities in Lejweleputswa district for the
periods 1996 – 2016 together with population growth rates respectively. For two consecutive periods
1996 – 2001 and 2001 - 2011, Matjhabeng Local Municipality experience a negative growth of 2.88%
and 0.04% respectively. All municipalities in the district experienced a negative growth for the period
2001 – 2011 and Matjhabeng was the lowest with a negative growth of 0.04% followed by
Masilonyana with 0.17%. Interestingly the community survey of 2016 demonstrate growth of 0.12%.
Figure 2.1.1: Percentage distribution of Lejweleputswa population per region – CS
2016
Masilonyana13% Tokologo
3%
Tswelopele6%
Matjhabeng63%
Nala15%
Lejweleputswa DM Population 2016

22
Figure 2.1.2 below graphically display population growth rates in Lejweleputswa district per
municipality wherein none of the municipalities experienced a positive growth for the period 2001 –
2011 including Lejweleputswa district.
Figure 2.1.3: Percentage distribution of Lejweleputswa population per municipality –
Census 1996, 2001 and 2011
Masilonyana Tokologo Tswelopele Matjhabeng NalaLejweleputsw
a
Growth Rate (1996 - 2001) -0,44 4,25 0,80 -2,88 3,93 -1,31
Growth Rate (2001 - 2011) -0,17 -1,07 -1,13 -0,04 -1,73 -0,45
-4,00
-3,00
-2,00
-1,00
0,00
1,00
2,00
3,00
4,00
5,00
%
Masilonyana Tokologo Tswelopele Matjhabeng Nala
Census 1996 9,4 3,8 7,3 67,8 11,7
Census 2001 9,8 4,9 8,2 62,1 15,0
Census 2011 10,1 4,6 7,6 64,8 12,9
0,0
10,0
20,0
30,0
40,0
50,0
60,0
70,0
80,0
%

23
Figure 1.1.2 indicates that Matjhabeng local municipality contributed more than half the population
of Lejweleputswa district with percentage shares of 67.8%, 62.1% and 64.8% for 1996, 2001 and
2011 census years respectively.
Table 1.1.2: Total population, number of households and average household size
per region in Matjhabeng Local Municipality – CS2016
Source: Stats SA, CS 2016
Table 1.1.2 shows total population, number of households and average household size of
Matjhabeng local municipality per region from Census 2011. Average household size in Matjhabeng
local municipality was found to be 3 whereas only that of Allanridge and Matjhabeng NU were the
only regions with an average household size more than that of municipality.
Figure 1.1.3: Percentage distribution of Matjhabeng population per region – CS 2016
Regions Population Households
Average
Household
Size
Allanridge 19337 4854 4
Odendaalsrus 63743 18720 3
Welkom 211010 65878 3
Virginia 91963 27724 3
Ventersburg 11260 3406 3
Matjhabeng NU 9148 2613 4
Matjhabeng 428843 149021 3
4,8%
15,7%
51,9%
22,6%2,8%
2,3%
Allanridge
Odendaalsrus
Welkom
Virginia
Ventersburg
Matjhabeng NU

24
Figure 2.1.3 indicates percentage share of Matjhabeng population per region. Welkom contributes
more than 50% of the municipality population with a percentage share of 51.9% followed by Virginia
with 22.6%. Matjhabeng NU (Farms, small holdings, etc) and Ventersburg were the least
contributors with a percentage share of 2.3% and 2.8% respectively.
Figure 2.1.4: Percentage distribution of Matjhabeng population and households per
region – CS 2016
Figure 2.1.4 above show percentage distribution of Matjhabeng population and households per
region. Same as population percentage share, households in Matjhabeng contribute more than 50%
of total number of households with 53.5% and its more than population percentage share by 2.4%
i.e. household’s contribution is more than population contribution.
2.2 Population Composition
Figure 2.2.1: Percentage distribution of Matjhabeng population per region by gender – CS
2016
Allanridge Odendaalsrus Welkom Virginia VentersburgMatjhabeng
NU
Population 4,8 15,7 51,9 22,6 2,8 2,3
Households 3,9 15,2 53,5 22,5 2,8 2,1
0,0
10,0
20,0
30,0
40,0
50,0
60,0
%
Allanridge Odendaalsrus Welkom Virginia VentersburgMatjhabeng
NUMatjhabeng
Male 49,0 49,0 49,8 49,4 47,7 53,8 49,6
Female 51,0 51,0 50,2 50,6 52,3 46,2 50,4
42,0
44,0
46,0
48,0
50,0
52,0
54,0
56,0
%

25
Table 2.2.1 above indicates Matjhabeng population distribution per region by gender wherein in all
regions except Matjhabeng NU, the population comprised of more females than males. On average,
Matjhabeng local municipality had 50.4% of females and 49.6% of males. In Matjhabeng NU, there
found to be more males than females with 53.8% and 46.2% respectively.
Figure 2.2.2: Sex ratio in Matjhabeng local municipality per region – CS 2016
Figure 2.2.2 above displays sex ratio of Matjhabeng local municipality per region which supplement
information provided on figure 2.2.1 above. Only in Matjhabeng NU, there found to be predominance
of males over females i.e. for every 100 females there found to be 116 males.
2.3 Population Groups
Figure 2.3.1: Percentage distribution of Matjhabeng population per region by population
groups – CS 2016
Allanridge Odendaalsrus Welkom Virginia VentersburgMatjhabeng
NUMatjhabeng
Sex ratio 96 96 99 98 91 116 98
0
20
40
60
80
100
120
140
Sex
rati
o
Allanridge Odendaalsrus Welkom Virginia VentersburgMatjhabeng
NUMatjhabeng
Black African 94,2 93,2 85,1 88,7 92,6 85,1 87,8
Coloured 0,3 0,3 3,7 0,6 0,6 1,0 2,2
Indian or Asian 0,2 0,3 0,4 0,4 0,4 0,2 0,4
White 5,3 6,2 10,8 10,3 6,4 13,8 9,6
0,010,020,030,040,050,060,070,080,090,0
100,0
%

26
Figure 2.2.3 above indicates percentage distribution of Matjhabeng population by population groups
wherein in all regions including Matjhabeng, black African population contributes more than 85% of
the population followed by white population. Moreover, Matjhabeng NU has the highest proportion
of white population with 13.8% followed by Welkom and Virginia with 10.8% and 10.3% respectively.
2.4 Functional Age Groups
Figure 2.4.1: Percentage distribution of Matjhabeng population per region by
functional age groups - CS 2016
Figure 2.4.1 above indicates population distribution of Matjhabeng local municipality per region by
functional age groups. The information is sourced from Census 2011 wherein in all regions including
Matjhabeng local municipality, proportion of population aged between 15 and 34 years (Youth) is
more than that of 0 – 14 (children), (35 – 64) elderly and (65 +) older persons.
Figure 2.4.2: Dependency ratio in Matjhabeng Local municipality per region – CS2016
Allanridge Odendaalsrus Welkom Virginia VentersburgMatjhabeng
NUMatjhabeng
0 - 14 31,6 29,0 25,9 28,1 31,3 25,2 27,3
15 - 34 36,5 36,4 36,9 36,4 36,7 36,8 36,7
35 - 64 27,0 29,8 32,7 30,7 26,1 34,0 31,4
65 + 4,9 4,8 4,5 4,8 5,9 3,9 4,7
0,05,0
10,015,020,025,030,035,040,0
%

27
Figure 2.4.2 above indicates dependency ratios of regions within Matjhabeng local municipality.
Population in Matjhabeng NU has a larger working age group i.e. 15 – 64 years as compared to
Allanridge, Odendaalsrus and Ventersburg with the lowest dependency ratio of 41.1%. Matjhabeng
local municipality has a low dependency ratio of 46.9% which implies that the municipality has a
large portion of working age group (15 – 64 years).
2.5 Age Structure
Figure 2.5.1: Age structure of Matjhabeng local municipality – CS2016
Figure 2.5.1 above indicates population pyramid of Matjhabeng local municipality. From the
pyramid above, Matjhabeng municipality has a young population and most of this young population
is youth age group 20 – 24.
3. Labour Market
AllanridgeOdendaalsr
usWelkom Virginia Ventersburg
MatjhabengNU
Matjhabeng
Dependency ratio 57,4 51,1 43,7 49,0 59,3 41,1 46,9
0,0
10,0
20,0
30,0
40,0
50,0
60,0
70,0
%
15,0 10,0 5,0 0,0 5,0 10,0 15,0
0 - 4
10 - 14
20 - 24
30 - 34
40 - 44
50 - 54
60 - 64
70 - 74
80 - 84
%
Age
Female Male

28
In this section, in-depth analysis of employment status of Matjhabeng local municipality population
aged between 15 and 64 years will be highlighted.
Figure 3.1: Percentage distribution of Matjhabeng population by employment status and age
groups – Census 2001 and 2011
From the figure above, Figure 3.1, employed youth population increased from 21.6% in 2001 to
26.4% in 2011 whereas the unemployed youth decreased from 32.8% in 2001 to 26.1% in 2011. As
for adults (35 – 64 years) the employed and unemployed population decreased respectively from
48.8% and 26.6% in 2001 to 47.2% and 15.3% in 2011. On average (15 – 64 years) the employed
population increased from 34.4% in 2001 to 36.0% in 2011 whereas the unemployed population
decreased from 29.9% to 21.2%. Not economically active population increased in all age groups
between 2001 and 2011.
Figure 3.2: Unemployment rate in Matjhabeng – Census 2001 and 2011
Census 2001 Census 2011 Census 2001 Census 2011 Census 2001 Census 2011
15 - 34 Years 35 - 64 Years 15 - 64 Years
Employed 21,6 26,4 48,8 47,2 34,4 36,0
Unemployed 32,8 26,1 26,6 15,3 29,9 21,2
Not economically active 45,5 47,4 24,6 37,4 35,7 42,8
0,0
10,0
20,0
30,0
40,0
50,0
60,0
%

29
From figure 3.2 above, on average the unemployment rate in Matjhabeng decreased from
46.5% in 2001 to 37.0% in 2011 whereas for youth and adults population respectively
decreased from 60.3% in 2001 to 49.7% in 2011 and 35.3% in 2001 to 24.5% in 2011.
Figure 3.3: Unemployment rate in Matjhabeng per region – CS 2016
Figure 3.3 above indicates municipal unemployment rate per region according to census
2011 results. From the figure above, the region with the highest youth unemployment rate
is Ventersburg with 62.4% and the lowest was found to be of Matjhabeng NU with 16.2%.
Adult unemployment rate was the highest in Ventersburg at 39.0% followed by Allanridge
and Odendaalsrus with 33.5% and 31.1% respectively. On average, Ventersburg had the
highest unemployment rate of 52.2% followed by Allanridge with 47.7%. Again, Matjhabeng
NU had the lowest unemployment rate of 11.3%.
15 - 34 Years 35 - 64 Years 15 - 64 Years
Census 2001 60,3 35,3 46,5
Census 2011 49,7 24,5 37,0
0,010,020,030,040,050,060,070,0
Un
em
plo
ymen
t ra
te
Allanridge Odendaalsrus Welkom Virginia VentersburgMatjhabeng
NUMatjhabeng
15 - 34 Years 59,8 59,3 47,4 48,9 62,4 16,2 49,7
35 - 64 Years 33,5 31,1 22,5 24,8 39,0 6,8 24,5
15 - 64 Years 47,7 45,5 34,6 36,6 52,2 11,3 37,0
0,0
10,0
20,0
30,0
40,0
50,0
60,0
70,0
Un
em
plo
yme
nt
rate

30
Figure 3.4: Percentage distribution of employed population by sector and age groups
in Matjhabeng local municipality – CS 2016
From figure 2.4 above, highest employed population in informal sectors in Matjhabeng is
youth with 12.1% and the highest employed population in private households are adults
aged between 35 and 64 years with 13.3%.
Figure 3.5: Percentage distribution of employed population by sector and age groups
per region in Matjhabeng local municipality – CS 2016
Figure 3.5. above indicates employed population in Matjhabeng local municipality per
region and type of sector. From the figure above, all the regions have more than 50% of
employed population in formal sector and Ventersburg has the lowest proportion with
57.8%. Allanridge has the lowest proportion of population working in informal sector and
Ventersburg has the highest proportion of population working in private household.
4. Levels of Education
In the formalsector
In the informalsector
Private household Do not know
15 - 34 Years 74,0 12,1 11,2 2,6
35 - 64 Years 74,8 10,0 13,3 1,9
15 - 64 Years 74,5 10,8 12,5 2,2
0,010,020,030,040,050,060,070,080,0
%
Allanridge Odendaalsrus Welkom Virginia VentersburgMatjhabeng
NUMatjhabeng
In the formal sector 78,7 76,6 75,5 75,1 57,8 60,9 74,8
In the informal sector 7,2 9,0 9,9 9,5 14,4 18,4 10,0
Private household 12,3 12,2 12,8 13,5 26,5 19,0 13,3
Do not know 1,8 2,2 1,9 1,9 1,3 1,7 1,9
0,020,040,060,080,0
100,0
%
31
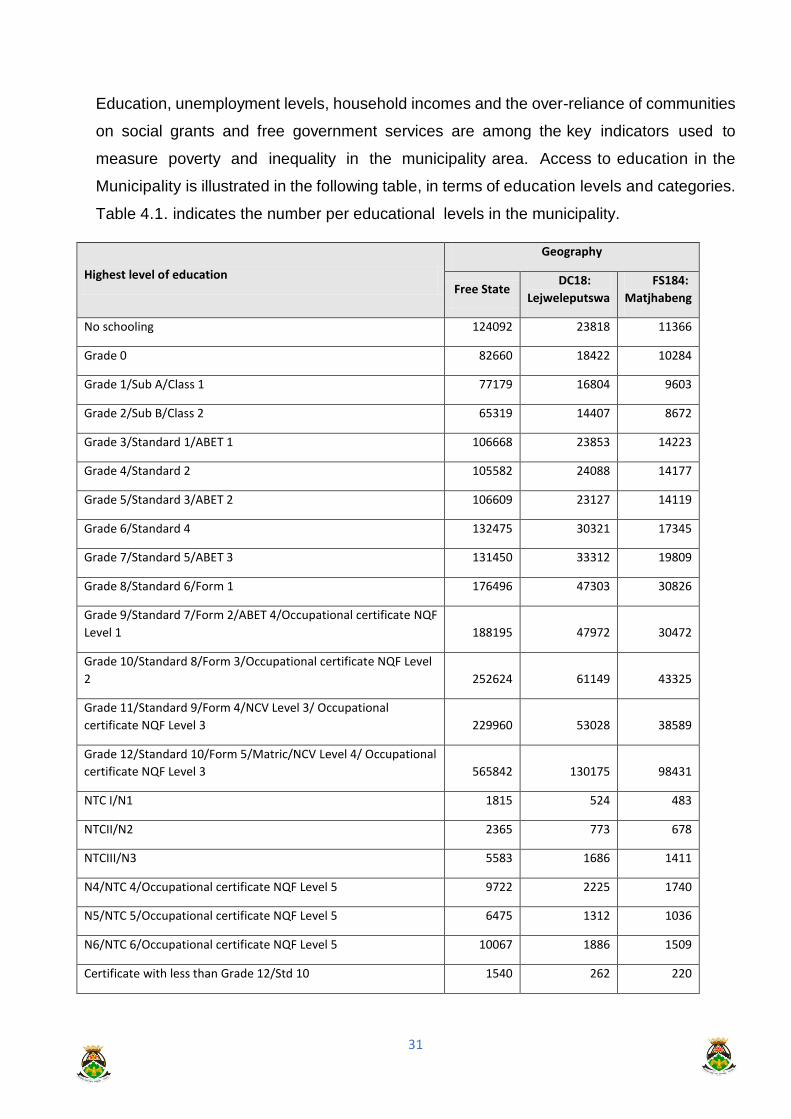
Education, unemployment levels, household incomes and the over-reliance of communities
on social grants and free government services are among the key indicators used to
measure poverty and inequality in the municipality area. Access to education in the
Municipality is illustrated in the following table, in terms of education levels and categories.
Table 4.1. indicates the number per educational levels in the municipality.
Highest level of education
Geography
Free State DC18:
Lejweleputswa
FS184:
Matjhabeng
No schooling 124092 23818 11366
Grade 0 82660 18422 10284
Grade 1/Sub A/Class 1 77179 16804 9603
Grade 2/Sub B/Class 2 65319 14407 8672
Grade 3/Standard 1/ABET 1 106668 23853 14223
Grade 4/Standard 2 105582 24088 14177
Grade 5/Standard 3/ABET 2 106609 23127 14119
Grade 6/Standard 4 132475 30321 17345
Grade 7/Standard 5/ABET 3 131450 33312 19809
Grade 8/Standard 6/Form 1 176496 47303 30826
Grade 9/Standard 7/Form 2/ABET 4/Occupational certificate NQF
Level 1 188195 47972 30472
Grade 10/Standard 8/Form 3/Occupational certificate NQF Level
2 252624 61149 43325
Grade 11/Standard 9/Form 4/NCV Level 3/ Occupational
certificate NQF Level 3 229960 53028 38589
Grade 12/Standard 10/Form 5/Matric/NCV Level 4/ Occupational
certificate NQF Level 3 565842 130175 98431
NTC I/N1 1815 524 483
NTCII/N2 2365 773 678
NTCIII/N3 5583 1686 1411
N4/NTC 4/Occupational certificate NQF Level 5 9722 2225 1740
N5/NTC 5/Occupational certificate NQF Level 5 6475 1312 1036
N6/NTC 6/Occupational certificate NQF Level 5 10067 1886 1509
Certificate with less than Grade 12/Std 10 1540 262 220

32
Diploma with less than Grade 12/Std 10 4104 1071 682
Higher/National/Advanced Certificate with Grade
12/Occupational certificate NQF 15532 3004 2280
Diploma with Grade 12/Std 10/Occupational certificate NQF
Level 6 38554 6691 4689
Higher Diploma/Occupational certificate NQF Level 7 17518 3733 2575
Post-Higher Diploma (Master’s 11807 2720 2098
Bachelor’s degree/Occupational certificate NQF Level 7 31348 5449 3778
Honours degree/Post-graduate diploma/Occupational certificate
NQF Level 8 15423 3457 2582
Master’s/Professional Master’s at NQF Level 9 degree 4932 621 409
PHD (Doctoral degree/Professional doctoral degree at NQF Level
10) 3198 350 295
Other 8822 1626 898
Statssa: CS 2016
4. Levels of Service
5.1. Potable Water
Matjhabeng local Municipality is a water services authority in terms of Water Services Act, No: 108
of 1997. Sedibeng Water is water services provider in terms of the same Act. Matjhabeng has a well-
established Water infrastructure consists mostly of reservoirs (4) and 99 Km of bulk pipelines of
Sedibeng Water, 5 pump stations, 1,540,862 m of reticulation pipeline. More than 1/3 of reticulation
system is more than 40 years old and 36% of water reticulation consists of old AC pipe which is
prone to damage. Sedibeng Water is the water service provider in terms of Water Service Act, and
supply mainly the Goldfields region and the mines with water from the Vaal River, Bulkfontein near
Bothaville and to a lesser extent from the Sand River.
Main reservoirs are east of Allanridge, in Welkom, north and south of Virginia. Pump stations are
east of Allanridge and at Virginia where purification plant exist. Other water infrastructure resources
were constructed by the Department of Water Affairs including dams in Allemanskraal and canals
serving the Sand – Vet irrigation scheme.

33
Matjhabeng Local Municipality is confronted by numerous challenges that relates to the provision
these services. They range from planning, coordination, financing, execution and reporting. The
absence of a comprehensive Water Services Development Plan (WSDP) in the municipality is an
indictment.
The table below illustrate that Matjhabeng has over the years incrementally reduced the level of no
access to water and at the same time expanded household access to both RDP water standard and
higher level of water access (piped tap water inside yard and dwelling).
Over the years the quality of drinking water provided to citizens has improved. This is reflected in
our Blue-drop report as compiled by the Department of Water Affairs (DWS). According to DWS
Blue-Drop Certification ratings Matjhabeng scored 79.91% in 2012 assessment.
Figure 5.1.1: Percentage distribution of households in Matjhabeng local municipality with access to piped
water – Census 1996, 2001 and 2011
Figure 5.1.2: Percentage distribution of households in Matjhabeng local municipality with
access to piped water inside dwelling/yard by type of toilet facility per region – CS 2016
Piped waterinside thedwelling
Piped waterinside the yard
Piped water fromaccess point
outside the yard
No access topiped water
Census 1996 53,7 32,4 11,4 2,5
Census 2001 25,9 45,5 23,9 4,6
Census 2011 54,6 36,2 7,1 2,0
0,010,020,030,040,050,060,0
%

34
The figure above indicates households with access to piped water inside dwelling/yard by type of
toilet facility. Highest proportion of households with flush toilets is 99.2% in Allanridge followed by
Odendaalsrus and Ventersburg with 98.7% and 96.7% respectively. Matjhabeng NU has the highest
proportion of 37.1% households with pit toilet usage followed by Welkom with 9.1%. As for bucket
toilets, Virginia has the highest proportion of 10.8% followed by Matjhabeng NU with 3.1%. On
average, Matjhabeng local municipality has a proportion of 88.9% of households with flush toilets.
Response to COVID-19 pandemic
During the period between April and May 2020, the Municipality received tankers and JoJo tanks
from the Department of Water and Sanitation at national level to address water issues in informal
settlement areas within the Municipality. Potable water supply to informal settlement areas has been
improved through this national intervention. To sustain the supply of potable water to these informal
settlement areas the municipality must ensure that these JoJo tanks are protected from vandalism
as has been the case of late. People steal the steel pipe sections of water supply system to the
detriment of continued and sustained potable water supply to these areas. In the plans to respond
to COVID-19 interventions, it is expected that the Municipality must develop intervention
mechanisms to alleviate the challenges of interrupted potable water supply.
5.2. Sanitation
AllanridgeOdendaalsru
sWelkom Virginia Ventersburg
MatjhabengNU
Matjhabeng
Flush toilet 99,2 98,7 87,0 87,7 96,7 34,3 88,9
Chemical toilet 0,0 0,1 0,1 0,0 0,1 1,4 0,1
Pit toilet 0,2 0,1 9,1 0,3 0,2 37,1 5,5
Bucket toilet 0,1 0,3 1,4 10,8 0,5 3,1 3,4
Other 0,5 0,8 2,4 1,2 2,5 24,2 2,2
0,020,040,060,080,0
100,0120,0
%

35
The second generation of democratic local government was mandated to among others to improve
levels of sanitation and eradicate bucket system as form of sanitation. In this regard these mandates
were fulfilled. However, challenges were identified, among others were poor project planning,
execution and reporting. This has led to a particular number of households still not able to use proper
sanitation thus reverting back to old system.
Matjhabeng has 12 wastewater treatment works (1 Decommission), 49 sewage pump stations and
1,255,501m of reticulation infrastructure. More than 1/3 of reticulation system is more than 40 years
old. Reticulation consists mostly of vitrified clay pipes (prone to roots penetration and joint
dislocation), old AC pipes used mainly on rising mains and frequent bursts have been reported.
The other challenge that came with expansion of service has been the capacity of wastewater
Treatment plants and pump stations. It is also important to note that one of the major challenges is
a general decay of infrastructure due to its age, this leads to regular sewage spillage due to blockage
and pipe brakeage.
Response to COVID-19 pandemic
It would be advisable for the Municipality to put in the sanitation plans for 2020/2021 refurbishment
of wastewater treatment works to ensure that we provide clean environment for our people. Areas
in our Municipality that have consistent challenges are Kutloanong, Whites, Rheederspark area as
well as Lakeview areas. Odendaalsrus has a problem of the replacement of line in Van der Vyver
and this plan has been devised but never implemented due to financial challenges.
It would also be expected that the Municipality plans around replacement of pump stations
throughout the affected areas. Almost 11% of households still use buckets as a form of sanitation to
the detriment of their livelihoods. These forms of sanitation have long been discarded but due to
poor workmanship in some areas, people resort to this form of sanitation because the bulk sewer
line keeps blocking. These are areas to be tackled head-on and as part of our plans, we need to
prioritize them in our plan.
The other serious challenge that causes blockages is the ageing infrastructure as the clay pipes are
too old. There has been a programme to replace them with PVC pipes and expectation would be to
continue replacing them depending on affordability and the acceleration of revenue enhancement
strategy to get more money to enable implementation of these programmes.
Figure 5.2.1: Percentage distribution of households in Matjhabeng local municipality by type
of toilet facility per region – CS 2016

36
Figure 5.2.2: Percentage distribution of households in Matjhabeng local municipality with no
access to piped water by type of toilet facility per region – CS 2016
The figure above indicates that, proportion of 84.4% households in Ventersburg with no access to
piped water use other forms of toilet facilities followed by Allanridge and Odendaalsrus with 58.3%
and 54.9% respectively. On average, Matjhabeng local municipality has 37.5% proportion of
households which uses other forms of toilet facilities followed by 24.7% proportion of households
with flush toilets. Proportion of households with no access to piped water and use pit toilets is higher
in Welkom with 39.2 followed by Matjhabeng NU with 37.1%. On average Matjhabeng local
municipality is at 21.7% proportion of households with pit toilet usage and has no access to piped
water.
Figure 5.2.3: Percentage distribution of households in Matjhabeng local municipality with
access to piped water on a community stand by type of toilet facility per region – CS 2106
Allanridge Odendaalsrus Welkom Virginia VentersburgMatjhabeng
NUFS184:
Matjhabeng
Flush toilet 98,7 90,3 80,1 82,7 84,9 24,3 81,9
Chemical toilet 0,0 0,1 0,1 0,0 0,1 1,7 0,1
Pit toilet 0,2 2,2 13,8 1,2 0,5 40,5 8,9
Bucket toilet 0,1 3,9 1,5 13,1 1,6 2,6 4,4
Other 1,1 3,6 4,6 3,0 12,9 30,8 4,7
0,020,040,060,080,0
100,0120,0
%
Allanridge Odendaalsrus Welkom Virginia Ventersburg Matjhabeng NU Matjhabeng
Flush toilet 41,7 27,8 30,9 19,0 13,3 11,7 24,7
Chemical toilet 0,0 0,0 0,0 0,5 0,0 0,4 0,2
Pit toilet 0,0 0,0 39,2 1,2 0,0 37,1 21,7
Bucket toilet 0,0 17,3 3,0 39,6 2,2 0,4 16,0
Other 58,3 54,9 26,9 39,6 84,4 50,4 37,5
0,010,020,030,040,050,060,070,080,090,0
%

37
From the figure above, Figure 5.2.2, Welkom has the highest proportion of 65.8% households with
pit toilet which access water from communal taps followed by Matjhabeng NU and Virginia with
50.3% and 23.7% respectively. On average Matjhabeng local municipality is at 47.1% of households
with pit toilets and access water from communal taps. Proportion of households with bucket toilet
usage is higher in Virginia with 47.0% followed by Odendaalsrus and Ventersburg with 34.1% and
9.1% respectively.
5.3. Road and Transportation
The municipality has well established road and transportation infrastructure. The main challenge for
over the years has been maintenance of such infrastructure due to escalating cost due to its age.
This has major implication to the budget of the municipality as whole.
Our Municipality consist of the following types of roads: gravel and surfaced (tar and paved roads).
The municipality has a total length of 156.13km inclusive of provincial, private and municipal road,
of which 51km is gravel and 105.13 km is unsurfaced. Mostly in our Towns roads are surfaced and
in townships roads are graveled but gradually township roads are now being given attention by
upgrading from gravel to surfaced road using internal and external resources (i.e. MIG and Public
Works funds).
The public transport system operating in Matjhabeng is privately owned taxis. The rail network that
passes through Hennenman, and Virginia is mainline service linking the Municipality with Gauteng,
Kwazulu Natal, Eastern Cape and the Western Cape. However, there is local railway network mainly
servicing mines. The local railway network remains property of the municipality. Matjhabeng remains
the main route of national bus services, however there are no bus service operating locally in
Matjhabeng Municipality except mine workers’ dedicated transport.
Allanridge Odendaalsrus Welkom Virginia Ventersburg Matjhabeng NU Matjhabeng
Flush toilet 77,8 22,8 6,4 11,4 7,1 3,7 10,5
Chemical toilet 0,0 0,1 0,3 0,2 0,0 3,0 0,4
Pit toilet 0,0 21,2 65,8 23,7 3,4 50,3 47,1
Bucket toilet 0,0 34,1 1,7 47,0 9,1 2,4 14,4
Other 22,2 21,8 25,9 17,6 80,3 40,7 27,6
0,010,020,030,040,050,060,070,080,090,0
%

38
Response to COVID-19 pandemic
The Municipality has an agreement with local mining using the road infrastructure to upgrade our
specific road networks. This process started in the current financial year and is continuing. There
are those inaccessible roads in townships that must also receive attention from the Municipality.
In March 2019, the Municipality was hit by floods and communities were badly affected in the
process. Reparations were done and it was once off. The Municipality must develop a plan to ensure
that the situation is catered in case recurs. We need to have a road master plan with budget to
ensure that all prioritized and affected road networks are attended to as a matter of urgency.
5.4. Electricity and Energy
The bulk electrical network is well established around the Matjhabeng area. Eskom serves all mines
and all townships in the municipal area and thus there is sufficient bulk infrastructure available to
serve the whole area. Main challenge however remains an aging electrical infrastructure in particular
in towns where the municipality is provider. However, a change in cost recovery and their
subsidization policy has made it very expensive to electrify the rural areas, and these include farms
and farming communities who need such basic power support.
Matjhabeng Local Municipality will develop the Energy Resource Plan to guide and address energy
needs and that will be aligned with the national plan. The Municipality is trying level best to decrease
its carbon footprint thus moving towards green economy.
5.4.1. Household Energy/ Fuel Sources
Province,
District and
Local
municipality
Household access to electricity
In-
house
convent
ional
meter
In-house
prepaid
meter
Connected
to another
source
which
household
pays for
(e.g. con
Connected
to another
source
which
household
is not
paying for
Generator
Solar
home
syste
m
Batter
y Other
No
access to
electricity
Total
Free State 108973 761009 17676 2466 209 992 179 4786 50349 946638
DC18:
Lejweleputswa 34255 167983 4449 623 30 156 106 1285 10126 219014

39
FS181:
Masilonyana 2803 17890 477 87 - - 26 134 1385 22802
FS182:
Tokologo 1533 7342 203 75 - 39 - 79 561 9831
FS183:
Tswelopele 1147 10864 923 118 - - - 33 621 13705
FS184:
Matjhabeng 25575 114481 2421 235 30 87 80 388 5726 149021
FS185:
Nala 3198 17407 425 109 - 30 - 652 1833 23653
The national electricity crises of 2010 and the resultant effects on South African residents and the
economy has highlighted how highly reliant we are on electricity as a source of energy. Government
has committed to developing measures to promote energy saving, reduce energy costs to the
economy, and reduce the negative impact of energy use on the environment.
The tables below illustrate that as a locality we are overly dependent on electricity as a source of
energy for lighting, cooking and heating. In fact, the statistics reflect an increase of electricity as
energy source in that the use electricity for lighting has since increased towards universal coverage.
In part this can be attributed to the fact that with the gradual eradication of electrification backlogs
through the household electrification programme, the number of people in our electricity network has
increased. On the other hand, this display the lack of usage of alternative source of energy to fulfil
our energy needs.
Figure 3.4: Percentage distribution of households in Matjhabeng local municipality by source
of energy for lighting per region – CS 2016

40
Response to COVID-19 pandemic
One of the causes of more infections is that we are in a cold season in South Africa-winter. We are
expected to ensure that there is no electricity disruptions as a result of vandalism as much as is
practically possible. We know as a Municipality that we are a target of zama zama activities
throughout the Municipal area. Worst hit areas we know of are Bronville, Rheederspark,
Odendaalsrus, Thabong and some sections of Kutloanong. These are hotspot areas that need
attention. In some areas, there is practical overloading of the transformers due to illegal connections
and the Municipality is obliged to replace such equipment as and when the problem occurs. It would
be expected to have money set aside to cater for eventual dysfunctioning of transformers in the
Municipality.
4.4. Waste Management
The estimated population served by the Municipality is approximately 428 843 (2016 StatsSA). Out
of an estimated 131 626 households, 126 709 households currently receive refuse removal services,
representing 96% of the current population; of these, # households receive Free Basic Refuse
Removal (FBRR) service, representing # % of households served. All services are coordinated by
the Municipal Solid Waste Management Division, with the main office in Welkom and complemented
by Eastern and Western regional offices. The service rendered extends to all the proclaimed
townships, un-proclaimed townships and to some extent to the farms as the need arises. Currently
there is four permitted municipal landfill site in the MLM area. In addition to the landfill sites, the
Matjhabeng Local Municipality has one transfer station in Virginia. It should be noted that four
additional privately-owned landfill sites exist within the municipal boundaries mainly operated by the
mines. These are not regulated by the municipality; however, it is required that the municipality, at
Allanridge Odendaalsrus Welkom Virginia Ventersburg Matjhabeng NU Matjhabeng
Electricity 98,2 89,8 90,9 93,6 81,9 77,0 91,1
Other 1,7 10,1 8,9 6,2 18,0 22,4 8,7
None 0,1 0,1 0,2 0,1 0,1 0,5 0,2
0,0
20,0
40,0
60,0
80,0
100,0
120,0%

41
a minimum, compile a registry of these sites and confirm that Industry Waste Management Plans
are in place for all major industries within its area of jurisdiction.
Refuse Removal
A similar positive trend can also be observed with the provision of refuse removal services to our
residents. The number of residents with no basic refuse has significantly reduced and therefore
confirming the progressive reduction of refuse removal service backlog.
The municipality makes effort to ensure that refuse removal is done at least once a week at every
formalized household and from businesses and this is in-line with the national target. To ensure the
efficient management of the solid waste, the municipality conducts quarterly awareness campaigns
to educate community members and scholars about waste management. There are areas which do
not receive the service, and these include farms and informal settlements. The reason for this is that
the farms are too far from the main operational area and the quantities of waste produced are not
substantial enough to warrant regular removal (cost - benefit analysis). Movement in informal
settlements is a challenge in that plant and machinery cannot move freely between the dwellings.
Mechanical breakdown of aged fleet often affects the weekly removal of waste.
Figure 3.5: Percentage distribution of households in Matjhabeng local municipality
by type of refuse disposal per region – CS 2016
AllanridgeOdendaals
rusWelkom Virginia
Ventersburg
Matjhabeng NU
Matjhabeng
Removed by local authority/private company 97,0 90,3 85,7 95,2 88,5 5,1 87,3
Communal refuse dump 0,1 0,5 1,6 0,5 4,5 0,9 1,2
Own refuse dump 2,6 5,5 7,1 1,9 5,3 65,5 6,7
No rubbish disposal 0,1 2,4 5,0 1,8 1,3 24,1 4,0
Other 0,1 1,3 0,6 0,6 0,3 4,3 0,8
0,020,040,060,080,0
100,0120,0
%

42
Response to COVID-19
The basic point of departure is developed and approve an integrated waste management plan that
complies with legislation. We need to know processes and systems to be followed by way of an
approved integrated waste management plan.
Refuse removal trucks must form part of the plan. For instance, council has already noted that we
should procure needed equipment via the RT57 procurement system of the National Treasury. We
need to have related equipment as part of the refuse removal plan for the 2020/2021 financial year.
4.5. Housing and Human Settlements
In this section, information on household composition and services will be analysed to give an overall
picture on services delivery in Matjhabeng local municipality.
Figure 3.16: Percentage distribution of households in Matjhabeng local municipality by main
type of dwelling – Census 1996, 2001 and 2011
Figure 4.2 shows percentage distribution of households by main type of dwelling. In 1996, the
proportion of formal dwellings was 60% followed by informal dwellings with 37.4%. Between 2001
and 2011, informal dwellings decreased from 40.5% to 19.7% whereas formal dwellings increased
from 56.8% to 78.5%. With regard to traditional dwellings decreased from 2.2% to 0.4%. In
respective years 1996, 2001 and 2011, the highest proportion of dwellings was found to be in formal
dwellings followed informal dwellings.
Formal dwellingTraditional
dwellingInformal dwelling Other
Census 1996 60,0 1,3 37,4 1,3
Census 2001 56,8 2,2 40,5 0,5
Census 2011 78,5 0,4 19,7 1,4
0,010,020,030,040,050,060,070,080,090,0
%

43
Response to COVID-19 pandemic
It was discovered that the virus will mostly hit people in informal settlements because of their nature
association. The environment they live in does not allow for social distancing as a minimum. It is
therefore crucial that we cater for this specific need of providing land for human settlements in our
plans. We would expect that provincial department of human settlements will take into account this
unique requirement of fighting the spread of the pandemic by providing decent housing. In our plans,
it would be appreciated to cater for title deeds, land for residential purposes.
4.6. Recreational Services
The municipality has a well-established recreational and sports facilities. There have being a lot of
investment made over the period of time. Among the challenges that remains in this service is lack
adequate facilities particularly in previously disadvantaged areas.
4.7. Cemetery and Memorials
The Municipality has well developed cemetery and memorial services across its jurisdiction.
However, the adequate burial space remains a challenge which require innovate ways of managing
it.
IMPORTANT CONSIDERATION RELATING TO HOUSEHOLD LEVEL OF SERVICE
Overall, in 2017:
Water
93.7% of households had access to piped water inside the dwelling or yard.
1.3% used communal tap
1.5% used the neighbor’s tap.
Recorded backlogs amounted to 2 503 units (2.6% of households).
Sanitation
15.0% used pits or bucket toilets or had no facility.
In 2011, most of the bucket toilets were in Virginia, followed by Hennenman and Welkom. Households without toilets occurred mostly in Welkom, as well as toilets without ventilation.
Solid waste
86.3% are serviced least once a week
6.7% of households had their own refuse dump

44
4.0% had no rubbish disposal
1.2% used a communal refuse dump
Most households without municipal refuse services lived in Welkom.
Energy
About 5 000 urban households had no access to electricity or used another source of energy.
Very few households use alternative sources of energy.
Cemeteries
Mmamahabane and Meloding require new cemeteries
Free basic services
Free basic services were delivered to an estimated 19 537 households in 2015/16
20% of household consumers received free basic water, basic electricity, basic sanitation, and solid waste services.
Response to COVID-19 pandemic
We need to revise our cemetery plan to also cater for COVID-19 related deaths. It has been indicated
that we will have adapt our lifestyles to suit conditions imposed by the virus. It has also been
confirmed that there is special treatment of deaths as a result of the coronavirus. We are expected
to provide land dedicated for coronavirus deaths.
5. Economy structure and performance
The main economic activities in the Lejweleputswa District happened in the primary sector and the
tertiary sector. The primary sector in Lejweleputswa is driven by agriculture and mining. Matjhabeng
is the largest municipality in the District and it contains most of the mining activities, especially gold
mining, followed by Masilonyana with some of the gold mining and diamond mining. Recently the
mining sector has been on a downward trend as a result of closure of many of the shafts as a result
of high costs of production among others and the need for deep mining. The recent decline in world
commodity prices, has aggravated the situation in general with many businesses that have
traditionally dependent on the mining sector either have closed down or are in the process of closing
down. Other municipalities’ primary sector relies heavily on agriculture.

45
Economic Structure
Figure 4.4: Sectoral composition of Lejweleputswa economy (%, current prices)
Source: IHS Global Insight Regional eXplorer, 2015
The composition of the District’s economy is dominated by the primary sector at 52 percent in 2014
as shown by figure 4.4, up from 41 percent in 2005. The tertiary sector contributed 42 percent to the
District ‘s economy in 2014, decreasing by 9 percentage points from 51 percent in 2005. The
secondary sector’s share declined from 8 percent in 2005 to 6 percent in 2014, further indicating the
difficulties that the sector is facing. Very little value adding is taking place in the region by using the
vast primary products the District has in abundance.
Sectoral composition of the economy
Sectoral composition is the contribution of the different sectors to total GDP of Lejweleputswa’s
economy. This includes all the nine sectors within an economy of a region as classified by the South
African Standard Industrial Classification (SIC) of all economic activities (CSS fifth edition).
Table 5.1: Sectoral composition of Lejweleputswa’s economy by local municipalities, 2014.
2014 Lejweleputswa Masilonyana Tokologo Tswelopele Matjhabeng Nala
1 Agriculture 5.6% 6.2% 24.6% 36.9% 0.8% 17.7%
2 Mining 46.5% 50.3% 21.6% 1.2% 56.0% 4.7%
3 Manufacturing 2.5% 2.1% 2.9% 2.2% 2.1% 5.2%
Primary sector41%
8%
Tertiary sector51%
2005
Primary sector52%
Secondary sector
6%
Tertiary sector42%
2014

46
4 Electricity 1.5% 1.2% 2.9% 2.8% 1.3% 2.3%
5 Construction 1.7% 2.2% 2.5% 1.8% 1.5% 2.6%
6 Trade 11.0% 8.3% 12.3% 15.4% 10.0% 17.6%
7 Transport 6.3% 5.2% 5.0% 7.8% 5.6% 11.8%
8 Finance 10.8% 8.4% 7.6% 10.6% 10.8% 13.9%
9 Community
services 14.2% 16.2% 20.7% 21.4% 11.9% 24.0%
Total Industries 100.0% 100.0% 100.0% 100.0% 100.0% 100.0%
Source: IHS Global Insight Regional eXplorer, 2015
The 2014 sectoral composition of Lejweleputswa as revealed by figure 4.5 points to the dominance
of a few sectors in the economy of the District. According to table 5.1, the mining sector is the
dominant sector with 46.5 percent of the economic activities of the district, followed by community
services sector at 14.2 percent and then trade at 11 percent. The smaller municipalities of Nala,
Tswelopele and Tokologo are the municipalities without mining as the dominant sector, instead
Tswelopele has agriculture as the dominant sector at 36.9 percent in 2014.
Nala had government services as the dominant sector with 24 percent in 2014, whilst Tokologo had
agriculture as the dominant sector with 24.6 percent in 2014. In recent years the contribution of
mining in Lejweleputswa’s economy has been declining due to a number of reasons and recently
the effect of lower world commodity prices has fuelled the decline of the sector. The share of the
primary sector in Lejweleputswa’s GVA has also been on a decline, indicating a shift away from the
primary sector to the tertiary sector. The community services sector is growing strongly in all of
Lejweleputswa’s municipalities and is also forecasted to grow further.
Tress Index
The tress index measures the level of diversification or concentration of a region’s economy. The
index ranges between zero and one. The closer to 0 the index is, the more diversified is the
economy. The higher the index or closer to 1, the less diversified the economy, and the more
vulnerable the region’s economy to exogenous factors that can include things like adverse economic
conditions due to natural disasters, like global warming (Wikipedia, 2015).

47
Figure 4.5: Tress index of Lejweleputswa and the Free State and its Districts
Source: IHS Global Insight Regional eXplorer, 2015
Lejweleputswa’s economy has been leaning more to a less diversified economy due to its increase
closer to 1 of its Tress Index over a ten-year period as illustrated by figure 4.5. Even though
Lejweleputswa’s Tress Index has improved in 2014 (56.93 percent) as compared to (55.01 percent)
2005, the worst years of its less diversification were 2013 (61.32 percent) and 2012 (60.66percent).
This simply indicates fewer industries dominating the region’s economy, thus the vulnerability of the
region’s economy to outside shocks becomes very easily.
If compared to the rest of the province, Lejweleputswa is the second less diversified regional
economy in the Free State after Mangaung Metro. The most diversified economy is that of Fezile
Dabi among the Districts and the province is even better than all the Districts.
Location Quotient
Location quotient reveals what makes a particular region “unique” in comparison to the national or
provincial average. It is basically a way of quantifying how concentrated a particular industry or
cluster is as compared to the province or nationally (EMSI Resource library, 2015).
2005 2006 2007 2008 2009 2010 2011 2012 2013 2014
Lejweleputswa 55,01 55,73 57,46 58,07 56,05 59,24 58,79 60,66 61,32 56,93
Masilonyana 61,32 61,62 61,96 60,96 59,04 61,76 61,43 63,20 64,05 60,51
Tokologo 42,38 42,63 44,64 49,17 46,56 44,53 44,10 44,34 44,76 45,83
Tswelopele 56,76 56,79 58,33 62,36 60,89 58,23 57,58 57,31 57,42 58,62
Matjhabeng 61,25 63,28 65,71 67,33 65,16 68,20 67,61 69,81 70,55 66,59
Nala 42,80 40,37 40,06 41,16 40,87 41,38 41,35 41,26 41,23 41,85
0,00
10,00
20,00
30,00
40,00
50,00
60,00
70,00
80,00
Per
cent
age

48
Figure 4.6: Lejweleputswa’s Location Quotient
Source:
IHS Global Insight Regional eXplorer, 2015
According to figure 4.6, above the dominant sector in Lejweleputswa is the mining sector
with a location quotient of 5.05 in 2014, which has declined slightly from 5.10 in 2005. By its
nature mining is more export orientated and brings into the economy of the region more
money than any other sector in the region. Agriculture follows the mining sector though very
small as compared to the mining sector with an increase in the location quotient of 2.31 in
2014 as compared to 1.54 location quotient in 2005. The other sectors are less concentrated
in the region, all ranging less than 1 location quotient. Trade is one of a few sectors that
have shown some positive growth in its location quotient from 0.76 in 2005 to 0.82 in 2014.
Economic Performance
The Gross Value Added by Region (GVA-R) measures the difference between inputs into
particular region’s economy and the value of outputs (goods and services) in that region or
sector.
Table 4.2: GVA-R. Contribution to total economic growth in Lejweleputswa (% point,
Constant 2010 prices)
2005 2006 2007 2008 2009 2010 2011 2012 2013 2014
1 Agriculture 0.1% -0.4% 0.0% 0.9% -0.1% 0.0% -0.5% -0.1% 0.0% 0.2%
2 Mining 0.8% -3.8% -0.7% -3.0% -2.0% 0.9% -1.3% -2.2% 1.9% -0.3%
3 Manufacturing -0.2% -0.4% -0.1% 0.2% -0.2% 0.0% -0.4% -0.5% -0.1% -0.1%
4 Electricity 0.0% -0.2% 0.0% 0.0% 0.0% -0.1% -0.1% -0.1% 0.0% 0.0%
5 Construction 0.0% -0.1% 0.2% 0.1% 0.2% -0.2% -0.1% -0.1% 0.0% 0.0%
1Agricultur
e2 Mining
3Manufact
uring
4Electricity
5Constructi
on6 Trade
7Transport
8 Finance9
Community services
2005 1,54 5,10 0,30 0,70 0,46 0,76 0,68 0,66 0,87
2014 2,31 5,05 0,21 0,43 0,47 0,82 0,68 0,56 0,67
0,00
1,00
2,00
3,00
4,00
5,00
6,00
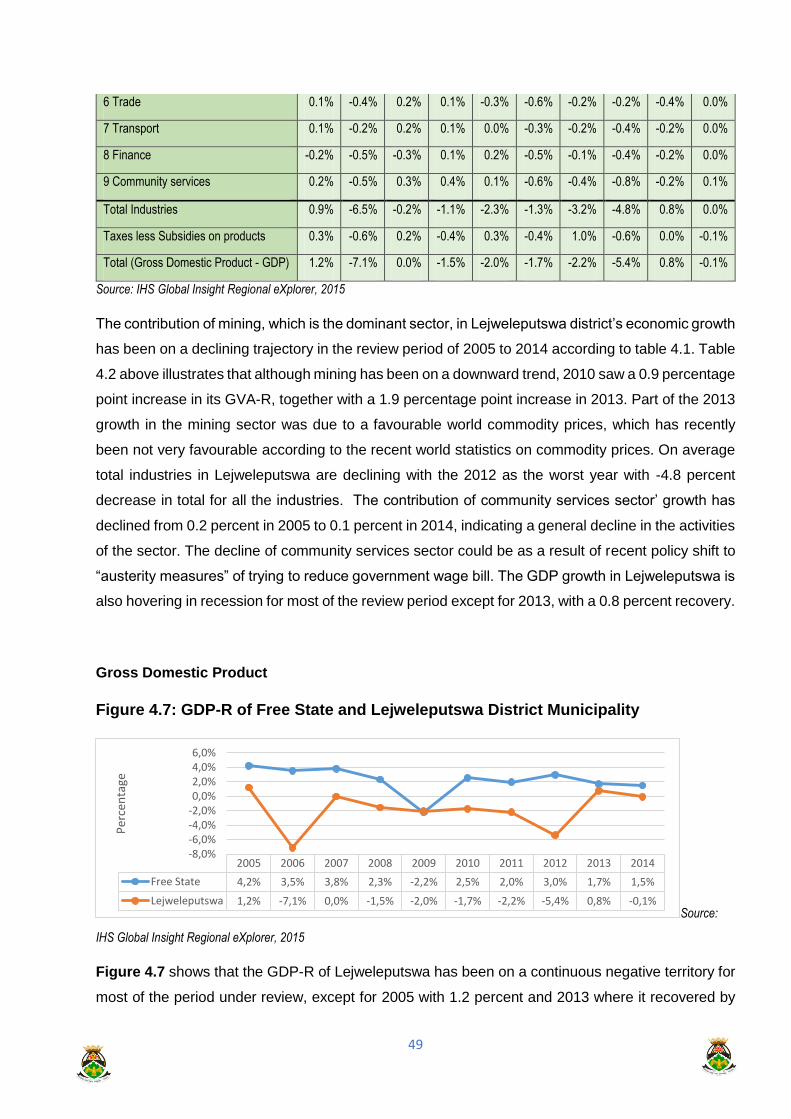
49
6 Trade 0.1% -0.4% 0.2% 0.1% -0.3% -0.6% -0.2% -0.2% -0.4% 0.0%
7 Transport 0.1% -0.2% 0.2% 0.1% 0.0% -0.3% -0.2% -0.4% -0.2% 0.0%
8 Finance -0.2% -0.5% -0.3% 0.1% 0.2% -0.5% -0.1% -0.4% -0.2% 0.0%
9 Community services 0.2% -0.5% 0.3% 0.4% 0.1% -0.6% -0.4% -0.8% -0.2% 0.1%
Total Industries 0.9% -6.5% -0.2% -1.1% -2.3% -1.3% -3.2% -4.8% 0.8% 0.0%
Taxes less Subsidies on products 0.3% -0.6% 0.2% -0.4% 0.3% -0.4% 1.0% -0.6% 0.0% -0.1%
Total (Gross Domestic Product - GDP) 1.2% -7.1% 0.0% -1.5% -2.0% -1.7% -2.2% -5.4% 0.8% -0.1%
Source: IHS Global Insight Regional eXplorer, 2015
The contribution of mining, which is the dominant sector, in Lejweleputswa district’s economic growth
has been on a declining trajectory in the review period of 2005 to 2014 according to table 4.1. Table
4.2 above illustrates that although mining has been on a downward trend, 2010 saw a 0.9 percentage
point increase in its GVA-R, together with a 1.9 percentage point increase in 2013. Part of the 2013
growth in the mining sector was due to a favourable world commodity prices, which has recently
been not very favourable according to the recent world statistics on commodity prices. On average
total industries in Lejweleputswa are declining with the 2012 as the worst year with -4.8 percent
decrease in total for all the industries. The contribution of community services sector’ growth has
declined from 0.2 percent in 2005 to 0.1 percent in 2014, indicating a general decline in the activities
of the sector. The decline of community services sector could be as a result of recent policy shift to
“austerity measures” of trying to reduce government wage bill. The GDP growth in Lejweleputswa is
also hovering in recession for most of the review period except for 2013, with a 0.8 percent recovery.
Gross Domestic Product
Figure 4.7: GDP-R of Free State and Lejweleputswa District Municipality
Source:
IHS Global Insight Regional eXplorer, 2015
Figure 4.7 shows that the GDP-R of Lejweleputswa has been on a continuous negative territory for
most of the period under review, except for 2005 with 1.2 percent and 2013 where it recovered by
2005 2006 2007 2008 2009 2010 2011 2012 2013 2014
Free State 4,2% 3,5% 3,8% 2,3% -2,2% 2,5% 2,0% 3,0% 1,7% 1,5%
Lejweleputswa 1,2% -7,1% 0,0% -1,5% -2,0% -1,7% -2,2% -5,4% 0,8% -0,1%
-8,0%-6,0%-4,0%-2,0%0,0%2,0%4,0%6,0%
Per
cen
tage

50
0.8% percentage points on the back of a strong mining sector which was also positive in 2013 by
1.9 percent. However, it declined further again in 2014 to -0.1 percent, and it is also expected to
decline further in 2015 on the back of low worldwide commodity prices. The negative growth rate
experienced in most years in the District is affecting the District negatively and is one of the factors
pushing people away from the District, leading to what can be termed economic migrants.
The sustainability of the District’s economy is in jeopardy because of a continued negative growth
rate in the District driven by a declining mining sector and a shrinking agricultural sector. However,
the provincial growth rate has always been positive except for the 2009 recession, where it was
below that of the District by -2.2 percentage points. The best growth for the province posts the
recession was in 2012, with a growth rate of 3 percent, which was also the worst growth rate year
for Lejweleputswa at -5.4 percent. The recession in Lejweleputswa in 2012 was driven by the mining
sector with -2.2 percent and the community services sector with -0.8 percent and other tertiary
sectors relying on the mining sector. The 2014 slump is also as a result of low commodity prices
affecting the mining sector and a general decrease in total industries of -4.8 percent.
Figure 4.8: GDP-R of Lejweleputswa and its municipalities
Source:
IHS Global Insight Regional eXplorer, 2015
According to figure 4.8, the District’s GDP-R follows that of Matjhabeng to a large extent as
compared to the rest of the municipalities. Lejweleputswa’s average growth rate for the period 2005
to 2014 was -1.8 percent, which is a sign for a shrinking economy. The worst average growth rate
for the District’s local municipalities in the review period was experienced in Masilonyana with a -2.7
percent average growth rate followed by Matjhabeng with a -2.4 percent between 2005 and 2014.
2005 2006 2007 2008 2009 2010 2011 2012 2013 2014
Lejweleputswa 1,2% -7,1% 0,1% -1,5% -2,0% -1,7% -2,2% -5,3% 1,0% 0,0%
Masilonyana 2,9% -6,7% -0,7% -2,4% -0,8% -0,5% -6,4% -9,1% -2,9% -0,1%
Tokologo 8,8% 4,5% 11,9% 12,1% -1,4% 2,7% -9,9% 1,2% -0,9% 2,5%
Tswelopele 4,3% 3,8% 9,7% 8,1% 1,0% 3,8% -0,3% 2,0% 1,9% 2,7%
Matjhabeng 0,5% -8,7% -0,7% -3,0% -2,4% -2,7% -1,8% -6,5% 1,5% -0,6%
Nala 4,0% 0,2% 0,9% 4,6% -2,0% 1,1% -0,1% 1,5% 0,9% 1,8%
-15,0%
-10,0%
-5,0%
0,0%
5,0%
10,0%
15,0%
Per
cen
t

51
In 2008, Tokologo had the highest growth rate of 12.1 percent, which declined during the 2009
recession to -1.4 and further in 2011 to -9.9 percent making it the worst performing local municipality
in Lejweleputswa in 2011. This kind of performance can only happen if there are few participants in
the economy of the municipality who have a significant share of the economy. However, the average
growth rate for Tokologo municipality is 3.2 percent in the review period. Tswelopele has shown the
highest average growth rate in the district with a 3.7 percent, followed by Nala with an average
growth rate of 1.3 percent in the same period.
GDP-R per capita.
Per capita GDP-R is a measure of the total output of a region that takes into account the gross
domestic product and then divides it by the number of the people in the region (World Bank, 2015).
It is one of the primary indicators of the region’s performance (investorwords.com, 2015). It is
calculated by either adding up everyone’s income during the period or by adding up the value of final
goods and services produced in the region during the year (Investorwords.com, 2015).
Figure 4.9: GDP-R Per Capita of Lejweleputswa
Source:
IHS Global Insight Regional eXplorer, 2015
Figure 4.9 above shows the relative performance of the Free State’s real GDP-R per capita against
that of Lejweleputswa from 2005 to 2014. The real GDP-R per capita of the Free State is on the rise
indicating an increase in the standard of living of the people of the province. It increased from R48
881in 2005 to R56 853 in 2014, which is an average increase of 16.3 percent between 2005 and
2014. On the other hand, the GDP-R of Lejweleputswa decreased by 17.5 percent between 2005
and 2014 i.e. from R54 235 in 2005 to R44 709 in 2014. This indicates a declining standard of living
2005 2006 2007 2008 2009 2010 2011 2012 2013 2014
Free State 48,881 50,649 52,560 53,659 52,308 53,405 54,202 55,558 56,257 56,853
Lejweleputswa 54,235 50,762 50,851 49,918 48,719 47,794 46,769 44,322 44,711 44,709
,0
10,000
20,000
30,000
40,000
50,000
60,000
R

52
of the people of Lejweleputswa. A decline in the average standard of living in one of the regions of
the province should be a course for concern for the government and policy makers.
Response to COVID-19 pandemic
As a proactive stance to ameliorate the devastating impact brought about by coronavirus epidemic,
we need to give priority to businesses that are likely to close as a result of the situation. The kinds
of interventions we prioritize would be dictated by the nature of problems encountered. We would
expect that all work performed must, to a greater extent, be labour intensive to enable absorption of
laid-off and employable work force staying at home. By all intents and purposes, the Municipality
must develop a system that allows this absorption to take place in a manner that does not kill other
companies. Government employment systems of expanded public works programmes and others
must be deployed to ease the work challenges.
Educational facilities
As reflected in the plan below, there are presently a total of 275 educational facilities in
Matjhabeng Local Municipality. These are made up of the following:
1 Adult Basic Education and Training Facilities (ABET);
7 Early Childhood Development Facilities (ECD);
3 Further Education and Training (FET) Facilities;
129 Rural / Farm Schools;
5 Independent Schools;
1 Private School;
129 Public Schools.
In terms of the existing provision of educational facilities measured against the proposed standards,
the anticipated need is indicated in the table below.
Backlog of educational facilities per area according to CSIR guideline
Urban area Population
Required Provided Vacant
school sites
1 per 7000 1 per 12 500 Primary Secondary
Primary Secondary
Allanridge / Nyakallong 19 337 3 2 4 2 8
Odendaalsrus /Kutloanong 63 743 9 5 10 7 22
Welkom / Thabong 211 011 28 17 31 11 37
Virginia / Meloding 66 208 9 5 15 6 21
Hennenman /Phomolong 24 167 3 2 4 2 12
Ventersburg/Mmamahabane 11 260 2 1 3 1 5

53

54
The Matjhabeng Municipality is made up of 36 wards and its Council consists of 36 directly elected
Ward Councillors and 6 Proportionally Elected Councillors. In keeping an efficiently and seamless
communication with communities, the ward Councillors chair’s ward committees as part of promoting
participatory democracy. In the Municipality’s commitment to ward based planning, we have
completed the process of electing ward committees in all 36 wards in the locality such as to ensure
proper consultation cascades even to the basic units in our community.
The Ward Councillors as chairpersons of these committees convene constituency meetings on a
monthly basis so as to ensure that communities are well informed about service delivery issues and
also to ensure their full participation in providing guidance in so far as their needs and Council
planning is concerned.
The mandate for Local Government as enshrined in our constitution (section 152) is to, among
others:
i. Promote democratic and accountable Government for Local communities.
ii. Ensure the provision of sustainable services to communities.
iii. Promote a safe and healthy environment; and
iv. Encourage community participation in Local Government.
Keeping in line with the above and promotion of good Governance, the Council has undertaken
separation of power between the legislative and administrative arms of Governance. This process
has sought to establish sound and independent oversight for expedient response to Municipal
mandate. It remains this Council’s commitment to pertinent level of participation, accountability and
broad representation by establishing:
i. Clear delimitation of powers between spheres of Governance,
ii. Thorough Executive accountability for expedient service delivery and meaningful
development,
iii. Independent and inclusive representative oversight by the Legislative arm.
Matjhabeng Local Municipality has the following outline of governance structure:

55
The Speaker of Council
The Speaker is the Head of the Legislative Arm of Council and plays a coordination and
management role in relation to the Section 79 Standing Committees. Other responsibilities of the
Speaker, as legislated, include:
Presiding at meetings of the Council;
Performing the duties and exercising the powers delegated to the Speaker;
Ensuring that the Council meets at least quarterly;
Maintaining order during meetings;
Ensuring compliance with the Code of Conduct by Councillors; and
Ensuring that Council meetings are conducted in accordance with the rules and orders
of the Council.
COUNCIL
SPEAKER
CHAIRPERSON
OF
CHAIRPERSONS
STANDING
COMMITTEES
PORTFOLIO
COMMITTEES
COUNCIL WHIP

56
The Chief Whip of Council
The Chief Whip plays a pivotal role in the overall system of governance to sustain cohesiveness
within the governing party and maintain relationships with other political parties. The Chief Whip is
required to:
o Ensure proper representation of all political parties in the various committees;
o Maintain sound relations with the various political parties represented in Council;
o Attend to disputes between political parties and build consensus.
Chairperson of Chairpersons
The Chair of Chairs is responsible for coordinating the work of all Section 79 Committees
and works closely with and supports Chairpersons of Committees.
Chairpersons of Section 80 Portfolio Committees
Section 79 Portfolio Committees perform an oversight role by monitoring the delivery and
outputs of the Executive. These committees do not have any delegated decision-making
powers. Functions include:
Reviewing, monitoring and evaluating departmental policies;
Reviewing and monitoring of city plans and budgets;
Considering quarterly and annual departmental reports;
Examining the links between the strategy, plans and budgets; and
Holding the political Executive accountable for performance against policies and priorities.
SECTION 80 COMMITTEE CHAIRPERSON
Finance Cllr. SD Manese
Integrated Development Planning & Performance and Monitoring
Cllr. M.L Radebe
LED, Spatial Planning, Land-use, Agriculture and Human Settlements Cllr. M.C Radebe
Corporate Services Cllr. V.E Mawela

57
Sports, Arts and Culture, Youth, Women and People with disability
Special Programmes: Office of the Executive Mayor Cllr X. Masina
LED and Mining Cllr. S. Liphoko
Public Safety and Transport Cllr. V. R. Morris
Community services Cllr. T.B Lushaba
Infrastructure and Technical Services Cllr. M.E Tshopo
SECTION 79 COMMITTEES(STANDING) CHAIRPERSON
MPAC Cllr. M. Masienyane
DISPUTE RESOLUTIONS Cllr. H. Mokhomo
RULES Cllr. B. Mahlumba
CHAIRPERSONS Cllr. M Mphikeleli
Multiparty Party Whippery
The multiparty Whippery constitutes of all political parties represented in council. Each party
selects among its councillors a party whip, whom are responsible for the management of their
individual party representatives, discipline and to ensure that there is efficient cross-party
coordination of council political work. This will ensure the smooth and efficient running of political
work of council.
The current council consists of six political parties namely, ANC, DA, EFF, COPE and FF+ and
United Front of Civics.
Administrative structure
The Matjhabeng local municipality as guided by the Municipal Systems Act (MSA), Municipal
Structures Act and Municipal Finance Management Act (MFMA) has been able to complete the
restructuring of its top organizational structure. We are currently in the process of reviewing micro
organizational structure with all intentions to ensure that the structure responds to the strategic
and operational needs of the municipality.
The municipality currently has 2240 in its employ, 1826 of them are employed permanently and
414 are on temporary basis.

58
Powers and Functions
The Municipal Manager appointed by Council in terms of Section 82 of the Municipal Structures
Act, is designated as the Accounting Officer and the Administrative Head. He is also the Chief
Information Officer of the municipality and he is responsible for managing the Promotion of
Access to Information Act (PAIA) requirements. The responsibilities of the Municipal Manager
include the management of financial Affairs and service delivery in the Municipality. The Municipal
Manager is assisted by the Executive Director of who are head of six municipal departments.
Municipality has structured its departments in a way that each has an Executive Director
appointed under Section 56 of MSA for its core functions. Alignment of these functions are such
that they enable a swift attainment of all our strategic and operational targets.
POSITIONS NAME
Acting Municipal Manager Me Zingisa Tindleni
Chief Financial Officer Mr Thabo Panyani
Executive Director Strategic Support Services Mr Tumelo Makofane
Acting Executive Director Corporate Services Mr Sipho Nhlapo
Executive Director Infrastructure Mr Ntwampe Thobela
Acting Executive Director LED and Human Settlement Me Morakane Mothekhe
Acting Executive Director Community Services Mr Eric Motheoane
Employment Equity Plans
Council in an attempt to maximize the capacity of the municipality to serve the community
Matjhabeng, has committed to achieve all the employment equity goals and objectives as
guided by the Municipal Systems Act, Act 32 of 2000. All these are clearly articulated in the
Employment Equity Plan which is review and reported annual as annexure to this Document.
Skills Development Plan
The municipality aligns itself with the requirements of the Skills Development Act of 1998,
which clearly states that the employer must plan and implement learning programs that will
enable employees to acquire skills and qualifications that will enhance their performance at
contribute to the organization’s optimum functioning. Skills Development Plan is annexure of
the document.

59

60
OUR VISION
By being a benchmark developmental municipality in service delivery excellence.
OUR MISSION STATEMENT
By being a united, non-racial, non-sexist, transparent, responsible municipality.
By providing municipal services in an economic, efficient and effective way.
By promoting a self-reliant community through the promotion of a culture of
entrepreneurship.
By creating a conducive environment for growth and development.
Mayoral Strategic Priorities
1. Roads maintenance
2. Streetlights maintenance
3. Replacement of asbestos water pipes
4. Achieve housing accreditation
5. Economic development
SWOT ANALYSIS
KPA CHALLENGES PRIORITIES OPPORTUNITIES THREATS
Municipal Transformation and Institutional Development
Shortage of personnel in critical division – infrastructure departments, Quality of reporting and performance information
Strengthening of critical service delivery division Improving quality of performance information (setting of KPIs by departments)
Opportunities for embarking on an extensive organizational review in the medium to long term. Strong and credible monitoring and evaluation. Attainment of clean audit. Enabling policy and legislative frameworks on staff establishments
Capacity to deliver on assigned developmental mandate

61
Service Delivery Housing backlogs and incomplete housing projects: illegal settlements and land invasions Massive service delivery and infrastructure backlogs in the townships and rural areas, roads and storm water Inadequate funding for key service delivery projects and programmes Ineffective service delivery – refuse and waste collection Ageing service delivery infrastructure (including electricity and water line losses) and utilities (fleet) Unavailability of water at source and declining dam levels Maintenance of service delivery infrastructure and utilities (including fleet) Poor planning capital projects resulting to counter-funding
Building of mixed housing (BNG, Gap Market and Bonded houses); Attainment of level 1 accreditation of housing delivery Accelerate the programme of upgrading roads and storm-water in township; Development and implementation of a comprehensive storm-water master-plan increase the pace of eradicating sanitation backlogs Implementation of Integrated Waste Management Plan and purchasing of compaction trucks of waste removal services Implementation of Water Conservation and Demand management programmes Development of electricity master plan and business strategy that also deals with green energy and future development outlook Implementation of refurbishment and rehabilitation programmes Multiyear capital program to ensure assets are indeed replaced at the end of their economic life
BNG, Gap Market and Bonded Houses); Level 1 accreditation for Housing Delivery; Accelerating development land parcels with mixed development trajectory Replication of township revitalization programme Availability of support programme that will be providing resources for township revitalization such as revitalization of Central Business District and Expanded bulk services to Regular waste removal, services and building of transfer stations at strategically located sites Promotion of green environment Adequate budgeting for implementation to Water Demand Management; Water conservation and harvesting of water Civic education on the use of water Budget adequate for rehabilitation of infrastructure Enhancing future and contract fast-tract delivery of
Social protest - communities demanding housing Peoples houses being flooded during inclement weather Rising claims lodged against the municipality’s lack of security of water supply from sources due to high account from bulk water supplier Degradation of the environment Community protests Illegal dumping may threaten the health and safety of citizens Wastage and losing of monies as a result of water loss Unreliable water supply due to constant pipe bursts Water usage by citizens – gardening, car washes Correct use of infrastructure by communities Inadequate capital grants and community dissatisfaction about service delivery

62
Reviewing turn-around time of servicing service delivery utilities / vehicles Implementation of Capital Infrastructure plan Management of consultants to avoid overdesign which result to counter-funding Implementation of refurbishment and rehabilitation programmes Multi Year capital program to ensure assets are indeed replaced at the end of their economic life Reviewing turn-around time of servicing service delivery utilities / vehicles Implementation of Capital Infrastructure plan Management of consultants to avoid overdesign which result to counter-funding
programmes and projects
Local Development
Provision of land to accommodate emerging township small farmers. Availabil i ty of economic marketing
Providing commonages in partnerships with the Department of Agriculture to accommodate farming activity and grazing of animals
Providing commonages in partnership with the Department of Agriculture to accommodate farming activity and grazing of animals.
Availabil i ty of land Food Security Rampant poverty

63
strategy and investment strategy Availabil i ty of reliable public transport Lack of long-term economic strategy
Agri-Park and Agri-Vil lages developments
Structural layout of road infrastructure Availabil i ty of adequate funding
Financial Viability and Sustainability
Rising services arrears debt Rising SCM deviations
Implementation of Revenue Enhancement Strategy and cost containment strategy Revenue and prudent cash flow management
Committed management and staff Stable and supportive polit ical leadership Implementation of valuation roll and data purif ication
Non-compliance to internal controls procedures and legislation Non-payment for municipal services compounded by unemployment rate
Key Developmental Challenges
Ageing road infrastructure
Decaying water infrastructure resulting in high water loss
Aging and vandalism of street lighting infrastructure
Availability of residential sites for low- and high-income housing
Low economic growth and High unemployment rate particularly among youth
Aging service delivery vehicles
High levels of crime
Back to Basics
Municipalities are mandated to provide effective and efficient quality services to the
residents and stakeholders in the city. Whilst tremendous progress has been made there
are areas that would require additional effort to ensure that acceptable service delivery
standards are reached. To assist municipalities to achieve acceptable levels of services,
DCOG has implemented a Back to Basics program which all municipalities have to
subscribe to. The program is directed at service the people and built on five pillars, as
listed below.

64
The Back to Basics program identifies 4 priority areas of intervention as immediate
priorities for transformation, to encourage all municipalities to be functional centres of
good governance.
Priority 1: Get all municipalities out of a dysfunctional state and at the
very least able to perform the basic functions of local government.
Priority 2: Support municipalities that are at a minimum basic level of
performance to progress to a higher path.
Priority 3: Supporting and incentivize municipalities that are performing well to remain
there.
Priority 4: Targeted and vigorous response to corruption and fraud, and a zero-tolerance
approach to ensure that these practices are rooted out.
The institutionalization of the Back to Basics would be via a performance management system
to recognize and reward good governance based on performance measures, such as:
Putting people first
Delivering basic services
Good Governance
Sound financial management
Building Capacity
All three spheres of government have an important role to play in ensuring well-
functioning municipalities. Back to basics is the framework for government collective
action.
IDP Development Process plan
This process plan is based on the unique character and circumstances of Matjhabeng Local
Municipality, taking due cognizance of the process plan requirements as outlined in the Municipal
Systems Act (S 34) and guidelines for Integrated Development Planning provided by National
Department of Cooperative Governance (DCOG).
In order to ensure certain minimum quality standards of the Integrated Development Plan (IDP), and
a proper coordination between and within spheres of government, the preparation of the Process
Plan has been regulated in the Municipal Systems Act (2000). The preparation of a Process Plan,

65
which is in essence the IDP Process sets out in writing, requires adoption by Council. This plan has
to include the following, amongst others:
A programme specifying the time frames for the different planning steps;
Appropriate mechanisms, processes and procedures for consultation and participation of
local communities, organs of state, civil society, and other role players in the IDP drafting
Process;
An indication of the organizational arrangements for the IDP Process;
Binding Process and planning requirements, i.e. policy and legislation; and
Mechanisms and procedures for vertical and horizontal alignment

66
IDP/BUDGET REVIEW PROCESS PLAN TIMETABLE
FOR
FINANCIAL YEAR 2019/2020
ITEM IDP REVIEW PROCESS
ACTIVITY NARRATION TIMEFRAME RESPONSIBLE
DEPARTMENT
1 Process plan Adoption of the Process plan by relevant bodies within the context of applicable laws and government directives
Accounting officers and senior officials of municipality begin planning for next three-year budget
Accounting officers and senior officials of municipality review options and contracts for service delivery
Mayor begins planning for next three-year budget in accordance with co-ordination role of budget process
MFMA s 21, 23
MSA s 34 Chapter 4 as amended
Circular 54 of MFMA
MFMA s 68, 77
MSA s 76-81
May 2019
August 2019
Municipal Manager and EXCO
Executive Mayor and
MAYCO COUNCIL

67
Planning includes review of the previous year's budget process and completion of the Budget Evaluation Checklist
Mayor tables in Council a time schedule outlining key deadlines for: preparing, tabling and approving the budget; reviewing the IDP
(as per s 34 of MSA) and budget related policies and consultation processes at least 10 months before the start of the budget year.
Mayor establishes committees and consultation forums for the budget process
MFMA s 53
MFMA s 21,22, 23;
MSA s 34, Ch 4 as
amended
2 Strategic Planning Session
Assess Municipal wide status Quo
Service Delivery Levels Financial Health & related policies Organizational establishment and efficiency Financial Plan assessment
Review Municipal Strategies (Mission, Vision, KPA, KPI and strategic targets, tariffs and budget policies)
Determine priorities for the financial year
Executive Management Strategic Planning Session
August/
September 2019
Municipal Manager
EXCO

68
3 Prioritization and Identification of Projects
Identification of projects and determination of the accompanying budgets by individual municipal business units (directorates; sub- directorates)
Budget offices of municipality determine revenue projections and proposed rate and service charges and drafts initial allocations to functions and departments for the next
financial year after taking into account strategic objectives
Engages with Provincial and National sector departments on sector specific programmes for alignment with municipalities plans (schools, libraries, clinics, water, electricity, roads, etc)
Business Units/Directorates/Sub- Directorates inputs on projects and budget
30 September 2019
Municipal Manager
IDP Sub-Directorate
Finance
Municipal Manager’s EXCO

69
6 4

70
4 Bulk Service Providers
Accounting officer does initial review of national policies and budget plans and potential price increases of bulk resources with function and department officials
MFMA s 35, 36, 42; MTBPS
October/November 2019
MM, Finance, Exco
5 Tariffs finalization
Council finalizes tariff (rates and service charges) policies for next
financial year
Accounting officer and senior officials consolidate and prepare proposed budget and plans for next financial year taking into account previous years performance as per audited financial statements
MSA s 74, 75 December 2019 MM
Exco
6 Provincial Development Forum/
Alignment
Align IDP with Draft Budget Estimates ,District, Provincial and National Priorities
Identification of projects from Sector Departments (National and Provincial) for inclusion in the IDP
Accounting officer reviews proposed national and provincial allocations to municipality for incorporation into the draft budget for tabling.
January
2020
IDP
Finance

71
(Proposed national and provincial allocations for three years must be available by 20 January) MFMA s 36 January
2020
7 Development of 1st Draft IDP and Budget for MTREF
IDP Sub-Directorate and Finance compile the drafts
Accounting officer finalizes and submits to
Mayor proposed budgets and plans for next
three-year budgets takinginto account the recent mid-year review and any corrective measures proposed as part of the oversight report for the previous years audited financial statements and annual report
The purpose is to prepare for MAYCO debriefing and ultimately Council approval
January 2020 IDP Sub-Directorate
Finance
8 First Draft of IDP Review & Draft Budget
Municipal Manager and Executive Mayor submit Draft IDP and Budget for MTREF for further inputs’ refinement
Accounting officer publishes tabled budget, plans, and proposed revisions to IDP, invites local community comment and submits to NT, PT and others as prescribed.
MAYCO
COUNCIL
MFMA s 22 & 37; MSA Ch 4 as amended
Mid Mar 2020
End Mar 2020
Municipal Manager
Executive Mayor

72
Accounting officer reviews any changes in prices for bulk resources as communicated by 15 March
MFMA s 42
9 External
Stakeholders Engagement
IDP Representatives Forum : ( IDP / Budget Conference)
Ward Councilors ; Ward Committees; Non-governmental Organizations; Community-Based-Organizations Business Forum. Rate Payers’ Association And other Sectors ( Youth and
women) to present :
Status Quo Report; Confirm Community Needs; Input on a development Plan
Consultation with national and provincial treasuries and finalize sector plans for water, sanitation, electricity etc
Accounting officer assists the Mayor in revising budget documentation in accordance with consultative processes and taking into account the results from the third quarterly review of the current year
Various consultations will be held by the office of the Mayor with various stakeholders during this period
MFMA S21
April 2020
Executive Mayor
MAYCO
Speakers’ Office
IDP Sub-Directorate
Finance
Municipal Manager
Municipal Manager’s EXCO

73
10 Public
Consultation
Public Participation/ Imbizos :
Ward Councilors ; Ward Committees; NGO’s; CBO; Businesses. And other Sectors ( Youth and women)
ward based Imbizos for Ward Committees
The purpose is to confirm and beef-up inputs
Mid-April to Beginning of May 2020
Executive Mayor , MAYCO, MM, Finance, Speaker and IDP Office
Public hearings on the budget, and council debate. Council consider views of the local community, NT, PT, other provincial and national organs of state and municipalities.
Mayor to be provided with an opportunity to respond to submissions during consultation
IZIMBIZO and table amendments for council
consideration. Council to consider approval of
Feedback budget and plans at least 30 days before start
Consolidation of budget year.

74
Accounting officer assists the Mayor in preparing the final budget documentation for consideration for approval at least 30 days before the start of the budget year taking into account consultative processes and any other new information of a material nature
11 Draft IDP to District and COGTA
Submit Draft Budget/IDP to District and COGTA
End April 2020 IDP/Budget
Municipal Manager

75
12 Budget and IDP Approval
Submit Final Budget and IDP
Council must approve annual budget by resolution, setting taxes and tariffs, approving changes to IDP and budget related policies, approving measurable performance objectives for revenue by source and expenditure by vote before start of budget year
Mayor must approve SDBIP within 28 days after approval of the budget and ensure that annual performance contracts are concluded in accordance with s 57(2) of the MSA. Mayor to ensure that the annual performance agreements are linked to the measurable performance objectives approved with the budget and SDBIP. The mayor submits the approved SDBIP and performance agreements to council, MEC for local government and makes public within 14 days after approval.
MFMA s 16, 24, 26, 53
MFMA s 53; MSA s 38-45, 57(2)
End of May 2020
COUNCIL

76
Council must finalize a system of delegations.
MFMA s 59, 79, 82; MSA s 59- 65
13 IDP Review Adoption and approval of the Process Plan for
June 2020
Council Process Plan
for 2020/2021
2020/21 by MAYCO and Council

77
Participation and Consultation
The municipality embarked on an extensive public participation of the Budget, IDP and
the Performance Measures for the municipality. Through the process of ward meetings
and targeted presentations to the community and councillors, the following needs are
represented per ward. It must be noted that in cases where no information is reflected,
there were no inputs submitted for consolidation. Some councillors did not attend their
sessions convened for inputs hence some columns would remain empty. In other
instances, we have taken information from the 2019 matrix. For the 2020/2021 council
has decided to suggest 2 projects per ward for implementation and the priorities form a
separate submission and is therefore not part of the IDP as it would have to be approved
by the Acting Municipal Manager after all ward councillors have submitted their
respective ward priorities.

78
PUBLIC PARTICIPATION 2019
ISSUES RAISED BY COMMUNITY
WARD RESPONSIBILI
TY NATURE OF ISSUE
PRIORITIES BY WARD
COUNCILLOR
MLM OTHER
GOVERNMEN
T SPHERE
S
CAPITAL MAINTENANCE
Need Fire Station (operations)
1 X X Shopping complex
Sewerage network problems
X X X Houses/sites
New sites allocation X X Rehabilitation centre
Need High mast lights X X Fire station staffing
Need stadium from SANRAL Community project
X Lights
Pay attention to streets X X Paving of Roads
One stop Market on N1
X X Community hall
Home affairs and SASSA offices
Clinic
Ring Road needs to be redone
X X Stadium
Shopping complex X LED visit
24hrs EMS and Police services
X
High mast lights X X X Bucket eradication
Gravelling of roads X X Erven/Sites development
24/7 Clinic X Houses = 5000 units
Sites X X Resealing of tarred road
Fencing of cemeteries X X Graveling of streets
Employ cashiers at local municipal offices
X Paving of access roads with storm-water drainages
RDP Houses X Replacement/maintenance of high mast lights

79
Housing subsidy 2 X Reconstruction of road in BASIL READ AREA
Space for informal business
X X
Community Parks X X
TVET – Satellite Campus X
SASSA offices X
Dustbins X X
Bursaries X X
Tittle deeds 3 Bucket eradication
Create employment with maintenance of water canals
X Erven/sites development
Establish recreational park
X X X Houses = 5000 units
Eradication of bucket system and municipal services to improve
X X X Resealing of tarred road
Allocation of 5000 sites X X Graveling of streets
Shopping complex near taxi rank
X Paving of access roads
Sites X X Replacement/maintenance of high mast lights
Speed humps
X X Reconstruction road in basil read
Sewer problems to be resolved
X X Fixing of streetlights
Paving of roads X X Replacement of road signs
Multi-purpose centre X X Fixing potholes
Available stalls to be used
X Refurbishment of taxi rank
Ablution facilities in town
Roads

80
Grading of Calabria, Eureka,Chris Hani, Khuthalang and white village
4
X X Water meters
Poorly Built RDP houses X Maintenance of high mast lights
High mast lights X X X Development of a hall
Sewer problems and Calibria road unfinished
X X X Renovation of stadium and tennis court
Informal settlement cropping up at Tip-top and Zac-Bazaar
X Develop parks
De-registration of houses and sites
X Sites and rezoning of informal settlements
Unfinished Masakhane houses
X Urgent sewer networks and road construction Speed humps X X Dilapidated houses
Paving of main roads X X Eradication of bucket systems
Urgent Sewer network needed at Khothalang
X X Electrification and development of farms
Tittle deeds X Dilapidated, demolishing and reconstruction of 2 room houses in white city

81
Flooding meriting circle to be attended
X X Bursaries, learnerships, funding of artists and small businesses
Upgrading of 2 roomed houses
X Rezoning of Rooi-stein farm into residential and infrastructure Water meters at Dikopi X X
Grass cutting at Calabria, Eureka and White city
X X
Stadium and academy
X X
Clinic and Old age home X
Hall X X
Fence graveyard X X
High mast lights 5 X X X Shopping mall next to Meloding taxi rank
Convert unused municipal building to social club
X X Renovate councillors office and convert it to Thusong centre
Stadium X X Residential and church sites
Paving of streets X X Re-sealing of all tarred roads and erect speed humps
Speed humps in main road X X Assist in rebuilding all
dilapidated houses and toilets
Renovate community hall X Gold stein hostel to be converted to skills centre
Shopping complex X Create and upgrade all sports grounds

82
Home affairs and SASSA offices
X Avail business sites
Bigger clinic X
Turn old hostel to development centre
X X
Waste removal and grass cutting
X X
Fencing of cemeteries X X
Job creation X
Water and electricity X X
Sites X X
Renovation of harmony houses
X
Complete sewer networks 6 X X Indoor sports centre
2264 street needs paving X X Houses
Eradicate bucket system X X Roads
Storm water carnal X X Sites
Pave access road to school X X high mast lights
High mast lights in Leratong X X X Unemployment
Speed humps
X X High mast lights
High must lights especially Matlharantlheng
X X X
Urgently need police station X
Sports facilities X X
Bursaries and learnerships X X
Tittle needs and change of ownership of sites
X X
Sites(Business and residential)
X X
Primary school in Albania X
RDP houses X
Help disabled people and child headed families
X X
Attend to pipe bursts X X

83
Potholes 8 X X
Housing (high and low income)
X
Residential sites
X X
Need Clinic X
Tree cutting X X
Police station X
Need Primary and Secondary schools
X
Need swimming pool X X
Hospice X
High mast lights X X X
Speed humps X X
Social labour plans X
Youth centre X
Traffic robots X X
Storm water drainage systems
X X X
Electricity and water infrastructure
X X
Increase municipal fleet X X
Potholes X X Sewerage network in
old Virginia;
Housing (low and high income)
X Replacement of water
reticulation network;
Sites X X Potholes and
resealing of
roads; Shortage of staff at the clinic
X Streetlights;
Mobile police station X Refuse removal and transfer;
Social labour plans X Open/Broken storm
water drain lids;
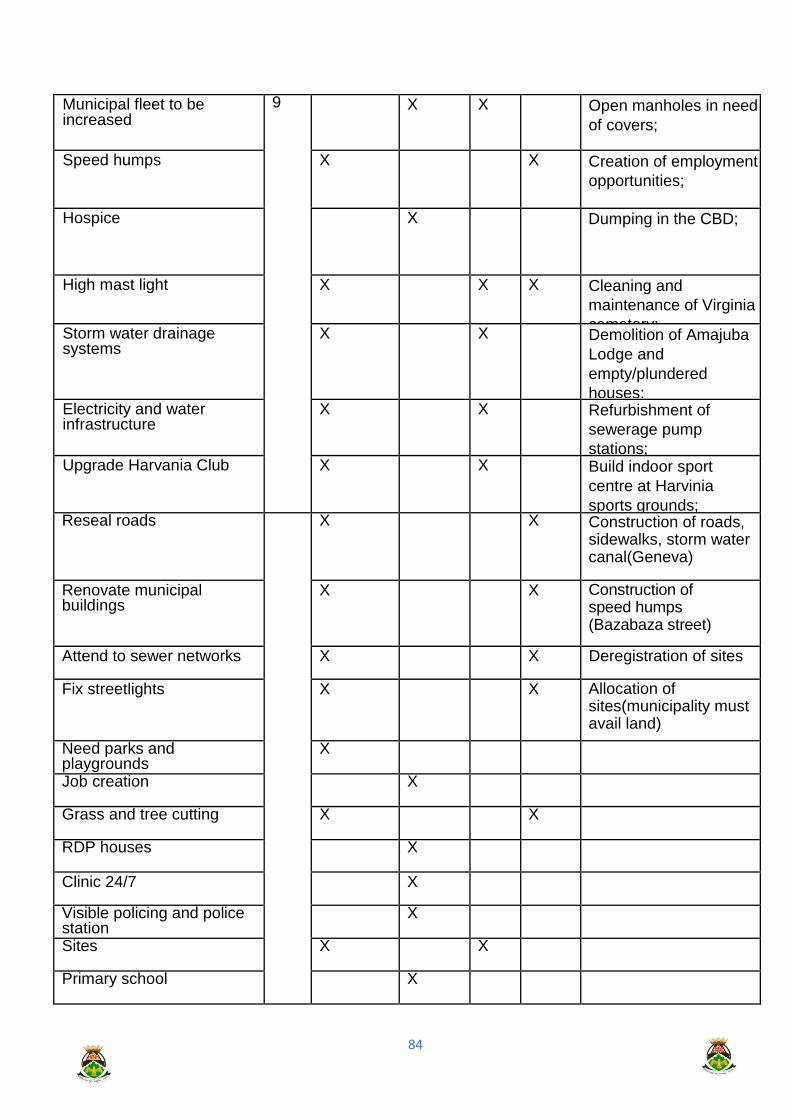
84
Municipal fleet to be increased
9 X X Open manholes in need
of covers;
Speed humps X X Creation of employment
opportunities;
Hospice X Dumping in the CBD;
High mast light X X X Cleaning and
maintenance of Virginia
cemetery; Storm water drainage systems
X X Demolition of Amajuba
Lodge and
empty/plundered
houses; Electricity and water infrastructure
X X Refurbishment of
sewerage pump
stations; Upgrade Harvania Club X X Build indoor sport
centre at Harvinia
sports grounds; Reseal roads X X Construction of roads,
sidewalks, storm water canal(Geneva)
Renovate municipal buildings
X X Construction of speed humps (Bazabaza street)
Attend to sewer networks X X Deregistration of sites
Fix streetlights X X Allocation of sites(municipality must avail land)
Need parks and playgrounds
X
Job creation X
Grass and tree cutting X X
RDP houses X
Clinic 24/7 X
Visible policing and police station
X
Sites X X
Primary school X

85
Storm water K9 10 X X
Refuse removal and speed humps
X X
Flushing toilets 11 X X Installation of sewer lines for ext 15
Sites X X Extending Bronville swimming
pool form baby swimming pool to Olympic size swimming pool
RDP houses X Deregistration of sites
Tittle deeds X
Paving of streets X X
Speed humps X X
Deregistration of abandoned sites
X
Swimming pool X X
Solar system to backup electricity
X X
Security at grave yards X
Dust bin 12 X X Graveling or paving of roads
Library X Closing of canal(water) next to Mantshebo School
Flush toilets for community
X X Street lights
Bridge over railway for school children
X X High mast lights
Clinic X Water drainage next to all roads
Waste removal X X Residential sites
RDP houses X Dustbins
Tittle deeds X Clinic
High mast lights X X X Community hall
Resealing of roads X X Library
Water carnal next to Mantshebo school
X X
Speed humps X X
Visible policing X

86
Sports facilities X
Youth employment and empowerment
X
Grading of roads X X
Community hall X X
Pave roads 13 X X Paving of roads
Ensure street light work X X Water and sanitation at Freedom Square
Library X Primary school
Sites X X High mast light maintenance
RDP houses X Park for adults and children
Carnal between Hani park and ward 13
X X Library
Bridge between Ext 15 and 13
X X Fencing and paving of roads in Phumlani cemetery
Police station X Police station
Clinic X Bridge crossing over railway to ext 15
Schools X Sites and RDP houses
Need stalls at freedom square
X X
Poverty alleviation projects X
Re-open storm water carnal next to railway
X X Speed humps
Expansion of Thabong East sewer plant
X X Paving
Completion of Moshoeshoe road
X X Extend sewer pump in ward 14
Sporting facilities X X Refuse removal
Tittle deeds X Bridge crossing railway to Ext 15
High mast lights X X X Tittle deeds
Eradicate two roomed houses
X Sports fields
Police station X Storm water channels

87
Bridge crossing to Ext 15 14 X X Business and church sites
Old age home X Dustbins
24hrs medical facility X High mast lights
Sites (residential, churches etc)
X X RDP houses
Storm water carnal next to Letsete S school
X 24hrs clinic and shelters
Taxi offloading areas X X
Tittle deeds 15 X Roads
Attend to incorrect billing X X Sites
Speed humps X X Housing/RDP
Tar roads X X Jobs
Change ownership of abandoned sites
X Sports facilities
Erect carnal next to Letsete S school
X X Tittle deeds
Indigent registration X Refuse bins
Municipality to maintain hostel units
X X Sewage – upgrade
High mast lights X X X Water metre upgrade
Taxi offloading areas X School halls
Letsete/Nanabolela
Water connection and site allocation
X
RDP Houses 16 X Roads
Maintenance and service community hall
X X RDP
Extend one room houses X Tittle deeds
Police station in far east X Demolish dilapidated houses for elderly
Potholes X X Clinic
Paving streets X X Infrastructure in T11
High mast lights X X X Sites
Attend to sewer challenges X X Renaming of streets
Provision Solar geysers X X

88
Tar Roads and storm water carnal
X X
School Hall X X
Arts Centre X X
Need for new primary school
17 X x Roads
Grade streets- x Address sewer problems Doornpan and Thubelisha
Library X X High mast lights not working
Sports grounds and parks X X Need for 6 high mast lights
Renaming of streets
X X Need for new primary school
Pave and tar roads X X Grade streets-
Shopping Centre X X Library
Government offices X X
Police station X X
Speed humps in all roads X X
Fix high mast lights X X
RDP Houses X X
Connect water to houses X X
Fix water leakages 18 X X Fix and replace meters in block 1,2 an K5
Sites X X Roads to be resealed
Pave/tar/gravel Streets X X Potholes to be fixed
Maintenance of infrastructure
X X Extra high mast lights in K2, K5 block2 and block 4
Youth employment projects X
RDP houses
X
TVET college X
High mast lights X X X
Water meters X X
Clinic 24/7 X

89
Dustbins 19 X X Site (residential, churches and NPO)
Roads maintenance X X Convert old mining hostel to TVET
RDP Houses X Bursaries and learnerships
Sites (residential, churches and business)
X X Land for multipurpose centre
Fix sewer problems X X New Community hall
Clinic 24/7 X X Maintenance of the stadium and be completed
High mast lights X X X Old age home
Paving of Roads X X Land for industrial park
Speed humps
X X Business sites at a reasonable price
Convert mining hostels to units
X Rezone area for residential sites to shopping complex
Parks X X Funding and training of SMMEs
Emergency Jojo tanks at cemeteries
X X Land for small scale farming
Reselling of Tar roads X Nyakallong farmers trust must get electricity
TVET satellite campuses X X Office for ward councillor and ward committee with full equipment
SASSA & home affairs offices
X Paving and resealing of roads
Community Hall X X Robots at R30 road on both Nyakallong entrances
Build Multi-purpose centre X X Streetlights and high mast lights
Tittle deeds Communal taps
Land for small scale farming
X Infrastructure at the graveyard
Call centre X

90
Sites 20 X X Sewage
Fix sewer networks X X Sites
Grass cutting, refuse removal and clear illegal dumping
X X Pave roads and seed humps
Fix streetlights X X Fix streetlights and high mast lights
High mast lights X X X Complete taxi rank
Correct meter reading X Extend Police station
Pave roads X X Renovate municipal offices
Install water meters K2 X X Fix and install new water meters
Decentralize municipal offices
X Youth development centre
Full operation of municipal offices in township
X Complete toilets and dilapidated houses
Youth development centre X X TVET college
Complete stadium
X X X Solar energy
Free wi-fi X X Free wi-fi
Build Police Station X Rezoning of Erven 6271/6272 for residential area
Sites X X Construction of road KUT 272 Seqhobong high school
Street naming X Allocation of roads KUT 223
Pave streets X X KUT 210
Water carnal next to paved roads
X X
Avail Dustbin X X
Job creation X
Sports and skills development centre
X X
Refuse removal X X

91
Shopping mall 21 X
RDP House for 4318 K5 X
Deregistration of sites X
Tittle deeds
X
Fix pipe bursts X X
Fix roads X X
Complete Hlasela projects 22 X X Water and sanitation in K9, K7, K10
Bucket eradication K10 X X Paving of new streets in K7
Storm water canal from K7 to K4
X X Resealing of roads
Sites X X Gravelling of roads
Clean storm water canals X X Storm water canals
Connect sewer and electricity at 79 houses
X X Replacing of asbestos roofing
RDP Houses X 19 unfinished houses to be completed
Tittle deeds X Housing
Deregistration of sites X High mast lights
TVET college X X Electrification of households in K10
Old age home
X Fencing park in Khotsong
Attend to sewer and meter boxes
X X Sites for NGOs, NPOs, Schools, Business and Churches
Fix toilet at 9491 K9 X X Sports grounds and recreation areas
Need Houses, tap water and flushing toilets
X X Sewer for entire ward
Cleaning and maintenance of the area
X X 500 sites
Sewage and pump station problems
X X Paving streets
Sites (500) X X High mast light

92
Library 23 X Library
Police station X Police station
High mast lights X X X Houses
Street naming X Community hall
Shopping complex X Another Primary school
Home affairs offices X High school
Build Agricultural village 24 X X Construction of sewer system and fixing of sewer station in Hani park
Sites X X Construction of
roads(paving/graveling) Hani park
Fix and develop water canals next to main roads
X X Storm water drainages in Hani park
Increase number of commonages
X X Electrification of site/houses in Hani park
Build old age home for farm workers
X Build Operation Hlasela centre in Hani Park
Avail agricultural land for communities
X 2 new High mast lights in Hani park and fix 2
Recreational facilities X X Installation of meters in Hani Park
Formalise informal settlement
X X Fixing of meter and leakages in Hani park
Pedestrian crossing X X Build RDP houses in Hani park
Mobile police station
X Land for residential sites
Fix sewer X X Allocate sites for informal settlement resident in Hani park
High mast lights X X Land for agricultural village
Grass cutting and sports grounds
X X X Land for rental housing
Dustbins X Sports grounds in Hani Park
Bursaries X X Land commonages

93
Electricity X Need land for business sites
Library in Hani park X Land for church sites
Refuse removal X X
Paving of roads X X
High school X
Clinic 25 X Tittle deeds
High mast lights
X Residential sites
Road paving in 2010 and Phokeng village
X X Circle in corner Craib and Louis
Speed humps X X Sewer network
Perking of sites in Phokeng X Clinic high mast lights
Playgrounds and sports facilities
X X Road paving in 2010, Phokeng, Ramaphosa,
Communal taps X X Speed humps
Job creation projects X Perking of sites in Phokeng and Ramaphosa
Primary school X Communal taps
Police station X Primary school
Installation of water meters and electricity
X X Police station
Repair streetlights X X Installation of water meter and electricity
Refuse removal must be consistent
X X Repair streetlights
Potholes X X Refuse removal
Grass cutting
X X Road signs and grass cutting
Prepaid meters for pensioners in Riebeeckstad
X Prepaid meters for pensioners in Riebeeckstad
Road signs in golden avenue
X X Playing grounds and sports facilities
Bush cutting and enclosure of parks
X X Dustbins

94
Reseal roads 26 X X Tar roads
High mast lights X X X Reseal roads
Build storm water canals X X Speed humps on all tarred roads
Sites X X Storm water next to number12401
Speed humps X X Sites for tenants
Dustbins X X High mast lights next to 8225 and 8183
Remove meters in the courtyard in Las Vegas
X X Youth employment
Tittle deeds
X Dustbin
Demolish 2 room houses X Tittle deeds
Pave Dr Mgoma and Modikeng (Remaining)
X X 2 roomed houses be renovated
Streetlight to be fixed X X Consolidation subsidies (NEWCHO) be demolished
Youth Unemployment X X Incomplete houses be attended to
Consolidation Subsidies (NEWCO Houses)
X Build ward councillor office at 12511
Incomplete Houses X Soccer field and netball ground be attended to
Storm water Drainage (5726)
X X Remove water meters from courtyard at Las-Vegas
Use 5% of budget to attract investors
27 X
Sports facilities X X X
High mast lights in Paballong
X X
Fix streetlights
X X
Visible policing and mobile police station
X
Tree cutting X X

95
Clean opens spaces X X
RDP houses 28 X
Close open manholes X X
Establish cooperatives X
High mast lights X X X
Parks X X
Clinic X
Tittle deeds X
Fix sewer system X X
Paving roads X X
Sports facilities X X
Sites X X
40 000 capacity stadium to be included in IDP
X
Revitalize Kotoki park & the one behind Thabong stadium
29 X X Water canal from Moremaphofu to Mxi Streets
Upgrade sewer network X X Infrastructure in
Thokoza be attended
Fix streetlights in Mponeng X X Tladi street be revisited
High mast lights in Ndaki X X Kotoki football ground
Speed humps X X Pave all unpaved streets
Refuse removal X X High mast lights and streetlights in Thuhloane and Mothusi road
Fix water leakages X X Park and playing grounds
Demolish old houses X
Build water canal in Maremaphofu
X X
Pave all streets 30 X X Paving blocks in Mmatsa, Chalale
Reseal road in front of old shops
X X Sidewalk and storm channels

96
Pedestrian crossing X X Water canals
High mast lights in Nkoane, Modikeng and Modikeng
X X Street lights in Constantia, Mothusi, Masole and Thelingoane
Build clinic X High mast lights
Replace asbestos roofing X Fencing of rental stock A,B and C
Connect Lichecko and Morake street
X X Replacing of asbestos roofing
Maintain halls X X Demolishing of 4 room houses and rebuilding of BNG houses
Speed humps in Molai street
X X Replacing of aging water pipes and meter
RDP X Upgrading of sewer pipe system
Sites for young people X X Two water hydrants
Playing grounds X X Majakathata IND park
Renovation of toilets
X Revamping of old shopping complex
Renovation of RDP houses for pensioners
X Establishing MLM youth business forum
Renew sewer pipes X Revamp municipal abandoned buildings for development centre
Job creation X X
Street light between Mothusi road and Bongani hospital
31 X X Sites
Speed humps X X Renovate and pave thabong community centre
Reseal road between Thola-mtwana and Thelerene
X X Paving of streets
Street lights between Thula-mtwana and Thelerine
X X Chuime street to be tarred
Build RDP houses X High mast lights maintenance

97
Provide Dustbins X Street lights in Constantia, Thelingoane and Thuhloane road be fixed and maintained Fix water leakages X X Community food garden behind TCC
Storm water canals X X Community fun park or outdoor sports facility
High mast lights X X X Day care centre site
Maintenance of roads X X Outstanding tittle deeds
Sports facilities X Turn kitchen building in Moeletsi rental unit into community centre
Tittle deeds X Replace stolen metres
Graveling X X
Maintain and revitalize CBD 32 X X Health clinic in Reitz park
Maintain roads
X X Potholes
Review and decrease municipal tariffs
X Fix streetlights
Maintain park and be guarded
X X Fix water leakages
Multipurpose centre X X Traffic signs and traffic lines
Streetlights X X Parks and spaces be
maintained and grass cutting regularly
Potholes X X Waste management
Grass cutting in all parks X X
Fix theronia X X
Refuse removal X X
Speed humps X X
Storm water drainage cleaning
X X
Develop show grounds X X

98
Fix sewer problem at taxi ranks
X X
Maintenance of general infrastructure
33 X X
Tree pruning and grass cutting
X X
Fix potholes X X
Install new water meters X
Fix street lights X X
Fix leakages X X
Residential sites 34 X X
Clinic X
Street lights X X
Library X
Grass cutting X X
Renovate old building into orphanage homes
X
Refuse removal during
working hours not night
X X
Close open manholes X X
Maintenance of general infrastructure
X X Install stolen electricity
distribution boards and
prepaid meter in 742
shacks Loitering cattle X Replace water meters ion
all sites
Residential sites X X New road between
Jabulani village and Ext 2(1.2km)
Potholes spilled sewer X X Replace 150 asbestos
sewer pipes at ex mine
village houses (SLP)
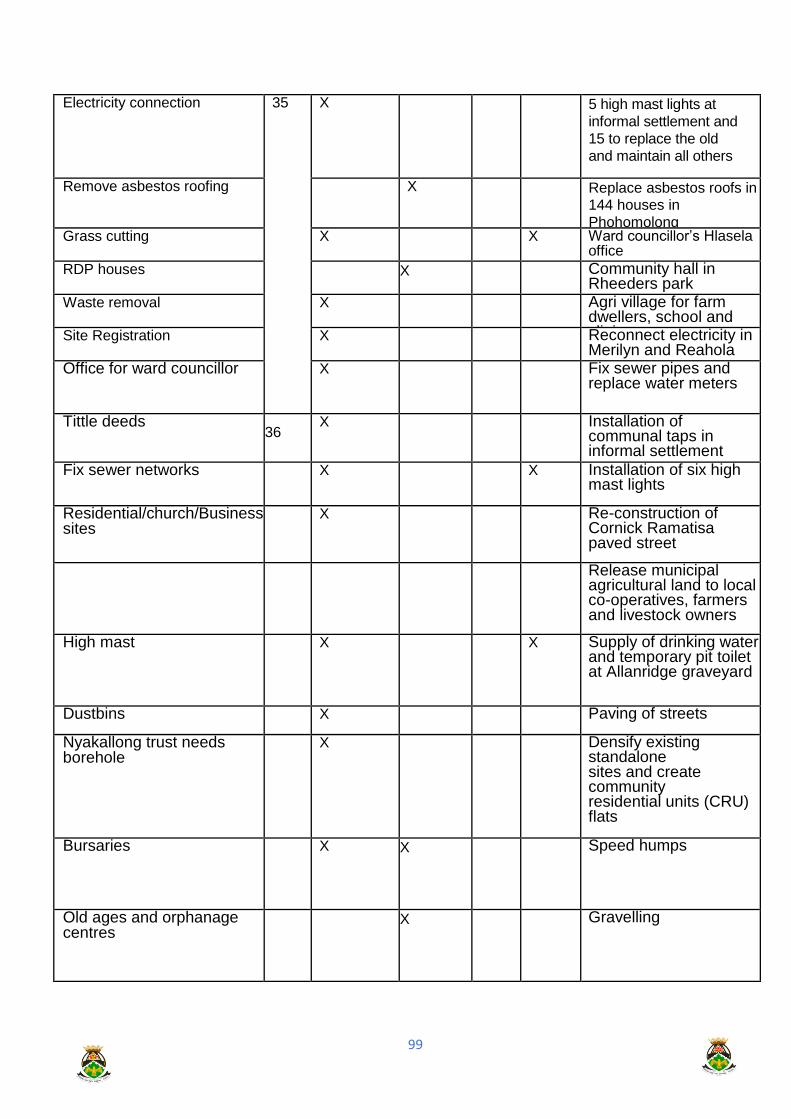
99
Electricity connection 35 X 5 high mast lights at
informal settlement and
15 to replace the old
and maintain all others
Remove asbestos roofing X Replace asbestos roofs in 144 houses in
Phohomolong Grass cutting X X Ward councillor’s Hlasela
office
RDP houses X Community hall in Rheeders park
Waste removal X Agri village for farm dwellers, school and clinic Site Registration X Reconnect electricity in Merilyn and Reahola
Office for ward councillor X Fix sewer pipes and replace water meters
Tittle deeds 36
X Installation of communal taps in informal settlement
Fix sewer networks
X X Installation of six high mast lights
Residential/church/Business sites
X Re-construction of Cornick Ramatisa paved street
Release municipal agricultural land to local co-operatives, farmers and livestock owners
High mast
X X Supply of drinking water and temporary pit toilet at Allanridge graveyard
Dustbins X Paving of streets
Nyakallong trust needs borehole
X Densify existing standalone sites and create community residential units (CRU) flats
Bursaries
X X Speed humps
Old ages and orphanage centres
X Gravelling

100
Fix streets and paving
X X Build community hall at Skoonplaas
Shopping mall
X Park in Nyakallong
Communal taps for SANCO village
X
Clinic 25/7 and proper staffing
X Purchase old dilapidated mines and release to community
Reseal Ramatisa street
X X Sports field
TVET satellite campus
X Revamp RDP houses that were not properly constructed
SASSA offices
X Sewer line in Phahameng must be replaced
Housing subsidies
X Renovate Allanridge Town Hall
Convert mining hostels to units
X X Build community residential units(flats)
Speed humps
X X Repair public facilities near Odendaalsrus hall
Build Multipurpose Centre
X X X Renovate facilities at the Odendaalsrus taxi rank
Councillor offices to be under building maintenance and cleaning program
X Kalkuil village streets be reconstructed and install 2 high mast lights

101
Sewer line, water and electricity in 7de-laan

102

103
FINANCIAL PLAN 1. INTRODUCTION This chapter reflects the three-year financial plan for Matjhabeng Local Municipality as per
the requirements of section 26(h) of the Municipal Systems Act 32 of 2000 read with
Regulation 2(3) of the Local Government: Planning and Performance Regulations, 2001.
The Financial Plan will reflect the budget projection for the MTREF, financial resources
available for capital project developments and operational expenditure, a financial strategy
that defines sound financial management and expenditure control, as well as ways and
means of increasing revenues and external funding for the municipality and its development
priorities and objectives. The aforementioned plan and strategies will contribute and ensure
the achievement of financial viability.
2. MEDIUM-TERM REVENUE AND EXPENDITURE FRAMEWORK (MTREF)
The budget is prepared and compiled within the MTREF. MTREF sets out the economic
context and assumptions that inform the compilation of the budget for the next three years.
However, it is reviewed annually to ensure that each year’s budget is affordable and
sustainable over at least the medium term.
The National Treasury Circulars states that municipal revenues and cash flows are expected
to remain under pressure in 2020/21 (MTREF) and so municipalities must adopt a
conservative approach when projecting their expected revenues and cash receipts. During
the tariff setting process we carefully considered affordability of tariff increases especially
as it relates to domestic consumers while considering the level of services versus the
associated cost, we aimed at balancing the affordability to poorer households and other
customers.
The main challenges experienced during the compilation of the MTREF can be summarised
as follows:
The ongoing difficulties in the national and local economy;
Aging and poorly maintained water, roads and electricity infrastructure;

104
The need to reprioritize projects and expenditure within the existing resource
envelope given the cash flow realities and declining cash position of the municipality;
The increased cost of bulk water and electricity (due to tariff increases from Sedibeng
Water and Eskom), which is placing upward pressure on service tariffs to residents.
Continuous high tariff increases are not sustainable - as there will be point where
services will no-longer be affordable;
Wage increases for municipal staff that continue to exceed consumer inflation, as
well as the need to fill critical vacancies;
Affordability of capital projects from own funding.
Availability of affordable capital/borrowing.
Budget Assumptions The following assumptions and parameters were considered in setting out the MTREF:
Consumer Price Index (CPIX) of approximately 6%
The CPIX inflation is forecasted to be within the upper limit of the 3 to 6 per cent
target band. (Source: Reserve Bank and National Treasury, MFMA Circular 98 & 99)
Increase in Sedibeng Water tariffs by 7.5%
Electricity tariff draft tariff increase of 6.22% (as per the Draft Nersa Guidelines.)
Eskom Tariff increase of 8.1%. (MFMA Circular 98 & 99)
Salary increases of approximately 6.5% (Collective Agreement)
National Treasury MFMA Budget Circular No. 98 & 99 (Guideline from NT)
These levels are within the South African Reserve bank inflation target range of 3% - 6%.
The municipality should justify all increases in excess of the upper boundary of the South
African Reserve Bank’s inflation target.
Operating Revenue Framework
For the municipality to achieve the set targets in terms of service delivery it needs to
generate sufficient revenue. The financial state of affairs of the municipality necessitates
105
difficult decisions to be made in terms of tariff increases, cost containment measures and
balancing expenditure against planned realistic revenues. Efficient and effective revenue
management is thus crucial.
The municipality’s revenue strategy is built around the following key components:
• National Treasury’s guidelines and macro-economic policy;
• Growth and continued economic development;
• Electricity tariff increases as approved by the National Electricity Regulator of South
Africa (NERSA);
• Achievement of full cost recovery of specific user charges especially in relation to
trading services;
• Determining the tariff escalation rate by establishing/calculating the revenue
requirement of each service;
• The municipality’s Property Rates Policy approved in terms of the Municipal Property
Rates Act, 2004 (Act 6 of 2004) (MPRA);
• Increase ability to extend new services and recover costs;
• The municipality’s Indigent Policy and rendering of free basic services; and
• Tariff policies of Matjhabeng Local Municipality.

106
The following table is a summary of the 2020/21 MTREF (classified by main revenue source):
Table 2 (Table A4 Budgeted Financial Performance – revenue and expenditure) reflects the operating revenue which excludes the
capital transfers and contributions which is in line with the Municipal Budget and Reporting Regulations. The inclusion of these
revenue sources will distort the calculation of the operating surplus/ (deficit).
The main sources of revenue are property rates, service charges and transfers recognized as operational.
FS184 Matjhabeng - Table A4 Budgeted Financial Performance (revenue and expenditure)
Description 2016/17 2017/18 2018/19
R thousandAudited
Outcome
Audited
Outcome
Audited
Outcome
Original
Budget
Adjusted
Budget
Full Year
Forecast
Pre-audit
outcome
Budget Year
2020/21
Budget Year
+1 2021/22
Budget Year
+2 2022/23
Revenue By Source
Property rates – 298 925 376 083 311 696 376 696 376 696 376 696 399 297 417 665 436 878
Serv ice charges - electricity rev enue – 570 256 561 371 761 499 731 499 731 499 731 499 776 999 825 169 898 609
Serv ice charges - w ater rev enue (20 000) 296 440 315 556 359 183 359 183 359 183 359 183 380 734 398 247 416 567
Serv ice charges - sanitation rev enue (10 000) 139 824 146 331 153 037 156 037 156 037 156 037 165 399 173 007 180 966
Serv ice charges - refuse rev enue (3 032) 95 041 100 868 90 352 104 352 104 352 104 352 110 613 115 701 121 023
Rental of facilities and equipment 13 963 15 358 22 324 22 324 22 324 22 324 23 663 24 752 25 890
Interest earned - ex ternal inv estments 2 419 1 119 3 858 3 858 3 858 3 858 4 089 4 277 4 474
Interest earned - outstanding debtors 177 971 204 822 143 825 203 825 203 825 203 825 216 054 225 993 236 389
Div idends receiv ed 18 20 22 22 22 22 23 24 25
Fines, penalties and forfeits 10 525 8 878 22 404 22 404 22 404 22 404 23 748 24 840 25 983
Licences and permits 80 80 80 80 – – 95
Agency serv ices – – – – – –
Transfers and subsidies 463 206 399 297 513 333 513 333 513 333 513 333 548 702 590 852 632 993
Other rev enue – 31 640 30 182 238 193 238 193 238 193 238 193 252 961 431 217 233 045
Gains 64 582 52 176 53 000 53 000 53 000 53 000 56 180 10 000 10 000
Total Revenue (excluding capital transfers and
contributions)
(33 032) 2 164 810 2 212 061 2 672 803 2 784 803 2 784 803 2 784 803 2 958 462 3 241 745 3 222 936
Current Year 2019/202020/21 Medium Term Revenue &
Expenditure Framework

107
Property Rates
Property Rates increases to R399 297 428 in the 2020/21 financial year and represents
13% of the revenue budget. The property rates tariffs will increase with 6% in the 2020/21
financial year, this increase is guided by MFMA Circular 98 and 99 and is in line with the
CPIX. The collection rate on property rates is set at 90%.
Service charges
The service charges for the 2020/21 budget is R1 433 744 076, 49% of the revenue is from
service charges. Service charges consist of revenue derived from electricity, water,
sanitation and refuse. Electricity revenue increases with an overall average of 6,22% as
determined by the National Energy Regulator of South Africa (Nersa) municipal tariff
guideline increase for the financial year 2020/21. The budgeted amount for electricity is
R776 998 640. Budgeted Water revenue is R380 733 724 in the 2020/21. Sanitation and
Refuse service charges increase with 6%, this increase is in line with the CPIX as prescribed
in MFMA Circular 98. The budgeted amount for Sanitation services is R 165 398 993 and R
110 612 719 for Refuse.
Operational Transfers and Grant receipts
Transfers recognized as operational receipts is the second largest revenue source totaling
which is 18% of the revenue and amount to R548 702 000 for the 2020/21 financial year as
per the draft Division of Revenue (DoRA) Bill 2020. The Equitable share allocation is a grant
which supplement the municipality’s own revenue for the provision of the necessary basic
level of services to each poor household within their jurisdiction.
Other Revenue Sources
Other revenue sources consist of rental of facilities and equipment, interest earned, fines,
gains on disposal of assets and other revenue.

108
Gains on disposal of PPE
The municipality intends to dispose of assets during the 2020/21 financial year and has
already started with the process. The projected revenue from the disposal of assets is R56
180 000. This projected revenue will be utilized as a source of funding for capital projects.
Other Revenue
The budgeted amount for other revenue is R252 961 356.
Proposed Tariff Increases
Tariff setting is a pivotal and strategic part of the compilation of the budget. During the
revision of the tariffs the local economic conditions, input costs, the macro-economic
forecasts as prescribed by MFMA circulars and the affordability of services were taken into
account to ensure financial sustainability. The municipality also participated in a tariff setting
workshop which was presented by the National and Provincial Treasury.
The table below provides information on the proposed tariff increases for the service
charges. The average tariff increase for rates will be 6%. The estimated tariff increase for
Revenue per source
Property rates Service charges - electricity revenue Service charges - water revenue
Service charges - sanitation revenue Service charges - refuse revenue Rental of facilities and equipment
Interest earned - external investments Interest earned - outstanding debtors Dividends received
Fines, penalties and forfeits Licences and permits Transfers and subsidies
Other revenue Gains on disposal of PPE

109
water will be 6% and electricity will be increased with an overall average 6.22%. The tariff
increases for sewerage and refuse will be at 6% which is in line with the CPIX.
Tariff increases – Revenue 2018/19
Revenue category Average tariff increases
Rates 6% Water 6 % Electricity 6.22% Sewerage 6% Refuse 6%
The general tariffs will be increased with 6%.
The municipality commenced with the implementation of the winter and summer tariffs for
electricity in the 2014/15 financial year. A comprehensive tariff study was performed on the
electricity tariff to ensure full cost recovery. The proposed overall average tariff increase for
electricity will be at 6.22% as per the NERSA requirements. The municipality will continue
implementing the winter, summer tariff as well as Inclining Block Tariffs (IBT) during the
2018/19 financial year as well as the outer years.
The municipality however still experience challenges in performing a fully cost reflective
study on other tariffs. Therefore, in considering the drafting of the budget in the 2018/19
financial year our tariffs must be cost reflective notwithstanding the CPIX and regulations by
National Treasury. This is in consideration of improving revenue collection of these facilities
as well as the quality of services to be provided by the municipality. To this extent all
departments of the municipality will be required to evaluate their tariffs so that they are cost
reflective and market related. The cost reflective tariffs will be phased in.

110
Operating Expenditure Framework
FS184 Matjhabeng - Table A4 Budgeted Financial Performance (revenue and expenditure)
Description Ref 2016/17 2017/18 2018/19
R thousand 1Audited
Outcome
Audited
Outcome
Audited
Outcome
Original
Budget
Adjusted
Budget
Full Year
Forecast
Pre-audit
outcome
Budget Year
2020/21
Budget Year
+1 2021/22
Budget Year
+2 2022/23
Revenue By Source
Property rates 2 – 298 925 376 083 311 696 376 696 376 696 376 696 399 297 417 665 436 878
Serv ice charges - electricity rev enue 2 – 570 256 561 371 761 499 731 499 731 499 731 499 776 999 825 169 898 609
Serv ice charges - w ater rev enue 2 (20 000) 296 440 315 556 359 183 359 183 359 183 359 183 380 734 398 247 416 567
Serv ice charges - sanitation rev enue 2 (10 000) 139 824 146 331 153 037 156 037 156 037 156 037 165 399 173 007 180 966
Serv ice charges - refuse rev enue 2 (3 032) 95 041 100 868 90 352 104 352 104 352 104 352 110 613 115 701 121 023
Rental of facilities and equipment 13 963 15 358 22 324 22 324 22 324 22 324 23 663 24 752 25 890
Interest earned - ex ternal inv estments 2 419 1 119 3 858 3 858 3 858 3 858 4 089 4 277 4 474
Interest earned - outstanding debtors 177 971 204 822 143 825 203 825 203 825 203 825 216 054 225 993 236 389
Div idends receiv ed 18 20 22 22 22 22 23 24 25
Fines, penalties and forfeits 10 525 8 878 22 404 22 404 22 404 22 404 23 748 24 840 25 983
Licences and permits 80 80 80 80 – – 95
Agency serv ices – – – – – –
Transfers and subsidies 463 206 399 297 513 333 513 333 513 333 513 333 548 702 590 852 632 993
Other rev enue 2 – 31 640 30 182 238 193 238 193 238 193 238 193 252 961 431 217 233 045
Gains 64 582 52 176 53 000 53 000 53 000 53 000 56 180 10 000 10 000
Total Revenue (excluding capital transfers
and contributions)
(33 032) 2 164 810 2 212 061 2 672 803 2 784 803 2 784 803 2 784 803 2 958 462 3 241 745 3 222 936
Expenditure By Type
Employ ee related costs 2 – 691 253 726 308 785 036 785 036 785 036 785 036 836 063 874 522 914 750
Remuneration of councillors 31 681 32 963 33 754 33 754 33 754 33 754 35 948 37 601 39 331
Debt impairment 3 524 615 554 662 551 895 522 650 522 650 522 650 200 000 200 000 200 000
Depreciation & asset impairment 2 – 213 701 212 795 216 298 116 298 116 298 116 298 123 276 120 000 120 000
Finance charges 202 718 324 320 140 826 190 826 190 826 190 826 202 275 211 557 221 289
Bulk purchases 2 – 954 324 1 052 109 1 028 643 722 893 722 893 722 893 1 078 988 1 131 339 1 183 381
Other materials 8 77 284 138 748 132 679 126 913 126 913 126 913 134 528 140 717 147 190
Contracted serv ices – 250 190 186 495 215 869 221 978 221 978 221 978 190 571 196 016 204 708
Transfers and subsidies – – – 2 000 1 200 1 200 1 200 750 750 750
Other ex penditure 4, 5 – 184 359 313 878 139 216 139 624 139 624 139 624 155 964 154 052 159 570
Losses
Total Expenditure – 3 130 125 3 542 279 3 246 217 2 861 173 2 861 173 2 861 173 2 958 364 3 066 555 3 190 968
Surplus/(Deficit) (33 032) (965 315) (1 330 217) (573 413) (76 370) (76 370) (76 370) 98 175 189 31 968
Transfers and subsidies - capital (monetary
allocations) (National / Prov incial and District) 141 911 151 383 170 615 170 615 170 615 170 615 153 247 163 862 174 830
Transfers and subsidies - capital (monetary
allocations) (National / Prov incial Departmental
Agencies, Households, Non-profit Institutions,
Priv ate Enterprises, Public Corporatons, Higher
Educational Institutions) 6 –
Transfers and subsidies - capital (in-kind - all)
Surplus/(Deficit) after capital transfers &
contributions
(33 032) (823 404) (1 178 835) (402 798) 94 245 94 245 94 245 153 345 339 051 206 798
Tax ation
Surplus/(Deficit) after taxation (33 032) (823 404) (1 178 835) (402 798) 94 245 94 245 94 245 153 345 339 051 206 798
Attributable to minorities
Surplus/(Deficit) attributable to municipality (33 032) (823 404) (1 178 835) (402 798) 94 245 94 245 94 245 153 345 339 051 206 798
Share of surplus/ (deficit) of associate 7
Surplus/(Deficit) for the year (33 032) (823 404) (1 178 835) (402 798) 94 245 94 245 94 245 153 345 339 051 206 798
2020/21 Medium Term Revenue &
Expenditure FrameworkCurrent Year 2019/20

111
B – Expenditure
Employee Related Cost & Councillor Remuneration
The salary figure is 28%, R836 063 363 of the total expenditure. However not all vacancies
have been filled. This has an adverse impact on service delivery. Councillor Remuneration
represents 1%, R35 947 661 of the total expenditure budget.
Bulk Service
Supply of bulk services making up 36%, R1 078 988 080 of total expenditure budget. Eskom
is increasing its electricity with 8.1% and Sedibeng is increasing with 7.5%.
Other Materials
Other Materials which relates to inventory used for repairs and maintenance is R134 528
303, this is 5% of the total expenditure budget.
Contracted Services
Contracted services consist out of outsourced services, consultants and professions; and
contractors. The line item for contractors represents the repair and maintenance. The total
budget for contracted services is R 190 571 330 which is 6% of total expenditure budget.
Other Expenditure
Other General Expenditure relate to operational costs and are therefore inevitable. This
makes up 5%, R 155 963 887 of total expenditure.
Depreciation and Debt Impairment
The total amount budgeted for debt impairment and depreciation amounts to R323 276 014
which is 11% of the total expenditure budget.

112
The Municipality therefore has a great challenge of providing basic services to its population
with limited resources.
Cost Containment Measures
The President announced the cost-containment measures in the State of the Nation
address, and it was re-emphasised by the Minister of Finance during the Budget Speech. It
must further be noted that MFMA Circular 58, 66, 70, 72, 74 and 75 on cost containment
measures are still applicable with regard to curbing of non-priority spending. This group of
expenditure has also been identified as an area in which cost savings and efficiencies can
be achieved as per the financial recovery plan.
The municipality has already embarked on the process of the implementation of cost
containment measures. On 24 April 2015, Council resolved that a Financial Recovery Plan
should be developed and that Cost Containment Measures should from part of the plan. On
20 May 2015 the Financial Recovery Plan containing the cost containment measures was
tabled in Council and reviewed during the 2017/18 financial year. The municipality adopted
the Cost Containment Policy in the 2019/20 financial year.
Capital Budget
The Capital Budget for the 2020/21 financial year is R 153 247 000 and is entirely funded
by grants. The sources of funds for the capital budget are as follow:
Municipal Infrastructure Grant R 118 247 000
Water Services Infrastructure Grant R 35 000 00

113
Vote Description Ref 2016/17 2017/18 2018/19
R thousand 1Audited
Outcome
Audited
Outcome
Audited
Outcome
Original
Budget
Adjusted
Budget
Full Year
Forecast
Pre-audit
outcome
Budget Year
2020/21
Budget Year
+1 2021/22
Budget Year
+2 2022/23
Capital expenditure - Vote
Multi-year expenditure to be appropriated 2
Vote 01 - Council General 68 521 3 074 – 50 000 10 000 10 000 10 000 – – –
Vote 02 - Office Of The Ex ecutiv e May or – – – – – – – – – –
Vote 03 - Office Of The Speaker – – – – – – – – – –
Vote 04 - Council Whip – – – – – – – – – –
Vote 05 - Office Of The Municipal Manager – – – – – – – – – –
Vote 06 - Corporate Serv ices – – – – – – – – – –
Vote 07 - Finance – – – – – – – – – –
Vote 08 - Human Resources – – – – – – – – – –
Vote 09 - Community Serv ices (96) 35 084 42 418 – – – – 11 726 12 266 12 830
Vote 10 - Public Safety And Transport – – – – – – – – – –
Vote 11 - Economic Dev elopment 4 922 681 2 235 – – – – – – –
Vote 12 - Engineering Serv ices 54 411 62 720 13 159 – – – – – – –
Vote 13 - Water/ Sew erage 28 044 63 037 86 852 4 307 – 4 307 4 307 – – –
Vote 14 - Electricity 1 649 2 370 12 912 15 545 – 15 545 15 545 – – –
Vote 15 - Other – – – – – – – – – –
Capital multi-year expenditure sub-total 7 157 451 166 966 157 577 69 852 10 000 29 852 29 852 11 726 12 266 12 830
Single-year expenditure to be appropriated 2
Vote 01 - Council General – – – – – – – – – –
Vote 02 - Office Of The Ex ecutiv e May or – – – – – – – – – –
Vote 03 - Office Of The Speaker – – – – – – – – – –
Vote 04 - Council Whip – – – – – – – – – –
Vote 05 - Office Of The Municipal Manager – – – – – – – – – –
Vote 06 - Corporate Serv ices – – – – – – – – – –
Vote 07 - Finance – – – – – – – – – –
Vote 08 - Human Resources – – – – – – – – – –
Vote 09 - Community Serv ices – – – 36 380 – 36 380 36 380 21 670 12 207 12 769
Vote 10 - Public Safety And Transport – – – – – – – – – –
Vote 11 - Economic Dev elopment – – – – – – – – – –
Vote 12 - Engineering Serv ices – – – 15 752 – 15 752 15 752 2 847 2 978 3 115
Vote 13 - Water/ Sew erage – – – 95 718 – 95 718 95 718 107 944 126 935 136 204
Vote 14 - Electricity – – – 2 912 – 2 912 2 912 9 060 9 476 9 912
Vote 15 - Other – – – – – – – – – –
Capital single-year expenditure sub-total – – – 150 763 – 150 763 150 763 141 521 151 596 162 000
Total Capital Expenditure - Vote 157 451 166 966 157 577 220 615 10 000 180 615 180 615 153 247 163 862 174 830
2020/21 Medium Term Revenue &
Expenditure FrameworkCurrent Year 2019/20

114
The above table gives an indication of the capital expenditure per vote. The bulk of the
capital budget is related to service delivery vote, which is community service, water,
sewerage and electricity.
Financial Resources for Capital Projects and Operating Expenditure
Section 18 (1) of the Municipal Finance Management Act 56 of 2003 states that an annual
budget may only be funded from realistically anticipated revenues to be collected; cash-
backed accumulated funds from previous years’ surpluses not committed for other
purposes; borrowed funds, but only for the capital budget.
The capital projects are funded from grants. The main source of funding are grants such as
the Municipal Infrastructure grant. The capital budget is funded by grants and own funding.
The municipality’s capital replacement reserve must reflect the accumulated provision of
internally generated funds designated to replace aging assets.
The operating expenditure is funded form operating income which consist of assessment
rates, trading services, grant income and other income e.g. rental income and fines
FINANCIAL STRATEGY
The revenue collection rate of the municipality for the past financial years varied between
55% and 60% which resulted in a negative cash flow position. The current ratio of the
municipality is presently at 0.32:1, which indicates that the current assets of the municipality
are insufficient to cover its current liabilities. A current ratio in the excess of 2:1 is considered
healthy.
During the 2016/201 financial year the municipality received an unqualified audit opinion.
The municipality developed an audit query action plan to address the issues raised in the
audit report and to also ensure that the issues do not re-occur in the future.

115
The following strategies have been employed to improve the financial management
efficiency and the financial position of the municipality.
Revenue Raising Strategy
In order for Matjhabeng Local Municipality to improve the quality of the services provided it
will have to generate the required revenue. The municipality’s anticipated revenue is based
on a collection rate of 60%. The municipality aspires to improve their collection rate to 80%
- 85%. A revenue strategy has been developed to ensure the improved collection rate is
achieved.
The municipality’s revenue strategy is built around the following key components:
• National Treasury’s guidelines and macroeconomic policy;
• Growth in the municipality and continued economic development;
• Efficient revenue management, which aims to ensure a 80 - 85 per cent annual
collection rate for property rates and other key service charges;
• Electricity tariff increases as approved by the National Electricity Regulator of South
Africa (NERSA);
• Achievement of full cost recovery of specific user charges especially in relation to
trading services;
• Determining the tariff escalation rate by establishing/calculating the revenue
requirement of each service;
• The municipality’s Property Rates Policy approved in terms of the Municipal Property
Rates Act, 2004 (Act 6 of 2004) (MPRA);
• Increase ability to extend new services and recover costs;
• The municipality’s Indigent Policy and rendering of free basic services; and
• Tariff policies of the municipality.
Asset Management Strategy An asset management strategy was identified to maintain the audit. The strategy will involve
the identification and verification of all assets, capturing of all the assets onto an integrated
asset management system, maintenance of the system and the production of an asset
register which is GRAP compliant.

116
Financial Management Strategy
The following are more of the significant programmes identified to address the financial
management strategy.
Develop and implement budget as per legislative framework
Review finance policies
Review of finance structure
Training and development of finance staff as well as the rest of the municipality
Unqualified audit report
Improve debt collection
Data purification
Accurate billing

117

118
6.1. Introduction
The Capital Infrastructure Investment Framework (CIIF) is a response to ensure that capital budget
and related operational funds are structured according to the strategic objectives and related outputs
as discussed above. Secondly that it’s funding allocation responds to national and provincial
directives within the context of the Municipal developmental realities.
The Capital Infrastructure Investment Framework (CIIF) is the means through which capital projects
are identified and prioritised for implementation in the following financial year and medium-term
period (3 years). The objectives of the CIIF are to:
Contribute towards the eradication of service delivery backlogs, especially in poor and
marginalised areas by prioritising projects in these locations;
Ensure the improved management of the existing infrastructure, with more attention given to
road and street lighting maintenance.
Improve service delivery through infrastructure and services that are planned, delivered, and
managed in an objective and structured manner;
Direct future public and private investment, by aligning capital budget requirements of
departments as defined in the IDP sector plans.
Make a positive impact towards improving the local economy. To this extent, the municipality
intends to spend 70% of the capital budget here below to and among local businesses.

119
6.2 INFRASTRUCTURE INVESTMENT / CAPITAL PLAN: 2020-2023
6.2.1 MUNICIPAL INFRASTRUCTURE GRANT (MIG) FUNDED PROJECTS
ITEM
NO.
PROJECT NAME WARD
NO.
CURRENT
STATUS
COMMENT/
NOTES
PROJECT
VALUE
BUDGET
2020/21
BUDGET
2021/22
BUDGET 2022/23
CEMETERIES
1.1 Kutlwanong: Creation
and Upgrading of
Cemeteries
35 Retention Establishing and
providing
infrastructure to
cemeteries
16 910 481,00 - - -
1.2 Meloding: Creation and
Upgrading of
Cemeteries
5 Retention Establishing and
providing
infrastructure to
cemeteries
15 714 832,00 - - -
1.3 Phomolong: Creation
and Upgrading of
Cemeteries
2 Retention Establishing and
providing
infrastructure to
cemeteries
16 910 481,00 - - -
1.4 Virginia: Creation and
Upgrading of
Cemeteries
9 Retention Establishing and
providing
infrastructure to
cemeteries
14 466 442,00 - - -
1.5 Bronville: Creation and
Upgrading of
Cemeteries
11 Retention Establishing and
providing
infrastructure to
cemeteries
16 277 243,00 - - -

120
ITEM
NO.
PROJECT NAME WARD
NO.
CURRENT
STATUS
COMMENT/
NOTES
PROJECT
VALUE
BUDGET
2020/21
BUDGET
2021/22
BUDGET 2022/23
1.6 Mmamahabane:
Creation and Upgrading
of Cemeteries
(New Development)
1 Construction Establishing and
providing
infrastructure to
cemeteries
36,576,729.42 2,184,551.44 - -
1.7
Allanridge: Provision of
water, sanitation and
high mast lights at the
cemetery
36 Design and
Tender
Water
Connection,
Ablution Facility,
1 Septic Tank, 1
High Masts
including
security light
2,734,002.81 2,734,002.81 - -
1.8 Allanridge: Provision of
water, sanitation and
high mast lights at the
cemetery phase 2
36 Design and
Tender
Construction of
Internal roads
including
packing
3 000 000.00 993 795.75 2 006 204.25 -
ROADS AND STORMWATER
1.9 Nyakallong:
Construction of storm
water system – phase 1
19 Construction Provision of
storm water
management
19,420,692.83 - - -
1.10 Nyakallong:
Construction of roads,
sidewalks & storm
water
19,36 Not
registered
Construction of
internal paved
roads,
pedestrian
walkways and
storm water
management
25 000 000.00 - 1,000,000.00 10,000,000.00

121
ITEM
NO.
PROJECT NAME WARD
NO.
CURRENT
STATUS
COMMENT/
NOTES
PROJECT
VALUE
BUDGET
2020/21
BUDGET
2021/22
BUDGET 2022/23
1.11 Mmamahabane:
Construction of roads,
sidewalks & storm
water
1 Not
registered
Construction of
internal paved
roads,
pedestrian
walkways and
storm water
management
25,000,000.00 - 2,236,946.43 22,113,789.92
1.12 Kutlwanong:
Construction of road,
sidewalks & storm
water
10,18 Not
registered
Construction of
internal paved
roads,
pedestrian
walkways and
storm water
management
25,000,000.00 - 5,000,000.00 10,000,000.00
1.13 Upgrading of Old
Thabong gravel roads
to concrete paving
blocks ward 28
28 Retention Construction of
internal paved
roads,
pedestrian
walkways and
storm water
management
16,981,825.16 -
1.14 Upgrading of Old
Thabong gravel roads
to concrete paving
blocks ward 26
26 Not
registered
Construction of
internal paved
roads,
pedestrian
walkways and
storm water
management
13 000 000.00 -
5,000,000.00

122
ITEM
NO.
PROJECT NAME WARD
NO.
CURRENT
STATUS
COMMENT/
NOTES
PROJECT
VALUE
BUDGET
2020/21
BUDGET
2021/22
BUDGET 2022/23
1.15 Upgrading of Old
Thabong gravel roads
to concrete paving
blocks ward 29
29 Not
registered
Construction of
internal paved
roads,
pedestrian
walkways and
storm water
management
13,000,000.00 - 400,000.00 2,500,000.00
1.16 Upgrading of Old
Thabong gravel roads
to concrete paving
blocks ward 30
30 Not
registered
Construction of
internal paved
roads,
pedestrian
walkways and
storm water
management
13,000,000.00 - 500,000.00 5,000,000.00
1.17 Upgrading of Old
Thabong gravel roads
to concrete paving
blocks ward 31
31 Not
registered
Construction of
internal paved
roads,
pedestrian
walkways and
storm water
management
13,000,000.00 - 500,000.00 8,081,758.64
1.18 Thabong Ext 22
Tandanani: Roads and
Storm water
25 Not
registered
Construction of
internal paved
roads,
pedestrian walk-
ways and storm
water
management
13,000,000.00 - - 500,000.00

123
ITEM
NO.
PROJECT NAME WARD
NO.
CURRENT
STATUS
COMMENT/
NOTES
PROJECT
VALUE
BUDGET
2020/21
BUDGET
2021/22
BUDGET 2022/23
1.19 Nyakallong
Construction of Storm
water System Phase 2
36 Not
Registered
Provision of
storm water
management
8,000,00.00 - 600,000.00 7,000,000.00
1.20 Meloding/Virginia:
Construction of 3km
paved roads and storm
water – phase 2
7 Design and
Tender
Construction of
3km paved
roads and storm
water
25,193,625.00 1 779 889.29 - -
1.21 Meloding: Upgrading of
3km paved roads and
storm water drainage
4 Design and
Tender
Upgrading of
3km paved
roads and storm
water drainage
27,781,860.71 27,781,860.71 - -
SANITATION
1.22 Matjhabeng: Upgrading
of 7 electrical panels at
sewer pump stations
Various Design &
Tender
Upgrading of
electrical panels
in pump stations
1 905 458,00
- - -
1.23 Whites: Septic Tank
System
3 Design and
tender
Provision of a
new sewer
treatment
system
(Improved
septic tank
system)
979 830.00 416,000.85 37,684.25 -
1.24 Upgrading of
Mmamahabane WWTW
1 Design and
Tender
Upgrading and
refurbish of
WWTW, Pump
station to
accommodate
future
12,953,790.00
8,691,779.87 647,688.00 -

124
ITEM
NO.
PROJECT NAME WARD
NO.
CURRENT
STATUS
COMMENT/
NOTES
PROJECT
VALUE
BUDGET
2020/21
BUDGET
2021/22
BUDGET 2022/23
development
and current
sewer volume
1.25 Kutlwanong: Upgrading
of Outfall sewer
18 Construction Construction of
new outfall
sewer and
house
connections to
correct levels
25,810,203.01 869,445.70 - -
1.26 Upgrade and refurbish
T8 pump station to
address new
developments.
14 Construction Upgrading of
current pump
station to
accommodat
e new
development
s and existing
new serviced.
(about 14500
stands)
18,456,037.97 684,115.27 - -
1.27 Upgrade of Kutlwanong
WWTW Phase 2 to
accommodate the new
3000 Stands
18 Not
registered
Upgrading of
WWTW to
accommodat
e sewer
volume from
3000 new
stands
41,896,185.60 22,392,045.06 1,596,838.56 -
1.28 Hennenman
Refurbishment of
WWTW
2 Not
registered
Upgrading of
wastewater
treatment works
12,000,000.00 - 1,000,000.00 10,500,000.00

125
ITEM
NO.
PROJECT NAME WARD
NO.
CURRENT
STATUS
COMMENT/
NOTES
PROJECT
VALUE
BUDGET
2020/21
BUDGET
2021/22
BUDGET 2022/23
1.29 Thabong Ext 15
Bronville: Provision of
sanitation services to
173 Stands (Vuk'uphile
Learnership)
23 Not
registered
Provision of
waterborne
sanitation
including water
and sewer
network
6,000,000.00 - - 500,000.00
1.30
Thabong Ext 15
Bronville: Provision of
sanitation services to
617 Stands
11 Not
registered
Provision of
waterborne
sanitation
including water
and sewer
network
24,686,697.55 3,481,752.87 14,465,496.32 -
1.31 Thabong Ext 26
Freedom Square:
Provision of sanitation
services to 391 Stands
(Vuk'uphile
Learnership)
13 Not
registered
Provision of
waterborne
sanitation
including water
and sewer
network
14,000,000.00 - - 9,000,000.00
1.32 Thabong: Upgrading of
Thabong Pump station
Not
registered
Upgrading of
Thabong Pump
station
10 000 000.00 - 10, 000 000.00 -
1.33 Kutlwanong K10
Provision of sanitation
services (Vuk'uphile
Learnership)
22 Not
registered
Provision of
waterborne
sanitation
including water
and sewer
network
16,000,000.00
- - 10,897 211.49

126
ITEM
NO.
PROJECT NAME WARD
NO.
CURRENT
STATUS
COMMENT/
NOTES
PROJECT
VALUE
BUDGET
2020/21
BUDGET
2021/22
BUDGET 2022/23
1.34 Phomolong Upgrading
of WWTW
2,3 Not
registered
Upgrading of
waste water
treatment works
28,600,000.00 - 28, 000 000.00 600,000.00
1.35 Upgrade and refurbish
2 sewer pump stations
in Meloding
Not
registered
Upgrading of
two sewer pump
stations in
Meloding
22,692,485.20 - 9,606,401.59 10,666,872.88
WATER
1.36 Allanridge replacement
of old galvanized steel
36 Construction Replacement of
old worn-out
dilapidated
galvanized steel
pipes
7,690,399.65 713,441.69 - -
1.37 Thabong X20 (Hani
Park): Extension of
network, house
connections and meters
(180 stands)
12 Construction Extension of
water network
and house
connections to
150 stands
4,202,064.08 254,284.06 - 3 947 780.00
1.38 Kutlwanong X9, K2,
Block 5 Water
connections and meters
(200 stands)
18,20,2
1
Not
registered
Provision of
water meters
for 200
stands
2,112,676.00 930,000.00 1,011,042.20 -

127
ITEM
NO.
PROJECT NAME WARD
NO.
CURRENT
STATUS
COMMENT/
NOTES
PROJECT
VALUE
BUDGET
2020/21
BUDGET
2021/22
BUDGET 2022/23
1.39 Kutlwanong
Replacement of
asbestos water
pipelines
Various Not
registered
Replacement of
asbestos pipes
14,738,349.20 7,618,473.95 6,097,795.85 -
1.40 Thabong Replacement
of asbestos water
pipelines
Various Not
registered
Replacement of
asbestos pipes
8 000 000,00 - 6 851 748.36 1 148 251.64
RECREATIONAL FACILITIES AND SPORTS
1.41 Meloding: Upgrading of
Indoor Sports Complex
4 Construction Upgrading of
sports complex
47,177,415.76 2,734,848.14 - -
1.42 Thabong: Upgrading of
the far east hall indoor
sports and recreational
facility
13 Construction Construction of
a new indoor
sports and
recreation hall
32,305,245.00
1,889,190.67 - -
1.43 Refurbishment of
Thabong Community
Centre
31 Design and
Tender
Upgrading and
refurbishment of
facilities.
10,000,000.00 697 076.19 - 2,500,000.00
LOCAL ECONOMIC DEVELOPMENT AND TAXI RANKS
1.44 Welkom: Upgrading &
Provision of New
Facilities for Streets
Traders
32 Retention Provision of
facilities for
street traders
2 161 240,00 - - -
1.45 Welkom: Industrial park
SMME Zone Fencing/
Paving & Shelter
32 Retention Provision of
facilities for
SMME Zone
31,555,107.00
- - -

128
ITEM
NO.
PROJECT NAME WARD
NO.
CURRENT
STATUS
COMMENT/
NOTES
PROJECT
VALUE
BUDGET
2020/21
BUDGET
2021/22
BUDGET 2022/23
1.46 Welkom Regional Taxi
Centres
32 Design &
Tender
Upgrading of
taxi facilities in
Welkom
68 066 162,40 - - -
SOLID WASTE MANAGEMENT
1.47 Upgrading of Welkom
Landfill Site
11 Construction Upgrading of
landfill to
accommodate
waste volumes
18,021,120.00 1,346,784.57 - 16 674 335.43
1.48 Upgrading of
Odendaalsrus Landfill
site
35,36 Construction Upgrading of
landfill to
accommodate
waste volumes
33,361,700.95 8,904,413.42 24 457 287.53 -
ELECTRICITY
1.49 Thabong: Twenty Ten
Provision and
Installation of 5 High
Mast Lights
Design and
Tender
Provision and
Installation of
High Mast
Lights
3,024,941.10 3,024,941.10 - -
1.50 Mothusi and Constantia
Road Provision and
Installation of Street
lights
12,13,
14,15,2
8,29
30,31,
Not
Registered
Provision and
Installation of
Street lights
along Mothusi
and Constantia
30,971,173.26 18 124 306.60 12 846 866.66 -
TOTALS 118 247 000.00 128 862 000.00 136 630 000.00

129
6.2.2 WATER SERVICES INFRASTRUCTURE GRANT (WSIG) FUNDED PROJECTS
ITEM
NO.
PROJECT NAME WARD
NO.
CURREN
T
STATUS
COMMENT/ NOTES PROJECT VALUE BUDGET
2020/21
BUDGET
2021/22
BUDGET
2022/23
1 Refurbishment of
Theronia WWTW
and Purified
Effluent System
33 Construct
ion
Refurbishment of the
WWTW to a functional
capacity of 15Ml per day
and the refurbishment of
the purified effluent
system for the purpose
of irrigating schools,
municipal parks, road
medians, traffic circles,
etc
R56 825 000.00 R30 000 000 R26 825 000 R -
TOTALS R30 000 000 R26 825 000 R

130
6.2.3 INTEGRATED NATIONAL ELECTRIFICATION PROGRAMME GRANT (INEP) FUNDED PROJECTS
ITEM
NO.
PROJECT NAME WARD
NO.
CURRENT
STATUS
COMMENT/ NOTES PROJECT
VALUE
BUDGET
2020/21
BUDGET
2021/22
BUDGET
2022/23
1 Upgrading of Urania
132kV 20MVA Sub-
Station
11 Planning R68 000 000 R30 000 000 R30 000 000 R 8 000000-
2 Rheederspark X2
(Phomolong Village):
12MVA Sub-station and
Electrification of 869
households
35 Planning R27 000 000 R10 000000 R5000 000 R8 000 000
TOTALS R40 000 000 R35 000 000 R16 000 000

131
6.2.4 OWN FUNDED PROJECTS
ITEM
NO.
PROJECT NAME WARD
NO.
CURRENT
STATUS
COMMENT/ NOTES PROJECT
VALUE
BUDGET
2020/21
BUDGET
2021/22
BUDGET
2022/23
Thabong: Installation of
bulk zonal water
meters and valves
All
(26.28.29.
30.31)
Design Stage MIG Counter funding R7 000 000 R1 170 000
Phomolong: Upgrading
of Sewer Pump station
2&3 Tender Stage MIG Counter funding R13 000 000 R3 833 905
Upgrading of the
Klippan Pump station
and Sandriver channel
32 Construction Upgrading the
capacity of the pumps
for the management
of the Witpan
R35 000 000 R14 996 095 R10 000 000
Refurbishment of
Welkom Airport
24 Design Stage Replacement of run-
way lights and
resealing and
refurbish facilities.
R50 000 000 R12 000 000 R12 000 000
Refurbishment of
Virginia Municipal
Offices
9 Planning Complete renovation
of building as it has
dilapidated
R4 000 000 R 4 000 000
Refurbishment of the
Kutlwanong Municipal
Offices
5 Planning Complete renovation
of building as it has
dilapidated
R3 000 000 R 3 000 000 -
Refurbishment of the
Allanridge Municipal
Offices
36 Planning Complete renovation
of building as it has
dilapidated
R2 000 000 R 2 000 000 -

132
ITEM
NO.
PROJECT NAME WARD
NO.
CURRENT
STATUS
COMMENT/ NOTES PROJECT
VALUE
BUDGET
2020/21
BUDGET
2021/22
BUDGET
2022/23
Fencing of Main
Municipal Offices in
Welkom
32 Planning R2 000 000 - R2 000 000-
Construction of new
Municipal Cattle Pound
32 Planning R10 000 000 R5 000 000 R5 000 000 -
Extension of the main
Municipal Building and
construction of new
Council chambers
32 Planning Current chambers
and offices do not
address
requirements of
councilors and
officials.
R50 000 000 R25 000 000 R25 000 000
Reinstatement of 6.5
KM Streetlight Koppie
Alleen in the Welkom
Unit
32,28
and 27
Contractor
on site
Project is in the
implementation
phase
R16 000 000 R16 000 000
TOTALS R 170 6000 000 R 41 000 000 R 57 000 000 R 43 000 000

133
6.2.5 PROJECTS IMPLEMENTED BY OTHER ORGANS OF STATE
6.2.5.1 DEPARTMENT OF WATER AND SANITATION (DWS)
ITEM
NO.
PROJECT NAME WARD
NO.
CURRENT
STATUS
COMMENT/ NOTES PROJECT
VALUE
BUDGET
2020/21
BUDGET
2021/22
BUDGET
2022/23
BUCKET ERADICATION
Meloding: Cemetery & Clinic
area, Sewer and Water
network for 350 stands to be
finalized – Bucket
eradication (Babereki) and
Phase 5 in ward 6
4, 5,
6
To be verified
with DWS
Phomolong Bucket
eradication
(Babereki)
2,3 The project was
suspended by the
Client. 2 848
households do not
have access to a
functional toilet
To be verified
with DWS
WASTEWATER TREATMENT WORKS – REGIONAL BULK INFRASTRUCTURE GRANT (RBIG)
Upgrading of the Thabong
WWTW to 24Ml capacity
33 Planning Refurbishment of
the WWTW to a
functional capacity
of 12Ml per day
To be verified
with DWS
TOTAL

134
6.2.5.2 SPORTS, ARTS, CULTURE AND RECREATION
Item No Project Name Implementing Agent Project Value Current status COMMENTS
1 Indoor sport facility at
Nyakallong
Provincial Department of
Sports, Arts, Culture and
Recreation
R20 000 000 Planning Budget to be verified
2 Thandanani Ward 25 :
Outdoor Multi-Purpose
Court
Provincial Department of
Sports, Arts, Culture and
Recreation
R20 000 000 Planning Budget to be verified
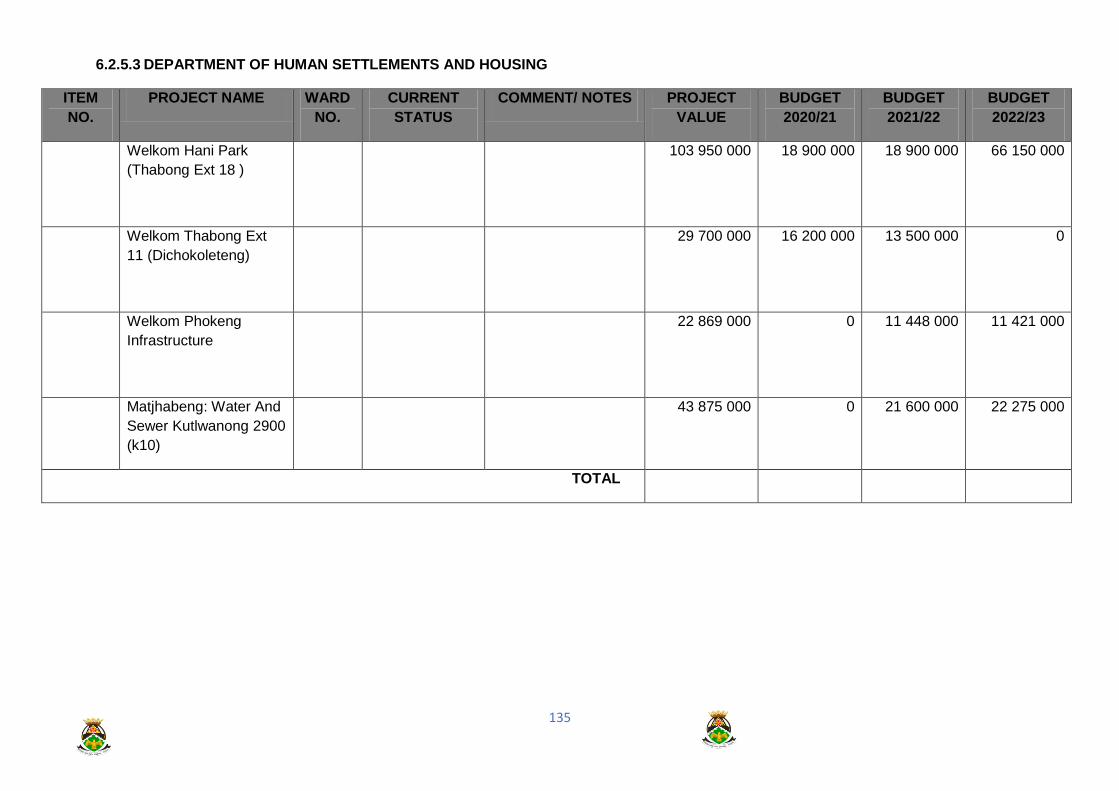
135
6.2.5.3 DEPARTMENT OF HUMAN SETTLEMENTS AND HOUSING
ITEM
NO.
PROJECT NAME WARD
NO.
CURRENT
STATUS
COMMENT/ NOTES PROJECT
VALUE
BUDGET
2020/21
BUDGET
2021/22
BUDGET
2022/23
Welkom Hani Park
(Thabong Ext 18 )
103 950 000 18 900 000 18 900 000 66 150 000
Welkom Thabong Ext
11 (Dichokoleteng)
29 700 000 16 200 000 13 500 000 0
Welkom Phokeng
Infrastructure
22 869 000 0 11 448 000 11 421 000
Matjhabeng: Water And
Sewer Kutlwanong 2900
(k10)
43 875 000 0 21 600 000 22 275 000
TOTAL

136
6.2.5.4 ESKOM and HOUSING DEVELOPMENT MULTI YEAR PLANNING
Project
Type PROJECT NAME
WAR
D NO.
COMMEN/
NOTES PROJECT VALUE
BUDGET
2018/2019
Planned
Number of
connections
YTD
Connections
Reported
BUDGET
2019/20(excl.
VAT)
Project
Type
Planned
Number of
connections
BUDGET
2020/21(excl v
BUDGET
2021/22
BUDG
ET
2022/2
3
INFR
Thabong
North(New
substation
12 Under
construction R18 167 844.19 R10 167 844.19 0
R 7,200,000.00 INFR 0 R 3,000,000.00
INFR
Thabong North
2km 132 kV Line 12
85% under
construction R6 077 813.66
R6 077 813.66
0 R 290,596.93
INFR 0 R 2,000,000.00
INFR Thabong Bulk: 2 X
132Kv feeder bay 12
85% under
construction R3 163 939.74 R3 163 939.74 0 R 290,596.93
INFR 0 R 100,000.00
INFR
Thabong Bulk:
Deviation of 132kV
incoming line
12
30% under
construction to
be completed 30
April 2019
R1 547 523.81 R1 547 523.81
INFR 0 R 50,000.00
INFR Thabong North:
Noka 11kV feeder 12
90% under
construction R280 034.90 R280 034.90 R 10,000.00
INFR 0 R 50,000.00
INFR Thabong North:
Mosa 11kV feeder 12
Construction
completed R158 755.00 R158 755.00 R 11,025.64
INFR 0 R 50,000.00
INFR Thabong North:
Kholo 11kV feeder 12
80% under
construction R127 119.93 R127 119.93 R 10,000.00
INFR 0 R 50,000.00

137
Project
Type PROJECT NAME
WAR
D NO.
COMMEN/
NOTES PROJECT VALUE
BUDGET
2018/2019
Planned
Number of
connections
YTD
Connections
Reported
BUDGET
2019/20(excl.
VAT)
Project
Type
Planned
Number of
connections
BUDGET
2020/21(excl v
BUDGET
2021/22
BUDG
ET
2022/2
3
HH Thandanani
Phokeng 25
603 connections
completed R6 417 929.83 R6 417 929.83 R 816,092.97 R 0.00
HH Phomolong Ext 5
Phase 2 3,2
Construction in
2020/21
0 0
HH 180 R 2,520,000.00
HH
Freedom Square
13,14 324 connections
completed
R5 749 822.89 R5 749 822.89
27 27
24573.82 Roll
over R 0.00
HH
Thabong Ext 6
13,17 36 connections
completed R853 254.04 R 853 254.04
R44,087.54 Roll
over R 0.00
HH Thabong Ext 7 13,17
260 stands,
under
construction
R3 465 990.04 R3 465 990. R1,185,011.02
Roll over R 0.00
HH Kutlwanong
Extensions 13 22
734 connections
completed R10 307 282.99 R10 307 282.99 0 0 R 189,000.00 R 400,000.00
Pre- Eng
Thabong Ext 8 16
Preparation for
construction in
2019/20
R200 000.00
180 202 R 2,431,584.39 R 0.00
HH
Thabong Ext 9 15,16
152 188 R 3,119,149.54

138
Project
Type PROJECT NAME
WAR
D NO.
COMMEN/
NOTES PROJECT VALUE
BUDGET
2018/2019
Planned
Number of
connections
YTD
Connections
Reported
BUDGET
2019/20(excl.
VAT)
Project
Type
Planned
Number of
connections
BUDGET
2020/21(excl v
BUDGET
2021/22
BUDG
ET
2022/2
3
Pre- Eng
Thabong Ext 10 16
Preparation for
construction in
2019/20
R213 000.00
266 274 R 4,434,833.42
R 0.00
Pre- Eng Kutlwanong Ext 13
Phase 2 Part 1 22
Preparation for
construction in
2019/20
R150 000.00
R 2,528,700.00
R 0.00
Pre- Eng Aldam Agri Village 1
Planned
connections for
2019/20
R300 000.00
R 931,975.70
R 0.00
Pre- Eng Kutlwanong Feeder
Bay
10,18,
20,21,
22
Preparation for
construction in
2019/20
R100 000.00
R 2,350,000.00
R 0.00
Pre- Eng Kutlwanong 11Kv
Cable and Line
10,18,
20,21,
22
Preparation for
construction in
2019/20
R100 000.00
R 1,500,000.00
R 0.00
Pre- Eng Mmamahabane
Groenpunt R70 1
Preparation for
construction in
2019/20
R150 000.00
R 7,082,189.56
R 0.00
INFR
Hennenman Rural
11kV Phomolong
Ext 5 feeder
2,3
INFR
0
R 2,890,142.80
INFr
Hennenman Rural
11kV Phomolong
By-Pass
2,3
INFR
0
R 2,890,142.80

139
Project
Type PROJECT NAME
WAR
D NO.
COMMEN/
NOTES PROJECT VALUE
BUDGET
2018/2019
Planned
Number of
connections
YTD
Connections
Reported
BUDGET
2019/20(excl.
VAT)
Project
Type
Planned
Number of
connections
BUDGET
2020/21(excl v
BUDGET
2021/22
BUDG
ET
2022/2
3
Pre- Eng Phomolong Ext 5
Phase 1 3
Preparation for
construction in
2019/20
R299 162.00
R 76,042.11 HH 500 R 4,271,884.04
INFR Phomolong Ext 5
11kV line
2,3 Construction in
2020/21 0 0
R 149,229.10 INFR 0 R 1,514,622.45
INFR
Hennenman Rural
11kV Phomolong
Ext 5 feeder
2,3
INFR 0 R 1,752,362.87
INFR
Hennenman Rural
11kV Phomolong
By-Pass
2.3
INFR 0 R 654,664.37
Infills
Infills
MLM 37 connections
completed R326 044.65 R326 044.65
19 28 R 127,931.32
R 2,800,000.00
FDH FDH MLM 8 connections
completed R123 970.00 R123 970.00 8 0 R 124,000.00 R 700,000.00
HH Thabong Ext 8 16
Construction
2019/20, 126
stands
R1 701 000.00 R 2,431,584.39
HH Thabong Ext 9 16
Construction
2019/20, 150
stands
R2 025 000.00
R 3,119,149.54

140
Project
Type PROJECT NAME
WAR
D NO.
COMMEN/
NOTES PROJECT VALUE
BUDGET
2018/2019
Planned
Number of
connections
YTD
Connections
Reported
BUDGET
2019/20(excl.
VAT)
Project
Type
Planned
Number of
connections
BUDGET
2020/21(excl v
BUDGET
2021/22
BUDG
ET
2022/2
3
HH Thabong Ext 10 16
Construction
2019/20, 200
stands
R3 510 000.00 R 4,434,833.42
HH Kutlwanong Ext 13
Phase 1 22
Construction
2019/20, 250
stands
R 3 375 000.00
308 308 R 4,896,315.94
HH Kutlwanong Ext 13
Phase 2 part 1 22
2 Construction
2019/20, 230
stands
R4 050 000.00 230
0 R 2,528,700.00
HH Aldam Agri Village
+ Line 1
Construction
2019/20, 50
stands
R1 375 000.00
50
R 603,386.59
HH Mmamahabane
Groenpunt R70 1
Construction
2019/20, R5 400 000.00
465 435 R 7,082,189.96
HH Phomolong Ext 5
Phase 1 3
Construction
2019/20, 319
stands
R5 589 000.00 319 0 R 76,042.11
INFR Kutlwanong Feeder
bay 22
Construction
2019/20 R 2,350,000.00
INFR Kutlwanong 11kV
Cable & Line 22
Construction
2019/20 R750 000.00 R 1,500,000.00

141
Project
Type PROJECT NAME
WAR
D NO.
COMMEN/
NOTES PROJECT VALUE
BUDGET
2018/2019
Planned
Number of
connections
YTD
Connections
Reported
BUDGET
2019/20(excl.
VAT)
Project
Type
Planned
Number of
connections
BUDGET
2020/21(excl v
BUDGET
2021/22
BUDG
ET
2022/2
3
Pre- Eng Phomolong Ext 5
Phase 2 3
Preparation for
construction in
2020/21
R108 000.00 R 0.00
Pre- Eng Kutlwanong Ext 13
Phase 2 part 2 22
Preparation for
construction in
2020/21
R189 000.00
290 R 3,915,000.00
FDH FDH MLM 8 R124 000.00 R 0.00
Infills Infills MLM 17 R96 951.00 R 0.00
HH Phomolong Ext 6 3 520 stands R13 169 800.00 0 0 R 8,400,000.00
HH Kutlwanong Ext 13
Phase 2 22 300 stands R6 440 000.00 R 189,000.00
Pre- Eng Kutlwanong Ext 13
Phase 3 22
Construction in
2021/22 Pre- Eng 0 R 400,000.00
Pre- Eng Thabong Ext 11 13
Preparation for
construction in
2021/22
0 R 0.00 Pre- Eng 0 R 153,600.00

142
Project
Type PROJECT NAME
WAR
D NO.
COMMEN/
NOTES PROJECT VALUE
BUDGET
2018/2019
Planned
Number of
connections
YTD
Connections
Reported
BUDGET
2019/20(excl.
VAT)
Project
Type
Planned
Number of
connections
BUDGET
2020/21(excl v
BUDGET
2021/22
BUDG
ET
2022/2
3
Pre- Eng
Homestead
Development East
Ext 15
13,17
Preparation for
construction in
2021/22
0 R 0.00 Pre- Eng 0 R 3,528,000.00 0 0
Totals
2024 1462 R71,284,149.56 970 R33,690,419.33 R0.00 R0.00

143
6.2.5.5. LEJWELEPUTSWA DEVELOPMENT AGENCY PROJECTS (PROJECTS FOR THE MEDIUM TERM EXPENTITURE
FRAMEWORK)
Project Description Locality Status No. of Jobs
Energy Storage System Pilot Project This is a new technology of storing electricity, especially from solar energy, in batteries made of vermiculite instead of lithium. It will alleviate power shortages during load-shedding. Highly recommended globally. TA Tsebolo Minerals
All Local Municipalities Ready for implementation (Short term)
100 (min)
Rural Electrification Pilot Project Power is generated using solar panels and a mini grid is installed in rural municipalities or dispersed settlements. Energy generated depends on the consumer needs. TA Tsebolo Minerals
All Local Municipalities Ready for implementation (Short term)
300
Solar PV Power Plant The project will generate electricity from solar energy to the tune of 480 MW. The project is worth R4.2 billion. NT has
Matjhabeng Ready for implantation (Short term)
2000 ( Phase 1)

144
approved the transaction but not the PPP due blockages given on the far right of the column. TA Duane
Waste Water Recycling Project All waste water from the sewer plants are removed of all harmful bacteria and disinfected for reuse by households. TA Tsebolo Minerals
All Local Municipalities Ready for implementation (Short term)
15 per plant
Biogas to Energy from WWTP This is the generation of electricity from the decomposition of organic material into hydrocarbons of which during combustion produce electricity. TA Tsebolo Minerals
All Local Municipalities Ready for implementation (Short term)
10 per plant
Rooftops and Carports PV System on Municipal owned Buildings The project will install solar panels on the roofs of municipal
All Municipalities including the District
Ready for implementation (Short term
3 per building

145
buildings in order to save electricity. TA Tsebolo Minerals
Bricks Making Project A cooperative in Brandfort supported by the municipality making bricks ZR Mahabane Co-operative
Masilonyana Brandfort
Ready to be restarted 35
Solar PV System to power WWTP and Pump Stations Waste-water treatment plants (sewer plants) will be fitted with solar panels to save electricity. Installation ensures panels are free of vandalism. TA Tsebolo Minerals
All Municipalities Ready for implementation (Short term)
5 per plant
Thabong Industrial Park This is medium term project looking at reclassifying the informal industry in Constantia Road opposite the police station in Thabong to a formal Industrial Park by DTI. All necessary infrastructure and services to be availed to SMMEs.
Matjhabeng Feasibility Study (Medium term)
50 minimum
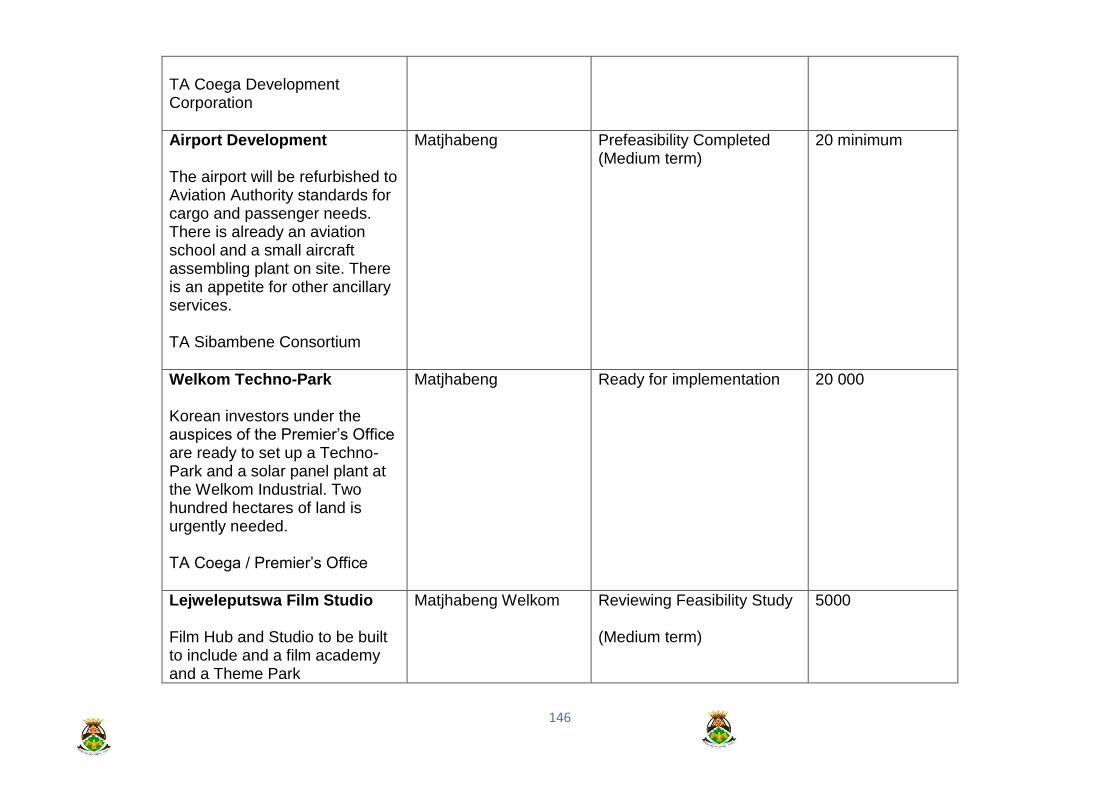
146
TA Coega Development Corporation
Airport Development The airport will be refurbished to Aviation Authority standards for cargo and passenger needs. There is already an aviation school and a small aircraft assembling plant on site. There is an appetite for other ancillary services. TA Sibambene Consortium
Matjhabeng Prefeasibility Completed (Medium term)
20 minimum
Welkom Techno-Park Korean investors under the auspices of the Premier’s Office are ready to set up a Techno-Park and a solar panel plant at the Welkom Industrial. Two hundred hectares of land is urgently needed. TA Coega / Premier’s Office
Matjhabeng Ready for implementation 20 000
Lejweleputswa Film Studio Film Hub and Studio to be built to include and a film academy and a Theme Park
Matjhabeng Welkom Reviewing Feasibility Study (Medium term)
5000

147
TA Sibambene Consortium
Africa Agribusiness Conference International conference on agriculture and ancillary services and tourism to be hosted TA Afrosonique
Matjhabeng Welkom Steering Committee In place (Medium Term)
100 temporaries
Hydroponics Project Use of tunnels to plant vegetables and herbs TA New Dynamics Consortium
Masilonyana Brandfort (Medium term)
Feasibility Study under review (Medium term)
40
Sol Plaatjie heritage Site National / Provincial Government to declare birth place of Sol Plaatjie a National Heritage Site. No TA allocated
Tokologo Boshoff (Medium term)
Proposal has been submitted to the Provincial Heritage Resource Authority
5
Maize Milling Cooperative Welkom is situated within the “maize triangle” which makes
Matjhabeng Welkom (Medium term)
Feasibility Study completed 60

148
the project suitable for agro-processing in the district. No TA allocated
Welkom International Convention Center Construction of the convention center as part of the projects to promote tourism in the district No TA allocated
Matjhabeng Welkom (Medium term)
Tender out for the feasibility study
10
Student Residence CUT Welkom Build a residence for students who are not from Welkom and in need of accommodation to further their studies TA SUCA
Matjhabeng Welkom (Medium term)
Feasibility Study completed 50
Underground Coal Gasification This is the combustion of coal in situ and extract hydrocarbons and steam to make fuel and generate electricity Facilitated by Premier’s Office
Masilonyana and Tswelopele (between Theunissen and Bultfontein) (Medium term)
Feasibility Study completed 100
Solid Waste Recycling Project
Lejweleputswa (all local municipalities involved)
At prefeasibility study 100
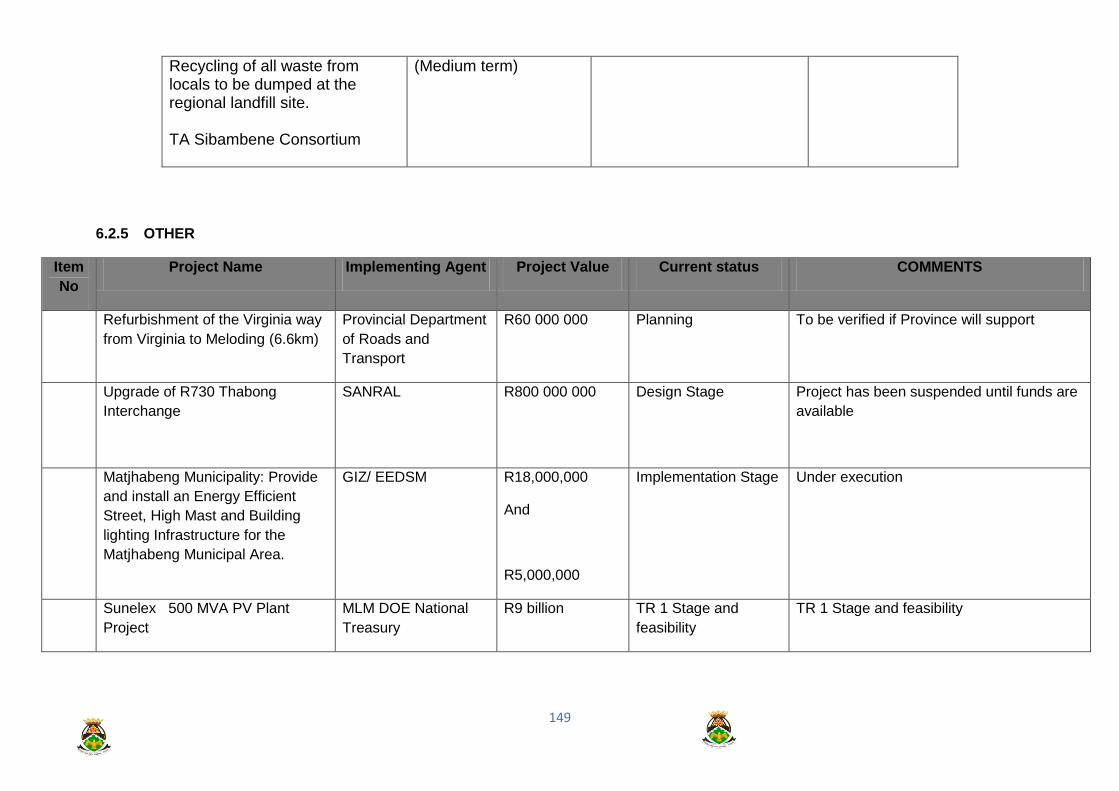
149
Recycling of all waste from locals to be dumped at the regional landfill site. TA Sibambene Consortium
(Medium term)
6.2.5 OTHER
Item
No
Project Name Implementing Agent Project Value Current status COMMENTS
Refurbishment of the Virginia way
from Virginia to Meloding (6.6km)
Provincial Department
of Roads and
Transport
R60 000 000 Planning To be verified if Province will support
Upgrade of R730 Thabong
Interchange
SANRAL R800 000 000 Design Stage Project has been suspended until funds are
available
Matjhabeng Municipality: Provide
and install an Energy Efficient
Street, High Mast and Building
lighting Infrastructure for the
Matjhabeng Municipal Area.
GIZ/ EEDSM R18,000,000
And
R5,000,000
Implementation Stage Under execution
Sunelex 500 MVA PV Plant
Project
MLM DOE National
Treasury
R9 billion TR 1 Stage and
feasibility
TR 1 Stage and feasibility

150
6.2.6 UNFUNDED PROJECTS
ITEM NO. PROJECT NAME WARD
NO.
CURRENT
STATUS
COMMENT/ NOTES PROJECT VALUE BUDGET
2020/21
BUDGET
2021/22
BUDGET
2022/23
MUNICIPAL BUILDINGS
Extension of the main
Municipal Building and
construction of new
Council chambers
32 Planning Current chambers
and offices does not
address
requirements of
councilors and
officials.
R50 000 000 R25 000
000
R25 000
000
MUNICIPAL SERVICES (WATER, SEWER, ELECTRICITY)
Service 10 business
stands 9520, Welkom
32 Planning R 1 000 000
Service 11 light
industrial stands in
X39, Welkom
32 Planning Sewer and water to be
constructed to enable
development of the
stands
R 3 000 000
7de-laan incorporation
(Odendaalsrus)
36 Planning Old mine infrastructure.
Service 23 light
industrial area in
Thabong Constantia
Road
30 Planning Stands needed by
SMME’s for
businesses.
R 6 000 000
Procure Water
Pressure Reduction
System (PRV) to
All Planning No PRV’s in Welkom
and Thabong to
regulate water
R 9 000 000

151
ITEM NO. PROJECT NAME WARD
NO.
CURRENT
STATUS
COMMENT/ NOTES PROJECT VALUE BUDGET
2020/21
BUDGET
2021/22
BUDGET
2022/23
reduce the occurrence
of burst pipes
pressure on old water
networks.
Data logging of bulk
water meters to
monitor consumption
trends, trigger alarms
and calculate losses
due to pipe bursts
All Planning Procurement of 5 Data
Loggers as part of
Water Demand
Management.
R 1 500 000
COMMUNITY AND RECREATIONAL FACILITIES
Fencing of
Kutlwanong Park
18 Planning R 1 500 000
Build a satellite Fire
Station in Thabang
25 Planning This facility should be
at centre of Thabong to
reduce response time
in cases of
emergences
R 25 000 000
SEWER NETWORKS REFURBISHMENT
3.6 Refurbish Brain Street
sewer network and
upgrade main outfall
to Big Frank Pump
Station
35 Planning Regular sewer
spillages due to poorly
executed project.
R 8 000 000

152
ITEM NO. PROJECT NAME WARD
NO.
CURRENT
STATUS
COMMENT/ NOTES PROJECT VALUE BUDGET
2020/21
BUDGET
2021/22
BUDGET
2022/23
3.7 Refurbish
Odendaalsrus outfall
sewer
36 Planning Outfall sewer about
dysfunctional and
sewer spillages on a
regular basis.
R14 000 000
3.9 Hennenman: Replace
portion of outfall sewer
to eliminate pump
station
3 Planning By replacing portion of
network old pump
station not needed to
be refurbish and
eliminate operational
and maintenance
costs of existing pump
station
R 3 000 000
3.10 Refurbishment of
collapsed sewer in
Welkom Koppie Alleen
Road
27, 32 Planning If sewer network is not
refurbish in time the
existing road may also
have to be
reconstructed at very
high cost.
R15 000 000
5.4 Refurbishment of the
sewer network to be
functional in Thabong
X15N, X18, X19 and
X20 (Hani Park)
(5100 stands)
11, 12,
13, 14,15,
23
Planning Existing network not
functional. About
5000 stands, most
with formal RDP
houses, without
sewer system.
R80 000 000
Refurbishment of the
Purified Sewer
33 Planning To reduce usage of
potable water for
R56 000 000

153
ITEM NO. PROJECT NAME WARD
NO.
CURRENT
STATUS
COMMENT/ NOTES PROJECT VALUE BUDGET
2020/21
BUDGET
2021/22
BUDGET
2022/23
Effluent (PSE) system
in Theronia WWTW
irrigation purposes
and to regulate
Theronia and
Flamingo pan levels.
WASTEWATER TREATMENT WORKS
Refurbish of
Ventersburg WWTW.
1 Planning Cleaning of
oxidation ponds and
refurbish pipe
system.
R 5 000 000
Refurbish of
Hennenman WWTW
as well as main pump
station.
2 Planning Need a
refurbishment to
ensure that effluent
are according to
standards
R15 000 000
Upgrade and refurbish
of Phomolong WWTW
to ensure addressing
new development.
2 Planning Current works only
sized for current
stands.
R20 000 000
Refurbish and
Upgrade
Odendaalsrus WWTW
by addressing
chlorination, drying
beds, maturation
35 Planning Needs refurbishment
and upgrade to
ensure that effluent
conform to Green
Drop Standards.
R 5 000 000

154
ITEM NO. PROJECT NAME WARD
NO.
CURRENT
STATUS
COMMENT/ NOTES PROJECT VALUE BUDGET
2020/21
BUDGET
2021/22
BUDGET
2022/23
ponds and humus
tank to comply with
Green drop standards.
SEWER PUMP STATIONS
Refurbish and
upgrade the following
pump stations:
Extension Nr 3,
Goudrif Nr 2, Akasia,
Goudrif Nr 1, Althea,
Meloding, Northen,
Ben Regal, Eldorie,
Kitty, Gawie Theron
and Hennenman
Planning Pump stations in poor
condition and spillages
occur and thus cause
health and safety
hazard.
R22 000 000
Replace 450mm rising
main line between
Major pump station
and Theronia
sewerage works and
enlarge sump of Major
pump station.
33 Planning Infrastructure old. If
breakage occur
major spillage of raw
sewerage into
Theronto pan.
R 7 000 000
Upgrading of the
Klippan Pump station
(Including upgrading
32 Planning Pump station not
effective on
management of
R40 000 000

155
ITEM NO. PROJECT NAME WARD
NO.
CURRENT
STATUS
COMMENT/ NOTES PROJECT VALUE BUDGET
2020/21
BUDGET
2021/22
BUDGET
2022/23
of the Mostert/
Sandriver canal)
water level of
Witpan.
Construct and
upgrade security and
alarm systems at
pump stations and
sewerage works to
reduce theft and
damage to
infrastructure
All Planning Regular dysfunctional
pump stations and
WWTW due to theft
and vandalism.
Expensive to repair.
R15 000 000
WATER
3.19 Replacement of worn-
out galvanised steel
pipes in Matjhabeng
towns
All Planning Reduce water loss R50 000 000
3.20 Replacement of
Asbestos water
pipelines in
Matjhabeng towns
All Planning Reduce water loss R50 000 000
ROADS AND ANCILARRIES
Thabong: Formalise
10 busy intersections
with traffic lights
All Planning Intersections operate
on substandard levels
during peak times
R6 000 000

156
ITEM NO. PROJECT NAME WARD
NO.
CURRENT
STATUS
COMMENT/ NOTES PROJECT VALUE BUDGET
2020/21
BUDGET
2021/22
BUDGET
2022/23
(Traffic Impact Study
to be compiled)
which causing unsafe
conditions.
Thabong: Formalise
1.7 km of roads
(THB272,
THB280,THB118,
THB278, THB290,
THB294, THB 246)
17 Planning R12 000 000
Thabong: Construct
Dr. Mnyandu Crescent
15 Planning R 4 000 000
Thabong: Construct
3.6 km of roads
(Mosunkutu, Molope,
Dr. Makhelemele,
South/West,
Mofubetsoana, James
Ngake, Mmatsa and
Modikeng Street
26 Planning R22 000 000
Thabong: Construct 2
km of roads Mmolai
Street, George Mooi
Street, Lebogang
Street, Motshei Street,
Tsotetsi Street, Bakodi
Street, Mokgomo
Street, Ndaki Street.
29 Planning R 12 000 000

157
ITEM NO. PROJECT NAME WARD
NO.
CURRENT
STATUS
COMMENT/ NOTES PROJECT VALUE BUDGET
2020/21
BUDGET
2021/22
BUDGET
2022/23
Phomolong: Formalise
Radebe Road & Basil
Read
2 Planning R 9 000 000
Thabong: Pave
Moshoeshoe Street,
Mike Selloane street,
N.J Ntolo Street,
Mlangeni Street,
Morolong Street,
Mathe Street
14 Planning R15 000 000
Thabong: Dr
Mnyandu_Crs,
Sambo_Str, E
Tshekedi_Str,
Bridgeman Botes_Str,
L Modimoeng_Str, S
Yoyo_Str, Dn
Makhethas_Str,
Moshoeshoe_Drv
15 Planning R 13 000 000
Mmamahabane:
Upgrade roads to the
Primary Schools and
Clinics
1 Planning R 9 000 000
Thabong Construct
road THB 192
(Constantia Road)
13 Planning R 2 000 000

158
ITEM NO. PROJECT NAME WARD
NO.
CURRENT
STATUS
COMMENT/ NOTES PROJECT VALUE BUDGET
2020/21
BUDGET
2021/22
BUDGET
2022/23
Virginia Way Service
lanes
9 Planning Formal high income
area with developed
stands
R 3 000 000
Meloding: Construct
roads to
accommodate storm
water challenges
MEL9,10,13,14,165 &
398
4,7 Planning Storm water
challenges.
R 9 000 000
Thabong: Construct
RP Teheli and THB
360,361,364 & 523 to
address taxi routes
and storm water
challenges
16 Planning Storm water
challenges.
R10 000 000
Thabong T15:
Construction of roads
to address taxi route
and storm water
challenges THB 341,
342 & THB350
16 Planning Storm water
challenges.
R 6 000 000
Kutlwanong: K9 north
portion where roads
are inaccessible
10, 18 Planning Storm water
challenges.
R 24 000 000

159
ITEM NO. PROJECT NAME WARD
NO.
CURRENT
STATUS
COMMENT/ NOTES PROJECT VALUE BUDGET
2020/21
BUDGET
2021/22
BUDGET
2022/23
Welkom: Upgrade
Arrarat and Volks
Road intersection
34 Planning High occurrence of
accidents. Traffic
Department need to
regulate during peak
times.
R 5 000 000
Welkom: Upgrade
Tempest and
Pretorius Street
intersection
27 Planning High occurrence of
accidents. Traffic
Department need to
regulate during peak
times.
R 4 000 000
Riebeeckstad: Craib
Avenue and Lois Str
25 Planning High occurrence of
accidents
R 3 000 000
Thabong: Formalize
busy intersections with
traffic lights (Traffic
impact study to be
compiled)
30,26,29
,12
Planning Outcome of preliminary
Taxi study in CBD
R 7 000 000
Power and Pambili
Road intersection
32 Planning Problematic
intersection
R 1 000 000
6.3.1.1. Rebuild Alma
road
27 Planning Existing road in poor
condition. Past
expected lifetime.
R 10 000 000
6.3.1.2. Rebuild
Stateway service
lanes
27,32,
34
Planning Roads damaged during
sewer constructions.
R15 000 000
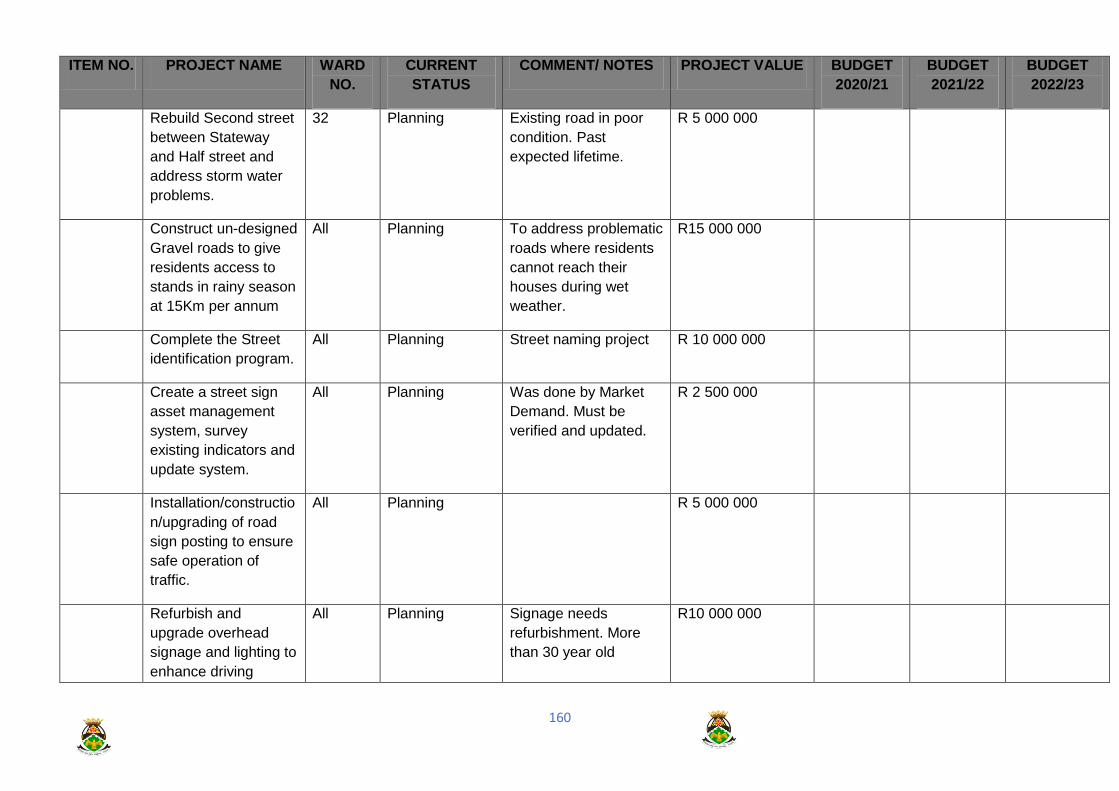
160
ITEM NO. PROJECT NAME WARD
NO.
CURRENT
STATUS
COMMENT/ NOTES PROJECT VALUE BUDGET
2020/21
BUDGET
2021/22
BUDGET
2022/23
Rebuild Second street
between Stateway
and Half street and
address storm water
problems.
32 Planning Existing road in poor
condition. Past
expected lifetime.
R 5 000 000
Construct un-designed
Gravel roads to give
residents access to
stands in rainy season
at 15Km per annum
All Planning To address problematic
roads where residents
cannot reach their
houses during wet
weather.
R15 000 000
Complete the Street
identification program.
All Planning Street naming project R 10 000 000
Create a street sign
asset management
system, survey
existing indicators and
update system.
All Planning Was done by Market
Demand. Must be
verified and updated.
R 2 500 000
Installation/constructio
n/upgrading of road
sign posting to ensure
safe operation of
traffic.
All Planning R 5 000 000
Refurbish and
upgrade overhead
signage and lighting to
enhance driving
All Planning Signage needs
refurbishment. More
than 30 year old
R10 000 000

161
ITEM NO. PROJECT NAME WARD
NO.
CURRENT
STATUS
COMMENT/ NOTES PROJECT VALUE BUDGET
2020/21
BUDGET
2021/22
BUDGET
2022/23
directions though
towns and safe
operation thereof.
without any
maintenance.
STORMWATER
Construct and
upgrade pedestrian
bridges over main
storm water channels
to ensure safe
crossing thereof;
Stateway (2),
Togo Drive (1),
Moshoeshoe
railway(1),
Nkoane Road (5),
and
Buicke Tshabalala (2)
12 Planning R 2 600 000 R 1 000 000 R 1 600 000
Upgrade main storm
water system in
Geelwortel /Toronto
channel (2km)
28 Planning To manage water level
of Toronto pan lake
R 5 000 000
Odendaalsrus:
refurbish main outfall
36 Planning Part of major system.
Needs refurbishment
R 6 000 000

162
ITEM NO. PROJECT NAME WARD
NO.
CURRENT
STATUS
COMMENT/ NOTES PROJECT VALUE BUDGET
2020/21
BUDGET
2021/22
BUDGET
2022/23
storm water canal
from Taxi Rank to the
vlei area
before more damage
occur.
Virginia: Dam wall in
Sandriver: Upgrade /
maintenance as
required by law.
2 Planning Legislation R 3 000 000
Retention dams for
preventing flooding of
Tana Street
32 Planning Houses flooded
regularly during rain
storms.
R 3 000 000
Address storm water
on existing roads
prone to flooding in all
towns
All Planning Attend to storm water
challenges where
water stands after rain
storms and damage
road infrastructure.
R 1 000 000
Extend Xaluva
channel north of
Nkoane Road
28 Planning Formalize canal to
improve affectivity and
reduce maintenance
actions and costs
R 2 000 000
Extend Bronville X9
channel to
Blesbokpan
11 Planning Formalize canal to
improve affectivity and
reduce maintenance
actions and costs
R 3 000 000
Upgrade storm water
in Dr Tlali Street
28 Planning Formalize canal to
improve affectivity and
R 2 500 000

163
ITEM NO. PROJECT NAME WARD
NO.
CURRENT
STATUS
COMMENT/ NOTES PROJECT VALUE BUDGET
2020/21
BUDGET
2021/22
BUDGET
2022/23
reduce maintenance
actions and costs
Odendaalsrus:
refurbish main outfall
storm water canal
from Taxi Rank to the
vlei area
36 Planning Formalize canal to
improve affectivity and
reduce maintenance
actions and costs
R 6 000 000
Upgrade main storm
water system in
Meloding near railway
crossing
4,5,6,7,9 Planning Formalize canal to
improve affectivity and
reduce maintenance
actions and costs
R 7 000 000
Phomolong: Upgrade
informal canal from
road PHO 146 to the
main chanal and on
stand 10839
2 Planning Formalize canal to
improve affectivity and
reduce maintenance
actions and costs
R 1 500 000
Phomolong:
construction of new
canal from WWTP to
spruit
3 Planning Proper management of
effluent to curb erosion.
R 5 000 000
Thandanani (2010):
Construction of storm
water cut off drains
25 Planning Stormwater
management to
prevent damage to
property.
R 1 000 000

164
ITEM NO. PROJECT NAME WARD
NO.
CURRENT
STATUS
COMMENT/ NOTES PROJECT VALUE BUDGET
2020/21
BUDGET
2021/22
BUDGET
2022/23
Finalization of Uitsig
canal retention dam
(Stand 8083
Thabong).
29 Planning R 5 000 000
Formalizing storm
water canal at school
in T15
16 Planning R 500 000
Formalizing storm
water canal in
Thuhlwane street:
Thabong
29, 31 Planning R 5 000 000
Formalizing storm
water canal at A
Phakathi near
Nkoane road
16,25 Planning R 300 000
Concrete Lining
existing canals at 5km
per annum.
All Planning R40 000 000
Virginia: Dam wall in
Sandriver: Upgrade /
maintenance as
required by law.
8, 9 Planning R 3 000 000
Retention dams at
Meloding (Albany)
5,9 Planning R 3 000 000

165
ITEM NO. PROJECT NAME WARD
NO.
CURRENT
STATUS
COMMENT/ NOTES PROJECT VALUE BUDGET
2020/21
BUDGET
2021/22
BUDGET
2022/23
Retention dams for
preventing flooding of
Tana Street
27 Planning R 6 000 000
Relining of Stateway
Canal Lindsey to
Anthony
29 Planning R 4 000 000
BUILDINGS
Upgrading of
Industrial Park,
Meloding municipal
offices, Long Road
flats, Welkom show
grounds, Klippan
Training centre, 7de
Laan Odendaalsrus
5,30,32,
36
Planning R 4 000 000
Upgrading of Old
Public Safety Building
27 Planning R 3 000 000

166
ITEM NO. PROJECT NAME WAR
D NO.
CURRENT
STATUS
COMMENT/ NOTES PROJECT
VALUE
BUDGET
2020/21
BUDGET
2021/22
BUDGET
2022/23
ELECTRICITY
132KV DISTRIBUTION
WELKOM
Upgrade of SCADA
system
32 Planning Ensure control over
remote substations
R10,722,536 R3,668,236 R2.821,720 R4,232,580
WELKOM
Provision and
installation 20MVA
132KV transformer
at Urania
Substation
32 Planning To ensure an effective
and safe 132kV
Distribution network
R14,029,591.8
4
R14,029,591.
84
ADMINISTRATION AND STRATEGIC PLANNING
Matjhabeng
Energy Efficiency
residential load
management
All Planning Council benefiting
from the time of use
tariffs
R 5,819,726. R 5,819,726.
MATJHABENG
Ring fencing and
Asset Evaluation of
the Matjhabeng
Electrical
Engineering
Services
All Planning To ensure effective
and efficient electrical
service delivery to the
community of the
Matjhabeng
Municipality that
comply to the NERSA
R 5,344,337 R 5,344,337

167
ITEM NO. PROJECT NAME WAR
D NO.
CURRENT
STATUS
COMMENT/ NOTES PROJECT
VALUE
BUDGET
2020/21
BUDGET
2021/22
BUDGET
2022/23
Department - All 6
Towns
licensing
requirements.
WELKOM
Quality of supply
All Planning To ensure that a good
quality of supply is
provided to the
community
R 4,384,247 R2,630,548 R1,227,589 R526,109
DISTRIBUTION LOW AND MEDIUM VOLTAGE
VENTERSBURG
Electrification 75
stands X1
1 Planning To ensure the
effectiveness of the
medium voltage
distribution networks
R12,884,038 R12,884,038
HENNENMAN
Electrification 11
Stands X12
3 Planning To ensure the
effectiveness of the
medium voltage
distribution networks
R12,666,804 R12,104,295 R562,508
Welkom
Re Electrification of
Phomolong
Rheeders Park X2
583 stands
35 Planning To ensure the
effectiveness of the
medium voltage
distribution networks
R 11,169,976 R 11,169,976

168
ITEM NO. PROJECT NAME WAR
D NO.
CURRENT
STATUS
COMMENT/ NOTES PROJECT
VALUE
BUDGET
2020/21
BUDGET
2021/22
BUDGET
2022/23
Welkom
Re Electrification of
Naude Ville X2 330
stands
32 Planning To ensure the
effectiveness of the
medium voltage
distribution networks
R18,341,180 R9,170,590 R9,170,590
WELKOM
Alma development
27,10 Planning To ensure the
effectiveness of the
medium voltage
distribution networks
R19,131261 R6,377,087 R6,377,087
HENNENMAN
Ring electrical
supply 11kV Atlass
Street
3 Planning To ensure the
effectiveness of the
medium voltage
distribution networks
R562,508 R562,508
HENNENMAN
Ring electrical
supply 11kV Goud
Street
3 Planning To ensure the
effectiveness of the
medium voltage
distribution networks
R669,753 R669,753
ODENDAALSRUS
Provision and
installation of a
11kV electrical
main electrical
supply to
Hospitalpark from
Sub 1A (1.7km)
35 Planning To ensure the
effectiveness of the
medium voltage
distribution networks
R 4,047,610 R 4,047,610

169
ITEM NO. PROJECT NAME WAR
D NO.
CURRENT
STATUS
COMMENT/ NOTES PROJECT
VALUE
BUDGET
2020/21
BUDGET
2021/22
BUDGET
2022/23
ODENDAALSRUS
Provision and
installation of a
11kV electrical ring
and interconnector
feeders between
Hospitalpark and
Eldorie (2.4km)
36 Planning To ensure the
effectiveness of the
medium voltage
distribution networks
R2,638,308 R2,638,308
ODENDAALSRUS
Upgrade electrical
supply to Du
Plessis Single
36 Planning To ensure the
effectiveness of the
medium voltage
distribution networks
R 210,443 R 210,443
ODENDAALSRUS
Complete 11kV
electrical ring feed
in CBD Area
(Odendaal street)
36 Planning To ensure the
effectiveness of the
medium voltage
distribution networks
R 236,749 R 236,749
ODENDAALSRUS
Replace stolen
11kV Medium
Voltage Supply
cable between Sub
8 and Mini
Substation MS 17B
Industrial Area
35 Planning To ensure the
effectiveness of the
medium voltage
distribution networks
R 1,203,675 R 1,203,675

170
ITEM NO. PROJECT NAME WAR
D NO.
CURRENT
STATUS
COMMENT/ NOTES PROJECT
VALUE
BUDGET
2020/21
BUDGET
2021/22
BUDGET
2022/23
ODENDAALSRUS
Replace stolen
11kV Medium
Voltage Supply
cable between Sub
1A and Mini
Substation MS5
36 Planning To ensure the
effectiveness of the
medium voltage
distribution networks
R 717,422 R 717,422
ODENDAALSRUS
Replace 11kV
Medium Voltage
Supply ring
feedcable between
Sub 18 MS 18A
and MS18 Eldorie
36 Planning To ensure the
effectiveness of the
medium voltage
distribution networks
R2,539,548 R2,539,548
ODENDAALSRUS
Upgrading of
overhead electrical
networks that was
damaged due theft
and vandalism
35,36 Planning To ensure the
effectiveness of the
medium voltage
distribution networks
R19,075,277 R6,358,425 R6,358,425 R6,358,425
WELKOM
Ring feed Vista &
Bongani Hospital
28 Planning To ensure the
effectiveness of the
medium voltage
distribution networks
R 3,395,161 R 3,395,161
WELKOM
ST Helena
32 Planning To ensure the
effectiveness of the
R2,805,918 R1,052,219 R1,052,219 R701,479

171
ITEM NO. PROJECT NAME WAR
D NO.
CURRENT
STATUS
COMMENT/ NOTES PROJECT
VALUE
BUDGET
2020/21
BUDGET
2021/22
BUDGET
2022/23
upgrading of cable
distribution network
medium voltage
distribution networks
VIRGINIA
Upgrading of
electrical ring feed
11kV to Fauna
Park
9 Planning To ensure the
effectiveness of the
medium voltage
distribution networks
R 2,200,892 R1,052,219 R1,149,672
VIRGINIA
Upgrading of
electrical ring feed
11kV to Boabab Str
9 Planning To ensure the
effectiveness of the
medium voltage
distribution networks
R 350,739 R35,073 R315,665
VIRGINIA
Upgrading of
electrical ring feed
11kV to Virginia
and Harmony
8 Planning To ensure the
effectiveness of the
medium voltage
distribution networks
R 1,094,308 R526,109 R568,198
WELKOM
Upgrading of the
St Helena
Electrical
distribution network
32 Planning To ensure the
effectiveness of the
medium voltage
distribution networks
R 8,618,943 R6,865,244 R1,052,219 R701,479
WELKOM DOE
Electrification
Extension X15 X9
Thabong Bronville
Phase 6
12 Planning To ensure the
effectiveness of the
medium voltage
distribution networks
R 7,316,719 R5,563,020 R1,753,698

172
ITEM NO. PROJECT NAME WAR
D NO.
CURRENT
STATUS
COMMENT/ NOTES PROJECT
VALUE
BUDGET
2020/21
BUDGET
2021/22
BUDGET
2022/23
WELKOM
Provision and
Installation of a
Bulk supply
Overhead Line
Bronville and
Extension 15
Thabong
12 Planning To ensure the
effectiveness of the
medium voltage
distribution networks
R 3,507,397 R1,753,698 R1,753,698
WELKOM
Upgrading medium
voltage network
Flamingo park
34 Planning To ensure the
effectiveness of the
medium voltage
distribution networks
R 2,104,438 R1,052,219 R1,052,219
WELKOM
Upgrading medium
voltage network
Stateway new
Businesses
32,33 Planning To ensure the
effectiveness of the
medium voltage
distribution networks
R 11,478,756 R5,579,951 R3,985,679 R1,913,126
WELKOM
Upgrading medium
voltage network
EXT 9 &15
12 Planning To ensure the
effectiveness of the
medium voltage
distribution networks
R 2,104,438 R1,052,219 R1,052,219
WELKOM
Upgrading medium
voltage network
Civic Centre
32 Planning To ensure the
effectiveness of the
medium voltage
distribution networks
R 7,683,203 R 7,683,203

173
ITEM NO. PROJECT NAME WAR
D NO.
CURRENT
STATUS
COMMENT/ NOTES PROJECT
VALUE
BUDGET
2020/21
BUDGET
2021/22
BUDGET
2022/23
WELKOM
Upgrading medium
voltage network
Industrial Area
27 Planning To ensure the
effectiveness of the
medium voltage
distribution networks
R5,101,669 R5,101,669
HENNENMAN
Replace overhead
transmission lines
in Fabriek street
3 Planning To ensure the
effectiveness of the
medium voltage
distribution networks
R385,813 R385,813
WELKOM
Rehabilitation of
low voltage
reticulation Phase
1 Bedelia
33 Planning To ensure the
effectiveness of the
medium voltage
distribution networks
R 2,893,603 R1,139,904 R1,753,698
WELKOM
Ext 19 LT electrical
reticulation
upgrade
12 Planning To ensure the
effectiveness of the
medium voltage
distribution networks
R1,155,658 R526,109 R629,549
WELKOM
Flamingo park LT
Electrical
distribution
upgrade
34 Planning To ensure the
effectiveness of the
medium voltage
distribution networks
R 1,728,485 R876,849 R851,636
WELKOM
Upgrade of SCADA
system an d the
27,32,
33,34,
35
Planning Ensure control over
remote substations
R 18,341,180 R9,876,020 R2,821,720 R5,643,440

174
ITEM NO. PROJECT NAME WAR
D NO.
CURRENT
STATUS
COMMENT/ NOTES PROJECT
VALUE
BUDGET
2020/21
BUDGET
2021/22
BUDGET
2022/23
Control Room at
CBD Substation
STREET LIGHTS
PHOMOLONG
Provision and
installation of
Street Lighting for
main entrance road
6013.29 meters
2,3 Planning To ensure an effective
service and adhere to
road ordinances as
well SANS regulations
R 1,963,163 R654,387 R654,387 R654,387
NYAKALONG
Provision and
installation of
Street Lighting for
main entrance road
1416.16 meters
36,19 Planning To ensure an effective
service and adhere to
road ordinances as
well SANS regulations
R482,335 R482,335
MMAMAHABANE
Provision and
installation of
Street Lighting for
main entrance road
4089.42 meters
1 Planning To ensure an effective
service and adhere to
road ordinances as
well SANS regulations
R 1,335,079 R445,026 R445,026
MELODING
Provision and
installation of
Street Lighting for
4,5,6,
7,9
Planning To ensure an effective
service and adhere to
road ordinances as
well SANS regulations
R 1,758,359 R586,119 R586,119

175
ITEM NO. PROJECT NAME WAR
D NO.
CURRENT
STATUS
COMMENT/ NOTES PROJECT
VALUE
BUDGET
2020/21
BUDGET
2021/22
BUDGET
2022/23
main entrance road
5882.04 meters
KUTLWANONG
Provision and
installation of
Street Lighting for
main entrance road
1128.54 meters
18,20,
22,10
Planning To ensure an effective
service and adhere to
road ordinances as
well SANS regulations
R 368,436 R 368,436
KUTLWANONG
Provision and
installation of 118
Solar Street
Lighting in
Kutlwanong
18,20,
22,11
Planning To ensure an effective
service and adhere to
road ordinances as
well SANS regulations
R 4,655,838 R 4,655,838
THABONG:
NKOANE ROAD
Provision and
installation of
Street Lighting for
main entrance road
6294.79 meters
16,17,
26,29
Planning To ensure an effective
service and adhere to
road ordinances as
well SANS regulations
R 2,055,072 R 2,055,072
THABONG:
MANGOSUTHU
BUTHELEZI ROAD
Provision and
installation of
Street Lighting for
14 Planning To ensure an effective
service and adhere to
road ordinances as
well SANS regulations
R 632,179 R 632,179

176
ITEM NO. PROJECT NAME WAR
D NO.
CURRENT
STATUS
COMMENT/ NOTES PROJECT
VALUE
BUDGET
2020/21
BUDGET
2021/22
BUDGET
2022/23
main entrance road
1936.4 meters
THABONG:
PHAKATI ROAD
Provision and
installation of
Street Lighting for
main entrance road
1959.05 meters
28 Planning To ensure an effective
service and adhere to
road ordinances as
well SANS regulations
R 639,574 R 639,574
THABONG: NDAKI
ROAD
Provision and
installation of
Street Lighting for
main entrance road
7225.81 meters
26 Planning To ensure an effective
service and adhere to
road ordinances as
well SANS regulations
R 2,359,042 R 2,359,042
THABONG:
MOTHUSI ROAD
Provision and
installation of
Street Lighting for
main entrance road
2124.26 meters
29,31 Planning To ensure an effective
service and adhere to
road ordinances as
well SANS regulations
R 693,511 R 693,511

177
ITEM NO. PROJECT NAME WAR
D NO.
CURRENT
STATUS
COMMENT/ NOTES PROJECT
VALUE
BUDGET
2020/21
BUDGET
2021/22
BUDGET
2022/23
THABONG:
CONSTANTIA
ROAD
Provision and
installation of
Street Lighting for
main entrance road
2124.26 meters
30,12,
14,31
Planning To ensure an effective
service and adhere to
road ordinances as
well SANS regulations
R1,875,627 R1,875,627
HENNENMAN
Provision and
installation of
two(2) high mast
lights for
Phomolong
2,3 Planning To ensure a safe
living environment in
the previous
disadvantage areas
R1,269,774 R634,887 R634,887
VIRGINIA
Provisioning and
installation of
Two(2) high mast
lights in Saaiplaas
8 Planning To ensure a safe
living environment in
the previous
disadvantage areas
R1,269,774 R634,887 R634,887
VIRGINIA
Provision and
installation of High
mast and
streetlights in
Virginia
4,8,9 Planning To ensure a safe
living environment in
the previous
disadvantage areas
R1,202,160 R526,109 R676,050
VIRGINIA
Provisioning and
4,5,6,
7,9
Planning To ensure a safe
living environment in
R1,269,774 R634,887 R634,887

178
ITEM NO. PROJECT NAME WAR
D NO.
CURRENT
STATUS
COMMENT/ NOTES PROJECT
VALUE
BUDGET
2020/21
BUDGET
2021/22
BUDGET
2022/23
installation of
Two(2) high mast
lights Meloding
the previous
disadvantage areas
VIRGINIA
Provisioning and
installation of
Ten(10) high mast
lights Meloding
Albany
7 Planning To ensure a safe
living environment in
the previous
disadvantage areas
R6,348,870 R1,587,217 R1,587,217 R3,174,414
ODENDAALSRUS
Provision and
installation of
Ten(10) high mast
lights in
Odendaalsrus
Ward 35
35 Planning To ensure a safe
living environment in
the previous
disadvantage areas
R6,348,870 R1,587,217 R1,587,217 R3,174,414
ODENDAALSRUS
Provision and
installation of
Thirteen(13) high
mast lights in
Kutlwanong
10,18,
20,21,
22
Planning To ensure a safe
living environment in
the previous
disadvantage areas
R8,253,531 R2,063,382 R2,063,382 R4,126,764
ALLANRIDGE
Provision and
installation of
Six(6) high mast
lights in Nyakallong
36 Planning To ensure a safe
living environment in
the previous
disadvantage areas
R3,809,322 R952,330 R952,330 R1904660

179
ITEM NO. PROJECT NAME WAR
D NO.
CURRENT
STATUS
COMMENT/ NOTES PROJECT
VALUE
BUDGET
2020/21
BUDGET
2021/22
BUDGET
2022/23
WELKOM
Five (5) High mast
lights Hani Park,
Bronville
11,12,
23
Planning To ensure a safe
living environment in
the previous
disadvantage areas
R3,174,435 R793,608 R793,608 R1,587,216
WELKOM
One (1) High mast
lights Phomolong
Ext2
35 Planning To ensure a safe
living environment in
the previous
disadvantage areas
R634,887 R634,887
WELKOM
Seven (7 ) High
mast lights Welkom
Reitz Park Ward 27
27 Planning To ensure a safe
living environment in
the previous
disadvantage areas
R4,444,209 R1,111,052 R1,111,052 R2,222,104
WELKOM
26 High mast lights
Thabong
11,13,
12,14,
15,16,
17,23,
25,26,
29,30,
31,27
Planning To ensure a safe
living environment in
the previous
disadvantage areas
R16,507,062 R4,126,765 R4,126,765 R8,253,530
VENTERSBURG
Three(3) High Mast
Lights in
Mmamahabane
1 Planning To ensure a safe
living environment in
the previous
disadvantage areas
R1,904,661 R476,165 R476,165 R952,330
VENTERSBURG
Upgrading of
streetlights
1 Planning To ensure an effective
service and adhere to
R212,197 R212,197

180
ITEM NO. PROJECT NAME WAR
D NO.
CURRENT
STATUS
COMMENT/ NOTES PROJECT
VALUE
BUDGET
2020/21
BUDGET
2021/22
BUDGET
2022/23
road ordinances as
well SANS regulations
HENNENMAN
Upgrading of
streetlights in
Hennenman Town
3 Planning To ensure an effective
service and adhere to
road ordinances as
well SANS regulations
R231,458 R231,458
ODENDAALSRUS
Provision and
installation of
streetlights Mimosa
Way
36 Planning To ensure an effective
service and adhere to
road ordinances as
well SANS regulations
R350,739 R350,739
WELKOM
Central park
lighting
32 Planning To ensure an effective
service and adhere to
road ordinances as
well SANS regulations
R210,443 R210,443
WELKOM
Koppie Alleen
Street replacement
stolen and
vandalized
streetlight
infrastructure and
the reinstallation
thereof so to
minimize the theft
of the electrical
cable installations.
33 Planning To ensure an effective
service and adhere to
road ordinances as
well SANS regulations
R 3,950,408 R 3,950,408

181
ITEM NO. PROJECT NAME WAR
D NO.
CURRENT
STATUS
COMMENT/ NOTES PROJECT
VALUE
BUDGET
2020/21
BUDGET
2021/22
BUDGET
2022/23
Matjhabeng
Municipality
Provide and install
a streetlight
management
system for the
Matjhabeng
Municipal Area.
All
wards
Planning To ensure an effective
service and adhere to
road ordinances as
well SANS regulations
R16,930,320 R4,232,580 R4,232,580 R8,465,160
Matjhabeng
Municipality
Provide and install
a Energy efficient
streetlight and
building project
system for the
Matjhabeng
Municipal Area.
All
wards
Planning To ensure an effective
service and adhere to
road ordinances as
well SANS regulations
R21,162,900 R5,643,440 R5,643,440 R11,286,880
Electrical workshop
WELKOM
Mini-Substation
Replacement
12,32 Planning Ensure sustainable
infrastructure
R 1,915,565 R638,521 R638,521 R638,521
VENTERSBURG
Upgrading of OCB
in distribution
network
1 Planning Ensure sustainable
infrastructure
R2,483,133 R1,693,032 R790,081

182
ITEM NO. PROJECT NAME WAR
D NO.
CURRENT
STATUS
COMMENT/ NOTES PROJECT
VALUE
BUDGET
2020/21
BUDGET
2021/22
BUDGET
2022/23
TOTAL
6.4 INFRASTRUCTURE ASSET MAINTENANCE PROGRAMMES
ITEM NO. PROJECT NAME WAR
D NO.
CURRENT
STATUS
COMMENT/ NOTES PROJECT
VALUE
BUDGET
2020/21
BUDGET
2021/22
BUDGET
2022/23
WATER SERVICES
6.4.1 Installation of water
meters on areas
without any and
replacement of all
dysfunctional water
meters
All Planning Water Demand to
reduce water loss and
unaccounted-for
water.
R3 000 000 R 3 000 000 R 3 000 000 R 3 000 000
Install water meters
at developed parks
and communal
stand pipes.
All Implementation Water Demand to
reduce water loss and
unaccounted for
water.
R 500 000 R 500 0000
Replacement of
non-functional and
worn-out Valves
and hydrants
All Planning Water Demand to
reduce water loss
R 5 000 000 R 1 000 000 R 1 000 000 R 1 000 000

183
ITEM NO. PROJECT NAME WAR
D NO.
CURRENT
STATUS
COMMENT/ NOTES PROJECT
VALUE
BUDGET
2020/21
BUDGET
2021/22
BUDGET
2022/23
Conduct leak
detection
investigation and
analysis to
determine priority
list and develop
water loss
monitoring
database.
All Planning Water Demand to
reduce water loss
R 4 000 000 R 4 000 000
Implement leak
detection system
and equipment
All Planning Water Demand to
reduce water loss
R10 000 000 R 2 000 000 R 2 000 000 R 2 000 000
SANITATION SERVICES
Refurbishment of
collapsed line in
Anthony Road,
Odendaalsrus
35 Reduce sewerage
spillages
R 500 000 R 500 000
Virginia Industrial
Area outfall sewer
upgrade
9 Designed
internal
R 2 000 000 R 2 000 000
WASTEWATER TREATMENT PLANTS AND PUMPSTATION
Refurbish of
Witpan Sewerage
works
32 Construction Construction R10 000
000
R 2 000 000

184
ITEM NO. PROJECT NAME WAR
D NO.
CURRENT
STATUS
COMMENT/ NOTES PROJECT
VALUE
BUDGET
2020/21
BUDGET
2021/22
BUDGET
2022/23
Cleaning of sumps
in Pump Stations
as and when
needed
(Term-Contracts)
All O&M
Planning
R 5 000 000
R 1 000 000
R 1 000 000
R 1 000 000
ROADS AND STORMWATER
Repair or replace
damaged and
stolen catch pit and
manhole lids
All O&M R10 000
000
R 1 500 000 R 1 500 000 R 1 500 000
Upgrade catch pits
with limited
capacity to
enhance storm
water functionality.
All O&M R 4 000 000 R 1 000 000 R 1 000 000 R 1 000 000
Crack sealing of
roads to prevent
water seepage into
base layers and
extend life
expectancy (Km)
All Planning R 21 000 000 R 7 000 000 R 7 000 000 R 7 000 000
Repair potholes in
formal roads to
reduce
deterioration and
All O&M R25 000 000 R5 000 000 R5 000 000 R5 000 000

185
ITEM NO. PROJECT NAME WAR
D NO.
CURRENT
STATUS
COMMENT/ NOTES PROJECT
VALUE
BUDGET
2020/21
BUDGET
2021/22
BUDGET
2022/23
ensure safe usage
thereof (m2).
Resealing of roads
of roads
All O&M R100 000 000 R37 000 000 R37 000 000 R37 000 000
Gravelling of
Roads
All O&M R25 000 000 R5 000 000 R5 000 000 R5 000 000
Cleaning of lined
storm water canals
in the whole of
Matjhabeng once a
year.
All O&M R 4 000 000 R 800 000 R 800 000 R 800 000
Cleaning of unlined
storm water canals
in Matjhabeng
twice a year.
All O&M R 6 000 000 R 1 200 000 R 1 200 000 R 1 200 000
Cleaning and
maintenance of
existing storm
water drainage
pipes (Operational)
35,36 O&M R 13 000 000 R 2 600 000 R 2 600 000 R 2 600 000
BUILDINGS
Build new Council
chambers and
32 Planning Current chambers
and offices does
not address
requirements of
R 20m R 700 000 R 5 000
000
R10 000 000

186
ITEM NO. PROJECT NAME WAR
D NO.
CURRENT
STATUS
COMMENT/ NOTES PROJECT
VALUE
BUDGET
2020/21
BUDGET
2021/22
BUDGET
2022/23
extend Municipal
offices
councilors and
officials.
ELECTRICITY
WELKOM
Upgrading
breakers and
isolators 132KV
reticulation
32 Planning To ensure an effective
and safe 132kV
Distribution network
R1,480,840 R878,849 R583,991
WELKOM
Main intake test,
upgrade and
repairs to 132KV
32 Planning To ensure an effective
and safe 132kV
Distribution network
R1,006,879 R637,708 R369,171
ADMINISTRATION AND STRATEGIC PLANNING
HENNENMAN
Upgrading of load
control
3 Planning Council benefiting
from the time of use
tariffs
R1,315,274 R1,315,274
ODENDAALSRUS
Upgrading of load
control
1 Planning Council benefiting
from the time of use
tariffs
R175,369 R175,369
VIRGINIA
Upgrading of load
control system
Virginia
9 Planning Council benefiting
from the time of use
tariffs
R360,739 R360,739

187
ITEM NO. PROJECT NAME WAR
D NO.
CURRENT
STATUS
COMMENT/ NOTES PROJECT
VALUE
BUDGET
2020/21
BUDGET
2021/22
BUDGET
2022/23
WELKOM
Upgrading load
control Welkom
32,33, Planning Council benefiting
from the time of use
tariffs
R701,479 R701,479
MATJHABENG
Upgrading of
remote meter
reading software
for the Matjhabeng
Electrical
Engineering
Services
Department
All Planning Ensuring that use is
made of the saving
that will be obtained
with the
implementation of the
time of use tariffs that
was approved by the
NERSA
R31,885 R31,885
MATJHABENG
Conduct a Risk
assessment for the
Electrical
Engineering
Services in terms
of the OHS Act
85/1993
All Planning To ensure a safe
working environment
for the Electrical
Engineering Services
Department
R263,054 R263,054
WELKOM
Quality of supply
All Planning To ensure that a good
quality of supply is
provided to the
community
R 4,384,247 R2,630,548 R1,277,589 R525,109
DISTRIBUTION LOW AND MEDIUM VOLTAGE

188
ITEM NO. PROJECT NAME WAR
D NO.
CURRENT
STATUS
COMMENT/ NOTES PROJECT
VALUE
BUDGET
2020/21
BUDGET
2021/22
BUDGET
2022/23
ODENDAALSRUS
Upgrade electrical
distribution boxes
35,36 Planning To ensure the
effectiveness of the
medium voltage
distribution networks
R 158 110 R 105 406 R 52 703
VENTERSBURG
Provision and
installation
protection relays
1 Planning Insuring a safe
working environment
R131,527 R131,527
HENNENMAN
Provision and
installation
protection relays
3 Planning Insuring a safe
working environment
R424,395 R175,369 R249,025
VIRGINIA
Upgrading of
protection relays
4,8,9 Planning Insuring a safe
working environment
R852,297 R150,818 R350,739 R350,739
ODENDAALSRUS
Upgrading of
protection relays
35,36 Planning Insuring a safe
working environment
R850,544 R526,109 R324,434
WELKOM
Upgrading of
protection relays
27,32,
33,34,
35
Planning Insuring a safe
working environment
R1,867,187 R622,395 R622,395 R622,395
VIRGINIA
Provision and
installation of
8,9 Planning Ensuring that use is
made of the saving
that will be obtained
with the
R315,655 R52,610 R263,054

189
ITEM NO. PROJECT NAME WAR
D NO.
CURRENT
STATUS
COMMENT/ NOTES PROJECT
VALUE
BUDGET
2020/21
BUDGET
2021/22
BUDGET
2022/23
remote Electrical
metering systems
implementation of the
time of use tariffs that
was approved by
NERSA
ODENDAALSRUS
Provision and
installation of
remote Electrical
metering systems
35,36 Planning Ensuring that use is
made of the saving
that will be obtained
with the
implementation of the
time of use tariffs that
was approved by
NERSA
R 510,817 R324,083 R 186,733
WELKOM
Provision and
installation of
remote Electrical
metering systems
27,32,
33,34,
35
Planning Ensuring that use is
made of the saving
that will be obtained
with the
implementation of the
time of use tariffs that
was approved by
NERSA
R 3,332,024 R1,110,674 R1,110,674 R1,110,674
MATJHABENG
Testing and
verification of all
large electrical
consumer
connections to the
NRS 058
regulations in all
Planning Ensuring that use is
made of the saving
that will be obtained
with the
implementation of the
time of use tariffs that
R 6,563,218 R 2,187,739 R 2,187,739 R 2,187,739

190
ITEM NO. PROJECT NAME WAR
D NO.
CURRENT
STATUS
COMMENT/ NOTES PROJECT
VALUE
BUDGET
2020/21
BUDGET
2021/22
BUDGET
2022/23
towns by a SANAS
approved authority
was approved by
NERSA
REVENUE PROTECTION
VENTERSBURG
Provision and
installation of a
STS pre-paid
electrical meters
1 Planning To ensure that an
effective and efficient
service is rendered
R192,906 R192,906
HENNENMAN
Provision and
installation of a
STS pre-paid
electrical meters
3 Planning To ensure that an
effective and efficient
service is rendered
R192,906 R192,906
VIRGINIA
Upgrading of STS
pre-paid electrical
metering system
4,8,9 Planning To ensure that an
effective and efficient
service is rendered
R210,443 R210,443
ODENDAALSRUS
Upgrading of STS
pre-paid electrical
metering system
35,36 Planning To ensure that an
effective and efficient
service is rendered
R368,276 R157,832 R210,443

191
ITEM NO. PROJECT NAME WAR
D NO.
CURRENT
STATUS
COMMENT/ NOTES PROJECT
VALUE
BUDGET
2020/21
BUDGET
2021/22
BUDGET
2022/23
ALLANRIDGE
Provision and
installation of STS
pre-paid electrical
metering system
36 Planning To ensure that an
effective and efficient
service is rendered
R192,906 R149,064 R43,842
WELKOM
Pre-paid metering
upgrade
27,32,
33,34,
35
Planning To ensure that an
effective and efficient
service is rendered
R327,240 R327,240
HIGHMAST LIGHTS AND STREET LIGHTS
MATJHABENG
Upgrading lighting
Othello Road
32 Planning To ensure an effective
service and adhere to
road ordinances as
well SANS regulations
R87,684 R87,684
MATJHABENG
Maintenance of
Street Lights
O&M To ensure an effective
service and adhere to
road ordinances as
well SANS regulations
R5 000 000 R5 000 000
MATJHABENG
Maintenance of
High Mast Lights
O&M To ensure an effective
service and adhere to
road ordinances as
well SANS regulations
R8 000 000 R8 000 000
ELECTRICAL WORKSHOP
MATJHABENG
Testing and repair
all Electrical
Planning To ensure that
electrical installation
of Council buildings
R1,227,589 R526,109 R350,739 R350,739

192
ITEM NO. PROJECT NAME WAR
D NO.
CURRENT
STATUS
COMMENT/ NOTES PROJECT
VALUE
BUDGET
2020/21
BUDGET
2021/22
BUDGET
2022/23
Installation that is
property of the
Matjhabeng
Municipality in
terms to the
SANS10142-1
regulations
adhere to the SANS
10142 regulations
HENNENMAN
Provision and
installation of
security systems at
electrical
Substations
3 Planning To safeguard Council
from theft and
vandalism of property
R 87,684 R 87,684
VENTERSBURG
Provision and
installation of
security systems at
electrical
Substations
1 Planning To safeguard Council
from theft and
vandalism of property
R78,916 R78,916
ALLANRIDGE
Provision and
installation of
security systems at
electrical
Substations
36 Planning To safeguard Council
from theft and
vandalism of property
R 87,684 R 87,684
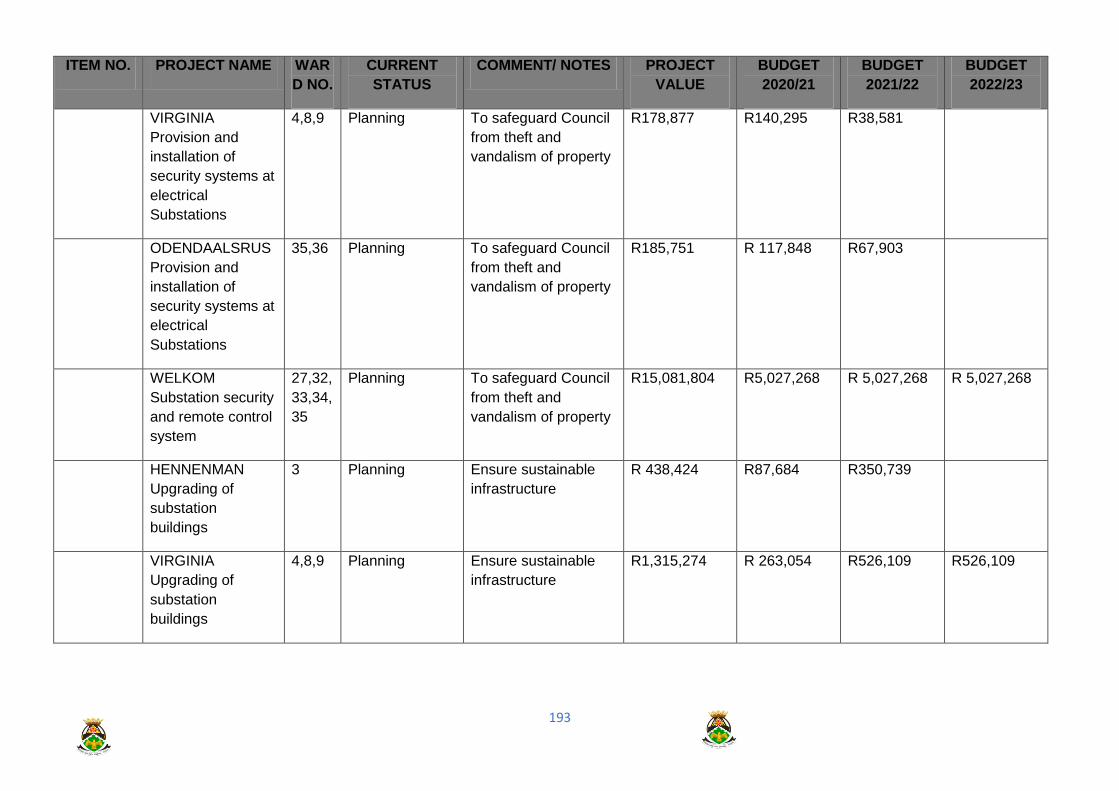
193
ITEM NO. PROJECT NAME WAR
D NO.
CURRENT
STATUS
COMMENT/ NOTES PROJECT
VALUE
BUDGET
2020/21
BUDGET
2021/22
BUDGET
2022/23
VIRGINIA
Provision and
installation of
security systems at
electrical
Substations
4,8,9 Planning To safeguard Council
from theft and
vandalism of property
R178,877 R140,295 R38,581
ODENDAALSRUS
Provision and
installation of
security systems at
electrical
Substations
35,36 Planning To safeguard Council
from theft and
vandalism of property
R185,751 R 117,848 R67,903
WELKOM
Substation security
and remote control
system
27,32,
33,34,
35
Planning To safeguard Council
from theft and
vandalism of property
R15,081,804 R5,027,268 R 5,027,268 R 5,027,268
HENNENMAN
Upgrading of
substation
buildings
3 Planning Ensure sustainable
infrastructure
R 438,424 R87,684 R350,739
VIRGINIA
Upgrading of
substation
buildings
4,8,9 Planning Ensure sustainable
infrastructure
R1,315,274 R 263,054 R526,109 R526,109

194
ITEM NO. PROJECT NAME WAR
D NO.
CURRENT
STATUS
COMMENT/ NOTES PROJECT
VALUE
BUDGET
2020/21
BUDGET
2021/22
BUDGET
2022/23
ODENDAALSRUS
Upgrading Main
substation
36 Planning Ensure sustainable
infrastructure
R1,175,369 R1,175,369
ALLANRIDGE
Upgrading Main
substation
36 Planning Ensure sustainable
infrastructure
R 1,9752,043 R 1,9752,043
ALLANRIDGE
Emergency work to
be done on all
substation in
Allanridge
36 Planning Ensure sustainable
infrastructure
R 350,739 R 350,739 0 0
WELKOM
Revamp main-sub
structures
32 Planning Ensure sustainable
infrastructure
R 263,054 R 131,527 R 131,527

195

196
7.1 IMPLEMENTATION
7.1.1 INTRODUCTION
The rationale behind this chapter is to the following:
Our targets for the FY 2020/2021
Our targets for the term 2017/22
This chapter presents the IDP implementation framework in line with the following key performance
areas;
1. Service delivery and infrastructure development
2. Municipal transformation and organizational development
3. Good governance and public participation
4. Financial Sustainability and Viability
5. Local Economic Development
As indicated in Chapter 1, this IDP has certain gaps, which we intend to address once we go into
the review of the IDP however the same was not fully achieved.
7.1.2 INSTITUTIONAL SCORE CARD
The indicators contained in the Scorecard help us determine five-year impacts and outcomes we
aim to achieve through the implementation of our objectives. The targets and indicators on the
Scorecard below are generally impact and outcome indicators and targets, i.e. the measure of the
overall developmental impact, and the extent of benefit to beneficiaries. The required SDBIP
indicators, definition of indicators and reporting requirements are addressed in Chapter 9,
Performance Management.

197
KPA 1: MUNICIPAL TRANSFORMATION AND INSTITUTIONAL DEVELOPMENT
KPI
No OBJECTIVE STRATEGY KPI BASELINE WARD
ANNUAL
TARGET
ANNUAL
BUDGET
SOURCE
OF
FUNDING
RESPONSIBLE
DEPARTMENT 2020 / 2021
2021 / 2022
2022 / 2023
POE
PROGRAMME: ORGANISATIONAL PLANNING
MTI 1
To ensure
that the
Matjhabeng
Local
Municipality is
sufficiently
capacitated
with skilled
and
competent
workforce
across all
levels in order
to meet
Service
Delivery
objectives
Review the
Organizational
structure and
identify critical
positions to
capacitate the
Local
Municipality.
Approved
Organizationa
l structure
2009
Organizational
Structure
All wards
Reviewed
Organizationa
l Structure
approved
R0.00
Nil Rands for
review of
structure.
+- R20,000
for Org Plus
Software
- CSS Approved
organizationa
l structure
Revised Revised Architecture of the
structure
Council resolution
Financial
implications
PROGRAMME: RECRUITMENT, SELECTION AND PLACEMENT

198
KPI
No OBJECTIVE STRATEGY KPI BASELINE WARD
ANNUAL
TARGET
ANNUAL
BUDGET
SOURCE
OF
FUNDING
RESPONSIBLE
DEPARTMENT 2020 / 2021
2021 / 2022
2022 / 2023
POE
MTI 2
MTI 3
Recruit, Select
and place 120
applicants in
line with the
approved
Organizational
Structure and
Budget.
Number of
critical
positions
filled in
accordance
with the
Organizatio
nal
Structure
20 All wards
120 R74 898 461 COUNCIL CSS 120 As per the
needs
As per the
needs
Requisitions and
authorizations
Advertisement
Appoint Letters
Contracts of
employment
Induct 120 newly
recruited
employees
No. of New
Employees
inducted
0 All wards
120 R0.00 - CSS 120 As per the
recruitment
As per the
recruitment Induction Manual
Attendance register
PROGRAMME: TRAINING AND DEVELOPMENT MTI
4 To capacitate
the Matjhabeng
Local
Municipality
with well
Trained and
skilled
employees.
Implement 367
Training
Interventions in
line with the
Workplace Skills
Plan (WSP)
Number of
Employees
trained
152 All
wards 367 Training
Beneficiaries
R1 700 000.00 COUNCIL CSS 367 3
6
7
3
6
7
Annual training
report
Approved
submissions
Attendance register
Training feedback
PROGRAMME: EMPLOYEE WELLNESS

199
KPI
No OBJECTIVE STRATEGY KPI BASELINE WARD
ANNUAL
TARGET
ANNUAL
BUDGET
SOURCE
OF
FUNDING
RESPONSIBLE
DEPARTMENT 2020 / 2021
2021 / 2022
2022 / 2023
POE
MTI 5
MTI 6
MTI 7
MTI 8
To ensure
Health and
Wellness of
Employees
within
Matjhabeng
Local
Municipality
Develop a
revised Health
and Wellness
Plan
Revised
Health and
Wellness
plan
Current Health
and Wellness
Plan
All
wards Revised
Health and
Wellness
plan
R0.00 - CSS Revised
Health and
Wellness
plan
- - Revised health and
wellness plan
Conduct 24 Life
Skill Awareness
Programme
sessions/campai
gn s
Number of
Awareness
sessions/
campaigns
conducted
24 All
wards
40 R0.00 - CSS 24 2
4
2
4
Attendance register
Approved
submissions
Invitation letters
Provide 130
counselling
services to
distressed
Councillors and
employees
Number of
counselling
sessions
conducted
130 All
wards
80 R0.00 - CSS 130 1
3
0
1
3
0
Consultation
register
Provide at least
70 Pauper Burial
services to
destitute people
and unknown
corpses
Number of
beneficiaries
assisted
62 All
wards
70 R0.00 - CSS 70 7
0
7
0 Signed orders
Death
certificates
Service level
agreements
PROGRAMME: LEGAL SERVICES MANAGEMENT
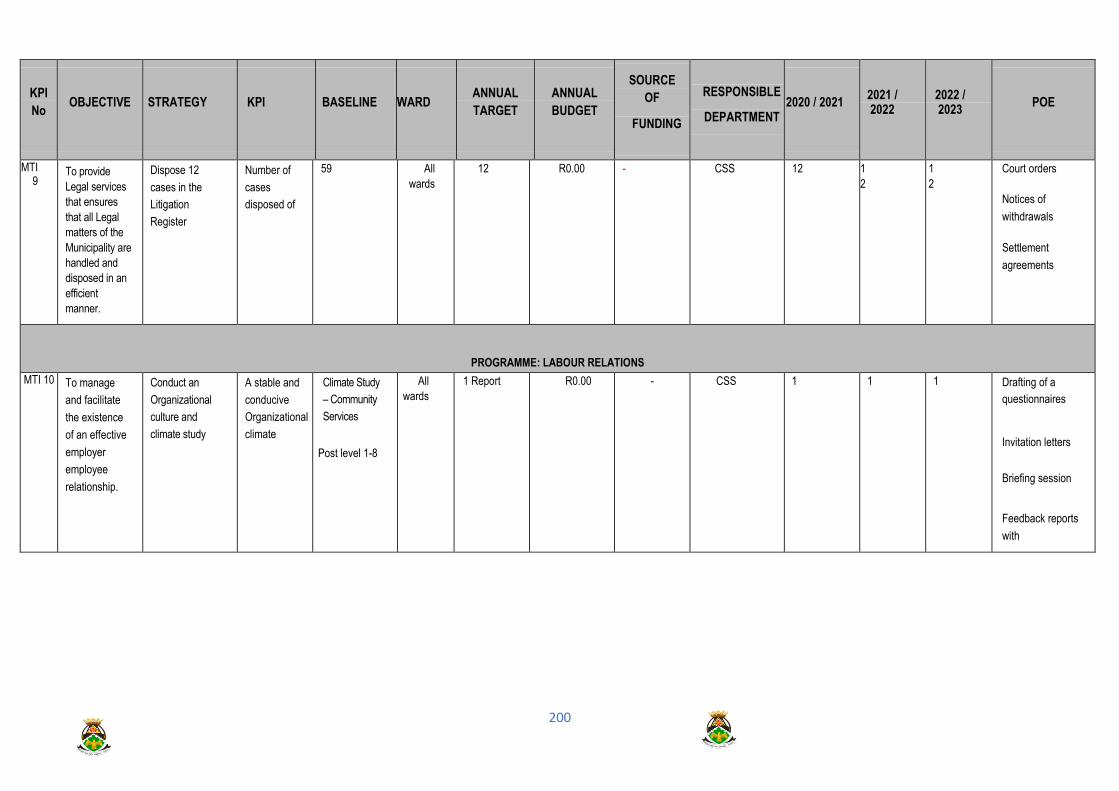
200
KPI
No OBJECTIVE STRATEGY KPI BASELINE WARD
ANNUAL
TARGET
ANNUAL
BUDGET
SOURCE
OF
FUNDING
RESPONSIBLE
DEPARTMENT 2020 / 2021
2021 / 2022
2022 / 2023
POE
MTI 9
To provide
Legal services
that ensures
that all Legal
matters of the
Municipality are
handled and
disposed in an
efficient
manner.
Dispose 12
cases in the
Litigation
Register
Number of
cases
disposed of
59 All
wards
12 R0.00 - CSS 12 1
2
1
2
Court orders
Notices of
withdrawals
Settlement
agreements
PROGRAMME: LABOUR RELATIONS
MTI 10 To manage
and facilitate
the existence
of an effective
employer
employee
relationship.
Conduct an
Organizational
culture and
climate study
A stable and
conducive
Organizational
climate
Climate Study
– Community
Services
Post level 1-8
All
wards
1 Report R0.00 - CSS 1 1 1 Drafting of a
questionnaires
Invitation letters
Briefing session
Feedback reports
with
recommendations

201
KPI
No OBJECTIVE STRATEGY KPI BASELINE WARD
ANNUAL
TARGET
ANNUAL
BUDGET
SOURCE
OF
FUNDING
RESPONSIBLE
DEPARTMENT 2020 / 2021
2021 / 2022
2022 / 2023
POE
MTI 11 To facilitate a
sound employer
employee
relationship.
Utilize 12 the
Local Labour
Forum as a
consultative/negot
iations forum to
facilitate and
sustain effective
relations,
ultimately
enhancing service
delivery
A fully
functional
Local Labour
Forum
6 All
wards
12 Meetings R0.00 - CSS Schedule of
Meetings
Attendance
Registers
Minutes
MTI 12 To enhance
the
understanding
of labour
related
Collective
Agreements
Conduct 4 briefing
sessions on
Labour related
matters as
contained
Collective
Agreements
Adequately
informed
Employees
1 All
wards
4 Sessions R0.00 - CSS Invitations
Attendance
Registers
Copy of
Presentation

202
KPI
No OBJECTIVE STRATEGY KPI BASELINE WARD
ANNUAL
TARGET
ANNUAL
BUDGET
SOURCE
OF
FUNDING
RESPONSIBLE
DEPARTMENT 2020 / 2021
2021 / 2022
2022 / 2023
POE
MTI 13 Attendance of
Arbitrations
Attend 10
Arbitrations and
implement all 10
Arbitration Awards
Attendance
of
Arbitrations
set down
by
SALGBC
10 All
wards Total
Arbitrations
set down by
SALGBC
R0.00 - CSS Total
Arbitrations set
down by
SALGBC
Total
Arbitrations
set down by
SALGBC
Total
Arbitratio
ns set
down by
SALGBC
Set down notice
Attendance
registers
Arbitration Awards
Monthly Reports
PROGRAMME: OCCUPATIONAL HEALTH AND SAFETY MTI 14 To ensure
compliance with
the
Occupational
Conduct 16 Safety
Awareness
programmes
Number of
Health and
Safety
awareness
10 All
wards
16 R0.00 - CSS 16 16 16 Invitations
programme
MTI 15
MTI 16
programs
conducted
Attendance register
Number of
Health and
Safety
Inspections
conducted
10 All
wards
20 R0.00 - CSS 20 20 20 Inspections register

203
KPI
No OBJECTIVE STRATEGY KPI BASELINE WARD
ANNUAL
TARGET
ANNUAL
BUDGET
SOURCE
OF
FUNDING
RESPONSIBLE
DEPARTMENT 2020 / 2021
2021 / 2022
2022 / 2023
POE
Health and
Safety Act
Conduct 20 of
Safety
Inspections
Number of
Health and
Safety
Medical
Tests
conducted
80 All
wards
100 R0.00 - CSS 100 100 100 Medical tests
register
PROGRAMME: HUMAN RESOURCES MANAGEMENT
HUMAN RESOURCES PLANNING
MTI 17
MTI 18
To develop an
efficient and
effective
Human
Resources
Management
Plan aligned
with IDP
Review the current
Human Resources
Plan
Reviewed
Human
Resources
Plan
approved
Current
Human
Resources
Plan
All
wards Approved
Human
Resources
Plan
R0.00 - CSS 1 Approved
Human
Resources
Plan
1 Approved
Human
Resources
Plan
1 Approved
Human
Resources
Plan
EXCO
approved plan
To have job
descriptions
which are
aligned with
Directorate
plans
Review
100% of Job
descriptions
Number of Job
Descriptions
Reviewed
100% of Job
descriptions
aligned across
Divisions
All
wards 100% of Job
descriptions
reviewed and
aligned across
Divisions
R0.00 - CSS 100% of Job
descriptions
reviewed and
aligned across
Divisions
100% of Job
descriptions
reviewed
and aligned
across
Divisions
100% of
Job
description
s reviewed
and
aligned
across
Divisions
List of reviewed job
descriptions
List of all job
descriptions
Copies of
signed job
descriptions
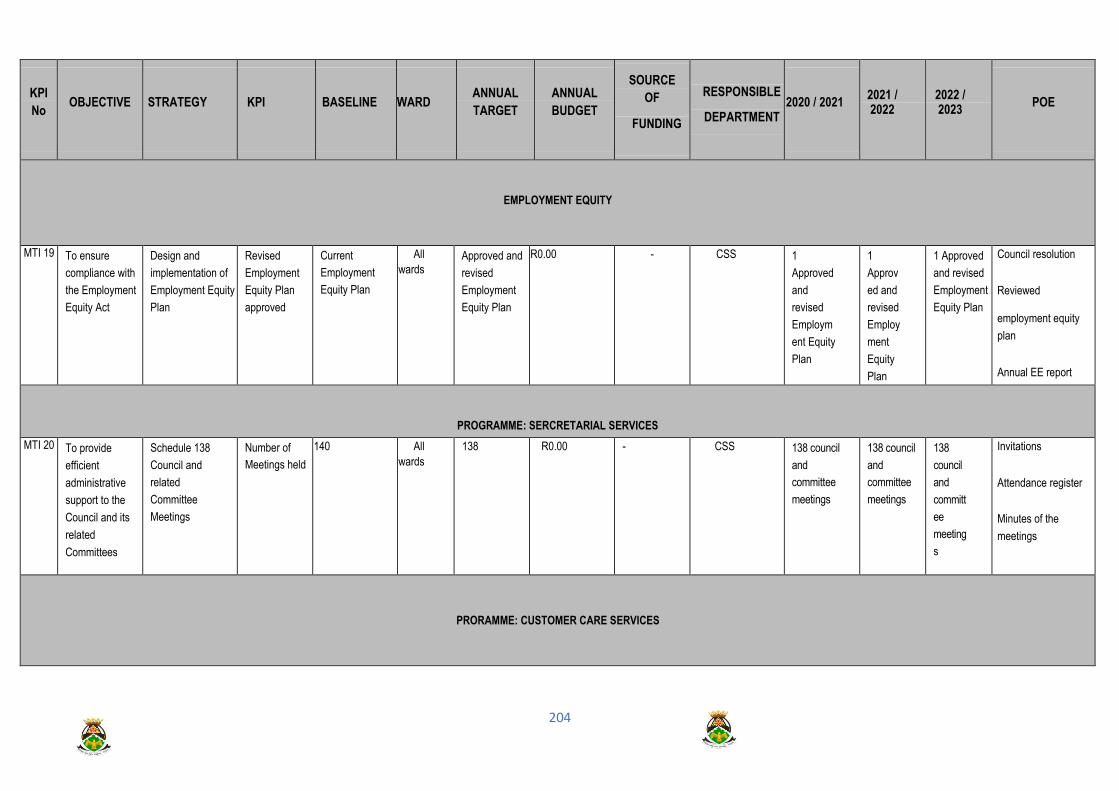
204
KPI
No OBJECTIVE STRATEGY KPI BASELINE WARD
ANNUAL
TARGET
ANNUAL
BUDGET
SOURCE
OF
FUNDING
RESPONSIBLE
DEPARTMENT 2020 / 2021
2021 / 2022
2022 / 2023
POE
EMPLOYMENT EQUITY
MTI 19 To ensure
compliance with
the Employment
Equity Act
Design and
implementation of
Employment Equity
Plan
Revised
Employment
Equity Plan
approved
Current
Employment
Equity Plan
All
wards Approved and
revised
Employment
Equity Plan
R0.00 - CSS 1
Approved
and
revised
Employm
ent Equity
Plan
1
Approv
ed and
revised
Employ
ment
Equity
Plan
1 Approved
and revised
Employment
Equity Plan
Council resolution
Reviewed
employment equity
plan
Annual EE report
PROGRAMME: SERCRETARIAL SERVICES
MTI 20 To provide
efficient
administrative
support to the
Council and its
related
Committees
Schedule 138
Council and
related
Committee
Meetings
Number of
Meetings held
140 All
wards
138 R0.00 - CSS 138 council
and
committee
meetings
138 council
and
committee
meetings
138
council
and
committ
ee
meeting
s
Invitations
Attendance register
Minutes of the
meetings
PRORAMME: CUSTOMER CARE SERVICES

205
KPI
No OBJECTIVE STRATEGY KPI BASELINE WARD
ANNUAL
TARGET
ANNUAL
BUDGET
SOURCE
OF
FUNDING
RESPONSIBLE
DEPARTMENT 2020 / 2021
2021 / 2022
2022 / 2023
POE
MTI 21 To provide
professional and
responsive
Customer Care
Services
Develop
1Customer Care
Relations
Management
Brochure
Existence of a
Customer Care
Relations
Management
Brochure
0 All
wards
1 R0.00 - CSS 1 Customer
Care Brochure
1 Customer
Care
Brochure
1 Customer
Care
Brochure
Approved Brochure
by EXCO
MTI 22 Develop 1
electronic
Customer Care
Management
System.
Existence of an
electronic
Customer
Management
Systems.
0 All
wards
1 R0.00 - CSS 1 electronic
customer Care
Management
system
- - Functional
Customer Care
Management
system
MTI 23 Provide door
472 as well as
192 building
signage
Municipal
building.
Number of
Signages
mounted in all
Municipal
Buildings
0 All
wards
Door
Signages:472
Building
Signages:
192
R350 000 - CSS Submissions
Invoices
PRORAMME: DOCUMENT MANAGEMENT
MTI 24 To ensure
sound
Record
Keeping
and Record
Develop 1
Document
Management
Policy Manual
Existence
of an
adopted
Document
Manageme
nt Policy
Manual
0 All
wards
1 R0.00 - CSS 1 document
management
policy manual
- - 1 document
management policy
manual

206
KPI
No OBJECTIVE STRATEGY KPI BASELINE WARD
ANNUAL
TARGET
ANNUAL
BUDGET
SOURCE
OF
FUNDING
RESPONSIBLE
DEPARTMENT 2020 / 2021
2021 / 2022
2022 / 2023
POE
MTI 25 Manageme
nt Practices
Purchase 1
Electronic
Document
Management
System
Existence of an
Electronic
Document
Management
System
0 All
wards
1 R900 000 COUNCIL CSS 1 Electronic
Document
Management
System
- - 1 Electronic
Document
Management
System
TI 26 Train 100
Municipal Officials
on sound Record
Keeping and
management
practices
Number of
Municipal
Officials
trained
0 All
wards
100 R0.00 - CSS 100 trained
municipal
officials
- - Attendance register
MTI 27 To enhance
responsivenes
s to citizen’s
priorities and
capabilities of
delivery of
quality
services,
quality
management
and
administrative
practices
Submit 12 Monthly
reports each period
on the 7th of each
succeeding month.
Submit
monthly
report to
management
on the actual
performance
against the
SDBIP
None All
wards
12 Monthly
Performance
reports
R0.00 - EDCS 12 monthly
reports
- - 12 monthly reports
MTI 28 Hold 12
monthly
departmental
per year
Number of
departmental
meetings held
None All
Wards 12 Monthly
departmental
meetings held
R0.00 - EDCS 12 Monthly
departmental
meetings
12 Monthly
departmental
meetings
12 Monthly
departmental
meetings
12 Monthly
departmental
meetings
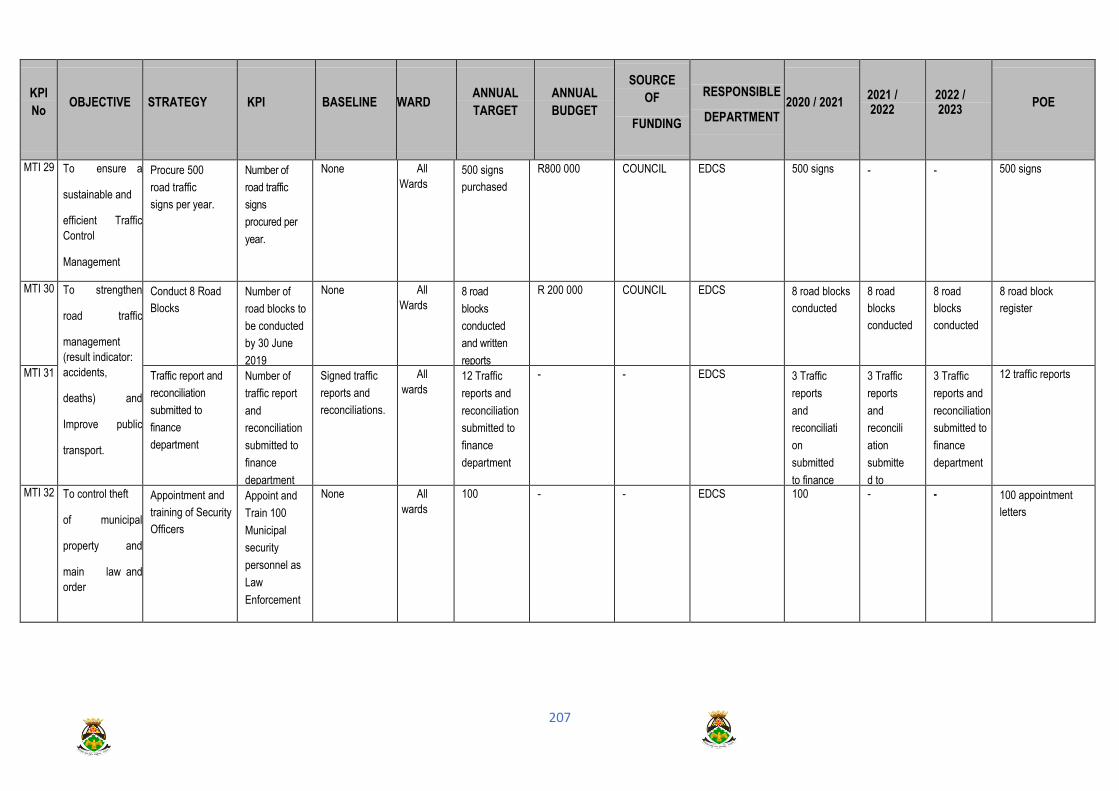
207
KPI
No OBJECTIVE STRATEGY KPI BASELINE WARD
ANNUAL
TARGET
ANNUAL
BUDGET
SOURCE
OF
FUNDING
RESPONSIBLE
DEPARTMENT 2020 / 2021
2021 / 2022
2022 / 2023
POE
MTI 29 To ensure a
sustainable and
efficient Traffic
Control
Management
Procure 500
road traffic
signs per year.
Number of
road traffic
signs
procured per
year.
None All
Wards
500 signs
purchased
R800 000 COUNCIL EDCS 500 signs - - 500 signs
MTI 30 To strengthen
road traffic
management
(result indicator:
accidents,
deaths) and
Improve public
transport.
Conduct 8 Road
Blocks
Number of
road blocks to
be conducted
by 30 June
2019
None All
Wards 8 road
blocks
conducted
and written
reports
R 200 000 COUNCIL EDCS 8 road blocks
conducted
8 road
blocks
conducted
8 road
blocks
conducted
8 road block
register
MTI 31 Traffic report and
reconciliation
submitted to
finance
department
Number of
traffic report
and
reconciliation
submitted to
finance
department
Signed traffic
reports and
reconciliations.
All
wards 12 Traffic
reports and
reconciliation
submitted to
finance
department
- - EDCS 3 Traffic
reports
and
reconciliati
on
submitted
to finance
departmen
t
3 Traffic
reports
and
reconcili
ation
submitte
d to
finance
departm
ent
3 Traffic
reports and
reconciliation
submitted to
finance
department
12 traffic reports
MTI 32 To control theft
of municipal
property and
main law and
order
Appointment and
training of Security
Officers
Appoint and
Train 100
Municipal
security
personnel as
Law
Enforcement
None All
wards
100 - - EDCS 100 - - 100 appointment
letters

208
KPI
No OBJECTIVE STRATEGY KPI BASELINE WARD
ANNUAL
TARGET
ANNUAL
BUDGET
SOURCE
OF
FUNDING
RESPONSIBLE
DEPARTMENT 2020 / 2021
2021 / 2022
2022 / 2023
POE
MTI 33 Facilitate the
development of
safer
communities
Appoint 20 Fire
officers in
Mmamahabane
satellite fire station
Number of
Fire officers
in
Mmamahab
ane satellite
fire station
None All
wards
8 - - EDCS 0 20 Fire
officers
appointed
0 20 appointment
letters
MTI 34 To ensure
access to
regular and
sustainable
refuse removal
services to all
household,
public facilities
and
businesses
Develop and
approve a
Security Master
Plan
1 Security
Master
Plan
developed
and
approved
None All
wards 1 Security
Master Plan
developed
and
approved
R500 000 COUNCIL EDCS Drafting of the
plan
Draft
Security
Master
Plan
1 Security Master
Plan
MTI 35 Review of Disaster
Management Plan
Reports on
review of
Disaster
Management
Plan
Draft Plan All
wards One
developed
and
approved
DMP
R0.00 - EDCS 0 0 Report on
the
progress
of the
Review of
the DMP
1 Disaster
Management Plan
approved by exco
MTI 36 Develop 1 Fire
Management Plan
Reports on
developme
nt of Fire
Manageme
nt Plan
None All
wards One
developed
and
approved
FMP
R 300 000 COUNCIL EDCS 1 report on
the progress
of the
development
of the FMP
1 report on
the
progress of
the
developme
nt of the
FMP
1 report on
the
progress
of the
developme
nt of the
FMP
1 Fire Management
Plan approved by
exco

209
KPA 2: BASIC SERVICES AND INFRASTRUCTURE INVESTMENT
OBJECTIVE STRATEGY KPI BASE-LINE ANNUAL TARGET
BUDGET FUNDING
SOURCE
WARD RESPONSIBILITY 2020/2021 2021/22 2022/23 POE
PROGRAMME: SEWER NETWORKS AND WWTW DEVELOPMENTAL AND MAINTENANCE PROGRAMS
To develop and
maintain Sewer
infrastructure
networks and ancillary
infrastructure to
ensure a healthy
environment as
required by National
Environmental
Management Act
(MEMA).
Refurbish and
upgrade all
identified WWTW
and pump-
stations as well
as bulk sewer
networks to
ensure that
systems are
functional in line
with Green Drop
regulations and
MEMA:
100% of completed
refurbishment
works of
Nyakallong WWTW
Existing WWTW not fully functional
Project on retention stage
R52 299 552.00
Implementation according to 5 year schedule
MIG 36 INFRASTRUCTURE Retention
615 430.42
Complete
% of completed
refurbishment works
of Virginia WWTP
Sludge Management
Existing WWTW not fully functional
Project completed
R41 655 606.00
Implementation according to 5 year schedule
MIG 9 INFRASTRUCTURE 100% Complete
% of completed
refurbishment works
of WWTW, Pump
Station and outfall
sewer pipe line in
Mmamahabane
WWTW, Pump
Station and Outfall
sewer pipe exist in
Mmamahabane
100% completion of the works
R16 733 670.00m Implementation according to 5 year schedule
MIG 1 INFRASTRUCTURE 100% Complete
100%Functional
Septic Tank system
Whites
Sewer network
exist. Sewer
transported by
road to
Hennenman
WWTW
Refurbishment of works in the next year
R10 231 310.29
Implementation according to 5 year schedule
MIG 3 INFRASTRUCTURE 100%
completed of
construction
714 136.95
Retention
37 684
% of completed
works of Virginia:
Upgrading of Waste
Water Treatment
Works – Phase 2
Existing WWTW not fully functional
Upgrading of works in the next year
R41 790 175.33m Implementation according to 5 year schedule
MIG 9 INFRASTRUCTURE 100% Practical
completion of
construction
R3 050 043.81m
Retention
R1 914
710.99
Final Completion

210
OBJECTIVE STRATEGY KPI BASE-LINE ANNUAL TARGET
BUDGET FUNDING
SOURCE
WARD RESPONSIBILITY 2020/2021 2021/22 2022/23 POE
% of completed
upgrade and
refurbishment of
Kutlwanong
WWTW and
inlet pump
station to
address new
developments to
total of 9 Ml/d.
WWTW exists but too small for development of 2900 new stands
Refurbishment of works in the next year
R41 896 185.60 Implementation according to 5 year schedule
MIG 18
INFRASTRUCTURE 60% completed
of construction
R23 980 023.94
100%
practical
completed of
construction
R10 518
223.94
Retention
R1 518 223.94
% of completed
refurbishment of
Theronia
WWTW
R113m Implementation
according to 5 year
schedule
WSIG 33 INFRASTRUCTURE 55% completed
of refurbishment
R62 000 000
100%
completed of
refurbishment
R51 000 000
Retention
R5 650 000
Phomolong
WWTW
Upgrading of
existing
WWTW
Upgraded WWTW
24m
MIG 3,2 INFRASTRUCTURE 60% complete
construction
10,532,500.00
Refurbish
maintenance and
upgrade all
identified pump-
stations and
ancillary works to
ensure that systems
are functional in line
with Green Drop
regulations and
MEMA as well as to
% of completed
upgrade and
refurbishment of
Thabong T8
pump station to
address new
developments
T8 pump
station exists
Construction stage
R 16m Implementation according to 5 year
schedule
MIG 14 INFRASTRUCTURE 100%
completed of
upgrade and
refurbishment
8 265 023.72
Retention
879 016.28
% of completed
upgrade and
refurbishment of
Phomolong
Pump station
Pump station (Sky
range) exists
1 Functional
pump station
R13 000 000 Implementation according to 5 year schedule
MIG/COUNCIL
(O&M)
3 INFRASTRUCTURE Retention
846 000.00

211
OBJECTIVE STRATEGY KPI BASE-LINE ANNUAL TARGET
BUDGET FUNDING
SOURCE
WARD RESPONSIBILITY 2020/2021 2021/22 2022/23 POE
address new
developments.
Matjhabeng:
Upgrading of 7
electrical panels at
sewer pump stations
Electrical panels
need upgrading
7 upgraded
electrical panels
R1.9m MIG Various INFRASTRUCTURE 100%
complete
construction
1,058,793.04
Retention
55,725.90
Sumps cleaned at
pump stations to
reduce risk of
flooding and extend
life of mechanical
equipment
Number of sumps
cleaned in the next
financial year.
60 sumps 8 sumps/a R2.4m Implementation according to 5 year schedule
COUNCIL
(O&M)
All wards
INFRASTRUCTURE 8 sumps
cleaned R2.4m
8 sumps
cleaned
R2.4m
8 sumps cleaned
R2.4m
Construct and
refurbish 2500m
of Kutlwanong
and 1.3km of
Odendaalsrus
outfall sewer
lines
respectively
from the next
financial year
% completed of
upgrade and
refurbishment
Kutlwanong
outfall sewer
Kutlwanong
outfall sewer line
exists
Construction
stage
R21m Implementation according to 5 year schedule
MIG 18 INFRASTRUCTURE 40% completed
of upgrade and
refurbishment
4 499 172.72
100%
completed of
upgrade and
refurbishment
14 032
106.42
Retention
875 800.86
. Identify and replace
300 damaged or
stolen manhole
covers without
resale value to
cover open
manholes and
reduce risk of
damage to public
and equipment
Number of
manhole
covers
replaced
24 870 MH 200 MH covers replaced/a
R500 000 Implementation according to 5 year schedule
COUNCIL
(O&M)
All wards INFRASTRUCTURE 200 MH covers
replaced
R500 000
200 MH
covers
replaced
R500 000
200 MH covers
replaced
R500 000
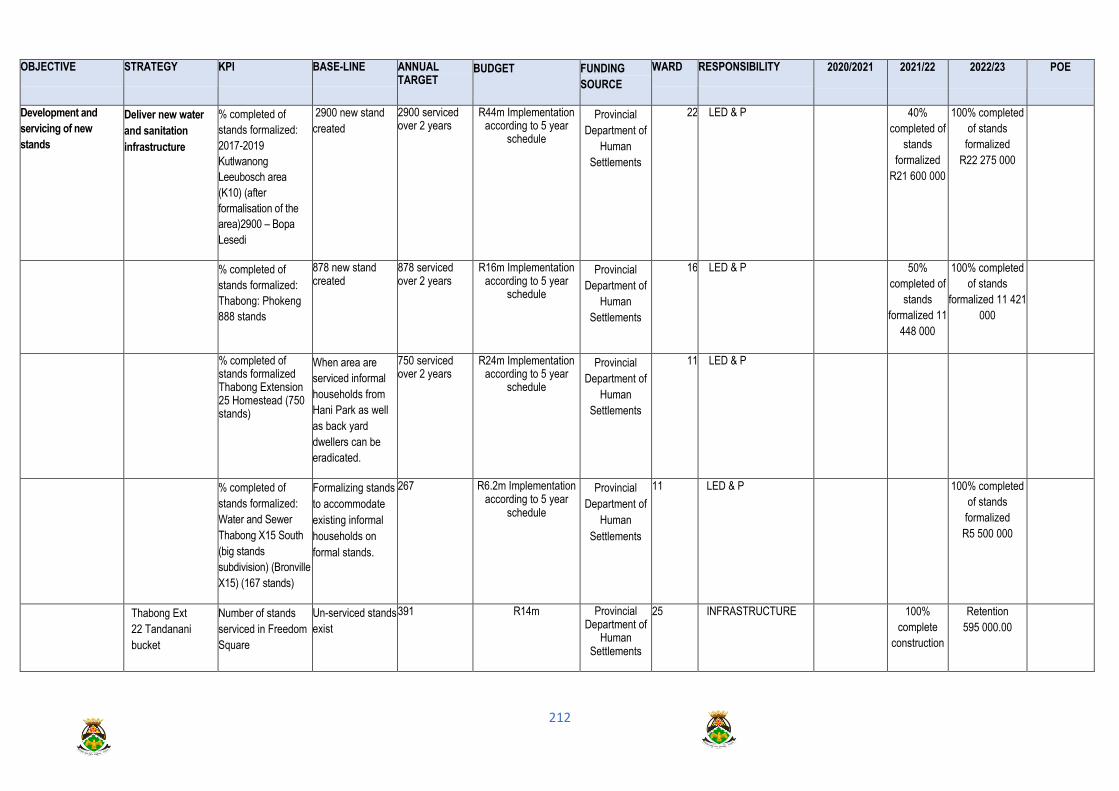
212
OBJECTIVE STRATEGY KPI BASE-LINE ANNUAL TARGET
BUDGET FUNDING
SOURCE
WARD RESPONSIBILITY 2020/2021 2021/22 2022/23 POE
Development and
servicing of new
stands
Deliver new water
and sanitation
infrastructure
% completed of
stands formalized:
2017-2019
Kutlwanong
Leeubosch area
(K10) (after
formalisation of the
area)2900 – Bopa
Lesedi
2900 new stand
created
2900 serviced over 2 years
R44m Implementation according to 5 year
schedule
Provincial
Department of
Human
Settlements
22 LED & P 40%
completed of
stands
formalized
R21 600 000
100% completed
of stands
formalized
R22 275 000
% completed of
stands formalized:
Thabong: Phokeng
888 stands
878 new stand created
878 serviced over 2 years
R16m Implementation according to 5 year
schedule
Provincial
Department of
Human
Settlements
16 LED & P 50%
completed of
stands
formalized 11
448 000
100% completed
of stands
formalized 11 421
000
% completed of stands formalized Thabong Extension 25 Homestead (750 stands)
When area are
serviced informal
households from
Hani Park as well
as back yard
dwellers can be
eradicated.
750 serviced over 2 years
R24m Implementation according to 5 year
schedule
Provincial
Department of
Human
Settlements
11 LED & P
% completed of
stands formalized:
Water and Sewer
Thabong X15 South
(big stands
subdivision) (Bronville
X15) (167 stands)
Formalizing stands
to accommodate
existing informal
households on
formal stands.
267 R6.2m Implementation according to 5 year
schedule
Provincial
Department of
Human
Settlements
11 LED & P 100% completed
of stands
formalized
R5 500 000
Thabong Ext
22 Tandanani
bucket
Number of stands
serviced in Freedom
Square
Un-serviced stands
exist
391 R14m Provincial Department of
Human Settlements
25 INFRASTRUCTURE 100%
complete
construction
Retention
595 000.00

213
OBJECTIVE STRATEGY KPI BASE-LINE ANNUAL TARGET
BUDGET FUNDING
SOURCE
WARD RESPONSIBILITY 2020/2021 2021/22 2022/23 POE
eradication for
391 stands
13 405
000.00
Supply Water and
Sewer lines 300
stands in
Phomolong Phase
2 by March 2021
Number of stands
supplied with water
and sewer lines in
Phomolong
800 Un-serviced
stands exist
300 stands R3m Implementation according to 5 year schedule
Provincial
Department of
Human
Settlements
3 INFRASTRUCTURE
Service stands
in Hani Park
(Thabong ext
18)
Number of stands
serviced in Hani Park
Un-serviced stands
exist
According to available budget
R103.9m Implementation according to 5 year schedule
COUNCIL 12 INFRASTRUCTURE 25% completed
of stands
R18 900 000
100%
completed of
stands
R66 150 000
Thabong Ext 15
Bronville bucket
Eradication for
617 stands
Number of stands
serviced in Bronville
Un-serviced stands
exist
173 R6m MIG 11 INFRASTRUCTURE 20%
complete
construction
821 609.16
100% complete
construction
4 774 439.29
To develop and
maintain Water
networks and
ancillary works as
well to ensure
constant water supply
and Water Demand
Management System
to enhance revenue
Replace of old
worn out water
pipes to reduce
water loss and
service
disruption.
Number of kilometres
of worn out water
pipelines replaced.
138 km of pipe
exist
15 km/a worn out
water pipelines
replaced.
R20m/a COUNCIL All wards INFRASTRUCTURE R20m/a R20m/a R20m/a
Replace old worn-
out dilapidated
galvanized steel
pipes in Allanridge
Old
galvanized
steel pipes
replaced
Galvanized steel
pipes exist
Old galvanized
steel pipes
replaced
R6m MIG 36 INFRASTRUCTURE 100%
completed
construction
5 319 075.02
Retention
363 241.76
Service and
refurbish 500
hydrants and
valves once in 5
year, and
replace that
Number of hydrants
refurbished
500 hydrants
exist
refurbish 100
hydrants
R1.5m/a COUNCIL All wards INFRASTRUCTURE R1.5m/a R1.5m/a R1.5m/a

214
OBJECTIVE STRATEGY KPI BASE-LINE ANNUAL TARGET
BUDGET FUNDING
SOURCE
WARD RESPONSIBILITY 2020/2021 2021/22 2022/23 POE
cannot be
repaired.
Replace 5 000
water meters that is
dysfunctional
Number of water
meters replaced
5 000 meters
exist
1 000 new meters
R1.5m COUNCIL All wards
INFRASTRUCTURE R1.5m/a R1.5m/a R1.5m/a
Kutlwanong X9,
K2, Block 5 Water
connections and
meters (200
stands)
Number of water
meter connections
made
400 stands
without meters
400 R12 112 676.00m MIG 18,20,21 INFRASTRUCTURE 20%
complete
construction
2 000 000.00
80% complete
construction
9 511 042.20
Thabong X20 (Hani
Park): Extension of
network, house
connections and
meters (180
stands)
Number of house
connections and
meters installed
Extension of
water network
and house
connections to
180 stands exist
180 R2 599 855.74 MIG 12 INFRASTRUCTURE Final
Completion
296 079.42
Kutlwanong:
Replacement of old
asbestos water pipes
with pvc pipes
Length of replaced
pipes
650m 650m R14 818 349.20 MIG INFRASTRUCTURE 20%
complete
construction
6 979 935.89
100% Practical
Completion
7 097 795.85
Replacement of
water asbestos pipes
in Thabong
Length of replaced
pipes
650m 650m R18 000 000.00 MIG INFRASTRUCTURE 40% complete
construction
6 688 853.00
Retention
900 000.00
Investigate and
register 4 000
existing water
meters not on
Finance system
Number of water
meters investigated
4 000 meters
registered exist
2 000 meters
registered
R0.5m COUNCIL 2,3 INFRASTRUCTURE R0.5m R0.5m R0.5m
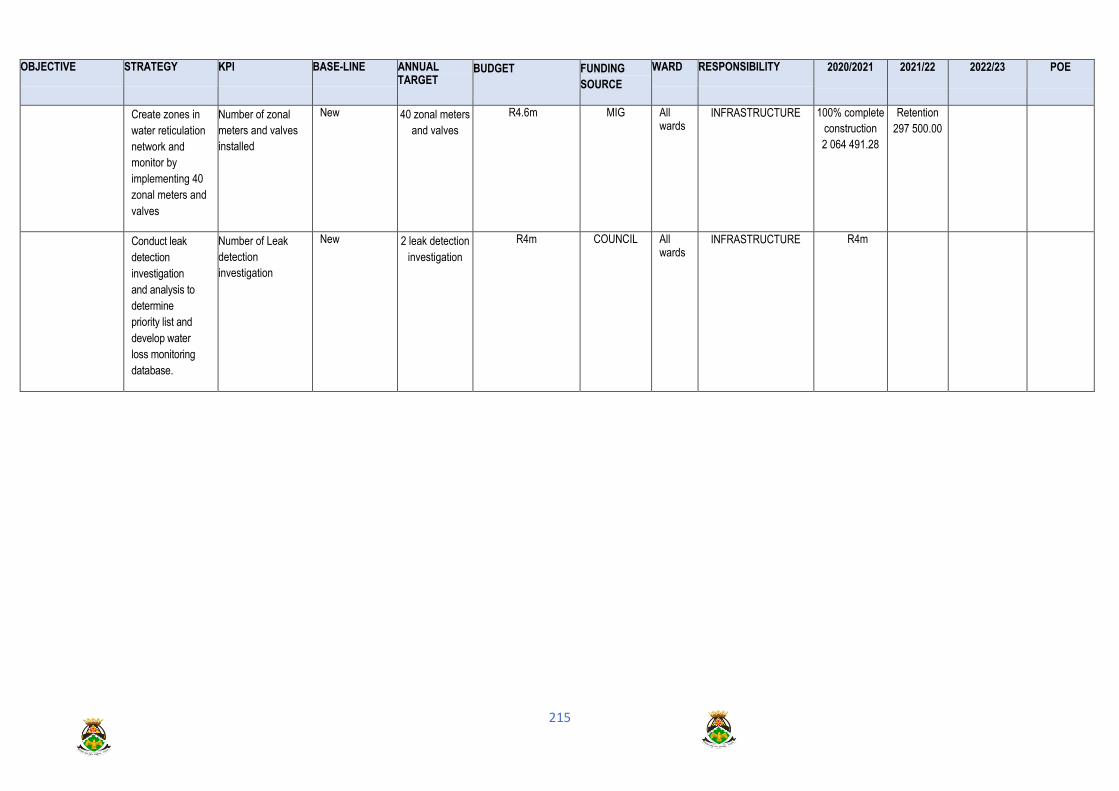
215
OBJECTIVE STRATEGY KPI BASE-LINE ANNUAL TARGET
BUDGET FUNDING
SOURCE
WARD RESPONSIBILITY 2020/2021 2021/22 2022/23 POE
Create zones in
water reticulation
network and
monitor by
implementing 40
zonal meters and
valves
Number of zonal
meters and valves
installed
New 40 zonal meters
and valves
R4.6m MIG All wards
INFRASTRUCTURE 100% complete
construction
2 064 491.28
Retention
297 500.00
Conduct leak
detection
investigation
and analysis to
determine
priority list and
develop water
loss monitoring
database.
Number of Leak
detection
investigation
New 2 leak detection
investigation
R4m COUNCIL All wards
INFRASTRUCTURE R4m

216
OBJECTIVE STRATEGY KPI BASE-LINE
ANNUAL TARGET
BUDGET FUNDING SOURCE
WARD RESPONSIBILITY 2020/21 2021/22 2022/23 POE
To develop and maintain roads and storm water infrastructure and develop transportations systems and maintenance thereof.
Upgrading of Old Thabong gravel roads to concrete paving blocks Ward 28
% of construction of road upgraded from gravel road to concrete paving blocks in Ward 28
2.1km 2.1km over 2 Financial years
R16m Implementation according to 5 year schedule
MIG 28 INFRASTRUCTURE
Retention 563,988.50
Final Completion
Thabong Ext 22 Tandanani: Roads and Stormwater (2.3km)
% of construction of road upgraded in Thabong Ext 22 Tandanani
2.3km 2.3km R21m Implementation according to 5 year schedule
MIG 25 INFRASTRUCTURE
- 50% completed of construction
10 580 276,84
100% practical completed of construction
9 445 723,73
Resurface 25km of all streets every year according to PMS or Municipal priority list such that the use full life expectance of roads are extended but operations are safe.
Number of km of streets resealed per year
1200 km
25 km R 50m/a Implementation according to 5 year schedule
COUNCIL All wards
INFRASTRUCTURE 100% of roads resealed according to approved tender
R43m
100% of roads resealed according to approved tender
R50m
100% of roads resealed according to approved tender
R50m
100% of roads resealed according to approved tender
R50m
Patch 15 800 m2 of potholes in formal roads to reduce deterioration and ensure safe usage thereof (m2).
Number of square meters of streets patched
79 000 m2
15 800 m2 R4m Implementation according to 5 year schedule
COUNCIL All wards
INFRASTRUCTURE 100% of annual target refurbish through patching
R6m
100% of annual target refurbish through patching
R6m
100% of annual target refurbish through patching
R6m
100% of annual target refurbish through patching
R6m
Construct 10km of un- designed Gravel roads per
% of construction of undersigned
75 km 10 km R15m Implementation according to
COUNCIL All wards
INFRASTRUCTURE 100% of annual target refurbish
100% of annual target refurbish
100% of annual target refurbish
100% of annual target refurbish through gravel

217
OBJECTIVE STRATEGY KPI BASE-LINE
ANNUAL TARGET
BUDGET FUNDING SOURCE
WARD RESPONSIBILITY 2020/21 2021/22 2022/23 POE
annum to enhance accessibility and driving safety, especially during raining periods
gravel roads constructed
5 year schedule
through gravel construction R10m
through gravel construction R10m
through gravel construction R10m
construction R10m
Blade and re-gravel 60km of gravel and dirt roads to enhance driving comfort.
% of construction of gravel roads target refurbished by blading thereof.
200km 60 km R3.5m Implementation according to 5 year schedule
COUNCIL All wards
INFRASTRUCTURE 100% of annual target refurbish through blading of roads R3.5m
100% of annual target refurbish through blading of roads R3.5m
100% of annual target refurbish through blading of roads R3.5m
100% of annual target refurbish through blading of roads R3.5m
Upgrade 2km of main storm water system in Nyakallong
% of construction of main storm water system in Nyakallong
2 km 2 km R22m Implementation according to 5 year schedule
MIG 19,36 INFRASTRUCTURE
Retention
825,379.45
60% completed of Phase 2 construction
Retention
Clean and upgrade 7.1km of storm water.
% of cleaning of lined storm water canals according to maintenance plan
7.1 km exist
7.1 km R4m/a Implementation according to 5 year schedule
COUNCIL All wards INFRASTRUCTURE 100% completed of annual maintenance target
R4m/a
100% completed of annual maintenance target
R4m/a
100% completed of annual maintenance target
R4m/a
100% completed of annual maintenance target
R4m/a
Construction of new storm water networks and upgrade and maintenance of existing networks subject to availability of budget
Clean 5.6km of unlined storm water canals in Matjhabeng twice a year.
% of cleaning of unlined storm water canals according to maintenance plan
5.6 km exist
5.6 km R6m/a Implementation according to 5 year schedule
COUNCIL All wards
INFRASTRUCTURE 100% completed of annual maintenance target
R6m/a
100% completed of annual maintenance target
R6m/a
100% completed of annual maintenance target
R6m/a
100% completed of annual maintenance target
R6m/a
Clean and maintain 13km of existing storm water drainage pipes.
% of cleaning of closed storm water systems according to
13km exist
13 km of drainage pipes cleaned and maintained
R13m Implementation according to 5 year schedule
COUNCIL 35,36 INFRASTRUCTURE
100% completed of annual maintenance target
100% completed of annual maintenance target
100% completed of annual maintenance target
100% completed of annual maintenance target
R13m

218
OBJECTIVE STRATEGY KPI BASE-LINE
ANNUAL TARGET
BUDGET FUNDING SOURCE
WARD RESPONSIBILITY 2020/21 2021/22 2022/23 POE
maintenance plan
R13m R13m R13m
Repair or replace 40 damaged and stolen catch pit and manhole lids to restore affectivity thereof.
% of stolen catch pit and manhole lids repaired or replaced
1300 catch pits exist
400 R0.5m/a Implementation according to 5 year schedule
COUNCIL All wards
INFRASTRUCTURE 100% completed of annual maintenance target
R0.5m /a
100% completed of annual maintenance target
R0.5m /a
100% completed of annual maintenance target
R0.5m /a
100% completed of annual maintenance target
R0.5m /a

219
OBJECTIVE STRATEGY KPI BASELINE ANNUAL TARGET
ANNUAL BUDGET
FUNDING SOURCE
WARD RESPONSIBILITY 2020/2021 2021/2022 2022/2023 POE
To construct and maintain
132kV Distribution network,
MV networks, LV network,
Street light and high mast
lighting and ancillary works to
adhere to road ordinances as
well SANS regulations and
ensure an effective and safe
environment
132kV Distribution
WELKOM Provide
and install 20MVA
132KV transformer
at Urania
Substation
New transformer
installed
4
Substations
Construction stage
R14m COUNCIL
and DOE
32 INFRASTRUCTURE R5 000 000 R10 000 000 R10 000 000
Distribution Low and Medium Voltage
Rheederspark X2
(Phomolong Village):
12MVA Sub-station
and Electrification of
869 households
Electrification 900
stands
Reinstatement
of vandalised
Electrical
Infrastructure
Construction
stage
R15.541m COUNCIL and
DOE
35 INFRASTRUCTURE R15 545 000 R10 000000 R 5000 000
WELKOM:
Supply 4km of low
and medium
voltage network in
Extension 15
Thabong.
4km of low and
medium voltage
network
Extension
15
Thabong
exists
Construction stage
R 3.8m COUNCIL and
DOE
12 INFRASTRUCTURE R3,500,000
Street lights
WELKOM Install
thirteen (13) High
mast lights:
Number of
high mast
lights
installed
New R 0.3m MIG 11,12 INFRASTRUCTURE
PMU
R2 242 000 R2 242 000 R2 242 000

220
OBJECTIVE STRATEGY KPI BASELINE ANNUAL TARGET
ANNUAL BUDGET
FUNDING SOURCE
WARD RESPONSIBILITY 2020/2021 2021/2022 2022/2023 POE
Hani Park(3),
Bronville(6) and
Meloding (4)
Provision of new
high mast lights in
Meloding and
Bronville
New MIG 5,11,4,5,6,7 INFRASTRUCTURE
PMU
R2 242 000 R2 242 000 R2 242 000
Thabong: Twenty
Ten Provision and
Installation of 5 High
Mast Lights
Provision and
Installation of High
Mast Lights
New MIG 25 INFRASTRUCTURE
PMU
- - R1 750 000
Thabong: Constantia
Road: Provision and
Installation of Street
lights
Provision and
Installation of
Street lights along
Constantia Road
New MIG 12,13,
14,15,
30,31
INFRASTRUCTURE
PMU
- - R1 500 000
Thabong: Mothusi
Road Provision and
Installation of Street
lights
Upgrading and
provision of street
lights along
Mothusi road
New MIG 28,29,
30,31 INFRASTRUCTURE
PMU
- - R1 500 000
Reinstatement of 6.5
KM Streetlight
Koppie Alleen in the
Welkom Unit
Reinstatement
of stolen and
vandalized
street lighting
infrastructure
on the
SANRAL
road.
Contractor
on site
Completion R16 m Council Funding 32,28 and
27
INFRASTRUCTURE
PMU
R16 000 000
To ensure a sound
high mast and
streetlight
installation as GIZ,
DOE and MIG
funding is made
available.
Number of
street light
management
and buildings
convert to
energy efficient
lighting in
27000 street
lights
2000 street
lights and 50
high mast lights
convert with
energy efficient
lights (To be
confirm)
R18m GIZ All wards INFRASTRUCTURE R18m

221
OBJECTIVE STRATEGY KPI BASELINE ANNUAL TARGET
ANNUAL BUDGET
FUNDING SOURCE
WARD RESPONSIBILITY 2020/2021 2021/2022 2022/2023 POE
Matjhabeng
Municipal Area
To ensure an effective service
and adhere to road ordinances
as well SANS regulations
Repair and
Maintenance of
street lights to full
functionality
Number of street
lights maintained
and repaired
13564 street
lights exists
Repair and
Maintenance of
street lights to
full functionality
4069 Repair and
Maintenance of
street lights to full
functionality
All wards INFRASTRUCTURE Repair of 4069
streetlights
Repair of
4069
streetlights
Repair of 4069
streetlights
Repair and
Maintenance of High
mast lights to full
functionality
Number of high
mast lights
maintained and
repaired
367 high mast
lights exists
Repair and
Maintenance of
High mast lights
to full
functionality
110 Repair and
Maintenance of
High mast lights
to full functionality
All wards INFRASTRUCTURE Repair 110 High
Mast Lights
Repair 110
High Mast
Lights
Repair 110
High Mast
Lights
PROGRAMME: MASTER PLANS
To develop infrastructure roads,
water, sewerage, electricity,
storm water master plans in
order to facilitate proper
planning and budgeting in a cost
effective manner.
Develop Service
Master plan and
Planning designs
where applicable
for Storm water,
Sewer and Water
services by
analysing existing
networks and do
planning designs
for future projects
subject to
availability of
budget
Develop
Storm water
Master plan
for all towns
and prioritize
identified
projects.
3 1 Storm
water
Master
plan
R7m COUNCIL/ DBSA All wards INFRASTRUCTURE
Develop bulk
Sewerage
Master plan and
capacity
analysis for all
towns and
prioritize
identified
projects
3 1 Sewerage Master plan
R7m COUNCIL/ DBSA All wards INFRASTRUCTURE R7m

222
OBJECTIVE STRATEGY KPI BASELINE ANNUAL TARGET
ANNUAL BUDGET
FUNDING SOURCE
WARD RESPONSIBILITY 2020/2021 2021/2022 2022/2023 POE
Develop Water
reticulation
Master plan
(including
meters and
standpipes) for
all towns and
prioritize
identified
projects
3 1 Water
reticulation
Master plan
R7m COUNCIL/ DBSA All wards INFRASTRUCTURE R7m
Develop
Transportation
master plan
according to
legislation
0 1
Transportation
master plan
R7m COUNCIL/ DBSA All wards INFRASTRUCTURE
Develop
Purified
Effluent
(PSE)
master plan
0 1 Purified
Effluent (PSE)
master plan
R7m COUNCIL/ DBSA All wards INFRASTRUCTURE
Develop
Pavement
Management
System (PMS)
master plan
0 1 Pavement
Management
System
(PMS)
master plan
R7m COUNCIL/ DBSA All wards INFRASTRUCTURE R7m
Comply with the
Water Services
Authority
legislative
requirements
subject to
availability of
budget.
Develop Water
Services
Development
master plan
(WSDP)
according to
legislation (Act
108 of 1997)
and Water
master plan
(WMP)
Draft exists 1 Water
Services
Development
master plan
(WSDP)
R7m COUNCIL/ DBSA All wards INFRASTRUCTURE R7m

223
OBJECTIVE STRATEGY KPI BASELINE ANNUAL TARGET
ANNUAL BUDGET
FUNDING SOURCE
WARD RESPONSIBILITY 2020/2021 2021/2022 2022/2023 POE
Develop an
electrical master
plan to ensure
compliance to all
relevant
regulations
Development
of electrical
master plan
1 Electrical
Master plan
R7 m
COUNCIL/ DBSA All wards INFRASTRUCTURE R7m
To provide adequate burial
space for the community
Timeous provision
of Burial Space
Timeous
provision of
Burial Space
Timeous
provision of
Burial Space
4000 Graves R 30 000
000
MIG/ Council All
Wards
EDCS Upgrading/paving
of internal roads
at Phumlani,
Nyakallong,
Thuhlwane,
Kutlwanong and
Meloding
Cemeteries
*Fencing of
Welkom
Cemetery
3000 Graves
Fencing of
Old Meloding
Cemetery
3000
Graves
Fencing
of Old
Bronville
Cemetery
3000
Graves
To ensure that basic sport &
recreation facilities are
available to all communities
Upgrade &
maintain existing &
build new
municipal sport &
recreation facilities
Upgrade 1 Sport
Stadium and 2
sport Centre
3 Upgraded
Sport
Stadiums
1 Upgraded
Sport
Stadium and
2 sport
Centres
R23,100,000
MIG/COUNCIL
8,25,27 EDCS Upgrade 1 Sport
Stadium:
Ventersburg
Fencing of 1
Goldfields Sport
Centre
Upgrading of
Welkom Club
Upgrade 1
Sport
Stadium:
Nyakallong
Upgrade 1
Sport Stadium:
Phomolong

224
OBJECTIVE STRATEGY KPI BASELINE ANNUAL TARGET
ANNUAL BUDGET
FUNDING SOURCE
WARD RESPONSIBILITY 2020/2021 2021/2022 2022/2023 POE
Recreation
Centre
Establish 1 multi-
purpose centre:
-Meloding Phase 1
1 multi-purpose
centre
established
1 multi-
purpose
centre
established
1 multi-
purpose
centre
established
R 8 325
794.68
MIG 4 EDCS 1 multi-purpose
centre
established
Meloding Phase
1
1 multi-
purpose
centre
established
Meloding
Phase 2
1 multi-
purpose centre
established
Establishment of a
Fun Park
Virginia
One Fun Park
established
0 1 R1O Million MIG 9 EDCS Phase 2
Upgrading of
Swimming Pools
Number of
Swimming Pools
upgraded
4 4 R16 million MIG 11, 25,
32, 35
EDCS 1Mimosa 1
Riebeeckstad
1 Welkom
To ensure efficient Waste
Management Programme
Upgrade 1 landfill
site
1 Upgraded
landfill site
2 Established
Transfer
Stations
4
0
1 Upgraded
landfill site
2 established
transfer
station
R18 million
R12 million
MIG
DEA / MIG
11
25 / 34
EDCS 1 Upgraded
landfill site:
Hennenman
*Establishment of
2 Transfer
Stations (
1 Upgraded
landfill site:
Nyakallong

225
OBJECTIVE STRATEGY KPI BASELINE ANNUAL TARGET
ANNUAL BUDGET
FUNDING SOURCE
WARD RESPONSIBILITY 2020/2021 2021/2022 2022/2023 POE
Riebeeckstad &
Flamingo Park)
Purchase of New
Compactor Trucks
Number of
Compactor
Trucks
purchased
12 23 R20 000 000 Council EDCS 23 23 23
To ensure that the Municipality
has an effective and efficient
waste management system
Procure 2000
wheelie bins
Procurement of
2000 wheelie
bins
Procurement
of 2000
wheelie bins
Procurement
of 2000
wheelie bins
R6 000 000
Council All
Wards
EDCS Procurement of
2000 wheelie
bins
Procurement
of 2000
wheelie bins
Procurement
of 2000
wheelie bins
To ensure a sustainable and
efficient Traffic Control
Management
Procure 1000
signs and 500 000
litres of paint per
year
Number of road
traffic signs
procured per
year.
Number of litres
of paint
procured per
year.
1000 signs
and 500 000
litres of paint
per year
1000 signs
and 500 000
litres of paint
per year
R2 400 000
Council All
Wards
EDCS 1000 signs and
500 000 litres of
paint per year
1000 signs
and 500 000
litres of paint
per year
1000 signs and
500 000 litres
of paint per
year
Refurbishment of
the Training
Academy
Training
Academy
refurbished
0 1 R3 million Council 32 EDCS 1

226
OBJECTIVE STRATEGY KPI BASELINE ANNUAL TARGET
ANNUAL BUDGET
FUNDING SOURCE
WARD RESPONSIBILITY 2020/2021 2021/2022 2022/2023 POE
Construction of
Accommodation
for the students
Student
Accommodation
constructed
0 1 R10 000 000 MIG 32 EDCS 1
Establishment of
an indoor and
outdoor shooting
range
1 Indoor and
outdoor
shooting range
established
0 1 R3 Million Council EDCS 1
Establishment of a
complete Back
Office
Administration for
Traffic
Management
1 Complete
Back Office
Administration
for Traffic
Management
0 1 R10 million Council EDCS 1
Establishment of
Municipal Branch
Court
1 Municipal
Branch Court
established
0 1 R20 million Council EDCS 1 1 1
To reduce Crime
Train all 59
Municipal security
personnel as Law
Enforcement
Officers
Number of
Security
Personnel
trained as Law
Enforcement
Officers
0 216 R40 Million Council EDCS 5 216 140
Appoint 59
Security Officers
Number of
Security Officers
appointed
57 59 R800 000 Council EDCS 159 159 140
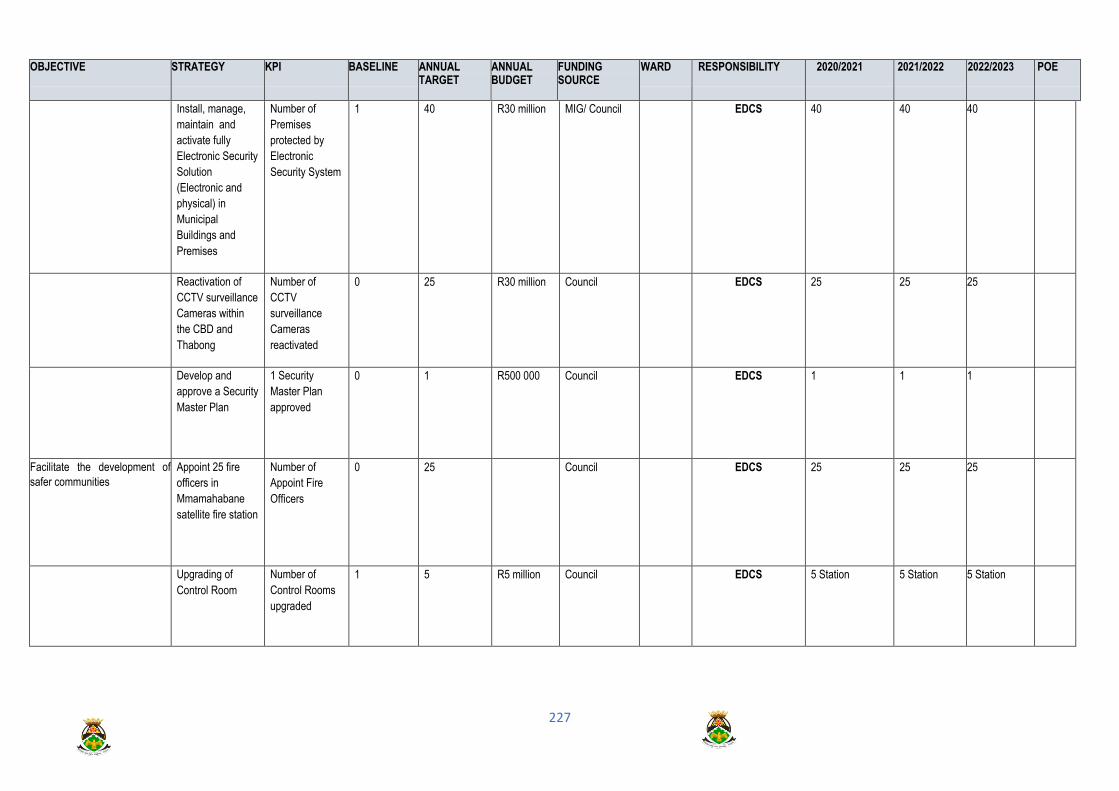
227
OBJECTIVE STRATEGY KPI BASELINE ANNUAL TARGET
ANNUAL BUDGET
FUNDING SOURCE
WARD RESPONSIBILITY 2020/2021 2021/2022 2022/2023 POE
Install, manage,
maintain and
activate fully
Electronic Security
Solution
(Electronic and
physical) in
Municipal
Buildings and
Premises
Number of
Premises
protected by
Electronic
Security System
1 40 R30 million
MIG/ Council EDCS 40 40 40
Reactivation of
CCTV surveillance
Cameras within
the CBD and
Thabong
Number of
CCTV
surveillance
Cameras
reactivated
0 25 R30 million Council EDCS 25 25 25
Develop and
approve a Security
Master Plan
1 Security
Master Plan
approved
0 1 R500 000 Council EDCS 1 1 1
Facilitate the development of
safer communities
Appoint 25 fire
officers in
Mmamahabane
satellite fire station
Number of
Appoint Fire
Officers
0 25 Council EDCS 25 25 25
Upgrading of
Control Room
Number of
Control Rooms
upgraded
1 5 R5 million Council EDCS 5 Station 5 Station 5 Station

228
OBJECTIVE STRATEGY KPI BASELINE ANNUAL TARGET
ANNUAL BUDGET
FUNDING SOURCE
WARD RESPONSIBILITY 2020/2021 2021/2022 2022/2023 POE
Procurement of
Fire Engines
Number of Fire
Engines
procured
2 4 R9 million Council EDCS 4 4 4
Procurement of
Utility Vehicles
Number of Utility
Vehicles
procured
1 7 R1 6 000 00 Council EDCS 7 7 7
Procurement of
the Hazmat Unit
Vehicle
Hazmat Unit
Vehicle
1 0 R5 million Council EDCS 1 1 1
Establishment of 5
satellite fire
stations
Number of
Satellite fire
stations
established
1 5 R14 Million MIG EDCS 4 4 4
Refurbishment of
Fire Training
College
Refurbished
Fire Training
College
0 1 R3 Million MIG EDCS 1 1 1

229
KPA3: LOCAL ECONOMIC DEVELOPMENT
KPI No OBJECTIVE STRATEGY
KPI BASELINE ANNUAL
TARGET
BUDGET FUNDING
SOURCE
WARD RESPONSIBILITY 2020/2021 2021/2022 2022/23 POE
LED 1 To review the
2013 SDF of
Matjhabeng
Analysis and
review of the 2013
approved SDF
Approved SDF SDF to be reviewed
in terms of Spatial
Planning and Land
Use Management
Act. - Approved
document
1 R2m MLM
Provincial Dept
of HS
All Dir LED, Panning
&HS
R1m R1m Invite of proposals
Appointment of
consultant
Inception
Steering Committee
First draft
Approval
LED 2 To develop
policies as
recommended
by the 2018
SDF review
Ensure appoint
provider
Approved
policies
In order to implement
the SDF policies
must be approved to
provide guidance
4 R4m Department of
Rural
Development
and Land
Reform /
COUNCIL
Matjhaben
g
Dir LED Planning
& HS
R1m R1m Invite of proposals
Appointment of
consultant
Inception
Steering Committee
First draft

230
KPI No OBJECTIVE STRATEGY
KPI BASELINE ANNUAL
TARGET
BUDGET FUNDING
SOURCE
WARD RESPONSIBILITY 2020/2021 2021/2022 2022/23 POE
Approval
LED 3 Marketing/redesign
of vacant
residential areas:
Allanridge X2
Allanridge X3
Flamingo Park X2
Naudeville X2
Riebeeckstad X1
Rheederpark X2
Virginia X10
Ventersburg X6
Odendaalsrus X13
An approved
redevelopment
strategy which
addresses each
of the listed
areas
Status Quo
information on
residential erven
revealed that
approximately 6000
undeveloped
residential erven in
Matjhabeng in the
listed areas
1 R4m
Prov Dept of
Human
Settlements
/Department
Matjhaben
g
LED & Planning R2m R2m Invite of proposals
Appointment of
consultant
Inception
Steering Committee
First draft
Approval
LED 4 To develop
10 000 housing
units in gap
market in 5
years
• Focus on
feasibility studies
on gap market
• Partner with
private sector
LA Agreement with
the Provincial Dept
of HS
Feasibility study
concluded
LA Agreements
concluded
LAA agreements for
gap market projects
Status Quo
information on
residential erven
revealed that
approximately 6000
undeveloped
residential erven in
Matjhabeng in the
listed areas
1000
4000
R0 Operational All LED& Planning Council resolution
Feasibility analysis
Bulk services and
development
agreements
Requests for Proposals

231
KPI No OBJECTIVE STRATEGY
KPI BASELINE ANNUAL
TARGET
BUDGET FUNDING
SOURCE
WARD RESPONSIBILITY 2020/2021 2021/2022 2022/23 POE
Site handover
LED 5 To promote
sustainable
spatial
development
CBD development
strategy and
economic
revitalization plan
for:
Welkom CBD
Hennenman CBD
Odendaalsrus station area
Virginia CBD
Meloding CBD
Phomolong CBD
Kutlwanong CBD
Thabong CBD
An approved
redevelopment
strategy for
each of the
listed areas
Current development
strategies are
outdated and
requires update in
order to stimulate
economic
regeneration
2 R0 COUNCIL
(Operational
budget)
Matjhaben
g
LED & Planning i R1m Terms of reference
Project steering
Committee established
Draft strategy
Council approval
LED 6 To promote
sustainable
spatial
development
To ensure the
optimal provision
and utilization of
open spaces in
Matjhabeng
Approved Open
Space Master
Plan for
Matjhabeng
A surplus of zoned
open spaces exists
in Matjhabeng that if
not required can be
utilized for Economic,
Social and HS
development.
6 units R500 000 Operational in
association
with University
of free State
Matjhaben
g
LED & Planning R200 000 R200 000 R100 000 Terms of reference
Assistance from
University
Project Steering
Committee
Analysis
Draft report
Council approval

232
KPI No OBJECTIVE STRATEGY
KPI BASELINE ANNUAL
TARGET
BUDGET FUNDING
SOURCE
WARD RESPONSIBILITY 2020/2021 2021/2022 2022/23 POE
LED 7 Township
establishment
in order to
create new
residential
areas in
Matjhabeng
and to address
the housing
backlog.
Township
establishment in
Matjhabeng to
address the
housing backlog
(2500 new erven
per annum)
Approved
township
establishment in
various areas
The current erven
backlog amounts to
12000 erven. In
order to cater for the
backlog over 4 years
approximately 2500
erven per annum is
required.
2500 R5 000 000 Dept. Human
Settlements
Matjhaben
g
LED & Planning R3m R2m R1m Motivation report
Business Plan
Funding approval
Appointment of
consultants
Layout approval
LED 8 To ensure the
planning and
development
of effective
and functional
townships in
Matjhabeng
Creation of light
industrial/Business
areas:
• Kutlwanong
• Phomolong
• Nyakallong
• Mmamahabane
• Thabong
• Meloding
50 registered
industrial erven
– in listed areas:
50 registered
business sites
The listed areas has
no industrial erven
which restricts
economic
development and job
creation
Areas occupied by
informal business
already
100 R5 000 000 Dept of Human
Settlements
22
3
36/19
3
25
LED & Planning R2m R3m Land identification
Land evaluation – flood
water
Contours
Acquisition of funding
Township establishment
LED 9 To ensure the
planning and
development
of effective
and functional
townships in
Matjhabeng
Registrations of all
townships where
the township
registers were not
opened yet
All listed areas 4 areas per annum 4 areas R2m COGTA/Depar
tment of HS
All HS R2m R2m R2m Identification of problem
areas
Terms of reference
Appointment of
consultants
Project Steering
Committee

233
KPI No OBJECTIVE STRATEGY
KPI BASELINE ANNUAL
TARGET
BUDGET FUNDING
SOURCE
WARD RESPONSIBILITY 2020/2021 2021/2022 2022/23 POE
LED 10 To ensure the
planning and
development
of effective
and functional
townships in
Matjhabeng
Rectification of
general plans in all
previously
disadvantaged
areas –
transgressions of
erf boundaries etc
6 areas 2 areas per annum R10m COGTA/Depar
tment of
Human
Settlements
All LED & P / COGTA R4M R4M R2M Identification of problem
areas
Terms of Reference
Appointment of
consultants
Project Steering
Committee
LED 11 To ensure the
planning and
development
of effective
and functional
townships in
Matjhabeng
Development of a
guideline
document for
spatial planning
layout standards
for Matjhabeng
Guideline
document
A consolidated and
uniform set of
planning guidelines
is required for
effective and uniform
township layout
planning in
Matjhabeng.
1 R0 COUNCIL
(Operational)
Matjhaben
g
LED & P R0 R0 R0 Analysis
Preparation of draft
document
Council approval
LED 12 To ensure the
planning and
development
of effective
and functional
townships in
Matjhabeng
Evaluation of a
strategy for the
provision of and
re-allocation of
surplus school
erven in
Matjhabeng
Approved
strategy for
utilization and
re-development
of surplus
school erven
A large number of
school erven are
vacant that may be
utilized for
development.
1 R0 COUNCIL
(Operational)
Matjhaben
g
LED & P R0 R0 R0 Define project objectives
Establish of Steering
Committee
Evaluate Standards
Evaluation of re-use of
vacant erven
Draft
Council approval
LED 13 Multi-purpose
stadium project
Approved
project in terms
of Council
resolution and
Land Availability
agreement
LAA was approved
and DTI funding was
secured. Council
must make
contribution towards
bulk services
1 R2 million Capital budget/
External - DTI
Ward 28 LED & P R1m R1m R0 LAA
Rezoning
Bulk services agreement

234
KPI No OBJECTIVE STRATEGY
KPI BASELINE ANNUAL
TARGET
BUDGET FUNDING
SOURCE
WARD RESPONSIBILITY 2020/2021 2021/2022 2022/23 POE
Council approval
Land transfer
LED 14 Provision of land
for the
development of
general public
amenities: ESKOM
areas, cemeteries,
new clinics, fire
stations, recreation
areas, etc. in
Matjhabeng
Approved site
allocation and
facilitation of
development
The need for the
development of new
public amenities is
constantly identified.
4 R0 Operational Matjhaben
g
LED & P R0 R0 R0 Communication
structures
Coordinated needs
determination
Processing of
applications
Council approval
LED 15 To facilitate
the effective
marketing and
development
of commercial
and industrial
land in
Matjhabeng
Identification,
marketing,
evaluation of
development
proposals and
recommendations
regarding the
development of
high potential
commercial and
industrial Municipal
owned land in
Matjhabeng
Successful
alienation and
development of
commercial and
industrial land in
Matjhabeng
Quarterly land
marketing initiative.
10 R100 000 Operational Matjhaben
g
LED & P R100000 R100000 R100000 Council approval
Marketing
Evaluation
Recommendations Bid
Evaluation Committee
Land Adjudication
Committee
Transfer of land
DEVELOPMENT CONTROL
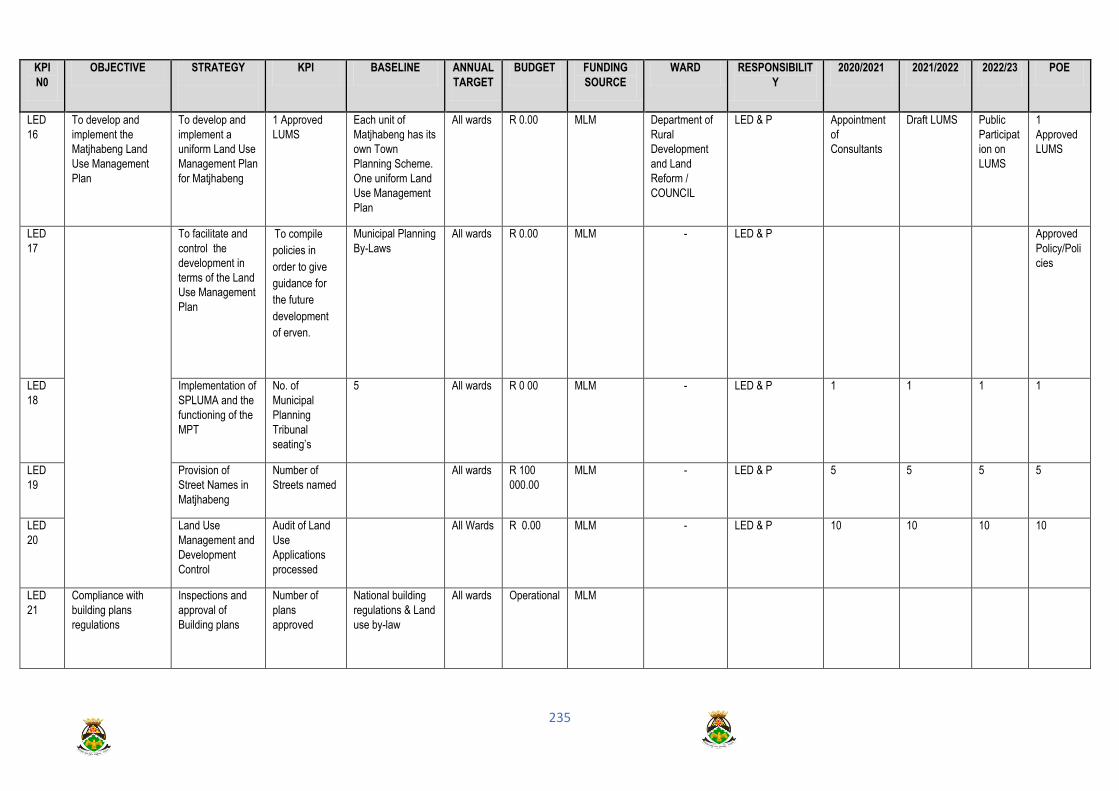
235
KPI
N0
OBJECTIVE STRATEGY
KPI BASELINE ANNUAL
TARGET
BUDGET FUNDING
SOURCE
WARD RESPONSIBILIT
Y
2020/2021 2021/2022 2022/23 POE
LED
16
To develop and
implement the
Matjhabeng Land
Use Management
Plan
To develop and
implement a
uniform Land Use
Management Plan
for Matjhabeng
1 Approved
LUMS
Each unit of
Matjhabeng has its
own Town
Planning Scheme.
One uniform Land
Use Management
Plan
All wards R 0.00 MLM Department of
Rural
Development
and Land
Reform /
COUNCIL
LED & P Appointment
of
Consultants
Draft LUMS Public
Participat
ion on
LUMS
1
Approved
LUMS
LED
17
To facilitate and
control the
development in
terms of the Land
Use Management
Plan
To compile
policies in
order to give
guidance for
the future
development
of erven.
Municipal Planning
By-Laws
All wards R 0.00 MLM - LED & P Approved
Policy/Poli
cies
LED
18
Implementation of
SPLUMA and the
functioning of the
MPT
No. of
Municipal
Planning
Tribunal
seating’s
5 All wards R 0 00 MLM - LED & P 1 1 1 1
LED
19
Provision of
Street Names in
Matjhabeng
Number of
Streets named
All wards R 100
000.00
MLM - LED & P 5 5 5 5
LED
20
Land Use
Management and
Development
Control
Audit of Land
Use
Applications
processed
All Wards R 0.00 MLM - LED & P 10 10 10 10
LED
21
Compliance with
building plans
regulations
Inspections and
approval of
Building plans
Number of
plans
approved
National building
regulations & Land
use by-law
All wards Operational MLM
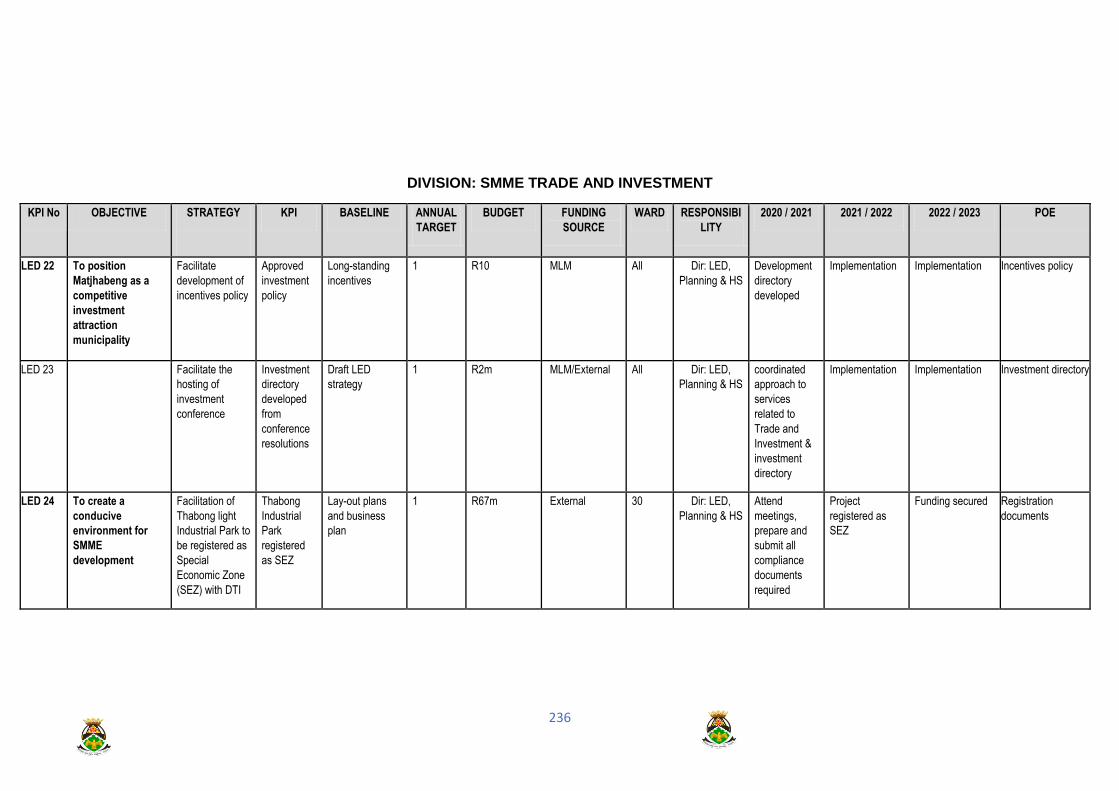
236
DIVISION: SMME TRADE AND INVESTMENT
KPI No OBJECTIVE STRATEGY
KPI BASELINE ANNUAL
TARGET
BUDGET FUNDING
SOURCE
WARD RESPONSIBI
LITY
2020 / 2021 2021 / 2022 2022 / 2023 POE
LED 22 To position
Matjhabeng as a
competitive
investment
attraction
municipality
Facilitate
development of
incentives policy
Approved
investment
policy
Long-standing
incentives
1 R10 MLM All Dir: LED,
Planning & HS
Development
directory
developed
Implementation Implementation Incentives policy
LED 23 Facilitate the
hosting of
investment
conference
Investment
directory
developed
from
conference
resolutions
Draft LED
strategy
1 R2m MLM/External All Dir: LED,
Planning & HS
coordinated
approach to
services
related to
Trade and
Investment &
investment
directory
Implementation Implementation Investment directory
LED 24 To create a
conducive
environment for
SMME
development
Facilitation of
Thabong light
Industrial Park to
be registered as
Special
Economic Zone
(SEZ) with DTI
Thabong
Industrial
Park
registered
as SEZ
Lay-out plans
and business
plan
1 R67m External 30 Dir: LED,
Planning & HS
Attend
meetings,
prepare and
submit all
compliance
documents
required
Project
registered as
SEZ
Funding secured Registration
documents

237
KPI No OBJECTIVE STRATEGY
KPI BASELINE ANNUAL
TARGET
BUDGET FUNDING
SOURCE
WARD RESPONSIBI
LITY
2020 / 2021 2021 / 2022 2022 / 2023 POE
LED 25 Facilitation of
Youth Business
Corners
Youth
business
corners
completed
in all 3
areas
Business plans 3 R9m MLM/External 5,19,20 Dir: LED,
Planning & HS
Facilitate
funding
Kutlwanong
project
completed
Nyakallong
project completed
Completion
certificates
LED 26 To capacitate and
empower SMMEs in
all sectors
Facilitation of
business skills
for SMMEs
Number of
programme
s conducted
4 programmes
introduced in
current financial
year
4 R150 000 MLM/External All Dir: LED,
Planning & HS
Facilitate 4
programmes
Facilitate 4
programmes
Facilitate 4
programmes
Reports
LED 27 Facilitate
exhibitions,
partnerships and
networking
sessions for
SMMES
Number of
partnerships
,
exhibitions/n
etworking
sessions
conducted
Report on
partnerships,
exhibitions/netw
orking sessions
conducted
2 R350 000 MLM/External All Dir: LED,
Planning & HS
Facilitate 2
sessions a
year
Facilitate 2
sessions a year
Facilitate 2
sessions a year
Reports

238
DIVISION: TOURISM
DIVISION: AGRICULTURE, WELKOM AIRPORT AND MINING
KPI
No
OBJECTIVE STRATEGY KPI BASELINE WARD ANNUAL
TARGET
ANNUAL
BUDGET
FUNDING
SOURCE
RESPONSIBILITY 2020/2021 2021/2022 2022/23 POE
LED
32
To create the
suitable
environment
for sustainable
agricultural
production
To facilitate and support
establishment of Farmer
Production Support Unit
(FPSU) in farm Kalkkuil
153, situated near
Odendaalsrus.
By Facilitation and
monitoring the
establishment of the
Farmer Production
Support Unit (FPSU)
in Odendaalsrus
Available land
Construction
of 1st phase of
the project
has started
Ward
36
1 R12m Dep. Of
Rural
Development
and Land
Reform
LED & P 0 0 0 Completion
certificate/letter
for the 1st phase
of the project
LED
33
Assist and ensure a
maintained/improved
infrastructure Municipal
farms.
Maintained/improved
infrastructure
Municipal farms.
Water reticulation,
fencing, solar energy
and construction and
renovation of
buildings
Municipal
farms
Wards .3 R1m Council LED & P 0 0 1 Report and
Documentation

239
KPI No OBJECTIVE STRATEGY
KPI BASELINE ANNUAL
TARGET
BUDGET FUNDING
SOURCE
WARD RESPONSIBILITY 2020 / 2021 2021 / 2022 2022 / 2023 POE
LED 28 To develop the pre-
feasibility studies
for five priority
projects as per LED
Strategy
Development of
the pre-
feasibility
studies for five
priority projects
as per LED
Strategy
Approved
pre-
feasibility
studies for
five priority
projects as
per LED
Strategy
Draft LED
Strategy
One approved
document
R2 500 000 MLM
External (
Harmony)
All Dir :LED
MM
Draft pre-
feasibility
studies for five
priority
projects as
per LED
Strategy
LED 29 To position
Matjhabeng as a
destination of
choice
Promote
Tourism
awareness and
education
Number of
tourism
awareness
and
education
programme
s that have
materialised
Matjhabeng
Tourism Sector
Strategy
4 Tourism
awareness and
education
programmes
R810 000 MLM All DIR :LED Tourism
awareness
and education
programmes
implemented
Reports on
Tourism
awareness and
education
LED 30 To ensure that
tourism
marketing plan
is developed
A developed
Tourism
marketing
Plan
Matjhabeng
Tourism Sector
Strategy
-Matjhabeng
Tourism Sector
Strategy
-Sand River
Route
Development
Plan
R500 000 MLM
External (
Harmony)
All DIR:LED Draft Strategy
presented to
council
Council
Resolution
LED 31 Implementation
of the Sand
River Route
An
approved
Sand River
Route
Infrastructur
e Business
Plan
Sand River
Route
Development
Plan
One approved
Document
R800 000 MLM All Dir :LED
MM
Draft
Infrastructure
Business Plan
presented to
Council
Council
Resolution

240
KPI
No
OBJECTIVE STRATEGY KPI BASELINE WARD ANNUAL
TARGET
ANNUAL
BUDGET
FUNDING
SOURCE
RESPONSIBILITY 2020/2021 2021/2022 2022/23 POE
LED
34
Organize and conduct
workshops and capacity
building for the
commonage committees
in Matjhabeng Local
Municipality
The number of
workshops and
capacity building to
be conducted for the
commonage
committees in all six
towns of Matjhabeng
Local Municipality
4 All
wards
6 workshops
conducted in
six towns
R100 000,
00
COUNCIL LED & P 0 1 1 Reports
LED
35
Stimulate and
promote small
scale mining
within
Matjhabeng
Local
Municipality.
By supporting and
facilitating the
development of
identified Small Scale
Miners
Number of small-
scale miners
assisted
Support
letters
Energy,
/Petroleum
Wholesale
License
Environmental
Authorization
Permit
All
wards
4 Small
Scale
Miners
R0.00 - LED & P 0 2 1 Letters of support
and Council
resolution
LED
36
To facilitate the
planning and
the
implementation
of the Mining
Social and
Labour Plans
(SLP’s) in
Matjhabeng
Identify economic
development projects to
be funded through SLP
in collaboration with
mining houses around
Matjhabeng in
consultation with the
community.
Number of projects
funded through
Mining Social Plan
All
wards
3 economic
development
projects to
be funded
through SLP
in
collaboration
with mining
houses
R0.00 External LED & P 0 1 1 Reports and
Minutes of Mining
houses
Mines

241
KPI
No
OBJECTIVE STRATEGY KPI BASELINE WARD ANNUAL
TARGET
ANNUAL
BUDGET
FUNDING
SOURCE
RESPONSIBILITY 2020/2021 2021/2022 2022/23 POE
LED
37
Local
Municipality
Implementation of TETRA 4 Projects as identified through Mou 1. The Meloding Community Hall –
2.The development of sport facilities at Tikwe Primary School
3. Infrastructure development at Adamson’s Vley Community School
4. The development of sport facilities/fields at the Reatlehile Secondary School
Number of projects implemented Implementation as per MoU between TETRA 4 and Matjhabeng LM.
Project identification complete Signed MoU between TETRA 4 and Matjhabeng LM.
4,5,6
and 7
4 R/0 TETRA4 LED & P 0 1 1 Completion
certificate/hand
over report
LED
38
To support the
establishment of
Livestock market centre
(Auction Centre) and
incorporation of livestock
pound in farm Kalkkuil
153, situated near
Odendaalsrus.
No of Livestock
market centre
(Auction Centre) and
livestock pound to
be established
Land
available
Drawings and
draft tender
documents
available
Ward
36
1 R200 000.00
R15m
Council
External
funding
LED & P Reports
LED
39 Optimize
effective
utilization of
municipal
facilities under
LED
Upgrading of Welkom
Airport
Feasibility study and
business plan to be
developed by
Transactional
Advisors as source d
and funded by the
Lejwe Le Putswa
Development
Agency (LDA)
Technical
Report
1 N/A Council
External
funding
LED & P 0 1 0 Finalized
Feasibility study
and business
plan documents.

242
KPI
No
OBJECTIVE STRATEGY KPI BASELINE WARD ANNUAL
TARGET
ANNUAL
BUDGET
FUNDING
SOURCE
RESPONSIBILITY 2020/2021 2021/2022 2022/23 POE
LED
40
Maintenance and
improvement of Welkom
Airport infrastructure
Maintained/improved
infrastructure,
fencing, at Welkom
Airport
Dilapidated
buildings,
fencing in a
bad status
Runways, as
well as
taxiways.
1 R2m Council
LED & P Completion report
LED
41
Ensure that
Welkom Airport complies
with South African Civil
Aviation Authority
(SACAA) Rules and
Regulations.
Renewal of
Aerodrome license
for Welkom Airport
by making sure that
it operates with the
license that is
approved by the
SACAA
Expired
Aerodrome
license
1 R50 000.00 Council LED & P 1 0 0 Valid Aerodrome
license
HUMAN SETTLEMENTS
KPI N0 OBJECTIVE STRATEGY
KPI BASELINE ANNUAL
TARGET
BUDGET FUNDING
SOURCE
WARD RESPONSIBILITY 2020 / 2021 2021 / 2022 2022 /
2023
POE
HS 1 Promote
Security of
Tenure
Monitor Hennenman
Land Restitution
Project
Number of
Houses built
27 houses already
built
50 R 3 938 680.00 FSPHS 3 DIR LED Planning &
HS
R 3 938
680.00
To be
confirmed(T.B
.C)
T.B.C

243
KPI N0 OBJECTIVE STRATEGY
KPI BASELINE ANNUAL
TARGET
BUDGET FUNDING
SOURCE
WARD RESPONSIBILITY 2020 / 2021 2021 / 2022 2022 /
2023
POE
HS 2 Promote
Security of
Tenure
Development of G
Hostel
Community
Residential Units
(CRU)
Number of
units
The Consultant &
Contractor
appointed.
PROJECT is at
30% to completion
350 R 55 594 124.00 FSPHS 31 DIR LED Planning &
HS
R 55 594
124.00
T.B.C T.B.C
HS 4 Promote
Security of
Tenure
Facilitate Planning
and Surveying of
sites
Appointment
of Consultant
N/A 1000 R 1 000 000.00 MLM All wards DIR LED Planning &
HS
R
1 000 000.00
T.B.C T.B.C
HS 5 Promote
Security of
Tenure
Installation of Bulk
Service Freedom
Square
Appointment
of
Consultants
N/A 390 R 11 400 000.00 FSPHS 13 DIR LED Planning &
HS
R
11 400 000.00
T.B.C T.B.C
HS 6 Promote
Security of
Tenure
Installation of Bulk
Service Nyakallong
Appointment
of consultants
N/A 50 R 2 100 000.00 FSPHS 19 & 36 DIR LED Planning &
HS
R 2 100
000.00
T.B.C T.B.C
HS 7 Promote
Security of
Tenure
Installation of Bulk
Service
Mmamahabane
Appointment
of
Consultants
N/A 500 R 10 400 000.00 FSPHS 1 DIR LED Planning &
HS
R 10 400
000.00
T.B.C T.B.C
HS 8 Promote
Security of
Tenure
Installation of
service Phokeng
Appointment
of
Consultants
N/A 300 R 11 400 000.00 FSPHS 25 DIR LED Planning &
HS
R 11 400
000.00
T.B.C T.B.C

244
KPI N0 OBJECTIVE STRATEGY
KPI BASELINE ANNUAL
TARGET
BUDGET FUNDING
SOURCE
WARD RESPONSIBILITY 2020 / 2021 2021 / 2022 2022 /
2023
POE
HS 9 Promote
Security of
Tenure
Installation of
Service Hennenman
N/A 300 R 11 400.000.00 FSPHS 3 DIR LED Planning &
HS
R 11
400.000.00
T.B.C T.B.C
HS 10 Promote
Security of
Tenure
Installation of
Service Kutlwanong
K10
Appointment
of
Consultants
N/A 400 R 47 911 000.00 FSPHS 22 DIR LED Planning &
HS
R 47 911
000.00
T.B.C T.B.C
HS 11 Promote
Security of
Tenure
Virginia Ext 5
(Saaiplaas) Top
Structure
Appointment
of contractors
N/A 50 R 6 609 000.00 FSPHS 9 DIR LED Planning &
HS
R 6 609
000.00
T.B.C T.B.C Contractor appointed
HS 12 Promote
Security of
Tenure
Installation of Bulk
Service: Ext 27
Thabong
Appointment
of
Consultants
N/A NONE R 3 150 000.00 FSPHS DIR LED Planning &
HS
R 3 150
000.00
T.B.C T.B.C Contractors
appointed
HS 13 Promote
Security of
Tenure
Military veteran Lois
Construction
Number of
Houses Built
20 houses
completed
42 R 6 779 400.00 FSPHS 35, 27,
10
DIR LED Planning &
HS
R 6 779
400.00
T.B.C T.B.C
HS 14 Promote
Security of
Tenure
Welkom Hanipark
(Thabong Ext 18)
Appointment
of consultants
0 0 R 45 050 000.00 FSPHS 23 DIR LED Planning &
HS
R 45 050
000.00
T.B.C T.B.C

245
KPI N0 OBJECTIVE STRATEGY
KPI BASELINE ANNUAL
TARGET
BUDGET FUNDING
SOURCE
WARD RESPONSIBILITY 2020 / 2021 2021 / 2022 2022 /
2023
POE
HS 15 Promote
Security of
Tenure
Rheederspark
Top structure
Appointment
of contractor
N/A 50 R 6 609 000.00 FSPHS 35 DIR LED Planning &
HS
R 6 609
000.00
T.B.C T.B.C Contractor appointed
HS 16 Promote
Security of
Tenure
Installation of bulk
Service:
Dichokoleteng
Appointment
of
Consultants
N/A 0 R 2 750 000.00 FSPHS 16 DIR LED Planning &
HS
R 2 750
000.00
T.B.C T.B.C
HS 17 Promote
Security of
Tenure
Marobe Land
Restitution
Number
house built
N/A 390 R 6 000 00.00 FSPHS 35 DIR LED Planning &
HS
R 6 000 00.00 T.B.C T.B.C
HS 18 Promote
Security of
Tenure
Matjhabeng
Restructuring Zone
Appointment
Consultants
N/A 0 R 9 000 000.00 FSPHS All ward DIR LED Planning &
HS
R 9 000
000.00
T.B.C T.B.C
HS 19 Promote
Security of
Tenure
Facilitating of
drafting of Housing
Sector Plan
Appointment
of
Consultants
N/A 0 NONE FSPHS All ward DIR LED Planning &
HS
NONE T.B.C T.B.C
HS 20 Promote
Security of
Tenure
Monitor the
implementation of
demolishing of three
roomed houses in
Phomolong (30)
Number of
House
demolished
N/A 30 NONE FSPHS 3 DIR LED Planning &
HS
NONE T. B .C T. B.C
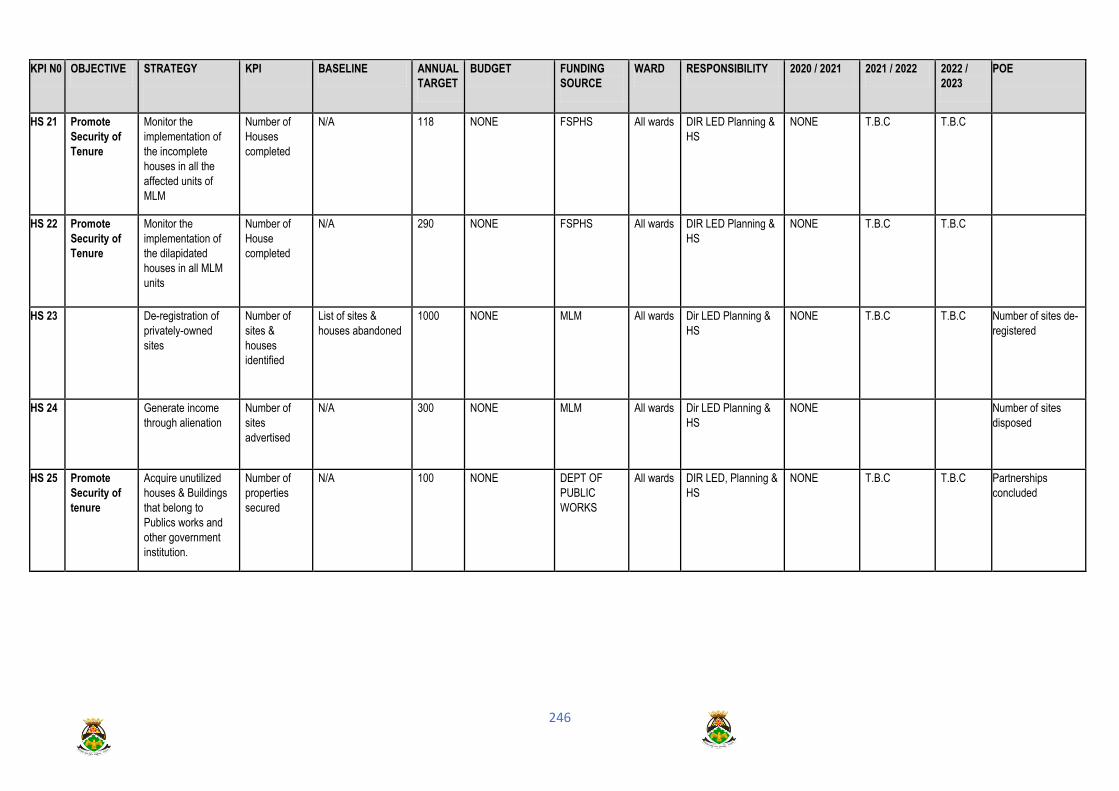
246
KPI N0 OBJECTIVE STRATEGY
KPI BASELINE ANNUAL
TARGET
BUDGET FUNDING
SOURCE
WARD RESPONSIBILITY 2020 / 2021 2021 / 2022 2022 /
2023
POE
HS 21 Promote
Security of
Tenure
Monitor the
implementation of
the incomplete
houses in all the
affected units of
MLM
Number of
Houses
completed
N/A 118 NONE FSPHS All wards DIR LED Planning &
HS
NONE T.B.C T.B.C
HS 22 Promote
Security of
Tenure
Monitor the
implementation of
the dilapidated
houses in all MLM
units
Number of
House
completed
N/A 290 NONE FSPHS All wards DIR LED Planning &
HS
NONE T.B.C T.B.C
HS 23 De-registration of
privately-owned
sites
Number of
sites &
houses
identified
List of sites &
houses abandoned
1000 NONE MLM All wards Dir LED Planning &
HS
NONE T.B.C T.B.C Number of sites de-
registered
HS 24 Generate income
through alienation
Number of
sites
advertised
N/A 300 NONE MLM All wards Dir LED Planning &
HS
NONE Number of sites
disposed
HS 25 Promote
Security of
tenure
Acquire unutilized
houses & Buildings
that belong to
Publics works and
other government
institution.
Number of
properties
secured
N/A 100 NONE DEPT OF
PUBLIC
WORKS
All wards DIR LED, Planning &
HS
NONE T.B.C T.B.C Partnerships
concluded

247
KPA4: MUNICIPAL FINANCIAL VIABILITY AND MANAGEMENT
KPI NO OBJECTIVE STRATEGY KPI BASELINE WARD ANNUAL
TARGET
ANNUAL
BUDGET
FUNDING
SOURCE RESPONSIBILITY 2020/2021 2021/2022 2022/2023 POE
PROGRAMME: FINANCIAL ACCOUNTING AND MANAGEMENT
MF 1 To practice
sound and
sustainable
financial
Submit draft AFS
for audit purposes
Draft
annual
financial
statements
are
submitted
to auditor
general for
audit
Annually All
wards
31 August
2020
R 2 000
000
COUNCIL,
NT Grants
(FMG &
MSIG)
FINANCE 31 August
2020
31 August 2021 31 August
2022
AFS

248
KPI NO OBJECTIVE STRATEGY KPI BASELINE WARD ANNUAL
TARGET
ANNUAL
BUDGET
FUNDING
SOURCE RESPONSIBILITY 2020/2021 2021/2022 2022/2023 POE
MF 2 management
personnel
Implement
action plans,
financial
accounting and
internal controls
as per
professional
standards,
financial
management to
form part of
strategic
communication
Date by action
plans and
related
policies are to
be
communicate
d with
stakeholders
Annually All
wards
31 August
2020
R0 - FINANCE 31 August
2020
31 August 2021 31 August
2022
Action plan
MF 3 Implement
100% of
allocated capital
projects to
identified
projects in the
2019/2020
financial year
The % of a
municipality’s
capital budget
actually spent
on capital
projects
identified for
2018/2019 in
terms of the
approved IDP
Annually All
wards
30 June 2021 R118 247
000.00
MIG/External FINANCE 30 June
2021
30 June
2022
30 June
2023
MIG reports

249
KPI NO OBJECTIVE STRATEGY KPI BASELINE WARD ANNUAL
TARGET
ANNUAL
BUDGET
FUNDING
SOURCE RESPONSIBILITY 2020/2021 2021/2022 2022/2023 POE
MF4 To plan,
prepare and
approve a
credible
municipal
budget
timeously
Adhere strictly
to IDP/ budget
time table,
MBR, MFMA,
NT Circulars,
review of
budget related
policies.
Approval of
Budget time
table and
Budget by
Council
All
wards
31 August
2020
31 May 2021
R0.00 - FINANCE 31 August
2020
31 May
2021
31 August 2021
31 May
2022
31 August
2022
31 May
2023
Council
resolution
MF5 Contribute
budget
information from
the Directorate
towards a
credible budget
before end May
2019
MFMA
Section
52, 71 and
72 reports.
Annually All
wards
31 May 2021 R0.00 - SSS 31 May
2021
31 May
2022
31 May
2023
Approved
budget
2020/2021
MF 6 Implement
budget allocated
to the
Directorate in an
efficient manner
by the end of
June 2019
MFMA
Section
52, 71 and
72 reports.
Annually All
wards
30 June 2021 R0.00 - SSS 30 June
2021
30 June
2022
30 June
2023
Quarterly non-
financial
reports

250
KPI NO OBJECTIVE STRATEGY KPI BASELINE WARD ANNUAL
TARGET
ANNUAL
BUDGET
FUNDING
SOURCE RESPONSIBILITY 2020/2021 2021/2022 2022/2023 POE
MF7
To practice
sound and
sustainable
Calculate
financial ratios on
a monthly basis,
comparing of
baseline and
report deviations
with
recommendations
MFMA
Section
52, 71 and
72 reports.
Monthly All
wards
12 monthly
reports
R0.00 - FINANCE 12 monthly
reports
12 monthly
reports
12 monthly
reports
MFMA
reports
MF8 Develop and
adhere to budget
time lines
Approved budget
time lines
Annually All
wards
August 2020 R0.00 - FINANCE August
2020
August
2021
August
2022
Council
resolution,
budget
timetable
MF 9 Develop and
submit draft
budget to
council for
noting and
approval
Approved budget Annually All
wards
March 2021
and May
2021
R0.00 - FINANCE March 2021
and May 2021
March 2022 and
May 2022
March
2023 and
May 2023
Council
resolution
MF 10 Review all budget
related policies
Approved budget
related policies
Annually All
wards
May 2021 R0.00 - FINANCE May 2021 May 2022 May 2023 Council
resolution
MF 11 Submit draft
annual financial
statements to
AG by 31
August 2017
Draft annual
financial
statements
Annually All
wards
Annual
Financial
Statement
31 August
2020
R0.00 - FINANCE Annual
Financial
Statement
31 August
2020
Annual Financial
Statement
31 August 2021
Annual
Financial
Statement
31 August
2022
Draft AFS
Council
resolution

251
KPI NO OBJECTIVE STRATEGY KPI BASELINE WARD ANNUAL
TARGET
ANNUAL
BUDGET
FUNDING
SOURCE RESPONSIBILITY 2020/2021 2021/2022 2022/2023 POE
MF 12 financial
management
Develop audit
query action plan
Reduced % of
AG audit queries
Annually All
wards
February 2021 R0.00 - FINANCE February
2021
February
2022
February
2023
Audit Action
Plan
MF 13
Review and
Implementation of
Financial
Recovery Plan
Increase in
Revenue
Annually All
wards
31 May 2021 R0.00 - FINANCE 31 May
2021
31 May
2022
31 May
2023
FRP
PROGRAMME: SUPPLY CHAIN MANAGEMENT
MF 14 Ensure timely
procurement of
supplies
Departmental
needs analysis
and
departmental
procurement
plan
Number of
days for
orders to be
processed.
Annually All
wards
14 days
turnaround
time for
orders and 3
months
turnaround
time for
tenders
R0.00 - FINANCE 14 days
turnaround
time for
orders and 3
months
turnaround
time for
tenders
14 days
turnaround
time for
orders and 3
months
turnaround
time for
tenders
14 days
turnaroun
d time for
orders
and 3
months
turnaroun
d time for
tenders
PROGRAMME: EXPENDITURE MANAGEMENT
MF 15 To ensure safe
keeping of
documents.
Store and keep
safe all
supporting
documentation
including
monthly voucher
audits
Monthly
document
audit stored
and safely
kept
12 All
wards
12 monthly
reports
R0.00 - FINANCE 12 monthly
reports
12 monthly
reports
12 monthly
reports
12 monthly
reports

252
KPI NO OBJECTIVE STRATEGY KPI BASELINE WARD ANNUAL
TARGET
ANNUAL
BUDGET
FUNDING
SOURCE RESPONSIBILITY 2020/2021 2021/2022 2022/2023 POE
MF 16 Effective and
efficient
expenditure
control
Prepare a Draft
Account Payable
Policy to be
approved by
council
Date by
which a Draft
Account
Payable
Policy will be
approved
1 All
wards
31 May 2021 R0.00 - FINANCE 31 May
2021
31 May
2022
31 May
2023
Approved
Account
Payable
Policy
MF 17 Effective and
efficient
expenditure
control
Encourage
suppliers to
submit relevant
documentation
on time
Number of
reconciliation
and age analysis
reports timeously
submitted
12 All
wards
12 monthly
reports
R0.00 - FINANCE 12 monthly
reports
12 monthly
reports
12 monthly
reports
12 monthly
reports
MF 18 GRAP
Municipal Asset
Register
Prepare a
complete
and
accurate
asset
register
Number of
reconciliation
reports timeously
submitted
12 All
wards
12 Monthly
Reports
R0.00 - FINANCE 12 Monthly
Reports
On
additions
and
12 Monthly
Reports
On
additions
and
12 Monthly
Reports
On
additions
and
Asset
Register
On additions
and
redundant
assets
redundant
assets
redundant assets redundant
assets

253
KPI NO OBJECTIVE STRATEGY KPI BASELINE WARD ANNUAL
TARGET
ANNUAL
BUDGET
FUNDING
SOURCE RESPONSIBILITY 2020/2021 2021/2022 2022/2023 POE
MF 19 Conduct two
asset counts
per year
Number of asset
counts per year
1 All
wards
1 reports on
asset counts
R0.00 COUNCIL FINANCE 1 report on
asset
counts
1 report on asset
counts
1 report on
asset
counts
Asset Count
Report
MF 20 Conduct quarterly
depreciation
calculations
Quarterly
Depreciation
Calculations
1 All
wards
4 quarterly
reports on the
accuracy of
depreciation
R0.00 COUNCIL FINANCE 4 reports on the
accuracy of
depreciation
4 reports on the
accuracy of
depreciation
4 reports
on the
accuracy of
depreciatio
n
4 Quarterly
Reports
PROGRAMME: REVENUE MANAGEMENT
MF 21 To increase our
revenue
earning
capacity and
collection
Implementation of
internal controls
and key control
matrix
Internal controls
and key control
matrix
12
monthly reports
All
ward
s
12 monthly
reports
R0.00 COUNCIL FINANCE 12
monthly report
12
monthly
reports
12
monthly
reports
12
monthly
Reports

254
KPA5: GOOD GOVERNANCE AND PUBLIC PARTICIPATION
KPI NO OBJECTIVE STRATEGY KPI BASELINE ANNUAL
TARGET BUDGET
FUNDING
SOURCE
WARD
RESPONSIBILITY
2020/2021 2021/2022 2022/2023 POE
GGPP 1 To promote
social
cohesion and
nation
building
through
SPORT, ART
Youth:
Prepare and
host MLM
Games for
annual OR
Tambo
Games
between
October and
November in
Welkom
1 Annual OR
Tambo Games
held
1 1 Annual
OR
Tambo
Games
held
R200 000 COUNCIL All
wards Office of the
Executive Mayor
1 Annual OR
Tambo
Games held
1 Annual OR
Tambo
Games held
1 Annual OR
Tambo Games
held
Fixture line-
up/Programme
GGPP2 Elderly:
Organize
recreational
games for
senior citizens
between
January and
March within
Matjhabeng
Local
Municipality
1
Recreationa
l games for
senior
citizens
held
1 1 A fun
walk/run for
senior
citizens held
and 500
attendees
expected.
R200 000 COUNCIL All
wards Office of the
Executive Mayor
1 A fun
walk/run for
senior
citizens
held and
500
attendees
expected.
1 A fun
walk/run
for senior
citizens
held and
500
attendees
expected.
1 A fun walk/run
for senior
citizens held and
500 attendees
expected.
Registration of
attendees

255
KPI NO OBJECTIVE STRATEGY KPI BASELINE ANNUAL
TARGET BUDGET
FUNDING
SOURCE
WARD
RESPONSIBILITY
2020/2021 2021/2022 2022/2023 POE
GGPP 3 AND
CULTURE
People with
Disabilities:
Organize 1
recreational
games for
people with
disabilities
between
October and
Dec
Recreational
games for
people with
disabilities
held
1 1 recreational
games for
people with
disabilities held
between
October and
December
R200 000 COUNCIL All
wards Office of the
Executive Mayor
1
recreationa
l games for
people
with
disabilities
held
between
October
and Dec
2020
1
recreational
games for
people with
disabilities
held
between
October and
Dec 2021
1 recreational
games for
people with
disabilities held
between October
and Dec 2022
Fixture line-
up/Programme
GGPP4 Host 1 MLM
Arts &
Culture
Festival in
the third
quarter of
the financial
year
MLM Arts &
Culture
Festival hosted
1 1 Arts and
Cultural
festival to be
held in the
third quarter.
R500 000 COUNCIL All
wards Office of the
Executive Mayor
1 Arts
and
Cultural
festival to
be held in
the third
quarter.
1 Arts
and
Cultural
festival
to be
held in
the third
quarter.
1 Arts and
Cultural festival
to be held in
the third
quarter.
MLM Arts & Culture
Festival programme
GGPP 5 Annually
convene a
candle light
switching
on in
December
Switched on
Candle Light
event
Annual event 1 candle light
switching on
event in
December
R800 000 COUNCIL All
wards Office of the
Executive Mayor
1 candle
light
switching
on event
in
December
2021
1 candle
light
switching
on event
in
Decembe
r 2021
1 candle light
switching on
event in
December
2022
Candle light festivity
programme
GGPP 6 Annually host
Centenary
Choir
Competition to
honor fallen
Host choral
Competition
event
1 Choral
competition
R800.000 COUNCIL All
wards
Office of the
Executive Mayor
Choral
competition
Choral
competition
Choral
competition
Choir Advert
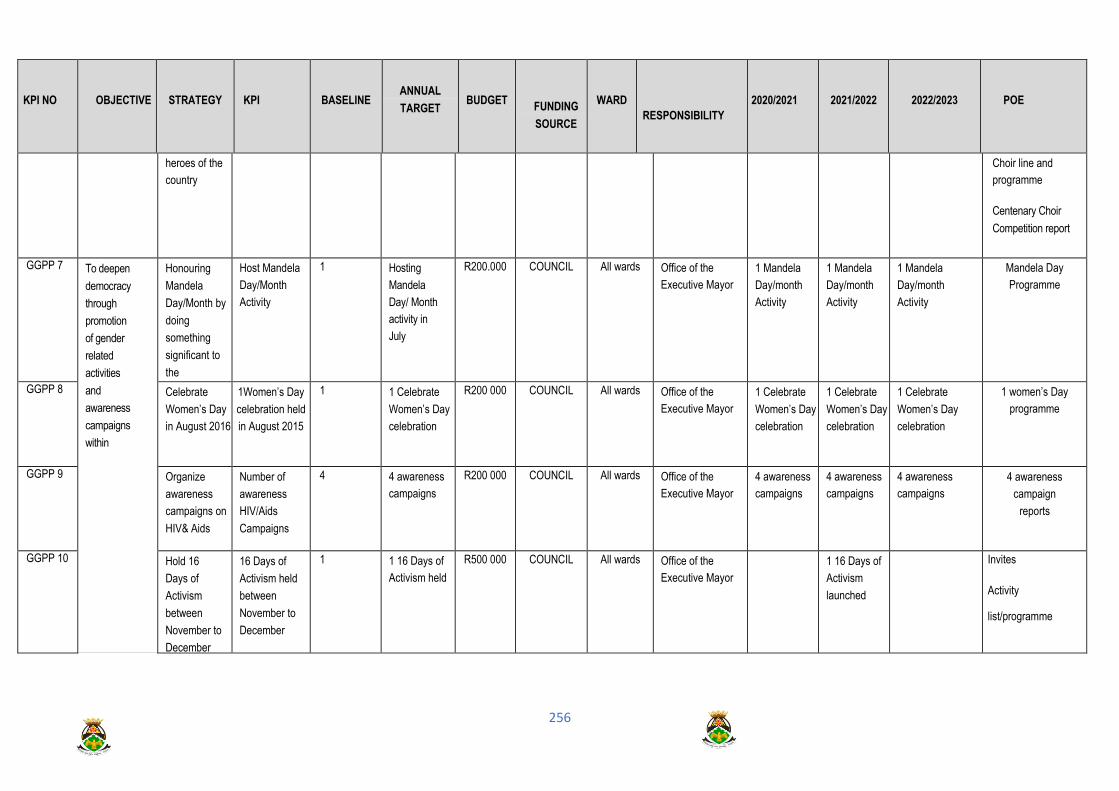
256
KPI NO OBJECTIVE STRATEGY KPI BASELINE ANNUAL
TARGET BUDGET
FUNDING
SOURCE
WARD
RESPONSIBILITY
2020/2021 2021/2022 2022/2023 POE
heroes of the
country
Choir line and
programme
Centenary Choir
Competition report
GGPP 7 To deepen
democracy
through
promotion
of gender
related
activities
and
awareness
campaigns
within
Honouring
Mandela
Day/Month by
doing
something
significant to
the
disadvantaged
communities in
July
Host Mandela
Day/Month
Activity
1 Hosting
Mandela
Day/ Month
activity in
July
R200.000 COUNCIL All wards Office of the
Executive Mayor
1 Mandela
Day/month
Activity
1 Mandela
Day/month
Activity
1 Mandela
Day/month
Activity
Mandela Day
Programme
GGPP 8 Celebrate
Women’s Day
in August 2016
1Women’s Day
celebration held
in August 2015
1 1 Celebrate
Women’s Day
celebration
R200 000 COUNCIL All wards Office of the
Executive Mayor
1 Celebrate
Women’s Day
celebration
1 Celebrate
Women’s Day
celebration
1 Celebrate
Women’s Day
celebration
1 women’s Day
programme
GGPP 9 Organize
awareness
campaigns on
HIV& Aids
Number of
awareness
HIV/Aids
Campaigns
4 4 awareness
campaigns
R200 000 COUNCIL All wards Office of the
Executive Mayor
4 awareness
campaigns
4 awareness
campaigns
4 awareness
campaigns
4 awareness
campaign
reports
GGPP 10 Hold 16
Days of
Activism
between
November to
December
16 Days of
Activism held
between
November to
December
1 1 16 Days of
Activism held
R500 000 COUNCIL All wards Office of the
Executive Mayor
1 16 Days of
Activism
launched
Invites
Activity
list/programme

257
KPI NO OBJECTIVE STRATEGY KPI BASELINE ANNUAL
TARGET BUDGET
FUNDING
SOURCE
WARD
RESPONSIBILITY
2020/2021 2021/2022 2022/2023 POE
GGPP 11 government
.
Hold 4 Mayoral
Imbizo’s in the
6 units of
Matjhabeng by
June (End of
Financial Year)
4 Mayoral
Imbizo’s held in
the 6 units of
Matjhabeng by
June
6 4 Mayoral
Imbizo held
R600 000 COUNCIL All wards Office of the
Executive Mayor
1
Mayoral
Imbizo
held
1 Mayoral
Imbizo held
1 Mayoral Imbizo
held
4 Mayoral
imbizo invites
made.
4 Mayoral imbizo
reports reports
GGPP 12 Convene
and hold an
annual
career expo
and
guidance
between
January and
February.
Annual
career expo
convened
and guidance
between
January and
February.
1 1 Annual
career expo
R200,000 COUNCIL All wards Office of the
Executive Mayor
1 Annual
career expo
1 Annual
career expo
1 Annual career
expo
1 Annual career
expo report
GGPP 13 To improve
the optimal
functionality
of the Ward
Committees
Produce
credible ward
committee
plans that
are aligned
to the IDP by
September
2020
Number of ward
plans produced
by September
2020
36
0
36 Ward plans R600 000 COUNCIL All wards Office of the
Speaker
36 Ward plans 36 Ward
plans
36 Ward plans 36 ward
committee plans

258
KPI NO OBJECTIVE STRATEGY KPI BASELINE ANNUAL
TARGET
BUDGET FUNDING
SOURCE
WARD RESPONSIBILITY 2020/2021 2021/2022 2022/2023 POE
GGPP 14 Produce 12
monthly reports
about
activities/progra
mmes within
each of the 36
wards
Number of
monthly
reports
from ward
committee
s produced
for the
whole
financial
year/12
months
4
3
2
432
Reports (36
Wards x 12
reports)
R0.00 - All wards Office of the Speaker 108 Reports
(36 Wards x 3
reports)
108 Reports
(36 Wards x 3
reports)
108 Reports
(36 Wards x 3
reports)
432 monthly
ward reports
GGPP 15 Manage
performance of
all 36 wards in
the municipality
Number
of
perform
ance
manage
ment
reports
submitt
ed to
office of
the
Speake
r on a
quarterl
y
1
4
4
144
Performance
Reports (36
Wards x 4
Reports)
R200 000 COUNCIL All wards Office of the Speaker 36
Performance
Reports (36
Wards
reports)
36
Performance
Reports (36
Wards reports)
36 Performance
Reports (36
Wards reports)
144 quarterly
performance reports
for 36 wards per
year
GGPP 16 Develop and
implement a
skills profiles of
all ward
committee
members to
determine
relevant
capacity
building
programme
Number of
skills audit
and training
programme
s conducted
1 1 Skills Audit
undertaken
3 Training
programmes
R200 000 COUNCIL All wards Office of the Speaker 1 Skills Audit
undertaken
3 Training
programmes
1 Skills
Audit
undertaken
3 Training
programmes
1 Skills Audit
undertaken
3 Training
programmes
1 ward
committee skills
audit report
2 attendance
registers for
training
2 training reports

259
KPI NO OBJECTIVE STRATEGY KPI BASELINE ANNUAL
TARGET
BUDGET FUNDING
SOURCE
WARD RESPONSIBILITY 2020/2021 2021/2022 2022/2023 POE
GGPP 17 To
improv
e
public
particip
ation
thereby
elimina
ting
public
protest
s
Communicate
relevant Council
resolutions to
Ward
Committees
quarterly (in
consultation with
the Offices of
the Executive
Mayor, Council
Whipery and
Municipal
Manager)
Number of
reports
communic
ated to
ward
committee
s per
quarter
4 4 Reports R0.00 - All wards Office of the Speaker 4 Reports 4 Reports 4 Reports 4 ward meeting
report reports
GGPP 18 Hold
Community
meetings at least
once a quarter
with the Ward
Councillor
supported by the
Ward
Committee to
address
community
programmes/d
evelopmental
matters.
Number of
community
meetings
held by a
ward
councillor
to address
community
programme
s/developm
ental
matters.
1
4
4
144 Community
Meetings
R0.00 - All wards Office of the Speaker 144
Community
Meetings
144
Community
Meetings
144 Community
Meetings
144 invites
issued for ward
meetings
144 attendance
registers of ward
meetings

260
KPI NO OBJECTIVE STRATEGY KPI BASELINE ANNUAL
TARGET
BUDGET FUNDING
SOURCE
WARD RESPONSIBILITY 2020/2021 2021/2022 2022/2023 POE
GGPP 19 To
ensure
Council
functio
ns
optimal
ly,
effectiv
ely and
efficien
tly
Convene
council
meetings at
least four times
as per the
approved
schedule four
times per year
Number of
approved
Council
meetings
convened
4 A minimum of 4
sittings per year
(excluding
special Council
sittings)
R0.00 - All wards Office of the Speaker 4 council
meetings
4 council
meetings
4 council
meetings
4 Adverts for
ordinary council
meeting
4 attendance
registers
GGPP13 To
strengthen
communicat
ion with
internal and
external
stakeholder
s
Review of
communication
Policy for
approval by
September of
each financial
year.
Council
approved
Communic
ation
policy
1 approved
in 2013
1 approved
Communicatio
n Policy
R0.00 - All wards ED SSS 1 approved
Communicati
on Policy
- - Approved
Communication policy
Invite media
houses on a
quarterly basis
to communicate
municipal
activities
Number of
interactions
with media
houses
3 media
briefings
were done for
2016/2017
4 media
briefings
conducted per
year
R0.00 - All wards EDSSS 4 media
briefings
conducted per
year
4 media
briefings
conducted
per year
4 media
briefing
conducted per
year
4 media reports and
4 attendance
registers

261
KPI NO OBJECTIVE STRATEGY KPI BASELINE ANNUAL
TARGET
BUDGET FUNDING
SOURCE
WARD RESPONSIBILITY 2020/2021 2021/2022 2022/2023 POE
GGPP 14
GGPP 15
To develop
effective
and
adequate
risk
manageme
nt system
Approve a risk
management
strategy by
September 2020
Approval of 1
risk
management
strategy by
September
2020
1 risk
manageme
nt policy
and 1 risk
manageme
nt strategy
were
approved
by Council
in
December
2016
1 risk
management
Strategy
R0.00 - All wards ED SSS 1 risk
manageme
nt policy
and 1 risk
manageme
nt Strategy
- - 1 approved risk
management
strategy and council
resolution
Approve a risk
management
plan by
September 2020
Approval
and
implementat
ion of risk
managemen
t plan by
September
2020
1 Risk
Management
plan was
approved in
December
2016
1 risk
management
Plan
R0.00 - All wards ED SSS 1 risk
management
Plan
1 risk
management
Plan
1 risk
management Plan
1 approved risk
management and risk
committee resolution
GGPP 16 Conduct four risk
assessments for all identified risks in the risk
register
Number of
risk
assessments
conducted per
year
1 risk
assessment
was
4 risk
assessments
conducted per
year
R0.00 - All wards EDSSS 4 risk
assessment
conducted per
year
4 risk
assessment
conducted per
year
4 risk
assessment
conducted per
year
4 risk assessment
reports

262
KPI NO OBJECTIVE STRATEGY KPI BASELINE ANNUAL
TARGET
BUDGET FUNDING
SOURCE
WARD RESPONSIBILITY 2020/2021 2021/2022 2022/2023 POE
GGPP 17 To promote
an
environment
free of fraud
and
corruption
Approve a fraud prevention plan by September 2020
Approval of a
fraud
prevention
plan by
September
2020
1 fraud
prevention
plan was
approved in
December
2018
1 fraud
prevention plan
approved
R0.00 - All wards ED SSS 1 fraud
prevention
plan
1 fraud
prevention
plan
1 fraud
prevention plan
1 fraud prevention
plan
Risk management
committee resolution GGPP 18 To provide
advice and
opinions on
the
organization’
s efficiency
and
effectiveness
in risk
management
, internal
control,
governance
processes
and
performance
management
.
Approve a risk based internal audit plan by Audit Committee by September 2020
1 Approved
Risk Based
Internal Audit
plan by
September
2020
1 Plan was
approved in
November
2016
1 Approved
Risk Based
Internal Audit
plan by
September
2020
R0.00 - All wards EDSSS 1 Approved
Risk Based
Internal Audit
plan by
September
each year
- - 1 approved risk
based internal audit
plan
Audit Committee
resolution on internal
audit risk based
internal audit plan

263
KPI NO OBJECTIVE STRATEGY KPI BASELINE ANNUAL
TARGET
BUDGET FUNDING
SOURCE
WARD RESPONSIBILITY 2020/2021 2021/2022 2022/2023 POE
GGPP 19
Compile four
Internal audit
reports on
operations,
internal control,
risk and
performance
management
performance management per year
Number of
internal audit
reports
compiled per
year
2 Internal
Audit Reports
were
compiled for
2016/2017
financial year
Four Internal
audit reports
compiled per
year
R0.00 - All wards EDSSS 4 Internal
audit report
compiled per
year
4 Internal audit
report
compiled per
year
4 Internal audit
report compiled
per year
4 approved
internal audit
reports
GGPP 20 Develop an Internal Audit methodology
Approval of
Internal Audit
methodology
by audit
committee
1 Internal
Audit
Methodology
was
approved by
December
2016
1 Internal Audit
Methodology
approved by
September
2020
R0.00 - All wards EDSSS 1 Internal
Audit
Methodology
approved by
September
2020
1 Internal
Audit
Methodology
approved by
September
2021
1 Internal Audit
Methodology
approved by
September
2022
1 approved
internal audit
methodology
Audit Committee
resolution n internal
audit methodology
GGPP 21 Coordinate and host four Audit Committee meetings per year
Number of
Audit
Committee
meetings
coordinated
and hosted
Not Audit
Committee
meetings
were
coordinated
and hosted
until February
2018
Four Audit
Committee
meetings
coordinated
and hosted by
July 2021
R68,000.
00
COUNCIL All wards EDSSS 4 Audit
Committee
meeting
coordinated
and hosted by
July 2021
4 Audit
Committee
meeting
coordinated
and hosted by
July 2022
4 Audit
Committee
meeting
coordinated and
hosted by July
2023
4 signed audit
committee meetings
4 attendance
registers

264
KPI NO OBJECTIVE STRATEGY KPI BASELINE ANNUAL
TARGET
BUDGET FUNDING
SOURCE
WARD RESPONSIBILITY 2020/2021 2021/2022 2022/2023 POE
GGPP 22 Facilitate annual review of Internal Audit Charter
Approval of
the Audit
Charter by the
Audit
Committee
1 Internal
Audit Charter
was
approved by
the Audit
Committee in
2016
1 Internal Audit
Charter
approved by
the Audit
Committee by
July 2020
R0.00 - All wards EDSSS 1 Internal
Audit Charter
approved by
the Audit
Committee by
July 2020
1 Internal
Audit Charter
approved by
the Audit
Committee by
July 2021
1 Internal Audit
Charter
approved by the
Audit
Committee by
July 2022
1 approved
internal audit
charter
Audit Committee
resolution on internal
audit charter
GGPP 23 Improve
alignment
of
programme
s at both
District,
Provincial
and
National
levels to
Attend all set forum meetings as required by Inter- Governmental Framework Act
Number of
Municipal
Managers
Forum
meetings
attended for
the financial
year.
4 MM’s
meetings
4 MM’s
meetings
attended during
the 2020/2021
financial year
R0.00 - All wards EDSSS 4 MM’s
meetings
attended
during the
2020/2021
financial year
4 MM’s
meetings
attended
during the
2021/2022
financial year
4 MM’s
meetings
attended during
the 2022/2023
financial year
4 invitations for MM
forum meetings
4 Attendance
registers for the MM
forum meetings held

265
KPI NO OBJECTIVE STRATEGY KPI BASELINE ANNUAL
TARGET
BUDGET FUNDING
SOURCE
WARD RESPONSIBILITY 2020/2021 2021/2022 2022/2023 POE
GGPP 24 Number of
technical IGR
forum meeting
attended
during the
financial year.
3 technical
IGR meetings
were
attended
during the
2016/2017
financial year
4 technical IGR
meetings
attended by
June 2021
R0.00 - All wards EDSSS 4 technical
IGR meetings
attended June
2021
4 technical
IGR meetings
attended June
2022
4 technical IGR
meetings
Attended By
June 2023
4 technical IGR
invitations to the
Municipality
4 attendance
registers to the
technical IGR
meetings held GGPP 25 Number of
District
Coordinating
Forum
meetings
attended for
the 2020/2021
financial year.
1 DCF
meeting was
attended
during the
2015/2016
4 DCF
meetings
attended by
June 2021
R0.00 - All wards EDSSS 4 DCF
meetings
attended by
end June
2021
4 DCF
meetings
attended by
end June 2022
4 DCF meetings
attended by end
June 2023
4 invitations to the
DCF meetings
4 attendance
registers of the
DCF meetings
held
GGPP 26 Number of
MECLOGA
meetings
attended for
the financial
year.
4 MECLOGA
meetings
were
attended in
the year
under review
4 MECLOGA
meetings
attended by
June 2021
R0.00 - All wards EDSSS 4 MECLOGA
meetings
attended by
June 2021
4 MECLOGA
meetings
attended by
June 2022
4 MECLOGA
meetings
attended by
June 2023
4 MECLOGA meeting
invitations
4 attendance
registers of the
MECLOGA meetings
held

266
KPI NO OBJECTIVE STRATEGY KPI BASELINE ANNUAL
TARGET
BUDGET FUNDING
SOURCE
WARD RESPONSIBILITY 2020/2021 2021/2022 2022/2023 POE
GGPP 27 Improve
alignment
of
programme
s at both
District,
Provincial
and
National
levels to
ensure
synergy in
planning
Number of
Back to
Basics
Intervention
Team
meetings
participated in
for the
financial year
3 Back to
Basics
Intervention
Team
meetings
4 Back to
Basics
Intervention
Team meetings
attended by
June 2021
R0.00 - All wards EDSSS 4 Back to
Basics
Intervention
Team
meeting
attended by
June 2021
4 Back to
Basics
Intervention
Team meeting
attended by
June 2022
4 Back to
Basics
Intervention
Team meeting
attended by
June 2023
4 Back to Basics
invitations to
meetings
4 attendance
registers of Back to
Basics meetings held
GGPP 28 Number of
PMS Forum
meetings
participated in
for the
financial year
3 PMS Forum
meetings
4 PMS Forum
meetings
attended by
June 2021
R0.00 - All wards EDSSS 1 PMS Forum
meeting
attended by
June 2021
1 PMS Forum
meeting
attended by
June 2022
1 PMS Forum
meeting
attended by
June 2023
4 PMS invitations to
meetings
4 attendance
registers of PMS
meetings held
GGPP 29 To develop a people-centred IDP that
meets legislative requirements and promote integration
Develop annual IDP
review process plan
Annual review
of the ID
1 IDP
Document
1 reviewed IDP R0. 00 COUNCIL (OPEX) All Wards EDSSS - - - 1 IDP process plan
approved
1 attendance register
of public participation
meetings
1 attendance register
of IDP representative
forum meeting.
GGPP 30 To monitor and evaluate
the implementation of the Integrated Development Plan (IDP)
and Budget, in line with
municipal
goals and
five
year Local
Government
Facilitate approval of annual SDBIP Approved
SDBIP
Approved SDBIP for
2018/2019
Approved
SDBIP for
2021/2022
R0.00 - All wards EDSSS 1 approved
PMS
- - Approved SDBIP
published
Council resolution on
the approval of a
Municipal SDBIP

267
KPI NO OBJECTIVE STRATEGY KPI BASELINE ANNUAL
TARGET
BUDGET FUNDING
SOURCE
WARD RESPONSIBILITY 2020/2021 2021/2022 2022/2023 POE
GGPP 31 Strategic
Agenda
implementati
on plan
Facilitate signing of
performance agreements of
6 S56/57 Managers and
for the Municipal
Manager by the 30 July
2020.
6 Signed
performance
agreements of
S56/57
Managers and
1 for the
Municipal
Manager by
30 July 2020.
7
Performance
agreements
were signed
for the
2017/2018
financial year.
6 Signed
performance
agreements of
S56/57
Managers and
1 for the
Municipal
Manager by 30
July 2020.
R0.00 - All wards EDSSS 6 Signed
performance
agreements
of S56/57
Managers
and 1 for the
Municipal
Manager by
30 July 2020.
6 Signed
performance
agreements of
S56/57
Managers and
1 for the
Manager by 30
July 2021.
6 Signed
performance
agreements of
S56/57
Managers and 1
for the
Municipal
Manager by 30
July 2022.
-6 Signed
performance
agreements of
S56/57 Managers -1
for the
Municipal Manager
by 30 July 2020.
GGPP 32 Facilitate assessment
reviews of S56/57
Managers each quarter of
the current financial year.
4 quarterly
assessment
reviews
facilitated
No
assessments
were
conducted in
the first half
of 2017/2018
4 quarterly
assessment
reviews
facilitated
R0.00 - All wards EDSSS 4 quarterly
informal
assessment
reviews
4 quarterly
formal
assessment
reviews
4 quarterly
informal
assessment
reviews
4 quarterly
assessment
review reports
Attendance registers
of assessment panel
members.
Appointment
letters as
members of the
assessment review
panel.
GGPP 33 Facilitate a review of IDP on a quarterly basis 4 review
sessions held
No
assessments
were
conducted in
the first half
of 2017/2018
4 review
sessions held
Linked to
Audit
Committ
ee
budget
sittings
- All wards EDSSS 4 review
sessions held
4 review
sessions held
4 review
sessions held
Invitation letters to
the assessment
panel
4 reports on the
assessment
GGPP34 Facilitate
drafting of the annual report for 2019/2020 financial year
1 Approved
oversight
report by
MPAC for
2017/2018
1 Oversight report was approved for 2019/2020 1 Approved
oversight report
by MPAC
R0.00 - All wards EDSSS 1 Approved
oversight
report by
MPAC for
2019/2020
1 Approved
oversight
report by
MPAC for
2020/2021
1 Approved
oversight report
by MPAC for
2021/2022
1 annual report
approved by council
1 council resolution
on the public
consultation process.

268
KPI NO OBJECTIVE STRATEGY KPI BASELINE ANNUAL
TARGET
BUDGET FUNDING
SOURCE
WARD RESPONSIBILITY 2020/2021 2021/2022 2022/2023 POE
GGPP 35 To promote
and improve
effective
linkage
between the
community,
stakeholders
and the
municipality
to ensure
accountabilit
y and
responsive
governance
structures.
Implementation of Council, Sec
80, Management
Resolution
Percentage of
resolutions
(Council, Sec.
80,
Management)
implemented
within the
required time
frames
There is a
register
Percentage of
resolution
implemented
within the
required time
frame
100% of
the
resolutio
ns
impleme
nted on
time
N
/
A
N/A All 100% 100% 100% Signed council
resolution register.
Attendance
registers of
council, s80
committees
Attendance registers
of Executive
Management
Committee

269

270
MATJHABENG IN SPATIAL CONTEXT
1.1 THE FREE STATE PROVINCE
The Free State Province is one of nine provinces in South Africa and is centrally located in terms of the geographic distribution of South Africa. The Free State represents 10.6% of the total land area of South Africa (Census 2001). The province covers an area of 129 464 km² and had a pollution of 2.7 million in 2001.
(Source: Free State Provincial Growth and Development Strategy; 2005 to 2014)

271
(Source: www.dining-out.co.za/images/FreeState.gif)
The Free State is divided into five district municipalities (districts). These are again subdivided into
three to five local
municipalities
0 local municipalities.
The five districts are:
1. Fezi Dabi in the north
2. Thabo Mofutsanyane in the east
3. Motheo in the south east
4. Xhariep in the south
5. Lejweleputswa in the north east
The major towns include:
Bloemfontein in Mangaung
Bethlehem in Thabo Mofutsanyane
Kroonstad and Sasolburg in Fezile Dabi
Welkom in Lejweleputswa
(Source: Retrieved from "http://en.wikipedia.org/wiki/Free_State")

272
1.2 THE LEJWELEPUTSWA DISTRICT
Lejweleputswa District Municipality area of jurisdiction is situated in the north western part of the
Free State and borders North West to the north; Northern Free State and Thabo Mofutsanyane to
the north east and east; Motheo and Xhariep to the south; and the Northern Cape to the west (IDP
Review, 2004/2005).The Lejweleputswa District, the Goldfields, is situated north of Mangaung
Municipality in the Free State Province. It is accessible from Johannesburg, Cape Town, Klerksdorp
and Kimberley (Lejweleputswa District Economic Development Strategy).
(Source: Leweleputswa District Economic Development Strategy, p10)
Lejweleputswa is surrounded by:
Dr Kenneth Kaunda District in North West to the north (DC40)
Fezile Dabi to the north-east (DC20)
Thabo Mofutsanyane to the south-east (DC19)
Mangaung Metropolitan to the south
Xhariep to the south-west (DC16)
Frances Baard in Northern Cape to the west (DC9)
Bophirima in North West to the north-west (DC39)

273
Coordinates: 27°58 ′S, 26°44 ′E
(Source: Draft Leweleputswa GDS 2006, p6)
274
The district comprises the following 5 municipalities and covers an area of 31686 square kilometres:
Masilonyana Local Municipality consisting of the following towns: Theunissen, Brandfort,
Winburg, Soutpan and Verkeedevlei
Matjhabeng Local Municipality consisting of the following towns: Welkom, Virginia,
Odendaalsrus, Hennenman, Ventersburg and Allanridge
Nala Local Municipality consisting of the following towns: Bothaville and Wesselsbron
Tokologo Local Municipality consisting of the following towns: Boshof, Dealesville and
Hertzogville
Tswelopele Local Municipality consisting of the following towns: Bultfontein and Hoopstad.
1.3 MATJHABENG MUNICIPAL AREA
The Matjhabeng Municipal area, previously known as the Free State Goldfields, consists of the
following towns:
Welkom / Thabong
Allanridge / Nyakalong
Odendaalsrus / Kutlwanong
Hennenman / Phomelong
Ventersburg / Mmamahbane
Virginia / Meloding
The area is favourably located in the north-eastern Free State about 250 km south of Johannesburg
and 160 km north of Bloemfontein. The nearest harbour is Durban approximately 565km from
Matjhabeng by road.

275
(Source: Matjhabeng Municipality)
2. THE LEGISLATIVE ENVIRONMENT FOR SPATIAL DEVELOPMENT
There are various legislative frameworks at national, provincial and local government level that
influences spatial development. These include over-arching legislation e.g. the Constitution to more
sector specific legislation e.g. the National Land and Transport Transition Act and National
Environmental Management Act. In the context of this document the following are important:
2.1 Development Facilitation Act 67/1995
The Development Facilitation Act set the tone for subsequent legislation concerning land
development. The principles set in Section 3 are:
3. (1) The following general principles apply, on the basis set out in section 2, to all land
development:

276
(a) Policy, administrative practice and laws should provide for urban and rural land
development and should facilitate the development of formal and informal, existing and new
settlements.
(b) Policy, administrative practices and laws should discourage the illegal occupation of land,
with due recognition of informal land development processes.
(c) Policy, administrative practice and laws should promote efficient and integrated land
development in that they-
(i) promote the integration of the social, economic, institutional and physical aspects of
land development;
(ii) promote integrated land development in rural and urban areas in support of each other;
(iii) promote the availability of residential and employment opportunities in close proximity
to or integrated with each other;
(iv) optimize the use of existing resources including such resources relating to agriculture,
land, minerals, bulk infrastructure, roads, transportation and social facilities;
(v) promote a diverse combination of land uses, also at the level of individual erven or
subdivisions of land;
(vi) discourage the phenomenon of "urban sprawl" in urban areas and contribute to the
development of more compact towns and cities;
(vii) contribute to the correction of the historically distorted spatial patterns of settlement in
the Republic and to the optimum use of existing infrastructure in excess of current
needs; and
(viii) encourage environmentally sustainable land development practices and processes.
(d) Members of communities affected by land development should actively participate in the
process of land development.
(e) The skills and capacities of disadvantaged persons involved in land development should be
developed.

277
(f) Policy, administrative practice and laws should encourage and optimize the contributions of
all sectors of the economy (government and non-government) to land development so as
to maximize the Republic's capacity to undertake land development and to this end, and
without derogating from the generality of this principle-
(i) national, provincial and local governments should strive clearly to define and make
known the required functions and responsibilities of all sectors of the economy in
relation to land development as well as the desired relationship between such sectors;
and
(ii) a competent authority in national, provincial or local government responsible for the
administration of any law relating to land development shall provide particulars of the
identity of legislation administered by it, the posts and names of persons responsible
for the administration of such legislation and the addresses and locality of the offices
of such persons to any person who requires such information.
(g) Laws, procedures and administrative practice relating to land development should-
(i) be clear and generally available to those likely to be affected thereby;
(ii) in addition to serving as regulatory measures, also provide guidance and information
to those affected thereby;
(iii) be calculated to promote trust and acceptance on the part of those likely to be affected
thereby; and
(iv) give further content to the fundamental rights set out in the Constitution.
(h) Policy, administrative practice and laws should promote sustainable land development at
the required scale in that they should-
i. promote land development which is within the fiscal, institutional and
administrative means of the Republic;
ii. promote the establishment of viable communities;
iii. promote sustained protection of the environment;
iv. meet the basic needs of all citizens in an affordable way; and
v. ensure the safe utilization of land by taking into consideration factors such as
geological formations and hazardous undermined areas.
vi. Policy, administrative practice and laws should promote speedy land
development.

278
(j) Each proposed land development area should be judged on its own merits and no particular
use of land, such as residential, commercial, conservational, industrial, community facility,
mining, agricultural or public use, should in advance or in general be regarded as being
less important or desirable than any other use of land.
(k) Land development should result in security of tenure, provide for the widest possible range
of tenure alternatives, including individual and communal tenure, and in cases where land
development takes the form of upgrading an existing settlement, not deprive beneficial
occupiers of homes or land or, where it is necessary for land or homes occupied by them
to be utilized for other purposes, their interests in such land or homes should be reasonably
accommodated in some other manner.
(l) A competent authority at national, provincial and local government level should co-ordinate
the interests of the various sectors involved in or affected by land development so as to minimize
conflicting demands on scarce resources.
(m) Policy, administrative practice and laws relating to land development should stimulate the
effective functioning of a land development market based on open competition between
suppliers of goods and services.
2.2 Municipal Systems Act, 32/2000.
The Municipal Systems Act, (Act 32, 2000) obligates all municipalities to prepare an Integrated
Development Plan (lDP) as the primary and overriding management tool. As an integral component
of the lDP the SDF must also adhere to the requirements of the Local Government: Municipal
Planning and Performance Management Regulations, 2001.
The content of a Spatial Development Framework is spelled out in terms of the Local Government:
Municipal Planning and Performance Management Regulations, 2001 (Government Notice 22605,
24 August 2001) which stated in regulation 2 (4) that:
2(4) A spatial development framework reflected in a municipality’s Integrated Development Plan
must
(a) give effect to the principles contained in Chapter 1 of the Development Facilitation Act,
1995 (Act No. 67 of 1995);
(b) set out objectives that reflect the desired spatial form of the municipality;

279
(c) contain strategies and policies regarding the manner in which to achieve the
objectives referred to in paragraph (b), which strategies and policies must-
(i) indicate desired patterns of land use within the municipality;
(ii) address the spatial reconstruction of the municipality; and
(iii) provide strategic guidance in respect of the location and nature of
development within the municipality;
(d) set out basic guidelines for a land use management system in the municipality;
(e) set out a capital investment framework for the municipality’s development programs;
(f) contain a strategic assessment of the environmental impact of the spatial development
framework;
(g) identify programs and projects for the development of land within the municipality;
(h) be aligned with the spatial development frameworks reflected in the integrated
development plans of neighbouring municipalities; and
(i) provide a visual representation of the desired spatial form of the municipality, which
representation –
(i) must indicate where public and private land development and infrastructure
investment should take place;
(ii) must indicate desired or undesired utilization of space in a particular area;
(iii) may delineate the urban edge;
(iv) must identify areas where strategic intervention is required; and
(v) must indicate areas where priority spending is required.
2.3 Land Use Management Bill
The Land use management bill aims to normalize land use management throughout the
whole country by setting further principles in Section 4.
4. (1) The general principle is that spatial planning, land development and land use management
must promote and enhance –

280
(a) equality
(b) efficiency;
(c) integration;
(d) sustainability; and
(e) fair and good governance
Principle of equality
5. (1) Everyone affected by a decision or process on spatial planning, land development and land
use management has the right -
(a) to be treated equally by the law;
(b) to equal protection and benefit of the law; and
(c) not to be unfairly discriminated against except as permitted in terms of the Constitution.
(2) No provision of this Act shall prevent the introduction or implementation of policies and other
measures designed to protect or advance persons, or categories of persons, disadvantaged by
unfair discrimination.
Principle of efficiency
6. Policies and other measures on spatial planning, land development and land use management
must -
(a) ensure the best use of available resources;
(b) develop and promote compact human settlements and discourage low density urban
sprawl; and
(c) secure proximity between residential and work places taking into account the health and
well-being of affected persons.
Principle of integration
7. Policies and other measures on spatial planning, land development and land use management
must -
(a) promote efficient, optimally functional and integrated settlement patterns;

281
(b) be functionally co-ordinated, aligned with, and take into account related policies and
programmes, including transportation systems;
(c) promote integration of communities from diverse backgrounds, including race and class;
and
(d) facilitate appropriate mixed land use.
Principle of sustainability
8. In order to ensure the sustainable management and use of the resources making up the natural
and built environment, policies and other measures on spatial planning, land development and land
use management must -
(a) ensure that land is used or developed only in accordance with the law;
(b) create synergy between economic, social and environmental concerns;
(c) protect natural, environmental and cultural resources in a manner consistent with
applicable environmental management legislation;
(d) preserve the use of prime and unique agricultural land; and
(e) take into account disaster management.
Principle of fair and good governance
9. (1) Policies and other measures on spatial planning, land development and land use
management must be democratic, participatory and lawful.
(2) A process or decision on spatial planning, land development and land use management
must -
(a) be lawful, reasonable and procedurally fair;
(b) comply with the right to just administrative action;
(c) take into account and promote the need of affected persons to understand its nature and
effect; and
(d) Promote efficient administration, including -
(i) The provision of adequate notice of details of officials who may assist the
public;

282
(ii) inviting affected persons to forums at which spatial planning, land
development and land use management decisions are taken ; and
(iii) Taking decisions within prescribed time-frames.
The Land Use Management Bill then further defines Spatial Development Frameworks on a
National, Provincial, Regional and a Municipal level. Section 17 of the Land use
management Bill states:
10. (1) The spatial development framework of a municipality must –
(a) give effect to the directive principles;
(b) be consistent with the national spatial development framework;
(c) be consistent with the provincial spatial development framework of the province in which
the municipality is located;
(d) be consistent with any applicable national and provincial legislation on environmental
management; and
(e) give effect to any national and provincial plans and planning legislation.
(2) A municipal spatial development framework must reflect at least –
(a) the current state of affairs report on land use in the municipality, including any spatial
dysfunctionality that exists;
(b) a conceptual framework of the desired spatial growth patterns in the municipality;
(c) a multi-sector based spatial plan, at an appropriate scale, sufficiently formulated to
achieve the desired spatial development goals, including -
(i) the correction of past spatial imbalances and the integration of
disadvantaged persons;
(ii) linkage between settlement development and appropriate transport
infrastructure and systems;

283
(iii) vacant land analysis of strategically located land comprising -
(aa) location and size;
(bb) ownership;
(cc) current zoning;
(dd) value;
(ee) surrounding land use;
(ff) geotechnical conditions; and
(gg) most suitable use (suitability index)
(d) a multi-sector driven resource plan for implementation of the spatial development
framework.
1. SPATIAL EDVELOPMENT STRUCTURE OF MATJHABENG
3.1 Current spatial structure
The current spatial development structure of Matjhabeng has not been approved and will be
attached
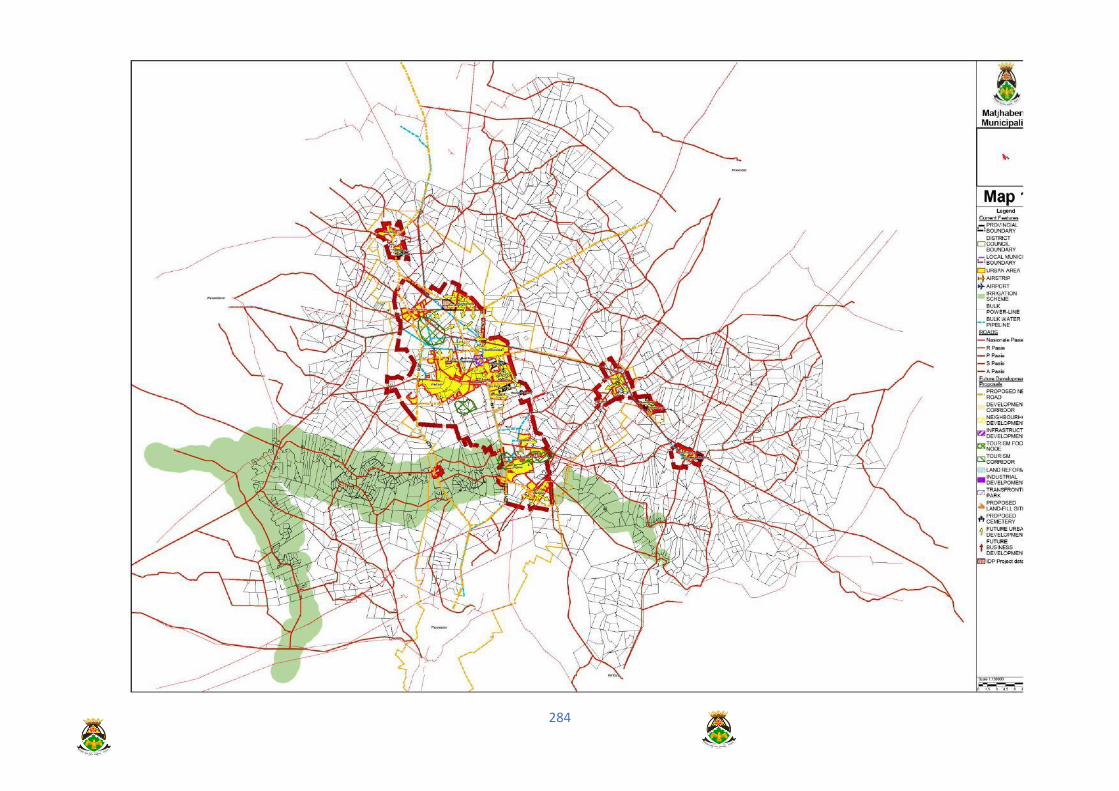
284

285
3.2 Current land uses in Matjhabeng
The following table depicts the current land uses in Matjhabeng
TOWN TOTAL
ERVEN
BU
SIN
ES
S
CE
ME
TE
RY
ED
UC
AT
ION
AL
GO
VE
RN
ME
NT
IND
US
TR
IAL
INS
TIT
UT
ION
AL
PA
RK
S
RE
SID
EN
TIA
L
WELKOM
WELKOM 9148 366 43 27 427 66 396 7821
NAUDEVILLE 1044 4 1 2 7 15 1015
RHEEDERPARK 1379 6 4 9 24 1336
FLAMINGO PARK 1634 4 6 3 7 50 1564
THABONG 29871 288 1 245 102 20 227 28986
BRONVILLE 2368 15 5 2 16 20 19 2291
RIEBEECKSTAD 5618 154 21 16 108 25 95 5191
SUBTOTAL 51062 837 1 325 50 653 154 826 48204
VIRGINIA
VIRGINIA 6431 306 1 19 11 184 32 168 5710
MELODING 10774 100 4 80 62 10528
SUBTOTAL 17205 406 5 99 11 184 32 230 16238
HENNENMAN
HENNENMAN 1695 122 1 34 10 139 2 88 1299
HAVENGAVILLE 51 27 3 1 1 19
PHOMELONG 4983 29 2 48 33 4871
117 2 8 107
DAGBREEK HOLDINGS 25 25
CONFIDO HOLDINGS 23 23
SUBTOTAL 6895 180 3 82 10 142 3 130 6345
VENTERSBURG
VENTERSBURG 658 65 9 5 35 7 5 532

286
TOWN TOTAL
ERVEN
BU
SIN
ES
S
CE
ME
TE
RY
ED
UC
AT
ION
AL
GO
VE
RN
ME
NT
IND
US
TR
IAL
INS
TIT
UT
ION
AL
PA
RK
S
RE
SID
EN
TIA
L
MMAMAHABANE 1875 18 1 10 1 5 15 1825
TSWELANGPELE 636 6 2 15 5 608
SUBTOTAL 3169 89 3 34 6 40 7 25 2965
ALLANRIDGE
ALLANRIDGE 1627 27 1 18 5 9 64 1503
NYAKALLONG 4114 21 1 41 24 4027
SUBTOTAL 5741 48 2 59 5 9 88 5530
ODENDAALSRUS
ODENDAALSRUS 3511 211 2 18 27 82 26 90 3055
KUTLWANONG 12296 116 1 117 90 11971
SUBTOTAL 15807 327 3 135 27 82 26 180 15026
TOTAL 99879 1887 17 734 109 1110 222 1479 94308
4. THE MATJHABENG SPATIAL DEVELOPMENT FRAMEWORK PLAN
4.1 THE SPATIAL DEVELOPMENT FRAMEWORK
The Spatial Development Framework is a multi-year plan that shows general future spatial direction aiming at
the creation of integrated and habitable cities, towns and rural areas. From a town planning perspective this
plan should direct and arrange the development activities and the built form in such a way that it can
accommodate ideas and desires of people without compromising the natural environment and the way
services are rendered.

287
4.2 CURRENT STATUS
The compilation of the Spatial Development Framework for Matjhabeng is in progress and will be
completed in
phases in order to comply with the applicable legislative requirements. The plan will be completed
as follows:
Phase 1 is an analyses phase. During this phase data is collected both cadastral
and physical. From this information a base map is compiled indicating: (See Map 1):
- Status quo information.
- Development constraints and restrictions.
- Existing spatial trends.
- Available land on account of its strategic location, ownership, current use, physical
conditions etc.
Phase 2 is a strategic phase where the following is proposed: (Municipal Policy)
-The identification of areas for the conservation of the natural and build environment, including
environmentally sensitive areas, river corridors, areas of biodiversity or with unique ecological
processes, heritage resources, high potential agricultural land etc.
- The identification of areas of future growth and development, that includes the
development of the necessary urban development policies to address:
a) The desired spatial structure, as well as patterns and directions of future growth.
b) The desired land-uses for each area, as well as areas where certain land-uses should
be encouraged or discouraged, or the intensity of certain uses be increased or
decreased.
c) Development corridors and development nodes.
d) Transport routes to facilitate future traffic demands and mobility requirements.
e) Areas where infrastructural investment is required.

288
f) The spatial reconstruction of the Municipal area and the correction of past imbalances
and integration.
g) Proposed areas for noxious activities, social services, cemeteries, waste disposal and
the like.
h) The spatial implications of HIV/AIDS, for example the positioning of future clinics and
care centres for orphans.
i) The spatial findings of the strategic environmental assessment.
j) The location of IDP projects and strategies.
Phase 3 is the detail phase. This phase must be done if and when specific circumstances
demand further investigation and more detailed interventions in a specific area. The terms
of reference of this phase shall only become clear as the SDF process unfolds. This phase
comprises the following actions:
- A detail assessment of priority and unique areas, and areas that require a higher level of
management.
- Compilation of detail RSDP’s (Regional Spatial Development Plans) for these areas.
- The establishment of regional policies in line with the parent policy.
The Public Participation Process is critical in order to establish legitimacy and the “buy-in” of all
stakeholders into the Spatial Development Framework. The deliverables of the process shall be the
creation of the Spatial Development Framework document consisting of maps and policies
encompassing:
- Spatial development plan – (on a strategic level).
- Urban development boundary and policies.
- Transportation and movement policy.
- Nodal development policy.
- Environmental policy.
- Corridor development policy.
- Sustainable neighbourhood policy for inter alia previously disadvantaged communities.

289
- Land use management policy.
4.3.1 GENERAL DIRECTION, PRINCIPLES AND NORMS ADOPTED
During the Integrated Development Planning process, the principles and Plan of the Free State
Goldfields Structure Plan Phase One was adopted. In order to direct development, the following
objectives must guide the Spatial Development Framework: efficiency, sustainability and
accessibility. To further enhance the development and implementation of the Spatial Development
Framework the following underlying principles are as important when developing and applying the
Spatial Development Framework: integration, equality and good governance.
The general principles and norms in relation to the spatial development of Matjhabeng as
discussed in this section are depicted in the attached Map 2 and Map 3.

290

291

292
4.4 Spatial Development Trends
The physical integration of Matjhabeng into one Town is at present restricted due to the physical
distance between the towns as well as mining activities forming physical restrictions. (Ventersburg
Virginia 20Km, Allanridge Odendaalsrus 15 Km, Hennenman Welkom 25 Km etc.)
The integration of existing towns should optimally utilize existing infrastructure and increase the density
of established towns.
Where a new development extends the present town limits, it must form a homogeneous extension
of the town.
Integration between Ventersburg and Mmamahabane is almost complete and further development
direction should be given in the Matjhabeng Structure Plan.
Integration between Hennenman and Phomolong should be pursued but will be difficult due to some
physical restrictions like a spruit, sewerage works and a dumping site.
Virginia and Meloding can to some extent be integrated via a southern link over the farm Schoonheid.
The Land use plan for Mining Land would assist in clarifying this and other opportunities for
integration.
Allanridge and Nyakallong also have physical restrictions of a pan, a sewerage works and a major
provincial road separating them, but the Matjhabeng Structure Plan should give clear direction.
Bronville Thabong Riebeeckstad Kutlwanong Odendaalsrus and Welkom can be integrated over the
longer term and should develop in line with the proposals of the Goldfields Structure Plan Phase 1.
4.5 Localized General Spatial Development Principles
The following aspects are key to the future spatial development of Matjhabeng:
• Optimal utilization of natural and infrastructural resources, and integrated planning principles should
drive all development.
Effective and efficient procedures and processes for applications and consents should be pursued to
facilitate development initiatives.

293
Future trends with a spatial impact, for example HIV/AIDS, needs to be carefully monitored and
planning should take place accordingly in a pro-active and holistic manner.
The core areas of the Goldfields including Welkom/Thabong, Odendaalsrus/Kutlwanong, and
Virginia/Meloding should be encouraged to develop as a compact integrated sub-region.
Development in towns must be channeled to develop towards each other as indicated by the
Goldfields Guide Plan.
Defunct or undeveloped mining land including infrastructure should be reclaimed for urban functions
to create the ideal compact sub-regional urban structure.
The location of residential and employment opportunities should be in close proximity to or integrated
with each other.
The densification of urban uses to optimize civil engineering services, opportunities and facilities.
4.6 Land development for residential purposes will be guided by the following principles:
All open land in the different urban areas previously earmarked for residential development should be
developed as a first priority.
All defunct or undeveloped mining land and open spaces between urban areas should be developed
as a second priority or simultaneously with developments highlighted as a first priority.
The existence of well-established residential areas with high land values should be protected against
urban decay. Transitional zones between low and high residential income areas can be planned to
assume the projection of well-established residential areas. These transitional zones must be planned
to the satisfaction of the Municipality and these zones can include any land use providing for the
desirable transition.
Areas indicated for residential development should make provision for the different income levels of
the population and different tenure options should be made available.
The minimum size of a residential stand shall be 500m2 in any new residential layout.
Mining hostels in the past offer housing to mainly heads of households and could be utilised for high
density family based residential development and or education facilities, community facilities,
commercial hive development on ground floor with residential development on top floors.
Private hostels should be upgraded to high-density family or single dweller units and ownership of land
should be promoted.
4.7 Defunct or undeveloped mining areas

294
It is further important to realize that mining land is to be released in terms of the Minerals Act, Act 50/1991
as amended before mining land could be used for urban purposes.
Land development of defunct or undeveloped mining areas, when needed for urban
development (rehabilitation through urban development), should be guided by the following:
(i) Land uses
(a) Residential
Detail studies concerning the feasibility to convert hostel buildings to high density units,
education facilities, community facilities or commercial hives at ground level with
residential development on top level should, be carried out before any decision
regarding the utilization of land is taken.
Existing mining villages and open areas around these villages should be planned to
form balanced township extensions.
(b) Shaft areas and reduction plants
Defunct shaft areas should be utilized for non-noxious industrial and commercial land
uses and should be planned as a unit to surrounding neighbourhoods.
(c) Rock and refuse dumps
Rock and refuse dumps in the area should be rehabilitated and township development
can only proceed when dumps are removed.
(d) Existing industrial areas
Existing industrial areas should be incorporated into any future detail town planning as industrial areas.
(e) Explosive magazines
Defunct explosive magazines should be rehabilitated when development is considered. Note must be taken
regarding the limitations for residential development when explosive magazines are still in operation.

295
(f) Concession stores, mining offices and security training areas
Concession stores should be incorporated as local business areas in proposed development areas.
Mining offices should be used as office/park - commercial/park facilities and the high quality of
gardening should be continued to enhance the tranquility of the area.
Existing security training areas should be used as community facilities for example a school, orphanage,
old age home, etc.
(g) Sports facilities
Existing mining sport facilities should be re-utilized in future urban developments as sport zones. Adjacent
hostels to these facilities should be converted for indoor sport such as karate, wrestling, boxing, etc.
(h) Mine water canals
Mine water canals still in operation when township development proceeds in earmarked mining areas
should be incorporated and safeguarded in respect to pollution and health within the guidelines of the
National Department of Health, Department of Water Affairs and Forestry and Department of
Environmental Affairs.
(i) Excavation areas
These areas need to be rehabilitated before or during urban development processes.
(j) Existing mining road networks
These roads are assets and should be incorporated in future development plans as internal/external
linkages.
(k) Railway network systems
If development in a mining area proceeds, investigations should be done to establish the feasibility of
reusing existing railway lines for alternative uses such as industrial, commercial or rail based
transportation systems.
(l) Slimes dam
296
Due to radiation levels no slimes dams can be re-used for urban development purposes.
(m) Trees
Existing plantations should be incorporated into any development plans.
(i) Infrastructure
- Mining services:
Future development teams should liase closely with mining officials in order to
determine which mining services can be removed or should be accommodated in
development plan proposals.
- Civil engineering:
Before development can proceed on undeveloped/defunct mining land the following
investigations must be done:
- the capacities of bulk services supply to development areas should be
determined.
- existing sewerage and water reticulation networks, which may be utilized in
developments, should be evaluated for compliance with municipal requirements.
- the general conditions of existing roads should be verified to determine whether these
roads comply with geometric standards and municipal requirements.
(ii) Environmental issues
It is important that mining houses clarify environmental restrictions such as radiation, acid
mine drainage, subterranean water quality, general contamination and geotechnical
restrictions before land is to be developed for urban land usage.
4.8 Business
297
(i) The retail component
The Central Business District of Welkom should maintain its dominant status as first order business
centre in Matjhabeng. Decentralized suburban business areas should be planned and managed on a
coordinated basis taking the existence of other areas into account.
In Welkom rezoning along Stateway, between the CBD and the industrial area, should be allowed subject
to the conditions as proposed by the Matjhabeng municipality.
Business areas in the municipal Area are planned in a hierarchical pattern. Future development of
business areas should accommodate these planned areas and these hierarchical settlement patterns of
business should be extended. The retail hierarchy as proposed in Table 15 should be applied in a flexible
manner to identify retail opportunities for the Municipal area.
(ii) Mixed land use nodes
Certain areas in the Matjhabeng should be earmarked as mixed land use nodes to encourage developers
to make investments in these areas that in turn will create work opportunities that are greatly needed to
the Matjhabeng area.
4.9 The Industrial component
(i) Industries
Approximately 446 ha additional land will be needed by the year 2010. The following areas are proposed
as industrial areas to make up the need:
- Hennenman Industrial Area
- the portion of land to the east of the market (about 7 ha)
- the land to the south and south-east of Voorspoed-Oos Extension 12 industrial areas (about 460 ha).
- the land between Arrarat Street, Alma Drive and Western Holdings shaft for light industries,
commercial development and industrial parks (about 86 ha).
- The following areas could be used for industrial development. These areas include mining land that
could become defunct in the next 15 years and are as follows:

298
mining land at Western Holdings 5 shaft: approximately 160 ha mining land at Western Holdings 8 shaft:
approximately 200 ha mining land at Western Holdings 1 shaft: approximately 168 ha mining land at Western
Holdings 2 shaft: approximately 68 ha
(ii) Light industrial and commercial corridor
- The existing corridor of mixed land uses along Provincial Road (P1/2) between Welkom and
Odendaalsrus as a given situation should be supported and extended to accommodate different zones
of land uses including mining, residential, commercial, recreation areas, etc.
(iii) Heavy industries
- Heavy industries that are classified as noxious industries in terms of noise, smoke or other pollution
activities should be
encouraged to settle at locations south of Welkom and towards Virginia. Since no residential areas
can be developed here due to constraints associated with mining activities. Noxious industries should
have the lowest impact on the environment in this area.
4.10 Education and community facilities
(i) Primary and Secondary Education
- The existing standards prescribed by the National Department of Education will be used during future
developments to determine the number of education facilities required. These school sites will be
located according to population distribution, road network and the availability of existing buildings or
suitable land.
- Land not needed by the Education Department should revert back to the municipality to utilize for
other purposes.
(ii) Tertiary education
- Tertiary Education is currently only located in Welkom. Open land to the north of the existing tertiary
education component
should be reserved for future extensions or additional facilities.

299
- Detail studies concerning the feasibility to convert defunct mining infrastructure (buildings) to
education facilities should
be done especially in areas reserved as mixed land use nodes.
(iii) Community facilities
- Community facilities comprise a whole range of facilities from crèches, libraries and community halls
to churches. Land
for Community facilities are provided according to the norms and standards of the Provincial
Government. The development of the facilities itself is governed by the need and the availability of
funds and institutions.
4.11 Open space
(i) Informal
- An integrated network of open spaces should be designed to link natural areas and community facilities
with residential areas. This is particularly important in low income areas where pedestrian movement
is high due to lower vehicle ownership levels.
- Existing drainage areas, lake areas, exotic and indigenous plantations as well as Thorn veld areas
should form part of the
network of open spaces and retention facilities should be planned in advance in these areas to prevent storm
water hazards.
- An Open Space Master Plan should be compiled to determine the future use of all open spaces.
(ii) Formal
- Community recreation parks should be identified in future developments. One community recreation
area per population of 60 000 should be provided to serve local recreational needs.
- Multi-purpose neighbourhood parks, mini parks and space for aesthetic parks should be provided
according to needs at a local level when development plans are prepared.

300
4.12 Urban agriculture
- The principle of urban agriculture as an urban land use is accepted and the proposals are as such
that continuity of normal
urban development will not be disrupted. There is a need for agricultural holdings / small farms with
a size of 1-25 ha to provide for a range of needs in the community.
4.13 Public Transport
- The areas planned for Taxi ranks must be developed since these locations have been planned to
serve as major assemble
nodes on a macro basis. At a micro level provision must further be made for taxis at the different
decentralized suburban business nodes.
- The South African Rail Commuter Corporation Limited identified a future rail corridor in concept
between Welkom and
Virginia. This corporation was also involved in this Structure Planning process that resulted in the
conceptual identification of a future rail based public corridor located between Odendaalsrus and
Welkom. The conceptual location of this corridor is indicated on the Spatial Development Framework
Plan. The location of this corridor is not fixed and further investigations by the South African Rail
Commuter Corporation Limited should be done to determine feasibilities and exact location of such
a commuter system.
4.14 Cemeteries
- The existing cemeteries at Allanridge, Nyakallong, Welkom, Thabong, Odendaalsrus, Kutlwanong,
Bronville, Hennenman
and Phomolong are sufficient for this IDP period to satisfy growing needs. Ventersburg,
Mmamahabane and Bronville are in the process of addressing the need.
4.15 Refuse areas and waste disposal
-The refuse areas currently serving Welkom, Thabong, Bronville and Odendaalsrus are sufficient to serve
needs for the

301
IDP period. Special attention should be given to the introduction of refuse transfer stations.
Investigations should further be done to utilize defunct mining areas for example slimes dams for
purposes of refuse areas or waste disposal sites. Due to radiation levels defunct slimes dam areas
are restricted for urban development.
5. LAND USE MANAGEMENT PLAN FOR MATJHABENG
The Land Use Management Plan ensures that all land and properties in Matjhabeng are used only according
to their permitted
land-use or zoning rights. It considers applications for new developments by property owners and
developers to change permitted land uses, zoning rights and their accompanying restrictions, which are in
turn specified in a zoning scheme. This responsibility is exercised in line with the City's commitment to
sustainable and equitable development.
Typical land-use or zoning categories in a zoning scheme include:
Residential zones (e.g. single residential dwellings, group housing schemes or blocks of flats)
Open space zones (e.g. public open spaces, parks, sports fields, cemeteries or private open spaces)
Business commercial zones (e.g. shops or office blocks)
Community use facility zones (e.g. schools, clinics or places of worship)
Industrial zones (e.g. factories, motor repair garages or warehouses)
Utility zones (e.g. electricity substations or water treatment plants)
Transport zones (e.g. public roads, railway lines and public transport interchanges)
In addition to the spatial development frameworks and structure plans, zoning schemes and related
regulations and
policies are primary tools for land-use and development management.
The new uniform Land Use Management Plan for Matjhabeng will be approved shortly and thus replace
the existing land use management guidelines for the different units in Matjhabeng.
302

303
1. Introduction
1.1 Strategic Objectives of a Performance Management System
In the local government context, a comprehensive and elaborate system of monitoring performance of
municipalities has been legislated. This system is intended to continuously monitor the performance of
municipalities in fulfilling their developmental mandate. Central to this is the development of key performance
indicators as instruments to assess performance. These indicators help to translate complex socio-economic
development challenges into quantifiable and measurable outputs. They are therefore crucial if a proper
assessment is to be done of the impact of government in improving the quality of life for all.
The Municipal Planning and Performance Management Regulations stipulates that a municipality’s
Performance Management System (PMS) must entail a framework that describes and represents how the
municipality's cycle and processes of performance planning, monitoring, measurement, review, reporting
and improvement will be conducted, organized and managed, including determining the roles of the different
role-players.
In line with the said legal requirement this framework is a policy document that will set out the requirements
that the Matjhabeng Municipality’s PMS will need to fulfil, the principles that inform its development and
subsequent implementation, the preferred performance model of the Municipality, the process by which the
system will work, the delegation of responsibilities for different roles in the process and a plan for the
implementation of the system.
1.2 The Legislative framework for performance management
The legislative and policy framework for PMS includes the Constitution, The Municipal Systems Act, the
Municipal Finance Management Act, Municipal Planning and Performance Management Regulations, The
White Paper on Local Government and Batho Pele principles. The main regulatory mechanism for PMS is
Chapter 6 of the MSA and the related Municipal Planning and Performance Management Regulations.

304
The major PMS policy instruments is the 1998 White Paper on Local Government supported by the Batho
Pele principles, which policies was given legal stature through the adoption of the Municipal Systems Act in
2000 (Act 32 of 2000). The said Act requires all municipalities to:
Develop a performance management system
Set targets and monitor and review the performance of the Municipality based on indicators linked
to their Integrated Development Plan (IDP)
Table and publish an annual performance report on performance of the Municipality forming part of
its annual report as per the Municipal Finance Management Act (MFMA).
Incorporate and report on a set of general (sometimes also referred to as national) indicators
prescribed by the Minister responsible for local government
Conduct, on a continuous basis, an internal audit of all performance measures
Have their annual performance report audited by the Auditor-General
Involve the community in setting indicators and targets and reviewing municipal performance
These are some of the main elements and requirements of the legislative requirements for the development
and implementation of a performance management system for municipalities. For the ease of reference and
for the benefit of a comprehensive Matjhabeng Municipality Performance Management System Framework,
more detailed legislative and policy guidelines and requirements are included in the framework.
1.2.2 The White Paper on Local Government (1998)
The White Paper on Local Government (1998) suggested that local government should introduce the idea
of performance management systems. The White Paper noted that,
"Involving communities in developing some municipal key performance indicators increases the accountability
of the municipality. Some communities may prioritise the amount of time it takes a municipality to answer a
query; others will prioritise the cleanliness of an area or the provision of water to a certain number of
households. Whatever the priorities, by involving communities in setting key performance indicators and
reporting back to communities on performance, accountability is increased, and public trust in the local
government system enhanced" (The White Paper on Local Government, 1998).
1.2.3 Batho Pele (1998)

305
Similarly, the White Paper on Transforming Public Service Delivery (Batho Pele) puts forward eight
principles for good public service:
Consultation:
Citizens should be consulted about the level and quality of public service they receive, and, where
possible, should be given a choice about the services which are provided.
Service standards:
Citizens should know what standard of service to expect.
Access:
All citizens should have equal access to the services to which they are entitled.
Courtesy:
Citizens should be treated with courtesy and consideration
Information:
Citizens should be given full and accurate information about the public services they are entitled to
receive.
Openness and transparency:
Citizens should know how departments are run, how resources are spent, and who is in charge of
particular services.
Redress:
If the promised standard of service is not delivered, citizens should be offered an apology, a full
explanation and a speedy and effective remedy; and when complaints are made citizens should receive a
sympathetic, positive response.
Value-for-money:
Public services should be provided economically and efficiently in order to give citizens the best possible
value-for-money.
“Importantly, the Batho Pele White Paper notes that the development of a service-oriented culture
requires the active participation of the wider community. Municipalities need constant feedback from

306
service-users if they are to improve their operations. Local partners can be mobilized to assist in building
a service culture. For example, local businesses or non-governmental organizations may assist with
funding a helpline, providing information about specific services, identifying service gaps or conducting a
customer survey” – The White Paper on Local Government (1998).
1.2.4 The Municipal Systems Act (2000)
The principle requirements of the Municipal Systems Act have already been highlighted. To provide further
insights into the requirements of the Act, the different sections of Chapter 6 (Annexure A) of the MSA will
be summarized:
Section 38: Requires municipalities to establish a Performance Management System, promote a
performance management culture and administer its affairs in an economical, effective, efficient and
accountable manner.
Section 39: Gives Executive Mayor the responsibility for managing the development of a Performance
Management System, as well as powers of delegation of responsibilities and the responsibility of submitting
the PMS to Council.
Section 40: Places responsibility on the municipality for the monitoring and review of its PMS.
Section 41: Outlines the core components to be included in the PMS of the municipality, and refers to KPI’s,
targets, measurement mechanisms, steps for improvement and the reporting processes.
Section 42: Requires the municipality to establish mechanisms and procedures for community involvement
in the process, in terms of Chapter 4 of the MSA.
Section 43: Allows the minister to establish general KPI’s which must be included in the KPI’s of
municipalities, to the extent that these general KPI’s are relevant to the municipality.
Section 44: Requires the municipality to notify stakeholders internally and the general public of its KPI’s
and targets.
Section 45: Requires the municipality to conduct an internal audit of its performance as well as an audit by
the auditor general.
Section 46: Requires the municipality to prepare an annual performance report.
Section 47: Requires MEC to compile an annual performance report for the municipalities within the
province

307
Section 48: The Minister has to compile an annual report and submit it to parliament, in terms of the
performance of the municipalities in relation to general KPI’s
Section 49: Allows the Minister to make regulations or issue guidelines for the purpose of Chapter 6 of the
MSA
1.2.5 Municipal Planning and Performance Management Regulations (2001)
The Minister responsible for local government published the Municipal Planning and Performance
Management Regulations (2001) in terms of the Municipal Systems Act (Section 49) setting out in detail the
requirements for a municipal PMS. The Regulations also contain the general indicators prescribed by the
Minister responsible for local government
1.2.6 Municipal Finance Management Act (2004)
It is also important to note that the Municipal Finance Management Act (MFMA) contains various important
provisions related to municipal performance management. It requires municipalities to annually adopt a
Service Delivery and Budget Implementation Plan (SDBIP) with service delivery targets and performance
indicators. Whilst considering and approving the annual budget the Municipality must also set measurable
performance targets for each revenue source and vote. The Municipality must lastly compile an annual report,
which must include a performance report compiled in terms of the Systems Act. In terms of a circular issued
by National Treasury provision is also made for the compilation on an annual basis of departmental SDBIPs.
2. Performance management and measures at various levels
Performance management can be applied to various levels within any organisation. The legislative
framework as set out above provides for performance management at various levels in the municipality
including strategic (sometimes also referred to as municipal, organisational or corporate) level, operational
(also referred to as services, departmental or section/team) level and lastly, individual level.
At strategic level the five-year IDP of the municipality forms the basis for performance management, whilst
at operational level the annual SDBIP forms the basis. The Matjhabeng Municipality will supplement the
required SDBIP with Operational Plans. The IDP is a long-term plan and by its nature the performance
measures associated with it will have a long-term focus, measuring whether a municipality is achieving its
IDP objectives. A SDBIP (both for the municipality as a whole and that of a department) is more short-term

308
in nature and the measures set in terms of the SDBIP, reviewing the progress made with implementing the
current budget and achieving annual service delivery targets.
The measures set for the Matjhabeng Municipality at strategic level is captured in a strategic
(municipal/organisational/corporate) scorecard structured in terms of the preferred performance
management model of the Municipality. The measures at operational level are to be captured in the SDBIP
of the Municipality and the SDBIPs of the various Departments in the Municipality.
By cascading performance measures from strategic to operational level, both the IDP and the SDBIP, forms
the link to individual performance management. This ensures that performance management at the various
levels relate to one another which is a requirement of the Municipal Planning and Performance Regulations.
The MFMA specifically requires that the annual performance agreements of managers must be linked to the
SDBIP of a municipality and the measurable performance objectives approved with the budget.
The following diagram indicates the performance management at various levels:
Performance management and measurement in the Matjhabeng Local Municipality
3. Objectives of the Performance Management System
IDP
Performance
Management
Team / Individual
Departmental
Workplace
Responsibility
Level
Organisational
SDBIP
Measurement
Setting Targets

309
As indicated above the Municipality’s PMS is the primary mechanism to monitor, review and improve the
implementation of its IDP and to gauge the progress made in achieving the objectives as set out in the IDP.
The objectives for any municipal performance management system is guided and regulated by the relevant
legislation and policy guidelines. The Planning and Performance Management Regulations informs the
objectives to a great extent. The PMS for the Matjhabeng Municipality includes the following objectives that
the system should fulfil:
Meeting IDP Objectives
To ensure that the priorities as contained within the IDP are achieved, by measuring the success of
meeting these objectives.
Effective Community Participation
The Performance Management System is to ensure that effective community participation is achieved
throughout the process.
Financial Accountability
The system should assist in improving the financial accountability of the key office bearers and officials.
Facilitate increased accountability
The performance management system should provide a mechanism for ensuring increased
accountability between the local community, politicians, the Municipal Council and the municipal
management team.
Facilitate learning and improvement
The PMS should facilitate learning in order to enable the Municipality to improve delivery.
Provide early warning signals
It is important that the system ensure decision-makers are timeously informed of performance related
risks, so that they can facilitate intervention, if necessary.

310
Facilitate decision-making
The performance management system should provide appropriate management information that will
allow efficient, effective and informed decision-making, particularly on the allocation of resources.
The functions listed above are not exhaustive but summarize the intended benefits of the system. These
intended functions should be used to evaluate and review the performance management system on a
regular basis (see chapter 9).
4. Principles governing Matjhabeng Municipality PMS
The principles that should govern the Matjhabeng Municipal PMS are developed to ensure that the PMS
is relevant, especially in attaining its objectives and legislative requirements. The said principles are the
following:
v' effective utilization of financial and human resources
v' simplicity so as to facilitate implementation given any current capacity constraints,
v' politically acceptable to all political role players,
v' administratively managed in terms of its day-to-day implementation,
v' implementable within any current resource constraints,
v' transparency and accountability both in terms of developing and implementing the system,
v' efficient and sustainable in terms of the ongoing implementation and use of the system,
v' public participation in terms of granting citizens their constitutional right to participate in the process,
v' integration of the PMS with the other management processes within the Municipality,
v' objectivity based on credible information and lastly,
v' reliability of the information provided on the progress in achieving the objectives as set out in its
IDP.

311
5. Preferred performance management model
A performance management model can be defined as the grouping together of performance indicators,
sometimes based other type of indicator, into logical categories or groups (often called perspectives), as a
means to enhance the ability of an organisation to manage and analyse its performance. As such a model
provides a common framework for what aspects of performance is going to be measured and managed. It
further ensures that a balanced set of measures are employed that are not relying on only one facet of
performance and therefore not presenting a holistic assessment of the performance of an organisation.
A number of performance models are available and any of them could be applied by the Municipality. The
available models include the Municipal Scorecard, Balanced Scorecard and the Key Performance Area
Model. The Matjhabeng Municipality has however chosen the Balanced Scorecard. In terms of the said
model all indicators are grouped together into Perspectives within the Strategic Scorecard. These
perspectives have its roots in the Balanced Scorecard Model and have been adapted to best suit the
performance model of the municipality. The Strategic Scorecard has its main focus on the performance of
the Municipality as an organization according to the following perspectives:
Financial sustainability
Effective service delivery
People and social development
Improve customer relations
Good governance
The municipality has Operational Plans in place which are drawn up annually and gives direction to the
operations for the respective departments of the municipality. The operational plans are linked to the SDBIP
and also to the IDP objectives. The operational plans consist of Key Performance Areas with its Key
Performance indicators which are linked to the IDP objectives.
The Operational Plans will inform the Strategic Scorecard and the Individual MSA Section 56 Employees’
performance agreements are also structured in terms of the perspectives of the Strategic Scorecard. This

312
allows for appropriate linkage between the strategic or organizational PMS and individual PMS within the
municipality.
The diagram above serves as a schematic representation of the Matjhabeng Strategic Model.
6. THE PROCESS OF MANAGING PERFORMANCE
The annual process of managing performance at strategic (municipal, organisational or corporate) level in the Municipality
involves the steps as set out in the diagram below:
The following table spells out in more detail the role of all relevant roleplayers in each of the above steps:
•Financial sustainability
•Effective service delivery
•People & Social development
•Improve Customer relations
•Good Governance
Matjhabeng Strategic Scorecard
Operational Plans
SDBIP IDP
11 IDP Priorities
Departmental
/Operational Level
Reporting
Municipal/Strategic
Level Reporting
IDP Objectives
Achievement of
Municipal Vision
and Mission
MATJHABENG STRATEGIC MODEL
Annual IDP
Review Process

313
1. Performance
Planning
2. PerformanceMonitoring
3. PerformanceMeasurement
4. Performance
Analysis
5. Performance
Reporting
6. Performance
Review
PERFORMANCEMANAGEMENT
The following table spells out in more detail the role of all relevant roleplayers in each of the above steps:
STAKEHOLDERS PERFORMANCE PLANNING
MEASUREMENT AND
ANALYSIS
PERFORMANCE REPORTING & REVIEWS
Citizens and
Communities Be consulted on
needs
Develop the long term
vision for the area
Influence the identification of priorities
Influence the choice of indicators and setting of targets
Be given the opportunity to review municipal performance and suggest new indicators and targets
Council Facilitate the development of a long-term vision. (MSA Chapter 5)
Develop strategies to achieve vision (MSA Chapter 5)
Identify priorities (MSA Chapter 5)
Adopt indicators and set targets (Planning and Performance Management Regulations (PPMR)
Review municipal performance bi-annually

314
STAKEHOLDERS PERFORMANCE PLANNING
MEASUREMENT AND
ANALYSIS
PERFORMANCE REPORTING & REVIEWS
Executive Mayoral
Committee and the
IDP Steering
Committee
Play the leading role in giving strategic direction and developing strategies and policies for the organisation
Manage the development of an IDP (MSA Chapter 5)
Approve and adopt indicators and set targets (MSA Chapter 6)
Communicate the plan to other stakeholders (MSA Chapter 5)
Conduct the major reviews of municipal performance, determining where goals had or had not been met, what the causal reasons were and to adopt response strategies
Municipal Manager +
HODs
Assist the Executive
Mayoral Committee in
providing strategic direction and developing strategies and policies for the organisation
Manage the development of the IDP (MSA Chapter 5)
Ensure that the plan is integrated
Identify and propose indicators and targets (MSA Chapter 6)
Communicate the plan to other stakeholders (MSA Chapter 5; PPMR)
Regularly monitor the implementation of the IDP, identifying risks early
Ensure that regular monitoring (measurement, analysis and reporting) is happening in the organisation
Intervene in performance problems on a daily operational basis (PPMR)
Conduct regular reviews of performance MSA Chapter 5)
Ensure that performance reviews at the political level are organised
Ensure the availability of information
Propose response strategies to the Mayoral Committee
Directorate/
Departmental
Managers
Develop service plans for integration with other sectors within the strategy of the organization (MFMA)
Measure performance according to agreed indicators, analyse and report regularly .Manage implementation and intervene where necessary
Inform decision-makers of risks to service delivery timeously
Conduct reviews of service performance against plan before other reviews
The balance of this chapter looks at each of the steps in more detail and how they will unfold in the process
of managing performance in the Municipality. Although the steps and what follow relates mainly to
performance management at strategic level, the principles and approaches as espoused could also be
applied to performance management at operational level.

315
6.1 Performance Planning
The performance of the Municipality is to be managed in terms of its IDP and the process of compiling an
IDP and the annual review thereof therefore constitutes the process of planning for performance. It should
be noted that the last component of the cycle is that of performance review and the outcome of such a
review process must inform the next cycle of IDP compilation/review by focusing the planning processes on
those areas in which the Municipality has under-performed.
The performance Planning step is further specified and rolled out in more detail in terms of the Service
Delivery and Budget Implementation Plan, being a requirement of the Municipal Finance Management Act.
The third level of planning for performance refers to the Operational Plans at Departmental level, as indicated
within the Matjhabeng Strategic Model.
6.2 Performance monitoring
Performance monitoring is an ongoing process by which a Manager accountable for a specific indicator as
set out in the strategic scorecard (or a service delivery target contained in an annual SDBIP) continuously
monitors current performance against targets set. These targets will be developed as part of the Operational
Plans and is to be linked to the KPI’s that are set within these Plans. The aim of the monitoring process is to
take appropriate and immediate interim (or preliminary) action where the indication is that a target is not going
to be met by the time that the formal process of performance measurement, analysis, reporting and review is
due.
In the instance of the Matjhabeng Municipality the Strategic Scorecard of the Municipality is reported on a
quarterly basis to the Executive Mayor. Performance monitoring requires that in between the said formal cycle
of performance measurement appropriate action be taken should it become evident that a specific
performance target is not going to be met. It is therefore proposed that at least on a monthly basis Managers
track performance trends against targets for those indicators that lie within the area of accountability of their
respective Departments as a means to early on identify performance related problems and take appropriate
remedial action.
Each Manager delegate to the direct line manager, the responsibility to monitor the performance for his/her
sector. Such line managers are, after all, best placed given their understanding of their sector to monitor on a
regular basis whether targets are being met currently or will be met in future, what the contributing factors are
to the level of performance and what interim remedial action needs to be undertaken. This will also serve to
better link organizational performance with individual/employee performance.

316
6.3 Performance measurement
Performance measurement refers to the formal process of collecting and capturing performance
data to enable reporting to take place for each key performance indicator and against the target
set for such indicator. Given the fact that initially at least the Municipality will have to rely on a
manual process to manage its performance provision has been made in the Strategic Scorecard
for the name of an official responsible for reporting on each indicator (please note that this might
not necessarily be the same official accountable for performance on an indicator).
The said official will, when performance measurement is due, have to collect and collate the
necessary performance data or information and capture the result against the target for the period
concerned on the strategic scorecard and report the result to his/her Manager making use of the
said scorecard after completing the next step (see performance analysis below). It should be
noted at this stage that for each of the scorecards of the Municipality two formats exist namely a
planning and reporting format. The planning format is used to plan and capture the performance
targets for each indicator whilst the reporting format is used to capture actual performance
against targets and to report to the Executive Mayoral Committee.
6.4 Performance analysis
Performance analysis involves the process of making sense of measurements. It requires
interpretation of the measurements as conducted in terms of the previous step to determine
whether targets have been met and exceeded and to project whether future targets will be met
or not. Where targets have not been met performance, analysis requires that the reasons
therefore should be examined, and corrective action recommended. Where targets have been
met or exceeded, the key factors that resulted in such success should be documented and shared
so as to ensure organisational learning.
In practice the aforementioned entails that the Manager responsible for each indicator will have to,
after capturing the performance data against targets on his/her respective Operational Scorecards
strategic, analyse the underlying reasons why a target has/has not been met and capture a summary
of his/her findings on the Operational Scorecard. The Manager will thereafter have to compile a draft
recommendation in terms of the corrective action proposed in instances where a target has not been
achieved and also capture this on the strategic scorecard. Provision has been made on the reporting
format of the strategic scorecard to capture both the “reason for deviance” in other words the results
of the analysis undertaken) and the “corrective measures” proposed.
The Strategic Scorecard will then be compiled with the inputs from the respective managers by
extracting the information from their Operational Scorecards and importing and translating it into

317
the five perspectives contained within the Matjhabeng Strategic Scorecard. The Strategic
Scorecard as completed must then be submitted to a formal meeting of the senior management
team for further analysis and consideration of the draft recommendations as captured by the
relevant Managers. This level of analysis should examine performance across the organisation in
terms of all its priorities with the aim to reveal and capture whether any broader organisational
factors are limiting the ability to meet any performance targets in addition to those aspects already
captured by the relevant Manager.
The analysis of the Strategic Scorecard by senior management should also ensure that quality
performance reports are submitted to Councillors and that adequate response strategies are
proposed in cases of poor performance. Only once senior management has considered the
Strategic Scorecard, agreed to the analyses undertaken and captured therein and have reached
consensus on the corrective action as proposed, can the Strategic Scorecard be submitted to the
Executive Mayoral Committee for consideration and review.
6.5 Performance reporting and review
6.5.1 In-year performance reporting and review
The submission of the Strategic Scorecard to the Executive Mayor for consideration and review of
the performance of the Municipality as a whole is the next step in the process. The first such report
is a major milestone in the implementation of any PMS and it marks the beginning of what should
become a regular event namely using the performance report as a tool to review the Municipality’s
performance, and subsequently the IDP, and to make important political and management
decisions on how to improve.
As indicated earlier it is recommended that the Strategic Scorecard be submitted to the Executive
Mayoral Committee for consideration and review on a quarterly basis. The reporting should
therefore take place in October (for the period July to end of September - quarter 1 of the financial
year), January (for the period October to the end of December - quarter 2), April (for the period
January to the end of March - quarter 3) and July (for the period April to the end of June - quarter
4).
The review in January will coincide with the mid-year performance assessment as per section 72
of the MFMA. The said section determines that the accounting officer must by 25 January of each
year assess the performance of the municipality and report to the Council on inter alia its service
delivery performance during the first half of the financial year and the service delivery targets and
performance indicators as set out in its SDBIP.

318
Performance review is the process where the leadership of an organisation, after the performance of
the organisation have been measured and reported to it, reviews the results and decided on
appropriate action. The Executive Mayor in reviewing the Strategic Scorecard submitted to it on a
quarterly basis will have to ensure that targets committed to in the Scorecard have been met, where
they have not, that satisfactory and sufficient reasons have been provided by senior management
and that the corrective action being proposed is sufficient to address the reasons for poor
performance. If satisfied with the corrective action as proposed these must to be adopted as formal
resolutions of Council, minuted and actioned accordingly.
6.5.2 Annual performance reporting and review
On an annual basis a comprehensive report on the performance of the Municipality also needs to
be compiled. The requirements for the compilation, consideration and review of such an annual
report are set out in chapter 12 of the MFMA. In summary it requires that:
All municipalities for each financial year compile an annual report
The annual report be tabled within seven months after the end of the financial year
The annual report immediately after it has been tabled be made public and that the local
community be invited to submit representations thereon
The municipal Council consider the annual report within nine months after the end of the
financial year and adopt an oversight report containing the council’s comments on the annual
report
The oversight report as adopted be made public
The annual report as tabled and the Council’s oversight report be forwarded to the Auditor-
General, the Provincial Treasury and the department responsible for local government in the
Province
The annual report as tabled and the Council’s oversight report are submitted to the Provincial
legislature.
The oversight report to be adopted provides the opportunity for full Council to review the
performance of the Municipality. The requirement that the annual report once tabled and the
oversight report be made public similarly provides the mechanism for the general public to review
the performance of the Municipality. It is however proposed that in an effort to assist the public in
the process and subject to the availability of funding, a user-friendly citizens’ report be produced in
addition to the annual report for public consumption. The citizens’ report should be a simple, easily
readable and attractive document that translates the annual report for public consumption.

319
It is also proposed that annually a public campaign be embarked upon to involve the citizens of the
Municipality in the review of municipal performance over and above the legal requirements of the
Municipal Systems Act and the MFMA. Such a campaign could involve all or any combination of
the following methodologies:
> Various forms of media including radio, newspapers and billboards should be used to
convey the annual report.
> The public should be invited to submit comments on the annual report via telephone, fax and
email.
> Public hearings could be held in a variety of locations to obtain input of the annual report.
> Making use of existing structures such as ward and/or development committees to
disseminate the annual report and invite comments.
> Hosting a number of public meetings and roadshows at which the annual report could be
discussed, and input invited.
> Producing a special issue of the municipal newsletter in which the annual report is highlighted,
and the public invited to comment.
> Posting the annual report on the council website and inviting inputs.
The public review process should be concluded by a formal review of the annual report by the IDP
Representative Forum of the Municipality.
Lastly it should be mentioned that the performance report of a municipality is only one element of
the annual report and to ensure that the outcome thereof timeously inform the next cycle of
performance planning in terms of an IDP compilation/review process, it is recommended that the
annual performance report be compiled and completed as soon after the end of a financial year as
possible but ideally not later than two months after financial year end.

320
6.5.3 Summary of various performance reporting requirements
The following table, derived from both the legislative framework for performance management and
this PMS framework, summarizes for ease of reference and understanding the various reporting
deadlines as it applies to the municipality.
REPORT FREQUENCY
SUBMITTED FOR
CONSIDERATION
AND / OR REVIEW
REMARKS
1. Departmental SDBIPs Continuous Manager of Department
See MFMA Circular 13 of
National Treasury for further
information
2. Monthly budget statements Monthly Executive Mayor/Mayor (in
consultation with EXCO)
See sections 71 and 54 of the
MFMA
3. Departmental scorecards Monthly Mayoral Committee Only if developed separately
from Departmental SDBIPs
4. Strategic
(municipal/organisational/
corporate) Scorecard
Quarterly Mayoral Committee This PMS framework (see
section 7.5.1 above)
5. SDBIP mid-year budget
and performance
assessment
Annually during
January of
each year
Executive Mayor/Mayor (in
consultation with EXCO)
See sections 72 and 54 of the
MFMA
6. Performance report Annually Council
See section 46 of the Municipal
Systems Act as amended. Said
report to form part of the annual
report (see 7 below)
7. Annual report Annually Council See chapter 12 of the MFMA

321
7. The auditing of performance measures
7.1 The role of internal audit in terms of performance management
The MFMA requires that the Municipality must establish an internal audit section which service
could be outsourced depending on its resources and specific requirements. Section 45 of the
Municipal Systems Act stipulates that the results of the Municipality’s performance measures must
be audited by the said internal audit section as part of the internal auditing process and annually
by the Auditor-General.
The Municipal Planning and Performance management Regulations stipulates that internal audit
section must on a continuous basis audit all performance and the auditing must include an
assessment of the following:
(i) The functionality of the municipality’s performance management system.
(ii) Whether the municipality’s performance management system complies with the Act.
(iii) The extent to which the municipality’s performance measurements are reliable in
measuring the performance of municipalities by making use of indicators.
(iv)
Each of the aforementioned aspects will now be looked at briefly.
Functionality
To function could be defined as a proper or expected activity or duty or to perform or operate as
expected. This could also be applied to the operation of any system such a PMS. The internal audit
section must therefore on a regular basis audit whether the PMS of the Municipality is functioning
as developed and described in this framework.
Compliance
To comply can be defined as to act in the way that someone else has commanded or whished. In
this respect it is clear that the legislature wishes to ensure that the Municipality’s PMS complies
strictly with the requirements of the Systems Act, Regulations and the MFMA. This compliance
check would require that the Municipality’s internal audit unit, at least on an annual basis, verifies
that the Municipality’s PMS complies with the said legal requirements.
Reliability
To rely could be defined as to trust or depend (upon) with confidence. Reliability in the context of PMS
refers to the extent to which any performance measures reported upon could be seen as being
reliable, e.g. if the performance target was to build 500 houses and it is reported that the target has
322
been met or exceeded, it must be established whether the information is factually correct or only an
estimation or even worse, purposeful misrepresentation. Undertaking a reliability audit will entail the
continuous verification of performance measures and targets reported upon. This will require that the
Municipality sets in place a proper information management system (electronically or otherwise) so
that the internal audit section is able to access information regularly and to verify its correctness.
The Municipality’s internal auditors must submit quarterly reports on the audits undertaken to the
Municipal Manager and the Audit Committee.
7.2 Audit Committee
The MFMA and the Municipal Planning and Performance Management Regulations require that the
municipal council establish an audit committee consisting of a minimum of three members, where
the majority of members are not employees of the municipality. No Councillor may be a member of
an audit committee. Council shall also appoint a chairperson who is not an employee.
The Regulations gives municipalities the option to establish a separate performance audit
committee whereas the MFMA provides only for a single audit committee. The operation of this
audit committee when dealing with performance management is governed by section 14 (2-3) of
the Regulations which require that the audit committee must:
review the quarterly reports submitted to it by the internal audit unit.
review the municipality's PMS and make recommendations in this regard to the Council of the
Municipality at least twice during a financial year submit an audit report to the municipal Council.
In order to fulfil their function a performance audit committee may, according to the MFMA and the
Regulations,
1. communicate directly with the council, municipal manager or the internal; and external
auditors of the municipality concerned;
2. access any municipal records containing information that is needed to perform its duties
or exercise its powers;
3. request any relevant person to attend any of its meetings, and, if necessary, to provide
information requested by the committee; and
4. Investigate any matter it deems necessary for the performance of its duties and the
exercise of its powers.
The Municipality has already established an Audit Committee and it is set in terms of the
MFMA, Regulations and this framework.

323
7.3 Performance Investigations
The Audit Committee should also be able to commission in-depth performance investigations
where there is either continued poor performance, a lack of reliability in the information being
provided or on a random ad-hoc basis. The performance investigations should assess:
The reliability of reported information
The extent of performance gaps from targets
The reasons for performance gaps
Corrective action and improvement strategies
While the internal audit section may be used to conduct these investigations, it is preferable that
external service providers, preferably academic institutions, who are experts in the area to be
audited, should be used. Clear terms of reference will need to be adopted by the Council for each

324

325
Introduction
The purpose of the Mineral and Petroleum Resources Development Act, 2002, (Act No 28 of 2002)
(MPRDA) is amongst others to transform the mining and production industries. In order to ensure
effective transformation in this regard, the Act requires the submission of the Social and Labour Plan
as a pre-requisite for the granting of mining or production rights. According to s 23, 24 & 25 of the
MPRDA, mining companies must submit a Social and Labour Plan (SLP) when applying for mining
rights, and the local economic development (LED) of the SLP must be aligned with the local and
district municipality Integrated Development Plan (IDP).
The alignment between the SLP and IDP local economic development initiatives provides a platform
for investment opportunity, economic growth, poverty reduction and infrastructure development. The
Social and Labour Plan requires applicants for mining and production rights to develop and
implement comprehensive Human Resources Development Programmes including Employment
Equity Plans, Local Economic Development Programmes and processes to save jobs and manage
downscaling and/or closure.
The above programmes are aimed at promoting employment and advancement of the social and
economic welfare of all South Africans whilst ensuring economic growth and socio-economic
development. The management of downscaling and/or closure is aimed at minimizing the impact of
commodity cyclical volatility, economic turbulence and physical depletion of the mineral or
production resources on individuals, regions or local economies.
This chapter in the IDP is meant specifically to respond to this requirement of the above-mentioned
legislation in making sure that all player in the Mining and Quarry Extraction Industry are compliant
and their Social and Labour Plans, in particular Community Development Project are geared toward
Local Economic Development. This plan is five (5) year renewable based on the negotiations with a
mining houses, the Municipality and the Department of Mineral Resources (DMR).
BELOW ARE SOME PROGRAMMES OF MINING HOUSES for Matjhabeng LM
COMPANY NAME AREA OF OPERATION
NAME OF PROJECT
TYPE OF PROJECT
BUDGET

326
Gold One Africa Limited 10036 MR
Phomolong Establishment of Light Industrial Site
Infrastructure R 12 500.000
Road Maintenance
R 12 500.000
Hennenman, Virginia and Venter burg
External bursaries Plan (9)
Educational
R 7 936.000
Hennenman, Virginia and Venter burg
Learnership Plan18.2 (20)
R 10. 772,848
Hennenman, Virginia and Venter burg
Internship Plan (30)
R 234.000
OMV Crushers Virginia (Pty) Ltd 10032 MR
Virginia and Welkom (Bronville)
Community bursaries (LED)
Educational
R 200 000
Northern Lights Trading 246 (Pty) Ltd 10031 MR
Odendalsrus and Allanridge
Upgrade of Commonage Farms infrastructure (Water and Fencing)
LED R 950 000
Road maintenance
Infrastructure R 2,900 000
Sibanye Gold Matjhabeng Road Maintenance
Infrastructure R25 000 000
Harmony Gold Mine
Virginia
Development of the pre-feasibility studies for five priority projects as per LED Strategy
Sports and Educational
R 3 000 000
Virginia
Jewellery School (School Subsidy)
Educational R 4 000 000
Odendaalsrus
Livestock Market and Impound Centre
LED R 16 000 000
Welkom Business Industrial Hub
LED R 1 000 000
Matjhabeng
Broad Based Livelihoods Programme (BBL). Food gardens production, livestock improvement and skills development
LED R 2 500 000

327
Matjhabeng
Business Studies and Feasibility Plans (Mining Museum and Ternary and leather processing Factory)
LED R 1 300 000
TETRA 4. Virginia Gas Project
Meloding/ Virginia
Renovation of the Meloding Community Hall including refurbishment of community gym
LED / COMMUNITY DEVELOPMENT
R 592, 321.58
The development of sport facilities at Tikwe Primary School
LED / EDUCATIONAL
R 1 168, 321.58
Infrastructure development at Adamson’s Vley Community School
LED / EDUCATIONAL
R 123, 397.39
The development of sport facilities/fields at the Reatlehile Secondary School
LED / EDUCATIONAL
R1, 013,705
Anglo Allied. Kutlwanong
Introduction of security system and renovation of the Kutlwanong Community Hall,
LED / COMMUNITY DEVELOPMENT
R200 000.00
Other small mining and quarrying operations SLP projects will be included in the IDP as and when
they make applications to Department of Mineral Resources and also when IDP is reviewed
annually.
NB: Northern Lights Trading 246 (Pty) Ltd 10031 and MR Gold One Africa Limited 10036 MR funding
will only implement and spend funds once the Mining right is concluded and mine is optional.