integrated project: bering sea project · integrated project: bering sea project mike sigler alaska...
TRANSCRIPT

Integrated Project:Bering Sea Project
Mike SiglerAlaska Fisheries Science Center
Ecosystem Science ReviewJuneau, AlaskaMay 2-6, 2016

Bering Sea ProjectBering Ecosystem Study (BEST) +
Bering Sea Integrated Ecosystem Research Program (BSIERP)
bsie
rp.n
prb.
org
BE
ST-
BS
IER
P B
erin
g S
ea P
roje
ct
North Pacific Research BoardBoard of Directors meeting
Anchorage, AlaskaApril 30, 2014
Mike Sigler (NOAA) (on behalf of the larger program)

Program scope and chronology
bsie
rp.n
prb.
org
BE
ST-
BS
IER
P B
erin
g S
ea P
roje
ct
● 2007 – 2010 Field Work● 2011 – 2013 Synthesis● 24,205 person-days of fieldwork● 176 publications to date
Outline
● Prologue: Seasonal ice and the cold pool
● Chapter 1: Why did pollock abundance
decline then rebound in the last decade?
● Chapter 2: Location matters for fur seals
and fishermen
● Chapter 3: The eastern Bering Sea in the
future
● The benefits of an integrated program
bsie
rp.n
prb.
org
BE
ST-
BS
IER
P B
erin
g S
ea P
roje
ct
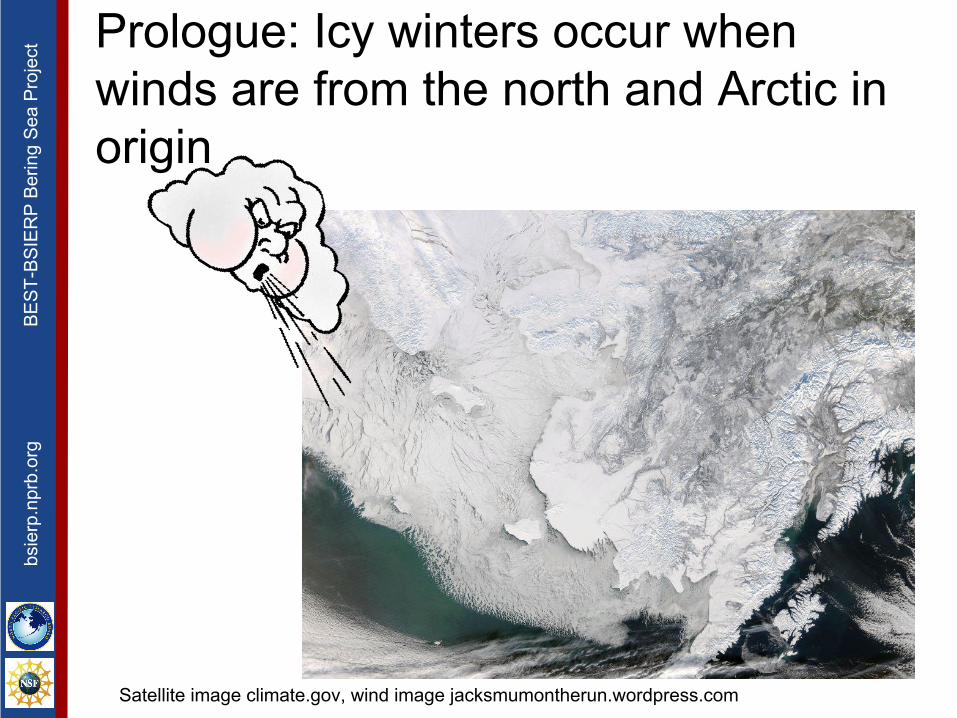
Prologue: Icy winters occur when winds are from the north and Arctic in origin
bsie
rp.n
prb.
org
BE
ST-
BS
IER
P B
erin
g S
ea P
roje
ct
Satellite image climate.gov, wind image jacksmumontherun.wordpress.com

Icy winters increase the size of the ‘cold pool’ (<2 °C )
bsie
rp.n
prb.
org
BE
ST-
BS
IER
P B
erin
g S
ea P
roje
ct
COLD YEARWARM YEAR
Lauth
bsie
rp.n
prb.
org
BE
ST-
BS
IER
P B
erin
g S
ea P
roje
ct
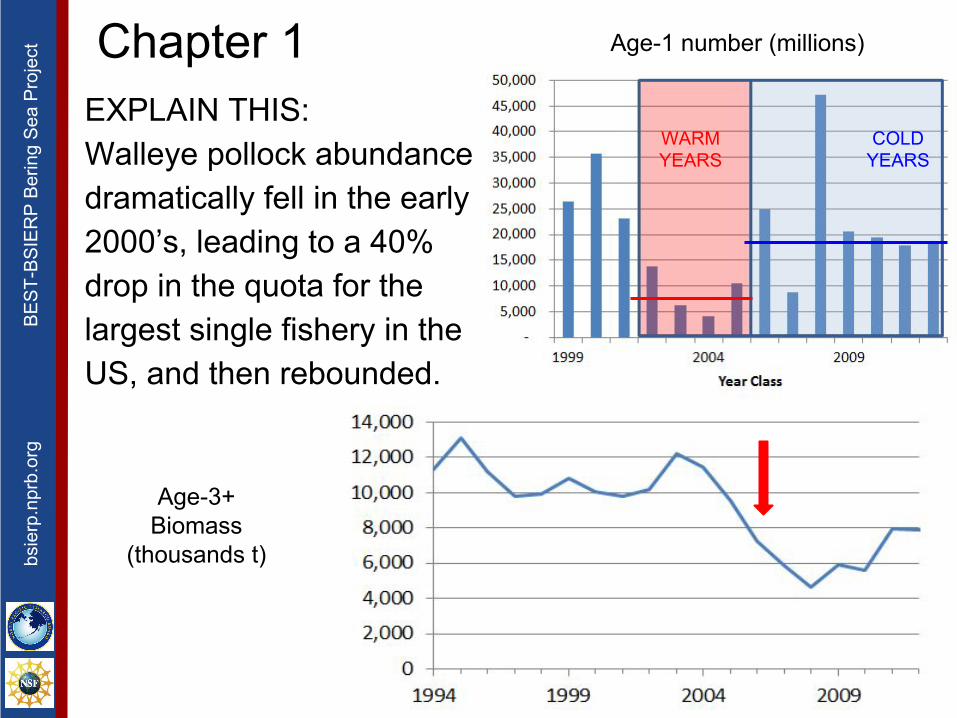
Age-3+ Biomass
(thousands t)
Age-1 number (millions)
WARM YEARS
COLDYEARS
EXPLAIN THIS: Walleye pollock abundance dramatically fell in the early 2000’s, leading to a 40% drop in the quota for the largest single fishery in the US, and then rebounded.
Chapter 1

bsie
rp.n
prb.
org
BE
ST-
BS
IER
P B
erin
g S
ea P
roje
ct
… and does not appear to limit production of
copepod and krill, which are prey for
age-0 pollock
Campbell, Ashjian, Lessard, Liu, Zhai, Zeeman, Eisner, Gann, Mordy, Moran, Lomas, Gibson
Mordy, Cokelet, Ladd, Menzia, Proctor, Stabeno, Wisegarver
COLDWARM
The amount of primary production available for copepods and krill is similar in warm and cold years

Egg production Metamorphosis
Calanus egg production
Low energy demand
COLD YEARICE
bsie
rp.n
prb.
org
BE
ST-
BS
IER
P B
erin
g S
ea P
roje
ct
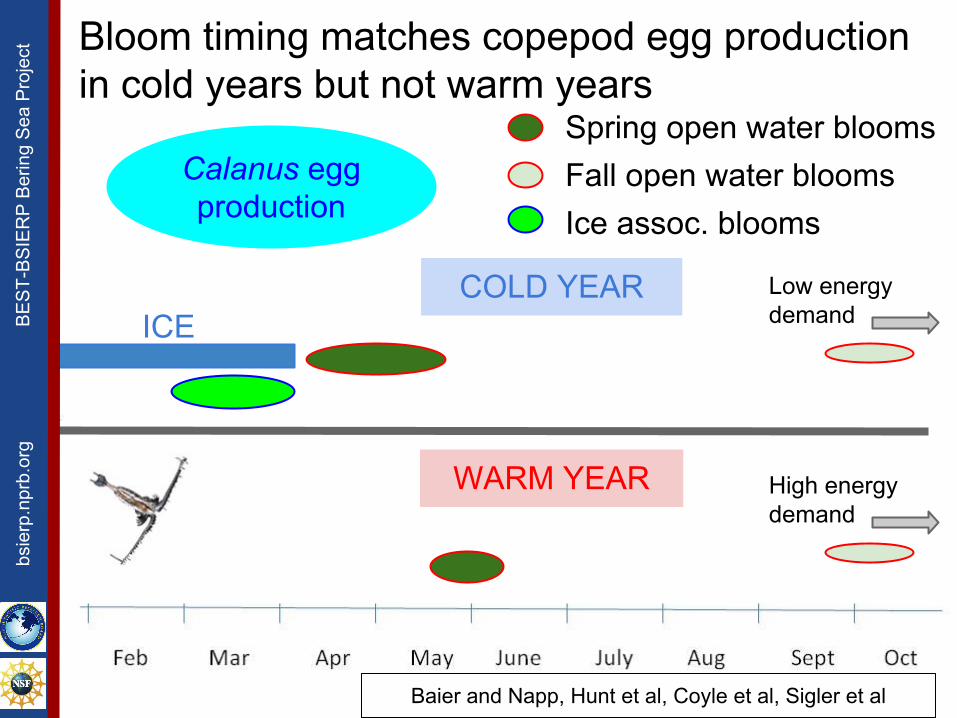
Baier and Napp, Hunt et al, Coyle et al
Bloom timing matches copepod egg production in cold years
Ice assoc. bloomsFall open water bloomsSpring open water blooms
Egg production Metamorphosis
Calanus egg production
Low energy demand
High energy demand
COLD YEAR
WARM YEAR
ICE
bsie
rp.n
prb.
org
BE
ST-
BS
IER
P B
erin
g S
ea P
roje
ct
Ice assoc. bloomsFall open water bloomsSpring open water blooms
Baier and Napp, Hunt et al, Coyle et al, Sigler et al
Bloom timing matches copepod egg production in cold years but not warm years

Ice algae likely enhances copepod reproduction
bsie
rp.n
prb.
org
BE
ST-
BS
IER
P B
erin
g S
ea P
roje
ct
Campbell, Lessard, Ashjian, Durbin, Rynearson, Casas
Gradinger, Bluhm, Iken, Weems
Higher ingestion rate when feeding on ice algae than water column phytoplankton

Copepods and krill are more abundant in cold years: This contradicted our expectation (strike 1!)
Larg
e zo
opla
nkto
n ab
unda
nce
bsie
rp.n
prb.
org
BE
ST-
BS
IER
P B
erin
g S
ea P
roje
ct
Eisner et al.
Southeastern Bering Sea (< 60 °N)

bsie
rp.n
prb.
org
BE
ST-
BS
IER
P B
erin
g S
ea P
roje
ctAs a consequence, age-0 pollock consume richer diets in cold years, better preparing them for their first winter...
… and enhancing survivorship.
Heintz et al.

bsie
rp.n
prb.
org
BE
ST-
BS
IER
P B
erin
g S
ea P
roje
ct EXPLANATION: Due to bloom timing, large crustacean zooplankton benefit from icy winters, providing prey for age-0 pollock to enter their first winter fat (and happy?)
Age-3+ Biomass
(thousands t)
Age-1 number (millions)
WARM YEARS
COLDYEARS

Chapter 2: Location matters
for fur seals and fishermen
bsie
rp.n
prb.
org
BE
ST-
BS
IER
P B
erin
g S
ea P
roje
ct

We predicted fishermen would travel farther north in warm years, but instead the opposite occurred (strike 2!)
bsie
rp.n
prb.
org
BE
ST-
BS
IER
P B
erin
g S
ea P
roje
ct
Pollock catcher/ processor fleet, center of fishing effort:
In summer, a northward and off-shelf shift correlated with colder conditions and larger cold pool
Haynie, Pfeiffer
COLD
WARM

Even with negligible temperature-related shift, some cost effects can occur
bsie
rp.n
prb.
org
BE
ST-
BS
IER
P B
erin
g S
ea P
roje
ct
Summer/fall cod longline fishery: Vessels traveled farther (29 vs 20 km/ton catch) and set their gear more often during a trip (39 vs 33) in warm vs. cold years.
Haynie, Pfeiffer

Population trends differ among locations
bsie
rp.n
prb.
org
BE
ST-
BS
IER
P B
erin
g S
ea P
roje
ct
Per
cent
of m
axim
um n
umbe
r

Population trends differ among locations
bsie
rp.n
prb.
org
BE
ST-
BS
IER
P B
erin
g S
ea P
roje
ct
Per
cent
of m
axim
um n
umbe
r

Foraging locations - closer to home is better
bsie
rp.n
prb.
org
BE
ST-
BS
IER
P B
erin
g S
ea P
roje
ct
● Trip lengths shorter for fur seals and murres at Bogoslof than Pribilofs
● Energy content of diet lower at Pribilofs than Bogoslof because of species consumed
Trites, Battaile, Benoit-Bird, Harding, Heppell, Irons, Kitaysky, Kuletz, Paredes, Renner, Roby
Kernel density use estimates for northern fur seals, blacklegged kittiwakes, and thickbilled murres tagged on St. Paul Island (purple), St. George Island (green) and Bogoslof Island (blue) in 2009. Isopleths are 50, 75, and 95 % use contours with darker colors indicating higher use areas.

Trends observed by communities (local and traditional knowledge, subsistence harvests):● Location differences
between the south (many species in decline) and the north (a productive ecosystem)
● Patterns are consistent with the northern Bering Sea remaining icy during winter and spring and the southeastern Bering Sea more affected by changes in sea ice extent
bsie
rp.n
prb.
org
BE
ST-
BS
IER
P B
erin
g S
ea P
roje
ct
Huntington, Braem, Brown, Hunn, Krieg, Lestenkof, Noongwook, Sepez, Sigler, Wiese, Zavadil
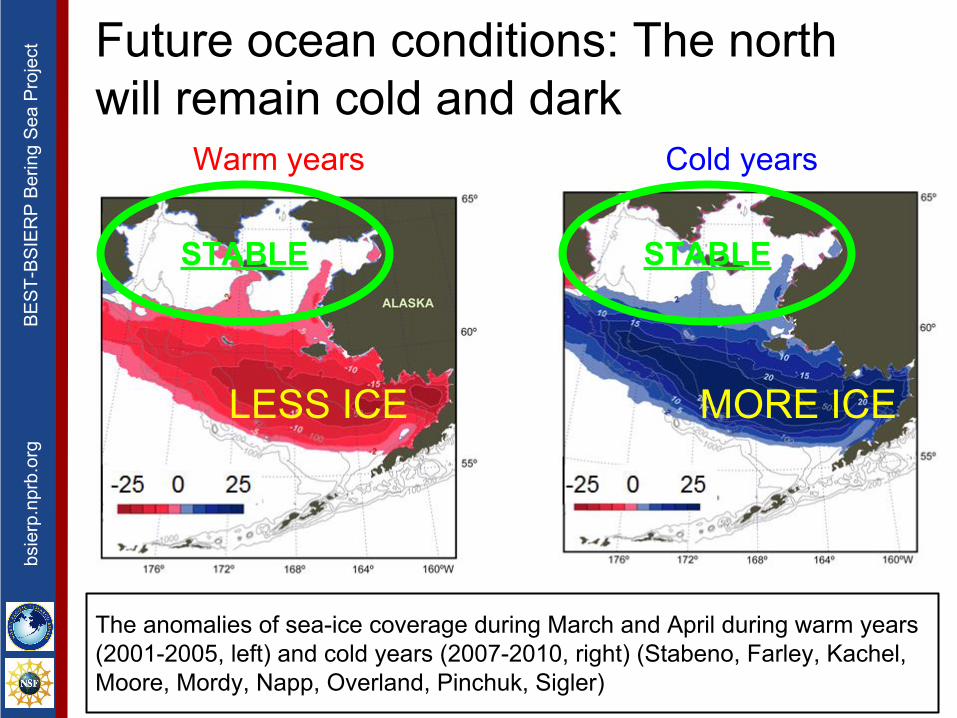
Future ocean conditions: The north will remain cold and dark
bsie
rp.n
prb.
org
BE
ST-
BS
IER
P B
erin
g S
ea P
roje
ct
The anomalies of sea-ice coverage during March and April during warm years (2001-2005, left) and cold years (2007-2010, right) (Stabeno, Farley, Kachel, Moore, Mordy, Napp, Overland, Pinchuk, Sigler)
LESS ICE MORE ICE
STABLE STABLE
Warm years Cold years

Chapter 3: The eastern
Bering Sea in the future
bsie
rp.n
prb.
org
BE
ST-
BS
IER
P B
erin
g S
ea P
roje
ct

Subarctic fish will not expand into the northern Bering Sea shelf, which contradicts our expectation when the program started (strike 3!)
bsie
rp.n
prb.
org
BE
ST-
BS
IER
P B
erin
g S
ea P
roje
ct
The average number of days in which sea-ice was present in March and April during 2001-2010.
Stabeno, Farley, Kachel, Moore, Mordy, Napp, Overland, Pinchuk, Sigler, Hollowed, Barbeaux, Cokelet, Kotwicki, Ressler, Spital, Wilson

Models also forecast that the north will remain cold and dark
bsie
rp.n
prb.
org
BE
ST-
BS
IER
P B
erin
g S
ea P
roje
ct
Frac
tiona
l ice
cov
er
Zhang and BanasSea surface temperature

Forecast fish abundance, climate effects differbs
ierp
.npr
b.or
gB
ES
T-B
SIE
RP
Ber
ing
Sea
Pro
ject
Mueter, Bond, Ianelli, Hollowed Wilderbuer, Stockhausen, Bond
Temperature Inshore transport
Walleye pollock Northern rock sole

Forecast fish abundance, climate effects differbs
ierp
.npr
b.or
gB
ES
T-B
SIE
RP
Ber
ing
Sea
Pro
ject
Mueter, Bond, Ianelli, Hollowed Wilderbuer, Stockhausen, Bond
Temperature Inshore transport
Walleye pollock Northern rock sole

The benefits of an integrated ecosystem research program (strengths, challenges, solutions)● Management implications
○ understanding “why” helps stakeholders● Deep and broad publication set● Formation of new teams and
collaborations● Results achieved by this integrated
program that likely would not have been accomplished by a series of individual projects (3 examples)
bsie
rp.n
prb.
org
BE
ST-
BS
IER
P B
erin
g S
ea P
roje
ct

Age-1 number (millions)
WARM COLD
ICELow energy demand
COLD YEAR
Due to bloom timing, large crustacean zooplankton benefit from icy winters, providing prey for age-0 pollock to enter their first winter fat
bsie
rp.n
prb.
org
BE
ST-
BS
IER
P B
erin
g S
ea P
roje
ct
Andrews, Ashjian, Baier, Banas, Bluhm, Campbell, Casas, Cieciel, Cokelet, Coyle, Durbin, Eisner, Farley, Gann, Gibson, Gradinger, Heintz, Hunt, Iken, Janout, Kachel, Ladd, Lessard, Liu, Lomas, Menzia, Moore, Moran, Mordy, Mueter, Napp, Overland, Pinchuk, Proctor, Ressler, Rynearson, Salo, Siddon, Sigler, Stabeno, Weems, Wisegarver, Yamaguchi, Zeeman, Zerbini, Zhai, Zhang

Prey closer to colonies and more energy dense at Bogoslof compared to Pribilof islands
bsie
rp.n
prb.
org
BE
ST-
BS
IER
P B
erin
g S
ea P
roje
ct
Trites, Battaile, Benoit-Bird, Friday, Harding, Heppell, Hoover, Irons, Jones, Kitaysky, Kuletz, McIntosh, Mueter, Nordstrom, Orben, Paredes, Renner, Ressler, Roby, Sigler, Suryan, Waluk, Wilson, Young, Zerbini

The northern Bering Sea will stay cold for the foreseeable future and subarctic fish will not expand into there
bsie
rp.n
prb.
org
BE
ST-
BS
IER
P B
erin
g S
ea P
roje
ct
Frac
tiona
l ice
cov
er
Sea surface temperature
Banas, Barbeaux, Bond, Cokelet, Curchitser, Farley, Gibson, Hedstrom, Hermann, Hollowed, Kachel, Kotwicki, Moore, Mordy, Napp, Overland, Pinchuk, Ressler, Sigler, Spital, Stabeno, Wilson, Zhang
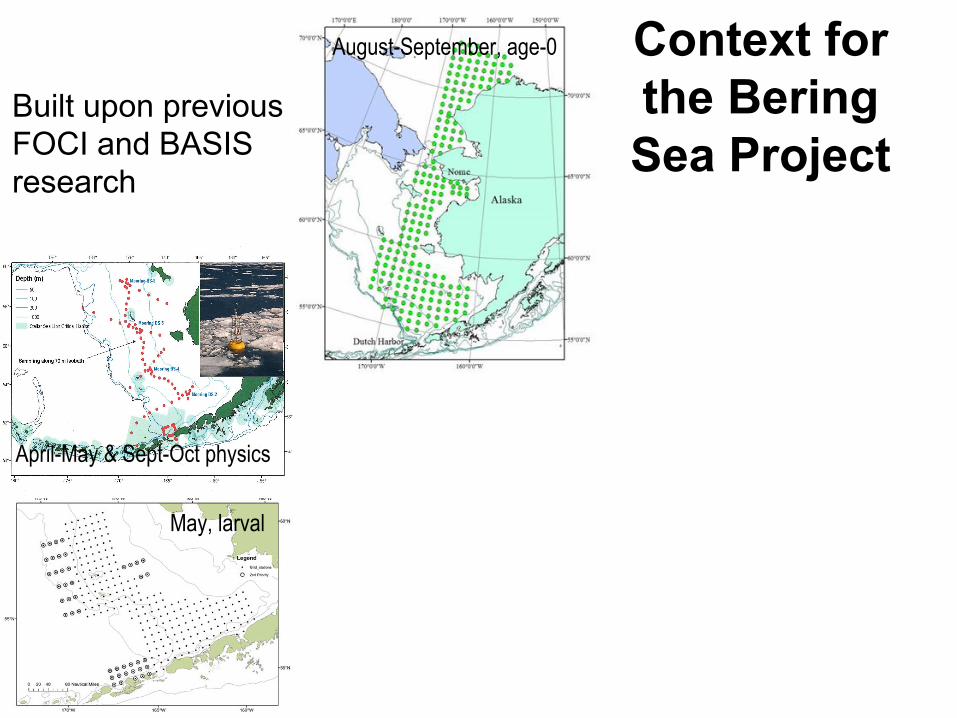
Context for the Bering Sea Project
Built upon previous FOCI and BASIS research
May, larval
April-May & Sept-Oct physics
August-September, age-0

Context for the Bering Sea Project
Built upon previous FOCI and BASIS research
Continuing as RPA and ACLIM
May, larval
April-May & Sept-Oct physics
August-September, age-0

Status of ecosystem data (TOR 4)
● Bering Sea Project Archive
Strategies to obtain and manage ecosystem data
● Hypotheses● Study plan

Status of ecosystem modeling (TOR 5)

Integrated ecosystem-level analyses● Climate and oceanography (Stabeno et al., 2012a, b) ● Bloom timing, zooplankton, and juvenile walleye pollock
(Hunt et al., 2011)● Zooplankton and juvenile walleye pollock (Coyle et al.,
2011)● Walleye pollock bioenergetics (Heintz et al., 2013)● Climate, sea ice, phytoplankton, zooplankton, and
juvenile walleye pollock (Sigler et al., 2016)● Prey patch and top-level predator foraging (Benoit-Bird
et al., 2013)● Climate and communities (Huntington et al., 2013)

Cumulative analyses
Quantitative climate and fisheries effects● Walleye pollock (Mueter et al., 2011)● Northern rock sole (Wilderbuer et al., 2013)● Red king crab (Punt et al., 2014)● Tanner crab (Punt et al., 2015)

Inclusion of ecosystem data into living marine resource management advice (TOR 6)
Age-3+ Biomass
(thousands t)
Provides understanding for why abundance has declined and catch quotas should be reduced.

How was this inclusion decided?
● This information was presented during the annual stock assessment cycle
● Reviewed by Groundfish Plan Team and Scientific and Statistical Committee
● Presented to North Pacific Fisheries Management Council

Peer-review of ecosystem-related science program and products (TOR 7)
Nearly 170 peer-reviewed publications to date

Communication to managers, partners, stakeholders and the public (TOR 8)
● Annual presentation at Alaska Marine Science Symposium (audience ~800-1,000 people)
● Two-page briefing papers● Magazine● Presentations at North Pacific Fisheries
Management Council related meetings, Ocean Sciences, National Science Foundation, Arctic Research Council, etc.