interactions between the quality of pantograph current ... · interactions between the quality of...
TRANSCRIPT

Interactions between the quality of pantograph current collection and the codified current signalling
1E. Fedeli, 2R. Manigrasso, 2G. Bucca, 2A. Collina
RFI, Roma, Italy1; Politecnico di Milano – Department of Mechanics, Milano, Italy2
Abstract
In-line tests carried out on the Italian train called “Minuetto” showed that when two pantographs are used in order to run two coupled trains, the second pantograph suffers disturbances caused on the catenary by the passage of the first pantograph, which deteriorates the quality of current collection and causes interferences with the codified current signalling system, based on codified blocks of 50Hz current circulating in the tracks. This phenomenon is heavily dependent on the distance between the pantographs, the catenary mechanical features, the vehicle speed, the filtering system features and the train electrical drive control. The present paper discussed experimental and numerical activities used to study the problem of current collection quality in the case of collection with two closely spaced pantographs.
Introduction
The correct operation of the electrical drive of a railway vehicle and its regular run is heavily dependent on the current collection quality. The train speed is one of the most important parameters that influences the current collection quality: over the speed value of 250km/h the dynamical components of the contact force increase due to the interaction between pantograph and catenary. In these conditions the probability of contact loss occurrence between the collector strip and the contact wire is very high. In some particular conditions, the current collection quality may deteriorate even at relatively low speed, as in the case of collection with multiple pantographs. In-line tests on the Italian train called “Minuetto” (a blocked composition suburban train, which may operate in multiple, fed by the Italian 3kV d.c. catenary) indicated that current collection by means of two pantographs suffers deterioration due to the negative influence on the second pantograph of the mechanical disturbance induced on the catenary by the passage of the first pantograph. In particular, when the distance between the two pantographs in contact is close to the span length, mutual interaction between the two pantographs may be produced due to the catenary motion caused by the interaction with the first pantograph. Moreover, this phenomenon becomes more pronounced when the mechanical tension of contact wire is not very high, with values that may be half of that typical of high-speed railway lines. In this paper a procedure, schematized in Figure 1, to study the problem of current collection quality evaluation when multiple pantographs are in contact is presented. Numerical models were developed and experimental tests were carried out in order to identify the value of the main parameters used in the numerical models. The aim of the paper is to investigate possible critical interference of the low quality of current collection on the codified current signalling, based on codified blocks of 50Hz current, that flows on the rails and allows the exchange of information between the train and the railway system to assure a safe train operation. In the following paragraphs the experimental tests carried out in the laboratories of the Department of Mechanics of the Politecnico di Milano, the numerical model for the study of dynamical interaction between pantograph and catenary and the numerical model for the dynamical analysis of electrical system are described.
Experimental tests
Experimental tests on the study of physical phenomena are fundamental either to obtain measurements of main characterizing parameters or to complete and/or validate the numerical model created for the emulation of real phenomena.
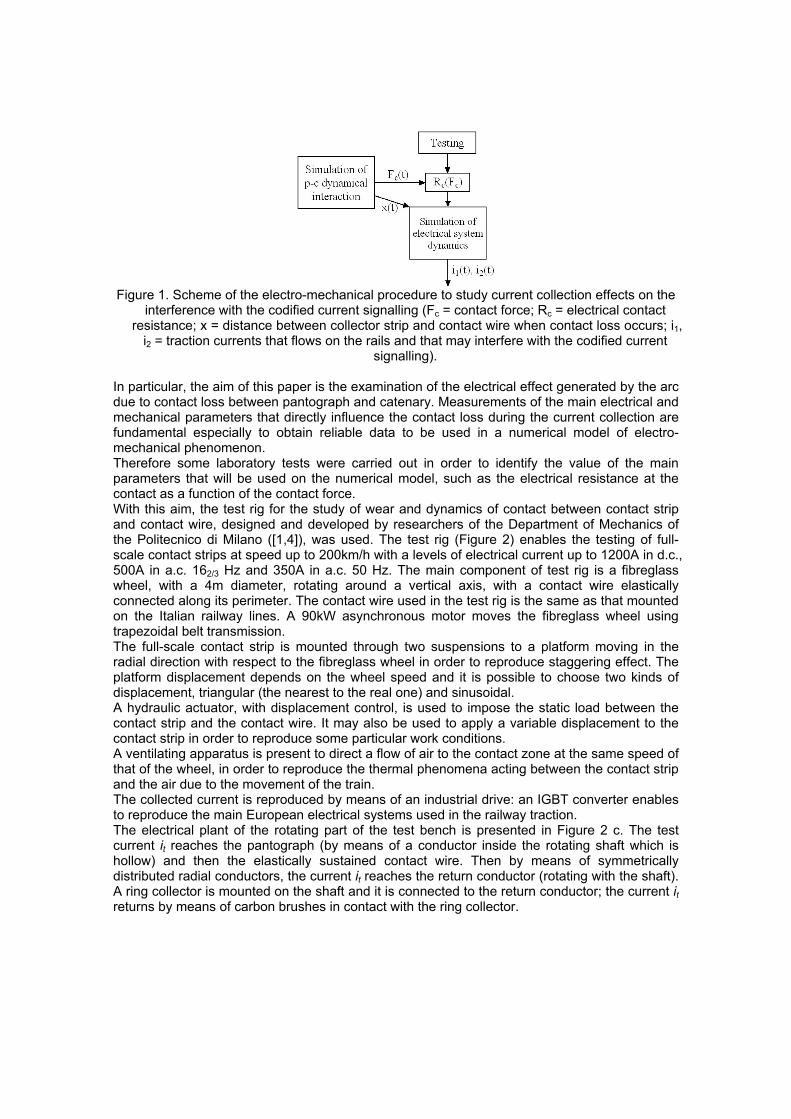
Figure 1. Scheme of the electro-mechanical procedure to study current collection effects on the
interference with the codified current signalling (Fc = contact force; Rc = electrical contact resistance; x = distance between collector strip and contact wire when contact loss occurs; i1,
i2 = traction currents that flows on the rails and that may interfere with the codified current signalling).
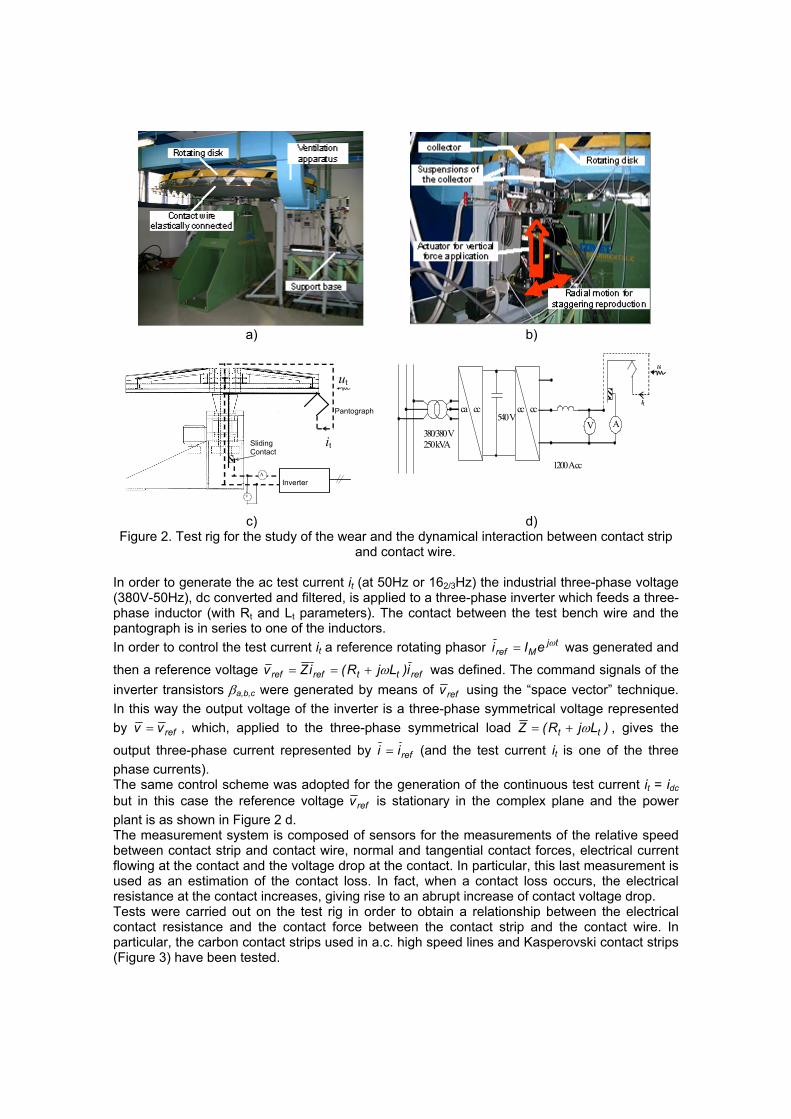
In particular, the aim of this paper is the examination of the electrical effect generated by the arc due to contact loss between pantograph and catenary. Measurements of the main electrical and mechanical parameters that directly influence the contact loss during the current collection are fundamental especially to obtain reliable data to be used in a numerical model of electro-mechanical phenomenon. Therefore some laboratory tests were carried out in order to identify the value of the main parameters that will be used on the numerical model, such as the electrical resistance at the contact as a function of the contact force. With this aim, the test rig for the study of wear and dynamics of contact between contact strip and contact wire, designed and developed by researchers of the Department of Mechanics of the Politecnico di Milano ([1,4]), was used. The test rig (Figure 2) enables the testing of full-scale contact strips at speed up to 200km/h with a levels of electrical current up to 1200A in d.c., 500A in a.c. 162/3 Hz and 350A in a.c. 50 Hz. The main component of test rig is a fibreglass wheel, with a 4m diameter, rotating around a vertical axis, with a contact wire elastically connected along its perimeter. The contact wire used in the test rig is the same as that mounted on the Italian railway lines. A 90kW asynchronous motor moves the fibreglass wheel using trapezoidal belt transmission. The full-scale contact strip is mounted through two suspensions to a platform moving in the radial direction with respect to the fibreglass wheel in order to reproduce staggering effect. The platform displacement depends on the wheel speed and it is possible to choose two kinds of displacement, triangular (the nearest to the real one) and sinusoidal. A hydraulic actuator, with displacement control, is used to impose the static load between the contact strip and the contact wire. It may also be used to apply a variable displacement to the contact strip in order to reproduce some particular work conditions. A ventilating apparatus is present to direct a flow of air to the contact zone at the same speed of that of the wheel, in order to reproduce the thermal phenomena acting between the contact strip and the air due to the movement of the train. The collected current is reproduced by means of an industrial drive: an IGBT converter enables to reproduce the main European electrical systems used in the railway traction. The electrical plant of the rotating part of the test bench is presented in Figure 2 c. The test current it reaches the pantograph (by means of a conductor inside the rotating shaft which is hollow) and then the elastically sustained contact wire. Then by means of symmetrically distributed radial conductors, the current it reaches the return conductor (rotating with the shaft). A ring collector is mounted on the shaft and it is connected to the return conductor; the current it returns by means of carbon brushes in contact with the ring collector.
a) b)
Pantograph
Inverter
Sliding Contact
A
V
ut
it
Vi
ca cc
cc cc 540 V
1200 A cc
380/380 V 250 kVA
V A
ut
it
c) d) Figure 2. Test rig for the study of the wear and the dynamical interaction between contact strip
and contact wire. In order to generate the ac test current it (at 50Hz or 162/3Hz) the industrial three-phase voltage (380V-50Hz), dc converted and filtered, is applied to a three-phase inverter which feeds a three-phase inductor (with Rt and Lt parameters). The contact between the test bench wire and the pantograph is in series to one of the inductors. In order to control the test current it a reference rotating phasor tj
Mref eIi ω= was generated and
then a reference voltage refttrefref i)LjR(iZv ω+== was defined. The command signals of the inverter transistors βa,b,c were generated by means of refv using the “space vector” technique. In this way the output voltage of the inverter is a three-phase symmetrical voltage represented by refvv = , which, applied to the three-phase symmetrical load )LjR(Z tt ω+= , gives the
output three-phase current represented by refii = (and the test current it is one of the three phase currents). The same control scheme was adopted for the generation of the continuous test current it = idc but in this case the reference voltage refv is stationary in the complex plane and the power plant is as shown in Figure 2 d. The measurement system is composed of sensors for the measurements of the relative speed between contact strip and contact wire, normal and tangential contact forces, electrical current flowing at the contact and the voltage drop at the contact. In particular, this last measurement is used as an estimation of the contact loss. In fact, when a contact loss occurs, the electrical resistance at the contact increases, giving rise to an abrupt increase of contact voltage drop. Tests were carried out on the test rig in order to obtain a relationship between the electrical contact resistance and the contact force between the contact strip and the contact wire. In particular, the carbon contact strips used in a.c. high speed lines and Kasperovski contact strips (Figure 3) have been tested.
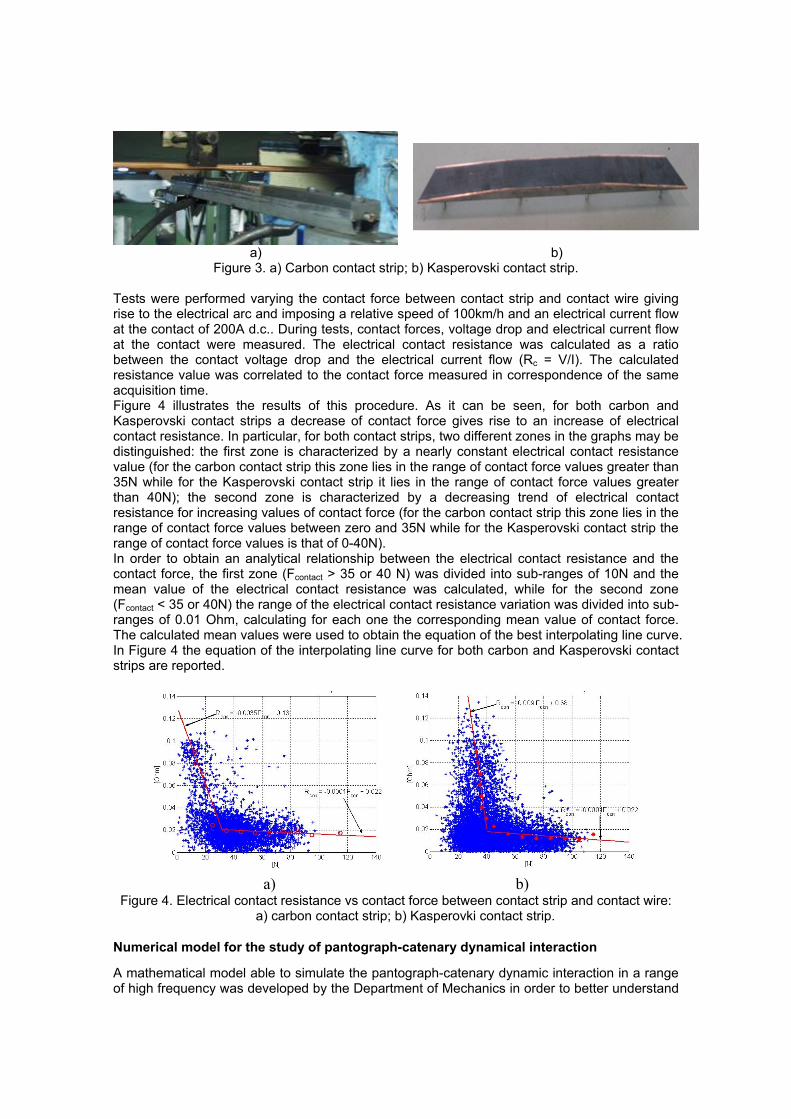
a) b) Figure 3. a) Carbon contact strip; b) Kasperovski contact strip.
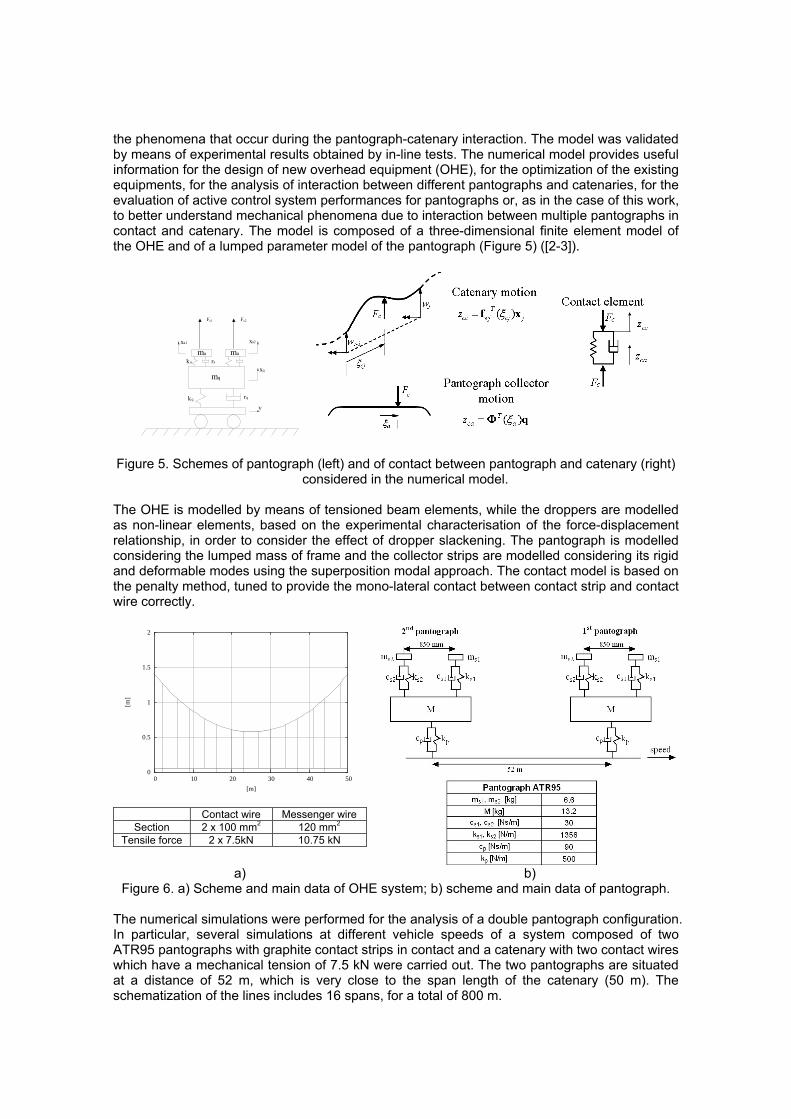
Tests were performed varying the contact force between contact strip and contact wire giving rise to the electrical arc and imposing a relative speed of 100km/h and an electrical current flow at the contact of 200A d.c.. During tests, contact forces, voltage drop and electrical current flow at the contact were measured. The electrical contact resistance was calculated as a ratio between the contact voltage drop and the electrical current flow (Rc = V/I). The calculated resistance value was correlated to the contact force measured in correspondence of the same acquisition time. Figure 4 illustrates the results of this procedure. As it can be seen, for both carbon and Kasperovski contact strips a decrease of contact force gives rise to an increase of electrical contact resistance. In particular, for both contact strips, two different zones in the graphs may be distinguished: the first zone is characterized by a nearly constant electrical contact resistance value (for the carbon contact strip this zone lies in the range of contact force values greater than 35N while for the Kasperovski contact strip it lies in the range of contact force values greater than 40N); the second zone is characterized by a decreasing trend of electrical contact resistance for increasing values of contact force (for the carbon contact strip this zone lies in the range of contact force values between zero and 35N while for the Kasperovski contact strip the range of contact force values is that of 0-40N). In order to obtain an analytical relationship between the electrical contact resistance and the contact force, the first zone (Fcontact > 35 or 40 N) was divided into sub-ranges of 10N and the mean value of the electrical contact resistance was calculated, while for the second zone (Fcontact < 35 or 40N) the range of the electrical contact resistance variation was divided into sub-ranges of 0.01 Ohm, calculating for each one the corresponding mean value of contact force. The calculated mean values were used to obtain the equation of the best interpolating line curve. In Figure 4 the equation of the interpolating line curve for both carbon and Kasperovski contact strips are reported.
a) b)
Figure 4. Electrical contact resistance vs contact force between contact strip and contact wire: a) carbon contact strip; b) Kasperovki contact strip.
Numerical model for the study of pantograph-catenary dynamical interaction
A mathematical model able to simulate the pantograph-catenary dynamic interaction in a range of high frequency was developed by the Department of Mechanics in order to better understand
the phenomena that occur during the pantograph-catenary interaction. The model was validated by means of experimental results obtained by in-line tests. The numerical model provides useful information for the design of new overhead equipment (OHE), for the optimization of the existing equipments, for the analysis of interaction between different pantographs and catenaries, for the evaluation of active control system performances for pantographs or, as in the case of this work, to better understand mechanical phenomena due to interaction between multiple pantographs in contact and catenary. The model is composed of a three-dimensional finite element model of the OHE and of a lumped parameter model of the pantograph (Figure 5) ([2-3]).
xa1 xa2
maak ra
kq rq
xq
v
qm
ma
Fc1 Fc2
Figure 5. Schemes of pantograph (left) and of contact between pantograph and catenary (right) considered in the numerical model.
The OHE is modelled by means of tensioned beam elements, while the droppers are modelled as non-linear elements, based on the experimental characterisation of the force-displacement relationship, in order to consider the effect of dropper slackening. The pantograph is modelled considering the lumped mass of frame and the collector strips are modelled considering its rigid and deformable modes using the superposition modal approach. The contact model is based on the penalty method, tuned to provide the mono-lateral contact between contact strip and contact wire correctly.
0
0.5
1
1.5
2
0 10 20 30 40 50
[m]
[m]
Contact wire Messenger wireSection 2 x 100 mm2 120 mm2
Tensile force 2 x 7.5kN 10.75 kN
a) b) Figure 6. a) Scheme and main data of OHE system; b) scheme and main data of pantograph.
The numerical simulations were performed for the analysis of a double pantograph configuration. In particular, several simulations at different vehicle speeds of a system composed of two ATR95 pantographs with graphite contact strips in contact and a catenary with two contact wires which have a mechanical tension of 7.5 kN were carried out. The two pantographs are situated at a distance of 52 m, which is very close to the span length of the catenary (50 m). The schematization of the lines includes 16 spans, for a total of 800 m.

Simulation results show that the first pantograph produces an uplift of contact wire which gives rise to a significant interfering motion with the second pantograph. This last, in fact, is in contact with a disturbed contact wire which has a vertical oscillating motion (due to the time delay related to the train speed and pantograph distances), in phase with the uplift due to the second pantograph contact force. This interaction causes high amplitudes of the oscillating motion and an increase of the contact loss percentage of the second pantograph. Figure 7 a shows the contact wire uplift under suspension due to the passage of the two pantographs when simulated train speed is equal to 130km/h and the static contact force is equal to 90N. As can be seen the uplift due to the passage of the second pantograph is greater than that due to the first pantograph (Figure 7 a). Current collection quality is evaluated analysing the contact force time history: as an example, in Figure 7 c and d the time histories of contact force for the two collector strips of the first and the second pantographs are shown. As it is possible to notice, contact forces of the second pantograph have high variations in comparison to the first pantograph and the current collection quality suffers a deterioration due to the phenomenon described above.
0 5 10 15 20 25-60
-40
-20
0
20
40
60
80
100
[s]
Upl
ift [m
m]
Uplift of catenary under suspension
1st pantograph
2nd pantograph
0 5 10 15 200
1
2
3
4
5
6
[s]
[mm
]
Distance between 2nd pantograph collectors and contact wire
1st collector strip2nd collector strip
a) b)
0 5 10 15 200
50
100
150
200
[s]
[N]
Contact forces of 1st pantograph
1st collector strip2nd collector strip
0 5 10 15 200
50
100
150
200
250
[s]
[N]
Contact forces of 2nd pantograph
1st collector strip2ndcollector strip
c) d)
Figure 7. a) Uplift of catenary under suspension due to the passage of first and second pantographs (ut =130km/h, Fc,stat=90N); b) distance between collectors strips of second
pantograph and contact wire (ut=130km/h, Fc,stat=90N); c) and d) contact forces of the two collector strips of first and second pantographs (ut =130km/h, Fc,stat=90N).
The numerical model is able to provide the distance between the collector strip and the contact wire when a contact loss occurs (Figure 7 b). This variable is used, as explained below, to calculate the voltage drop at the contact during the contact loss.
The model of the electrical dynamics of the two pantographs
The electrical dynamics of the two pantographs in contact were determined by means of the model presented in Figure 8. The following sub-systems were considered for each of the two coupled pantographs: i) the contact voltage vc between pantograph and catenary; ii) the input filter LC; iii) the traction drive (represented by the current generator it); iv) the protection apparatus PA of the signalling circuit (the harmonic analyzer “Franchini”). The characteristics of these subsystems are as follows.

The contact voltage vc with traction current it and speed ut of the trains was evaluated in different ways in accordance with the dynamic evolution of the contact forces Fc,i1 and Fc,i2 between the two collector strips of the pantograph and the contact wire. When both the collector strips are in contact, the contact voltage has been calculated as:
vf1
i1
PA2
IR2
2ti
IR1
PA1
1ti
vc1 vc2
i2
vf2
V
ut
l
L L
C C
vc2
Figure 8. The model for the electrical dynamics of the two pantographs.
t2i,c2i,c1i,c1i,c
2i,c2i,c1i,c1i,cc i
)F(R)F(R)F(R)F(R
v+⋅
= (1)
The mean contact resistance Rc was evaluated as a function of the dynamical contact force Fc using the test bench equipped with a carbon contact strip (with current it = idc and speed of the cooling air ut). As shown in Figure 4 a, the result can be represented by the function:
⎪⎩
⎪⎨
⎧
>+⋅−=
≤<+⋅−=
N35Ffor022.0F0001.0R
N35F0for13.0F0035.0R
ccc
ccc
(2)
obtained with it = 200A and ut = 100km/h. The arc voltage va between contact strip and contact wire when their distance during the contact loss is x(t) (with mean arc current ia and speed of the cooling air ut) was modelled as follows. A simulation software program of the test rig system was prepared, taking into account the real elastic suspensions and the contact wire irregularity. Using this numerical model the maximum xM of x(t) was evaluated for a static load Fc,stat of the pantograph. The maximum arc voltage vaM with mean impressed arc current ia was measured with the same static load Fc,stat and ut = 100km/h using the test rig. Then the values va and ia were related in the arc model as va = (vaM / xM)·x(t) where the constant (vaM / xM) is considered about 250V/mm with ia = 200A and ut = 100km/h. Here below, in order to simplify the analysis, the same arc constant (vaM / xM)=250V/mm will be used when the speed ut and the line current it of each coupled train are in the range 100<ut<130km/h and 150<it<250A. The main switch IR of each coupled train can be operated by the protection apparatus PA of the signalling current as will be discussed later. The aim of the LC low pass input filter (L = 63mH; C = 1mF) is to limit the presence of a 50Hz component in the traction current due to traction converter or to the asymmetries of the diodes of the traction plant ac/dc converter. The model of the traction apparatus depends on the design of the traction controller. In particular if the reference torque Tref is designed to vary (for smoothing purposes) according to the voltage oscillations of the filter capacitor vf, the traction apparatus can be represented by a
constant current generator it. In fact if the actual torque of the traction motors fref vTT ≡≈ , as the input power of the traction apparatus is ΩTiv tf = (where the motor speed Ω is constant when the catenary and pantograph lose contact) then it is constant. The protection apparatus PA approved by RFI against the circulation of a 50Hz component in the traction current which may interfere with the codified current signalling has an electromagnetic current transducer and the measured current is treated by a pass-band filter (the pass-band is 47-51.7Hz). If the maximum value of the output current of the filter exceeds 1A for more than 0.5s then an opening command of the main switch IR is generated. The command becomes operative if the output current exceeds 1A for more than 2.5s. In any case the performance of the train is reduced when the output current of the filter exceeds 0.8A.
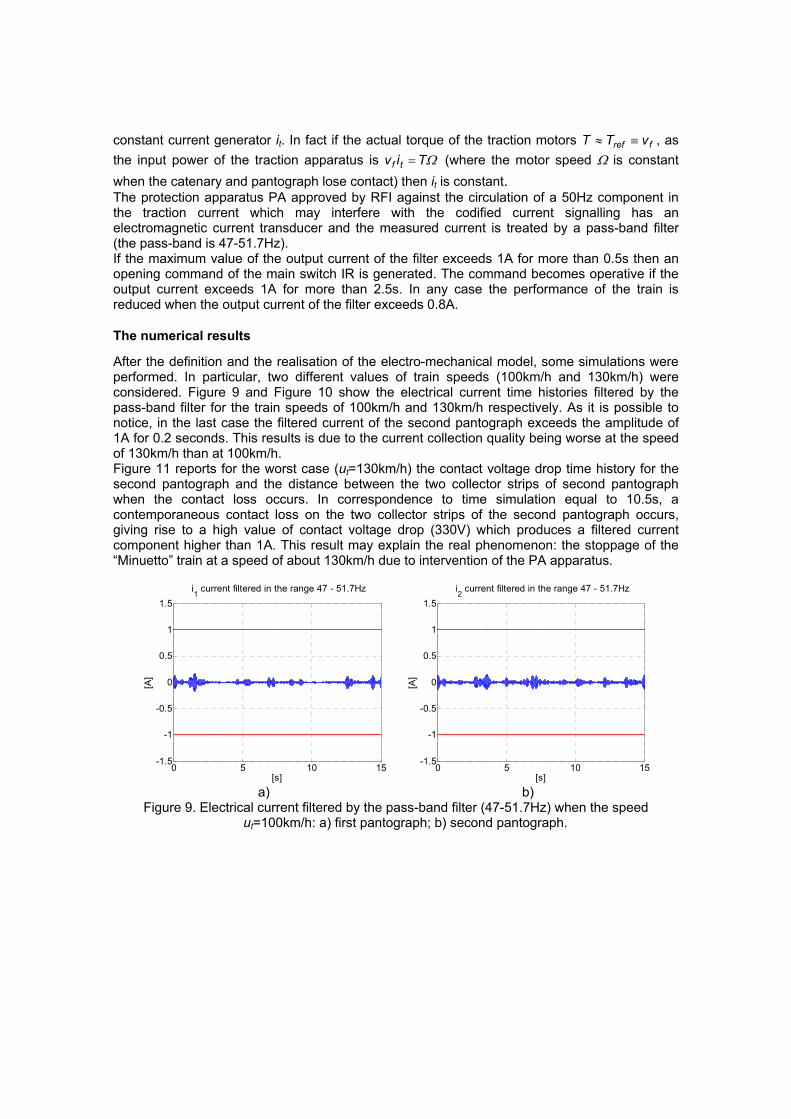
The numerical results
After the definition and the realisation of the electro-mechanical model, some simulations were performed. In particular, two different values of train speeds (100km/h and 130km/h) were considered. Figure 9 and Figure 10 show the electrical current time histories filtered by the pass-band filter for the train speeds of 100km/h and 130km/h respectively. As it is possible to notice, in the last case the filtered current of the second pantograph exceeds the amplitude of 1A for 0.2 seconds. This results is due to the current collection quality being worse at the speed of 130km/h than at 100km/h. Figure 11 reports for the worst case (ut=130km/h) the contact voltage drop time history for the second pantograph and the distance between the two collector strips of second pantograph when the contact loss occurs. In correspondence to time simulation equal to 10.5s, a contemporaneous contact loss on the two collector strips of the second pantograph occurs, giving rise to a high value of contact voltage drop (330V) which produces a filtered current component higher than 1A. This result may explain the real phenomenon: the stoppage of the “Minuetto” train at a speed of about 130km/h due to intervention of the PA apparatus.
0 5 10 15-1.5
-1
-0.5
0
0.5
1
1.5
[s]
[A]
i1 current filtered in the range 47 - 51.7Hz
0 5 10 15-1.5
-1
-0.5
0
0.5
1
1.5
[s]
[A]
i2 current filtered in the range 47 - 51.7Hz
a) b)
Figure 9. Electrical current filtered by the pass-band filter (47-51.7Hz) when the speed ut=100km/h: a) first pantograph; b) second pantograph.

0 5 10 15-1.5
-1
-0.5
0
0.5
1
1.5
[s]
[A]
i1 current filtered in the range 47 - 51.7Hz
0 5 10 15-2
-1.5
-1
-0.5
0
0.5
1
1.5
2
[s]
[A]
i2 current filtered in the range 47 - 51.7Hz
a) b)
Figure 10. Electrical current filtered by the pass-band filter (47-51.7Hz) when the speed ut=130km/h: a) first pantograph; b) second pantograph.
0 5 10 150
50
100
150
200
250
300
350
[s]
[V]
Contact voltage drop vc2
0 5 10 15 200
1
2
3
4
5
6
[s]
[mm
]Distance between 2nd pantograph collectors and contact wire
1st collector strip2nd collector strip
a) b) Figure 11. a) Contact voltage drop of second pantograph (ut=130km/h); b) distance between
collector strips of second pantograph and contact wire when contact loss occurs (ut=130km/h).
Conclusions
In this paper an electro-mechanical model able to study the phenomena that occur when two pantographs are used to run coupled trains was presented. In particular, the deterioration of the current collection quality and codified current signalling interference due to the disturbances caused by the passage of the first pantograph were analysed. Experiments were carried out with the test rig of the Politecnico di Milano to tune and determine realistic parameters to be used for modelling. Preliminary results showed that the model is able to evidence the real behaviour of the system. Further experiments are being carried out to find a better relationship between arc voltage and distance between the contact strip and the contact wire.
References
[1] M. Bocciolone, G. Bucca, A. Collina, F. Mapelli. “A test rig for the comparative evaluation of the performance of collector strips”, Railway Engineering Conference, London, UK, 2004.
[2] S. Bruni, G. Bucca, A. Collina, A. Facchinetti, S. Melzi. “Pantograph-catenary dynamic interaction in the medium-high frequency range”, XVIII IAVSD Symposium, Japan, 2003.
[3] A. Collina, S. Bruni. “Numerical simulation of pantograph-overhead equipment interaction”, Vehicle System Dynamics, Vol. 38(n.4), pp.261-291, 2002.
[4] G. Diana, R. Manigrasso, M. Bocciolone, F. Mapelli, A. Collina. “Banco prova materiali per striscianti” (“Test bench for material strip”), Ingegneria Ferroviaria, n. 3, pp. 295-301. [3]