interactive map visualization of large datasets in analytic ... -...
TRANSCRIPT

Setup
SSL VPN Instructions
See separate handout for detailed instructions.
Connect to the clear-guest wifi network. Use the daily password provided. Access a public site (like www.oracle.com) to verify connectivity.
Connect to the Array SSL-VPN site at the provided URL using IE/Firefox/Safari (Chrome is not supported). Sign in using the username/password combination provided by the HoL instructors.
Once VPN is enabled use Remote Desktop to connect to the HoL client machine using the machine IP and credentials provided by the HoL instructors will.
Once connected to the client machine in Remote Desktop, start up Firefox.
Open workshop launchpad
Using Firefox in the client machine, navigate to [ip address]:7777 using the server IP address provided by the HoL instructors. For example, for an address 10.146.52.38, point the browser to 10.146.52.38:7777. You should see the following page.
Introduction
The purpose of this lab is to provide hands-on experience with a new feature of MapViewer 12.2.1 that renders a theme as tiles generated at run-time (i.e., when queried). This feature is known as Dynamic Tile Layers (or DTL) and is useful for displaying frequently updated content, such as smart meter data or moving asset locations, in operational applications.

A DTL is a theme (Vector, Raster, WMS) which is rendered as tiles at run-time. DTLs are particularly effective when used in concert with UTF Grids (explained below) for relatively static layers to provide additional context that can be turned on or off in a map display.
Storm demo with DTL
This is a modified version of the storm demo which is part of the MVDEMO sample that displays all 50 years of storm locations (wind, hail, tornado), instead of year by year.
The layers (wind, hail, tornado) are rendered as tiles at query time. The query includes non-spatial columns such as Year, Month, Day, Loss (property loss in millions), Crop Loss, Fatalities, and Injuries. This information is used to populate a grid of a specified cell size (e.g. 4x4 pixels) which contains the column values for one of the points (the default is the one with a max value for a column such as Loss) that fall within the grid. So if 4 wind storm locations fall within a grid cell then the info-window which is displayed when the user clicks on that grid cell is the storm with the max (property) loss value.
While the demo shows fixed (historical) storm locations the layers could equally well have been locations of mobile assets, smart-meter readings, or locations of people Tweeting about the Patriots from their Android device.
Since the layers are just JDBC queries or predefined themes, they can also be filtered by non-spatial attributes such as “property loss > 1 (million)”. Similarly they can be rendered using an advanced style.

The next few sections briefly introduce MapViewer, Dynamic Tile Layers, UTF Grids, and the MVDEMO sample application.
Oracle MapViewer
MapViewer is a toolkit consisting of server and client JEE and Javascript components for incorporating interactive maps and spatial analysis in browser-based applications. While it is optimized to work with Oracle Spatial & Graph, the data and background maps can come from external sources such as GeoJSON, WFS, WMS ,and online map services such as HERE, Bing, or OpenStreetMap.
The Javascript library (aka Oracle Maps V2) leverages HTML5 and provides rich interactivity. The server component (deployed in a JEE container such as Weblogic Server or Glassfish) performs the database queries and serves up the data to be rendered in the HTML5 client.
Dynamic Tile Layers
Dynamic tile layers (DTL) are layers (themes) that are defined programmatically (i.e. only by using the OM.layer.DynamicTileLayer Oracle Maps V2 API object). Unlike predefined layers (themes) the definition is not stored in the USER_SDO_THEMES or USER_SDO_CACHED_MAPS metadata views.
A DTL is similar to a JDBC theme or layer in the sense that it is defined in client code via the API. It differs from a JDBC layer in that it must have an associated tile layer configuration object which specifies the Universe (SRID, zoom levels, extent) and tile image size (e.g. 256x256 pixels). This is because a DTL is rendered as tiles at run-time.
DTLs are rendered as tiles and require a Tile Layer configuration which specifies tile size, number of zoom levels, and extent. When displayed on a background map tile layer, a DTL can inherit the configuration of the background map tile layer. When displayed alone a DTL requires a fully specified tile configuration object as described below.
A DTL code example
A DTL needs a tile layer configuration, i.e. a Universe and tile image size. The following two lines create those
configuration objects. The third line specifies the MapViewer URL.
var myuniv = new OM.universe.LatLonUniverse();
var myconfig = new OM.layer.TileLayerConfig(
{
tileImageWidth: 256,
tileImageHeight: 256
});
var basemvURL = http://myapp.mycorp.com/mapviewer; //a MapViewer instance URL
Once we have the tile specification we can define a DTL using OM.layer.DynamicTileLayer. We’ll use the SQL (JDBC) query based Tornado layer from the Storm demo described above as an example.
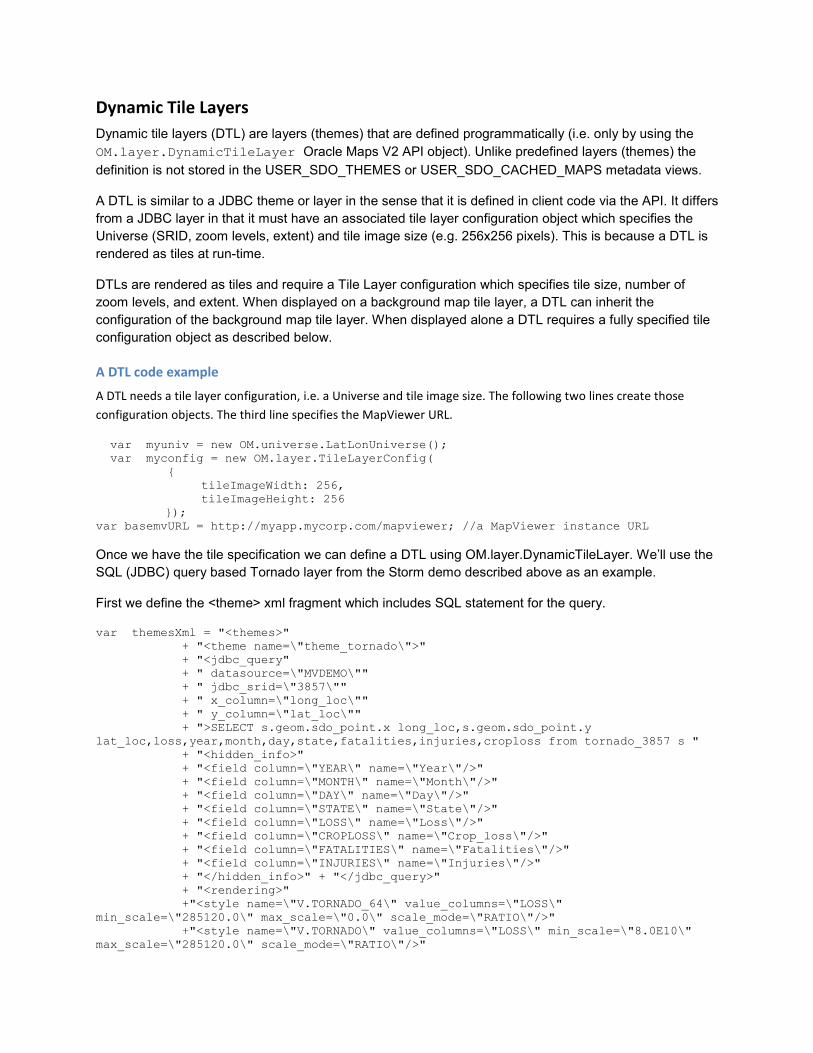
First we define the <theme> xml fragment which includes SQL statement for the query.
var themesXml = "<themes>"
+ "<theme name=\"theme_tornado\">"
+ "<jdbc_query"
+ " datasource=\"MVDEMO\""
+ " jdbc_srid=\"3857\""
+ " x_column=\"long_loc\""
+ " y_column=\"lat_loc\""
+ ">SELECT s.geom.sdo_point.x long_loc,s.geom.sdo_point.y
lat_loc,loss,year,month,day,state,fatalities,injuries,croploss from tornado_3857 s "
+ "<hidden_info>"
+ "<field column=\"YEAR\" name=\"Year\"/>"
+ "<field column=\"MONTH\" name=\"Month\"/>"
+ "<field column=\"DAY\" name=\"Day\"/>"
+ "<field column=\"STATE\" name=\"State\"/>"
+ "<field column=\"LOSS\" name=\"Loss\"/>"
+ "<field column=\"CROPLOSS\" name=\"Crop_loss\"/>"
+ "<field column=\"FATALITIES\" name=\"Fatalities\"/>"
+ "<field column=\"INJURIES\" name=\"Injuries\"/>"
+ "</hidden_info>" + "</jdbc_query>"
+ "<rendering>"
+"<style name=\"V.TORNADO_64\" value_columns=\"LOSS\"
min_scale=\"285120.0\" max_scale=\"0.0\" scale_mode=\"RATIO\"/>"
+"<style name=\"V.TORNADO\" value_columns=\"LOSS\" min_scale=\"8.0E10\"
max_scale=\"285120.0\" scale_mode=\"RATIO\"/>"
+ "</rendering>"
+ "</theme>"
+ "</themes>";
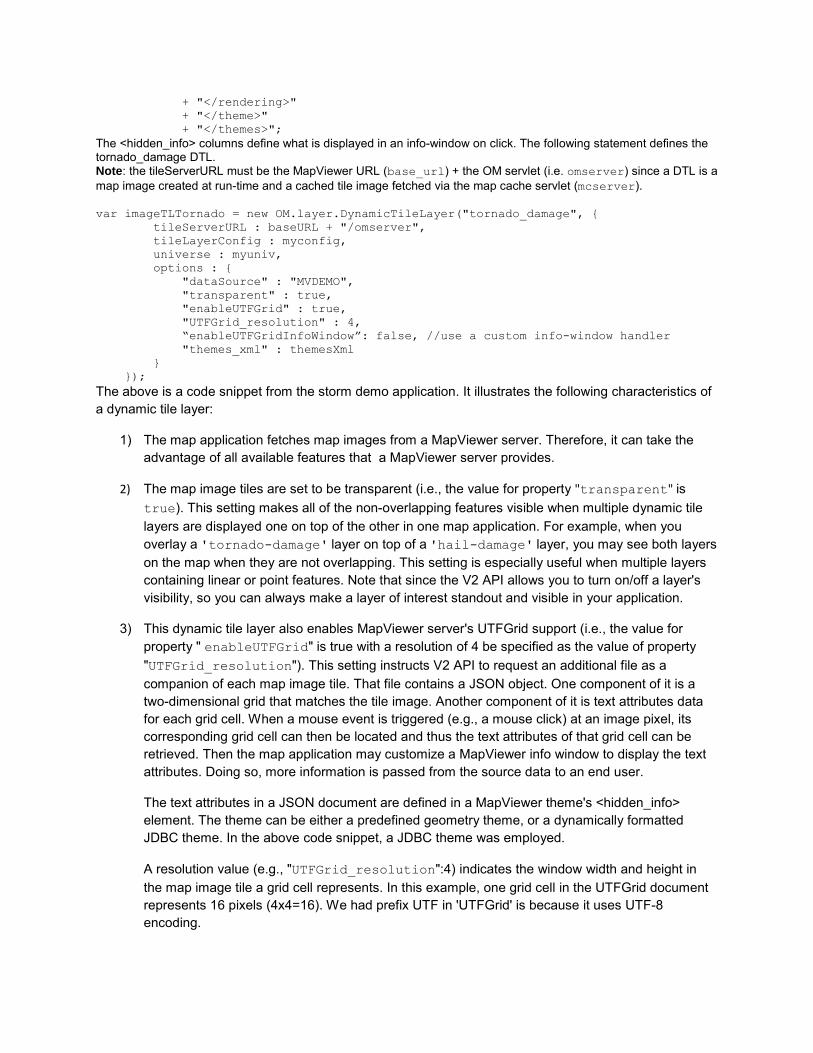
The <hidden_info> columns define what is displayed in an info-window on click. The following statement defines the tornado_damage DTL. Note: the tileServerURL must be the MapViewer URL (base_url) + the OM servlet (i.e. omserver) since a DTL is a map image created at run-time and a cached tile image fetched via the map cache servlet (mcserver). var imageTLTornado = new OM.layer.DynamicTileLayer("tornado_damage", {
tileServerURL : baseURL + "/omserver",
tileLayerConfig : myconfig,
universe : myuniv,
options : {
"dataSource" : "MVDEMO",
"transparent" : true,
"enableUTFGrid" : true,
"UTFGrid_resolution" : 4,
“enableUTFGridInfoWindow”: false, //use a custom info-window handler
"themes_xml" : themesXml
}
});
The above is a code snippet from the storm demo application. It illustrates the following characteristics of a dynamic tile layer:
1) The map application fetches map images from a MapViewer server. Therefore, it can take the advantage of all available features that a MapViewer server provides.
2) The map image tiles are set to be transparent (i.e., the value for property "transparent" is
true). This setting makes all of the non-overlapping features visible when multiple dynamic tile layers are displayed one on top of the other in one map application. For example, when you overlay a 'tornado-damage' layer on top of a 'hail-damage' layer, you may see both layers on the map when they are not overlapping. This setting is especially useful when multiple layers containing linear or point features. Note that since the V2 API allows you to turn on/off a layer's visibility, so you can always make a layer of interest standout and visible in your application.
3) This dynamic tile layer also enables MapViewer server's UTFGrid support (i.e., the value for property " enableUTFGrid" is true with a resolution of 4 be specified as the value of property "UTFGrid_resolution"). This setting instructs V2 API to request an additional file as a companion of each map image tile. That file contains a JSON object. One component of it is a two-dimensional grid that matches the tile image. Another component of it is text attributes data for each grid cell. When a mouse event is triggered (e.g., a mouse click) at an image pixel, its corresponding grid cell can then be located and thus the text attributes of that grid cell can be retrieved. Then the map application may customize a MapViewer info window to display the text attributes. Doing so, more information is passed from the source data to an end user.
The text attributes in a JSON document are defined in a MapViewer theme's <hidden_info> element. The theme can be either a predefined geometry theme, or a dynamically formatted JDBC theme. In the above code snippet, a JDBC theme was employed.
A resolution value (e.g., "UTFGrid_resolution":4) indicates the window width and height in the map image tile a grid cell represents. In this example, one grid cell in the UTFGrid document represents 16 pixels (4x4=16). We had prefix UTF in 'UTFGrid' is because it uses UTF-8 encoding.

When this UTF Grid is included with a map tile layer, a mouse click will be associated with a cell in the UTF Grid. If a feature is present at the mouse click location, the cell will contain a character which in turn will be associated with attribute(s). Those attributes are then leveraged for interaction such as info windows. It is important to recognize the inherit trade off associated with a gridded representation of layer attributes: performance and scalability are improved while detailed accuracy is reduced.
MVDEMO Sample Application
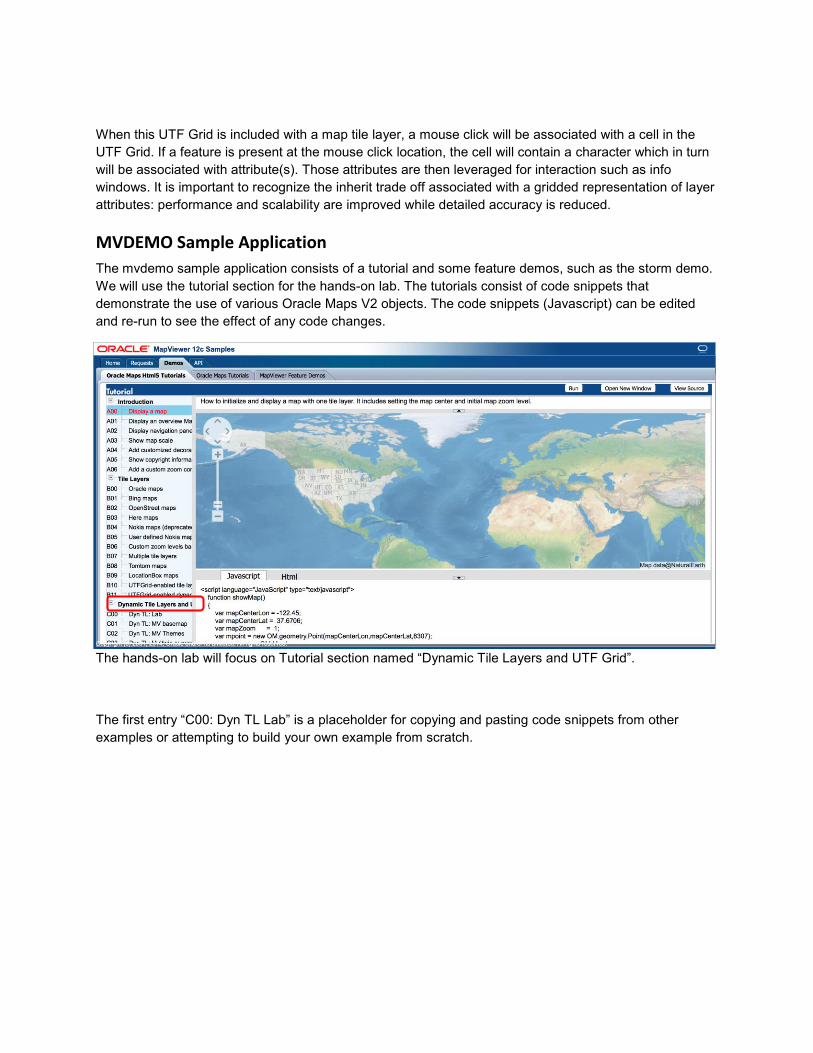
The mvdemo sample application consists of a tutorial and some feature demos, such as the storm demo. We will use the tutorial section for the hands-on lab. The tutorials consist of code snippets that demonstrate the use of various Oracle Maps V2 objects. The code snippets (Javascript) can be edited and re-run to see the effect of any code changes.
The hands-on lab will focus on Tutorial section named “Dynamic Tile Layers and UTF Grid”.
The first entry “C00: Dyn TL Lab” is a placeholder for copying and pasting code snippets from other examples or attempting to build your own example from scratch.

Lab
MapViewer Console
- Open MapViewer Console from launchpad
- log in using admin/welcome1
- Review Admin, Metadata, Configuration tabs

MVDEMO overview
Open MVDMEO from launchpad
Click on Oracle Maps Html5 Tutorial link at bottom of page
Explore demo categories and observe Run button used to refresh map with code changes
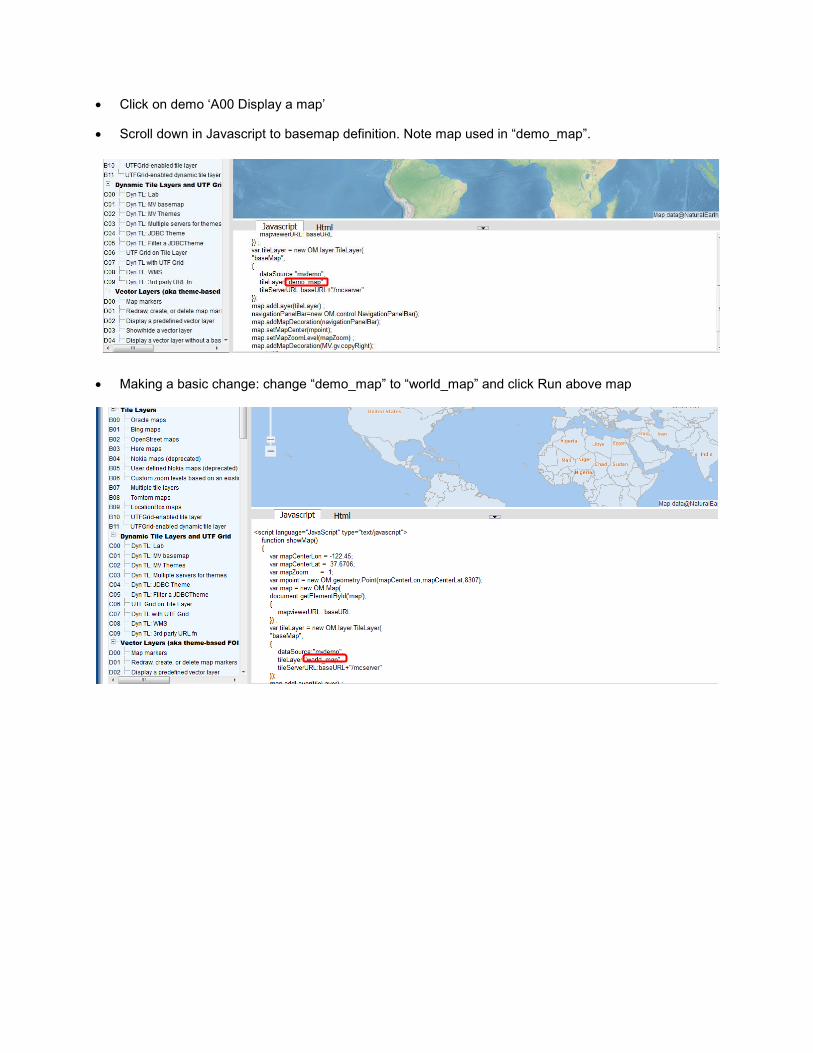
Click on demo ‘A00 Display a map’
Scroll down in Javascript to basemap definition. Note map used in “demo_map”.
Making a basic change: change “demo_map” to “world_map” and click Run above map

Dynamic Tile Layers
Dynamic Tile Layer based on predefined basemap
o Open “C01 - Dyn TL: MV basemap”
o Observe Dynamic Tile Layer defined using basemap
o Change basemap from ‘demo_map’ to ‘world_map’ and click Run
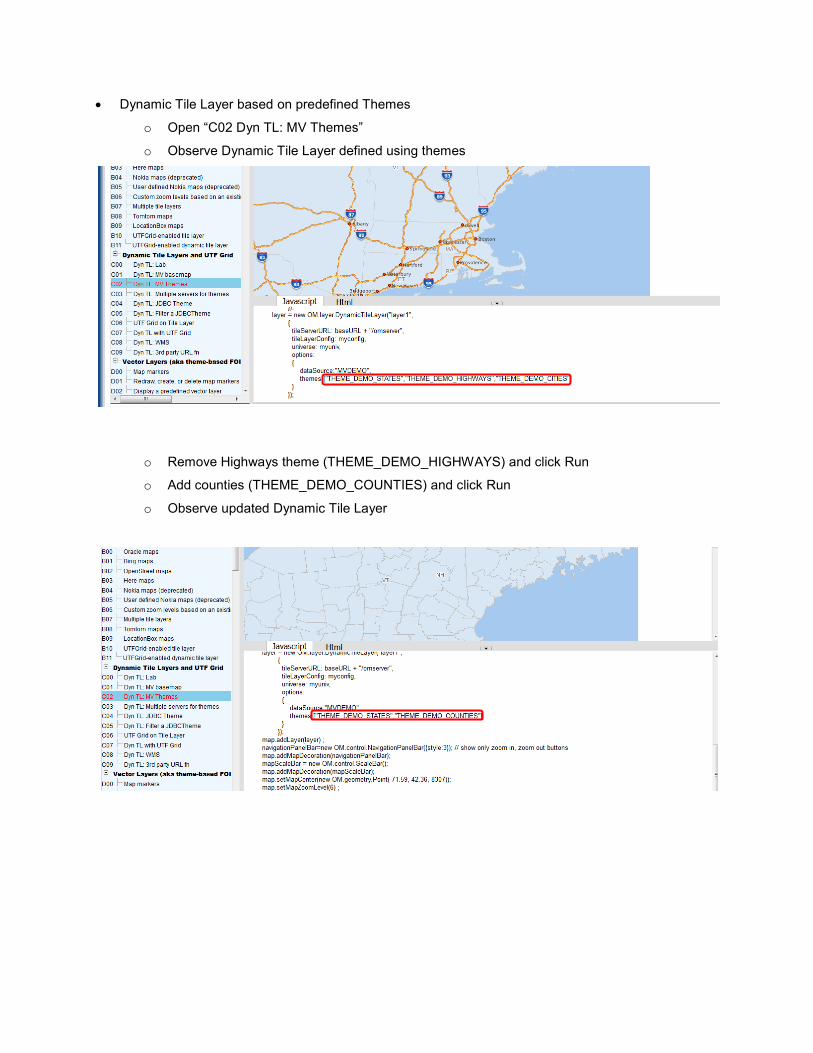
Dynamic Tile Layer based on predefined Themes
o Open “C02 Dyn TL: MV Themes”
o Observe Dynamic Tile Layer defined using themes
o Remove Highways theme (THEME_DEMO_HIGHWAYS) and click Run
o Add counties (THEME_DEMO_COUNTIES) and click Run
o Observe updated Dynamic Tile Layer

Dynamic Tile Layer from multiple MapViewer server instances
o Open “CO3 Dyn TL: Multiple servers for themes”
o Note ability to source from alternate MapViewer server instance
o Exercise not part of lab as our environment does not allow external internet access
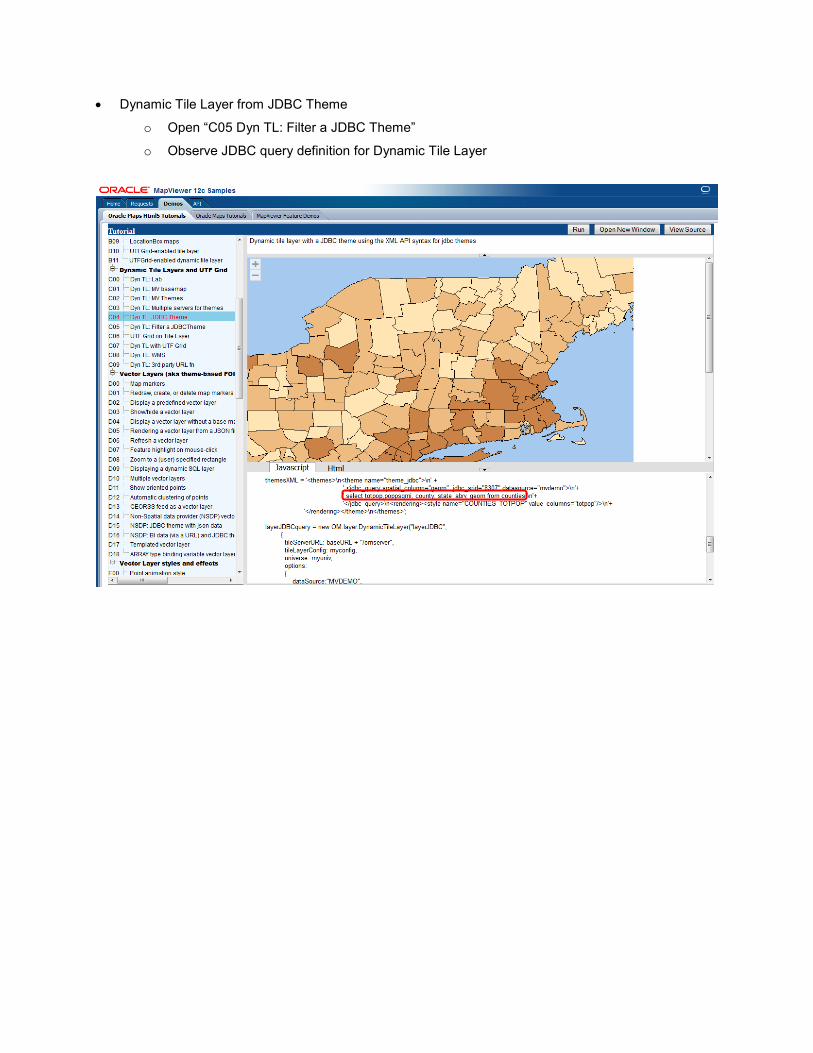
Dynamic Tile Layer from JDBC Theme
o Open “C05 Dyn TL: Filter a JDBC Theme”
o Observe JDBC query definition for Dynamic Tile Layer
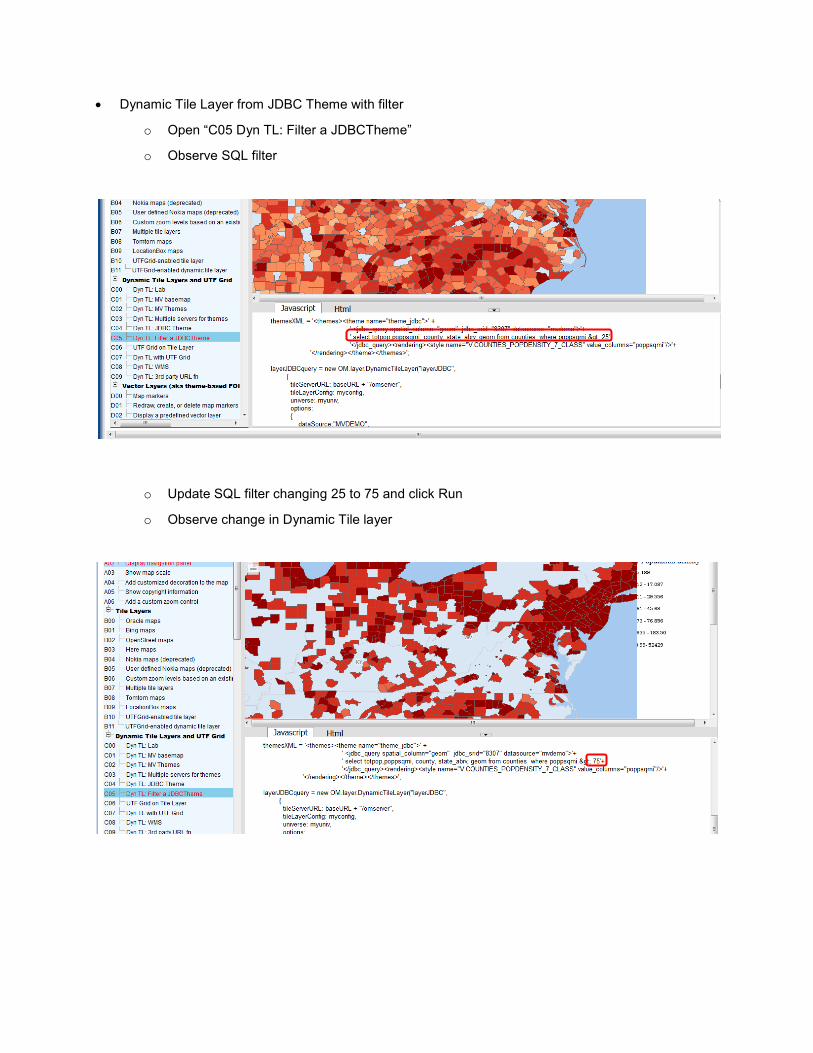
Dynamic Tile Layer from JDBC Theme with filter
o Open “C05 Dyn TL: Filter a JDBCTheme”
o Observe SQL filter
o Update SQL filter changing 25 to 75 and click Run
o Observe change in Dynamic Tile layer

UTF Grid
UTF Grid on predefined tile layer
o Open “C06 UTF Grid on Tile Layer”
o Observe UTF Grid enabled
o Click on map and observe UTF Grid-based info window
o Update tile layer source from “county_utf_grid_tl” to “utfgrid_tl” and click Run
o Click on map and observe UTF Grid-based info window
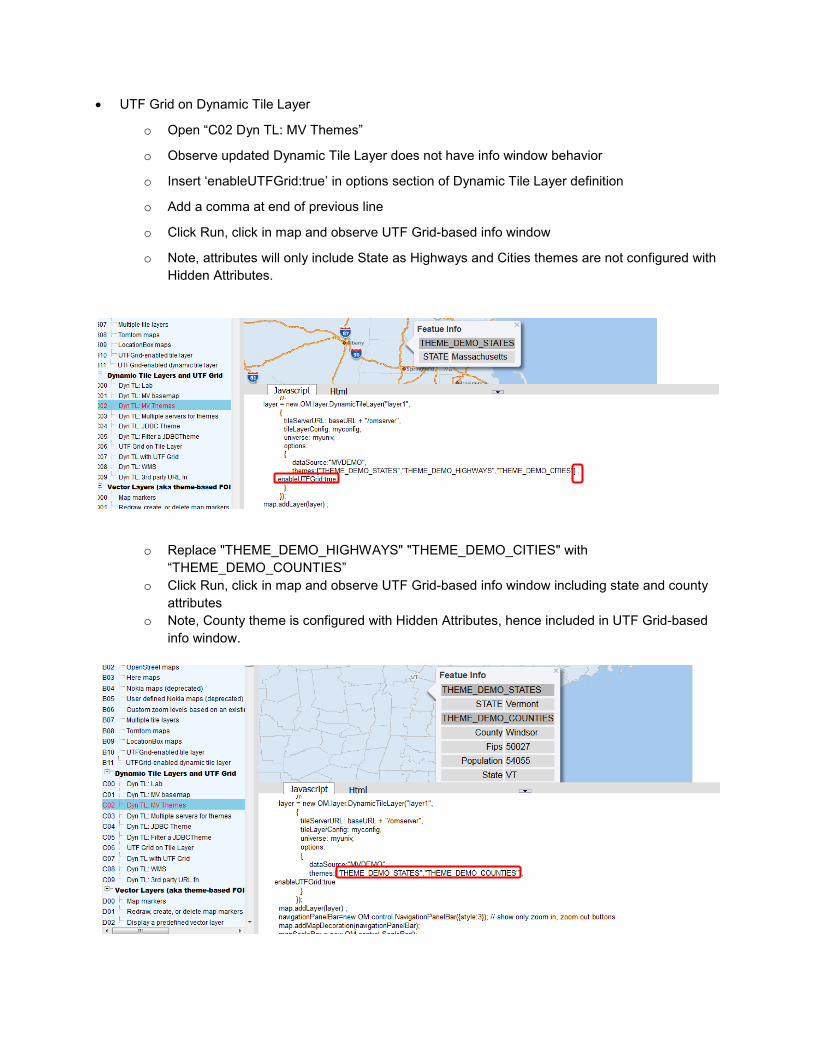
UTF Grid on Dynamic Tile Layer
o Open “C02 Dyn TL: MV Themes”
o Observe updated Dynamic Tile Layer does not have info window behavior
o Insert ‘enableUTFGrid:true’ in options section of Dynamic Tile Layer definition
o Add a comma at end of previous line
o Click Run, click in map and observe UTF Grid-based info window
o Note, attributes will only include State as Highways and Cities themes are not configured with Hidden Attributes.
o Replace "THEME_DEMO_HIGHWAYS" "THEME_DEMO_CITIES" with “THEME_DEMO_COUNTIES”
o Click Run, click in map and observe UTF Grid-based info window including state and county attributes
o Note, County theme is configured with Hidden Attributes, hence included in UTF Grid-based info window.

Customize attributes for UTF Grid on Dynamic Tile Layer o Open “C04 Dyn TL: JDBC Theme” o Observe updated Dynamic Tile Layer does not have info window behavior o UTF Grid attributes are controlled using a theme’s Hidden Info. We will add Hidden Info to the
JDBC theme. o Insert the following Hidden Info definition inside the jdbc_query XML tags:
'<hidden_info><field column="county" name="County Name"/><field
column="totpop" name="Total Population"/></hidden_info> \n'+
o Insert enableUTFGrid:true in options section of Dynamic Tile Layer definition o Add a comma at end of previous line o Click Run and click in map to observe UTF Grid-based info window
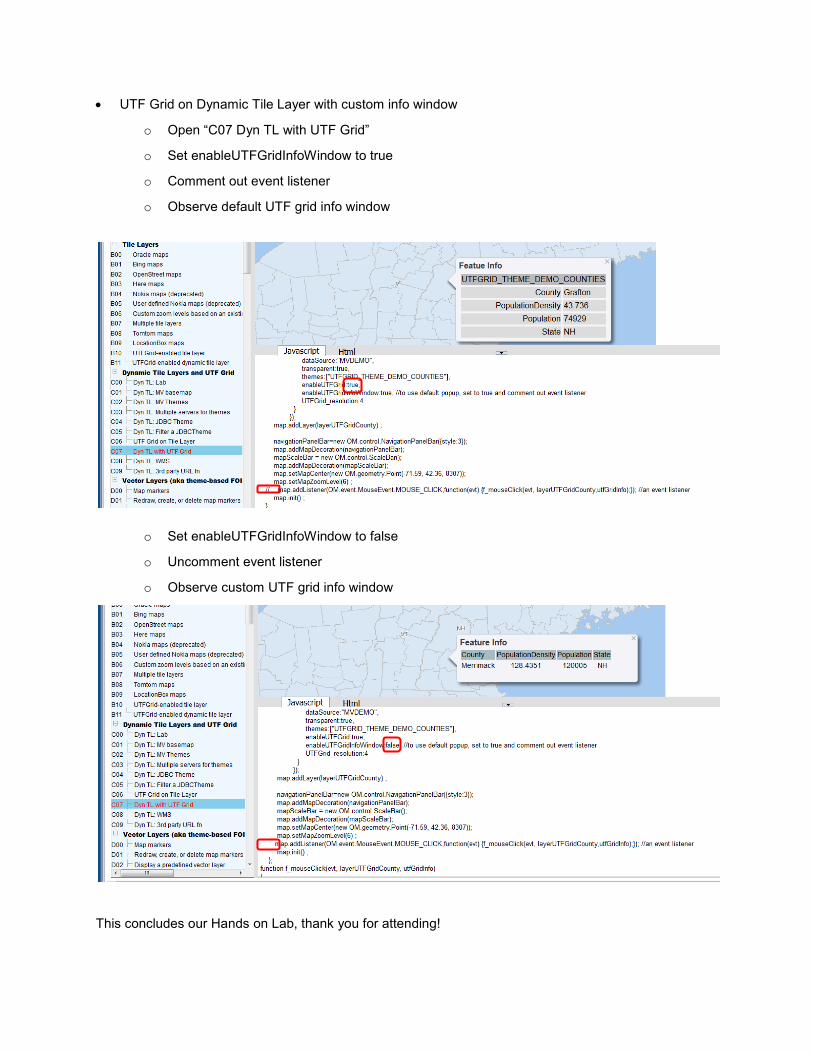
UTF Grid on Dynamic Tile Layer with custom info window
o Open “C07 Dyn TL with UTF Grid”
o Set enableUTFGridInfoWindow to true
o Comment out event listener
o Observe default UTF grid info window
o Set enableUTFGridInfoWindow to false
o Uncomment event listener
o Observe custom UTF grid info window
This concludes our Hands on Lab, thank you for attending!