intermediaries in international trade: margins of trade and export
TRANSCRIPT
Intermediaries in International Trade:
margins of trade and export flows∗
Andrew B. Bernard†
Tuck School of Business at Dartmouth, CEPR & NBER
Marco Grazzi‡
Department of Economics, University of Bologna
Chiara Tomasi§
Universita degli Studi di Trento & LEM Scuola Superiore S.Anna
first version, October 2010this version, April 2013
Abstract
This paper examines the factors that give rise to intermediaries in exporting and exploresthe implications for trade volumes. The most productive manufacturing firms export directlywhile less productive firms export indirectly through an intermediary. Export intermediariessuch as wholesalers serve different markets and export different products than manufacturingexporters. These underlying differences between direct and intermediary exporters have impor-tant consequences for trade flows. The ability of export intermediaries to overcome countryand product fixed costs means that they can more easily respond along the extensive margin toexternal shocks. Intermediaries and direct exporters respond differently to exchange rate fluc-tuations both in terms of the total value of shipments and the number of products exported aswell as in terms of prices and quantities. Aggregate exports to destinations with high shares ofindirect exports are much less responsive to changes in the real exchange rate than are exportsto countries served primarily by direct exporters.
JEL codes: D22, F12, F14, L22, L23
Keywords: heterogeneous firms, international trade, intermediation, wholesalers, export entrycosts, product adding and dropping, exchange rates
∗This is a substantially revised version of NBER Working Paper No. 17711 and CEPR Discussion Paper No.8766 which was titled “Intermediaries in International Trade: direct versus indirect modes of export”. The presentwork has been possible thanks to a research agreement between the Italian Statistical Office (ISTAT) and the ScuolaSuperiore Sant’Anna. Tomasi gratefully acknowledges financial support from the European Commission 6th FP(Contract CIT3-CT-2005-513396), Project: DIME - Dynamics of Institutions and Markets in Europe and from theMarie Curie Program Grant COFUND Provincia Autonoma di Trento. Bernard acknowledges support from theEuropean University Institute and the Tuck School of Business. ver. 3.1†100 Tuck Hall, Hanover, NH 03755, USA, tel: +1 603 646 0302, email: [email protected]‡Piazza Scaravilli 2, 40126 Bologna, Italy. tel: +39 051 2098130, email: [email protected]§Via Inama, 5, 38122 Trento Italy, tel: +39 0461 282161, email: [email protected]
Intermediaries in International Trade
1 Introduction
The growing availability of firm-level international trade data has contributed to the blooming of
both theoretical and empirical literatures highlighting the importance of firm heterogeneity in ag-
gregate trade flows. Since the initial empirical papers of Bernard and Jensen (1995, 1999), Roberts
and Tybout (1997) and the theoretical models of Melitz (2003) and Bernard et al. (2003), a major
focus in international trade has been on the relationship between the characteristics of produc-
ing firms, most notably productivity, and their participation in international trade. An emerging
stream of research has examined differences among trading firms (Bernard, Jensen, Redding and
Schott; 2010; Ahn et al.; 2011; Antras and Costinot; 2011). These papers emphasize that exporters
include both manufacturing firms that organize the production and distribution of their goods
abroad as well as intermediaries that specialize in distribution in foreign markets.
In this paper, using newly available Italian firm-level trade data, we examine the underlying
factors that give rise to exports by intermediaries and the consequences for trade volumes and
the margins of adjustment to external shocks. We find that producers in the middle range of
size and efficiency are the most likely to export indirectly through an intermediary. Intermediaries
themselves specialize in particular destinations and sell more products in each market. In particular,
relative to manufacturing exporters, intermediaries sell more to difficult markets that have higher
entry costs.
The ability of intermediaries to export to markets with high entry costs has implications for
their responses to aggregate shocks to profitability. Wholesale (intermediary) exporters are more
likely to adjust along the extensive margin, i.e. add and drop products. In addition, the char-
acteristics of products handled by wholesalers are different from those exported directly - they
are less differentiated and have lower contract intensity. Firm-level exports respond differently for
wholesale exporters and manufacturing exporters. Pass-through is lower and total export value
is less responsive to exchange rate changes for wholesalers. Aggregating to the country-level, this
firm-level variation results in differential changes in exports between destinations served primarily
by direct and indirect exporters.
More than one quarter of Italian exporters are intermediaries and they account for over 10
percent of exports. However, there is substantial variation in the importance of intermediaries
across countries and products. New Zealand and China have intermediary export shares near 9
percent (25th percentile) while Paraguay and Malawi are at the 75th percentile with shares above
23 percent.
The existence of intermediaries suggests that they overcome barriers to international trade at
a lower cost than manufacturers for some range of goods and for some countries. We show that
manufacturers with intermediate levels of size and productivity are more likely to use intermediaries
1
Intermediaries in International Trade
to export. The least productive manufacturers do not export at all and the most productive export
directly.
We examine the role of both country and product characteristics in country-product exports by
wholesalers and manufacturers. Intermediaries are more likely to export to smaller markets with
high export entry costs.1 In addition, the quality of the general contracting environment is related
to the choice of mode of export. Exports through an intermediary are more likely when the quality
of the general contracting environment of the country is weak. Intermediaries also focus on products
with particular characteristics such as lower contract intensity, greater product homogeneity, and
higher product-level sunk costs of exporting.
One important difference between wholesalers and manufacturers lies in their tendency to add
and drop products. Intermediaries add and drop products at much higher rates than direct ex-
porters. These firms face lower sunk costs of exporting and thus are able to adjust their extensive
margin more easily.
The differences in fixed costs across destinations and products give rise to variation in response
to common external shocks to profitability such as exchange rate changes. Wholesalers are better
able to adjust along the extensive margin and total exports by wholesalers are less responsive
to exchange rate changes. Given the big difference in the share of intermediated exports across
countries and products, these firm-level results suggest that there are potentially large, predictable
differences in how aggregate exports will respond to changes in the value of the domestic currency.
We indeed find that the responsiveness of aggregate exports is much greater in destinations served
primarily by direct exporters.
1.1 Relation to the literature
Early theoretical work on the role of intermediaries in international trade, e.g. Rauch and Watson
(2004) and more recently Petropoulou (2011), models trade as an outcome of search and networks.
However, several new papers in the theoretical literature on intermediaries in exporting have taken a
more technological perspective based on models of heterogeneous firms (Ahn et al.; 2011; Akerman;
2010; Felbermayr and Jung; 2011).2 In these new papers, exporting entails both fixed and variable
costs. However, there is an intermediation technology which allows wholesalers to lower the per-
product fixed costs and exploit economies of scope in exporting.
While all active manufacturers serve the domestic market, producing firms can potentially
serve foreign markets by selling directly or using a wholesale intermediary. Producing firms sort
into different export channels according to their productivity. As in the standard model of Melitz
1Akerman (2010), Ahn et al. (2011), and Bernard, Jensen, Redding and Schott (2010) report evidence of a greaterrole for intermediaries in such markets.
2Blum et al. (2011) and Blum et al. (2010) look the role of intermediaries largely from the perspective of theimporting country while Rauch and Watson (2004) discuss when intermediary firms actually take possession of thegoods.
2
Intermediaries in International Trade
(2003), the least productive firms serve only the domestic market while the most productive firms
can export directly by incurring the fixed cost of export and any variable trade costs. A third
category of firms in the middle of the productivity range chooses to export indirectly through
wholesalers. We provide direct evidence on the sorting of manufacturers into these three groups.
A firm’s decision regarding the mode of export is determined by variable and fixed trade costs,
which in turn also depends on country and product characteristics. Countries with relatively high
fixed export costs offer a great opportunity for wholesalers to intermediate trade.
The existing theoretical frameworks emphasize the interaction of producer firm heterogeneity
and fixed export costs in the decision to export directly or indirectly. While these models are all
static models of single-product firms, it is relatively easy to envision a dynamic extension where
firms potentially make multiple products and their profitability evolves over time (see Bernard,
Redding and Schott; 2010; Bernard et al.; 2011). In a dynamic environment, variation in the sunk
cost of exporting across firm types leads to predictable variation in product adding and product
dropping in the export market. Firms facing lower sunk costs would be more likely to both add and
drop products in steady state and in the face of exogenous shocks to profitability. As intermediary
exporters have lower entry costs they should be more likely to churn their export product mix.
This paper is closely related to recent empirical work by Ahn et al. (2011), Akerman (2010)
and Bernard, Jensen, Redding and Schott (2010) who examine various aspects of intermediaries
in exports for China, Sweden and the US, respectively.3 All three papers examine the differences
between intermediaries and firms that export directly. Bernard, Jensen, Redding and Schott (2010)
find that 35 percent of US exporters are wholesalers accounting for 10 percent of exports by value.
Their work emphasizes the differences in the attributes between exporters of different types. Aker-
man (2010) reports slightly more exporting intermediaries than manufacturers and intermediaries
are smaller in terms of total turnover and especially export value, but export more products and
ship to more destinations. Akerman (2010) finds that country-sector intermediary export shares
increase in distance and measures of fixed costs and fall with destination GDP. In contrast with
the other studies, Ahn et al. (2011) find much higher exports per firm for intermediaries than for
direct exporters. Intermediaries are also active in many more products than direct exporters. In-
termediary export shares are positively related to distance, tariffs and a measure of fixed costs and
negatively correlated with destination GDP.
This paper builds on this growing empirical literature and extends it in a number of directions.
First, we document the differences between producing exporters and intermediary exporters in terms
3The definition of an exporting intermediary varies across all the papers so the results are not directly comparableto each other or those presented below. Specifically, Ahn et al. (2011) define an intermediary as a firm with certainChinese characters in its name, Akerman (2010) uses the main activity of the firm and includes both wholesalers andretailers and Bernard, Jensen, Redding and Schott (2010) distinguish between pure wholesalers, pure retailers andtwo types of firms that mix manufacturing with wholesaling and retailing. As discussed below we only consider firmswith wholesaling as their main activity as intermediaries.
3
Intermediaries in International Trade
of their firm characteristics, destination and product mixes, and export values and quantities. We
then examine export participation and levels by direct and intermediary exporters across countries
and products and their relation to country and product characteristics. Our focus, however is on
the differences between wholesale and manufacturing exporters in their response to shocks. We
consider product adding and dropping, intensive and extensive margin adjustments at the firm
level and their consequences for aggregate trade flows.
The rest of the paper is organized as follows: Section 2 examines the characteristics of pro-
ducing firms that produce for the domestic market only, those that export indirectly through an
intermediary and direct exporters. Section 3 documents differences between direct manufacturing
exporters and wholesaler exporters and examines the role of country and product fixed costs on
the choice of export mode. Section 4 explores product adding and dropping in the export market
and the response of exports both at the firm level and in the aggregate to exchange rates shocks.
Section 5 concludes.
2 Direct and Indirect Exporters
In this section we start by examining the relationship between manufacturing firm characteristics
and their choice of export mode, direct or indirect. We then turn our attention to the differences
between wholesale (intermediary) exporters and manufacturing exporters in the Italian data.
The Italian trade data do not contain information on the mode of export by domestic manu-
facturing firms. To examine the choice between direct and indirect exporting, we use the Business
Environment and Enterprise Performance Survey conducted by the World Bank (BEEPS).4
The BEEPS data is available for a wide cross-section of countries at very different levels of
development and unfortunately for our purposes does not include data on Italy. We look at the
relationship between manufacturing firm size and efficiency and choice of export mode for all the
countries in the sample as well as for two subsets of countries more likely to be similar to Italy.
The first is the set of countries in the BEEPS data that are in the European Union.5 The second
set of countries are those with per capita income levels above the 75th percentile according to the
World Bank.6 Firm total sales are broken down in three mutually exclusive categories (that sum
to 100 percent): share of national sales, share of indirect exports and share of direct exports. We
group firms into those that do not export, firms that ship some or all of their goods indirectly and
4We consider only firms in the Manufacturing sectors. See the Appendix for a more detailed description of theBEEPS data. Table 1 in the online Technical Appendix provides the number of observations available for each country.The online Technical Appendix can be found at http://mba.tuck.dartmouth.edu/pages/faculty/andrew.bernard/IIT-Appendix.pdf
5The EU countries in the BEEPS data are Bulgaria, Croatia, Czech Republic, Estonia, Germany, Greece, Hungary,Ireland, Latvia, Lithuania, Poland, Portugal, Romania, Slovakia, Slovenia, and Spain.
6This high-income group consists of Argentina, Germany, Greece, Ireland, Oman, Portugal, Slovenia, Spain, andSouth Korea.
4
Intermediaries in International Trade
firms that only export directly. Across all countries, 63.5 percent of firms do not export at all, 27.0
percent of firms export directly and 9.5 percent of firms reach foreign markets using intermediaries
for some or all of their exports.7 The ability to export indirectly increases by a third the number
of firms that can reach foreign markets with their goods.
We consider the prediction of the new models of intermediation and trade that firms will sort
between domestic only firms, indirect exporters and direct exporters according to their underlying
productive efficiency. As proxies for firm efficiency we use log total sales per employee as well as
log employment and log total sales.8
We estimate regressions of the form
lnYf = c+ αDXf + βDX
f ∗ ShareDir + dt + dc + εi (1)
where Yf is the proxy for firm efficiency, DXf is a dummy which equals 1 if the manufacturer exports
either directly or indirectly, and DXf ∗ ShareDir an interaction of the export dummy and a direct
export share variable which is 0 for pure indirect exporters and rises to 1 for pure direct exporters
and dt and dc are year and country fixed effects. Standard errors are clustered at the firm level.
The models predict positive coefficients on both the export dummy and the interaction term.
Results are reported Table 1 for all countries pooled together as well as for the subsets of EU
and High Income countries. As has been reported extensively in the empirical literature, exporters
are bigger in terms of employment and sales and have higher sales per employee. The differences
between exporters and non-exporters are greater for the high income group.
Looking at the interaction term, we find a positive and significant coefficient in all specifications.
Direct exporters are substantially larger and have higher sales per employee than indirect exporters.
The sorting predictions of the model are born out in the data, suggesting that the presence of
intermediaries allows less efficient producers to export their products. The EU and High Income
subsets show the same overall pattern.
3 Wholesale and Manufacturing Exporters
We now turn to an examination of the exporters themselves, i.e. the wholesale firms that act as
intermediaries and the manufacturers that export directly. We document the extent of intermedia-
tion in Italian exports, highlighting important stylized facts about intermediaries and showing how
they differ from manufacturing firms.
7The share of indirect exporters is similar for both the High-Income and EU subset of countries, 7.8 and 9.4percent respectively.
8We use sales because the data does not include measures of value-added.
5

Intermediaries in International Trade
3.1 Trade and firm data
The analysis of exports by manufacturers and wholesalers is based upon two firm-level datasets
collected by the Italian statistical office (ISTAT), namely Statistiche del Commercio Estero (COE)
and Archivio Statistico Imprese Attive (ASIA).9
The COE dataset consists of all cross-border transactions performed by Italian firms and it
covers the period 2000-2007. COE includes the annual value and quantity of export transactions
by the firm for product-country destination pairs.10 A product is defined as a six digit category in
the Harmonized System (HS6).
Using the unique identification code of the firm, we link the firm-level export data to IS-
TAT’s registry of active firms, ASIA. In ASIA, firms are classified according to their main activity,
as identified by ISTAT’s standard codes for sectoral classification of business (5-digit ATECO).
This information allows us to distinguish between four broad categories of firms: manufacturers,
wholesalers, retailers, and a residual group including the remaining sectors.11 ASIA also contains
information on firms’ operations including the number of employees and total turnover.12 The
combined dataset used for the analysis is not a sample but rather includes all active firms.
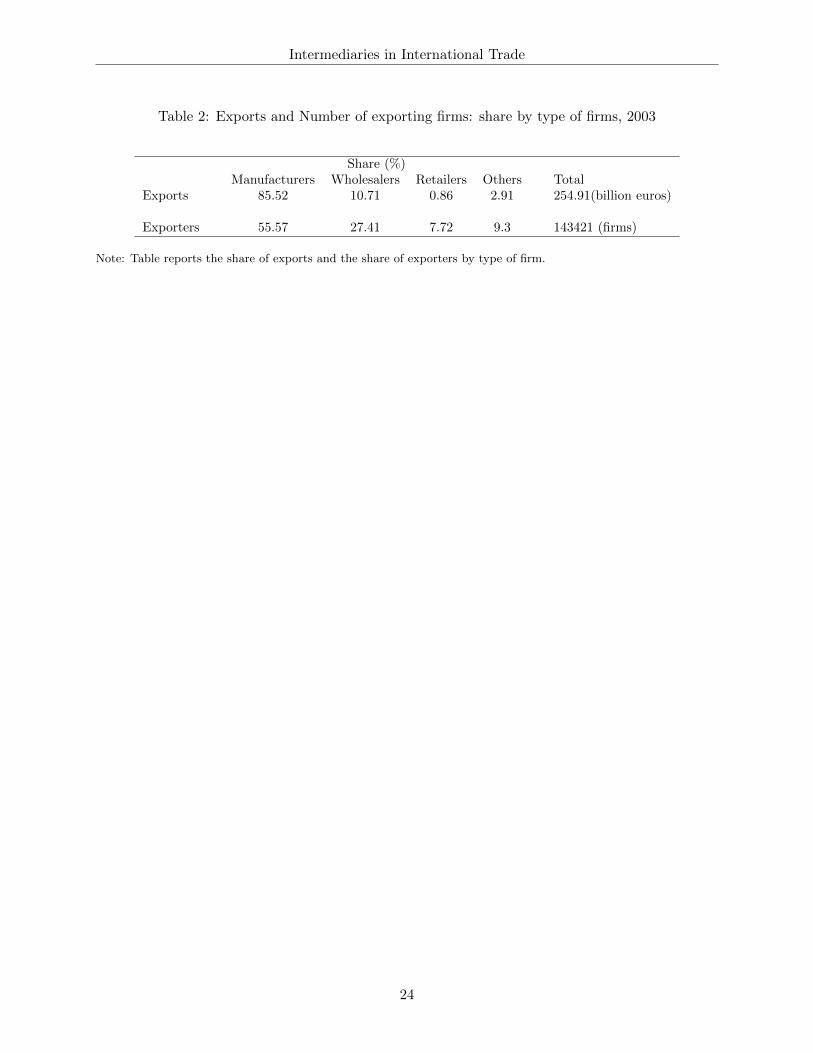
Table 2 reports the total value of exports and the relative share of the four broad categories
of firms. A preponderance of exports, more than 85 percent of the value, is performed directly by
manufacturing firms. Manufacturing exporters also represent more than 55 percent of exporting
firms. The 27 percent of exporters that are wholesalers account for more than 10 percent of Italian
exports in 2003. These figures are in line with those reported for the US in Bernard, Jensen,
Redding and Schott (2010) where wholesalers are 35 percent of exporting firms and control just
over 10 percent of US exports. As in other countries, retailers are relatively minor players in
exporting, accounting for less than one percent of exports by value. As a result, the remainder
of the paper focuses on the role of wholesalers as export intermediaries and uses the two terms
interchangeably.
9This paper represents the first use of this data on Italian trade transactions at the firm level. The database hasbeen made available for work after careful screening to avoid disclosure of individual information. The data wereaccessed at the ISTAT facilities in Rome.
10ISTAT collects data on exports based on transactions. The European Union sets a common framework of rulesbut leaves some flexibility to member states. A detailed description of requirements for data collection on exports inItaly is provided in the Appendix.
11In particular, we classify firms in sectors from 151 to 372 as manufacturers, and firms in sectors from 501 to 519(with the exclusion of 502 which concerns the activity of repair of motor vehicles) as wholesalers. Retailers are firmsin sectors 521 to 527, and Others contains the remaining sectors.
12Information on total turnover are available only for two years, 2000 and 2003.
6

Intermediaries in International Trade
1
1.5
2
2.5
3
3.5
4
4.5
5
5.5
6 8 10 12 14 16 18
ln E
mp
loy
men
t
ln Exports
Employment per level of exports
ManufacturersWholesalers
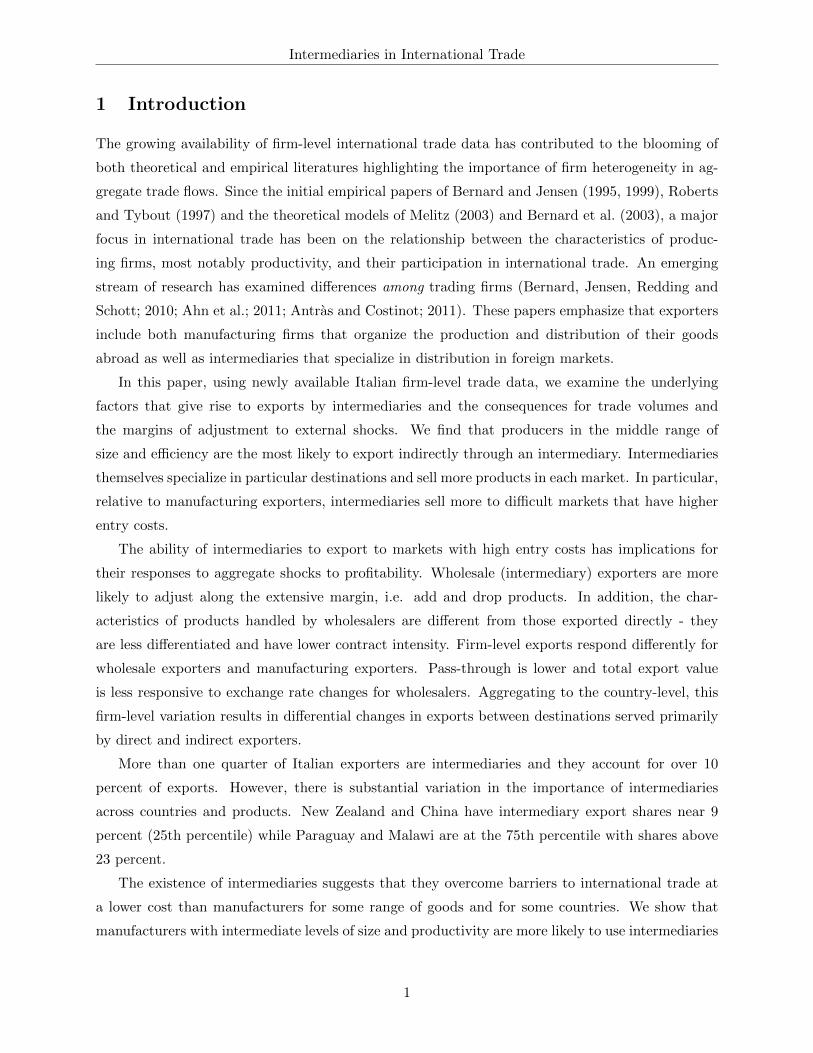
Figure 1: Relation between (log of) employment and exports, 2003. Observations are placed in 20equally-sized bins according to the variable on x-axis. Coordinates of dots display the average of xand y variables of the data in each bin (see text).
3.2 Firm characteristics
The results compare manufacturers and wholesalers along a number of dimensions including size,
the number of destination countries and the number of products exported.13
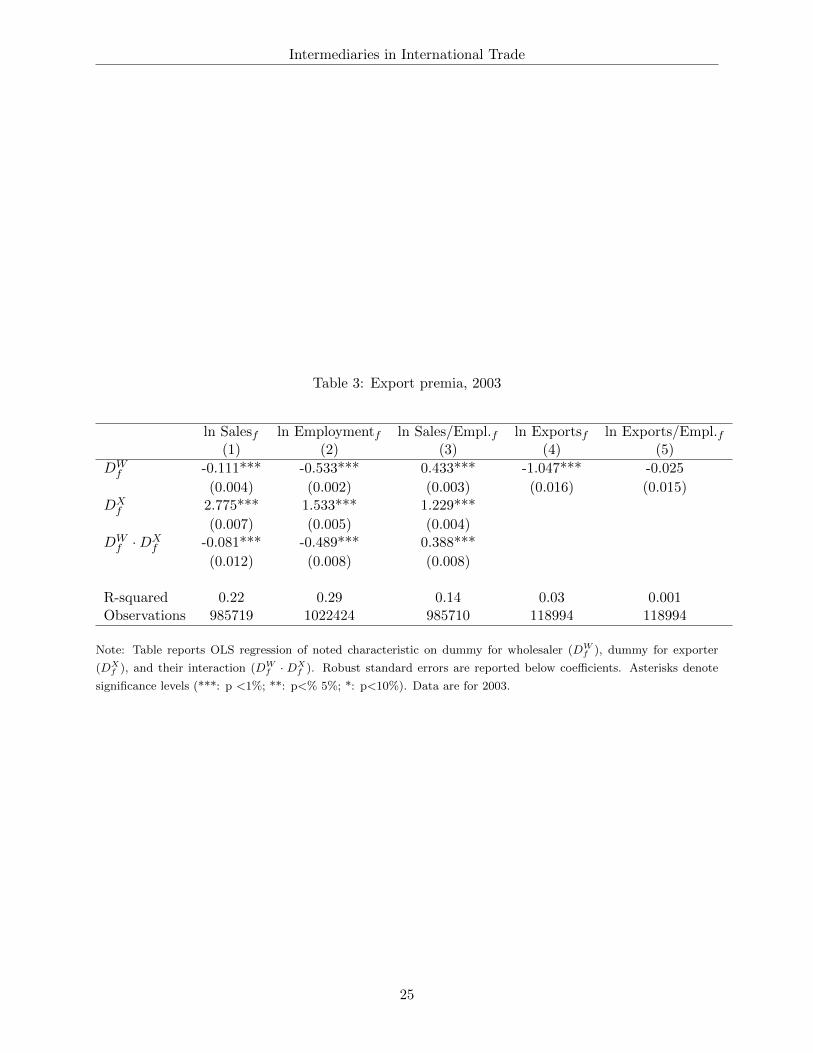
To quantify the differences between manufacturers and wholesalers, we estimate the following
cross-sectional OLS regression,
lnYf = c+ αDWf + βDX
f + γ(DWf ·DX
f ) + εf (2)
where lnYf denotes the logarithm of either total sales, number of employees, or sales per employee
ratio. DWf is a firm-level dummy variable, one for wholesaler and zero for manufacturer; DX
f is
a dummy indicating if a firm is an exporter; and (DWf ∗ DX
f ) is the interaction between the two
dummies and takes value of one if a firm is a wholesaler exporter and zero otherwise. The results
are presented in Table 3.
As expected, manufacturers are on average larger than wholesalers, 12 percent (0.111 log points)
in terms of sales and 70 percent in terms of employment, α is negative and significant in both
specifications. In contrast, sales per employee are substantially higher at wholesalers. We also
confirm the now-standard results that direct manufacturing exporters are dramatically larger and
have higher sales per employee than manufacturers who do not export or who export indirectly, β
is large, positive and significant.
Perhaps unsurprisingly, we provide the first evidence that the selection of good firms into
exporting is true for wholesalers as well. Exporting wholesale firms have total sales 14.8 times
13In their work on US traders, Bernard, Jensen, Redding and Schott (2010) find not only that traders differ fromdomestic firms, but also that substantial heterogeneity exists between trading firms of different ‘types’.
7
Intermediaries in International Trade
larger than non-exporting wholesalers and employ 2.8 times as many workers, β+ γ is positive and
significant. Sales per employee at exporting intermediaries are 5 times higher than at non-exporters.
Looking at exports in columns 4 and 5 of Table 3, we find that the value of exports at wholesalers
is much smaller than that of manufacturing exporters but that this difference largely disappears
when considering exports per employee.
The results are consistent with the idea that manufacturing firms are performing two activi-
ties, the physical production of the goods and the intermediation of the goods to a downstream
customer, while wholesalers are only engaged in the latter activity. This distinction is important
when attempting to compare the exporting activities of wholesalers and manufacturers as the use
of employment as a proxy for firm size may yield misleading comparisons. A manufacturing firm
with 100 employees will typically have lower sales and exports than a wholesale firm with the same
employment.
Figure 1 displays the binned relation between log exports and log employment, reporting the
(log) number of employees a firm has, on average, for a certain level of exports.14 The plot confirms
that wholesalers require fewer employees to attain any given level of export value. As a consequence,
we use sales-based measures as proxies for size throughout the rest of our analysis.
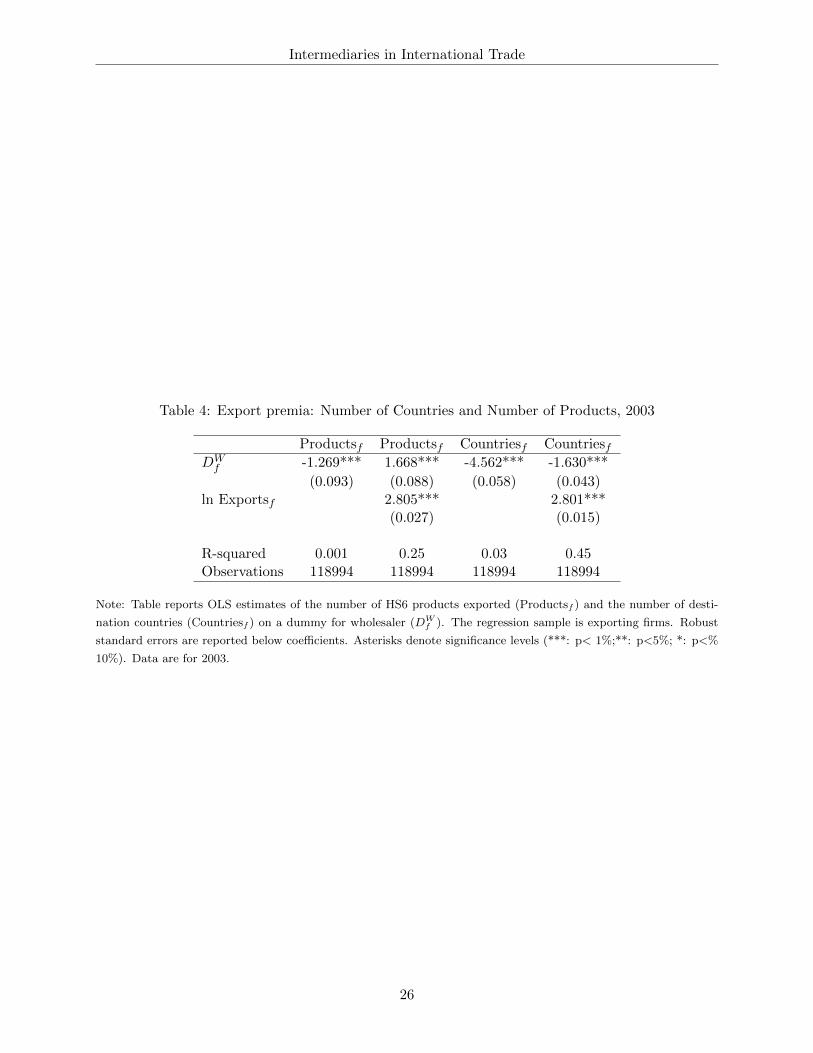
3.3 Product and geographic diversity
The theoretical models discussed in the introduction generally focus on the role of intermediaries in
solving the fixed cost problem for specific markets. This section provides evidence on the presence
of intermediaries in markets and sectors. Table 4 reports the results of the regression of the number
of products exported and the number of destination markets (Products and Countries, respectively)
on the firm wholesaler dummy, DWf , and a proxy for firm size,
Yf = c+ αDWf + β lnSizef + εf if DX
f = 1. (3)
The first row of Column 1 shows that, unconditionally, wholesale exporters export fewer HS6
products. However, including a control for firm size, log export value, the coefficient becomes
positive and significant; exporting intermediaries are active in a wider range of products compared
to similarly-sized manufacturers. In contrast, intermediaries serve fewer export markets even when
adjusting for firm size. These results suggest that intermediaries are indeed able to spread country-
specific fixed costs over a wider range of products.
14Binned plots allow for a succinct representation of the relation between two variables and avoid displaying cloudsof thousands of observations. Here data are placed in 20 equally-sized bins according to their (log of) export value,and the x-coordinate displays the average of the bin. The y-coordinate is the average (log of) employment withinthat bin.
8

Intermediaries in International Trade
3.4 Intermediated exports
This section explores the relationship between country and product characteristics and exports by
wholesalers and manufacturers.
3.4.1 Country level data
Firm-level trade data are complemented by country characteristics including proxies for market
size and variable and fixed trade costs. For market size we use total GDP from the World Bank
World Development Indicators database.
We create two measures of country-level fixed costs. To generate a proxy for the market-specific
fixed costs of exporting to a country, we use information on three measures from the World Bank
Doing Business dataset: number of documents for importing, cost of importing and time to import
(Djankov et al.; 2010). Given the high level of correlation between these variables, we use the
primary factor (Market Costs) derived from principal component analysis as that factor accounts
for most of the variance contained in the original indicators (see Table A1 in Appendix).
The second measure of country-level fixed costs relates to the quality of governance and con-
tracting. Data on the contracting environment are available from a variety of sources, e.g. World
Bank, Heritage Foundation, and Transparency International. To proxy for institutional quality we
use information from the six variables in the World Bank’s Governance dataset (Kaufman et al.;
2009): Voice and Accountability, Political Stability and Absence of Violence/Terrorism, Govern-
ment Effectiveness, Regulatory Quality, Rule of Law, and Control of Corruption. As these six
measures are highly correlated, we again use the primary factor obtained from principal compo-
nent analysis, Governance, as the proxy for country governance quality.15 If firms must invest
in fixed resources to export to countries with weaker contracting environments, one would expect
better Governance to be associated with lower intermediary export shares.
Variable trade costs may be either due to policy barriers, such as tariffs and non-tariff barriers,
or to the cost of moving goods across borders, such as transportation costs. Following the large
gravity literature, transportation costs are proxied by geographic distance calculated using the
great circle formula (de Sousa et al.; 2012). In order to account for the effect of policy barriers on
the presence of intermediaries and manufacturers we also use HS6 product-country import tariffs,
taken from World Integrated Trade System (WITS).16
15Table A2 in Appendix reports the results of the principal component analysis for the governance measure.16WITS contains the TRAINS database on bilateral tariffs at the six-digit level of the Harmonized System (HS)
product classification for about 5,000 products and 200 countries. TRAINS provides information on four differenttype of tariffs: Most-Favored National Tariffs (MFN), Preferential Tariffs (PRF), Bound Tariffs (BND), and theeffectively applied tariffs (AHS). We use the AHS tariff in the empirical analysis. The AHS tariff is the MFN Appliedtariff, unless a preferential tariff exists.
9

Intermediaries in International Trade
3.4.2 Product level data
In addition to country attributes, we consider both product characteristics that are related to the
specificity of the product and those more generally related to market structure.
Wholesale exporters should handle products where the direct interaction between producers and
customers is less important. If goods with higher relation-specificity have relatively larger product-
country fixed costs of exporting, the share of direct exports is likely to be greater. Transactions
involving complex goods, whose production process is intensive in the use of highly specialized and
customized inputs, may require specific knowledge and tasks because of the effort associated with
the identification of potential customers, more detailed contracts, post-sale service, etc. For those
goods, the product-market component of fixed costs is relatively large and such goods are more
likely to be exported directly by the firms that produce them.
We use a measure of industry contract intensity developed by Nunn (2007) to measure the
importance of relationship-specific investment in intermediate inputs across industries. Nunn’s
original data, corresponding to US I-O industries, is concorded to HS6 products.17 Industries that
require more relationship-specific investments are expected to be less easily served by intermediaries
as the product-market component of fixed costs is relatively large.
On the contrary, the indirect mode of export would prevail if the traded good does not require
a relation-specific investment, as for commoditized products. This prediction is in line with the
hypothesis put forward by Peng and Ilinitch (2001) “the higher the commodity content of the
product, the more likely that export intermediaries will be selected by manufacturers”.
In order to account for differentiation within a HS6 product class we employ the coefficient
of price dispersion (Ahn et al.; 2011).18 Lower price dispersion is assumed to be associated with
more homogeneous products. For homogeneous products, the product-market component of fixed
costs will be lower and thus it is more likely that the export transactions will be carried out by an
intermediary.
The ease with which firms can start and stop exporting a product is directly related to product-
level sunk export costs. Products that have higher sunk costs of entry are more likely to be handled
by intermediaries. We adapt a measure of product-level sunk entry costs developed by Bernard
and Jensen (2007) to the export market. In steady state, a product with high sunk costs of entry
into export markets should have a low entry rate and an equally low exit rate. During transitions
between steady states, either the entry rate (expanding product) or the exit rate (shrinking product)
may be unusually high. However, the minimum of the two rates should still correspond to steady-
state entry or exit. We calculate the minimum of the firm-level export entry and exit rates for each
17See the Data Appendix for a description of the concordance procedure.18The coefficient of price variation is computed on COE data as the coefficient of variation in the unit values of any
of the HS6 products across all firm-product-country transactions. In the empirical analysis we use data from 2003,but the product ranking in terms of price dispersion does not vary much over the years.
10
Intermediaries in International Trade
product, min(entry, exit).19 A higher minimum level of entry and exit indicates lower sunk costs
of exporting and a lower likelihood that the product will be exported through an intermediary.
3.4.3 Country and product outcomes
In this section we examine the relationship between country and product characteristics and export
levels by wholesalers and manufacturers. Exports by wholesaler are expected to be more prevalent
in difficult markets characterized by high costs of entry and small relative size and in more homo-
geneous products with low relation-specificity and high sunk export costs.20 For this and all the
subsequent empirical analysis, we restrict our attention to Italian exports outside the EU. Due to
the differential reporting requirements for Intra-EU and Extra-EU trade it is not desirable to pool
all destinations together.21
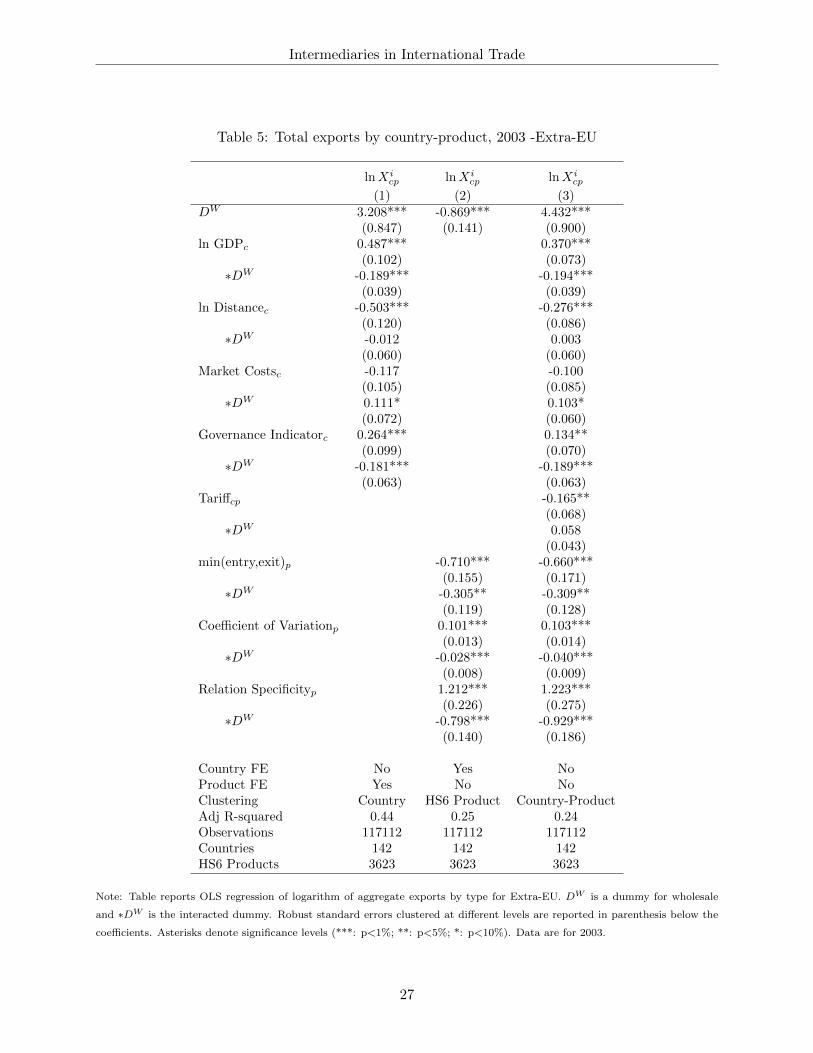
Table 5 reports regression results with the log of country-product exports by exporter type,
lnXicp, as dependent variable and country, product and product-country characteristics, Cc, Pp and
τpc, as explanatory variables, together with a full set of interactions with the wholesaler dummy,
DW ,
lnXicp = c+ αDW + β1Cc + β2Cc ∗DW + γ1Pp + γ2Pp ∗DW + δ1τpc + δ2τpc ∗DW + dj + εcp. (4)
Columns 1 and 2 add country and product fixed effects, respectively, while column 3 includes all
the available product and country characteristics.22
Results on the country characteristics in columns 1 and 3 show that the level of exports of both
manufacturers and wholesalers exports is positively correlated with GDP, however the effects are
significantly lower for wholesalers. The results on Market Costs and Governance are also in line
with the theoretical predictions. Intermediaries’ exports increase with market costs, suggesting
that wholesalers are better able to spread fixed costs across products. The country governance
indicator yields a similar pattern of results: better governance is associated with higher exports
from manufacturers but that effect is greatly reduced or disappears entirely for wholesalers.
Both greater distance and higher tariffs, our variable trade cost measures, significantly reduce
exports. However neither shows a significant differential effect between manufacturers and whole-
19The entry rate is the number of new exporters of the product between year t and t+s divided by the averagenumber of exporters in the two years. The exit rate is the number of firms that stop exporting the product betweent and t+s divided by the average number of exporters in the two years. The min(entry, exit) in a given product iscomputed on COE data for years 2003 and 2007. Considering different years for the computation of the rates doesnot significantly affect the results.
20Higher country-level fixed costs of exporting and weaker governance are associated with smaller total levels ofexports (Lawless; 2010; Djankov et al.; 2010), here we consider their relationship to the composition of exports byfirm type.
21See the Appendix for details on the trade reporting cutoffs.22In Column 3 we cluster both on countries and products.
11
Intermediaries in International Trade
salers.23
Columns 2 and 3 of Table 5 report the results on the product characteristics. We focus on
the sign and significance of the interaction terms with the wholesaler dummy. Wholesalers export
relatively less in products with lower sunk entry costs, i.e. greater min(entry, exit), higher price
dispersion, and higher relationship specificity. All these coefficients have the expected signs and
point to product characteristics playing an important part in the endogenous choice of firms to
export directly or through an intermediary.
This section has examined the role of country and product characteristics in exports by manu-
facturers and wholesalers. Country-specific fixed export costs are correlated with the use of export
intermediaries. We further show that the quality of the more general contracting environment is
related to the choice of mode of export. Exports through an intermediary are more likely when the
quality of the general contracting environment of the country is weak.
We also show that the characteristics of the product play a role in determining the choice of
export mode. Lower contract intensity, greater product homogeneity, and higher product-level sunk
costs of exporting are associated with a greater reliance on intermediaries in exporting.
4 Intermediaries and exogenous shocks
4.1 Product adding and dropping
The cross-sectional analysis reveals that exporting wholesalers are smaller than manufacturers and
that they export a larger number of products to a smaller set of destinations. In addition to lower
firm-level trade flows, intermediaries also ship less within a product-country pair.24 These results
are broadly supportive of a framework emphasizing country-specific fixed costs of exporting. As
discussed earlier, the presence of sunk export costs that vary across firm types also has implications
for export dynamics. Lower sunk costs should result in higher probabilities of both entry into
exporting and exit from exporting. Intermediaries should be more likely to add and drop products
from their export portfolio than direct exporters.
If wholesalers have lower sunk costs per product, then they should also be more likely to add
and drop products. Following Bernard, Redding and Schott (2010), we analyze export product
switching between t and t + 1 using those years for which we have information on firms’ total
turnover, 2000-2001 and 2003-2004. We examine the probability that a current exporter adds a
23In contrast to Ahn et al. (2011), geographical distance affects negatively the value of trade equally for both typesof firms. Their specification is slightly different as they include a smaller set of covariates and do not include theinteracted wholesale dummy.
24This is shown in Table 4 of the Technical Appendix.
12
Intermediaries in International Trade
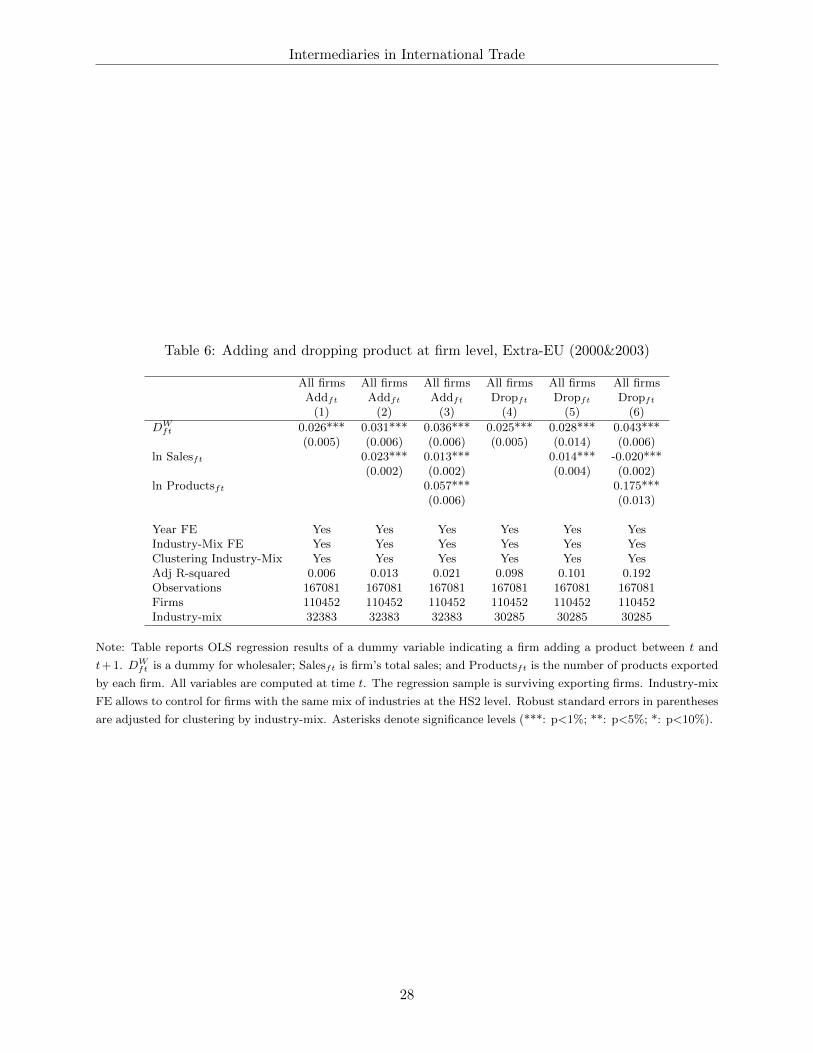
product to its export portfolio between years t and t+ 1 in the specification,
Addft = c+ αDWft + β lnSalesft + γ lnProductsft + dind + dt + εft (5)
where Addft takes value 1 if the firm adds an export product and zero otherwise. DWft , lnSalesft,
and lnProductsft are defined as above. Additional controls include year fixed effects, dt, and
industry-mix fixed effects, dind that controls for firms with the same mix of industries at the HS2
level. The specification for product dropping by the firm is similar,
Dropft = c+ αDWft + β lnSalesft + γ lnProductsft + dind + dt + εft (6)
where Dropft takes value 1 if the firm drops an export product and zero otherwise.
Results of Table 6 show that, as expected, intermediaries are both more likely to add a product
and more likely to drop a product than manufacturers that export directly. This finding is robust
to controlling for firm size and number of exported products.25
We further examine the differences across firm types in their product dropping behavior by
estimating a linear probability model at the firm-product level,
Dropfpt = c+ αDWft + β lnSalesft + γDeviationfpt + δ lnProductsft + dp + dt + εfpt (7)
where Dropfpt takes value 1 if product p is exported by the firm f in year t and not exported in year
t+ 1 and equal zero if the product is exported in both years.26 DWft is the firm wholesale dummy
and is the variable of interest. To control for firm attributes associated with product switching, we
include firm size, lnSalesft, the relative importance of the firm in the exports of the product given
by the log difference between the firm’s exports in product p and average firm exports in product
p, Deviationfpt, and the number of products exported by the firm in year t, lnProductsft. The
inclusion of product and year fixed effects, dp and dt, allows us to control for the possibility that
wholesalers export products with characteristics that make them more likely to be dropped.
Table 7 reports the results of the estimation of the firm-product dropping specification equa-
tion 7 for Extra-EU countries. Within a product-year, wholesaler exporters are much more likely
to drop a product than manufacturer exporters, 6.9 percentage points or 14.4 percent.27 This dif-
ferential persists even controlling for firm size, the number of exported products and the relative
importance of the firm in the product, although the magnitude of the coefficients is reduced.
25Results in the Technical Appendix show that the effect is more pronounced when comparing wholesalers andmanufacturers that are single-product firms.
26It is not feasible to estimate an adding regression at the firm-product level as the set of possible added productsincludes all the products not currently exported by the firm.
27On average the fraction of exported firm-products outside the EU that is dropped every year is 50% among allfirms, 48% for manufacturers and 53% for wholesalers.
13
Intermediaries in International Trade
The results on both export product dropping and export product adding are consistent with
intermediary exporters facing lower sunk costs of participation in the export market. These findings
suggest that shocks such as changes in tariffs or exchange rates may have differential effects on
wholesalers and manufacturers even within the same country-product pair.
4.2 Exchange rates and exports
The results support the idea that export intermediaries arise in large part because of the presence
of significant fixed export costs at the country and product level. In addition, product adding and
product dropping in the export market are greater for wholesale exporters than for manufacturers.
Taken together this evidence suggests that a common shock to profits across destinations, e.g.
a common tariff cut, may have different effects both across types of exporting firms and in the
aggregate across countries due to variation in the composition of exporters.
This section examines whether intermediaries and manufacturers respond differently to exoge-
nous currency shocks. Using annual fluctuations in bilateral real exchange rates as measures of
exogenous changes in export profitability, we investigate the effects on firms’ export behavior. We
consider the impact of exchange rate changes on firm exports to country c, as well as on the number
of exported products and the average value of exports to that destination. A firm’s total exports
to a destination can be decomposed into extensive and intensive margins,
lnXfc = lnProdfc + ln avgXfc (8)
where lnXfc is the log of total exports by firm f to country c, Prodfc is the number of distinct HS6
products exported by firm f to country c, and avgXfc is the average value of exports per product
from firm f to country c. We regress the annual log change from 2000 to 2007 of firm total exports
to country c and the annual changes of the two components on a dummy for wholesaler (DWft ), the
change in the log of the real bilateral exchange rate of the Italian currency (∆lnRERct) and their
interaction
∆lnZfct = c+ αDWft + β∆ lnRERct + γ∆ lnRERct ∗DW
ft + δ lnnpcft + dj + εfct (9)
where lnnpcft is the number of country-product pair where the firm has positive exports and dj
indicates a set of fixed effects.28 Using data from the International Financial Statistics database
(IMF, 2010), we define the RERct index for each year:
RERct = ERctCPItCPIct
28We thank a referee for suggesting the inclusion of the number of country-product pairs to account for the numberof markets where the firm has already sunk the entry costs.
14
Intermediaries in International Trade
where ERct is the nominal Italian exchange rate expressed as the number of foreign currency
units per home currency unit and CPItCPIct
is the ratio of the domestic consumer price level and
the consumer price index abroad.29 An upward (downward) movement therefore represents an
appreciation (depreciation) of the domestic currency.
Table 8 reports results from estimating equation 9 for firm-country exports, the number of
products and the average exports per product. Since real exchange rate variations inside the
Eurozone are related only to price levels changes, we include in the regressions only countries
outside the EU.
The first two columns of Table 8 present the results for export value, including country and year
fixed effects (column 1) and country and firm fixed effects (column 2). Exchange rate movements
have the expected effects on firm exports to country c: an appreciation of the Euro is associated with
a decrease in firm exports. However, the interaction of wholesaler type and the real exchange rate
is positive and significant in both columns; firm exports fall less (6.8-7.6 percent) for intermediaries
than for manufacturers when the Italian currency appreciates.30
Looking at columns 3-6 we observe that, for both manufacturing and wholesale firms, the fall in
exports in response to an appreciation of the domestic currency is driven both by a decrease in the
number of products exported and by a decline in the firm’s average exports per product. However,
for wholesalers, the adjustment on the extensive margin of the number of products is greater,
while the response of average exports is more muted. These results would appear to confirm that
wholesale exporters face lower fixed costs and are thus able to adjust more easily along the extensive
margin than direct exporters.
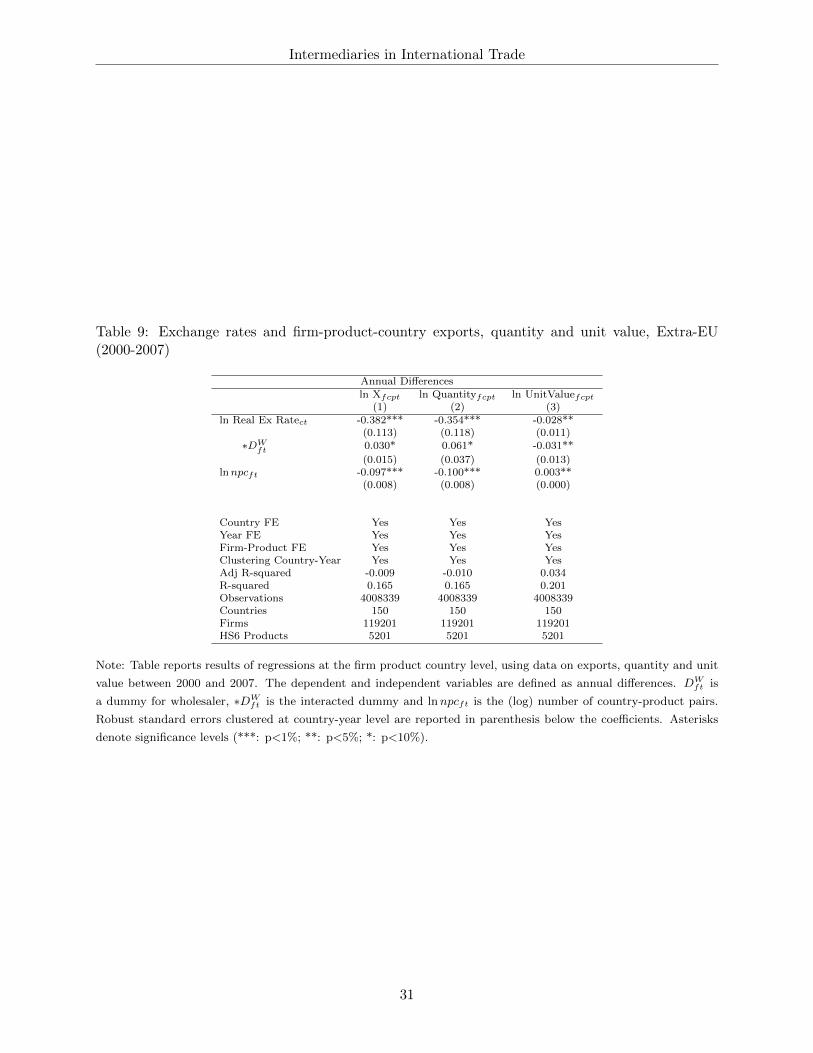
We next explore the sensitivity of the firm’s response within a country-product pair to annual
exchange rate movements by considering export value, quality and unit value. The estimation
equation is
∆lnYfpct = c+ αDWft + β∆lnRERct + γ∆lnRERct ∗DW
ft + δ lnnpcft + dj + εfpct (10)
where lnYfpct is the log of firm-level product-country export value, quantity or unit value. Table 9
reports results with country, year and firm-product fixed effects. As before, exports fall as the Italian
currency appreciates but the effect for wholesalers is significantly smaller. For direct exporters the
adjustment to a stronger home currency is primarily due to reductions in export quantities (93
29We use annual averages of the monthly official exchange rate, i.e. the rate determined by national authoritiesor to the rate determined in the legally sanctioned exchange market. Using a wholesale price index to construct thereal exchange rate reduces the number of countries in the sample but does not change the results. See the TechnicalAppendix for results using the WPI.
30Including the year fixed effects in columns 1, 3, and 5 effectively removes changes in the Euro that are commonacross all destinations. Similar results using a decomposition of the exchange rate movements into common andidiosyncratic components can be found in the Technical Appendix.
15
Intermediaries in International Trade
percent) rather than in unit value (7 percent). For wholesalers, the overall adjustment is smaller
due to a much smaller quantity response. Wholesalers drop their unit values more as the currency
rises, pass-through is lower, and quantities fall less.31
The literature on intermediaries in trade largely has focused on the underlying choice of firms
to export directly or indirectly and in particular on the role of fixed export costs. This section has
shown that these choices give rise to different responses to common external shocks to profitability.
Wholesalers are better able to adjust along the extensive margin and are less responsive to exchange
rate changes.
4.3 Aggregate exports
The firm-level results presented above suggest that the endogenous choice of direct or indirect
exporting by producing firms should matter for the response of aggregate, country-level export
volumes to exogenous shocks such as changes in the exchange rate. Destinations with high wholesale
export shares should show smaller responses of exports in response to exchange rate changes than
countries with low wholesale export shares.
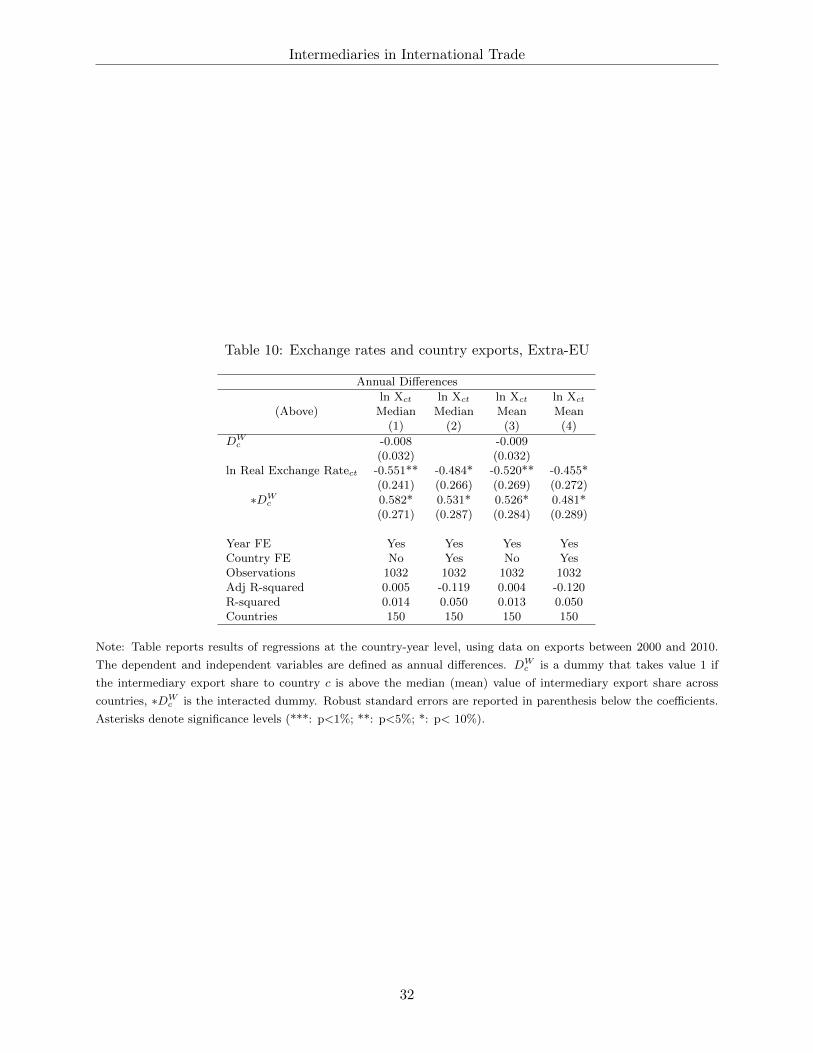
In Table 10 we consider a simple specification of the form
∆lnYct = c+ αDWc + β∆lnRERct + γ∆lnRERct ∗DW
c + dj + εct (11)
where lnYct is the log of country exports and DWc is a dummy that equals one if the country-level
share of wholesale exports is greater than the median (mean), and the exchange rate is defined as
before. Columns 1 and 3 report results with year fixed effects, while columns 2 and 4 include both
year and country fixed effects.
In every case, the results strongly confirm the importance of the mode of export in shaping the
aggregate responses to changes in the real exchange rate. The exchange rate export elasticity for
countries with low wholesale shares is negative and significant, ranging from -0.455 to -0.551 across
the specifications. In contrast, countries with wholesale export shares above the mean or median
have elasticities that are insignificantly different from zero.32
5 Conclusions
The present paper examines the role of intermediaries in exporting, the factors that lead firms to
export indirectly, and the consequences of intermediary exporters on trade value and the margins of
31In a recent paper on variation exchange rate pass-through and firm characteristics, Berman et al. (2012) emphasizethat pass-through differs systematically with the productivity of the exporting firm. While there are substantialdifferences between our Italian data and the French data they employ, in the Technical Appendix, we confirm theirfindings and show that our main results on the differences between wholesaler and manufacturing exporters are robustto the inclusion of a firm-level productivity measure.
32Including other aggregate country characteristics does not affect these findings, see the Technical Appendix.
16
Intermediaries in International Trade
adjustment to external shocks. Confirming the predictions of the theoretical literature, we find that
manufacturers of intermediate productivity are the most likely to export through an intermediary.
Using Italian firm-level trade data, we investigate the importance of wholesalers in exports across
destinations and products and examine how they differ from manufacturing firms that export
directly. Intermediary exporters are smaller, ship more products and reach fewer countries than
direct exporters.
We confirm the findings of previous research that wholesalers are more likely to export to
countries with high fixed export costs and to smaller markets. However, exporting by wholesalers
is also more common in destinations with weak contracting environments and in products that
are more homogeneous, have higher sunk entry costs and have lower relationship specificity. The
ability of intermediaries to effectively lower destination and product fixed costs means that they
churn their product mix more often and adjust along the extensive margin.
The differences in fixed costs across destinations and products have important implications
for firm-level and aggregate responses to exogenous changes in profitability such as exchange rates.
Wholesalers are more likely to adjust their product mix in response to an exchange rate change and
their total exports adjust less. Given the big difference in the share of intermediated exports across
countries and products, these firm-level results suggest that there are potentially large differences
in how aggregate exports will respond to changes in the value of the domestic currency that are
linked to the type of the exporting firm. We find significantly lower responses of aggregate exports
to changes in the exchange rate for destinations served primarily by wholesale exporters.
These findings raise questions for future research. Firms in smaller, lower income countries
may be more likely to use intermediaries to reach foreign countries. Rapidly growing countries
with rising productivity may see a large shift from intermediated trade to direct exports. Our
results suggest such a shift would be associated with greater responsiveness of aggregate exports
to exchange rate changes.
17

Intermediaries in International Trade
Appendix
Direct and indirect export data
The Business Enterprise Survey (BEEPS) is a joint initiative of the European Bank of Reconstruc-
tion and Development (EBRD) and of the World Bank Group. The survey examines the quality
of the business environment for different regions by collecting firm-level data on a broad range of
issues including firm financing, labor, infrastructure, informal payments and corruption, trade and
innovation activities.33 Four rounds of the survey have so far been implemented (1999, 2002, 2005
and 2009). The questionnaire administered by Enterprise Surveys has evolved over time, hence
not all variables are available in all waves. As a result data are provided in two different formats:
1) the standardized one, where country data are matched to a standard set of questions, and 2)
country specific surveys, that offer the complete survey information for a particular country. We
chose the “Standardized data 2002-2005” as it includes countries which are more similar to Italy
and its time span overlaps with our period of investigation.
The database includes 36,956 firms from represent 99 countries and 16 industries in manufac-
turing. The database contains information on a number of firm-level variables including number of
employees, total turnover, ownership structure, industry and geographical location.
Firm trade data
ISTAT collects data on export transactions, which are the basic unit of observation for trade flows.
It is then possible to link transactions to firms using the value added tax identification code (partita
IVA) of the firm which is also recorded in the transaction.34 There are different requirements in
order for a transaction to be recorded. These requirements depend on the destination, Intra or
Extra-EU, and on the value of the transactions. The European Union sets a common framework
but leaves some flexibility to member states.
As far as Extra-EU transactions are concerned there is a good deal of homogeneity among
member states as well as over time. Since the adoption of the euro as a common currency, Italy set
the threshold at 620 euro (or 1,000 Kg), so that all transactions bigger than 620 euro (or 1,000 Kg)
are recorded. All these records of Extra-EU transactions report complete information, that is, also
information about the product. From 2007 onward the threshold is at 1,000 euro (or 1,000 Kg).
Most of the existing differences are due to varying Intra-EU requirements. In 2003 there were
two reporting thresholds: 200,000 euros35 and 40,000 euros. Firms with more than 200,000 euros
of exports (based on the previous year) have to fill in the Intrastat document monthly. They report
33All data are freely accessible to researchers at http://www.enterprisesurveys.org.34The value-added tax identification number also allows the linking of export data to various Censuses conducted
by ISTAT.35In 2007 this threshold was raised to 250,000.
18
Intermediaries in International Trade
complete information including details about products. Firms with exports between 40,000 and
200,000 euros have to fill in the Intrastat form on a quarterly basis. The value of exports is recorded
but not information on products. Below 40,000 euros per year the transactions are not recorded.
Other data
We use the measure of industry contract intensity developed by Nunn (2007) . Nunn’s data are
classified according to the industry classification of the US I-O table compiled by the Bureau of
Economic Activity. To match each I-O industry to an HS6 product, first we use information from
Lawson et al. (2002) to construct a concordance between I-O industry classification and NAICS1997
code. Then the data are converted from NAICS1997 to NAICS2002. Finally, we exploit the
concordance between Harmonize System Codes and NAICS Industries developed by Pierce and
Schott (2009) to obtain the information on contract intensity at the level of HS6 product.
To generate a proxy for the market-specific fixed costs of exporting to a country, we use infor-
mation from the World Bank Doing Business database (DB). Three variables are used: number of
documents for importing includes all documents required per shipment to import the goods from a
given destination; cost of importing measures the fees levied on a 20-foot container in US dollars;
time to import reflects the number of days needed to import a standard container of goods from a
factory in the largest business city to a ship in the most accessible port (for details, see Djankov
et al.; 2010). Data are available from 2004 to 2010. Given the low variability of these indicators,
we take the average value over the available years.
We perform principal component analysis to construct a single measure for Market Costs and
again for Governance. Tables A1 and A2 report the principal component analysis (PCA) on
standardized variables for Market Costs and Governance, respectively. The panel in the middle of
Tables A1 and A2 shows the total variance accounted by each factor. The Kaiser criterion suggests
to retain those factors with variance equal or higher than 1. In both cases there is only one factor
that satisfies this criterion and this factor explain 77 percent and 86 percent of the sum of the
observed variance respectively. The lower panel of the two tables reports the factor loadings. Table
A1 shows the loadings on Factor1 are relatively large for all the variables related to market costs.
The same is true for institutional quality in Table A2. Finally, uniqueness is the variance that is
“unique” to the variable and not shared with others. Again all variables, in both tables, have a low
percentage of variance not accounted by other variables.
19

Intermediaries in International Trade
Table A1: PCA for Market Costs
Number of Obs. 180Retained Factors 1Number of Parameters 3
Variance Proportion
Factor1 2.30 0.77Factor2 0.51 0.17Factor3 0.18 0.06
Standardized Variables Factor1 Loadings Uniqueness
Number of documents for importing 0.81 0.34Cost of importing 0.87 0.23Time to import 0.93 0.12
Table A2: PCA for Governance Indicator
Number of Obs. 193Retained Factors 1Number of Parameters 6
Variance Proportion
Factor1 5.16 0.86Factor2 0.4 0.07Factor3 0.28 0.05Factor4 0.09 0.01Factor5 0.05 0.01Factor6 0.03 0.01
Standardized Variables Factor1 Loadings Uniqueness
Voice & Accountability 0.86 0.25Political Stability 0.85 0.27Government Effectiveness 0.96 0.09Regulatory Quality 0.95 0.1Rule of low 0.98 0.05Control of Corruption 0.96 0.09
20
Intermediaries in International Trade
References
Ahn, J., Khandelwal, A. K. and Wei, S.-J. (2011). The role of intermediaries in facilitating trade,
Journal of International Economics 84(1): 73–85.
Akerman, A. (2010). A theory on the role of wholesalers in international trade based on economies
of scope, Research papers in economics, Stockholm University, Department of Economics.
Antras, P. and Costinot, A. (2011). Intermediated trade, The Quarterly Journal of Economics
126(3): 1319–1374.
Berman, N., Martin, P. and Mayer, T. (2012). How do different exporters react to exchange rate
changes?, The Quarterly Journal of Economics 127(1): 437–492.
Bernard, A. B., Eaton, J., Jensen, J. B. and Kortum, S. S. (2003). Plants and productivity in
international trade, American Economic Review 93(4): 1268–1290.
Bernard, A. B. and Jensen, J. B. (1995). Exporters, jobs, and wages in U.S. manufacturing:
1976-87, Brookings Papers on Economic Activity: Microeconomics 1995: 67–112.
Bernard, A. B. and Jensen, J. B. (1999). Exceptional exporter performance: cause, effect, or both?,
Journal of International Economics 47(1): 1–25.
Bernard, A. B., Jensen, J. B., Redding, S. J. and Schott, P. K. (2010). Wholesalers and retailers
in US trade, American Economic Review 100(2): 408–13.
Bernard, A. B., Redding, S. J. and Schott, P. K. (2010). Multiple-product firms and product
switching, American Economic Review 100(1): 70–97.
Bernard, A. B., Redding, S. J. and Schott, P. K. (2011). Multiproduct firms and trade liberalization,
The Quarterly Journal of Economics 126(3): 1271–1318.
Blum, B., Claro, S. and Horstmann (2011). Intermediation and the nature of trade costs: theory
and evidence, Unpublished, Rotman School of Management.
Blum, B. S., Claro, S. and Horstmann, I. (2010). Facts and figures on intermediated trade, American
Economic Review 100(2): 419–23.
de Sousa, J., Mayer, T. and Zignago, S. (2012). Market access in global and regional trade, Regional
Science and Urban Economics 42(6): 1037–1052.
Djankov, S., Freund, C. and Pham, C. S. (2010). Trading on time, Review of Economics and
Statistics 92(1): 166–173.
21
Intermediaries in International Trade
Felbermayr, G. and Jung, B. (2011). Trade intermediation and the organization of exporters,
Review of International Economics 19(4): 634–648.
Kaufman, D., Kraay, A. and Mastruzzi, M. (2009). Governance matter VIII: Aggregate and indi-
vidual governance indicators 1996-2008, Policy Research Paper 4978, World Bank.
Lawless, M. (2010). Deconstructing gravity: trade costs and extensive and intensive margins,
Canadian Journal of Economics 43(4): 1149–1172.
Lawson, A. M., Bersani, K. S., Fahim-Nader, M. and Guo, J. (2002). Benchmark input-output
accounts of the united states, Survey of Current Business 82: 19–108.
Melitz, M. J. (2003). The impact of trade on intra-industry reallocations and aggregate industry
productivity, Econometrica 71(6): 1695–1725.
Nunn, N. (2007). Relationship-specificity, incomplete contracts, and the pattern of trade, The
Quarterly Journal of Economics 122(2): 569–600.
Peng, M. W. and Ilinitch, A. Y. (2001). Export intermediary firms: A note on export development
research, Journal of International Business Studies 29(3): 609–620.
Petropoulou, D. (2011). Information costs, networks and intermediation in international trade,
Globalization and Monetary Policy Institute Working Paper 76, Federal Reserve Bank of Dallas.
Pierce, J. and Schott, P. (2009). A concordance between ten-digit U.S. Harmonized System Codes
and SIC/NAICS product classes and industries, Working Paper 155486, NBER.
Rauch, J. E. and Watson, J. (2004). Network intermediaries in international trade, Journal of
Economics & Management Strategy 13(1): 69–93.
Roberts, M. J. and Tybout, J. R. (1997). The decision to export in Colombia: An empirical model
of entry with sunk costs, American Economic Review 87(4): 545–64.
22

Intermediaries in International Trade
Table 1: Productivity sorting. Exporters (any export mode) and share of direct exports, 2002-2005.
Dep. Var. log Employment log Total Sales log Total Sales/Empl.World HI* Europe World HI* Europe World HI* Europe
DX 0.698*** 0.987*** 1.090*** 0.901*** 1.261*** 1.196*** 0.204*** 0.274*** 0.107*(0.028) (0.200) (0.141) (0.040) (0.248) (0.164) (0.029) (0.114) (0.062)
DX ∗ Sh.Dir 0.760*** 0.531* 0.775*** 1.160*** 0.950*** 0.879*** 0.340*** 0.213** 0.104*(0.031) (0.297) (0.147) (0.043) (0.251) (0.169) (0.031) (0.109) (0.063)
Country FE Yes Yes Yes Yes Yes Yes Yes Yes YesSector FE Yes Yes Yes Yes Yes Yes Yes Yes YesYear FE Yes Yes Yes Yes Yes Yes Yes Yes YesR-squared 0.374 0.282 0.320 0.755 0.294 0.374 0.834 0.127 0.489N. Obs 36,956 1,712 2,482 36,956 1,712 2,482 36,956 1,712 2,482Countries 99 9 16 99 9 16 99 9 16
Note: Table reports regression of firms’ characteristics on a dummy for manufacturer (direct or indirect) exporter(DX
f ) and an the interaction of the export dummy and a direct export share variable (DX ∗Sh.Dir). Baseline categoryis domestic only. HI* (High Income) includes those countries above the 75th percentile of the income level accordingto the World Bank. Europe includes countries in the European Union. Robust standard errors clustered at firm-levelare reported in parenthesis below the coefficients. Asterisks denote significance levels (***: p<1%; **: p<5%; *: p<10%).
23
Intermediaries in International Trade
Table 2: Exports and Number of exporting firms: share by type of firms, 2003
Share (%)Manufacturers Wholesalers Retailers Others Total
Exports 85.52 10.71 0.86 2.91 254.91(billion euros)
Exporters 55.57 27.41 7.72 9.3 143421 (firms)
Note: Table reports the share of exports and the share of exporters by type of firm.
24
Intermediaries in International Trade
Table 3: Export premia, 2003
ln Salesf ln Employmentf ln Sales/Empl.f ln Exportsf ln Exports/Empl.f(1) (2) (3) (4) (5)
DWf -0.111*** -0.533*** 0.433*** -1.047*** -0.025
(0.004) (0.002) (0.003) (0.016) (0.015)DX
f 2.775*** 1.533*** 1.229***
(0.007) (0.005) (0.004)DW
f ·DXf -0.081*** -0.489*** 0.388***
(0.012) (0.008) (0.008)
R-squared 0.22 0.29 0.14 0.03 0.001Observations 985719 1022424 985710 118994 118994
Note: Table reports OLS regression of noted characteristic on dummy for wholesaler (DWf ), dummy for exporter
(DXf ), and their interaction (DW
f · DXf ). Robust standard errors are reported below coefficients. Asterisks denote
significance levels (***: p <1%; **: p<% 5%; *: p<10%). Data are for 2003.
25
Intermediaries in International Trade
Table 4: Export premia: Number of Countries and Number of Products, 2003
Productsf Productsf Countriesf CountriesfDW
f -1.269*** 1.668*** -4.562*** -1.630***
(0.093) (0.088) (0.058) (0.043)ln Exportsf 2.805*** 2.801***
(0.027) (0.015)
R-squared 0.001 0.25 0.03 0.45Observations 118994 118994 118994 118994
Note: Table reports OLS estimates of the number of HS6 products exported (Productsf ) and the number of desti-
nation countries (Countriesf ) on a dummy for wholesaler (DWf ). The regression sample is exporting firms. Robust
standard errors are reported below coefficients. Asterisks denote significance levels (***: p< 1%;**: p<5%; *: p<%
10%). Data are for 2003.
26
Intermediaries in International Trade
Table 5: Total exports by country-product, 2003 -Extra-EU
lnXicp lnXi
cp lnXicp
(1) (2) (3)DW 3.208*** -0.869*** 4.432***
(0.847) (0.141) (0.900)ln GDPc 0.487*** 0.370***
(0.102) (0.073)∗DW -0.189*** -0.194***
(0.039) (0.039)ln Distancec -0.503*** -0.276***
(0.120) (0.086)∗DW -0.012 0.003
(0.060) (0.060)Market Costsc -0.117 -0.100
(0.105) (0.085)∗DW 0.111* 0.103*
(0.072) (0.060)Governance Indicatorc 0.264*** 0.134**
(0.099) (0.070)∗DW -0.181*** -0.189***
(0.063) (0.063)Tariffcp -0.165**
(0.068)∗DW 0.058
(0.043)min(entry,exit)p -0.710*** -0.660***
(0.155) (0.171)∗DW -0.305** -0.309**
(0.119) (0.128)Coefficient of Variationp 0.101*** 0.103***
(0.013) (0.014)∗DW -0.028*** -0.040***
(0.008) (0.009)Relation Specificityp 1.212*** 1.223***
(0.226) (0.275)∗DW -0.798*** -0.929***
(0.140) (0.186)
Country FE No Yes NoProduct FE Yes No NoClustering Country HS6 Product Country-ProductAdj R-squared 0.44 0.25 0.24Observations 117112 117112 117112Countries 142 142 142HS6 Products 3623 3623 3623
Note: Table reports OLS regression of logarithm of aggregate exports by type for Extra-EU. DW is a dummy for wholesale
and ∗DW is the interacted dummy. Robust standard errors clustered at different levels are reported in parenthesis below the
coefficients. Asterisks denote significance levels (***: p<1%; **: p<5%; *: p<10%). Data are for 2003.
27
Intermediaries in International Trade
Table 6: Adding and dropping product at firm level, Extra-EU (2000&2003)
All firms All firms All firms All firms All firms All firmsAddft Addft Addft Dropft Dropft Dropft
(1) (2) (3) (4) (5) (6)
DWft 0.026*** 0.031*** 0.036*** 0.025*** 0.028*** 0.043***
(0.005) (0.006) (0.006) (0.005) (0.014) (0.006)ln Salesft 0.023*** 0.013*** 0.014*** -0.020***
(0.002) (0.002) (0.004) (0.002)ln Productsft 0.057*** 0.175***
(0.006) (0.013)
Year FE Yes Yes Yes Yes Yes YesIndustry-Mix FE Yes Yes Yes Yes Yes YesClustering Industry-Mix Yes Yes Yes Yes Yes YesAdj R-squared 0.006 0.013 0.021 0.098 0.101 0.192Observations 167081 167081 167081 167081 167081 167081Firms 110452 110452 110452 110452 110452 110452Industry-mix 32383 32383 32383 30285 30285 30285
Note: Table reports OLS regression results of a dummy variable indicating a firm adding a product between t and
t+ 1. DWft is a dummy for wholesaler; Salesft is firm’s total sales; and Productsft is the number of products exported
by each firm. All variables are computed at time t. The regression sample is surviving exporting firms. Industry-mix
FE allows to control for firms with the same mix of industries at the HS2 level. Robust standard errors in parentheses
are adjusted for clustering by industry-mix. Asterisks denote significance levels (***: p<1%; **: p<5%; *: p<10%).
28

Intermediaries in International Trade
Table 7: Firm-product dropping, Extra-EU (2000&2003)
Dropfpt Dropfpt
(1) (4)
DWft 0.069*** 0.021***
(0.001) (0.001)ln Salesft -0.004***
(0.000)Deviationfpt -0.099***
(0.000)ln Productsft -0.013***
(0.001)
Year FE Yes YesProduct FE Yes YesClustering Firm-Product Firm-ProductAdj R-squared 0.06 0.19Observations 1221737 1221737HS6 Products 5259 5259Firms 110452 110452
Note: Table reports OLS regression results of a dummy variable indicating a firm-product drop between t and t + 1.
DWft is a dummy for wholesaler; Salesft is firm’s total sales; Deviationfpt is (log of) firm’s exports in product p minus
(log of) average exports in product p; and Productsft is the number of products exported by each firm. All variables
are computed at time t. The regression sample is surviving exporting firms. Robust standard errors in parentheses
are adjusted for clustering by firm-product. Asterisks denote significance levels (***: p<1%; **: p<5%; *: p<10%).
29

Intermediaries in International Trade
Table 8: Exchange rates, firm-country exports, and extensive and intensive margins of trade, Extra-EU (2000-2007)
Annual Differences
ln Xfct ln Xfct ln Prodfct ln Prodfct ln Avg Xfct ln Avg Xfct
(1) (2) (3) (4) (5) (6)
DWft 0.016*** 0.020*** -0.005
(0.004) (0.003) (0.003)ln Real Ex Ratect -0.522*** -0.427*** -0.188*** -0.057* -0.334*** -0.370***
(0.150) (0.120) (0.047) (0.027) (0.107) (0.089)∗DW
ft 0.040* 0.029* -0.048** -0.037* 0.087** 0.066*(0.020) (0.015) (0.023) (0.018) (0.039) (0.038)
lnnpcft 0.048*** 0.326*** 0.034*** 0.280*** 0.014*** 0.046***(0.002) (0.010) (0.002) (0.009) (0.001) (0.005)
Country FE Yes Yes Yes Yes Yes YesYear FE Yes No Yes No Yes NoFirm FE No Yes No Yes No YesClustering Country-Year Yes Yes Yes Yes Yes YesAdj R-squared 0.007 0.013 0.003 0.016 0.003 -0.002Observations 2487054 2487054 2487054 2487054 2487054 2487054Countries 150 150 150 150 150 150Firms 137311 137311 137311 137311 137311 137311
Note: Table reports results of regressions at the firm-country level, using data on exports, number of products and
average exports between 2000 and 2007. The dependent and independent variables are defined as annual differences.
DWft is a dummy for wholesaler, ∗DW
ft is the interacted dummy and lnnpcft is the (log) number of country-product
pairs. Robust standard errors clustered at country-year level are reported in parenthesis below the coefficients.
Asterisks denote significance levels (***: p<1%; **: p<5%; *: p<10%).
30
Intermediaries in International Trade
Table 9: Exchange rates and firm-product-country exports, quantity and unit value, Extra-EU(2000-2007)
Annual Differencesln Xfcpt ln Quantityfcpt ln UnitValuefcpt
(1) (2) (3)ln Real Ex Ratect -0.382*** -0.354*** -0.028**
(0.113) (0.118) (0.011)∗DW
ft 0.030* 0.061* -0.031**
(0.015) (0.037) (0.013)lnnpcft -0.097*** -0.100*** 0.003**
(0.008) (0.008) (0.000)
Country FE Yes Yes YesYear FE Yes Yes YesFirm-Product FE Yes Yes YesClustering Country-Year Yes Yes YesAdj R-squared -0.009 -0.010 0.034R-squared 0.165 0.165 0.201Observations 4008339 4008339 4008339Countries 150 150 150Firms 119201 119201 119201HS6 Products 5201 5201 5201
Note: Table reports results of regressions at the firm product country level, using data on exports, quantity and unit
value between 2000 and 2007. The dependent and independent variables are defined as annual differences. DWft is
a dummy for wholesaler, ∗DWft is the interacted dummy and lnnpcft is the (log) number of country-product pairs.
Robust standard errors clustered at country-year level are reported in parenthesis below the coefficients. Asterisks
denote significance levels (***: p<1%; **: p<5%; *: p<10%).
31
Intermediaries in International Trade
Table 10: Exchange rates and country exports, Extra-EU
Annual Differences
ln Xct ln Xct ln Xct ln Xct
(Above) Median Median Mean Mean(1) (2) (3) (4)
DWc -0.008 -0.009
(0.032) (0.032)ln Real Exchange Ratect -0.551** -0.484* -0.520** -0.455*
(0.241) (0.266) (0.269) (0.272)∗DW
c 0.582* 0.531* 0.526* 0.481*(0.271) (0.287) (0.284) (0.289)
Year FE Yes Yes Yes YesCountry FE No Yes No YesObservations 1032 1032 1032 1032Adj R-squared 0.005 -0.119 0.004 -0.120R-squared 0.014 0.050 0.013 0.050Countries 150 150 150 150
Note: Table reports results of regressions at the country-year level, using data on exports between 2000 and 2010.
The dependent and independent variables are defined as annual differences. DWc is a dummy that takes value 1 if
the intermediary export share to country c is above the median (mean) value of intermediary export share across
countries, ∗DWc is the interacted dummy. Robust standard errors are reported in parenthesis below the coefficients.
Asterisks denote significance levels (***: p<1%; **: p<5%; *: p< 10%).
32