internal structure and deformation of an unstable ... · techniques (tarchi et al., 2003;...
TRANSCRIPT
Engineering Geology 101 (2008) 1–14
Contents lists available at ScienceDirect
Engineering Geology
j ourna l homepage: www.e lsev ie r.com/ locate /enggeo
Internal structure and deformation of an unstable crystalline rock mass above Randa(Switzerland): Part I — Internal structure from integrated geological andgeophysical investigations
Heike Willenberg a, Simon Loewa,⁎, Erik Eberhardt a,1, Keith F. Evans a, Thomas Spillmann b,2,Björn Heincke b,3, Hansruedi Maurer b, Alan G. Green b
a Geological Institute, Swiss Federal Institute of Technology, ETH Hoenggerberg, Zürich, Switzerlandb Institute of Geophysics, Swiss Federal Institute of Technology, ETH Hoenggerberg, Zürich, Switzerland
a r t i c l e i n f o
⁎ Corresponding author.E-mail address: [email protected] (S. Loew).
1 Present address: Geological Engineering/EOS, UnVancouver, BC, Canada.
2 Present address: National Cooperative for the DisposWettingen, Switzerland.
3 Present address: Geological Survey of Norway/NGU,
0013-7952/$ – see front matter © 2008 Elsevier B.V. Aldoi:10.1016/j.enggeo.2008.01.015
a b s t r a c t
Article history:Received 25 June 2007Received in revised form 18 January 2008Accepted 26 January 2008Available online 23 February 2008
In 1991, the steep slope above the village of Randa in southern Switzerland failed during two successiverockslide events three weeks apart. The failures, which resulted in the release of approximately 30×106 m3 ofmaterial, occurred in fractured gneissic rock whose principal foliation, faults and fracture zones dip into theslope. Above the scarp of the second rockslide, the mountain continues to move at rates of up to 2 cm/year. Inan attempt to understand failure mechanisms in fractured crystalline rock masses, we have carried out acomprehensive multidisciplinary study that included detailed geological mapping, borehole logging andimaging, and surface and borehole geophysical surveys. An integrated interpretation of the resultant data hasrevealed the presence of three prominent fault- and fracture zone sets that define the internal structure of therock mass. Some faults and fracture zones could be traced up to 85 m into the subsurface using borehole radarreflection methods. The dips of the faults and fracture zones estimated from surface mapping matched thosefrom radar reflection and borehole televiewer surveys. No evidence was found for significant faults orpersistent weakness planes that paralleled the 1991 rockslide failure surfaces. Instead, the new observationswere consistent with dominant failure mechanisms that involve the progressive development of major shearand brittle fracture zones and the eventual destruction of intact rock bridges immediately prior to catastrophiccollapse. This integrated study provides the first reliable model of the 3-D fault structure associated with andcontributing to a large rock slope instability in a brittle crystalline rock mass.
© 2008 Elsevier B.V. All rights reserved.
Keywords:RockslideFracture mappingBorehole geophysicsSurface geophysics
1. Introduction
Landslide hazard evaluation and mitigation are becoming increas-ingly important due to progressive urban development in landslideprone-areas (Schuster, 1996; Petley et al., 2005). Considerableadvances have been made concerning the risk management of suchhazards with the development of improvedmitigation techniques andearly warning systems, based for example on displacement monitor-ing (Voight, 1989; Crosta and Agliardi, 2002) and remote sensingtechniques (Tarchi et al., 2003; Metternicht et al., 2005). However,progress would be greatly assisted by more knowledge of the internalstructures and mechanisms that control slope movements. This is
iversity of British Columbia,
al of Radioactive Waste/Nagra,
Trondheim, Norway.
l rights reserved.
particularly true for brittle rock masses where deformation rates maysuddenly accelerate to catastrophic failure. A challenging class oflandslides in this regard concerns those involving rock slopes inwhichthe persistent planes of weakness (bedding, foliation, etc.) dip into theslope. In this situation, the development of a through-going failuresurface, which is necessary for coherent slope failure to develop on asignificant scale, is obliged to occur through the progressive develop-ment of a shear surface stepping up and along non-persistent dis-continuities. This is generally a complex process that may involve thefracture of intact rock bridges to link and extend the rupture surface(Einstein et al., 1983). Detailed in-situ studies of active slopes areessential to better understand these processes (Hack, 2000; Godioet al., 2006).
In 2001, we established an in-situ laboratory on a large slowmoving crystalline rock mass located above the village of Randa in theMatter Valley of the Swiss Alps (Fig. 1). One of the key objectives hereinvolved the detailed characterisation of the 3-D geological structureof the rock mass through geological mapping and surface and bore-hole geophysics. The results of this characterisation are reported inthis paper.
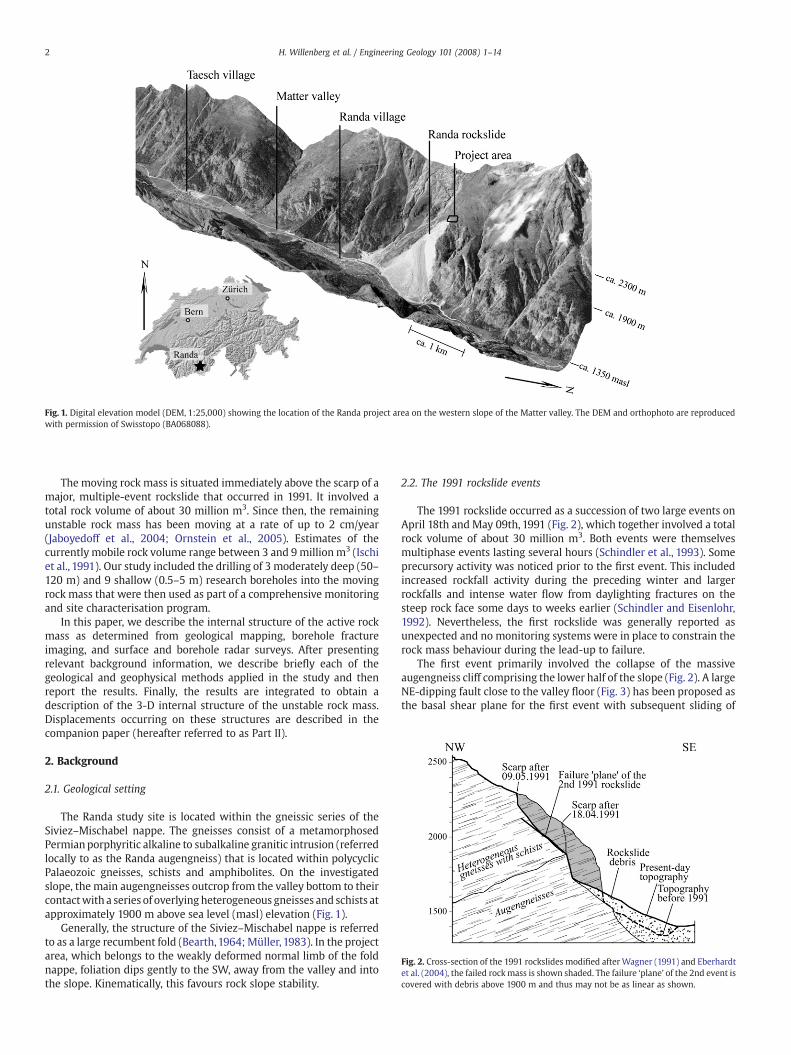
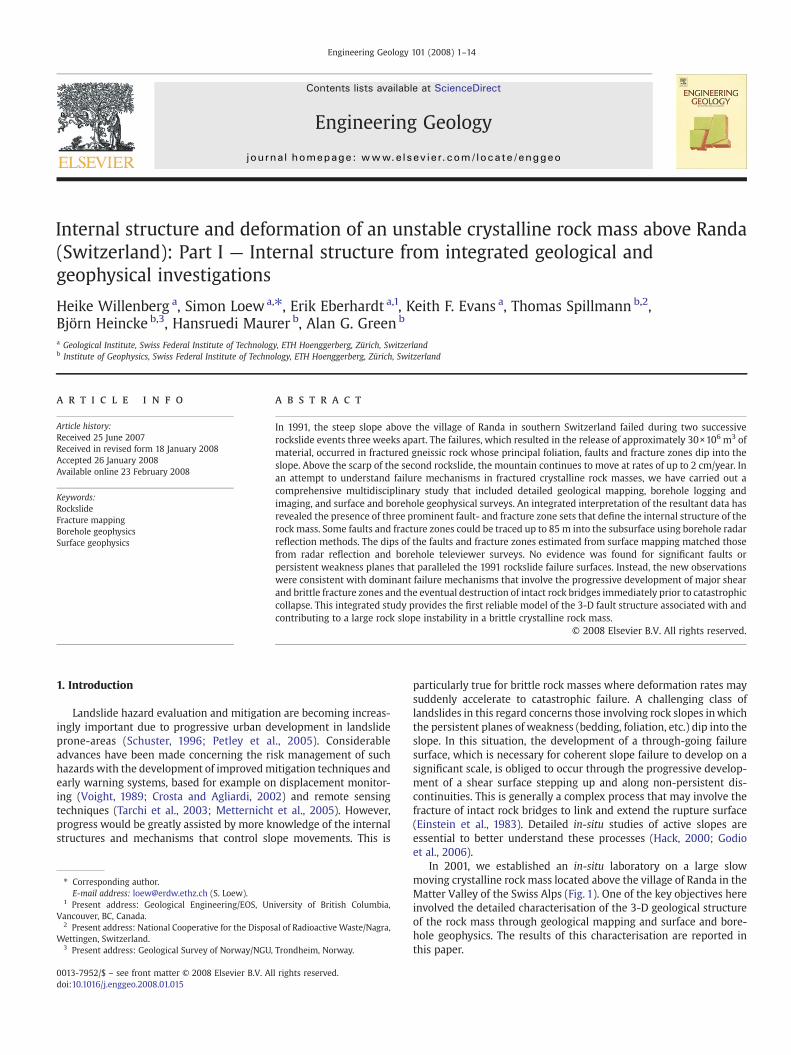
Fig. 1. Digital elevation model (DEM, 1:25,000) showing the location of the Randa project area on the western slope of the Matter valley. The DEM and orthophoto are reproducedwith permission of Swisstopo (BA068088).
Fig. 2. Cross-section of the 1991 rockslides modified after Wagner (1991) and Eberhardtet al. (2004), the failed rockmass is shown shaded. The failure ‘plane’ of the 2nd event iscovered with debris above 1900 m and thus may not be as linear as shown.
2 H. Willenberg et al. / Engineering Geology 101 (2008) 1–14
The moving rock mass is situated immediately above the scarp of amajor, multiple-event rockslide that occurred in 1991. It involved atotal rock volume of about 30 million m3. Since then, the remainingunstable rock mass has been moving at a rate of up to 2 cm/year(Jaboyedoff et al., 2004; Ornstein et al., 2005). Estimates of thecurrently mobile rock volume range between 3 and 9 millionm3 (Ischiet al., 1991). Our study included the drilling of 3 moderately deep (50–120 m) and 9 shallow (0.5–5 m) research boreholes into the movingrock mass that were then used as part of a comprehensive monitoringand site characterisation program.
In this paper, we describe the internal structure of the active rockmass as determined from geological mapping, borehole fractureimaging, and surface and borehole radar surveys. After presentingrelevant background information, we describe briefly each of thegeological and geophysical methods applied in the study and thenreport the results. Finally, the results are integrated to obtain adescription of the 3-D internal structure of the unstable rock mass.Displacements occurring on these structures are described in thecompanion paper (hereafter referred to as Part II).
2. Background
2.1. Geological setting
The Randa study site is located within the gneissic series of theSiviez–Mischabel nappe. The gneisses consist of a metamorphosedPermianporphyritic alkaline to subalkaline granitic intrusion (referredlocally to as the Randa augengneiss) that is located within polycyclicPalaeozoic gneisses, schists and amphibolites. On the investigatedslope, the main augengneisses outcrop from the valley bottom to theircontactwith a series of overlying heterogeneous gneisses and schists atapproximately 1900 m above sea level (masl) elevation (Fig. 1).
Generally, the structure of the Siviez–Mischabel nappe is referredto as a large recumbent fold (Bearth,1964; Müller, 1983). In the projectarea, which belongs to the weakly deformed normal limb of the foldnappe, foliation dips gently to the SW, away from the valley and intothe slope. Kinematically, this favours rock slope stability.
2.2. The 1991 rockslide events
The 1991 rockslide occurred as a succession of two large events onApril 18th and May 09th, 1991 (Fig. 2), which together involved a totalrock volume of about 30 million m3. Both events were themselvesmultiphase events lasting several hours (Schindler et al., 1993). Someprecursory activity was noticed prior to the first event. This includedincreased rockfall activity during the preceding winter and largerrockfalls and intense water flow from daylighting fractures on thesteep rock face some days to weeks earlier (Schindler and Eisenlohr,1992). Nevertheless, the first rockslide was generally reported asunexpected and no monitoring systems were in place to constrain therock mass behaviour during the lead-up to failure.
The first event primarily involved the collapse of the massiveaugengneiss cliff comprising the lower half of the slope (Fig. 2). A largeNE-dipping fault close to the valley floor (Fig. 3) has been proposed asthe basal shear plane for the first event with subsequent sliding of

Fig. 3. Topographic map of the project area before the 1991 rockslides. The tops of the scarps of the twomain rockslide events (April 18 andMay 9,1991) are indicated. The thin dottedlines are surface fractures that were seen to be active between the first and second rockslide events. The thin solid lines denote open surface fractures on the currently moving rockmass to the north and northwest of the rockslide scarp. The extent of the current instability NWof the 1991 rockslide scarp is based on geodetic monitoring data, which is described indetail in the companion paper (Part II). The NE-dipping fault indicated close to the valley floor is proposed to have acted as a basal sliding surface for the first 1991 rockslide event. Thearrows indicate the location of the section shown in Fig. 2.
3H. Willenberg et al. / Engineering Geology 101 (2008) 1–14
adjacent blocks in the SE direction along fractures dipping 40–50° tothe SE (mean orientation 110°/45°) (Wagner,1991; Sartori et al., 2003).The second event occurred in the overlying heterogeneous gneisses
Fig. 4. Location of the geological and geophysical survey areas. The focus of the investigatboreholes (SB 120, SB 50S and SB 50N) were drilled.
and formed a large SE-dipping failure surface (Fig. 2). Rudimentarydisplacement and fracture monitoring systems installed on theunstable rock mass shortly after the first event provided information
ions was the upper part of the unstable rock mass, where the three deep exploratory
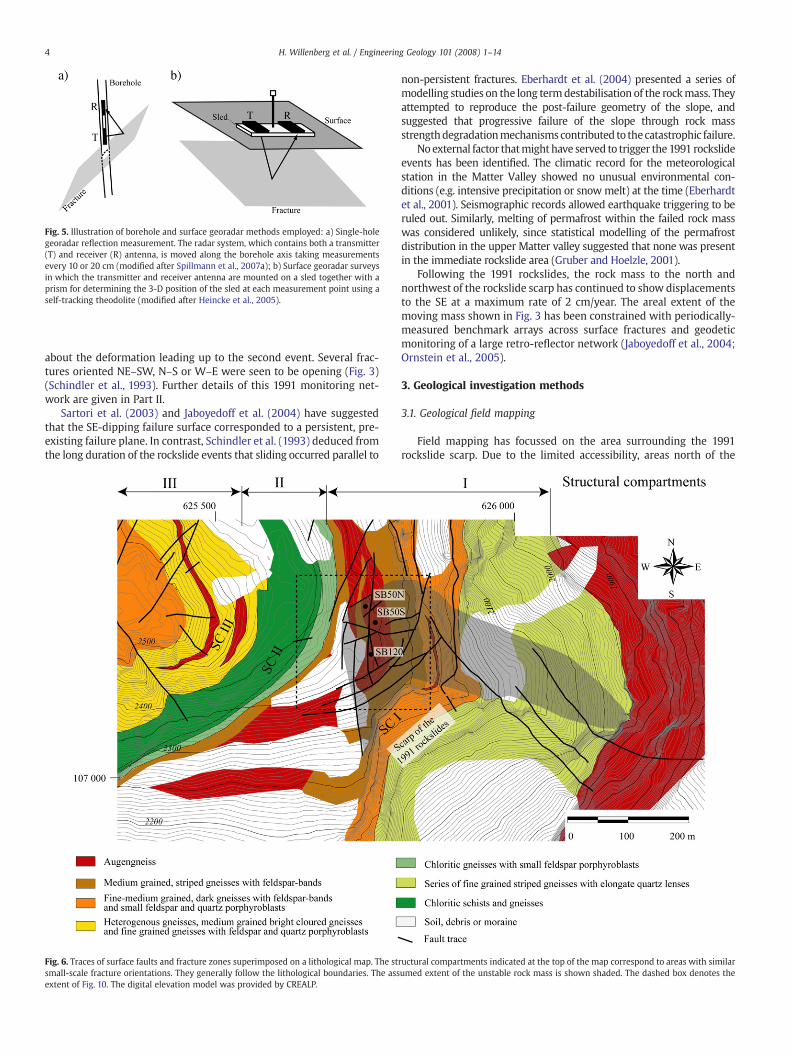
Fig. 5. Illustration of borehole and surface georadar methods employed: a) Single-holegeoradar reflection measurement. The radar system, which contains both a transmitter(T) and receiver (R) antenna, is moved along the borehole axis taking measurementsevery 10 or 20 cm (modified after Spillmann et al., 2007a); b) Surface georadar surveysin which the transmitter and receiver antenna are mounted on a sled together with aprism for determining the 3-D position of the sled at each measurement point using aself-tracking theodolite (modified after Heincke et al., 2005).
4 H. Willenberg et al. / Engineering Geology 101 (2008) 1–14
about the deformation leading up to the second event. Several frac-tures oriented NE–SW, N–S or W–E were seen to be opening (Fig. 3)(Schindler et al., 1993). Further details of this 1991 monitoring net-work are given in Part II.
Sartori et al. (2003) and Jaboyedoff et al. (2004) have suggestedthat the SE-dipping failure surface corresponded to a persistent, pre-existing failure plane. In contrast, Schindler et al. (1993) deduced fromthe long duration of the rockslide events that sliding occurred parallel to
Fig. 6. Traces of surface faults and fracture zones superimposed on a lithological map. The stsmall-scale fracture orientations. They generally follow the lithological boundaries. The assextent of Fig. 10. The digital elevation model was provided by CREALP.
non-persistent fractures. Eberhardt et al. (2004) presented a series ofmodelling studies on the long termdestabilisation of the rockmass. Theyattempted to reproduce the post-failure geometry of the slope, andsuggested that progressive failure of the slope through rock massstrengthdegradationmechanismscontributed to thecatastrophic failure.
No external factor thatmight have served to trigger the 1991 rockslideevents has been identified. The climatic record for the meteorologicalstation in the Matter Valley showed no unusual environmental con-ditions (e.g. intensive precipitation or snowmelt) at the time (Eberhardtet al., 2001). Seismographic records allowed earthquake triggering to beruled out. Similarly, melting of permafrost within the failed rock masswas considered unlikely, since statistical modelling of the permafrostdistribution in the upper Matter valley suggested that none was presentin the immediate rockslide area (Gruber and Hoelzle, 2001).
Following the 1991 rockslides, the rock mass to the north andnorthwest of the rockslide scarp has continued to show displacementsto the SE at a maximum rate of 2 cm/year. The areal extent of themoving mass shown in Fig. 3 has been constrained with periodically-measured benchmark arrays across surface fractures and geodeticmonitoring of a large retro-reflector network (Jaboyedoff et al., 2004;Ornstein et al., 2005).
3. Geological investigation methods
3.1. Geological field mapping
Field mapping has focussed on the area surrounding the 1991rockslide scarp. Due to the limited accessibility, areas north of the
ructural compartments indicated at the top of the map correspond to areas with similarumed extent of the unstable rock mass is shown shaded. The dashed box denotes the

Fig. 7. Orientation distributions of fractures (left) and foliation fractures (right) in eachof the three structural compartments: a) For SC I, which includes the unstable rockmass. Fracture sets 4 and 6 are absent from SC I, whereas fractures from set 8 are morefrequent. b) For SC II, which corresponds to the chloritic gneisses and schists, fracturesets 7 and 8 are absent. c) For SC III, which is situated above the unstable rock mass andthe chloritic gneisses and schists, fracture sets 1–7 are present. The projections arelower hemisphere.
Fig. 8. Stereonets showing the poles to faults and fracture zones mapped: a) on surface,and b) in the boreholes. Pure phyllonites parallel to foliation (i.e. without fracture) in theboreholes are not plotted. The projections are lower hemisphere.
5H. Willenberg et al. / Engineering Geology 101 (2008) 1–14
scarp below 2300 masl elevation could only be partly mapped.Lithological units were distinguished on the basis of field estimates ofquartz–feldspar content, grain size, mica content, petrographicheterogeneity on the decimeter- to meter-scale, and the presence ofsmall-scale deformation structures such as micro-folds. The locationsof surface fault and fracture-zone traces were determined fromoutcrop mapping and the identification of morphologic lineaments. Atectonic structure was mapped as a fault if indications of significantdifferential displacement by brittle failure were found (Ramsay andHuber, 1987), such as the presence of slickensides, Riedel fractures orcataclastic and gouge-type fabrics. Phyllonites (i.e. mm–cm thickdensely foliated schistous gneisses) were mapped as ductile shearzones. Intense brittle fracturing over dm-wide zones with only minordifferential displacement was used to identify fracture zones. In termsof their scale, faults and fracture zones could also be distinguishedfrom fractures by their several tens of meters extent.
Outcrop mapping of the small-scale fracture network (i.e. fracturesb10 m in length) was performed over the entire mapping area. Inaddition, scanline measurements were made along four lines of 40–140 m length on large rock faces in various lithologies, both in theunstable and stable parts of the investigated rock mass (see Fig. 4). The
scanline mapping followed procedures recommended by Priest (1993).In this paper, only the orientation data is presented; for analyses of thenormal set spacing and mean trace length see Willenberg (2004).
The subsurface investigations included a 120-m and two 50-mdeep, pneumatically drilled boreholes (denoted as SB 120, SB 50S andSB 50N in Fig. 4). The locations of the three boreholes were chosenbased on existing monitoring results, drilling logistics, the spatialrequirements for active crosshole seismic and radar experiments andsurface topography. The holes were found to be dry except for thelowermost 10 m of SB 120. After drilling, a suite of wireline logs wasrun. They consisted of a 4-arm borehole geometry log for determiningthe hole trajectory (azimuth and inclination) and cross-section, aspectral gamma log for identification of lithology, and an opticalteleviewer (OTV) log to provide oriented images of the borehole wall.Minor and major fractures were distinguished on the basis of thethickness of their traces in the OTV images. Schistose bands orfractures with openings N2 mmwere regarded as major fractures andhence classified as faults. Full-waveform sonic logs were also run inthe 50 m boreholes after PVC inclinometer casing had been cementedin place and could be filled with water.
The mechanical properties of the various lithologies were obtainedby testing the core samples recovered from the nine 0.5–5 m deepboreholes drilled for the installation of shallow seismic sensors(locations shown in Fig. 4). Static Young's modulus and Poisson's ratiowere determined from uniaxial and triaxial compression tests per-formed at the University of Saskatchewan's (Canada) Rock MechanicsLaboratory. P- and S-wave velocities were measured in-house underdifferent hydrostatic pressures (Heincke et al., 2006b).
4. Geophysical investigation methods
4.1. Borehole georadar experiments
Borehole georadar data were recorded in each of the three deepboreholes using both single-hole radar reflection and vertical radar

6 H. Willenberg et al. / Engineering Geology 101 (2008) 1–14
profiling (VRP) methods and crosshole techniques. These boreholemethods allowed the electromagnetic reflection characteristics of therock mass to be investigated at depths greater than could be reachedusing surface georadar approaches. Borehole reflection methods areparticularly useful for imaging steeply dipping fractures as shown inFig. 5a (Olsson et al., 1992; Tronicke and Knoll, 2005). At Randa, itinvolved the progressive movement of a fixed-offset transmitter–receiver antenna pair (MALA system with 100 MHz antennas) alongthe borehole. The interpretation of the reflections that intersected theborehole walls was constrained by the televiewer images (Spillmannet al., 2007). Fortunately, some reflections that did not cut theboreholes and hence could not be directly oriented (single-holegeoradar images by themselves contain no azimuthal information asto the direction of the reflector) could be projected to faults andfracture zones mapped on surface, thus allowing their orientation tobe derived.
Fig. 9. Outcrop and borehole examples of faults and fracture zones. a) Brittle–ductile sheasecondary fractures (hatched area below). b) Open surface fracture belonging to an F-2 set faucore, highlighted by a thick solid line, is accompanied by a fracture zone. d) Sketch of two Fphyllonites oriented parallel to foliation. e) F-2 borehole fault characterised by a 10 cm thick zfracture zone.
The VRP data were gathered in SB 50S and SB 50N along a surfaceprofile between the boreholes, and in SB 120 to a depth of 50.5 musing a surface line that extended out to 28.5 m from the hole towardsthe north (see Fig. 4). Georadar crosshole tomography between thetwo 50 m deep boreholes yielded estimates of radar velocity andattenuation between the boreholes (Spillmann et al., 2007). Theresults of the VRP and crosshole experiments are not reported in thispaper as they provided only limited useful data (Spillmann et al.,2007).
4.2. 3-D surface georadar
The 3-D surface georadar technique has the potential to imagefaults and fracture zones within crystalline rock masses with highresolution and accuracy (Grasmück, 1996), but the penetration depthis usually limited to several tens of meters due to attenuation and
r zone parallel to foliation (set F-1), accompanied by Riedel fractures (top) and set 8lt that is spanned by a crackmeter. c) Brittle–ductile fault of the F-3 set. The central fault-1 faults seen in the borehole OTV logs. Unwrapping of the borehole wall image showsone of densely foliated and fractured rock. f) Open borehole fracture belonging to an F-3
7H. Willenberg et al. / Engineering Geology 101 (2008) 1–14
scattering effects. The Randa surface georadar data were acquiredacross two overlapping 480–850 m2 areas (Fig. 4). Two unshielded100 MHz antennae mounted on a sled (Fig. 5b) were used to recorddata along densely spaced parallel lines (Heincke et al., 2005). Afterpre-processing, migration of the data accounting for topographyproduced images of moderately to shallowly dipping features(Heincke et al., 2005). To map steeply dipping structures characterisedby rough surfaces, a new scheme that highlighted the presence ofdiffractions was developed and applied to the georadar data (Heinckeet al., 2006a). This new semblance-based migration scheme, whichalso accounts for the influence of topography, was effective in map-ping the locations of numerous steeply dipping structures throughoutthe depth range of interest.
4.3. 3-D seismic refraction tomography
Unlike the georadar techniques, the 3-D tomographic seismicrefraction method does not have the resolution to determine thelocations and orientations of discrete fault and fracture zones.However, the distribution of low and high P-wave velocities withinthe rock mass is a measure of the degree of fracturing. Several casestudies using 2-D refraction tomography on unstable rock slopes havepreviously been reported (Hack, 2000; Godio et al., 2006). To ourknowledge, our survey was the first to involve a true 3-D approach(Heincke et al., 2006b).
The Randa seismic survey was designed to cover accessible parts ofthe unstable rock mass and large regions of the presumed stablemountain slope (Fig. 4). The primary layout involved eight profiles,five oriented in an E–W direction and 3 oriented in a N–S direction.Source and receiver spacings along the 126–324 m long profiles were
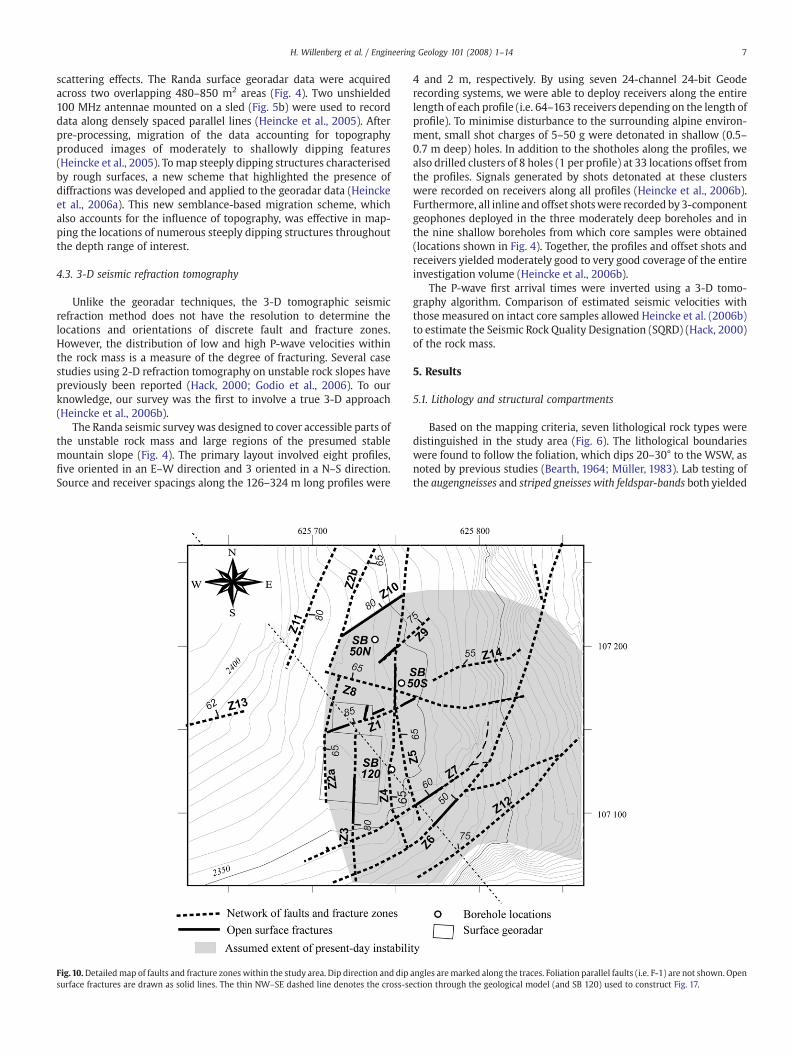
Fig.10.Detailedmap of faults and fracture zones within the study area. Dip direction and dipsurface fractures are drawn as solid lines. The thin NW–SE dashed line denotes the cross-se
4 and 2 m, respectively. By using seven 24-channel 24-bit Geoderecording systems, we were able to deploy receivers along the entirelength of each profile (i.e. 64–163 receivers depending on the length ofprofile). To minimise disturbance to the surrounding alpine environ-ment, small shot charges of 5–50 g were detonated in shallow (0.5–0.7 m deep) holes. In addition to the shotholes along the profiles, wealso drilled clusters of 8 holes (1 per profile) at 33 locations offset fromthe profiles. Signals generated by shots detonated at these clusterswere recorded on receivers along all profiles (Heincke et al., 2006b).Furthermore, all inline and offset shotswere recorded by3-componentgeophones deployed in the three moderately deep boreholes and inthe nine shallow boreholes from which core samples were obtained(locations shown in Fig. 4). Together, the profiles and offset shots andreceivers yielded moderately good to very good coverage of the entireinvestigation volume (Heincke et al., 2006b).
The P-wave first arrival times were inverted using a 3-D tomo-graphy algorithm. Comparison of estimated seismic velocities withthose measured on intact core samples allowed Heincke et al. (2006b)to estimate the Seismic Rock Quality Designation (SQRD) (Hack, 2000)of the rock mass.
5. Results
5.1. Lithology and structural compartments
Based on the mapping criteria, seven lithological rock types weredistinguished in the study area (Fig. 6). The lithological boundarieswere found to follow the foliation, which dips 20–30° to the WSW, asnoted by previous studies (Bearth, 1964; Müller, 1983). Lab testing ofthe augengneisses and striped gneisses with feldspar-bands both yielded
angles aremarked along the traces. Foliation parallel faults (i.e. F-1) are not shown. Openction through the geological model (and SB 120) used to construct Fig. 17.
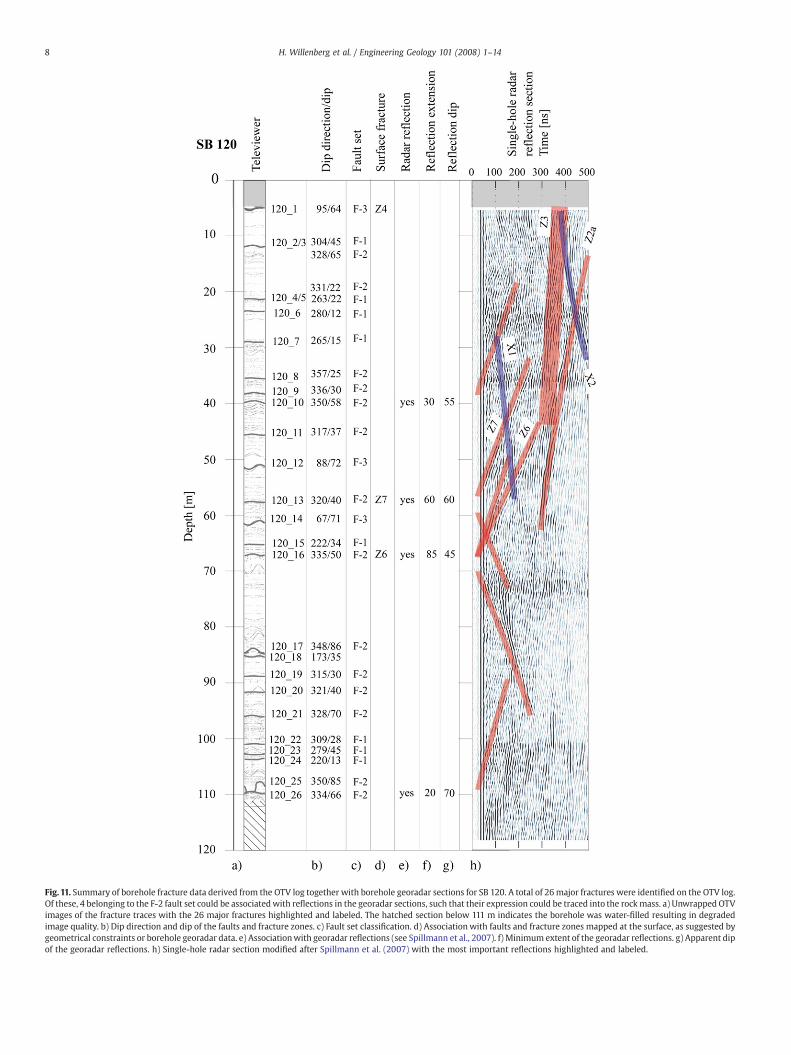
Fig. 11. Summary of borehole fracture data derived from the OTV log together with borehole georadar sections for SB 120. A total of 26major fractures were identified on the OTV log.Of these, 4 belonging to the F-2 fault set could be associatedwith reflections in the georadar sections, such that their expression could be traced into the rockmass. a) Unwrapped OTVimages of the fracture traces with the 26 major fractures highlighted and labeled. The hatched section below 111 m indicates the borehole was water-filled resulting in degradedimage quality. b) Dip direction and dip of the faults and fracture zones. c) Fault set classification. d) Associationwith faults and fracture zones mapped at the surface, as suggested bygeometrical constraints or borehole georadar data. e) Associationwith georadar reflections (see Spillmann et al., 2007). f) Minimum extent of the georadar reflections. g) Apparent dipof the georadar reflections. h) Single-hole radar section modified after Spillmann et al. (2007) with the most important reflections highlighted and labeled.
8 H. Willenberg et al. / Engineering Geology 101 (2008) 1–14
9H. Willenberg et al. / Engineering Geology 101 (2008) 1–14
mean uniaxial compressive strengths of σUCS=97 MPa, which is com-parable to those reported byGirod (1999). Lower values ofσUCS=69MPawere obtained for the fine grained chloritic gneisses with small feldsparporphyroblasts, which lie above the transition from unstable to stableground.
Fracture orientations for the entire study area were found to behighly variable, which suggests that the mapped area incorporatesseveral structural compartments (SC) with different preferred orienta-tions. The degree of scatter in the data could be reasonably minimisedby defining three structural compartments whose boundaries followthose of the lithological units (Fig. 6). Structural compartment SC Iextends along the northern scarp of the 1991 rockslide boundarybetween 1900 to 2380 masl and includes the region of the currentinstability. Structural compartment SC II, immediately above SC I,comprises the chloritic gneisses, whereas SC III includes the top of thestudy area from 2440 to 2450 masl.
5.2. Fracture systems
Poles to all fractures (i.e. excluding faults and fracture zones)mapped within the three structural compartments are shown in thestereonets of Fig. 7. Foliation fractures are common and have the sameorientation in each of the three structural compartments. A total ofeight non-foliation fracture sets are recognised, with each individualstructural compartment containing six to seven sets. Sets 1–5 aresteep fractures that are dominant and appear in all structuralcompartments, with the exception of set 4 which is absent from SCI. Members of set 1 dip to the NE and are normal to both the foliationand the axis of the large recumbent fold of the SiviezMischabel nappe.Sets 2–5 also include tectonic fractures related to the nappe structure
Fig. 12. Summary of borehole fracture data for bo
and stress release fractures. The wide scatter of these sets is mostlikely related to the presence of lithologic variability, large scalefolding and faulting, and complex stress release features in the Mattervalleywhich gradually changes its trend fromN–S to E–W. None of thethree moderately inclined fracture sets (6–8) are present in all threestructural compartments. Set 6 was mapped mostly in SC II and III. Incontrast, sets 7–8 primarily appear in SC I and thus are largely limitedto the unstable part of the rock mass. Fractures belonging to set 7,which dip at 30–60° to the NW, are more frequent than those of set 8,which is in the opposite direction to the SE-directed movement of theunstable rock mass. As such, the set 7 fractures cannot play a sig-nificant role in the development of a basal sliding surface. The set 8fractures dip shallowly to the south and are thus sub-parallel to thetopographic surface of the unstable rock mass and its vector ofmovement. Hence, they are favourably oriented for accommodatingsliding. However, their frequency and persistence is insufficient forthem to serve as or to form an extensive basal or internal slidingsurface (Willenberg, 2004). In terms of genesis, they are possiblyunloading fractures, although their proximity to the foliation-parallelfaults suggests a tectonic origin.
5.3. Faults and fracture zones
The network of steep tomoderately inclined fault and fracture zonesmapped in the study area is shown in Fig. 6. These were identified bycombining results of surface mapping and analyses of aerial photo-graphs with analyses of orthophotos of the region. The poles of faultsand fracture zones are displayed in the stereonet of Fig. 8a. Those ofmajor fractures/faults intersecting the boreholes (i.e. thickness of thetrace on the OTV image N2 mm) are shown in Fig. 8b. These two
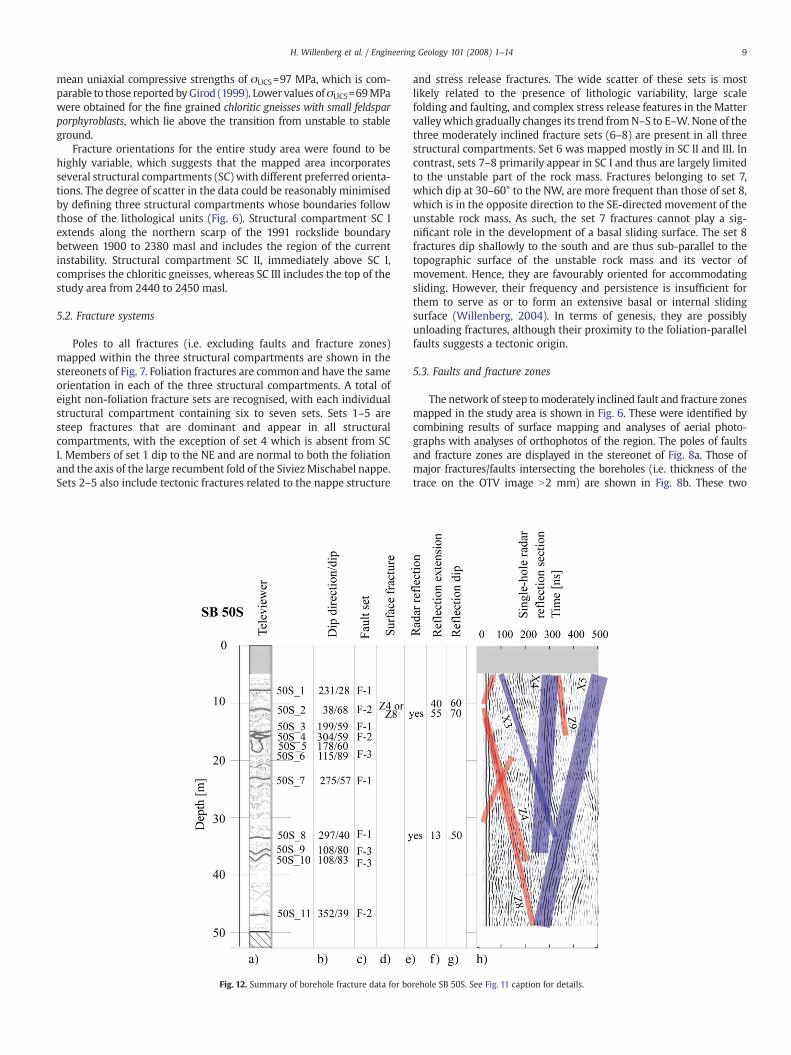
rehole SB 50S. See Fig. 11 caption for details.
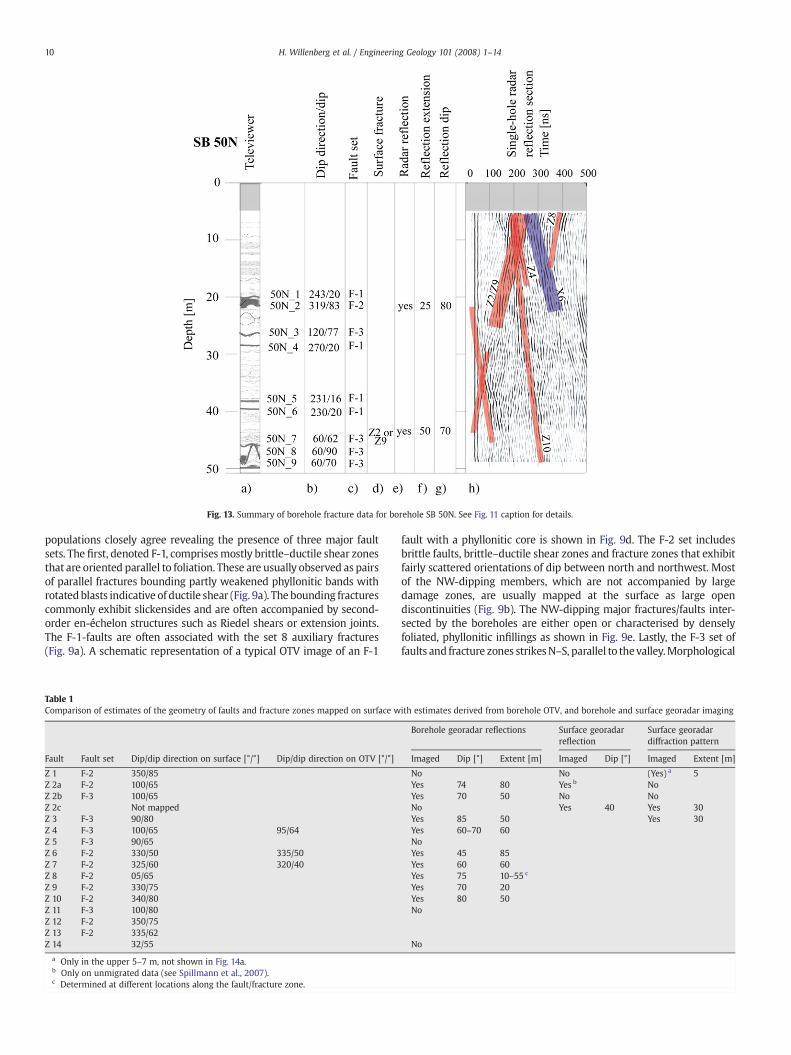
Fig. 13. Summary of borehole fracture data for borehole SB 50N. See Fig. 11 caption for details.
10 H. Willenberg et al. / Engineering Geology 101 (2008) 1–14
populations closely agree revealing the presence of three major faultsets. The first, denoted F-1, comprisesmostly brittle–ductile shear zonesthat are oriented parallel to foliation. These are usually observed as pairsof parallel fractures bounding partly weakened phyllonitic bands withrotatedblasts indicative of ductile shear (Fig. 9a). The bounding fracturescommonly exhibit slickensides and are often accompanied by second-order en-échelon structures such as Riedel shears or extension joints.The F-1-faults are often associated with the set 8 auxiliary fractures(Fig. 9a). A schematic representation of a typical OTV image of an F-1
Table 1Comparison of estimates of the geometry of faults and fracture zones mapped on surface w
Fault Fault set Dip/dip direction on surface [°/°] Dip/dip direction on OTV [°/°]
Z 1 F-2 350/85Z 2a F-2 100/65Z 2b F-3 100/65Z 2c Not mappedZ 3 F-3 90/80Z 4 F-3 100/65 95/64Z 5 F-3 90/65Z 6 F-2 330/50 335/50Z 7 F-2 325/60 320/40Z 8 F-2 05/65Z 9 F-2 330/75Z 10 F-2 340/80Z 11 F-3 100/80Z 12 F-2 350/75Z 13 F-2 335/62Z 14 32/55
a Only in the upper 5–7 m, not shown in Fig. 14a.b Only on unmigrated data (see Spillmann et al., 2007).c Determined at different locations along the fault/fracture zone.
fault with a phyllonitic core is shown in Fig. 9d. The F-2 set includesbrittle faults, brittle–ductile shear zones and fracture zones that exhibitfairly scattered orientations of dip between north and northwest. Mostof the NW-dipping members, which are not accompanied by largedamage zones, are usually mapped at the surface as large opendiscontinuities (Fig. 9b). The NW-dipping major fractures/faults inter-sected by the boreholes are either open or characterised by denselyfoliated, phyllonitic infillings as shown in Fig. 9e. Lastly, the F-3 set offaults and fracture zones strikesN–S, parallel to thevalley.Morphological
ith estimates derived from borehole OTV, and borehole and surface georadar imaging
Borehole georadar reflections Surface georadarreflection
Surface georadardiffraction pattern
Imaged Dip [°] Extent [m] Imaged Dip [°] Imaged Extent [m]
No No (Yes) a 5Yes 74 80 Yes b NoYes 70 50 No NoNo Yes 40 Yes 30Yes 85 50 Yes 30Yes 60–70 60NoYes 45 85Yes 60 60Yes 75 10–55 c
Yes 70 20Yes 80 50No
No

11H. Willenberg et al. / Engineering Geology 101 (2008) 1–14
depressions are commonly associated with these structures, butexposures in outcrops are scarce. Large fracture zones with or withouta fault core are typical for this set (Fig. 9c).
Fig. 14. a) Orthophoto of the study areawith an overlay of fault and fracture zone traces inferreof the instability is outlined with a blue dotted line. The green lines are segments of the fauassociatedwith borehole georadar reflectors are highlighted. The red dashed lines are high-anreproduced with permission of Swisstopo (BA068088). b) Thickness of ultralow velocity zoneet al., 2006b) with overlay of surface mapped faults and fracture zones. Thick ultralow veloc
It is evident from Fig. 6 that the density of faults and fracture zonesis higher inside the estimated boundaries of the current slopeinstability than outside. A close-up of this area is shown in Fig. 10.
d frommapping, lineament analysis and/or radar reflection surveys. The assumed extentlts and fracture zones that are open on surface. Faults and fracture zones that could begle planes indicated by high semblance values of the 3-D radar survey. The orthophoto iss (b1500 m/s) determined from seismic refraction tomography (modified after Heinckeity zones occur within the estimated boundaries of the unstable rock mass and beyond.
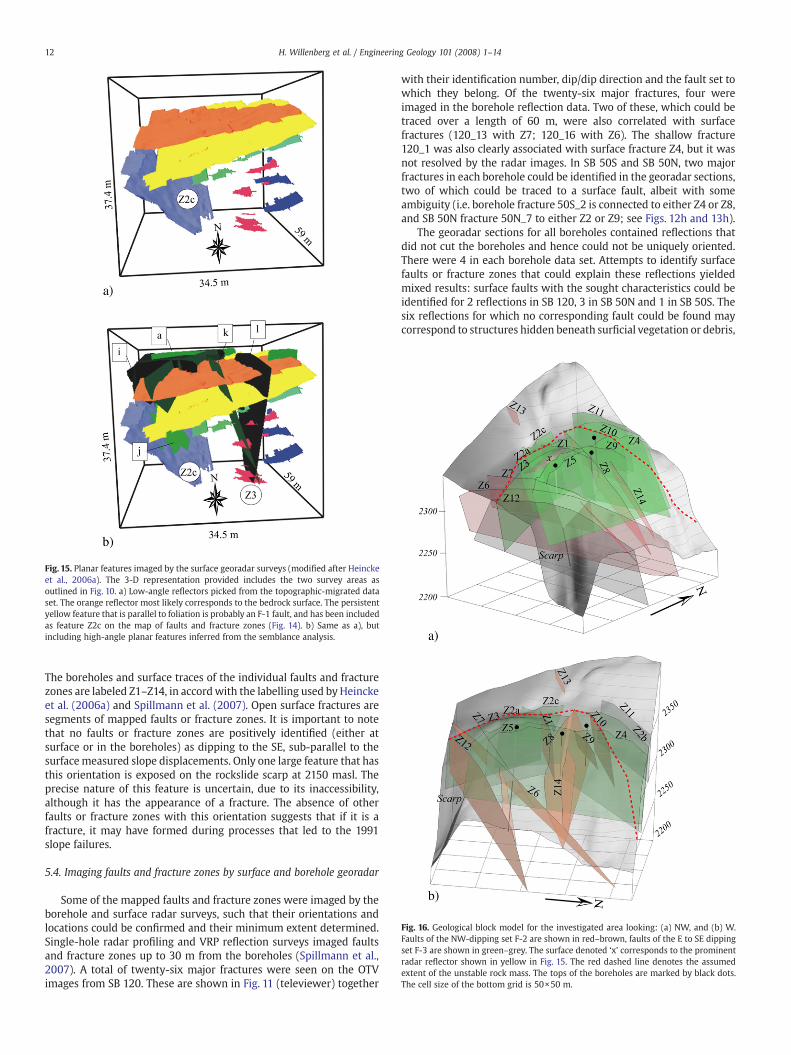
Fig. 15. Planar features imaged by the surface georadar surveys (modified after Heinckeet al., 2006a). The 3-D representation provided includes the two survey areas asoutlined in Fig. 10. a) Low-angle reflectors picked from the topographic-migrated dataset. The orange reflector most likely corresponds to the bedrock surface. The persistentyellow feature that is parallel to foliation is probably an F-1 fault, and has been includedas feature Z2c on the map of faults and fracture zones (Fig. 14). b) Same as a), butincluding high-angle planar features inferred from the semblance analysis.
Fig. 16. Geological block model for the investigated area looking: (a) NW, and (b) W.Faults of the NW-dipping set F-2 are shown in red–brown, faults of the E to SE dippingset F-3 are shown in green–grey. The surface denoted ‘x’ corresponds to the prominentradar reflector shown in yellow in Fig. 15. The red dashed line denotes the assumedextent of the unstable rock mass. The tops of the boreholes are marked by black dots.The cell size of the bottom grid is 50×50 m.
12 H. Willenberg et al. / Engineering Geology 101 (2008) 1–14
The boreholes and surface traces of the individual faults and fracturezones are labeled Z1–Z14, in accordwith the labelling used by Heinckeet al. (2006a) and Spillmann et al. (2007). Open surface fractures aresegments of mapped faults or fracture zones. It is important to notethat no faults or fracture zones are positively identified (either atsurface or in the boreholes) as dipping to the SE, sub-parallel to thesurfacemeasured slope displacements. Only one large feature that hasthis orientation is exposed on the rockslide scarp at 2150 masl. Theprecise nature of this feature is uncertain, due to its inaccessibility,although it has the appearance of a fracture. The absence of otherfaults or fracture zones with this orientation suggests that if it is afracture, it may have formed during processes that led to the 1991slope failures.
5.4. Imaging faults and fracture zones by surface and borehole georadar
Some of the mapped faults and fracture zones were imaged by theborehole and surface radar surveys, such that their orientations andlocations could be confirmed and their minimum extent determined.Single-hole radar profiling and VRP reflection surveys imaged faultsand fracture zones up to 30 m from the boreholes (Spillmann et al.,2007). A total of twenty-six major fractures were seen on the OTVimages from SB 120. These are shown in Fig. 11 (televiewer) together
with their identification number, dip/dip direction and the fault set towhich they belong. Of the twenty-six major fractures, four wereimaged in the borehole reflection data. Two of these, which could betraced over a length of 60 m, were also correlated with surfacefractures (120_13 with Z7; 120_16 with Z6). The shallow fracture120_1 was also clearly associated with surface fracture Z4, but it wasnot resolved by the radar images. In SB 50S and SB 50N, two majorfractures in each borehole could be identified in the georadar sections,two of which could be traced to a surface fault, albeit with someambiguity (i.e. borehole fracture 50S_2 is connected to either Z4 or Z8,and SB 50N fracture 50N_7 to either Z2 or Z9; see Figs. 12h and 13h).
The georadar sections for all boreholes contained reflections thatdid not cut the boreholes and hence could not be uniquely oriented.There were 4 in each borehole data set. Attempts to identify surfacefaults or fracture zones that could explain these reflections yieldedmixed results: surface faults with the sought characteristics could beidentified for 2 reflections in SB 120, 3 in SB 50N and 1 in SB 50S. Thesix reflections for which no corresponding fault could be found maycorrespond to structures hidden beneath surficial vegetation or debris,

13H. Willenberg et al. / Engineering Geology 101 (2008) 1–14
or which do not extend to the surface. The analysis of the VRP datafurther constrained the extent of surface fault Z3. Additional detailscan be found in Spillmann et al. (2007).
A comparison of fault/fracture zone geometry obtained fromsurface mapping with data obtained from the borehole OTV imagesand the various radar reflection structures is given in Table 1 andillustrated in Fig. 14a. The continuity and scale of the faults andfracture zones on the surface suggest that they extendmore than 80minto the subsurface, a result supported by the single-hole radarsurveys. Comparison of the dip angles of the radar reflectionsdemonstrates that they generally agree with the mapped dips towithin 10°. The dip estimates from the OTV are also in reasonableagreement, the primary discrepancy being for surface fault Z7, forwhich the OTV dip differs by 20° from that obtained from surfacemapping and the borehole georadar data.
The two 3-D surface georadar surveys had a penetration depth ofabout 40 m (Heincke et al., 2005). Reflectors identified from thetopographically migrated data set are shown in Fig. 15a in an imagevolume containing the two adjacent areas shown in Fig. 4. Since themajority are low-angle and parallel to foliation, they are likely F-1faults. High-angle faults are absent because they do not give rise toreflections from the near-vertical incident waves. A prominentreflector that dips at 35–40° to the east, and thus cuts the foliation,can be seen on the left side of the image volume. This is undoubtedly afault or fracture zone, but no mapped fault or lineament is present atits extrapolated intersectionwith the surface. Since it is closest to Z2a,it is designated Z2c. Its expected surface expression is included in themap of surface faults and fracture zones (Fig. 14).
High-angle faults and fracture zones with dips greater than 70°were imaged in the semblance-basedmigrated data set (Heincke et al.,2006a). This processing identified 13 steeply dipping planes, 6 ofwhich extend further than 5 m into the rock mass. These 6 planes,
Fig. 17. NW–SE section through SB 120 showing the F-1 to F-3 fault/fracture sets. The locationand geophysical methods are plotted as bold solid lines. Bold dashed lines indicate the locatiowere situated outside the survey areas. Also shown is the approximate location of the extrapparallel to the debris covered failure surface and based on a rare SE-dipping feature on the
shown in Figs. 14a and 15b, largely coincide with faults and fracturezones mapped on the surface and reflectors identified in the single-hole radar data. A surprising result was that the prominent opensurface fault Z1 (Fig. 14a) was seen to coincide with high semblancevalues in the uppermost 5 m, but not below.
5.5. P-wave velocity distribution
The P-wave velocities in the upper 30 m of the study area obtainedfrom the surface seismic refraction survey range from 0.5 to 4.0 km/s(Heincke et al., 2006b). Extremely low velocities are found close tofaults and fracture zones, particularly within the unstable rock mass.They extend to at least 30 m depth in some regions (see Fig. 14b).However, low velocities extending to depth are also found to the westof the estimated transition from unstable to stable rock. It is unlikelythat such low velocities are related to lithology, because velocitiesgreater than 3 km/s are found in the same units to the northwest.Rather, these extremely low velocities are evidence for very lowquality, possibly unstable, rock that extends beyond the measuredregion of mobile rock. This zone may extend even further to the west(beyond the low velocities shown in Fig. 14b), but this could notbe delineated with our deployment of seismic sources and receivers(Fig. 4).
6. Structural interpretation and conclusions
The combined geological and geophysical investigation haspermitted a 3-D geological model of the complex internal structureof the unstable slope to be constructed (Fig. 16). The internal structureis dominated by steeply to moderately inclined faults and fracturezones that dip to the NW and E to SE (F-2 and F-3). The NW-dippingfaults are prominent in the area near the boreholes, particularly at
of the cross-section is shown in Fig. 10. Faults and fracture zones mapped by geologicaln of surface faults and fracture zones that were not identified on the geophysical data orolated failure surface of the second 1991 rockslide, assuming a constant dip angle of 40°scarp.
14 H. Willenberg et al. / Engineering Geology 101 (2008) 1–14
depth in SB 120 (Fig. 16b). Further to the NW, these faults are lesspersistent. The ESE-dipping faults dominate the rock mass near thewestern boundary of the unstable rock mass. This boundary likelyfollows the complex zone of faults and fracture zones Z2, Z3, Z2b, Z2cand Z11 (Fig. 16a).
The absence of clear lateral boundaries to the unstable rock massmay be linked to the multitude of faults and fracture zones that serveto dissect the slope into an assemblage of blocks. No clear through-going basal sliding surface, separating stable from unstable rock,dipping towards the valley has been identified. Several authors haveproposed that the large inclined failure plane of the second 1991rockslide (Fig. 2) extends under the study area (Sartori et al., 2003;Jaboyedoff et al., 2004). This plane dips at 140°/40° and is coveredwithdebris above 1900 m, so its roughness and conformity to planarity areuncertain. A cross-section through the derived 3-D model (Fig. 17)shows the extrapolation of this plane under the study area. Given a dipof 40° it would not intersect SB 120; a dip greater than 41° would berequired for it to intersect SB 120. Thus, its absence in SB 120 cannot betaken as evidence that it does not exist.
We emphasize that except for one large fracture-like featureobserved on the rockslide scarp from a distance, there is no evidencefor significant persistent faults or weakness planes that parallel thefailure ‘plane’ of the second 1991 rockslide in surface outcrops, eitherin the borehole images or in the various geophysical data acquired atthe study site. This suggests that the present rock slope instability maynot be controlled by a pre-existing, highly persistent geological featurebut instead may be developing through the progressive coalescence ofsmall-scale discontinuities and the destruction of intact rock bridges.The time scale onwhich this process will occur is uncertain. Schindleret al. (1993) proposed that the hours-to-days duration of the 1991rockslide events coincided with the development of the eventualfailure plane. Although it is probable that the detailed demarcation andstrength loss of the plane occurred during this period, the degree towhich it had already been defined through progressive developmentand coalescence of discontinuities during the preceding phase ofsteady-state displacement is uncertain.
To address this question, it is of interest to establish the internaldeformations that are occurring within the currently unstable rockmass, which is moving to the SE at a nearly constant rate (based onmeasurements carriedout during thefiveyear studyperiod). These formthe basis of the companion paper (Part II) in which we integrate theavailable surface and borehole deformation data in an attempt to placeconstraints on the kinematics of the unstable rock slope movements.
Acknowledgements
This multidisciplinary project benefited from many contributions,including valuable input from Prof. Herbert Einstein (MIT) on thedoctoral thesis work of Heike Willenberg on which a large part of thispaper is based. Klaus Brauch (Terratec, Heitersheim) provided the toolsfor analysing the optical televiewer images and the Centre de Recherchésur l'EnvironmentAlpin (CREALP) provided thedigital terrainmodel andgeodetic survey data. The planning of the project was supported byHans-Rudolf Keusen and Bernhard Krummenacher (Geotest AG). Therock mechanical testing was performed by Zig Szczepanik at theUniversity of Saskatchewan. This project is financed by the SwissNational Science Foundation (Project No. 2100-059238.99).
References
Bearth, P., 1964. Geologischer Atlas der Schweiz - Erläuterungen zum Blatt Randa.Geologischer Atlas der Schweiz 1:25000. Kümmerly & Frey, Bern. 27 pp.
Crosta, G.B., Agliardi, F., 2002. How to obtain alert velocity thresholds for largerockslides. Physics and Chemistry of the Earth 27, 1557–1565.
Eberhardt, E.,Willenberg,H., Loew, S.,Maurer,H.R., 2001. Active rockslides inSwitzerland—understanding mechanisms and processes. In: Kühne, M., Einstein, H.H., Krauter, E.,Klapperich, H., Pöttler, R. (Eds.), International Conference on Landslides — Causes,Impacts and Countermeasures. Verlag Glückauf, Davos, pp. 25–34.
Eberhardt, E., Stead, D., Coggan, J.S., 2004. Numerical analysis of initiation andprogressive failure in natural rock slopes — the 1991 Randa rockslide. InternationalJournal of Rock Mechanics and Mining Sciences 41 (1), 68–87.
Einstein, H.H., Veneziano, D., Baecher, G.B., O'Reilly, K.J., 1983. The effect of discontinuitypersistence on rock slope stability. International Journal of Rock Mechanics andMining Sciences 20 (1), 227–236.
Girod, F., 1999. Altération météorique de roche granitique en milieu alpin: le cas del'othogneiss associé à l'éboulement de Randa (Mattertal, Valais, Suisse). DoctoralThesis, Université de Lausanne, Lausanne, 207 pp.
Godio, A., Strobbia, C., De Bacco, G., 2006. Geophysical characterisation of a rockslide inan alpine region. Engineering Geology 83 (1–3), 273–286.
Grasmück, M., 1996. 3-D ground penetrating radar applied to fracture imaging in gneiss.Geophysics 61, 1050–1064.
Gruber, S., Hoelzle, M., 2001. Statistical modelling of mountain permafrost distribution:local calibration and incorporation of remotely sensed data. Permafrost and PeriglacialProcesses 12, 69–77.
Hack, R., 2000. Geophysics for slope stability. Surveys in geophysics 21, 423–448.Heincke, B., Green, A.G., van der Kruk, J., Horstmeyer, H., 2005. Acquisition and
processing strategies for 3-D georadar surveying a region characterized by ruggedtopography. Geophysics 70 (6), K53–K61.
Heincke, B., Green, A., van der Kruk, J., Willenberg, H., 2006a. Semblance-basedtopographic migration (SBTM): a method for identifying fracture zones in 3-Dgeoradar data. Near Surface Geophysics 4, 79–88.
Heincke, B., et al., 2006b. Characterizing an unstable mountain slope using shallow 2- and3-D seismic tomography. Geophysics 71 (6), B241–B256.
Ischi, H., Keusen, H.R. and Scheller, E., 1991. Randa, Kt. Wallis, Bergsturz Grossgufer vomApril/Mai 1991 - Zusammenfassender Bericht über die Aktivitäten der Geotest AG.91126, Geotest AG, Martigny.
Jaboyedoff, M., Ornstein, P., Rouiller, J.D., 2004. Design of a geodetic database andassociated tools for monitoring rock-slope movements: the example of the top ofRanda rockfall scar. Natural Hazards and Earth System Sciences 204 (4), 187–196.
Metternicht, G., Hurni, L., Gogu, R., 2005. Remote sensing of landslides: an analysis of thepotential contribution to geo-spatial systems for hazard assessment inmountainousenvironments. Remote Sensing of Environment 98 (2–3), 284–303.
Müller, R., 1983. Die Struktur der Mischabelfalte (Penninische Alpen). EclogaeGeologicae Helvetiae 76 (2), 391–416.
Olsson, O., Falk, L., Forslund, O., Lundmark, L., Sandberg, E., 1992. Borehole radar appliedto the characterization of hydraulically conductive fracture zones. GeophysicalProspecting 40, 109–142.
Ornstein, P., Jaboyedoff, M., Rouiller, J.D., 2005. RandaDB: un système de gestion demesures appliqué a la surveillance des mouvements de versants, Géoline 2005.Lyon, p. 11.
Petley, D.N., Dunning, S.A., Rosser, N.J., 2005. The analysis of global landslide riskthrough the creation of a database of worldwide landslide fatalities. In: Hungr, O.,Fell, R., Couture, R., Eberhardt, E. (Eds.), Landslide riskmanagement. Taylor & FrancisGroup, Vancouver.
Ramsay, J.G., Huber, M.I., 1987. The Techniques of Modern Structural Geology — Foldsand Fractures, 2. Academic Press Limited, London. 700 pp.
Sartori, M., Baillifard, F., Jaboyedoff, M., Rouiller, J.D., 2003. Kinematics of the 1991 Randarockslides (Valais, Switzerland). Natural Hazards and Earth System Sciences 3,423–433.
Schindler, C., Eisenlohr, T., 1992. Bergsturz Grossgufer bei Randa: Geologisch-geotechnische Expertise, Geologisches Institut ETH, Ingenieurgeologie, Zürich.
Schindler, C., Cuénod, Y., Eisenlohr, T., Joris, C.L., 1993. Die Ereignisse vom 18. April und 9.Mai 1991 bei Randa (VS) - ein atypischer Bergsturz in Raten. Eclogae GeologicaeHelvetiae 86 (3), 643–665.
Schuster, R.L., 1996. Socioeconomic significance of landslides. In: Turner, A.K., Schuster,R.L. (Eds.), Landslides: Investigation and Mitigation. National Academy Press,Washington, pp. 12–35.
Spillmann, T., et al., 2007. Characterization of an unstable rock mass based on boreholelogs and diverse borehole radar data. Journal of Applied Geophysics 61 (1), 16–38.
Tarchi, D., et al., 2003. Landslidemonitoring by using ground-based SAR interferometry:an example of application to the Tessina landslide in Italy. Engineering Geology 68(1–2), 15–30.
Tronicke, J., Knoll, M.D., 2005. Vertical radar profiling: influence of survey geometry onfirst-arrival traveltimes and amplitudes. Journal of Applied Geophysics 57 (3),179–191.
Voight, B., 1989. Relation to describe rate-dependent material failure. Science 243 (4888),200–203.
Wagner, A., 1991. Bergsturz Grossgufer Randa - Etude structurale et géomécanique,Centre de Recherches Scientifiques Fondamentales et Appliquées de Sion. Sion.
Willenberg, H., 2004. Geologic and kinematic model of a landslide in crystalline rock(Randa, Switzerland). PhD thesis Thesis, Swiss Federal Institute of Technology,Zürich, 184 pp.