international journal of productivity and performance ...€¦ · international journal of...
TRANSCRIPT

International Journal of Productivity and Performance ManagementImproving and evaluating performance with the Public Sector ScorecardMax Moullin,
Article information:To cite this document:Max Moullin, (2017) "Improving and evaluating performance with the Public Sector Scorecard",International Journal of Productivity and Performance Management, Vol. 66 Issue: 4, pp.442-458, doi:10.1108/IJPPM-06-2015-0092Permanent link to this document:http://dx.doi.org/10.1108/IJPPM-06-2015-0092
Downloaded on: 03 May 2017, At: 11:36 (PT)References: this document contains references to 66 other documents.To copy this document: [email protected] fulltext of this document has been downloaded 290 times since 2017*
Users who downloaded this article also downloaded:(2009),"Performance management in the public sector", International Journal of Public SectorManagement, Vol. 22 Iss 6 pp. 478-498 http://dx.doi.org/10.1108/09513550910982850(2017),"Implementing the balanced scorecard in a local government sport organization: Evidencefrom Greece", International Journal of Productivity and Performance Management, Vol. 66 Iss 3 pp.362-379 http://dx.doi.org/10.1108/IJPPM-11-2015-0167
Access to this document was granted through an Emerald subscription provided by emerald-srm:609289 []
For AuthorsIf you would like to write for this, or any other Emerald publication, then please use our Emeraldfor Authors service information about how to choose which publication to write for and submissionguidelines are available for all. Please visit www.emeraldinsight.com/authors for more information.
About Emerald www.emeraldinsight.comEmerald is a global publisher linking research and practice to the benefit of society. The companymanages a portfolio of more than 290 journals and over 2,350 books and book series volumes, aswell as providing an extensive range of online products and additional customer resources andservices.
Emerald is both COUNTER 4 and TRANSFER compliant. The organization is a partner of theCommittee on Publication Ethics (COPE) and also works with Portico and the LOCKSS initiative fordigital archive preservation.
*Related content and download information correct at time of download.
Dow
nloa
ded
by S
heff
ield
Hal
lam
Uni
vers
ity, M
r M
ax M
oulli
n A
t 11:
36 0
3 M
ay 2
017
(PT
)

Improving and evaluatingperformance with the
Public Sector ScorecardMax Moullin
Sheffield Business School, Sheffield Hallam University, Sheffield, UK
AbstractPurpose – The Public Sector Scorecard (PSS) is an integrated performance management frameworkincorporating strategy mapping, service improvement, and measurement and evaluation. It adapts andextends the balanced scorecard to suit the culture and values of the public and voluntary sectors. The purposeof this paper is to assess, with the aid of two case studies across organisational boundaries, how the PSSaddresses a number of critical success factors for performance management and improvement in the publicand third sectors.Design/methodology/approach – The research takes a case study approach assessing the use of the PSSfor the UK Ethnic Minority Employment Task Force, and for Sheffield Let’s Change4Life, a £10 millionprogramme addressing obesity in children and families.Findings – This paper concludes that the PSS is an effective framework to help organisations improveoutcomes for service users and stakeholders without increasing overall cost, and develop measures ofperformance that help them improve and assure quality without motivating staff to achieve arbitrary targetsat the expense of poor service to the public. Key to this is its emphasis on developing a performancemanagement culture based on improvement, innovation and learning rather than a top-down blame culture.Originality/value – There have been many research papers describing the problems and pitfalls of publicsector performance management, but few which offer a solution. A particular innovation is how the theory ofplanned behaviour was integrated with a performance management framework for a behaviour changeprogramme addressing childhood obesity.Keywords Public sector, Performance management, Balanced scorecard, Evaluation,Public Sector Scorecard, Strategy mappingPaper type Case study
1. IntroductionMost public and third sector organisations – both within and beyond Europe – are strugglingwith two major problems: improving outcomes for service users and other key stakeholderswithout increasing overall cost; and developing measures of performance that help themimprove and assure quality without motivating staff to achieve arbitrary targets at the expenseof poor service to the public. This paper examines how the Public Sector Scorecard (PSS)(Moullin, 2002) an integrated service improvement and performance management frameworkfor the public and third sectors, can help such organisations address both these issues.
A number of factors are important in managing and measuring performance to overcomethese problems. They include working across organisational boundaries; capturing thevoice of users and other stakeholders; focussing on outcomes and evidence-based drivers ofoutcomes; re-designing processes and improving service delivery; addressing capability andorganisational issues; integrating risk management; and developing a performancemanagement culture based on improvement, innovation and learning rather than atop-down blame culture.
This paper begins by outlining the PSS and how it works in practice. It then examinesa number of critical success factors for effective performance management and how the PSSmethodology aims to address them in order to help organisations deliver improvedoutcomes and develop a more meaningful performance management culture. Two in-depthcase studies using the PSS across organisational boundaries are then presented, one incentral government and the other in a major city.
International Journal ofProductivity and PerformanceManagementVol. 66 No. 4, 2017pp. 442-458© Emerald Publishing Limited1741-0401DOI 10.1108/IJPPM-06-2015-0092
Received 25 June 2015Revised 13 June 2016Accepted 20 September 2016
The current issue and full text archive of this journal is available on Emerald Insight at:www.emeraldinsight.com/1741-0401.htm
442
IJPPM66,4
Dow
nloa
ded
by S
heff
ield
Hal
lam
Uni
vers
ity, M
r M
ax M
oulli
n A
t 11:
36 0
3 M
ay 2
017
(PT
)

2. Using the balanced scorecard (BSC) in the public sectorThe BSC (Kaplan and Norton, 1996) is a logical strategic framework enabling anorganisation to articulate its strategy in a set of focussed, strategic objectives and measures.It is a system of linked measures, targets and initiatives that collectively describe thestrategy of an organisation and how that strategy can be achieved. It aims to align businessactivities to the vision and strategy of the organisation, and monitor organisationalperformance against strategic goals (Niven, 2003).
While the BSC has been used primarily in the private sector, it has many potentialbenefits for not-for-profit organisations too. These include clarifying and gaining consensusabout strategy, communicating strategy throughout an organisation, aligning individualdepartments, units, or employees in the achievement of common goals, understanding theprocesses and relationships that lead to desired results, and focussing on the mostimportant improvement efforts (Kaplan and Norton, 1996, p. 109; Grigoroudis et al., 2012;Moore, 2003; Chan, 2004).
However, despite these potential benefits, the language, architecture andmethodology of theBSC tend to reflect its private sector origins. Part of the problem is that it is typically organisedacross four key perspectives: financial, customer, internal, and innovation, learning and growth.Indeed Gambles (1999, p. 24) says that “[…] in its usual form, it (the scorecard) is clearly notsuitable for the vast majority of the public sector”. One of the main difficultiesis that the most important perspective of the BSC is the financial perspective. Indeed mostcompanies only measure non-financial factors because they recognise that they will at somepoint affect bottom-line financial performance (Moullin, 2002; Pidd, 2012, p. 209). This is not thecase in the public and voluntary sectors, where an organisation with a large surplus at the endof the year but long waiting times or poor outcomes is not a well-performing organisation.The focus here is generally on social good and service to those in need, rather than profit andshareholder value (Yeung and Connell, 2006; Euske, 2003). In contrast, the financial perspectiveis an important and vital enabler of performance, rather than an end in itself (Moore, 2003).
Kaplan and Norton (2001b) claim that all that needs to be done to adapt the BSC for use inpublic sector organisations is to “rearrange the scorecard to place customers or constituents atthe top of the hierarchy” (p. 98). A similar approach is that of Niven (2003, p. 32) which has amission perspective at the top of the scorecard, then the customer perspective, followed by theother three original perspectives. There have been several other attempts to refine it forthe not-for-profit sectors (e.g. Irwin, 2002; Woodward et al., 2004; Lawrie and Cobbold, 2004)and it has been used with varying degrees of success in many public sector organisations(e.g. Radnor and Lovell, 2003; Niven, 2003; Greatbanks and Tapp, 2007).
However, Northcott and Taulapapa (2012) conclude that although each of the eight NewZealand local government organisations they examined had modified the BSC to fit theirorganisations, they had encountered significant difficulties in doing so. Similarly, reviewingthe use of the BSC within healthcare, Gurd and Gao (2008) conclude that “current applicationsdo not tend to show the health of patients as being central to the development of the BSC; thebalance is tilted towards the financial not the health outcomes”. Moore (2003) concurs, sayingthat “the basic concepts of the Balanced Scorecard have not been sufficiently adapted from theprivate, for-profit world where they were born to the world of the nonprofit manager”.
Another problem is that the methodology is still private sector oriented with little emphasison service user involvement, risk management or the need to work across organisationalboundaries (Moullin, 2006). In addition, public sector reforms “have an impact on social andpolitical dimensions, which are not accounted for in private sector frameworks” (Cordella andBonina, 2012). However, rather than adapt what is essentially a private sector model to fit allsectors, an alternative approach is to design a model specifically for the public and voluntarysectors which achieves similar benefits to those of the BSC in the private sector but within anot-for-profit culture – and this is the approach taken by the PSS.
443
Public SectorScorecard
Dow
nloa
ded
by S
heff
ield
Hal
lam
Uni
vers
ity, M
r M
ax M
oulli
n A
t 11:
36 0
3 M
ay 2
017
(PT
)

3. The PSSThe PSS is an integrated service improvement and performance management framework forthe public and third sectors. It has three phases – strategy mapping, service improvement,and measurement and evaluation.
At the heart of the PSS is the very simple, yet powerful, model on the left hand sideof Figure 1. Processes lead to outcomes, while capability – defined as the organisational, culturaland resource-based factors that need to be addressed for processes to work effectively – leads toeffective processes. This model is ideally suited for a workshop-based approach encouragingmanagers, staff, service users and other key stakeholders to identify the outcomes that matter tothem; to redesign or create new processes to achieve these outcomes; and to address thecapability and organisational factors that need to be in place for processes to be effective inachieving the outcomes. This can be done for a service as a whole or to help differentorganisations work together to focus on a particular outcome.
The right hand side of Figure 1 provides more detail on the different elements. Outcomesinclude the key performance outcomes that the organisation aims to achieve, those requiredby users and other key stakeholders, together with financial outcomes such as breaking-even,securing funding and offering value for money. There is just one perspective for the processeselement, namely, service delivery. Service delivery differs from planned service and policies asthis is what is actually experienced by users and stakeholders. Capability comprises whatneeds to be done to support staff and processes in delivering the required outcomes andoutputs. This might include trained and motivated people, good partnership workingand sufficient resources, together with a culture based on innovation and learning rather thana blame culture – all underpinned by effective and supportive leadership.
These seven perspectives differ from the four perspectives in the BSC – financial,customer, internal, and innovation learning and growth (Kaplan and Norton, 2001a) – in anumber of ways. In particular, the addition of “key performance outcomes” at the top of thescorecard ensures that the main aims of public and third sector organisations – and the publicand social value they create – are prominent. Financial aspects are included while thecustomer perspective is replaced by the “service user and stakeholder” perspective.The “service delivery” perspective has many similarities with the “internal” perspective of theBSC, while the term “growth” is omitted in the “innovation and learning perspective”. This isbecause growth, e.g. more people going to hospital or more benefits to give out, is notnecessarily a priority for many not-for-profit organisations! The inclusion of the other
OUTCOMES
PROCESSES
CAPABILITY
SERVICE USER/STAKEHOLDER
STRATEGIC
FINANCIAL
SERVICEDELIVERY
key performanceoutcomes
INNOVATIONAND LEARNING
LEADERSHIP
PEOPLE,PARTNERSHIPS
AND RESOURCESFigure 1.The Public SectorScorecard
444
IJPPM66,4
Dow
nloa
ded
by S
heff
ield
Hal
lam
Uni
vers
ity, M
r M
ax M
oulli
n A
t 11:
36 0
3 M
ay 2
017
(PT
)

capability perspectives is an important addition to the scorecard framework, as often poorperformance is not due to the processes themselves but to limited partnership working, poorlytrained or motivated staff, inadequate resources, or ineffective leadership.
The PSS is a flexible framework and, as with the BSC, the names of the sevenperspectives can be changed to suit the needs of the organisation. This is illustrated in theChilean government’s PSS strategy map for public health – see Figure 2. They chose “healthoutcomes” “user expectations” and “resource management” instead of “strategic”, “serviceuser and stakeholder” and “people, partnerships and resources”, respectively, but otherwisekept to the standard format. The health outcomes included improving population health,reducing health inequalities and increasing public satisfaction. The strategy map showshow they aimed to address – and monitor – these and the other desired outcomes in theirten-year plan (Gobierno de Chile, 2010).
4. How the PSS worksThe PSS is a workshop-based approach working with managers, staff, service users andother key stakeholders and has three phases – strategy mapping, service improvementand measurement and evaluation – see Figure 3.
4.1 Strategy mappingAs with the BSC, the strategy map is a key output of the PSS. According to Kaplan andNorton (2001a, p. 11), a strategy map “describes how shareholder value is created fromintangible assets”. However, with the PSS it can be defined more simply as “depicting therelationships between outcome, process, and capability elements” (Moullin, 2009a).
The strategy map is developed following a series of interactive workshops with seniormanagers, staff, service users and other stakeholders. These workshops would start byidentifying the desired outcomes – strategic, service user, stakeholder and financialoutcomes. Workshop participants then consider the outputs that the various processesinvolved need to achieve in order to deliver the various outcomes. Following this, the group
OUTCOMES
PROCESSES
CAPABILITY
USEREXPECTATIONS
INNOVATIONAND LERANING
LEADERSHIP
SERVICE DELIVERY
HEALTH OUTCOMES
FINANCIAL
RESOURCEMANAGEMENT
1. Reduce waiting lists
1. Strengthen research in health2. Improve the quality of medicine and health technology
2. Reduce user dissatisfaction
1. Improve population health
1. Improve health info systems2. Improve communication between different parts of health service3. Improve environmental conditions and promote healthy diet4. Reduce risk factors 5. Reduce mortality and sickness6. Reduce contagious and non- contagious diseases
2. Reduce health inequalities3. Increase public satisfaction with the health service4. Ensure the quality of health interventions
1. Lead functions and health promotion2. Leadership and management of staff teams and organisational devt
Boost financesof the sector
1. Increase and improve the resources of HR in health sector2. Improve and implement the health sector infrastructure3. Preparation for emergencies or disasters
Source: Translated from the Spanish
Figure 2.Public Sector
Scorecard – Chilepublic health example
445
Public SectorScorecard
Dow
nloa
ded
by S
heff
ield
Hal
lam
Uni
vers
ity, M
r M
ax M
oulli
n A
t 11:
36 0
3 M
ay 2
017
(PT
)

would be asked to identify the capability outputs that are needed to ensure that staff andprocesses are able to achieve the outcomes and process outputs required. These aspectsmight include effective team and partnership working, sufficient resources, supportiveleadership, together with an organisational culture promoting innovation and learningrather than a target-obsessed blame culture.
The links between capabilities, processes and outcomes are then illustrated in a draftstrategy map, which is reviewed at the next workshop. Risk factors will then be identified ina risk-management workshop and added to the draft strategy map by considering thereduction of a key risk as a desired outcome. The processes by which risks are reduced,eliminated or mitigated are then reviewed, together with the risk-management culture(a capability element), and added to the strategy map.
As Pidd (2012) points out, “there may well be some conflict between the strategic drivers(of the PSS) and any strategic thinking will need to balance differing claims and priorities”( pp. 211-212). This is important as most public and third sector organisations have a widevariety of objectives and stakeholders (Moriarty and Kennedy, 2002; McAdam et al., 2005).
4.2 Service improvementIn this phase, the strategy map will be used as a prompt to examine the effectiveness of servicedelivery in achieving the required outcomes and how it can be improved. Workshopparticipants will be encouraged to link their discussion to evidence or data available and this willbe supplemented where appropriate with tools such as process maps, systems thinking and leanmanagement – for example, to highlight areas of duplication, processes that could be simplifiedor accelerated through better communication, and eliminating non-productive activities such astalking to users who ring up because they have not received a service they were promised.
This or a subsequent workshop would then focus on what is required to achieve thecapability outputs in the strategy map and in particular how management can support staffand processes so that they can obtain the outcomes required. This could involve extraresources in a particular area, improving staff morale, and clear supportive leadership.It might also involve discussing how to develop a culture of improvement, innovation andlearning rather than a blame culture.
4.3 Measurement and evaluationThis phase begins by identifying possible performance measures for each element of thestrategy map. Discussion will take place with workshop participants, with informationexperts within the organisation, and with stakeholders and funders on their informationrequirements and the likely cost-effectiveness of different measures. It is important that themeasures chosen are seen as reasonable by both staff and service users.
Clarifyingoutcomes
Learning fromperformance
measuresIdentifying process
and capability outputs
Developingperformance
measures
Addressingcapability
Strategymapping
Integrating riskmanagement
Re-designingprocessesService improvement
Strategy mapping
Mea
sure
men
tan
d ev
alua
tion
Figure 3.How the Public SectorScorecard works
446
IJPPM66,4
Dow
nloa
ded
by S
heff
ield
Hal
lam
Uni
vers
ity, M
r M
ax M
oulli
n A
t 11:
36 0
3 M
ay 2
017
(PT
)
All potential measures identified will be reviewed by considering data quality issues,and aiming to minimise potential unwanted or perverse effects. A filtering process thentakes place to ensure that the measures chosen are cost-effective and can provide value formoney to the organisations concerned. Performance measurement has been definedas “evaluating how well organisations are managed and the value they deliver forcustomers and other stakeholders” (Moullin, 2002, p. 188). This definition has a deliberatecircularity – performance measurement is part of how an organisation is managed, so ittoo needs to deliver value to users and stakeholders.
Performance measures do not necessarily need to be quantitative. Indeed in many cases –particularly on some of the capability areas – more qualitative approaches are preferable.For example, if improving partnership working is included in the strategy map, a summary ofprogress and people’s perception on what has been achieved will be better than recording thenumber of meetings with different organisations or other irrelevant measures.
Analysing and learning from performance measures provides insight into how wellorganisations are performing in the different areas of the strategy map. The use of analyticsto determine cause and effect is also useful here. Taking action to address areas needingattention is also needed!
4.4 Completing the cyclePerformance information is then used to revise the strategy map, identify further serviceimprovements, and develop better performance measures – and so the cycle continues.Public and third sector organisations have frequent changes in strategy and it is importantthat the strategy map is a living document and that performance measures are aligned witha changing strategy ( Johnston and Pongatichat, 2008).
5. Critical success factors for public sector performance managementThis section examines a number of issues critical to the success of performancemanagement in the public and voluntary sectors. It also aims to show how these can beaddressed with the PSS (Moullin, 2009a; Penna, 2011):
5.1 Service user and stakeholder involvementService user involvement “places the experiences and knowledge of the service user at the heartof effective public service design and delivery” (Osborne et al., 2013, p. 146). Effective userinvolvement generally leads to better outcomes and more appropriate, responsive and effectiveservices (Moullin, 2002, pp. 165-167; Ridley and Jones, 2002). It is also important in being able toachieve public value, which is not necessarily defined by organisations who produce it, butrather by the citizens who collectively consume it (Cordella and Bonina, 2012; Alford andHughes, 2008). In health and social care, Bell (2000) suggests that public involvement should be“bread and butter to a responsive, equitable and efficient health service”, while Beresford (2000)says “not involving users is incompatible with the central aims of social work”.
Involvement of front-line staff is also crucial to the success of the BSC and otherperformance improvement initiatives (Barden, 2004). As Grigoroudis et al. (2012) point out,staff not only need to understand the strategic objectives and key performance indicators, butthey need to share the vision of the organisation or department. However, managers – andfacilitators – should also guard against “tokenism” – involving users and staff, but in practiceignoring what they have to offer (Buckley and Hutson, 2004) and ensure involvement is notpatronising or top-down (Ridley and Jones, 2002). In addition, it is important to involve otherstakeholders who may affect or be affected by the organisation’s strategy (Alford, 2002;Sanger, 2008). These may be important for the organisation’s future, e.g. funders and donors,have specific insights, or be affected by its actions. Involving such stakeholders in
447
Public SectorScorecard
Dow
nloa
ded
by S
heff
ield
Hal
lam
Uni
vers
ity, M
r M
ax M
oulli
n A
t 11:
36 0
3 M
ay 2
017
(PT
)
performance management can be important for reasons of legitimacy and ethicality as well asimproving effectiveness (Wang et al., 2015).
By involving users, staff and other key stakeholders in an interactive workshop setting, thePSS enables a service to make use of participants’ knowledge and understanding of servicedelivery and to address the needs of these stakeholders. It also leads to more successfulimplementation since participants feel they have contributed to the process of serviceimprovement rather than feel that change is imposed on them. For example, a project usingthe PSS for Sheffield’s Stop Smoking Service began with three workshops with over100 service users and was then steered by a reference group including managers and staff ofthe service, eight service users, a GP, a hospital consultant and representatives of the StrategicHealth Authority. The project’s recommendations did not therefore come as a surprise to suchstakeholders and were consequently well received (Moullin et al., 2007).
5.2 Focus on outcomesNiven (2003) believes that focussing on outcomes, rather than inputs or outputs, serves toguide an organisation towards its true aims and enhances accountability by requiring themto outline specifically how targeted groups are better off as a result of their service.Focussing on outcomes and being able to measure them is not a substitute for knowing andbeing able to measure your outputs, but it allows you to measure what your activities areactually achieving (Ellis, 2009).
Identifying the outcomes required by the organisation, its service users and otherstakeholders – including value for money – is the starting point of a PSS study and thisoutcome focus drives the entire PSS project, helping the organisation focus on achievingthese outcomes. However, it is also important to address and monitor process and capabilityoutputs as “outcome measures without performance drivers do not communicate how theoutcomes are to be achieved” (Kaplan and Norton, 1996, p. 105).
5.3 Working across organisational boundariesWorking across organisational boundaries is important for several reasons. First, users ofpublic services typically use services from a number of organisations or departments.They are often not very interested in how a particular organisation is doing, but they do careabout having co-ordinated the services available to them which may be from severalorganisations or departments (Moullin, 2006).
Second, many of the outcomes governments wish to address can only be achieved byorganisations working together. For example, if police, probation, social services and health donot co-ordinate their different policies in tackling drug abuse, poor outcomes are likelyto result (Moullin, 2002, pp. 159-161). Another example is a third sector organisation that aimsto reduce teenage pregnancy. In the UK research showed that 71 per cent of young women notin education, employment or training for over six months between the ages of 16 and 18 wereparents by the age of 21 (DCSF, 2006). It follows that working together with schools, collegesand local employers to improve and monitor outcomes for this group is likely to be moreeffective than, for example, talks pointing out the difficulties of early parenthood.
One of the many benefits of the PSS’s outcome focus is that it facilitates working acrossorganisational boundaries by enabling people from different organisations or departmentsto focus on the common outcomes required, rather than their narrower departmentalobjectives. This contrasts with the BSC, which is less well suited to working acrossorganisational boundaries as it focusses on achieving greater profit or the mission of anindividual organisation, promoting a competitive, rather than co-operative approach(Moore, 2003). In terms of measurement and evaluation, the PSS will not only evaluate theoutcomes and processes, but also capability elements such as partnership working anda shared vision.
448
IJPPM66,4
Dow
nloa
ded
by S
heff
ield
Hal
lam
Uni
vers
ity, M
r M
ax M
oulli
n A
t 11:
36 0
3 M
ay 2
017
(PT
)

5.4 Process improvement and capabilityMany process improvement methodologies developed originally for the private sector havebeen used in the public and third sectors. These include: systems thinking (Seddon, 2008),Lean (Radnor and Osborne, 2013), Six Sigma (Antony, 2006) and business processre-engineering (Harrington et al., 1997). Radnor (2010) reviewing the effectiveness of thesemethodologies in public services, notes the need for a structured performance measurementsystem as a potential success factor for these methodologies. Similarly, referring to lean inparticular, Bhatia and Drew (2006) recommend “developing a performance culture and usingperformance management systems that break down top-level objectives into clearmeasurable targets”. Moullin (2009c) argues that the greater range of stakeholder and userrequirements in the public sector causes problems in transferring Lean and Six Sigma frommanufacturing. He concludes that Lean and Six Sigma tools are very useful, but they need tobe used in the context of delivering better outcomes for service users and not simply tryingto replicate what has been successful in manufacturing. The use of analytics in trying toestablish the relationship between process outputs and outcomes is also important(Brown, 2007). For example, any differences in clinical outcomes in hospitals need to beanalysed to see if they are caused by variations in case mix, in resources or just by randomfluctuation before making any definite conclusions (Smith and Goddard, 2002).
The PSS includes process improvement within an overall performance managementframework focussing on the various outcomes required including financial outcomes suchas value for money. As an example, systems thinking, viewing the service and the valueobtained from the service user’s point of view, was used in the Stop Smoking Serviceproject referred to earlier. In the workshops, many users reported delays between themmaking the momentous decision to quit smoking and being able to obtain prescriptionsfrom the GP for the required medication. Through discussions with pharmacies and GPs,innovative ways were found to bypass the GP and get the medicines direct from thepharmacy (Moullin et al., 2007).
Capability and organisational culture are important drivers for achieving the outcomesrequired and these aspects need to be included in the strategy map, in order to improveand evaluate performance. The PSS framework includes people skills and motivation,partnership working, resource utilisation, organisational culture and leadership.Performance measures of these aspects will of course generally be qualitative ratherthan quantitative.
5.5 Integrating risk managementIntegrating risk management with strategy and performance management is anotherimportant feature of the PSS. As Moullin (2006) says, “identifying and addressing key risksare essential for any high-performing organisation and therefore any evaluation ofperformance without considering risk is incomplete”. Arguably, lack of attention to this wasthe major cause of the banking crisis. Many people blame bonuses. However, the realproblem was not bonuses themselves but the fact that the performance measures on whichbonuses were based did not take proper account of risks to the banks, their customers, andsociety. If they had included appropriate measures of risk factors, economic prospects in theworld today would be very different.
While Kaplan (2009) recommends a separate risk-management scorecard for usealongside the BSC, the PSS takes explicit account of risk by incorporating major risk factorsinto the strategy map. It does this by viewing the reduction of a key risk as a desiredoutcome, while the processes involved in reducing or mitigating the risk would appear in theservice delivery perspective. Ensuring that the organisation has a risk-managementcapability – for example, the absence of a blame culture and ensuring that the approach torisk does not stifle innovation – would appear in one or more of the capability perspectives.
449
Public SectorScorecard
Dow
nloa
ded
by S
heff
ield
Hal
lam
Uni
vers
ity, M
r M
ax M
oulli
n A
t 11:
36 0
3 M
ay 2
017
(PT
)

5.6 Culture of improvement, innovation and learningArguably the most important of these issues critical to the success of performancemanagement frameworks is developing a culture of improvement, innovation and learning,rather than a top-down blame culture (Moullin, 2004). Several authors (e.g. Brooks, 2007,Smith, 1993) talk about the “perverse” or “unforeseen” effects of targets, but these arepredictable consequences of a top-down performance management regime whichencourages staff to prioritise a target over service to the public (Moullin, 2009b).
The approach to targets of the PSS is summed up in the sentence “all targets areflawed, some are useful” (Moullin, 2009b). It is important to note that there is no suchthing as a perfect target. There is always a way of achieving a given target without theintention behind the target. Nevertheless, targets can be useful too. Moullin (2010) cites thecase of the UK National Health Service waiting time targets. These targets helpedreduce the number of people waiting over nine months for admission to hospitalfrom 175,000 to 223 from 1997 to 2004. It is important to note that this dramatic reductioncould not have been achieved without the considerable investment in the NHS duringthis period. Otherwise, the result is likely to have been what Deming calls “goals withoutmethods” which are always counter-productive (Deming, 1993). However, investmentby itself would not have achieved this dramatic improvement, if only because of theperverse incentive in the system – NHS waiting times are a key driver of the demand forprivate healthcare.
Given that all targets are flawed, it does not make sense to blame managers forperformance below target without a dialogue as to what might have caused the apparentlevel of performance. The Care Quality Commission (2009) did take note of this byallowing NHS Trusts to submit extenuating circumstances that might have affected theirability to meet a target. Rewarding people for performance above target without furtheranalysis is similarly premature.
While the BSC typically recommends organisations to specify targets for each of theperformance measures used, this is optional in the PSS. Targets are recommended only ifthey relate to outcomes or evidence-based drivers of outcomes, the value of the targetexceeds its cost, the target is challenging but achievable, and potential unintendedconsequences identified and minimised.
The tone needs to be set early on in a PSS study with both a director of the service andthe workshop facilitator emphasising the importance of openness and trust within aperformance management culture based on improvement, innovation and learning.As Safra Catz, president of Oracle, says, “You need to start by assuming that people wantto do the right thing” (cited in Thornton, 2009). The PSS approach contrasts with the BSCwhich is generally implemented top down “cascading the scorecard down theorganisation” (Bourne and Bourne, 2007, pp. 166-167).
6. Case studies – using the PSS across organisational boundariesThe PSS facilitates working across organisational boundaries by encouragingrepresentatives of different organisations to focus on the common outcomes they areaddressing, rather than the objectives of their own department. Two case studies arediscussed here – the UK government’s Ethnic Minority Employment Task Force andSheffield Let’s Change4Life (SLC4L), a £10 million city-wide project addressing obesity inchildren and adults.
6.1 Case Study 1 – the ethnic minority employment task forceThe UK Ethnic Minority Employment Task Force is a good example of workingacross organisational boundaries at central government level. It included governmentministers from five government departments, together with other stakeholders, mainly from
450
IJPPM66,4
Dow
nloa
ded
by S
heff
ield
Hal
lam
Uni
vers
ity, M
r M
ax M
oulli
n A
t 11:
36 0
3 M
ay 2
017
(PT
)

the third sector. It was set up in 2003 to drive forward strategies designed to ensure ethnicminorities no longer faced disproportionate barriers to achievement in the labour market.The task force included government ministers from five government departments, togetherwith other stakeholders, mainly from the third sector, with particular interest andexperience in ethnic minority employment.
The task force began by recognising that to achieve the main desired outcome ofincreasing ethnic minority employment, they needed to address three subsidiary outcomes:building employability by raising levels of educational attainment and skills; connectingpeople to work by reforming existing employment programmes, tackling specific barriers towork in deprived areas, and promoting self-employment; and equal opportunities in theworkplace (Strategy Unit, 2003).
The next stage was to identify the outputs needed to achieve these outcomes andthe government departments who should take the lead on each output. As can beseen from the strategy map (Figure 4), building employability was predominantly down tothe Department for Education and Skills, while the other two outcomes were thejoint responsibility of a number of different government departments. Also shownin Figure 4 are some of the capability aspects – specific activities that were identified asimportant to achieve the outcomes and outputs, together with effective partnershipworking between departments and leadership from the task force which were recognisedas also vital to the achievement of these outcomes. The strategy map shows clearly howthe contribution of each department related to the overall outcome, as well as helping inthe evaluation.
A number of performance measures were developed for the different outcomes and outputsin the strategy map. In addition each department was responsible for monitoring progress onthe activities they were responsible for. One of the key performance criteria for the task forcewas to reduce the gap between the employment rate of ethnic minorities and that of GreatBritain as a whole. This reduced from 18 to 12 percentage points from 2003 to 2010. However,it fell short of its original objective that, by 2013, no-one should be disadvantaged in theiremployment prospects because of their ethnicity.
Improving ethnic minority employment
OUTCOMES
PROCESSES
CAPABILITY
Buildingemployability
Connectingpeople to work
Equalopportunities
Reducingattainment gaps
at differentstages (DfES)
Increasingemployment ratesin areas with highEM popn. (ODPM)
Increasing self-employment (DTI)
Increasing EMemployment in
public sector (HO)
Improving outreachoutcomes (DWP)
Reducing racialdiscriminationat work (DTI)
Reducing racialprejudice (HO)
Work with lowattaining groups
Increasing EMaspirations
Ethnic minorityoutreach
programme
Pilot project onprocurement inpublic sector
Joint workingbetween departments
Leadership fromthe task force
Research on why certain groupsearn less than
others with similarqualifications
Notes: Key to departments: DfES, education and skills; DTI, trade and
industry; HO, home office; DWP, work and pensions; ODPM, office of
the deputy prime minister
Figure 4.Strategy map for the
ethnic minorityemployment task
force
451
Public SectorScorecard
Dow
nloa
ded
by S
heff
ield
Hal
lam
Uni
vers
ity, M
r M
ax M
oulli
n A
t 11:
36 0
3 M
ay 2
017
(PT
)
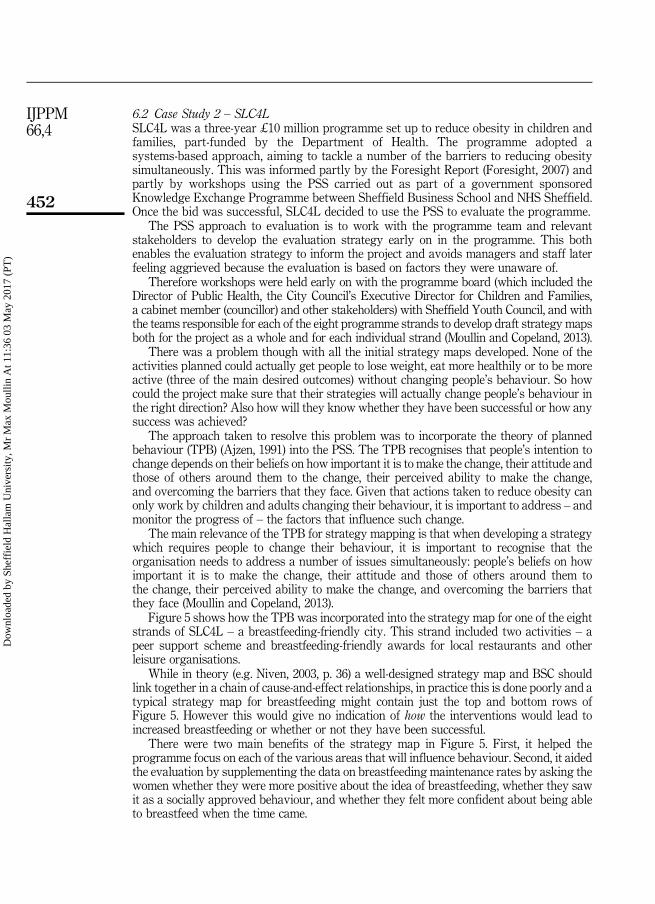
6.2 Case Study 2 – SLC4LSLC4L was a three-year £10 million programme set up to reduce obesity in children andfamilies, part-funded by the Department of Health. The programme adopted asystems-based approach, aiming to tackle a number of the barriers to reducing obesitysimultaneously. This was informed partly by the Foresight Report (Foresight, 2007) andpartly by workshops using the PSS carried out as part of a government sponsoredKnowledge Exchange Programme between Sheffield Business School and NHS Sheffield.Once the bid was successful, SLC4L decided to use the PSS to evaluate the programme.
The PSS approach to evaluation is to work with the programme team and relevantstakeholders to develop the evaluation strategy early on in the programme. This bothenables the evaluation strategy to inform the project and avoids managers and staff laterfeeling aggrieved because the evaluation is based on factors they were unaware of.
Therefore workshops were held early on with the programme board (which included theDirector of Public Health, the City Council’s Executive Director for Children and Families,a cabinet member (councillor) and other stakeholders) with Sheffield Youth Council, and withthe teams responsible for each of the eight programme strands to develop draft strategy mapsboth for the project as a whole and for each individual strand (Moullin and Copeland, 2013).
There was a problem though with all the initial strategy maps developed. None of theactivities planned could actually get people to lose weight, eat more healthily or to be moreactive (three of the main desired outcomes) without changing people’s behaviour. So howcould the project make sure that their strategies will actually change people’s behaviour inthe right direction? Also how will they know whether they have been successful or how anysuccess was achieved?
The approach taken to resolve this problem was to incorporate the theory of plannedbehaviour (TPB) (Ajzen, 1991) into the PSS. The TPB recognises that people’s intention tochange depends on their beliefs on how important it is to make the change, their attitude andthose of others around them to the change, their perceived ability to make the change,and overcoming the barriers that they face. Given that actions taken to reduce obesity canonly work by children and adults changing their behaviour, it is important to address – andmonitor the progress of – the factors that influence such change.
The main relevance of the TPB for strategy mapping is that when developing a strategywhich requires people to change their behaviour, it is important to recognise that theorganisation needs to address a number of issues simultaneously: people’s beliefs on howimportant it is to make the change, their attitude and those of others around them tothe change, their perceived ability to make the change, and overcoming the barriers thatthey face (Moullin and Copeland, 2013).
Figure 5 shows how the TPB was incorporated into the strategy map for one of the eightstrands of SLC4L – a breastfeeding-friendly city. This strand included two activities – apeer support scheme and breastfeeding-friendly awards for local restaurants and otherleisure organisations.
While in theory (e.g. Niven, 2003, p. 36) a well-designed strategy map and BSC shouldlink together in a chain of cause-and-effect relationships, in practice this is done poorly and atypical strategy map for breastfeeding might contain just the top and bottom rows ofFigure 5. However this would give no indication of how the interventions would lead toincreased breastfeeding or whether or not they have been successful.
There were two main benefits of the strategy map in Figure 5. First, it helped theprogramme focus on each of the various areas that will influence behaviour. Second, it aidedthe evaluation by supplementing the data on breastfeeding maintenance rates by asking thewomen whether they were more positive about the idea of breastfeeding, whether they sawit as a socially approved behaviour, and whether they felt more confident about being ableto breastfeed when the time came.
452
IJPPM66,4
Dow
nloa
ded
by S
heff
ield
Hal
lam
Uni
vers
ity, M
r M
ax M
oulli
n A
t 11:
36 0
3 M
ay 2
017
(PT
)
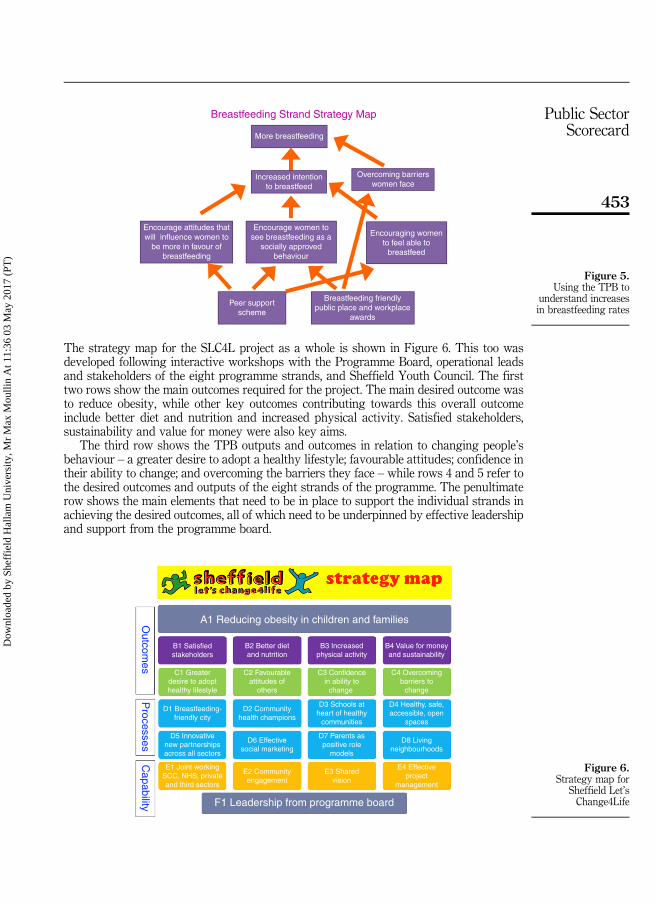
The strategy map for the SLC4L project as a whole is shown in Figure 6. This too wasdeveloped following interactive workshops with the Programme Board, operational leadsand stakeholders of the eight programme strands, and Sheffield Youth Council. The firsttwo rows show the main outcomes required for the project. The main desired outcome wasto reduce obesity, while other key outcomes contributing towards this overall outcomeinclude better diet and nutrition and increased physical activity. Satisfied stakeholders,sustainability and value for money were also key aims.
The third row shows the TPB outputs and outcomes in relation to changing people’sbehaviour – a greater desire to adopt a healthy lifestyle; favourable attitudes; confidence intheir ability to change; and overcoming the barriers they face – while rows 4 and 5 refer tothe desired outcomes and outputs of the eight strands of the programme. The penultimaterow shows the main elements that need to be in place to support the individual strands inachieving the desired outcomes, all of which need to be underpinned by effective leadershipand support from the programme board.
Breastfeeding Strand Strategy Map
More breastfeeding
Increased intentionto breastfeed
Overcoming barrierswomen face
Encourage attitudes thatwill influence women to
be more in favour ofbreastfeeding
Encourage women tosee breastfeeding as a
socially approvedbehaviour
Encouraging womento feel able to
breastfeed
Peer supportscheme
Breastfeeding friendlypublic place and workplace
awards
Figure 5.Using the TPB to
understand increasesin breastfeeding rates
A1 Reducing obesity in children and families
B1 Satisfiedstakeholders
B2 Better dietand nutrition
B3 Increasedphysical activity
B4 Value for moneyand sustainability
C1 Greaterdesire to adopthealthy lifestyle
C2 Favourableattitudes of
others
C3 Confidencein ability to
change
C4 Overcomingbarriers to
change
D1 Breastfeeding-friendly city
D2 Communityhealth champions
D3 Schools atheart of healthy
communities
D4 Healthy, safe,accessible, open
spaces
D5 Innovativenew partnershipsacross all sectors
D6 Effectivesocial marketing
D7 Parents aspositive role
models
D8 Livingneighbourhoods
E1 Joint workingSCC, NHS, privateand third sectors
E2 Communityengagement
E3 Sharedvision
E4 Effectiveproject
management
F1 Leadership from programme board
Outcom
esP
rocessesC
apability
Figure 6.Strategy map for
Sheffield Let’sChange4Life
453
Public SectorScorecard
Dow
nloa
ded
by S
heff
ield
Hal
lam
Uni
vers
ity, M
r M
ax M
oulli
n A
t 11:
36 0
3 M
ay 2
017
(PT
)

One example of the usefulness of the approach was when evaluating a workshop on diet andexercise provided for workers at a Sheffield steel manufacturer. While feedback fromparticipants was quite positive on items C1 and C3 of the strategy map, the evaluation alsorevealed that the company did not have space for a canteen on site – but there was aconvenient mobile burger bar parked outside the factory gates every lunchtime! Clearly,unless that particular barrier (item C4) is overcome such workshops were unlikely to lead toa significant change in obesity levels of workers or their families.
The strategy map was used both to help managers and strand leads focus on the desiredoutcomes, and to monitor and evaluate performance (Moullin and Copeland, 2013).The approach enabled the evaluation team to supplement the nationally available data onobesity rates with information on the impact of the programme on factors likely to influencefuture obesity rates. This was particularly useful as these lagging obesity rates refer toobesity in a specific year group (e.g. at age 10-11). Therefore changes from one year to thenext could be due to any differences the two cohorts experienced in the preceding 10 or11 years and not necessarily anything to do with SLC4L. The evaluation commended thesystems approach adopted by SLC4L, its strong leadership and joint working betweenpublic health and the city council, and the impact on participants’ attitudes and intentionstowards the adoption of health promoting behaviours (Moullin and Copeland, 2013).
Feedback on the use of the PSS was very positive. The executive director for children,young people and families at Sheffield City Council commented that “the strategy map isreally useful as it simplifies a complex issue with a complex response into an orderlyunderstandable approach”, while the SLC4L programme manager said “the SLC4L StrategyMap visually told the story of SLC4L, what we were trying to achieve and how. It helped allthose involved understand the outcome and process measures the programme was trying toachieve, and therefore being evaluated against”.
7. ConclusionPerformance management in the public and third sectors is understandably controversial.When done well it can motivate staff to improve performance and can “reveal thetrue performance of the system and the impact of any changes in real time”(NHS Modernisation Agency, 2004). When done poorly, however, it can alienate employeesand lead to a culture of blame where staff meet targets at the expense of service to thepublic (Moullin, 2009a).
The PSS is an effective framework for helping public and third sector organisationsmonitor and improve their services and focus on delivering desired outcomes includingvalue for money. The incorporation of process mapping, systems thinking and leanmanagement approaches ensures that service improvement is considered in relation to theoutcomes required including value for money. Furthermore, it does not stop at processes – itaddresses risk management, organisation culture and capability to ensure that staff andprocesses are supported in delivering the required outcomes. Finally, by measuringperformance on outcome, process and capability elements, the PSS enables managers andothers to identify where the organisation is making progress.
The two case studies illustrate how the PSS can be used across organisational boundaries,one across central government and one in a major city. They indicate that the PSS worksparticularly well alongside joined-up government approaches with “inter-departmentalcollaboration and coordination to provide integrated service delivery to citizens” (Cordella andBonina, 2012). By focussing on the outcomes that matter to users and stakeholders in aworkshop setting, the PSS facilitated partnership working between the various departmentsand organisations. As well as influencing strategy, the focus of the evaluation on outcomes andkey drivers of those outcomes, helped people understand the achievements of the projectand the areas that need addressing in the future.
454
IJPPM66,4
Dow
nloa
ded
by S
heff
ield
Hal
lam
Uni
vers
ity, M
r M
ax M
oulli
n A
t 11:
36 0
3 M
ay 2
017
(PT
)
Described as “groundbreaking” by a former head of research and communications at theNew York Senate (Penna, 2011) the PSS is consistent with the recommendation in the Darzireport that “NHS services […] will need to develop their own quality frameworks combiningrelevant indicators defined nationally, with those appropriate to local circumstances”(Department of Health, 2008). In addition, Robinson (2015) concludes that the PSS hasmoved “performance management from a top-down, blinkered, blame-game approach to asystem founded on inclusiveness, cooperation and understanding”.
However, as with all performance management frameworks there are continuingchallenges. Despite recent developments in analytics, it is often difficult to establish causeand effect. Pressures on reducing costs can make it difficult for managers to work inpartnership and to keep staff motivated. In addition, organisations and departments whichalready have performance management frameworks – however flawed – with attractivemixes of red, yellow and green, can be reluctant to do more than a minor update.
References
Ajzen, I. (1991), “The theory of planned behavior”, Organizational Behavior and Human DecisionProcesses, Vol. 50 No. 2, pp. 179-211.
Alford, J. (2002), “Defining the client in the public sector: a social‐exchange perspective”,Public Administration Review, Vol. 62 No. 3, pp. 337-346.
Alford, J. and Hughes, O. (2008), “Public value pragmatism as the next phase of public management”,American Review of Public Administration, Vol. 38 No. 2, pp. 130-148.
Antony, J. (2006), “Six sigma for service processes”, Business Process Management Journal, Vol. 12No. 2, pp. 234-238.
Barden, P. (2004), “A new prescription for NHS performance”, Financial Management, June.
Bell, A. (2000), “Involving the public: it’s not just for Christmas”, British Journal of Health CareManagement, Vol. 6 No. 6, pp. 272-273.
Beresford, P. (2000), “Service-users’ knowledges and social work theory: conflict or collaboration?”,British Journal of Social Work, Vol. 30 No. 4, pp. 489-504.
Bhatia, N. and Drew, J. (2006), “Applying lean production to the public sector”, The McKinsleyQuarterly, Vol. 3 No. 1, pp. 97-98.
Bourne, M. and Bourne, P. (2007), Balanced Scorecard, Chartered Management Institute, London.
Brooks, R. (Ed.) (2007), Public Services at the Crossroads, Institute for Public Policy Research, London.
Brown, M.G. (2007), Beyond the Balanced Scorecard – Improving Business Intelligence with Analytics,Productivity Press, New York, NY.
Buckley, J. and Hutson, T. (2004), “User involvement in care: avoiding tokenism and achievingpartnership”, Prof Nurse, Vol. 19 No. 9, pp. 499-501.
Care Quality Commission (2009), “Annual Health Check 2008/9”, Care Quality Commission, London, March.
Chan, Y.-C.L. (2004), “Performance measurement and adoption of balanced scorecards: a survey ofmunicipal governments in the USA and Canada”, International Journal of Public SectorManagement, Vol. 17 No. 3, pp. 204-221.
Cordella, A. and Bonina, C.M. (2012), “A public value perspective for ICT enabled public sector reforms:a theoretical reflection”, Government Information Quarterly, Vol. 29 No. 4, pp. 512-520.
DCSF (2006), Youth Matters, Department of Children, Schools and Families, HMSO, London.
Deming, W.E. (1993), The New Economics for Industry, Government and Education, MIT Press,Cambridge, MA.
Department of Health (2008), High Quality Care for All: NHS Next Stage Review, Department ofHealth, London.
Ellis, J. (2009), The Case for an Outcomes Focus, Charities Evaluation Services, London.
455
Public SectorScorecard
Dow
nloa
ded
by S
heff
ield
Hal
lam
Uni
vers
ity, M
r M
ax M
oulli
n A
t 11:
36 0
3 M
ay 2
017
(PT
)

Euske, K.J. (2003), “Public, private, not-for-profit: everybody is unique?”, Measuring BusinessExcellence, Vol. 7 No. 4, pp. 5-7.
Foresight (2007), Tackling Obesities: Future Choices – Project Report, The Stationery Office, London.
Gambles, I. (1999), “A balanced future lies in the cards”, Public Finance, 16-22 April, pp. 24-25.
Gobierno de Chile (2010), Estrategia National de Salud: Metas 2011-2020, Gobierno de Chile, Santiago, CA.
Greatbanks, R. and Tapp, D. (2007), “The impact of balanced scorecards in a public sector environment:empirical evidence from Dunedin City Council, New Zealand”, International Journal ofOperations & Production Management, Vol. 27 No. 8, pp. 846-873.
Grigoroudis, E., Orfanoudaki, E. and Zopounidis, C. (2012), “Strategic performance measurement in ahealthcare organisation: a multiple criteria approach based on balanced scorecard”, Omega,Vol. 40 No. 1, pp. 104-119.
Gurd, B. and Gao, T. (2008), “Lives in the balance: an analysis of the balanced scorecard (BSC) inhealthcare organisations”, International Journal of Productivity and Performance Management,Vol. 57 No. 1, pp. 6-21.
Harrington, H.J., Esseling, E.C. and Van Nimwegen, H. (1997), Business Process Improvement –Documentation, Analysis, Design and Management of Business Process Improvement,McGraw-Hill, New York, NY.
Irwin, D. (2002), “Strategy mapping in the public sector”, Long Range Planning, Vol. 35 No. 6, pp. 637-647.
Johnston, R. and Pongatichat, P. (2008), “Managing the tension between performance measurement andstrategy: coping strategies”, International Journal of Operations and Production Management,Vol. 28 No. 10, pp. 941-967.
Kaplan, R.S. (2009), “Risk management and the strategy execution system”, Balanced Scorecard Report,Vol. 11 No. 6, pp. 1-6.
Kaplan, R.S. and Norton, D. (1996), The Balanced Scorecard: Translating Strategy into Action, HarvardBusiness School Publishing, Boston, MA.
Kaplan, R.S. and Norton, D.P. (2001a), The Strategy-Focused Organization, Harvard Business SchoolPress, Boston, MA.
Kaplan, R.S. and Norton, D.P. (2001b), “Transforming the balanced scorecard from performancemeasurement to strategic management: part 1”, Accounting Horizons, Vol. 15 No. 1, pp. 87-104.
Lawrie, G. and Cobbold, I. (2004), How a Public Sector Agency Re-invigorated its Balanced Scorecard,2GC Active Management, Maidenhead.
McAdam, R., Hazlett, S. and Casey, C. (2005), “Performance management in the UK public sector:addressing multiple stakeholder complexity”, International Journal of Public SectorManagement, Vol. 18 No. 3, pp. 256-273.
Moore, M.H. (2003), “The public value scorecard: a rejoinder and an alternative to ‘strategicperformance measurement and management in non-profit organizations’ by Robert Kaplan(May 2003)”, Hauser Center for Nonprofit Organizations Working Paper No. 18, Boston, MA.
Moriarty, P. and Kennedy, D. (2002), “Performance measurement in public sector services: problemsand potential” in Neely, A. and Walters, A. (Eds), Proceedings of the Performance MeasurementAssociation Annual Conference, Performance Measurement Association, Boston, MA,pp. 395-402.
Moullin, M. (2002), Delivering Excellence in Health and Social Care, Open University Press, Buckingham.
Moullin, M. (2004), “Eight essentials of performance measurement”, International Journal of HealthCare Quality Assurance, Vol. 17 No. 3, pp. 110-112.
Moullin, M. (2006), “The design of an alternative balanced scorecard framework for public andvoluntary organizations”, Perspectives on Performance, Vol. 5 No. 1, pp. 10-12.
Moullin, M. (2009a), “Using the Public Sector Scorecard to measure and improve healthcare services”,Nursing Management, Vol. 16 No. 5, pp. 26-31.
456
IJPPM66,4
Dow
nloa
ded
by S
heff
ield
Hal
lam
Uni
vers
ity, M
r M
ax M
oulli
n A
t 11:
36 0
3 M
ay 2
017
(PT
)

Moullin, M. (2009b), “What’s the score? Feature article”, Public Finance, Chartered Institute of PublicFinance and Accountancy, London, 21 May.
Moullin, M. (2009c), “Lean and Six Sigma – can they really be applied to the public sector?”,Public Sector Executive, May/June, pp. 14-15.
Moullin, M. (2010), “Careful targets can help to achieve goals”, Local Government Chronicle, 11 February,p. 22.
Moullin, M. and Copeland, R. (2013), “Implementing and evaluating behaviour change programmeswith the Public Sector Scorecard”, National Health Executive, July-August, pp. 16-18.
Moullin, M., Soady, J., Skinner, J., Price, C., Cullen, J. and Gilligan, C. (2007), “Using the Public SectorScorecard in public health”, International Journal of Health Care Quality Assurance, Vol. 20 No. 4,pp. 281-289.
NHS Modernisation Agency (2004), 10 High Impact Changes for Service Improvement and Delivery,NHS Modernisation Agency, Leicester.
Niven, P.R. (2003), Balanced Scorecard Step-by-Step for Government and Non-Profit Agencies,John Wiley and Sons, Hoboken, NJ.
Northcott, D. and Taulapapa, T.M. (2012), “Using the balanced scorecard to manage performance inpublic sector organizations: issues and challenges”, International Journal of Public SectorManagement, Vol. 25 No. 3, pp. 166-191.
Osborne, S.P., Radnor, Z. and Nasi, G. (2013), “A new theory for public service management? Towards a(public) service dominant approach”, The American Review of Public Administration, Vol. 43 No. 2,pp. 135-158.
Penna, B. (2011), The Nonprofit Outcomes Toolbox: A Complete Guide to Program Effectiveness,Performance Measurement, and Results, John Wiley and Sons, Hoboken, NJ.
Pidd, M. (2012),Measuring the Performance of Public Services, Cambridge University Press, Cambridge.
Radnor, Z. (2010), “Transferring Lean into government”, Journal of Manufacturing TechnologyManagement, Vol. 21 No. 3, pp. 411-428.
Radnor, Z. and Lovell, B. (2003), “Success factors for implementation of the balanced scorecard in aNHS multi-agency setting”, International Journal of Health Care Quality Assurance, Vol. 16 No. 2,pp. 99-108.
Radnor, Z. and Osborne, S.P. (2013), “Lean: a failed theory for public services?”, Public ManagementReview, Vol. 15 No. 2, pp. 265-287.
Ridley, J. and Jones, L. (2002), User and Public Involvement in Health Services, Partners in Change, SHSTrust, Edinburgh.
Robinson, N. (2015), “Developing strategy in the public sector”, IMPACT, Vol. 2, Autumn, pp. 39-43.
Sanger, M. B. (2008), “From measurement to management: breaking through the barriers to state andlocal performance”, Public Administration Review, Vol. 68 No. 1, pp. S70-S85.
Seddon, J. (2008), Systems Thinking in the Public Sector, Triarchy Press, Axminster.
Smith, P. (1993), “Outcome-related performance indicators and organizational control in the publicsector”, British Journal of Management, Vol. 4 No. 3, pp. 135-151.
Smith, P.C. and Goddard, M. (2002), “Performance management and operational research:a marriage made in heaven?”, Journal of the Operational Research Society, Vol. 53 No. 3,pp. 247-255.
Strategy Unit (2003), Ethnic Minorities in the Labour Market, HMSO, London.
Thornton, J. (2009), “Public sector performance management: a discussion draft to stimulate debate andfeedback”, Oracle Corporation, Reading, MA.
Wang, W., Liu, W. and Mingers, J. (2015), “A systemic method for organisational stakeholderidentification and analysis using soft systems methodology (SSM)”, European Journal ofOperational Research, Vol. 246 No. 2, pp. 562-574.
457
Public SectorScorecard
Dow
nloa
ded
by S
heff
ield
Hal
lam
Uni
vers
ity, M
r M
ax M
oulli
n A
t 11:
36 0
3 M
ay 2
017
(PT
)
Woodward, G., Manuel, D. and Goel, V. (2004), Developing a Balanced Scorecard for Public Health,Institute for Clinical Evaluative Sciences (ICES), Toronto.
Yeung, A.K. and Connell, J. (2006), “The application of Niven’s balanced scorecard in a not-for-profitorganization in Hong-Kong: what are the factors for success?”, Journal of Asia Business Studies,Vol. 1 No. 1, pp. 26-33.
About the authorMax Moullin is the Director of the Public Sector Scorecard Research Centre and a Visiting Fellow at theSheffield Business School where he was a Principal Lecturer for over 25 years. He is a Fellow of theChartered Quality Institute and the Operational Research Society and author of the book DeliveringExcellence in Health and Social Care. Max Moullin can be contacted at: [email protected]
For instructions on how to order reprints of this article, please visit our website:www.emeraldgrouppublishing.com/licensing/reprints.htmOr contact us for further details: [email protected]
458
IJPPM66,4
Dow
nloa
ded
by S
heff
ield
Hal
lam
Uni
vers
ity, M
r M
ax M
oulli
n A
t 11:
36 0
3 M
ay 2
017
(PT
)