international journal of scientific & engineering research ...€¦ · doc. dr. sci. med. lutfi...
TRANSCRIPT
International Journal of Scientific & Engineering Research, Volume 6, Issue 5, May-2015 726 ISSN 2229-5518
IJSER © 2015 http://www.ijser.org
THE IMPACT OF DIABETES ON THE RATE OF PROGRESS OF CHRONIC RENAL
FAILURE 1. Dr. Argjent Muça, 2. Doc. Dr. Sci. Med. Lutfi ZYLBEARI2,,3, 3.Mr. Gazmend Zylbeari2.4. Mr. Dr.Zamira bexheti 3
1. Faculty of Medicine-Clinic for Endokrinology- Skopje,R. Macedonia
2. Private Special Hospital For Nefrology And Hemodialysis ,,Vita Medical Group” - Tetova, Macedonia 3. State University of Tetova, Medical Faculty, Tetova, Macedonia
Abstract: Diabetes mellitus still remains a serious health problem with a high prevalence worldwide in developed and developing countries, and with major impact on increasing the level od cardiovascular mortality and morbidity. Diabetes is counted as the fourth cause of mortality in developed countries. (7). In the United States and in Western countries diabetes with diabetic nephropathy, is recognized as the leading cause of kidney disease and chronic kidney disease at terminal stage. A large number of epidemiological studies have shown that one third of patients with hemodialysis or kidney transplanted patients with diabetes mellitus are tip 2. (8,9). Purpose of the paper:The purpose of the paper was to verify and document the impact of hyperglycemia in the rate of progress of chronic renal failure, as well as the correlation between hyperglycemia with cardiovascular disease and premature atherosclerosis of uremic and Diabetes Mellitus patients treated with hemodialysis, compared with the control group of healthy individuals. Material and methods of work, the control group, and forms of treatment with dialysis:In this prospective cohort research (,, cross-section ") are included 240 examiners, of whom 120 were uremic and diabetes mellitus patients, while 120 were healthy individuals who served as a control group. Blood taken for examination inserted into the vial with a few drops heparin (5ccm serum) were sent for analysis at the Institute of Clinical Laboratory in Skopje. From uremic and DM patients treated with HD (No.120), 54 of them (45%) were female with an average age 58.60 +/- 12.00 ndersa 64 (55%) were male, with an average age: 59.50 +/- 10.50 year. Control group of healthy examiners (voluntary blood donors) also were 120 of whom: 54(45%) were female with an average age of =58.00±13.20 and 64(55%) men with an average age of 57.60 ± 14.00 years. Control group was similar to the group of sick patients by age, gender and national affiliation. From total number of patients (120) 75 were with Diabetes Mellitus Tip-1 (D.M. Tip1 –insuline dependent) while 45 were patients with Diabetes Mellitus Tip-II ( D.M. tip 2 –tretated with oral hypoglycemics), table number 1. Both, patients and control group were analyzed within 12 months – once every three months, a total of 4 measurements, glycaemia profile, glycosylated hemoglobin (HbA1c), lipid profile and BMI (Body Mass Index) . Numerous studies have verified the impact of control of blood glucose and glycosilated hemoglobin (HbA1C) values in preventing micro/ macrovasculare and cardiovascular disease. (10)
Index terms: Diabetes Mellitus (DM),ESRD, blood glucose (Gl), the glycosylated hemoglobin (HbA1c), atherosclerosis (Ath), lipids profile.
—————————— ——————————
1 INTRODUCTION
Chronic deficiency presents irreversible, progressive reduction of renal function and glomerular filtration. When glomerular filtration rate (GFR) decrease among 30ml / min, while serum creatinine concentrations begin to rise above 240 μmol / l, the progress of renal failure begins with increased faster (1). With chronic renal failure is meant renal injury, when GFR is <90 ml / min, 1.73 m2 IRK and which lasts more than 3 months. Diabetes today is extremely big socioeconomic problem, due to material expenditures. As most frequent presenting increased risk factors leading to rapidly progressive renal damage are: high arterial pressure, excessive loss of protein through the urine, diabetic disorders, lipid disorders, MIA syndrome etc.
Dr. Argjent Muça-Faculty of Medicine-Clinic for Endokrinology- Skopje,R. Macedonia . Doc. Dr. Sci. Med. Lutfi ZYLBEARI- Private Special Hospital For Nefrology And Hemodialysis ,,Vita Medical Group” - Tetova, Macedonia, State University of Tetova, Medical Faculty, Tetova, Macedonia Mr. Gazmend Zylbeari-Private Special Hospital For Nefrology And Hemodialysis ,,Vita Medical Group” - Tetova, Macedonia 4. Mr. Dr.Zamira bexheti- State University of Tetova, Medical Faculty, Tetova, Macedonia For early detection of chronic renal injury first must be established criteria for early diagnosis of the basic disease, determining the stage of damage according to GFR, renal disease diagnostic screening, detection of manifestations and complications of renal lesions, detection of risky factors in the impact of progress of renal and cardiovascular damage.
.
IJSER

International Journal of Scientific & Engineering Research, Volume 6, Issue 5, May-2015 727 ISSN 2229-5518
IJSER © 2015 http://www.ijser.org
Under the proposal of K / DOQI and NKF (National Kidney Foundation), the levels of renal damage are determined according to GFR. (Table 1).
Phases Description of renal damage GFR* ml/min/1.73m2
1 Mild renal impairment with normal filtering ≥ 90
2 The slight decrease in renal function 60-89
3 The average reduction in renal function 30-59
4 Severe damage in renal function 15-29
5 Renal failure < 15 (dialysis)
* GFR-Glomerul Filtration Rate
At the table number 2 are identified normal and pathological values of proteinuria and albuminuria. (M=Males,F=Females)
Values Proteinuria Microalbuminuria
M= 17-250 mg/L M > 250mg/L M= < 17mg/L
F < 25 mg/L F= 355mg/L F= 25- 355 mg/L
Patients with chronic kidney disease (CKD) and Diabetes are required to adhere to the rules of the consumption of protein (when the cleareance of the endogen creatin is below 50-40 ml/min/1.73m2) , they should consume 0.6-0.8 g/Kg/PT/ per day or 30-35 kcal/kg. Clinical results from the study by MDRD (Modification of Diet in Renal Disease) has verified that if arterial
pressure is on borders: 125/75 mmHg and consumptions of proteins is from 0,6– 0,8 g/Kg /PT per day, significantly affects the inhibition and prevention of rapid progression of renal damage. As parameters for the determination of nutritional status, should be taken: concetracion of albumin, concentration of serum transferrin and body mass index (BMI)
At the table number 3 we presented the definition of progress, remission and regression of chronic nephropathy manifested by proteinuria
Parameters Progression Remission Regression
Proteinuria >1.0 g/24 h < 1.0 g/24 h < 0.3 g/24 h
Levels of FG
FG diminished
FG stable
FG increased
The structure of the kidney
FG exacerbated FG stable FG improved
The protein excess in urine may be reduced if we stick to following preferences : salt restriction, use of lower doses of ACE inhibitor, use of beta blockers, angiotensin II receptor antagonist ( when values of K are < 5.0 mmol/l), use of statins, normalization of glycemia. A good control of glycemia, when the level of HbA1c is < 7,0%, significantly inhibits the progression of diabetic nephropathy . Uremic patients treated with HD, HbA1c values should behave < 8,0% (4,5,6). A prospective study on diabetes has verified that intensive treatment of diabetes and normalization of elevated blood glucose values, has reduced for 16 -21% risk of acute myocardial infarction, from peripheral vascular diseases has been reduced for 35%, amputation for 39% etc. Any reduction in glycosylated hemoglobin for 1%, is in high positive correlation with risk reduction for 21% of CVD, and 37% of microvascular complications. Therefore, the control of glycemia and HbA1c, should be the primary obligation in the early detection of diabetic nephropathy. Past years was dominating the perception that patients with type 2 diabetes with nephropathy and proteinuria had relatively good prognosis compared with patients with type 1 diabetes, however contemporary
studies in recent years have verified that are equally at risk from CKD the two groups of patients with diabetes (13). Although kidney metabolism of insulin plays a small role for endogenous insulin mostly metabolized and degraded by the liver, exogenous insulin (at patients in isulin) primarily is eliminated by the kidneys, causing proteinuria with effects of diabetic nephropathy(14) . In patients with renal failure levels of insulin, proinsulin and C-peptides are grown..(15) . Renal clearance of C-peptide is larger compared to that of insulin, therefore examination of the concentration of C-peptide as a first warning on the secretion of insulin, is necessary at patients with diabetes. During the early stage of renal failure the insulin cleareance form kidneys is weakened, because of renal hipoperfusion (blood flow in kidneys is reduced), and as e result of beginning of decline of renal function, with what we have consequently reducing insulin extraction from body tissue. This phenomenon compensate the fall of insulin filtration up to that stage when GFR is < 20 ml /min, after which purification of insulin is reduced even further and as a result of increased half-life of insulin,
IJSER
International Journal of Scientific & Engineering Research, Volume 6, Issue 5, May-2015 728 ISSN 2229-5518
IJSER © 2015 http://www.ijser.org
and general requirements for insulin even more are reduced (16,17,18.). There are experimental studies in animals showing that chronic renal failure significantly affects the prevention and suppression of extra renal metabolism of insulin eg in skeletal muscles and liver. Therefore happens that diabetic patients (insulin dependent)
manifest decline in demand for insulin (insulin dose reduction) due to suppression of insulin metabolism. Some patients with CKD treated with HD often manifests symptoms of hypoglycemia because of the prolonged half-life of insulin in circulation and reduced elimination, while in normal circumstances renal tubes capacity to absorb insulin filter is large.(19,20).
2. MATERIAL AND METHODES
In this prospective cohort research (,, cross-section ") are included 240 examiners, of whom 120 were uremic and diabetes mellitus patients, while 120 were healthy individuals who served as a control group. Blood taken for examination inserted into the vial with a few drops heparin (5ccm serum) were sent for analysis at the Institute of Clinical Laboratory in Skopje. From uremic and DM patients treated with HD (No.120), 54 of them (45%) were female with an average age 58.60 +/- 12.00 ndersa 64 (55%) were male, with an average age: 59.50 +/- 10.50 year. Control group of healthy examiners (voluntary blood donors) also were 120 of whom: 54(45%) were female with an average age of =58.00±13.20 and
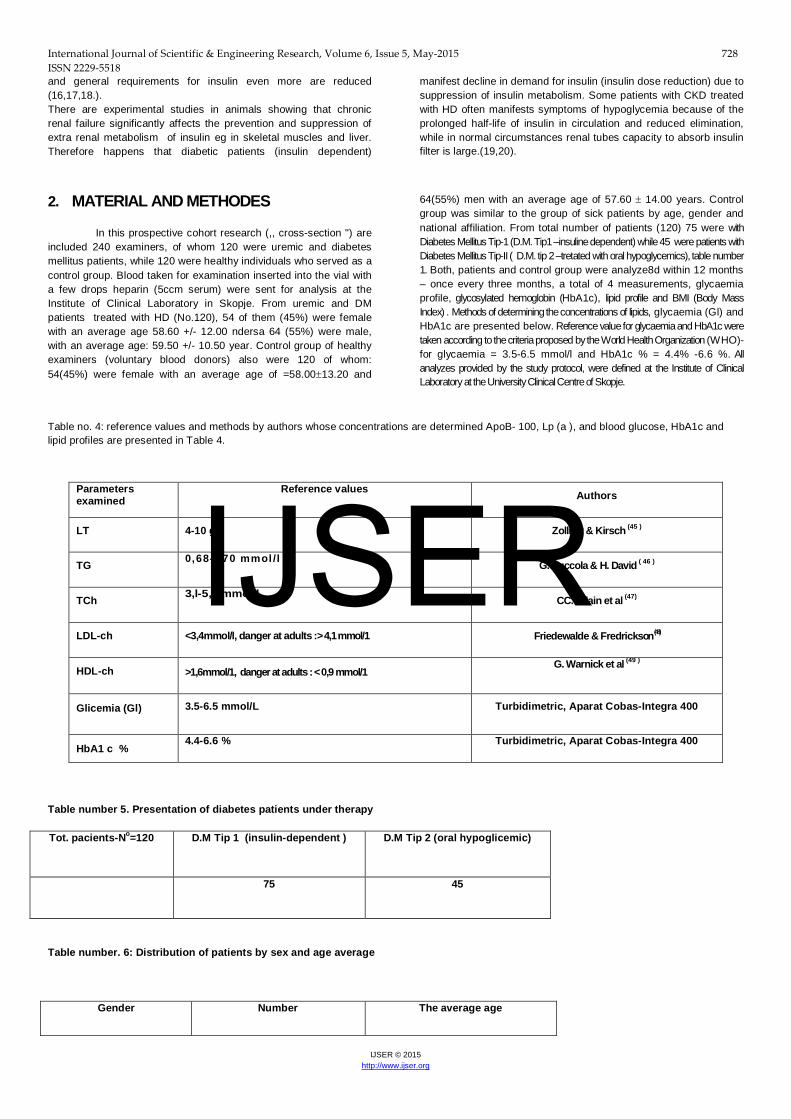
64(55%) men with an average age of 57.60 ± 14.00 years. Control group was similar to the group of sick patients by age, gender and national affiliation. From total number of patients (120) 75 were with Diabetes Mellitus Tip-1 (D.M. Tip1 –insuline dependent) while 45 were patients with Diabetes Mellitus Tip-II ( D.M. tip 2 –tretated with oral hypoglycemics), table number 1. Both, patients and control group were analyze8d within 12 months – once every three months, a total of 4 measurements, glycaemia profile, glycosylated hemoglobin (HbA1c), lipid profile and BMI (Body Mass Index) . Methods of determining the concentrations of lipids, glycaemia (Gl) and HbA1c are presented below. Reference value for glycaemia and HbA1c were taken according to the criteria proposed by the World Health Organization (WHO)- for glycaemia = 3.5-6.5 mmol/l and HbA1c % = 4.4% -6.6 %. All analyzes provided by the study protocol, were defined at the Institute of Clinical Laboratory at the University Clinical Centre of Skopje.
Table no. 4: reference values and methods by authors whose concentrations are determined ApoB- 100, Lp (a ), and blood glucose, HbA1c and lipid profiles are presented in Table 4.
Table number 5. Presentation of diabetes patients under therapy
Tot. pacients-No=120 D.M Tip 1 (insulin-dependent ) D.M Tip 2 (oral hypoglicemic)
75 45
Table number. 6: Distribution of patients by sex and age average
Gender Number The average age
Parameters examined
Reference values Authors
LT 4-10 g/l Zollner & Kirsch (45 )
TG 0,68- l,70 mmol /l G. Buccola & H. David ( 46 )
TCh 3,l-5,2 mmol/l CC. Allain et al (47)
LDL-ch <3,4mmol/l, danger at adults :> 4,1 mmol/1 Friedewalde & Fredrickson (48)
HDL-ch >1,6mmol/1, danger at adults : < 0,9 mmol/1 G. Warnick et al (49 )
Glicemia (Gl)
3.5-6.5 mmol/L Turbidimetric, Aparat Cobas-Integra 400
HbA1 c % 4.4-6.6 % Turbidimetric, Aparat Cobas-Integra 400
IJSER
International Journal of Scientific & Engineering Research, Volume 6, Issue 5, May-2015 729 ISSN 2229-5518
IJSER © 2015 http://www.ijser.org
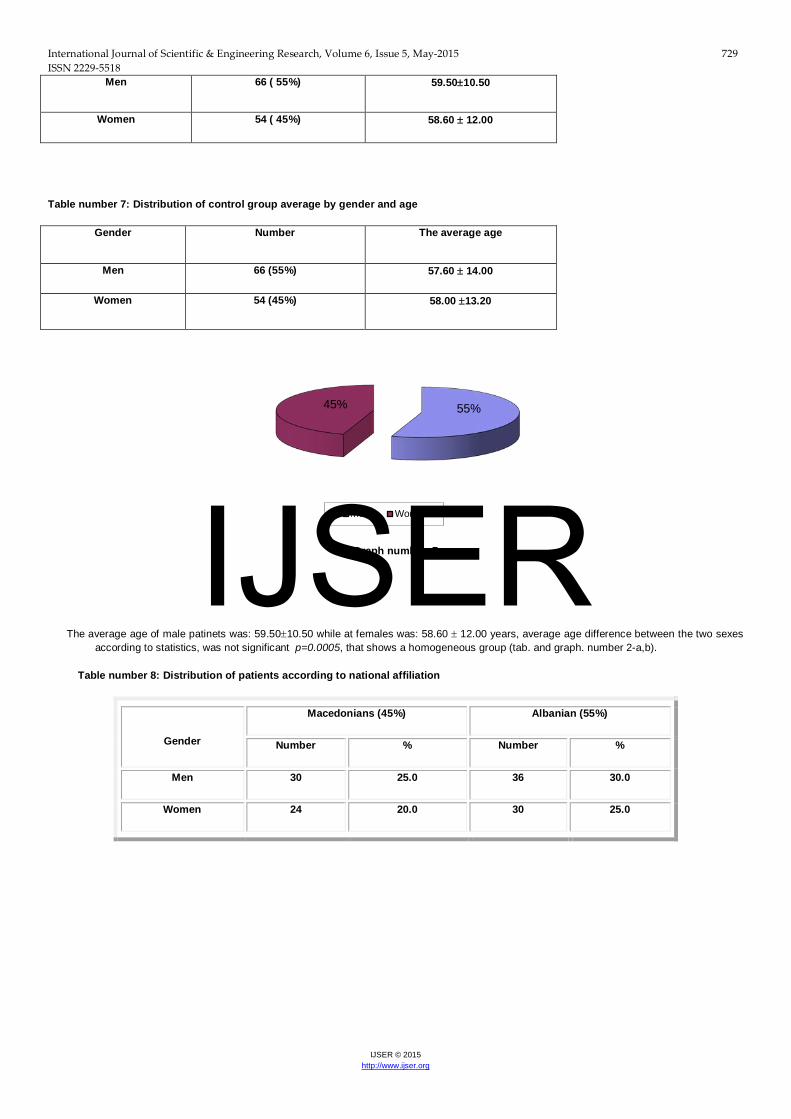
Men 66 ( 55%) 59.50±10.50
Women 54 ( 45%) 58.60 ± 12.00
Table number 7: Distribution of control group average by gender and age
Gender Number The average age
Men 66 (55%) 57.60 ± 14.00
Women 54 (45%) 58.00 ±13.20
Graph number. 7
The average age of male patinets was: 59.50±10.50 while at females was: 58.60 ± 12.00 years, average age difference between the two sexes according to statistics, was not significant p=0.0005, that shows a homogeneous group (tab. and graph. number 2-a,b).
Table number 8: Distribution of patients according to national affiliation
Gender
Macedonians (45%) Albanian (55%)
Number % Number %
Men 30 25.0 36 30.0
Women 24 20.0 30 25.0
55% 45%
Men WomenIJSER

International Journal of Scientific & Engineering Research, Volume 6, Issue 5, May-2015 730 ISSN 2229-5518
IJSER © 2015 http://www.ijser.org
Graph. number.3
From the total number of patients, 54 (45%) were Macedonian affiliation, while 66 (55%) were Albanian. From the total number of Macedonian patients (45%), 25% were males, while 20% were females. From the total number of Albanian patients (55%), 30% were males, while 25% were females. From the total number of 120 patients (100%), 66 (55%) were belonging to the Islamic religion, while 54 (45%) of the Catholic religion.
Table. 9: Distribution of patients according BMIx: male=66 and female = 54
BMIx Women Men
Poor feeding 10 10
Normal feed 26 31
More feed 14 15
Obesity instance II-a 4 10
0 10 20 30 40 50 60
Macedonians
Albanian
25
20
30
25
IJSER

International Journal of Scientific & Engineering Research, Volume 6, Issue 5, May-2015 731 ISSN 2229-5518
IJSER © 2015 http://www.ijser.org
Graph. number 9 From the total number of examinated patients – 120 (100% ) by BMIx, with the highest percentage of 48.0% were patients that belong to the group that were normal feeded, than follows the group of patients fed highly with 26 %, then the group fed poor 19.0%, and finally the group with second-degree obesity -a(II-a) with 10%, under the table and graph number 9. The difference between patients according to statistics is not significant with p<0.0005, and shows that this is homogeneous groups of patients.
Statistical processing of material examined
Values obtained of blood glucose, HbA1c% and lipids (Total chol., TG, HDL-ch, LDL-ch) and control group are presented with average values and standard deviation X +/_ SD. We tested the association between obtained variables, with linear regression analysis ( y= B x+ A) wh er e i t was es t i mat ed th e c or r e l a t i on c oef f ic i en t , , r " w i t h s t a t is t ic a l va l u e f or , , p” l ess th an 1 %, p< 0. 0 0 01 . C omp ar at i ve s t a t is t ic s of th e p ar am et ers of b l o od g l uc os e an d g l yc os yl a t ed h emog l ob i n b et ween th e t wo gr ou ps , was an al yzed w i t h t es t c a l l ed ST UDE NT OV , , t " , wh i l e f or d ep en d en t an d in d ep en d en t examp l es , as wel l as n on - p ar amet r ic t es ts , we us ed Man n-W hi tn e y-U t es t . S t at is t ic a l l y s ig n i f ic an t d i f f er enc es b et we en t h e gr ou p of p at i en ts an d c ont r o l gr ou p f or ob t a i n ed va l u es of th e e xam i n ed p ar amet ers , wer e an al yz ed w i t h th e t es t s o-c al l ed , ,A n on o va T wo-F ac t or ” w i th s t a t is t ic a l va l u e f or , , p “ l ess t h an 5% , r es p ec t i ve l y <0 . 00 0 5. R esu l ts ob t a i n ed f r om 4 measu r emen ts ar e pr es en t ed i n t ab ul ar f or m an d ar e p r oc ess ed in s t an d ar d s t a t is t ic a l s of t war e ( S t at is t ic f or W ind ows , vers i on 6 . 0 A St at . s of t T u ls a OK USA ) .
GAIEND RESULTS:
Results ( glycaemia, HbA1c, lipids,-tot.chol.,TG, HDL, LDL) obtained from patients group and control group are presented in tabular form. From these tables we can observe that at the two gruops of patients ( DM Type-1 and DM Type- 2 ), are verified high concentrations of lipids and HbA1c with significant statistical differences for p<0.0001, compared with control group. Between obtained values of patients ( DM Type-1 and DM Type- 2 ), was not noticed any significant difference, facts that are consistent with many other studies. Lipid parameters presented a significant increase of the concentrations of: LDL-ch and TG, while low concentrations of HDL-ch at two group of patients with IRKT and DM, compared with the results from the control group. Values obtained the total cholesterol (TCH) from the group of patients with DM and IRKT, compared with control group did not show any statistical significance.
Table nr.10. Presentation of the average values of the parameters analyzed to examine patients with DM type 1 - the Insulin-Dependent N0 = 75) and DM type 2 (with oral hypoglycemic-N0 = 45)
19% 48%
26% 7%
Poor Feeding Normal feed More feed Obesity instance II-a
IJSER

International Journal of Scientific & Engineering Research, Volume 6, Issue 5, May-2015 732 ISSN 2229-5518
IJSER © 2015 http://www.ijser.org
Parameters Number Average Minimum Maximum ± SD
Patients with Diabetes Mellitus, Type 1 (insulin-dependent N0 = 75 )
HbA1c % 75 9.4 6.5 13.80 6.50
Glycaemia 75 10.08 7.80 11.70 3.60
LT 75 7.60 2.30 12.50 2.80
TG 75 3.70 1.95 4.10 1.09
Cholesterol 75 5.70 1.40 6.50 1.40
HDL-ch 75 1.10 0.40 3.75 0.92
LDL-ch 75 4.60 1.60 5.80 0.90
Patients with type 2 D. Melltus tip 2 ( oral hypoglycemic - N0 = 45)
Glycaemia 45 7.80 4.60 9.60 3.20
HbA1c % 45 8.40 5.00 8570 3.80
LT 45 7.50 5.40 10.50 1.40
TG 45 3.80 2.40 4.80 0.90
Cholesterol 45 5.20 1.40 6.40 1.90
HDL-ch 45 1.08 0.50 2.00 0.70
LDL-ch 45 4.80 2.10 5.40 0.85
Table number 11. The average values of the analyzed paramaters for urea, creatinin and uric acid (serume values) and GFR defined under formula from Cocroft&Gault in ml / min in examined patients with DM Type 1 (insuline dependent) N0 = 75 at the beginning of the study
Parameters Average values ± SD
Potassium (mmol/l) 4.50 0.70
Urea(mmol/l) 14.70 2.80
Creatinin(mmol/l) 325.00 42.00
Uric acid(μmol/l) 386.00 48.60
GFR ( by Cocroft&Gault) 58.00 ml/min 5.80
Table number 12. The average values of the analyzed paramaters for urea, creatinin and uric acid (serume values) and GFR defined under formula from Cocroft&Gault in ml / min in examined patients with DM Type 1 (insuline dependent) N0 = 75 after 12 months
IJSER

International Journal of Scientific & Engineering Research, Volume 6, Issue 5, May-2015 733 ISSN 2229-5518
IJSER © 2015 http://www.ijser.org
Parameters Average values ± SD
Potassium (mmol/l) 5.0 0.60
Urea (mmol/l) 18.60 2.30
Creatinin ( mmol/l) 390.00 13.50
Uric acid(μmol/l) 410.00 20.00
GFR (by Cocroft&Gault) 54.00 ml/min 5.40
Table number13. The average values of the analyzed paramaters for urea, creatinin and uric acid (serume values) and GFR defined under formula from Cocroft&Gault in ml / min in examined patients with DM Type 2 (treated with oral hypoglycemic) N0 = 45 at the beginning of the study
Parameters Average values ± SD
Potassium (mmol/l) 4.50 0.60
Urea (mmol/l) 14.00 3.20
Creatinin ( mmol/l) 375.00 16.00
Uric acid (μmol/l) 386.00 28.00
GFR (by Cocroft&Gault) 60 ml/min 7.90
Table number 14. The average values of the analyzed paramaters for urea, creatinin and uric acid (serume values) and GFR defined under formula from Cocroft&Gault in ml / min in examined patients with DM Type 2 (treated with oral hypoglycemic) N0 = 45 after 12 months
Parameters Average values ± SD
Potassium (mmol/l) 5.00 0.40
Urea (mmol/l) 16.00 2.50
Creatinin ( mmol/l) 390.00 14.00
Uric acid (μmol/l) 420.00 15.00
GFR (by Cocroft&Gault) 50.00 ml/min 6.50
In the tables we can notice that between the parameters of the two groups of patients with DM (Insulin dependent patients and patients that are treated with oral hypoglycemic) there is no significant difference, except a slight increase of urea, kreatinin, uric acid and a mild decration of gromerular filtration (but on a significant decration) that shows the stabilization of diabetes takes place, and the rate of the renal insufficiency will slow down.
Table number 15. Presentation of the Mann-Whitney U-test for the difference of the analyzed parameters values at patients with DM type 1 and DM type 2.
Parameters U Z p-level
Glicemi 6750.000 0.47595 0.850240
HbA1c % 8365.000 0.48350 0.006540
IJSER

International Journal of Scientific & Engineering Research, Volume 6, Issue 5, May-2015 734 ISSN 2229-5518
IJSER © 2015 http://www.ijser.org
LT 1140.000 -0.126579 0.900480
TG 658.400 -3.25700 0.001120
Cholesterol 1086.500 0.37690 0.701420
HDL-ch 1076.800 0.56810 0.607800
LDL-ch 1147.600 -0.09840 0.964540
The difference which was recorded between the average values of patients with DM type 1 and type 2 DM was nonsignificant, for p <0.005. Significant difference was recorded only at: TG (p = 0.001120)
DISCUSSION: ESRD and diabetes are characterized by high risk of micro and makrovasculare disease, therefore are necessary numerous studies to detect new factors of cardiovascular risk, particularly those complications that are closely related to microvascular disease, as a result of unregulated diabetes. Among the risk factors that in recent years have been given special attention, are higher concentration of lipoproteins and hyperglycemia. There are documented facts that a large number of patients with DM and ESRD are potential candidate of a large number of diseases: cardiovascular, unstable angina pectoris, ischemic heart disease, acute myocardial infarction, left ventricular hypertrophy, congestive heart weakening , brain stroke, macrovascular complication, peripheral vascular diseases, diabetic vascular complications, diabetic retinopathy etc. All the above mentioned diseases are frequent and the main causes of morbidity and mortality of uremic and diabetic patients treated with HD )50, 51,52,53,54) therefore the American Association of Diabetes always suggests the maintenance and regulation of normal values of glycemia. Irregular checks and bad control of glycemia, are calculated as a indipedent risky factors rapid progression in ESRD (regardless of the type of diabetes). Patients with chronic renal failure have disturbed metabolism of glucose and insulin sensititvity. The basic mechanisms of disruption of glucose metabolism at diabetic patients with ESRD are not well known, but it is assumed that in this mechanism are involved and influencing: increase of gluconeogenesis in liver, reduced hepatal and skeletal absorption of glucose from muscles helped by an impairment of intracellular metabolism of glucose , due to the reduced oxidation of glucose in carbon dioxide and water , or as a consequence of the reduced synthesis of glucagon. The exact mechanism of insulin resistance of diabetic patients with ESRD is unclear, although some experts in their clinical studies have verified that during uraemia glucose production and glucose absorption from liver are normal, however skeletal muscles are the principal place of insulin resistance, while the oxidation of glucose is relatively normal. (21,22,223) Other factors that contribute to insulin resistance at uremic patients with diabetes are: accumulation of uremic toxins (proinflammatory cytokines, Interleucin,, MIA syndrome , secondary hyperparathyroidism , increase of PTH, renal anaemia, metabolic acidosis , iron deficiency, intravenously supplementation therapy with calcitriol (1,25-dihydroxyvitamin D) (24,25,26).A number of studies have verified that supplementation and correction of renal anemia with Eritropoetin significantly increase the sensitivity of insulin, increase secretion of insulin and decrease blood glucose level( ,27,28,29,30). The need for insulin in patients with DM and ESRD showa a biphasic requirement. At the beginning control (where GFR> 50 mL / min) and balance of glycemia is deteriorating due to insulin resistance. Therefore to achieve normalization of
glucose are needed higher doses of insulin. With advanced kidney failure and reduction of GFR <50 ml / min, insulin needs are smaller, and for normalization of glycemia are needed lower doses of insulin, even in some extreme cases may be necessary to stop with insulin. The need for insulin is also reduced due to reduced calorie intake of uremic patients with diabetes. (31,32). The measurement of HbA1c should be the most accurate method to assess glycemic control at patients with diabetes and ESRD, and uremic patients treated with HD (33,34,35,36) . Management of diabetic patients with advanced kidney disease, involves the use of low protein diet and limited sugary foods. In patients with type 1 diabetes (insulin therapy) food and insulin should be taken at certain time, and also attention should be paid to body weight, physical activity etc. Therefore, patients with diabetes and chronic renal failure should be advised to consume food with a limited amount of protein and to compensate the losses of calories from carbohydrates. Quality dietary control of these patients calls for close collaboration between experts in the field of diabetology, nephrology and dietology. This group of patients should avoid oral hypoglycemic, because of risk from hypoglycemia, with the exception of Glipizide or repaglinide (37). It is proven and documented that there is a high correlation between renal damage (micro / makroalbuminurise and proteinurise) and high values of glycaemia and HbA1c, with the rapid pace of progress of esrd, associated with diabetic nephro-pathy, and retinopathy. (38). A large number of studies on the role and effect of diabetes, have verified that patients with diabetes have pace and higher frequency of chronic renal damage progression. During blood laboratory examinations of patients with DM (regardless of the type of diabetes) is always present hypertrigly-ceridemia and high values of C-Reactive Protein (PCR), that also shows the presence of a silent inflammation in patients with diabetes mellitus (DM) and chronic renal failure.(39). Monitoring of hyperglycemia and HbA1c (within three months), should be basic postulate and one of the primary measures in pursuit of the pace of IRK and diabetic nephropathy. A large number of epidemiological studies have verified that with regulation and control of hyperglycemia, significantly is reduced the incidence rate of renal disease, therefore the American Association for Diabetes annually provides recommendations on control and regulation of hypergly-cemia and elevated HbA1c values of patients with ESRD and Diabetes Mellitus, which recommendations signify-cantly slows down the pace of progress of the IRK and the risk of CVD. In recent years the incidence of ESRD as a result of unregulated diabetes and diabetic nephropathy not only in the US and Europe, but also in the Balkans, has an increase of 33% -40%, which arises from the failure to treat the diabetes. Therefore recent years nephrologists always suggest and propose that the measurement and monitoring of blood glucose, HbA1c, arterial
IJSER

International Journal of Scientific & Engineering Research, Volume 6, Issue 5, May-2015 735 ISSN 2229-5518
IJSER © 2015 http://www.ijser.org
pressure and lipid control, to be one of the manda-tory measures for doctors at primary and second-dary practice, which evidently will reduce the rapid pace of diabetes. Since the initial stages of diabetes appearance (DM) there are also disorders of lipid (dyslipidaemia), therefore early examination of these disorders in patients with DM (Type-1 and Type-2) can significantly affect the prevention and slowdown of the early appearance of renal injury. Patients with diabetes mellitus are at higher risk for early atherosclerosis compared with healthy population, as well as its consequences on the cardiovascular system. According to contemporary thoughts diabetes is a multi-factorial disease etiology, and its main characteristic is hyperglycemia accompanied by metabolic disorders of sugars, fats, and proteins, which are manifested by disturbances in the secretion of insulin, insulin resistance, or by interaction all the aforementioned mechanisms. As the underlying factors of appearance of cardiovascular and cerebrovascular disease, and early atherosclerosis in patients with DM, disorders on metabolism of lipids have an important role. (40,41,42). Genetic factors that influence the development of cardiovascular and cerebrovascular diseases, and atherosclerotic processes, are: disruption of reverse transport of HDL-cholesterol, cumbersome expression of B-receptors compared with E-receptors, reduced conversion of VLDL to IDL and LDL-ch (43). Function of apolipoproteins is that they enable the hydrosolubility in water of undigested primary plasma lipids (Ch, TG, FL) by forming hydrosoluble macromolecular complexes of lipoproteins who are transported through the blood. Disorders of apoproteins are genetically determined and their function is defined in the basic way for any apolipoprotein in particular. ApoB-100 provides the absorption of cholesterol from hepatic and extrahepatic tissue by binding to receptors B/E enabling the extraction of triglycerides from the liver. Increased concentrations of ApoB-100 except in patients with Diabetes Mellitus (DM) are also recorded in other diseases as hyperproteinemia: Type II-A, II-B, Type-IV, Type-V, the period of pregnancy, nephrotic syndrome, hiperapo-ß lipoproteinemia, hepatic duct obstruction, smoking, use of diuretic, excessive use of ß-inhibitor therapy with corticosteroids, therapy with ciclosporin (CSA) and in patients with chronic renal failure. Small lipoprotein-A (Lp/a/) antigen (Apolipoprotein/a/; Apo/a/) is synthesized in the liver and in intracellular way via disulfide links is connected with ApoB-100. Lp(a) for the first time discovered Berger in 1963 (44) and is assumed that is a variation of LDL-cholesterol (LDL-ch) and quantitative marker for the risk of atheromatous [Lp(a)-atheromathosis]. Lp(a) reacting with fibrinolysis by enforcing thrombogenesis and formation of atherosclerotic plaque (28). Lp(a) in plasma circulates together with ApoB-100 as the protein basis of lipoproteins (Lp) rich with esterified cholesterol. Lipoprotein(a) can be calculated as the reactant in the acute phase of injury. A large number of studies have documented that between CVD and high value HgbA1c there is a high positive correlation with IRKT patients and D. mellitus (55,56.57). Numerous epidemiological studies and the American Association for diabetes (aad) have verified and documented that the regulation and regular check of glycemia decreases the risk of cardiovascular disease (CVD) and their complications wich reduces the mortality rate in uremic patients treated with hemodialysis (HD) [R = 58]. Concentration of glycated hemoglobin (HgbA1c) (which represents the average value of glycemia within three months) is calculated as the gold standard in the assessment of the risk of CVD in patients with ESRD treated DM and HD(59). American Association for diabetes (AAD)- always calls and suggests examination of glycated hemoglobin in order to behave adequate treatment decisions and treatment of diabetes in patients with ESRD in order to reduced the
complications of diabetic nephropathy [R=60], and slow the pace of progress of the ESRD (50). This happens by the lack of consensus on HgBA1C testing of patients with ESRD and diabetes type 1 and type 2 that in the initial stages of the disease, especially in those patients who are treated with EPO therapy prior to treatment with HD. In the pace of disease progression in patients with diabetes and ESRD affect many factors: the pharmacodynamic effects uremic acid, the perocedures dialysis itself, influence of insulin pharmacokinetics on carbohydrate metabolism and oral hypoglycemics, oxidative stress, lipidic peroxi-dasis, MIA syndrome, arterial hypertension, dyslipidemia, hypertriglyceridemia, shortened erythrocyte life, renal anemia etc. ESRD and DM patients, due to the appearance of anemia in the initial stages should be treated with Eritropoetin (rHuEpo) because eritropoetina increases the percentage of reticulocyte and stimulates the production of new red blood cells [62]. Some authors have verified a high correlation between high concentrations of ApoB-100 and Lp (a), and proteinuria in patients with diabetes mellitus. The above phenomena are justified by the fact that proteinuria results with increased protein synthesis in the liver, which increased synthesis, stimulates more the synthesis of apoproteins with origin from liver, and in particulary increases the concentration of apoliporoteins (a), a constituent of lipoproteins (a). A number of authors have verified early atherosclerosis in patients with DM-Tip1 and those with DM-Tip2 measured with the the scale of the occlusion of peripheral arteries, which is in high correlation with high concentrations of Lp (a). Results obtained from lipid profile showed a high disorder for both groups of exami-ned patients ( those with Type 1 DM and those with DM-Tip.2), which is consistent with all studies about disorders of lipid profile at patients with diabetes. A significant number of patients with DM compared with control groups of healthy individuals present high concentrations of ApoB-100, HbA1c% and Lp (a). This high correlation many authors correlate with the first symptoms of kidney damage from diabetes (the presence of macro- and micro- proteinuria) at those patients. A number of approxi-mately 40% of patients with diabetes and esrd a year before starting treat-ment with HD, have not check the value of HbA1c. According to recent reports from the Association of American nephrologists have there are evidences for increased use of insulin and oral hypoglycemic, which tells us about aggressive access in the treatment of patients with ESRD and diabetes. In the presentation of cardiovas-cular diseases and mortality rates at uremic and diabetic patients treated with HD, in addition to increased sugar level, also affect many other factors such as: disorder of lipid metabolism, hyperapolipoproteinemia, pharmacodynamic effects of uremia, uremic toxins, hemodialysis as medical procedure, effects of insulin, disorders of carbohy-drate metabolism, disorders of coagulation factors, arterial hypertension, smoking, secondary hyperparathyroidism, hyperhomocysteinemia, thrombotic factors, Oxidative stress etc.There are documented facts that the number and the life of erithrocytes at patients with ESRD are reduced, so is expected the decrease of concetration of HbA1c. Eritropoetin therapy of uremic patients with diabetes treated with hemodialysis, is proved that increases the percentage of new red blood cells in circulation, with the smallest exposure of glycemia during the process of glycolysis. HbA1c measurement is required every three months, but there are a group of patients with large discrepancy of values of glycaemia, so measurements of HbA1c at that group of patients should be more frequent. ( 61). Chronic hyperglycemia combined with dyslipidemia and hiperapolipoproteinemi even further increase the risk of morbidity and mortality from cardiovascular disease in uremic patients with diabetes treated with chronic hemodialysis terminals.
5 CONCLUSION:
For conclusion we can say that the knowledge of mechanisms, etiopathogenesiss, function and abnormalities on polymorphism and the negative impact of hyperglycemia and dyslipidemia are among the indipendent and risky factors of CVD and premature atherosclerosis, in
patients with terminal chronic renal failure (ESRD ) and diabetes. Treatment and normalization of their values at the initial stages of the disease is of big importance, and can significantly affect the prevention and can prevent premature progression rate of ESRD and atherosclerotic
IJSER

International Journal of Scientific & Engineering Research, Volume 6, Issue 5, May-2015 736 ISSN 2229-5518
IJSER © 2015 http://www.ijser.org
processes in coronary, cerebral and peripheral arteries. Uremic and diabetic patients treated with HD (regardless of the type of diabetes) are at high risk of early atherosclerosis appearance. Hyperglycemia and dyslipidemia are among the most dangerous factors of progress of ESRD. Therefore, improvement, balancing and regular control of diabetes and lipid, are the
first step in preventing the pace of progress and the incidence of ESRD, early atherosclerosis and cardiovascular disease. Are needed to further studies on the occurrence of CVD in uremic patients with diabetes treated with HD, in order to propose appropriate attitudes on the control of blood glucose and HbA1c based on the facts, at the early stages of the disease.
Literature
1. Schmitz PG. Progressive renal insufficiency. Office strategies to prevent or slow progression of kidney disease. Postgrad Med 2000; 108(1): 145–8, 151–4.
2 Fogo AB. Progression versus regression of chronic kidney disease. Nephrol Dial Transplant 2006; 21(2): 281–4.
3. Bolton WK, Kliger AS. Chronic renal insufficiency: current unders-tandings and their implications. Am J Kidney Dis 2000; 36(6 Suppl 3): S4–12.
4. Praga M. Therapeutic measures in proteinuric nephropathy.Kidney Int Suppl 2005; (99): S137–41.
5... Locatelli F, Del Vecchio L, Pozzoni P. Clinical benefits of slowingthe progression of renal failure. Kidney Int Suppl 2005; (99):S152–6.
6. Manske CL. Hyperglycemia and intensive glycemic control indiabetic patients with chronic renal disease. Am J Kidney Dis1998; 32(5 Suppl 3): S157–71.
7. Grundy SM, Howard B, Smith SJr, Eckel R, Redberg R, Bonow RO. Prevention Conference VI: Diabetes and Cardiovascular Disease: executive summary: conference proceeding for healthcare professionals from a special writing group of the American Heart Association . Circulation. 2002; 105:2231–2239.
8. Mokdad AH, Serdula MK, Dietz WH, et al. The spread of the obesity epidemic in the United States, 1991-1998. JAMA. 1999;282:1519–1522.
9. USRDS 1999 annual data report. Bethesda, Md: National Institutes of Health, National Institute of Diabetes and Digestive and Kidney Disease; 1999. US Renal Data System; pp. 25–38.
10 . Gerstein HC. Dysglycaemia: a cardiovascular risk factor. Diabetes Res Clin Pract. 1998;40(Suppl):9–14.
11. UK Prospective Diabetes Study Group. Intensive blood-glucose control with sulphonylureas or insulin compared with conventional treatment and risk of complications in patients with type 2 diabetes. (UKPDS 33) Lancet. 1998;352:837–853.
12. Stratton IM, Adler AI, Neil AW, et al. Association of glycaemia with microvascular and macrovascular complications of type 2 diabetes (UKPDS 35): prospective observational study. BMJ. 2000;321:405–412
13. Canadian Diabetes Association Clinical Practice Guidelines Expert Committee Canadian Diabetes Association 2003 Clinical Practice Guidelines for the Prevention and Management of Diabetes in Canada.Can J Diabetes. 2003;27(Suppl 2):s21–s23.
14. Ferrannini E, Wahren J, Faber OK, Felig P, Binder C, DeFronzo RA. Splanchnic and renal metabolism of insulin in human subjects: a dose-response study. Am J Physiol . 1983;244:E517–E527.
15. Jaspen JB, Mako ME, Kuzuya H, Blix PM, Horowitz DL, Rubenstein AH. Abnormalities in circulating beta cell peptides in chronic renal failure: comparison of C-peptide, proinsulin and insulin. J Clin Endocrinol Metab. 1977;45:441–446.
16. Rave K, Heise T, Pfutzner A, Heinemann L, Sawicki PT. Impact of diabetic nephropathy on pharmacodynamic and pharmacokinetic properties of insulin in type 1 diabetic patients. Diabetes Care.2001;24:886–890.
17. Biesenbach G, Raml A, Schmekal B, Eichbauer-Sturm G. Decreased insulin requirement in relation to GFR in nephropathic type 1 and insulin-treated type 2 diabetic patients. Diabet Med. 2003;20:642–645.
18. Mak RH, DeFronzo RA. Glucose and insulin metabolism in uremia. Nephron. 1992;61:377–382
19.. Maack T, Johnson V, Kan ST, Figueiredo J, Sigulem D. Renal filtration, transport and metabolism of low molecular weight proteins: a review. Kidney Int. 1979;16:251–270.
20. Goldberg AP, Hagberg JM, Delmez JA, Haynes ME, Harter HR. Metabolic effects of exercise training in hemodialysis patients. Kidney Int. 1980;18:754–761.
21. Alvestrand A. Carbohydrate and insulin metabolism in renal failure. Kidney Int. 1997;62(52Suppl):S48–S52.
22. Carone FA, Peterson DR. Hydrolysis and transport of small peptides by the proximal tubule. Am J Physiol. 1980;238:F151–158.
23. Adrogu HJ. Glucose homeostasis and the kidney. Kidney Int. 1992;42:1266–1272.
24. Mak RH. Intravenous 1,25-dihydroxycholecalciferol corrects glucose intolerance in hemodialysis patients. Kidney Int. 1992;41:1049–1054
25. Kautzsky-Willer A, Pacini G, Barnas U, et al. Intravenous calcitriol normalizes insulin sensitivity in uremic patients. Kidney Int. 1995;47:200–206.
26. Lin S, Lin Y, Lu K, et al. Effects of intravenous calcitriol on lipid profiles and glucose tolerance in uraemic patients with secondary hyperparathyroidism. Clin Sci. 1994;87:533–538.
27. Borissova AM, Djambazova A, Todorov K, Dakovska L, Tankova T, Kirilov G. Effect of erythropoietin on the metabolic state and peripheral insulin sensitivity in diabetic patients on hemodialysis. Nephrol Dial Transplant. 1993;8:93–98.
28. Mak RH. Effect of recombinant human erythropoietin on insulin, amino acid, and lipid metabolism in uremia. J Pediatr. 1996;129:97–104.
29. Kokot F, Wiecek A, Grzeszczak W, Klin M, Zukovska-Szczechowska E. Influence of erythropoietin treat-ment on glucose tolerance, insulin, glucagon, gastrin, and pancreatic polypeptide
IJSER
International Journal of Scientific & Engineering Research, Volume 6, Issue 5, May-2015 737 ISSN 2229-5518
IJSER © 2015 http://www.ijser.org
secretion in hemodialyzed patients with end stage renal disease. Contrib Nephrol. 1990;87:42–51.
30. Chagnac A, Weinstein T, Zevin D, et al. Effects of erythropoetin on glucose tolerance in hemodialysis patients. Clin Nephrol. 1994;42:398–400.
31. Runyan JW, Hurwitz D, Robbins SL. Effect of Kimmelstiel-Wilson syndrome on insulin requirements in diabetes. N Engl JMed. 1955;252:388–391.
32 Weinrauch LA, Healy RW, Leland OS, Jr, et al. Decreased insulin requirements in acute renal failure in diabetic nephropathy. Arch Intern Med. 1978;138:399–400.
33. Ansari A, Thomas S, Goldsmith D. Assessing glycemic control in patients with diabetes and end-stage renal failure. Am J Kidney Dis. 2003;41:523–531.
34. Paisey R, Banks R, Holton R, et al. Glycosylated haemoglobin in uraemia. Diabet Med. 1986;3:445–448.
35. Joy MS, Cefalu WT, Hogan SL, Nachman PH. Long-term glycemic control measurements in diabetic patients receiving hemodialysis. Am J Kidney Dis. 2002;39:297–307.
36. Position statement. Standard of Medical Care in Diabetes-2007. Diabetes Care. 2007;30:s4–s41.
37. K/DOQI clinical practice guidelines for cardiovascular disease in dialysis patients. Am J Kidney Dis. 2005;4(Suppl 3):S1–S360.
38. Tarkun I, Cetiarslan B, Canturk Z. Lipoprotien(a) concentration in patients with type 2 diabetes mellitus without cardiovascular disease: relatinoship to metabolic and diabetic complications. Nutr Metab Cardiovasc Dis 2002 Jun; 12 (3) 127-131.
39. Ogbera o A. Azenabour O A. Lipoprotein(a), C-reaktiv protein and some metabolic cardiovascular risk factors in type 2 DM. Diabetologija & Metabolic Syndrome 2010; 2:51.
40. Alaupovic P, Kostner G, Lee DM, Conathy WL, Magnani HH. Peptide composition of human plasma apolipo-proteins A, B and C. Expos Annu Bioch .Ponticelli C.et al. Lipid abnormalities in maintenance dialysis patients and renal transplant recipients.Kidney Int Suppl. 1978; 8: S 72.
41. Haas LB,Wahl PW, Sherrard DJ. A longitudinal study of lipid abnormalities in renal failure.Nephron 1983; 33:145.
42. Somer JB. Et al.B. Lipoprotein lipids in chronic renal failure and hemodialysis: the influence of etiology and implication for atherogenesis. Atherosclerosis 1979; 34:353.Med. 1972;31:145-60.
43. Miida T, et al. LCAT-dependent conversion of pre β1-HDL into alpha migrating HDL is severely delayed in haemodialysis patients. J Am Soc Nephrol.2003;14:732-8.
44. Scanu AM, Fless GM. Lipopro-tein(a). Heterogeneity and biological relevance.J Clin Invest. 1990; 85:1709-15.
45. Zölner N. Kirchs KZ. Fotometric-colors method. Ges Exp Med. 1962; 135: 545.
46. Bucola G, David H. Quantitative determination of serum triglycerides by use of enzymes. Clin Chem. 1973;19:476-82.
47. Allain CC, Poon LS, Chan CS, Richmond W. Enzymatic determi-nation of total serum cholesterol. Clin Chem.1974;20:470-5.
48. Friedewald WT, Levy RJ, Fredrickson DS. Estimation of concentration of low density lipoprotein cholesterol without the use of the preparative ultracentrifuge.Clin Chem.1972;18:499-502
49.Wamick G, Benderson J, Allbers J. Quantitation of high density lipoprotein subclasses after separation by dextran sulfate and Mg+ precipitation. Clin Chem. 1982; 28: 1574-61
50. System USRD: USRDS 2005 Annual Data Report. Atlas of End-Stage Renal Disease in the United States. National Institutes of Health, National Institutes of Diabetes and Digestive and Kidney Diseases: Bethesda, MD 2005.
51. Koro CE, Bowlin SJ, Bourgeois N et al. Glycemic control from 1988 to 2000 among US adults diagnosed with type 2 diabetes: a preliminary report. Diabetes Care 2004; 27: 17–20.
52. Liebl A, Mata M, Eschwege E. Evaluation of risk factors for development of complications in Type II diabetes in Europe. Diabetologia 2002; 45: S23–28.
53. Saydah SH, Fradkin J, Cowie CC. Poor control of risk factors for vascular disease among adults with previously diagnosed diabetes. JAMA 2004; 291: 335–342.
54. American Diabetes Association. Tests of glycemia in diabetes (position statement). Diabetes Care 2004; 27: S91–S93.
55. Selvin E, Marinopoulos S, Berkenblit G et al. Meta-analysis: glycosylated hemoglobin and cardiova-scular disease in diabetes mellitus. Ann Intern Med2004; 141: 421–431.
56. Menon V, Greene T, Pereira AA et al. Glycosylated hemoglobin and mortality in patients with nondiabetic chronic kidney disease. J Am Soc Nephrol 2005;16: 3411–3417.
57 . Selvin E, Coresh J, Golden SH et al. Glycemic control and coronary heart disease risk in persons with and without diabetes: the atherosclerosis risk in communities study. Arch Intern Med 2005; 165: 1910–1916.
58. Akmal M. Hemodialysis in diabetic patients. Am J Kidney Dis 2001; 38: S195–199.
59. American Diabetes Association. Standards of medical care in diabetes (position statement). Diabetes Care 2005; 28: S4–S36.
60. American Diabetes Association. Clinical practice recommendations . Diabetes Care 2006; 29: S3.
61. Ansari A, Thomas S, Goldsmith D. Assessing glycemic control in patients with diabetes and end-stage renal failure. Am J Kidney Dis 2003 ; 41: 523–531.
62. M E Williams, E Lacson Jr, M Teng, N Ofsthun and J M Lazarus. Hemodialyzed type I and type II diabetic patients in the US: Characteristics, glycemic control, and survival. Kidney International (2006) 70, 1503–1509. doi:10.1038/sj.ki. 500178 ; published online 30 August 2006
IJSER

International Journal of Scientific & Engineering Research, Volume 6, Issue 5, May-2015 738 ISSN 2229-5518
IJSER © 2015 http://www.ijser.org
Adress of the autorss: Ass. Dr. Aegjent MuÇa Faculty of Medicine-Clinic for Endokrinology- Skopje,R. Macedonia E-mail:argjent [email protected] Tel:00389/70883305
IJSER