international journal of social sciences and managementijssm.org/vol_2/neupane_2.1.pdf · services...
TRANSCRIPT
R. Neupane. (2015) Int. J. Soc. Sci. Manage. Vol-2, issue-1: 9-26
Full text of this paper can be downloaded online at www.ijssm.org/ & http://nepjol.info/index.php/IJSSM/issue/archive
International Journal of Social
Sciences and Management A Rapid Publishing Journal
Available online at: http://www.ijssm.org
and
http://www.nepjol.info/index.php/IJSSM/index
For any type of query or feedback kindly contact at email ID: [email protected]
ISSN 2091-2986
Impact factor*: 3.389
*Impact factor is issued by SJIF INNO SPACE. Kindly note that this is not the IF of Journal Citation Report (JCR).
Vol-2(1) January, 2015
CrossRef, Google Scholar, International Society of Universal Research in Sciences
(EyeSource), Journal TOCs, New Jour, Scientific Indexing Services, InfoBase Index,
Open Academic Journals Index (OAJI), Scholarsteer, Jour Informatics, Directory
of Research Journals Indexing (DRJI), International Society for Research Activity
(ISRA): Journal Impact Factor (JIF), Simon Fraser University Library, etc.
R. Neupane. (2015) Int. J. Soc. Sci. Manage. Vol-2, issue-1: 9-26
DOI: 10.3126/ijssm.v2i1.11814
Full text of this paper can be downloaded online at www.ijssm.org/ & http://nepjol.info/index.php/IJSSM/issue/archive
THE EFFECTS OF BRAND IMAGE ON CUSTOMER SATISFACTION AND
LOYALTY INTENTION IN RETAIL SUPER MARKET CHAIN UK
Ramesh Neupane
Greenwich London College, London
Email for Correspondence: [email protected]
Abstract
The main purpose of this research is to examine the effects of brand image on customer satisfaction and loyalty intention. It also examines the
relationships between the brand image and customer satisfaction, brand image and loyalty intention as well as customer satisfaction and loyalty
intention on the context of retail supermarket chain in UK. The hypotheses were formed on the basis of existing literatures and data was
collected to test the hypotheses so it is deductive research. The survey strategy is used to collect information from the customers of the main
six retailers based on London through structured closed ended questionnaires at a point of time and so it is cross-sectional research. A sample
of 120 customers was selected through convenience sampling technique. The statistical and mathematical tools such as percentage analysis,
correlation and regression analysis are used for data analysis through SPSS 20.
This study asserts that the overall brand image has significant effects (P = 0.000 and β = 0.880) on customer satisfaction. Similarly, the overall
brand image has significant effects (p = 0.000 and β = 0.780) on overall customer loyalty intention; and also customer satisfaction has significant
positive effects (p = 0.000 and β = 0.859) on customer loyalty intention in an organisation.
However, this study considered just five variables of brand image and five variables of customer satisfaction. There may have other important
factors which may influence the findings. A small sample size of just 120 customers from just six stores of the main retailers may not represent
the vision of all retail customers. Thus, it is recommended that a large scale research with more variables, large sample size with more stores
from different parts of the UK to validate these findings.
Keywords: Brand Image; Customer Satisfaction; Loyalty Intention; Retailers
Introduction
In the current competitive business environment, the brand
image of a company is very important like products or
services offered. Most of the business organisations
consider a brand image as a powerful asset for their success.
A trusted and recognised brand identity provides confidence
for customers to use the products offered by that brand.
Therefore, the successful organisations always work hard to
build strong brand and represent it in a consistent and clear
way (Egan, 2014).
Customer loyalty and customer satisfaction are also widely
accepted issues for all the companies, which is applied as a
marketing benchmark for the performance of the company
(Bennett and Rundle -Thiele, 2004). It is important to
illustrate that if a customer is happy with the product or
services then he is interested to show loyal attitude towards
the brand i.e. willing to pay more, willing to provide
positive word of mouth and to display loyal behaviours
(Bennett and Rundle -Thiele, 2004; Schultz, 2005). In the
current business atmosphere, all the organisations have
provided focus on 4ps i.e. product, price, place and
promotion and further applying 3ps i.e. process, physical
layout and people for service marketing. According to
Kotler (2001), organisational success is a direct
consequence of brand image and which is measured as a
significant feature of current marketing strategy. The
product differentiation is associated with the symbolic value
of a brand. In fact, according to Rundle-Thiele (2005) and
Kapferer (2005), currently, all of the successful companies
have considered that most of the customers are not loyal
about particular brand. Moreover, the current business
environment is to increase the entry of new product and
competition and service leads consumers to choose
particular product or services among the group of
alternatives (Ballantyne et al., 2011). It is therefore
important for the companies to focus on differentiating their
product from their competitors.
In order to attract new customers and retain the existing
customers for any organisation, the brand image is very
important because of the fact that the customers always seek
for branded products or services in this current competitive
market environment. It is therefore, the companies are
facing intense challenges in maintaining and enhancing
Research Article
R. Neupane. (2015) Int. J. Soc. Sci. Manage. Vol-2, issue-1: 9-26
Full text of this paper can be downloaded online at www.ijssm.org/ & http://nepjol.info/index.php/IJSSM/issue/archive
customer satisfaction, brand image and customer loyalty.
The impression of a brand’s total personality is brand image
which might be imaginary and real shortcommings and
qualities in the mind of associated customers. According to
Wheeler (2013), brand is the name, term, symbol or any
other features that differentiate one product from other
companies’ products. The brand image should be managed
carefuly because it is an important asset for the organisation
in order to creat values for the shareholders and other
associated groups.
Background
Building a reputed brand image and attracting new
customers remains a complicated task for the marketing
managers in any organisation. Nevertheless, the companies
should also focus on customer retention with profitable
long-term relationships. The foundation of customer
retention is higher level of their satisfaction towards the
products and services which they received as well as higher
value by customers. According to Schult, (2005), happy
customers are more likely to show more loyalty towards the
company like willingness to provide positive words of
mouth, repurchase the products as well as willingness to pay
more for the products because of trust. A reputable brand
with higher customer loyalty possesses a higher market
share and capacity to imply higher cost for their products or
services.
The successful companies have concentrated their attention
on higher quality services or products in best competitive
price in a suitable place to attract more customers and
enhance their brand image. The associated symbolic value
of brand image distinguishes the services or products from
the products offered by competitors. The customers have a
nature of comparing one product with the competitors’
product and attracted towards the highly reputed brands that
offer their products in competitive price.
Brand loyalty is ideally measured as the health of the
organisation (Bennett and Rundle-Thiele, 2005) and it is a
“marketers’ Holy Grail” (Kapferer, 2005). Researchers
have reported that a 5% increment in customer retention can
produce 25-95% profitability over 14 industries, for
instance in software, auto service chain and credit card
companies (Reichheld and Detrick, 2003). In addition, these
loyal consumers are more likely to be the promoter of the
brand and recommend it to their friends, relatives and other
potential customers (Schultz, 2005).
The competition among the key retailers such as Tesco,
ASDA, Morrison, Sainsbury, Co-Operative Groups, and
Iceland etc. is highly increasing to attract customers.
Different organisations have their own identity of their
brands in the UK market. They are adopting different
strategies to capture high market share, enhance customer
satisfaction level, customer loyalty as well as brand image
in the competitive market. In this context, this topic of “The
Effects of Brand Image on Customer Satisfaction and
Loyalty Intention in the Context of retail supermarket
chain” is chosen for research.
Aims and Objectives of the Study
The main aim of this research is to examine the effects of
brand image benefits on customer satisfaction and customer
loyalty in the context of retail supermarket chain UK. The
subsidiary aim of this research is to enhance knowledge and
understanding of brand image, customer satisfaction as well
as customer loyalty. The main objectives of this research are
as follows:
To critically examine the relationship between
brand image and customer satisfaction.
To critically evaluate the relationship between
brand image and customer loyalty intention.
To investigate the relationship between customer
satisfaction and customer loyalty intention.
Literature Review
Brand Image
“A brand is a term, design, name, symbol or any other
features that distinguish one company’s product to the
others” (American Marketing Association, 2013). Branding
procedures was initially adopted to differentiate one
individual’s cattle from other’s by means of distinct sign
burned into the cattle’s skin with a hot stamp made by iron
and was subsequently applied in marketing, business as well
as advertising. One of the well-known examples of a brand
is which belongs to Apple Company. Similarly, as
mentioned by Keller (2003), it is a set of mental associations
in customers’ perceptions which increase the value of
products or services. The brand is an intangible and
conditional asset for a company which has a capability to
generate profitability of the firm and compromise the
functional and emotional value (Martisiute et al., 2010).
Moreover, Nandan (2005) stated that brand is a symbol in
every people’s mind and it can be illustrated as visible name
or symbol which can distinguish the products from the
competitors’ products. A brand is as well negotiation of
product, packaging, promotion, advertisements and its
whole presentation besides to a particular name (Pepe et al.,
2011). From customer perspectives, brand is a guarantor of
reliability and equity in consumer products (Roman et al.,
2005). Moreover, Fennis and Pruyn (2006) asserted that
customer would desire to buy and use products from reputed
brand name to draw attention to their behaviours in different
situational perspectives.
Brand image is a unique set of associations in the mind of
customers regarding what a brand stand for and the implied
promises the brand makes. According to Business
Dictionary (2013), “the impression in the mind of customers
of a brand’s total personality which may be imaginary or
real shortcomings and qualities is called brand image”. It is
developed through advertising campaigns with consistent
theme over time, and is validated through the direct
R. Neupane. (2015) Int. J. Soc. Sci. Manage. Vol-2, issue-1: 9-26
Full text of this paper can be downloaded online at www.ijssm.org/ & http://nepjol.info/index.php/IJSSM/issue/archive
experiences by the customers. The reputable brand image
enables the customers to distinguish their needs that the
brand fulfils and it differentiates the company from others
and enhances the customer performance over the brand
(Hess and Story, 2006). The favourable brand image in the
mass market is very important in order to enhance market
share of the company. According to Keller (2003), “brand
image is the set of beliefs, ideas and impression that a
person holds regarding to an object” (p. 23). In addition,
Koo (2003) added that brand image is useful to drive
loyalty, brand equity, brand performance and purchasing
habits of customers.
According to Faircloth et al. (2001), brand image has been
conceptualised and operationalised in many ways. It has
been assessed based on brand values/benefits (Hsieh et al.,
2004; Bhat and Reddy, 1998), and attributes (Koo, 2003;
Kandampully and Suhartano, 2000) or using brand image
scale proposed by Malhotra (1981). The measurement of
brand image based on the above facts could assist
organisation or marketers to identify the strengths and
weaknesses of the particular brand and perceptions of
consumers towards their services or products as well. The
benefits of image can be divided into experiential,
functional and symbolic advantages. The experiential
advantages indicate to ‘what it felt like to use the services
or products and generally associated with product related
attributes’ (Nandan, 2005). The functional benefits are
associated with the intrinsic benefits of services or products
consumption and generally associated to the attributes
related to products. Similarly, the symbolic advantages
were related to the underlying needs for individual
expression or social approval and outer-directed self-esteem
which generally associated to the attributes which are not
related to the products (Sondoh Jr. et al., 2007).
Currently, there is an extensive range of options for the
customers to choose the particular service or product while
entering to shopping complex or via online. It is observed
that emotion of customers is one of the major factors which
influence the purchasing behaviours of customers (Berry,
2000). A study by Dick and Basu (1994) asserted that the
success of brand could generate customers’ awareness
regarding dignity of the brand and so optimise the
profitability of the company due to their purchase of
products and services from the company. Conclusively,
brand image can produce values in terms of assisting
consumers to precede information, generating reasons to
purchase, differentiating the brand from the competitors,
provides positive feelings, and offers a basis of extensions.
Generating and maintaining a successful brand image is an
important role of a company’s marketing strategy and
branding strategy.
The Characteristics of Successful Brands
There are a lot of great traits of successful brands. The
successful brand might be entirely distinct in character; they
communicate something in common, for instance, well-
price product, consistent quality, memorable, reliable and
unstoppable (Murphy, 1998). Successful brand is
memorable due to the fact that it is interesting. Customers
are drawn into it because it is different and unique. The
successful brands are reliable because they are consistent,
the customers are confident about what they will experience
after using this brand because they are dependable and
trustworthy. In addition, successful brands are unstoppable
due to the fact that they are multi-dimensional, customers
can never get enough of them since they are confident and
strong. For instance, Apple continues to verify that it is not
only a computer company. It has a lot of exciting products,
which customers stand in a long queue at the shopping
centres waiting patiently to spend their money. A high
competition, recession, tension in the Middle East – nothing
prevents them from enhancing. The company generated $65
billion revenue and $14 billion profits in 2010 (Cohan
2011).
Morgan (2012) claimed that a successful brand is
innovative, focused, passionate, consistent, flexible,
competitive, leadership and distinction. He added that great
brands always focus on innovation which prevents
becoming complacent and stagnant. They never break off
pushing. For instance, Samsung, Apple, Coca-Cola,
McDonald etc got high success in the market. However,
they do not stop innovation; they continue to focus on
improvement and innovation. Truly remarkable brands
always keep them most focused and know what they do and
they focus on doing it well. Successful brands have passion
which keeps them pushing and moving forward; they not
only love what they do they also love what they are doing.
The remarkable brand is consistent; customer can rely and
trust on them. If a brand is not consistent, it means the
company is opening a door for the customers to move
somewhere else (Delong et al., 2004). Great successful
brands are always willing to adopt and change; which have
strong competitive spirit that is applied to motivate them. It
is assumed that competition is great for customers and good
for a business because it makes the companies step up their
game and enhance their quality of service/product (Gelder,
2005).
As claimed by Hsieh et al. (2004), “a successful brand
image enables customers to identify the needs that the brand
satisfies and to differentiate the brand from its competitors
and consequently increases the likelihood that customers
will purchase the brand” (P. 252). A business organisation
of its services or products which continuously holds a
favourable image by the customers, would absolutely obtain
a competitive position in the marketplace, increase market
share, gain competitive advantages, as well as enhance
organisational performance. Moreover, many empirical
studies have asserted that favourable image (i.e. store/retail,
brand) will lead to customer loyalty (Kandampully and
Suhartano, 2000; Koo, 2003), purchase behaviour (Hsieh et
R. Neupane. (2015) Int. J. Soc. Sci. Manage. Vol-2, issue-1: 9-26
Full text of this paper can be downloaded online at www.ijssm.org/ & http://nepjol.info/index.php/IJSSM/issue/archive
al., 2004), brand equity (Faircloth et al., 2001), and brand
performance (Roth, 1995).
Brand Equity
Brand equity refers to a set of assets and liabilities
associated with brand, together with its name, symbol that
can perform beneficial or detrimental effects on the values
obtained from products or services offered by a company
(Yasin et al., 2007). Similarly according to Keller (2003),
brand equity refers the unique consequences of marketing
enforced by particular brand. Referring to the positive
influence of brand equity, it occurs when customers are
willing to spend more for the equivalent quality due to the
attractiveness of the symbol connected to the service or
products (Bello and Holbrook, 1995). Nevertheless, brand
equity might be destroyed because of improper
management. For example, poor customer service or
product quality could inversely affect the image of the brand
which leads decrease in volume of sales.
One of the typical instances about brand as a type of equity
is the obligation of laws to preserve intellectual property. In
many countries, the values of brand have been recognised
to both the producers and consumers with their well-
established legal system. Many countries have set up legal
system to protect, copyright, designs and trademarks in
order to tackle with piracy. According to Murphy (1998),
brand is also a tradable product having computable financial
worth. We can see the name of favourable brands in the list
of stock market which can be sold or bought. Some
reputable brands such as Tesco, Sainsbury, Vodafone,
Marks and Spencer, Lloyds Group etc. are listed in the index
of FTSE 100 (London Stoke Exchange, 2014). The
volatility of stoke market may affect the purchasing moods
of customers but not accounted for the decline or growth of
retail sales. These instances emphasise the values of brand
equity for organisation and the customers both. For the
organisation, brand equity might be a source to generate
revenue through cash flow. For example, the merger of
Reebok and Adidas in 2005 has helped to compete with
Nike in the US sports market, increased their revenue and
assisted to attract more customers to reverse to the large
company with higher aptitudes (Kiley, 2005). For customer
perspectives, brand equity might offer important
information regarding the brand which increases their
confidences while making purchasing decision. If a
customer has good perceptions about a brand then he/she
will certainly repurchase the product from that brand. In
addition brand equity may also helps to gain higher margins
through charging premium prices and decreased
dependence upon promotional activities (Aaker and Biel,
2013). If the customers have positive image then they no
longer focus on short-term promotional offers but the image
of a brand as a whole. The concept of brand equity can be
further divided into four sub areas: brand awareness, brand
loyalty, brand associations and perceived quality.
Brand Awareness: One of the main determinants of brand
equity is brand awareness. It indicates to the capability of
potential customers to recognise and recall the brand,
connecting the brand with its equivalent product class. It is
essential for the customers that they should be aware about
brand value of a product so that which could become their
buying choice. It is therefore the products need to enter the
awareness set before it appears as the set of consideration
(Blackwell et al., 2001) and enhance awareness of brand is
favourable to higher probability of entering the
consideration set (Nedungadi, 1990). So, a brand with high
awareness could have higher probability to be purchased
(Yasin et al., 2007).
There are many elements such as geographical location and
political influences can alter the level of brand awareness.
A research by Delong et al. (2004) claimed that owing to
geographical differences, the consumers from China cannot
distinguish European brand from US apparel brand.
Moreover, because of their political separations, brands
from Hong Kong and Taiwan are confused sometime.
Celebrity endorsement and advertisement could be some
functional tools for increasing brand awareness. According
to Tsai et al. (2007), attitude of advertisement is attributable
to the influence on attitudes of brand which affects intention
of consumers to purchase.
Brand Loyalty: Brand loyalty is also one of the key factors
of brand equity that directly and positively influences brand
equity (Atilgan et al., 2005). It refers that an individual
purchases products or services from the same brand
frequently rather than from other brands. Customers
continue to purchase the brand under the influence of brand
loyalty, regardless of the superior features, convenience
owned by competitors and prices. The repurchase intention
is one of the significant indicators of brand loyalty.
However, such measures may not be always accurate
because some customers make habitual purchase towards a
specific brand just as consequences of its effective
promotions and prominence in stock.
Brand loyalty includes customers’ commitment to
repurchase the product or continue to use the same brand
and can be confirmed by frequent purchase of services or
products as well as other positive attitudes like positive
words of mouth to others (Dick and Basu, 1994). The
customers may also repurchase a brand because of lack of
viable alternatives, situational constraints, or out of
conveniences (Jones et al., 2002). A real brand loyalty could
exist when consumers have high relative behaviours
towards the brand which can be seen through their
repurchase intention.
Brand Associations: Brand association is defined as the
particular connection between the brand and the memory
(Aakar, 1991). In addition, Yasin et al. (2007) added that
brand equity is highly supported by associations of
customers towards the brand that influence the particular
brand image. According to Yoo et al. (2000), brand

R. Neupane. (2015) Int. J. Soc. Sci. Manage. Vol-2, issue-1: 9-26
Full text of this paper can be downloaded online at www.ijssm.org/ & http://nepjol.info/index.php/IJSSM/issue/archive
association is a complex thought which associates one
another, including multiple episodes, ideas, facts and
examples which generate knowledge of brand network. The
intangible qualities such as distinctiveness and
innovativeness are also considered as brand associations.
According to Keller (2003), brand association can be
divided into three sub-divisions, namely benefits, attributes
and attitudes. The benefits may be functional, symbolic and
experimental. Functional benefits related to basic or
physical benefits; symbolic benefits related to signal effects
that a brand may execute on the consumers; and
experimental benefits associated to emotional feelings of
customers.
Various brands have various brand associations to their
probable consumers which can provide supports for them to
make a decision of repurchase. The brand association can
generate value for the company and also to its customers in
many ways like they help consumers for purchase decisions.
Brand association may also trigger the consumers to review
their previous experience and making them remember the
brand by heart (Kumar, 2009). It can also help to
differentiate one brand from other and also generate
positive feelings.
Perceived Quality: Perceived quality refers to the
perceptions of customers of the superiority or overall
quality of the service or product (Yasin, et al., 2007). It is a
type of intangible overall felling of the customers towards
the brand. It has a subjective nature and therefore the
understanding of actual specifications of the product could
have less association with perceived quality. A brand’s
perceived quality can generate values through offering
essential reason to purchase, charging premium price,
differentiating the brand position, and motivating members
of the channels to do well. In addition, it helps to create
extensions into categories of new brands. According to
Delong et al. (2004), perceived quality has the highest
importance in determining repurchase intention and brand
loyalty. However, it is extremely complex to get
satisfactory level of perceived quality because of the reality
that continuous and fast product innovation has already
enhanced expectations of customer regarding the product
quality.
Customer Satisfaction
According to Oliver (1997), “satisfaction is the consumers’
fulfilment response. It is a judgement that a product or
service features, or the product or service itself, provided
(or is providing) a pleasurable level of consumption-related
satisfaction including levels of under-or over-fulfilment” (P.
13). Similarly, Szymanski and Henard (2001) stated that
earlier studies on customer satisfaction emphasised
basically on the effects of expectations, performances,
disconfirmation of expectations, affects as well as equity on
satisfaction. As mentioned by Dietz et al. (2004),
expectations of customers are pre-trial beliefs regarding the
product which works as reference point or comparison
standard against which product presentation is judged. The
paradigm of expectancy disconfirmation recommends that
customers are satisfied if the products or services perform
better than their expectation (i.e., positive disconfirmation),
dissatisfied if expectations of customers exceeded real
performance from the products or services (i.e., negative
disconfirmation), and neutral satisfaction if the performance
of the products or services exactly matched their
expectations (i.e. zero confirmation/disconfirmation)
(Oliver, 1997). Some other researchers have identified some
potential predictors of satisfaction like service/products
quality (Sivas and Baker-Prewitt, 2000), service hospitality
experiences design (Pullman and gross, 2004), perceived
value (Yang and Peterson, 2004), retail store image (Koo,
2003) and customer relationship benefits (Reynold and
Beautty, 1999).
As mentioned by Hill et al. (2007), “Customer satisfaction
is a measure of how your organisation’s total product
performs in relation to a set of customer requirements”.
Similarly, Griffiths (2006) has defined customer
satisfaction by separating it from customer loyalty as
“Satisfaction is defined by what people say; loyalty is
defined by what they do” (Cited in Sunder, 2011).
Nevertheless, satisfaction is an extent of achievement of
some expectations, desire, goals, needs or any other
satisfying situation of transaction between customers and
the company.
According to Vavra (2002), customers can obtain
satisfaction from overall service or product; particular
performance of the product; representatives of the company
or department; various transactions like presentation of
sales, delivery of products, repair service, after sale service,
complaints handling; and post-purchase and pre-purchase
relationships generated by a company with their customers.
According to Cochran (2003), customer satisfaction is the
fundamental goal for organisations. There are no any other
higher accomplishments other than pleasing customers.
However, it does not mean that the company should abort
its competitive sense of business and become a non-profit
company. Moreover, customer satisfaction is an investment
which is essential due to the fact that the process of
customer satisfaction often don’t generate outcomes in very
short-term. Remunerations more often are recognised in the
medium or long-run. Various resources should be used in
order to understand the requirements of customers, data
collection regarding customers’ perceptions, and examining
such data. The resources requires for these functions is the
essential investment for customer satisfaction.
A research by B2B International (2014) asserted that many
companies lose 45% - 50% consumers in each period of five
years; gaining new consumers might be 20 times more
expensive than current customer retention. The confidence
and trust will increase when the customers get higher level
of satisfaction. If there is enhanced trust and confidence
R. Neupane. (2015) Int. J. Soc. Sci. Manage. Vol-2, issue-1: 9-26
Full text of this paper can be downloaded online at www.ijssm.org/ & http://nepjol.info/index.php/IJSSM/issue/archive
then there will be a very few customers likely switch to the
other companies (Hill et al., 2007).
Different literatures regarding customer satisfaction
primarily focused on expectations and needs of customers
towards the services or products offered by a company.
Some researchers have also emphasised on capabilities of
innovation and advanced technologies that significantly
enhance customer services. Some others indicated on the
importance for companies to focus on level of customer
service (Saxby, 2006).
Measurement of Customer Satisfaction
Different companies adopt different mechanism to measure
customer satisfaction. According to Cacioppo (2000),
assessment of customer satisfaction is one of the key
mechanisms for successful organisations in the current
economy in the world. Measurement of customer
satisfaction can help to hold existing customer and may
provide directions about how to attract new customers from
the competitive business environment. As mentioned by
Chen (2004), measurement of customer satisfaction and
understanding the extent may help organisations to improve
their customer services. It is argued that a satisfied customer
certainly recommend the product or service to their relatives
and friends. It is therefore, the marketing strategies should
be focused on increasing customer satisfaction level.
According to Oliver (1997), satisfaction of customer is their
evaluation after purchasing the products or services as it
meets or exceeds their expectations. Nevertheless, customer
satisfaction cannot be bounded into after purchase
evaluation but it could be their overall experiences of
purchasing and consuming experiences.
Because of high competitions and other environmental
issues, customer satisfaction and quality of service become
a fundamental marketing strategy for the business
companies. Enhancing service quality is essential for long
term sustainability and growth due to the fact that it could
help to deal with threats and challenges in the competitive
environment. The service quality is the extent to which the
services offered by an organisation meet or exceed
customer expectations (Eshghi et al., 2008). However, the
service quality is complicated to measure because
customers and service providers are from different
backgrounds and sometime same customer may act in
different manner with equivalent services or products (Kang
and James, 2004).
The first model to examine service quality is proposed by
Gronroos 1982 which focused on three factors: technical
quality, functional quality and image quality (Cited in
Neupane, 2012). In this model, the technical quality referred
what is delivered, functional quality indicated process of
service delivery, and the image quality indicated achieved
image by functional and technical quality. One of the
famous models for customer satisfaction measurement is
SERVQUAL proposed by Parasuraman et al. (1985) which
focuses on service quality as difference between the
expectations of customers on offered service or product and
their perceptions about purchased services or products. The
service quality evaluation is based on the evaluation of
service delivery and service outcomes. If the service or
product quality exceeds customer expectations then it is
believed as a good service quality. Parasuraman et al.
(1991) reduced their previous ten dimension of service
quality in to five dimensions which are given below.
Tangibles: It is related to various physical equipments such
as counters, shelves, lights, computers, and physical
environments of the service providing company and the
neatness of the employees. .
Reliability: It concerns with capability to perform the
promised service accurately and dependably. In addition, it
also relates to capability of problem solving, time limits,
and service rights of the customers.
Responsiveness: It is related to willingness to help
customer, prompt services, easily achievable information
and responding the request of the customers.
Assurance: It regards to courtesy, knowledge and
understandings of employees and their capability to
stimulate confidence and trust to the customers.
Empathy: It is connected with caring personal attention,
operating hours, personal service and understanding the
specific needs of the customers.
Different scholars have different argument regarding the
importance and significance of SERVQUAL model.
According to Cronin and Taylor (1992), the assessment of
quality of service on the basis of SERVQUAL model is not
sufficient which has more explanatory power then the
evaluation of gap between performance and expectations.
Similarly, Kang and James (2004) argued that this model
has focused more on delivery of service than other expects
like technical dimension. A similar argument was proposed
by Chang et al. (2003), he claimed that it is popular tool for
the measurement of service quality but the psychometric
properties are not yet created.
On the other hand, Buttle (1996) asserted that the
SERVQUAL dimension is applied by a lot of scholars to
assess customer satisfaction in different institutions such as
banking, retailing, restaurants, hospitals,
telecommunications, educations and hotels. A similar view
was proposed by Ladhari (2009), he asserted that it is a good
scale to use and assess the quality of service in particular
company however, it is important to select the most
meaningful tool that associates the assessment of specific
service to confirm valid and reliable outcomes. In this
context, this researcher adopts this model to evaluate
customer satisfaction level at the retailers in the UK.
Loyalty Intention
Different scholars have defined brand loyalty in many ways.
In this regard, Jacoby and Chestnut (1978) have asserted
over fifty operational definitions of brand loyalty, which
can be divided as attitudinal, behavioural and the composite
approach. In their work, they found more than 60% loyalty
R. Neupane. (2015) Int. J. Soc. Sci. Manage. Vol-2, issue-1: 9-26
Full text of this paper can be downloaded online at www.ijssm.org/ & http://nepjol.info/index.php/IJSSM/issue/archive
measure are behavioural terms. The repeat purchase
frequency or proportion of purchase is considered as
behavioural loyalty, whereas attitudinal brand loyalty
comprised “stated preferences, commitment or purchase
intentions of the customers” (Mellens et al., 1996).
However, all of those above behavioural definitions are
criticised by Oliver (1999) and Jacoby and Chestnut (1978)
as problematical. For instance, Oliver (1999) argued that
“all of these definitions suffer from the problem that they
recorded what customer did, and none tapped into the
psychological meaning of loyalty” (P. 34). The composite
meaning of loyalty focused on two dissimilar loyalty
approaches: attitudinal and behavioural concepts, which
was at first recommended by Jacoby and Chestnut (1978)
and afterwards by Oliver (1997).
According to Oliver (1997), customer's loyalty is defined as
"a deep held commitment to repurchase or re-patronise a
preferred product/service consistently in the future, thereby
causing repetitive same-brand or same brand-set
purchasing, despite situational influences and making
efforts that have the potential to cause switching
behaviours” (P.34).
A few scholars suggested that adopting a behavioural and
attitudinal approach can provide a more influential meaning
of brand loyalty (Jacoby and Chestnut, 1978; Dick and
Basu, 1994). All the above approaches are criticised by
many researchers and they may have many limitations.
According to Jacoby and Chestnut (1978), the behavioural
assessment simply corresponds to the static result of a
dynamic decision procedure. It is therefore; this approach
makes no attempt recognise the elements essential brand
loyalty buying and not sufficient to make clear the causal
factors which ascertain why and how brand loyalty
modified or developed. The attitudinal assessment are
related with feelings of customers towards a brand and
definite intentions like willingness to recommend and
repurchase the service or product from that brand
(Schiffman and Kanuk, 2004). The repurchased intention
can be examined through asking the customers regarding
their intentions to repurchase a given service or products in
the future (Jones and Sasser, 1995). In addition, they added
that organisations can obtain this information of repurchase
intention while measuring customer satisfaction, intent to
repurchase can also be examined at any time in the process
of customer relationship makes it valuable for companies
with a long cycle of repurchase, and repurchase intention is
a strong indicator of their future intention.
According to East et al. (2005), in relation to loyalty, the
association between behaviour and attitude approach was
found to be weak. For example, Hennig-Thurau and Khee
(1997) asserted that these researches who used actual
behavioural outcomes indicated a weak relationships and a
negative relationship with satisfaction. Conversely,
Rundle-Thiele and Bennett (2001) claimed that the measure
of attitudinal loyalty is appropriate to predict upcoming
brand loyalty under the situations of: where there is a
propensity towards sole brands; where the market is not
stable; and where there is a high participation and high
perceived risks.
Links between Brand Image and Customer Loyalty
It is accepted that positive brand image contributes to
enhance customer loyalty and also, customer loyalty has
great roles in building strong brand image of a company. It
is therefore, brand image is essential for companies to gain
lifetime customer loyalty which leads to gear up
organisational efficiency (Hess and Story, 2005).
According to Bloemer and Ruyter (1997), the effects of
store image associates to store satisfactions. Other factors
like social motives, relationships with customers have
inverse effects on customer loyalty (Bloemer et al., 1998).
If we consider the committed relationships between
organisation and customers, there is a strong link between
brand image and customer loyalty. The influences from
corporate image are much superior to those from overall
satisfaction. A research by Zins (2001) found that there is
no significant link between satisfaction and loyalty. But
according to Kandampully, and Suhartanto (2000),
corporate image is positively associated to customer
loyalty. In addition, they added that customer satisfaction
and corporate image with the organisational performance
significantly illustrate the variance of customer loyalty.
However, Andreassen and Lindestad (1998) found that
corporate image associated with other elements like
satisfaction has no significant effects on loyalty. According
to Cretu and Brodie (2007), brand image has specific effects
on customer loyalty and perceptions of customer value. In
this regard, Blamer (2001) considers that the reputation of a
company is associated with organisational values, purpose
and visions which can be expected as wider influences. The
reputations connected with the name of company may act
as the umbrella brand for the range of services or products
categories, whereas the brand image is specific to the certain
category of products. Therefore, the reputation could lead
customer loyalty because of trust that a customer can get
through public relation (Cretu and Brodie, 2007).
According to Ballester and Aleman (2001), the higher level
of brand trust leads to more commitments from the
customers and similarly, the higher level of customer
commitments leads to higher price tolerance that can create
higher brand loyalty. If there is a favourable brand image
then proactive public relation obtained by customers is
more congruent to organisational reputations and customers
are well capable to maintain positive attitudes, beliefs and
behaviours. Consequently, the favourable brand image can
increase public relation effects and enhance customer
loyalty. Conversely, unfavourable brand image leads to
inverse influence on other brand associations which might
be because of lack of customers’ trust in the company. A
negative behaviour may also come from scepticism over a

R. Neupane. (2015) Int. J. Soc. Sci. Manage. Vol-2, issue-1: 9-26
Full text of this paper can be downloaded online at www.ijssm.org/ & http://nepjol.info/index.php/IJSSM/issue/archive
company’s fairness and honesty while performing public
relations activities (Hsieh and Kai, 2008).
Links between Customer Satisfaction and Loyalty
A lot of researches have confirmed that customer
satisfaction has positive influence on customer loyalty
(Ismail et al., 2006; Da Silva and Alwi, 2006; Chiou et al.,
2002; Yang and Peterson, 2004). If the customers are
satisfied with the services or products offered by a brand
then they have more willingness to recommend the services
or products to others; have less probability to switch other
brands, and more likely to repurchase from the same brand
(Bennett and Rundle-Thiele, 2004). Various empirical
researches in retail/store image have verified that customer
satisfaction has strongly affected loyalty intention such as
intention to repurchase (Kandampully and Suhartano, 2000)
intention to recommend (Nguyen and Leblanc, 1998); and
intention to revisit the store (Bloemer and DeRuyter, 1998).
Various literatures on customer satisfaction and loyalty
suggests that customer satisfaction if the key determinant of
customer loyalty (Yang and Peterson, 2004). Both the
concepts have often appeared to be confused by academic
as well as professionals (Szwarc, 2005). A study by Richard
and Detrick (2003) demonstrated that customers claiming to
be highly satisfied may still stop to become loyal for the
company. And on the contrary, the loyal customers are not
necessarily to be satisfied even though the customers who
are satisfied tend to be more loyal to the company
(Gommans et al., 2001).
Theoretical Framework and Hypotheses Development
Based on the above reviewed literatures on brand image,
customer satisfaction, customer loyalty, and their
relationships, the following conceptual framework is
developed which demonstrates the relationships between
brand image benefits, customer satisfaction and loyalty
intention. The considered factors of brand image are
functional, symbolic, social, experiential, and appearance
enhances (Fig 1).
Fig. 1: Conceptual Framework
The following hypotheses are generated from the above
literatures.
H1: There is a positive relationship between brand image
benefits and customer satisfaction.
H2: There is positive relationship between brand image and
customer loyalty intention.
H3: There is a positive relationship between customer
satisfaction and loyalty intention.
Research Methodology
This study is based on positivism philosophy which states
that “Social world exists externally, and its properties
should be measured through objective methods, rather than
being inferred subjectively through sensation, reflection or
intuition” (Easterby-Smith et al., 2012). In this research, the
observer is independent, explanations show casualty,
human interest are irreverent, the progress of research goes
through hypotheses and deductive approach and the results
are generalised through statistical tools.
This study follows deductive approach which involves
testing the existing theory and in natural science, it is a
dominant research approach, in which laws offer the
foundation of explanation, predict their occurrence, allow
the expectation of phenomenon and so allow them to be
controlled (Collis and Hussey, 2003). The necessary data
was collected in order to test the hypotheses, and
conclusions are derived on the basis of analysing data and
hypotheses testing. This study begins with existing theories
and literatures then moves towards development of
hypotheses, observation and confirmation of the theories.
A strategy of survey is adopted in the current study because
of the fact that it is widely used in social sciences and
business research by many researchers and is one of the
most common quantitative strategies. The strategy of
survey allows us to gather quantitative data which can be
analysed using inferential and descriptive statistic through
quantitative techniques. The survey strategy provides more
control over the process of research, if the sampling
technique is applied; it is possible to develop results which
represent the entire population at the lower cost that
gathering data from the entire population to be studied
(Saunders et al., 2009). Readily available analysis software
such as Statistical Package for Social Sciences (SPSS) can
be used to analyse and interpret the data. The structured
closed-ended questionnaires are used to collect data from
the respondents from different retailers in the UK. The
survey was conducted by using a series of questionnaires to
collect necessary data from the participants.
Data Collection
All the necessary data are collected through primary and
secondary sources. The primary data are collected through
structured questionnaires survey from the customers
different retail companies based on London. The main
retailers such as Tesco, ASDA, Sainsbury, Morrison, The
Co-Operative Group and Iceland are included in this survey.
R. Neupane. (2015) Int. J. Soc. Sci. Manage. Vol-2, issue-1: 9-26
Full text of this paper can be downloaded online at www.ijssm.org/ & http://nepjol.info/index.php/IJSSM/issue/archive
This tool is used because it is a strong method to gather the
attitudes and opinions of the respondents in an economic
way. The necessary secondary data are obtained from
different secondary sources such as journals, research
papers, newspaper articles, books, company reports in this
research.
This study followed convenience sampling technique which
is a non-probability sampling method because of nature of
current study and other constraints of the researcher such as
limited time frame and limited resources. The participants
are selected on the basis of their availability and their
interest. The data are collected from the six retail stores
which all are based on London. In every store, the
respondents are picked from the exit corner of the store
according to their availability and interest. At first, the
researcher has obtained consent from the each store
manager to collect data from their customers; introduced
himself with every customer who came out from the store
after shopping from the respective store, and provided a pen
and a set of questionnaires to answer the questions. The
researcher himself helped answering questions for some
participants as their interest and accessibility. A sample of
120 customers is chosen from the different six retail stores
based on London. This small sample is considered due to
the time constraints and limited resources of the researcher.
The different retailing brands are considered in the survey
in order to obtain the participants from different
backgrounds in which some participants may also be
commuters, visitors, job holders and so on.
A set of closed-ended questionnaires is used in this survey
which includes the questions related to brand image,
customer satisfaction and customer loyalty intention. Brand
image consists of five variables with 15 questions; customer
satisfaction also consists of five variables with 22 questions
and loyalty intention consist 6 questions. All the questions
regarding brand image, customer satisfaction and loyalty
intention followed five-point likert scale in which 1-
strongly disagree, 2-disagree, 3- neutral, 4-agree and 5-
strongly agree.
A pilot study was conducted to test the relevance, clarity,
validity of questionnaires, test the adverse factors and
finalise the appropriate sample size before conducting entire
research. That feasibility study consists of 12 participants
from a Tesco store situated in Woolwich, London. This
study recommended that the questionnaires are
understandable, acceptable, have an appropriate clarity and
could be answered by the respondents in about 7 minutes.
The reliability of the current research instrument is
examined through Cronbach’s alpha (α) from the outcomes
of feasibility test. The results of the pilot test are
demonstrated in the following Table 1.
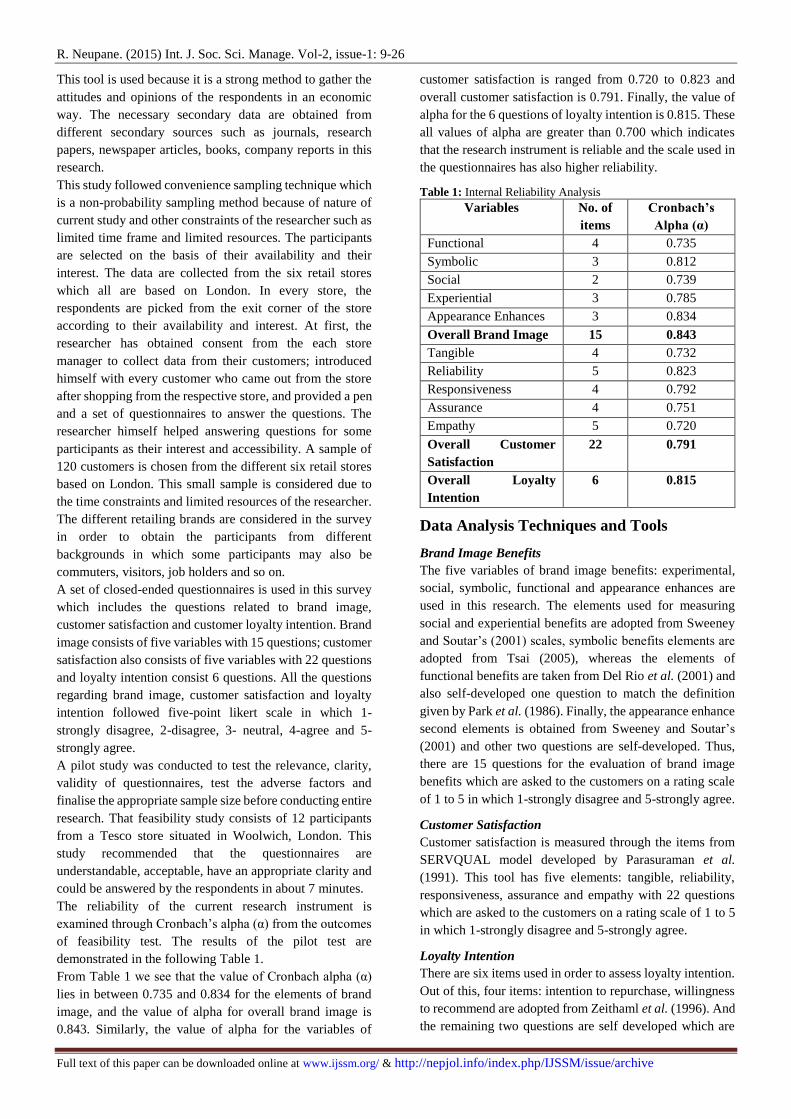
From Table 1 we see that the value of Cronbach alpha (α)
lies in between 0.735 and 0.834 for the elements of brand
image, and the value of alpha for overall brand image is
0.843. Similarly, the value of alpha for the variables of
customer satisfaction is ranged from 0.720 to 0.823 and
overall customer satisfaction is 0.791. Finally, the value of
alpha for the 6 questions of loyalty intention is 0.815. These
all values of alpha are greater than 0.700 which indicates
that the research instrument is reliable and the scale used in
the questionnaires has also higher reliability.
Table 1: Internal Reliability Analysis
Variables No. of
items
Cronbach’s
Alpha (α)
Functional 4 0.735
Symbolic 3 0.812
Social 2 0.739
Experiential 3 0.785
Appearance Enhances 3 0.834
Overall Brand Image 15 0.843
Tangible 4 0.732
Reliability 5 0.823
Responsiveness 4 0.792
Assurance 4 0.751
Empathy 5 0.720
Overall Customer
Satisfaction
22 0.791
Overall Loyalty
Intention
6 0.815
Data Analysis Techniques and Tools
Brand Image Benefits
The five variables of brand image benefits: experimental,
social, symbolic, functional and appearance enhances are
used in this research. The elements used for measuring
social and experiential benefits are adopted from Sweeney
and Soutar’s (2001) scales, symbolic benefits elements are
adopted from Tsai (2005), whereas the elements of
functional benefits are taken from Del Rio et al. (2001) and
also self-developed one question to match the definition
given by Park et al. (1986). Finally, the appearance enhance
second elements is obtained from Sweeney and Soutar’s
(2001) and other two questions are self-developed. Thus,
there are 15 questions for the evaluation of brand image
benefits which are asked to the customers on a rating scale
of 1 to 5 in which 1-strongly disagree and 5-strongly agree.
Customer Satisfaction
Customer satisfaction is measured through the items from
SERVQUAL model developed by Parasuraman et al.
(1991). This tool has five elements: tangible, reliability,
responsiveness, assurance and empathy with 22 questions
which are asked to the customers on a rating scale of 1 to 5
in which 1-strongly disagree and 5-strongly agree.
Loyalty Intention
There are six items used in order to assess loyalty intention.
Out of this, four items: intention to repurchase, willingness
to recommend are adopted from Zeithaml et al. (1996). And
the remaining two questions are self developed which are
R. Neupane. (2015) Int. J. Soc. Sci. Manage. Vol-2, issue-1: 9-26
Full text of this paper can be downloaded online at www.ijssm.org/ & http://nepjol.info/index.php/IJSSM/issue/archive
also asked to the customers on a rating scale of 1 to 5 in
which 1-strongly disagree and 5-strongly agree.
Process of Data Analysis
The collected secondary data will be based on the
judgement analysis on the basis of preliminary literatures.
But the collected primary data from the current survey is
analysed through mathematical and statistical tools. The
primary data collected from the participants is first entered
into Statistical Package for Social Science (SPSS 20), then
analysed through correlation, regression, bar diagram
percentage analysis and pie chart. The Pearson’s coefficient
of correlation is used to examine the relationship between
brand image benefits and customer satisfaction;
relationships between brand image and loyalty intention;
and customer satisfaction and loyalty intention. The
regression analysis is used to assess the effects of brand
image and customer satisfaction as well as effects of brand
image on customer loyalty. The related hypotheses were
tested through correlation and regression analysis.
Data Analysis, Findings and Discussion
Relationships between Brand Image and Customer
Satisfaction
Correlation:
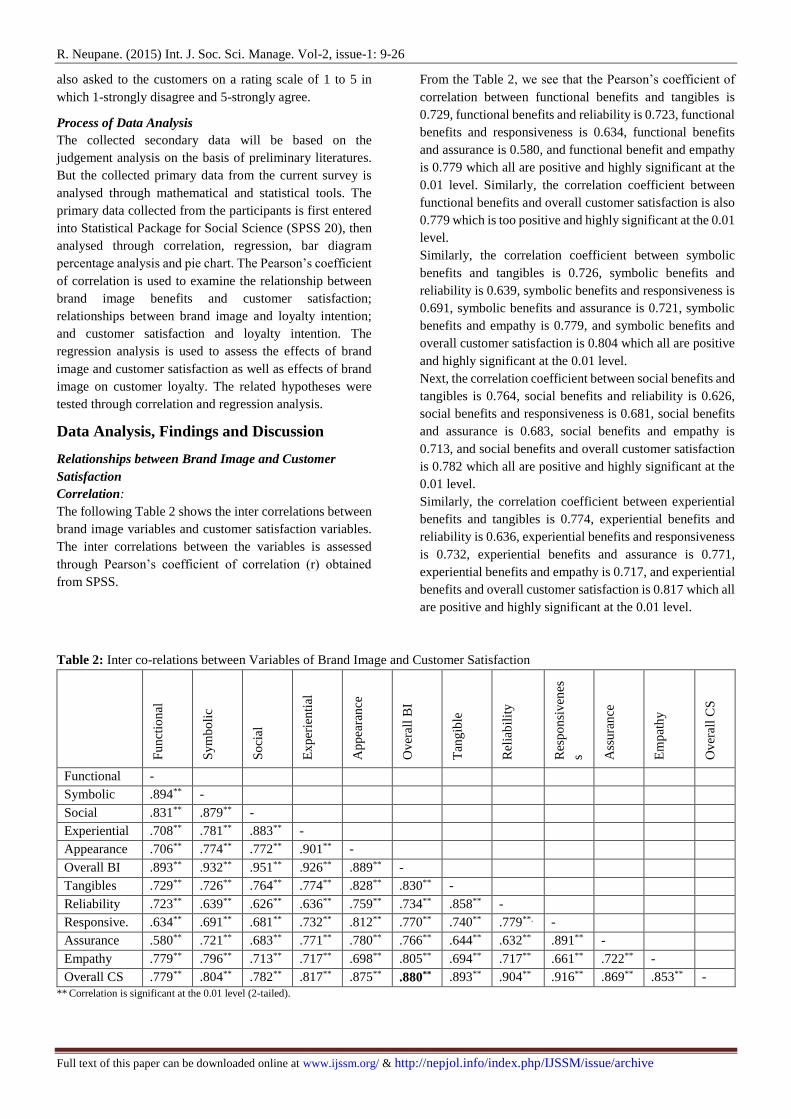
The following Table 2 shows the inter correlations between
brand image variables and customer satisfaction variables.
The inter correlations between the variables is assessed
through Pearson’s coefficient of correlation (r) obtained
from SPSS.
From the Table 2, we see that the Pearson’s coefficient of
correlation between functional benefits and tangibles is
0.729, functional benefits and reliability is 0.723, functional
benefits and responsiveness is 0.634, functional benefits
and assurance is 0.580, and functional benefit and empathy
is 0.779 which all are positive and highly significant at the
0.01 level. Similarly, the correlation coefficient between
functional benefits and overall customer satisfaction is also
0.779 which is too positive and highly significant at the 0.01
level.
Similarly, the correlation coefficient between symbolic
benefits and tangibles is 0.726, symbolic benefits and
reliability is 0.639, symbolic benefits and responsiveness is
0.691, symbolic benefits and assurance is 0.721, symbolic
benefits and empathy is 0.779, and symbolic benefits and
overall customer satisfaction is 0.804 which all are positive
and highly significant at the 0.01 level.
Next, the correlation coefficient between social benefits and
tangibles is 0.764, social benefits and reliability is 0.626,
social benefits and responsiveness is 0.681, social benefits
and assurance is 0.683, social benefits and empathy is
0.713, and social benefits and overall customer satisfaction
is 0.782 which all are positive and highly significant at the
0.01 level.
Similarly, the correlation coefficient between experiential
benefits and tangibles is 0.774, experiential benefits and
reliability is 0.636, experiential benefits and responsiveness
is 0.732, experiential benefits and assurance is 0.771,
experiential benefits and empathy is 0.717, and experiential
benefits and overall customer satisfaction is 0.817 which all
are positive and highly significant at the 0.01 level.
Table 2: Inter co-relations between Variables of Brand Image and Customer Satisfaction
Fu
nct
ion
al
Sy
mb
oli
c
So
cial
Ex
per
ien
tial
Ap
pea
ran
ce
Ov
eral
l B
I
Tan
gib
le
Rel
iab
ilit
y
Res
po
nsi
ven
es
s Ass
ura
nce
Em
pat
hy
Ov
eral
l C
S
Functional -
Symbolic .894** -
Social .831** .879** -
Experiential .708** .781** .883** -
Appearance .706** .774** .772** .901** -
Overall BI .893** .932** .951** .926** .889** -
Tangibles .729** .726** .764** .774** .828** .830** -
Reliability .723** .639** .626** .636** .759** .734** .858** -
Responsive. .634** .691** .681** .732** .812** .770** .740** .779**. -
Assurance .580** .721** .683** .771** .780** .766** .644** .632** .891** -
Empathy .779** .796** .713** .717** .698** .805** .694** .717** .661** .722** -
Overall CS .779** .804** .782** .817** .875** .880** .893** .904** .916** .869** .853** -
** Correlation is significant at the 0.01 level (2-tailed).

R. Neupane. (2015) Int. J. Soc. Sci. Manage. Vol-2, issue-1: 9-26
Full text of this paper can be downloaded online at www.ijssm.org/ & http://nepjol.info/index.php/IJSSM/issue/archive
Next, the correlation coefficient between appearance
enhances and tangibles is 0.828, appearance enhances and
reliability is 0.759, appearance enhances and
responsiveness is 0.812, appearance enhances and
assurance is 0.780, appearance enhances and empathy is
0.698, and appearance enhances and overall customer
satisfaction is 0.875 which all are also positive and highly
significant at the 0.01 level.
Finally, the correlation coefficient between overall brand
image and overall customer satisfaction is 0.880, which is
also highly positive and significant at the 0.01 level. This
indicates that brand image and customer satisfaction has
significant positive relationships. This means that the
enhancement of one variable has direct influence for the
enhancement of other variable.
Regression Analysis: The effect of brand image benefits on
customer satisfaction is assessed through regression
analysis in which the overall brand image benefit is
predictor variable and overall customer satisfaction is
dependent variable. The following Table 3, Table 4 and
Table 5 respectively show the model summary, ANOVA
and coefficients of regression."
Table 3: Model Summary
Model Summary
Model R R
Square
Adjusted R
Square
Std. Error of
the Estimate
1 .880a .775 .773 .25175
a. Predictors: (Constant), Overall Brand Image
The above model summary shows that coefficient of
determination ‘R Square’ indicates 77.3% of validity in
customer satisfaction due to brand image benefits in
MandS.
The Table 5 shows the coefficients of regression.
Unstandardised coefficient B tells the intercept and
coefficient for every predictor variable. The sig. (P-value)
indicates the measure of likelihood that the different in
outcome occurred by chance’
Table 4: ANOVA
ANOVAa
Model Sum of
Squares Df
Mean
Square F Sig.
1
Regression 25.740 1 25.740 406.137 .000b
Residual 7.479 118 .063
Total 33.219 119
a. Dependent Variable: Overall Customer Satisfaction
b. Predictors: (Constant), Overall Brand Image.
.
Table 5: Coefficients of Regression
Coefficientsa
Mo
del
Un
stan
dar
diz
ed
Co
effi
cien
ts
Sta
nd
ardiz
ed
Co
effi
cien
ts
t-st
at
Sig
. (P
-val
ue)
B Std.
Error
Beta
(β)
(Constant) 0.958 0.159 - 6.014 .000
Overall
Brand Image 0.774 0.038 0.880 20.153 .000
a. Dependent Variable: Overall Customer Satisfaction
In the above regression model, we see that overall brand
image has significant effects on customer satisfaction where
P = 0.000 which less than 0.05. The effects of overall brand
image show 0.774 point changes in the management of
brand image for each point change in customer satisfaction.
Thus, the regression analysis indicates that overall brand
image has significant effects (P = 0.000 and β = 0.880) on
customer satisfaction.
Relationships between Brand Image and Customer
Loyalty
Correlation:
The following Table 6 shows the inter correlations between
brand image variables and customer loyalty intention. The
Pearson’s coefficient of correlation is used to assess the
relationships between the variables.
Table 6: Inter co-relations between Variables of Brand Image and Customer Loyalty
Fu
nct
ion
al
Sy
mb
oli
c
So
cial
Ex
per
ien
tial
Ap
pea
ran
ce
Ov
eral
l B
I
Ov
eral
l
Lo
yal
ty
Functional -
Symbolic .894** -
Social .831** .879** -
Experiential .708** .781** .883** -
Appearance .706** .774** .772** .901** -
Overall BI .893** .932** .951** .926** .889** -
Overall Loyalty .720** .764** .673** .767** .758** .780** - **. Correlation is significant at the 0.01 level (2-tailed).

R. Neupane. (2015) Int. J. Soc. Sci. Manage. Vol-2, issue-1: 9-26
Full text of this paper can be downloaded online at www.ijssm.org/ & http://nepjol.info/index.php/IJSSM/issue/archive
The Pearson’s coefficient of correlation between functional
benefits and overall customer loyalty is 0.720, symbolic
benefits and overall loyalty is 0.764, social benefits and
overall customer loyalty is 0.673, experiential benefits and
overall customer loyalty is 0.767, and appearance enhances
and overall customer loyalty is 0.758 which all are highly
positive and highly significant at the 0.01 level
Similarly, the correlation coefficient between overall brand
image and overall customer loyalty is 0.780 which is also
positive and highly significant at the 0.01 level.
Thus, correlation analysis indicates that overall brand image
and customer loyalty intention are positively correlated with
r = 0.780, which is significant at the 0.01 level.
Regression Analysis:
The influence of overall brand image on customer loyalty
intention in assessed through regression analysis in which
overall brand image is predictor variable and customer
loyalty intention is dependent variable. The Table 7, Table
8, and Table 9 shows model summary, ANOVA and
coefficients of regression respectively.
Table 7: Model Summary
Model Summary
Model R R
Square
Adjusted R
Square
Std. Error of
the Estimate
1 .780a .608 .605 .42709
a. Predictors: (Constant), Overall Brand Image
The model summary in the above table shows that
coefficient of determination ‘R Square’ indicates 60.5% of
validity in customer loyalty intention is due to overall brand
image of the company.
Table 8: ANOVA
ANOVAa
Model Sum of
Squares
df Mean
Square
F Sig.
1
Regression 33.415 1 33.415 183.195 .000b
Residual 21.523 118 .182
Total 54.939 119
a. Dependent Variable: Loyalty Intention
b. Predictors: (Constant), Overall Brand Image
In the Table 9, unstandardized coefficient B tells the
intercept and coefficient for each independent variable. The
sig (P – value) shows the measure of likelihood that the
different in outcomes occurred by chance.
The above regression model shows that the overall brand
image has significant effects on overall customer loyalty
intention in which p = 0.000 which is less than 0.05. The
effect of overall brand image shows 0.881 point change on
overall brand image management for each point increase in
customer loyalty intention.
Thus, the above regression model between overall brand
image and customer loyalty intention indicates that overall
brand image has significant effects (p = 0.000 and β =
0.780) on overall customer loyalty intention.
Table 9: Coefficients
Coefficientsa
Model Unstandardized
Coefficients
Standardized
Coefficients
t Sig.
B Std.
Error
Beta
1
(Constant) .526 .270 1.946 .054
Overall
Brand
Image
.881 .065 .780 13.53
5 .000
a. Dependent Variable: Loyalty Intention
Relationships between Customer Satisfaction and
Customer Loyalty
Correlation:
The correlations between customer satisfaction variables:
tangibles, reliability, responsiveness, assurance and
empathy, and overall customer loyalty intention is assessed
through Pearson’s coefficient of correlation. The Table 10
shows the inter correlation between customer satisfaction
and customer loyalty.
The correlation table 10 shows that the Pearson’s
coefficient of correlation between tangibles and overall
customer loyalty is 0.682, reliability and overall customer
loyalty is 0.765, responsiveness and overall customer
loyalty is 0.801, assurance and overall customer loyalty is
0.765, and empathy and overall customer loyalty is 0.804
which all are highly positive and highly significant at the
0.01 level.
Similarly, the correlation coefficient between overall
customer satisfaction and overall customer loyalty intention
is 0.859 which is also highly positive and highly significant
at the 0.01 level.
Thus, correlation analysis shows that overall customer
satisfaction and customer loyalty intention are positively
correlated with r = 0.859 and significant at the 0.01 level.
Regression Analysis:
The effect of customer satisfaction on overall customer
loyalty intention is assessed through regression analysis in
which overall customer satisfaction is a predictor or
independent variable and overall loyalty intention is the
dependent variable. The following table 11, table 12, and
table 13 show the model summary, ANOVA and
coefficients of regression respectively.

R. Neupane. (2015) Int. J. Soc. Sci. Manage. Vol-2, issue-1: 9-26
Full text of this paper can be downloaded online at www.ijssm.org/ & http://nepjol.info/index.php/IJSSM/issue/archive
Table 10: Inter-Correlations between Customer Satisfaction and Customer Loyalty T
ang
ible
s
Rel
iab
ilit
y
Res
po
nsi
ven
ess
Ass
ura
nce
Em
pat
hy
Ov
eral
l C
S
Ov
eral
l
Lo
yal
ty
Tangibles -
Reliability .858** -
Responsiveness .740** .779** -
Assurance .644** .632** .891** -
Empathy .694** .717** .661** .722** -
Overall Customer Satisfaction .893** .904** .916** .869** .853** -
Overall Customer Loyalty .682** .765** .801** .765** .804** .859** -
**. Correlation is significant at the 0.01 level (2-tailed).
Table 11: Model Summary
Model Summary
Model R R
Square
Adjusted R
Square
Std. Error of
the Estimate
1 .859a .738 .736 .34943
a. Predictors: (Constant), Overall Customer Satisfaction
In the above model summary, the coefficient of
determination ‘R Square’ indicates that 73.8% of validity in
customer loyalty intention due to overall customer
satisfaction within the company.
Table 12: ANOVA
ANOVAa
Model Sum of
Squares
Df Mean
Square
F Sig.
1
Regression 40.531 1 40.531 331.939 .000b
Residual 14.408 118 .122
Total 54.939 119
a. Dependent Variable: Loyalty Intention
b. Predictors: (Constant), Overall Customer Satisfaction
Table 13: Coefficients of Regression
Coefficientsa
Model Unstandardized
Coefficients
Standardized
Coefficients
t Sig.
B Std.
Error
Beta
1
(Constant) -.422 .253 -1.669 .098
Overall
Customer
Satisfaction
1.105 .061 .859 18.219 .000
a. Dependent Variable: Loyalty Intention
The above Table 13 shows the coefficient of regression in
which unstandardized coefficient B represents the
intercepts and coefficient for each independent variable and
the sig. p – value shows the measure of likelihood which the
difference in outcome occurred by chance.
The model shows that overall customer satisfaction has
significant effects on loyalty intention in which p = 0.000
which is less than 0.05.
Thus, regression analysis indicates that customer
satisfaction has significant positive effects (p = 0.000 and β
= 0.859) on customer loyalty intention in an organisation.
Discussion of the Main Findings
This study examined the effects of brand image on customer
satisfaction and customer loyalty intention on a case of
super market chain. The results shows that brand image and
customer satisfaction have strong positive correlation;
brand image and customer loyalty have also strong positive
correlation, and customer satisfaction and customer loyalty
have also strong positive correlation.
The correlation coefficient between overall brand image
and overall customer satisfaction is 0.880, which is also
highly positive and significant at the 0.01 level. This
indicates that brand image and customer satisfaction has
significant positive relationships. This means that the
enhancement of one variable has direct influence for the
enhancement of other variable. Similarly, the regression
analysis indicates that overall brand image has significant
effects (P = 0.000 and β = 0.880) on customer satisfaction.
This fact supports hypothesis 1: There is a positive
relationship between brand image benefits and customer
satisfaction. This means that H1 is accepted. This result is
consistent with the results obtained by Hess and Story
(2006), they asserted that the reputable brand image enables
the customers to distinguish their needs that the brand fulfils
and it differentiates the company from others and enhances
the customer performance over the brand. Similarly, this
outcome is also consistent with the results by Dick and Basu
(1994), they found that the success of brand could generate
customers’ awareness regarding dignity of the brand which
helps to enhance their satisfaction from the purchase of
particular brand and so optimise the profitability of the
company due to their purchase of products and services
from the company.
The correlation coefficients in between overall brand image
benefits and overall customer loyalty intention is r = 0.780,
which is highly positive and highly significant at the 0.01
level. Similarly, the regression model between overall brand
image and customer loyalty intention indicates that overall
R. Neupane. (2015) Int. J. Soc. Sci. Manage. Vol-2, issue-1: 9-26
Full text of this paper can be downloaded online at www.ijssm.org/ & http://nepjol.info/index.php/IJSSM/issue/archive
brand image has significant effects (p = 0.000 and β =
0.780) on overall customer loyalty intention. These facts
supports hypothesis 2: There is positive relationship
between brand image and customer loyalty intention. This
means that H2 is accepted. This result is consistent with
many empirical studies they have asserted that favourable
image (i.e. store/retail, brand) will lead to customer loyalty
(Kandampully and Suhartano, 2000; Koo, 2003), purchase
behaviour (Hsieh et al., 2004). In addition, Koo (2003) and
Hess (2004) added that brand image is useful to drive
loyalty, brand equity, brand performance and purchasing
habits of customers. These findings are further consistent
with the results obtained by Cretu and Brodie (2007). They
found that brand image has specific effects on customer
loyalty and perceptions of customer value. Similarly,
according to Cretu and Brodie (2007), the reputations
connected with the name of company may act as the
umbrella brand for the range of services or products
categories, whereas the brand image is specific to the certain
category of products. Therefore, the reputation could lead
customer loyalty because of trust that a customer can get
through public relation.
Finally, the correlation analysis between customer
satisfaction and loyalty intention indicates that they are
positively correlated with r = 0.859 and significant at the
0.01 level. Similarly, regression analysis indicates that
customer satisfaction has significant positive effects (p =
0.000 and β = 0.859) on customer loyalty intention in an
organisation. These facts supports hypothesis 3: There is a
positive relationship between customer satisfaction and
loyalty intention. This means H3 is also accepted. This
result is consistent with the results obtained by many
researchers they have confirmed that customer satisfaction
has positive influence on customer loyalty (Ismail et al.,
2006; Da Silva and Alwi, 2006; Chiou et al., 2002; Yang
and Peterson, 2004). Similarly, according to Bennett and
Rundle-Thiele (2004), if the customers are satisfied with the
services or products offered by a brand then they have more
willingness to recommend the services or products to
others; have less probability to switch other brands, and
more likely to repurchase from the same brand.
Conclusion
This study is guided by positivism philosophy; cross-
sectional approach so that the necessary data was collected
at a single point of time rather than frequent observation
over the same sample. The primary data was collected
through structured closed ended questionnaires by
conducting a survey. The five elements of brand image:
functional, symbolic, social, experiential and appearance
enhances with 15 questions are considered in this survey.
Similarly, five elements of customer satisfaction from
SERVQUAL dimension: tangibles, reliability,
responsiveness, assurance and empathy are considered with
22 questions; and five questions of loyalty intention are
considered in the questionnaires survey. The collected data
were analysed through statistical and mathematical tools
through SPSS 20. The correlation and regression analysis
between brand image and customer satisfaction; brand
image and customer loyalty intention; and customer
satisfaction and loyalty intention were used to assess the
relationships between the variables.
Main Findings
The correlation coefficient between overall brand image
and overall customer satisfaction is 0.880, which is also
highly positive and significant at the 0.01 level. This
indicates that brand image and customer satisfaction has
significant positive relationships. This means that the
enhancement of one variable has direct influence for the
enhancement of other variable. Similarly, the regression
analysis indicates that overall brand image has significant
effects (P = 0.000 and β = 0.880) on customer satisfaction.
It is therefore, overall brand image has significant positive
effects on customer satisfaction.
The correlation coefficients in between overall brand image
benefits and overall customer loyalty intention is r = 0.780,
which is highly positive and highly significant at the 0.01
level. Similarly, the regression model between overall brand
image and customer loyalty intention indicates that overall
brand image has significant effects (p = 0.000 and β =
0.780) on overall customer loyalty intention. Therefore,
overall brand image has significant positive effects on
customer loyalty intention.
The correlation analysis between customer satisfaction and
loyalty intention indicates that they are positively correlated
with r = 0.859 and significant at the 0.01 level. Similarly,
regression analysis indicates that customer satisfaction has
significant positive effects (p = 0.000 and β = 0.859) on
customer loyalty intention in an organisation. This precisely
means that customer satisfaction has significant positive
impacts on customer loyalty.
Implications of the Study
This research concluded that overall brand image has
significant positive effects on customer satisfaction as well
as customer loyalty intention; and also customer satisfaction
in an organisation has significant positive effects on
customer loyalty. These findings added some strength of
brand image in marketing literature. As brand image has
positive influences on customer satisfaction and customer
loyalty, it has meaningful theoretical importance while
formulating the brand strategy in an organisation. These
findings further enhance the strengths of brand image to
maintain higher level of customer satisfaction and loyalty.
The propose research instrument of brand image benefits
can be used to study about the brand issues by the
researchers, marketers as well as organisations. In addition,
these instruments can be applied by the retailers themselves
to understand the perceptions of their customers regarding
brand image of the company, customer satisfaction and

R. Neupane. (2015) Int. J. Soc. Sci. Manage. Vol-2, issue-1: 9-26
Full text of this paper can be downloaded online at www.ijssm.org/ & http://nepjol.info/index.php/IJSSM/issue/archive
customer loyalty intention. These results may have practical
implications for the organisations while making the policies
in order to enhance brand image customer satisfaction and
customer loyalty.
Moreover, these findings and research instruments may
have practical use for the upcoming researchers in the field
of brand image, customer satisfaction and customer loyalty.
However, further researchers can investigate other elements
of customer satisfaction, brand image and loyalty intention.
Limitations
This research was conducted in a limited time of about 12
weeks with limited resources and so it may have some
limitations. There was a voluntary participation of the
respondents from just main six retailers which all are based
on London only. The study may not represent the real vision
of all retail customers in the UK. A large scale research is
expected to validate these results.
This research is conducted through cross-sectional research
design in which the necessary data is collected at the single
point of time which cannot allow observing cause and
effects relationships. The five variables of brand image, five
variables of customer satisfaction and five statements
regarding loyalty intention are considered in this study.
There may have other important elements that might have
significant effects on the research findings. The closed
ended questionnaires instrument is used to conduct the
survey to collect data from the retailers. Questionnaires may
have some limitations as it does not allow the in-depth
answer from the respondents.
A sample of 120 customers were selected through
convenience sampling technique, which is a non-probability
sampling method and it may not preserve equal chance of
selecting each unit from the population to be studied. The
small sample size from non-probability sampling method
may have sampling errors and which may not represent the
real vision of all retail customers. It is therefore, a large
sample test with more stores from different areas of the UK
and exploring more variables is necessary.
References Aaker DA (1991) Managing brand equity: Capitalizing on the
value of a brand name. New York: The Free Press
Aaker DA and Biel AL (2013) Brand Equity and Advertisement:
Advertising’s Role in Building Strong Brands. New
Jersey: Lawrence Erlbaum Associates, Inc., Publications.
American Marketing Association Dictionary (2013) available at:
http://www.marketingpower.com/_layouts/Dictionary.asp
x?dLetter=B [Accessed 2013-11-18].
Andreassen TW and Lindestad B (1998) Customer loyalty and
complex services: The impact of corporate image on
quality, customer satisfaction and loyalty for customers
with varying degrees of service expertise. International J.
Service Industry Manage. 9(1): 7-23.
Atilgan E, Aksoy S and Akinci S (2005) Determinants of the brand
equity: A verification approach in the beverage industry in
Turkey. Marketing Intelligence and Planning 23(3): 237-
248.
B2B International Official Website (2014) Customer Loyalty
Research. Available at:
http://www.b2binternational.com/research/services/custo
mer-loyalty-research/ [Accessed on 2014-10-12].
Ballantyne D, Frow P, Varey, R J, and Payne, A (2011) Value
propositions as communication practice: taking a wider
view. Industrial Marketing Management, 40 (2): 202–210.
Ballester ED and Aleman JL (2001) Brand Trust in the context of
consumer loyalty. European Journal of Marketing 35 (11):
1238-1258.
Balmer JMT (2001) The three virtues and seven deadly sins of
corporate brand management. Journal of General
Management 27(1): 1-17.
Bello DC and Holbrook MB (1995) Does and Absence of Brand
Equity Generalize Across Product Classes. Journal of
Business Research 34: 125-131.
Bennet, R., and Rundle-Thiele, S. (2004) Customer satisfaction
should not be the only goal. Journal of Service Marketing,
Vol.18 (7): 514–523.
Berry LL (2000) Cultivating service brand equity. Journal of the
Academy of Marketing Science 28(1): 128-137.
Bhat S and Reddy SK (1998) Symbolic and functional positioning
of brands. Journal of Consumer Marketing 15(1): 32–43.
Blackwell RD, Miniard PW and Engel JF (2001) Consumer
behaviour (9th ed.). Orlando FL: Harcourt College
Publishers.
Bloemer J and De Ruyter K (1998) On the relationship between
store image, store satisfaction and store loyalty. European
Journal of Marketing 32(5/6): 499–513.
Bloemer J, DeRuyter K and Peeters P (1998) Investigating drivers
of and satisfaction. The International Journal of Bank
Marketing 16(7): 276 – 286.
Bloemer J, Ruyter KD and Peeters P (1998) Investigating drivers
of bank loyalty: The complex relationship between image,
service quality and satisfaction. International J. Bank
Marketing 16(7): 276-286.
Blumberg B, Cooper DR and Schindler PS (2005) Business
Research Methods. Maidenhead: McGraw Hill Education.
Brace I (2008) Questionnaire Design: How to Plan, Structure and
Write Survey Material for Effective Market Research (2nd
ed.). London: Kogan Page Limited.
Business Dictionary (2013) Brand Image Definition. Online
available at:
http://www.businessdictionary.com/definition/brand-
image.html [Accessed 2014-10-10].
Butscher SA (2002) Customer Loyalty Programmes and Clubs.
England: Gower Publishing Limited.
Buttle F (1996) Servqual: review, critique, research agenda.
European Journal of Marketing 30(1): 8-32.
R. Neupane. (2015) Int. J. Soc. Sci. Manage. Vol-2, issue-1: 9-26
Full text of this paper can be downloaded online at www.ijssm.org/ & http://nepjol.info/index.php/IJSSM/issue/archive
Cacioppo K (2000) Measuring and Managing Customer
Satisfaction. Quality Digest 09/01/2000.
Chan C, Entrekin L and Anderson C (2003) Psychometric
assessment of the perception of service quality. Research
and Practice in Human Resource Management 11(1): 65
– 74.
Chen JD (2004) A Study on Customer Satisfaction and Behavioral
Intentions of the Service Quality for Fixed Network
Communication -An Example of Chung-Hwa Telecom
Company Kaohsiung. Development of Industrial
Engineers and Management I-Shou University.
Chiou JS, Droge C and Hanvanich S (2002) Does customer
knowledge affect how loyalty is formed? Journal of
Service Research 5(2): 113–124.
Cochran C (2003) Customer Satisfaction: Tools Techniques and
Formulas for Success. USA: Paton Professional A division
of Paton Press LLC.
Cohan P (2011) 2010’s Person and Story of the Year, Plus a
Bubble – Bursting Prediction for 2011. Online available
at: http://www.dailyfinance.com/2011/01/02/2010-
person-story-of-the-year-bubble-prediction/ [Accessed
2014-10-12].
Collis J and Hussey R (2003) Business Research: A Practical
Guide for Undergraduate and Postgraduate Students (2nd
edn), Basingstoke, Palgrave Macmillan.
Cretu AE and Brodie RJ (2007) The influence of brand image and
company reputation where manufacturers market to small
firms: A customer value perspective. Industrial Marketing
Management 36: 230-240.
Cronin JJ and Taylor SA (1992) Measuring Service Quality: A Re
examination and Extension. Journal of Marketing 56(3):
55–68.
Da Silva RV and Syed Alwi SF (2006) Cognitive, affective and
conative behavioural responses in retail corporate
branding. Journal of Product and Brand Management
15(5): 293–305.
Dawson C (2002) Practical Research Methods, New Delhi: UBS
Publishers’ Distributors.
Del Rio AB, Vazquez R and Iglesias V (2001) The role of the
brand name in obtaining differential advantages’. Journal
of Product and Brand Management, 10(7): 452–465.
Delong M, Bao M, Wu J, Chao H and Li M (2004) Perception of
US branded apparel in Shanghai. Journal of Fashion
Marketing and Management 8(2): 141-153.
DeVellis RF (2011) Scale Development: Theory and Applications
(Applied Social Research Methods) (3rd ed.). USA: SAGE
Publications, Inc.
Dick AS and Basu K (1994) Customer loyalty: Towards an
integrated conceptual framework. Journal of the Academy
of Marketing Science 22(2): 99–113.
Dietz J, Pugh SD and Wiley JW (2004) Service climate effects on
customer attitudes: An examination of boundary
conditions. Academy of Management Journal 47: 81-92.
East R, Gendall P, Hammond K and Wendy L (2005) Consumer
loyalty: Singular, addictive or interactive? Australian
Marketing Journal 13(2): 10–26.
Easterby-Smith M, Thorpe R and Jackson P (2002) Management
Research: An Introduction (2nd ed.). London: SAGE
Publications Ltd.
Easterby-Smith M, Thorpe R and Jackson P (2012) Management
Research (4th ed.) London: SAGE Publications Ltd.
Egan J (2014) Marketing Communications. United Kingdom:
SAGE Publications.
Eshghi A, Roy SK and Ganguli S (2008) Service quality and
customer satisfaction: An empirical investigation in Indian
mobile Telecommunications services, Marketing
Management Journal 18(2): 119-144.
Faircloth JB, Capella LM and Alford BL (2001) The effect of
brand attitude and brand image on brand equity. Journal
of Marketing Theory and Practice 9(3): 61–74.
Fennis BM and Pruyn TH (2006) You are what you wear: Brand
personality influences on consumer impression formation.
Journal of Business Research 60: 634-639.
Gelder SV (2005) Global Brand Strategy: Unlocking Branding
Potential Across Countries, Cultures and Markets. UK:
Kogan Page Limited.
Gommans M, Krishman KS and Sheffold KB (2001) From Brand
Loyalty to e-loyalty: A conceptual framework. Journal of
Economics and Social Research 3(1): 43-58.
Grönroos C (2007) Service Management and Marketing (3rd ed.).
West Sussex: John Wiley and Sons, Ltd.
Hennig-Thurau T and Khee A (1997) The impact of customer
satisfaction and relationship quality on customer
satisfaction: A critical reassessment and model
development. Psychology and Marketing 14(8): 737–764.
Hess J and Story J (2006) Trust-based commitment:
multidimensional consumer- brand relationships. Journal
of Consumer Marketing 21(5): 321-345.
Hill N and Alexander J (2002) The Handbook of Customer
satisfaction and loyalty Measurement (2nd ed.). England:
Gower Publishing Limited. PP. 2.
Hill N, Roche G and Allen R (2007) Customer Satisfaction: The
Customer Experience through the Customer's Eyes.
London: Cogent Publishing Ltd.
Hsieh AT and Kai Li C (2008) The moderating effect of brand
Image on public relations perception and customer loyalty.
Marketing Intelligence and Planning 26(1): 26-42.
Hsieh MH, Pan SL and Setiono R (2004) Product-, corporate-, and
country-image dimensions and purchase behavior: A
multicountry analysis. Journal of the Academyof
Marketing Science 32(3): 251–270.
Ismail I, Hasnah H, Ibrahim DN and Mohd Isa S (2006) Service
quality, client satisfaction, and loyalty towards audit firms:
Perceptions of Malaysian public listed companies.
Managerial Auditing Journal 22(7): 738–756.
R. Neupane. (2015) Int. J. Soc. Sci. Manage. Vol-2, issue-1: 9-26
Full text of this paper can be downloaded online at www.ijssm.org/ & http://nepjol.info/index.php/IJSSM/issue/archive
Jacoby J and Chestnut R (1978) Brand loyalty: Measurement and
management. New York: Wiley.
Jones MA, David LM and Sharon EB (2002) Why Customers
Stay: Measuring the Underlying Dimension of Service
Switching Costs and Managing Their Differential
Strategic Outcomes. Journal of Business Research 55:
441- 450.
Jones TO and Sasser JWE (1995) Why satisfied customers defect.
Harvard Business Review 73(6): 88–99.
Kandampully J and Suhartanto D (2000) Customer loyalty in the
hotel industry: the role of customer satisfaction and image.
International J. Contemporary Hospitality Management
12(6): 346-351.
Kang GD and James J (2004) Service quality dimensions: An
examination of Gronrooss service quality model.
Managing Service Quality 14: 266-277.
Kapferer JN (2005) The roots of brand loyalty decline: An
international comparison. Ivey Business Journal 69(4): 1–
6.
Keller KL (2003) Building, measuring, and managing brand
equity. New Jersey: Pearson Education.
Kiley D (2005) Rebook and Adidas Merger Looks Good: But Will
It Be Good? Online available at:
http://www.businessweek.com/stories/2005-08-
02/reebok-and-adidas-merger-looks-good-dot-but-will-it-
be-good [Accessed 2014-10-12].
Koo DM (2003) Inter-relationships among store images, store
satisfaction, and store loyalty among Korea discount retail
patrons. Asia Pacific Journal of Marketing and Logistics
15(4): 42–71.
Kotler and Keller (2007) A Framework for Marketing
Management (3rd ed.). New Jersey: Pearson Education Inc.
Kotler P (2001) A framework for marketing management. Upper
Saddle River, NJ: Prentice-Hall.
Kumar RS (2009) Consumer Behaviour and Branding: Concepts,
Readings and Cases-The Indian Context. India: Dorling
Kindersley India Pvt. Ltd.
Ladhari R (2009) A review of twenty years of SERVQUAL
research. International Journal of Quality and Service
Sciences 1( 2): 172-198.
Lam SSK and Woo KS (1997) Measuring service quality: A test-
retest reliability investigation of SERVQUAL. Journal of
Marketing Research Society 39(2): 381-396.
London Stoke Exchange (2013) FTSE 100, available at:
http://www.londonstockexchange.com/exchange/prices-
and-markets/stocks/indices/summary/summary-indices-
constituents.html?index=UKXandpage=3 [Accessed on
2014-11-16].
Malhotra NK (1981) A scale to measure self-concepts, person
concepts, and product concepts. Journal of Marketing
Research 18(4): 456–464.
Martisiute S, Gabriele V and Dainora, G (2010) Product or Brand?
How Interrelationship between Customer Satisfaction and
Customer Loyalty Work. European Journal of
Interdisciplinary Studies June 2010: 5-15.
Mayer-Waarden L (2008) The influence of loyalty programme
membership on customer purchase behaviour. European
Journal of Marketing 42: 84 – 114.
Mellens M, Dekimpe MG and Steenkamp JBEM (1996) A review
of brandloyalty measures in marketing. Tijdschrift voor
Economie en Management 41: 507– 532.
Murphy J (1998) What is branding?. In: Hart S and Murphy J (eds)
Brands: The new wealth creators. London: Macmillan
Press: 1-22.
Nandan S (2005) An exploration of the brand identity-brand image
linkage: communications perspective. Brand
Management 12(4): 264–278.
Nedungadi P (1990) Recall and consumer consideration sets:
Influencing 75 choice without altering brand evaluations.
Journal of Consumer Research 17 (3): 263-276.
Neupane R (2012) Effect of Relationship Marketing on Customer
Satisfaction: A Case Study of Tesco. Unpublished Master’s
Thesis. London: Coventry University.
Nguyen N and LeBlanc G (2001) Image and reputation of higher
education institutions in students' retention decisions.
International Journal of Educational Management 15(6):
303–311.
Oliver RL (1997) Satisfaction: a behavioural perspective on the
consumer (ed.). New York, NY: McGraw-Hill.
Oliver RL (2010) Satisfaction: a behavioural perspective on the
consumer. New York, NY: McGraw-Hill, PP. 8.
Oliver RL (1999) Whence consumer loyalty? Journal of
Marketing 63(4): 33–44.
Parasuraman A, Berry L and Zeithaml VA (1991) Refinement and
reassessment of the SERVQUAL Scale. Journal of
Retailing 67(4): 420 – 450.
Parasuraman A, Zeithaml VA and Berry L (1985) A conceptual
model of service quality and its implications for future
research. Journal of Marketing 49: 41 – 50.
Park CW, Jaworski BJ and Maclnnis DJ (1986) Strategic brand
concept-image management. Journal of Marketing 50(4):
135–145.
Pepe MS, Russell A and Paul D (2011) The Impact of Private
Label Brands on Customer Loyalty and Product Category
Profitability. Journal of Product and Brand Management
20(1): 27-36.
Pokharel B (2005) Social Research Methods. Kathmandu:
Dikshant Pustak Bhandar.
Pullman ME and Gross MA (2004) Ability of experience design
elements to elicit emotions and loyalty behaviours.
Decision Sciences, 35(3): 551–578.
Reichheld F and Detrick C (2003) Loyalty: A prescription for
cutting costs. Marketing Management 12(5): 24–25.
Reichheld F and Detrick C (2003) Loyalty: A prescription for
cutting costs. Marketing Management 12(5): 24–25.
R. Neupane. (2015) Int. J. Soc. Sci. Manage. Vol-2, issue-1: 9-26
Full text of this paper can be downloaded online at www.ijssm.org/ & http://nepjol.info/index.php/IJSSM/issue/archive
Reynolds KE and Beatty SE (1999) Customer benefits and
company consequences of customer-salesperson
relationships in retailing. Journal of Retailing 75(1): 11–
32.
Richard PJ. Devinney TM, Yip GS and Johnson G (2009)
Measuring Organizational Performance: Towards
Methodological Best Practice. .Journal of Management
35: 718-804.
Robson C (2002) Real World Research (2nd ed.). Oxford:
Blackwell.
Roman K, Maas J and Nisenholtz M (2005) How to advertise:
What works, what doesn't-and why. London: Kogan Page.
Roth MS (1995) Effects of global market conditions on brand
image customization and brand performance. Journal of
Advertising 24(4): 55–72.
Rundle-Thiele S and Bennett R (2001) A brand for all seasons? A
discussion of brand loyalty approaches and their
applicability for different markets. Journal of Product
andBrand Management 10(1): 25–37.
Saunders M, Lewis P and Thornhill A (2009) Research Methods
for Business Students, 5th edition. Essex, England :
Pearson Education Limited.
Saxby D (2006) If You Aren’t Measuring Customer Service, You
Aren’t Managing It. Measure-X White Paper, 2006.
Schiffman LG and Kanuk LL (2004) Consumer behavior (8th ed.).
New York: Prentice-Hall.
Schultz DE (2005) The loyalty paradox. Marketing Management
14(5): 10–11.
Sivas E and Baker-Prewitt JL (2000) An Examination of the
Relationship between Service Quality, Customer
Satisfaction, and Store Loyalty. International Journal of
Retail and Distribution Management 28(2): 55–68.
Sondoh Jr SL, Omar MW and Wahid NA (2007) The Effects of
Brand Image on Overall Satisfaction and Loyalty Intention
in the Context of Color Cosmetic. Asian Academy of
Management Journal 12(1): 83-107.
Sunder VK (2011) Outsourcing and Customer Satisfaction: A
Study of PC Help-Desk Services. USA: Xlibris
Corporation.
Sweeney JC and Soutar GN (2001) Consumer perceived value:
The development of a multiple item scale. Journal of
Retailing 77: 203–220.
Szwarc P (2005) Researching Customer Satisfaction and Loyalty:
How to Find Out What People Really Think. London:
Kogan Page Limited.
Szymanski DM and Henard DH (2001) Customer satisfaction: A
meta-analysis ofthe empirical evidence. Journal of the
Academy of Marketing Science 29(1): 16–35.
Thakur S and Singh AP (2012) Brand image, customer satisfaction
and loyalty intention: a study in the context of cosmetic
product among the people of Central India. EXCEL
International Journal of Multidisciplinary Management
Studies 2(5), May 2012.
Tsai M, Liang W and Liu M (2007) The effects of subliminal
advertising on consumer attitudes and buying intentions.
International Journal of Management 24(1): 3-14.
Tsai SP (2005) Utility, cultural symbolism and emotion: A
comprehensive model of brand purchase value.
International Journal of Research in Marketing, 1–15.
Vavra TG (2002) Customer Satisfaction Measurement Simplified:
A Step-by-Step Guide for ISO 9001:2000 Certification.
USA: American Society for Quality.
Wheeler A (2013) Designing Brand Identity: an essential guide
for whole branding team (4th ed.). New Jersey: John Wiley
and Sons, Inc.
Yang Z and Peterson R (2004). Customer perceived value,
satisfaction, and loyalty: Therole of switching costs.
Psychology and Marketing 21(10): 799–822.
Yasin NM, Noor MN and Mohamad O (2007) Does image of
country-of-origin matter to brand equity? Journal of
Product and Brand Management 16(1): 38-48.
Yin RK (2003) Case study research: Design and methods (3rd ed.).
Thousand Oaks, CA: Sage.
Yoo B, Donthu N and Lee S (2000) An examination of selected
marketing mix elements and brand equity. Journal of the
Academy of Marketing Science 28(2): 195-211.
Zeithaml VA, Berry LL and Parasuraman A (1996) The behavioral
consequences of service quality. Journal of Marketing
60(2): 31–46.
Zins AH (2001) Relative attitudes and commitment in customer
loyalty models: Some experiences in the commercial air
line industry. International Journal Service Industry
Management 12(3): 269-294.