international migration outlook 2014 -...
TRANSCRIPT

Special Focus: Mobilising Migrants’ Skills for Economic Success
Consult this publication on line at http://dx.doi.org/10.1787/migr_outlook-2014-en.
This work is published on the OECD iLibrary, which gathers all OECD books, periodicals and statistical databases.Visit www.oecd-ilibrary.org for more information.
International Migration Outlook 2014
International Migration Outlook 2014Contents
Editorial
Executive summary
Chapter 1. Recent developments in international migration trends
Chapter 2. Labour market integration of immigrants and their children: Developing, activating and using skills
Chapter 3. Managing labour migration: Smart policies to support economic growth
Chapter 4. Country notes: Recent changes in migration movements and policies
Statistical Annex
www.oecd.org/migration/imo
ISBN 978-92-64-21118-681 2014 10 1 P
Internatio
nal M
igratio
n Ou
tloo
k 2014


International MigrationOutlook
2014

This work is published under the responsibility of the Secretary-General of the OECD. The
opinions expressed and arguments employed herein do not necessarily reflect the official
views of OECD member countries.
This document and any map included herein are without prejudice to the status of or
sovereignty over any territory, to the delimitation of international frontiers and boundaries
and to the name of any territory, city or area.
ISBN 978-92-64-21118-6 (print)ISBN 978-92-64-22352-3 (PDF)
Annual: International Migration OutlookISSN 1995-3968 (print)ISSN 1999-124X (online)
The statistical data for Israel are supplied by and under the responsibility of the relevant Israeli authorities. The useof such data by the OECD is without prejudice to the status of the Golan Heights, East Jerusalem and Israelisettlements in the West Bank under the terms of international law.
Photo credits: Cover © David Rooney.
Corrigenda to OECD publications may be found on line at: www.oecd.org/about/publishing/corrigenda.htm.
© OECD 2014
You can copy, download or print OECD content for your own use, and you can include excerpts from OECD publications, databases and
multimedia products in your own documents, presentations, blogs, websites and teaching materials, provided that suitable
acknowledgment of the source and copyright owner is given. All requests for public or commercial use and translation rights should be
submitted to [email protected]. Requests for permission to photocopy portions of this material for public or commercial use shall be
addressed directly to the Copyright Clearance Center (CCC) at [email protected] or the Centre français d'exploitation du droit de copie
(CFC) at [email protected].
Please cite this publication as:OECD (2014), International Migration Outlook 2014, OECD Publishing.http://dx.doi.org/10.1787/migr_outlook-2014-en

FOREWORD
Foreword
This publication constitutes the thirty-eighth report of the OECD’s Continuous Reporting System on
Migration. The report is divided into four chapters plus a Statistical annex. It is a special edition
prepared for the OECD High-Level Policy Forum on Migration, held in Paris, December 2014. This
forum aimed at discussing and analysing challenges in managing migration and fostering
integration of immigrants and their children in the context of current and future skills needs of OECD
and key partner countries. The overarching theme was on “Mobilising migrants’ skills for
economic success”.
Chapter 1 provides a broad overview of recent trends in international migration flows.
Chapters 2 and 3 are devoted to special topics. Chapter 2 takes stock of the broad issues involved in
the labour market integration of immigrants and their offspring from a human capital perspective,
as well as of the policies at hand to free their full skills potential through the identification and
utilisation, the activation, and the development of their skills. It builds on the extensive work of the
OECD on integration issues, together with new evidence. Chapter 3 provides a systematic and
comparative overview of labour migration management; identifying key elements which can help
policy makers match concrete measures to overarching objectives. It discusses how the landscape for
labour migration policy is changing, due to both structural factors and the breakdown of traditional
categories, posing new challenges for policy makers.
Chapter 4 presents succinct country-specific notes and statistics on developments in
international migration movements and policies in OECD countries in recent years. Finally, the
Statistical annex includes a broad selection of recent and historical statistics on immigrant flows, the
foreign and foreign-born populations and naturalisations.
This year’s edition of the OECD International Migration Outlook is the joint work of staff of
the International Migration Division in the Directorate for Employment, Labour and Social Affairs.
Chapters 1 and 4 are a collective work of the staff of the International Migration Division with
contributions from John Salt (University College London, the United Kingdom) and Martina Lubyova
(Slovak Academy of Sciences, the Slovak Republic) for Chapter 4. Chapter 2 was prepared by
Thomas Liebig and Thomas Huddleston (Consultant to the OECD). Chapter 3 was prepared by
Jonathan Chaloff and Sankar Ramasamy. Jean-Christophe Dumont edited the report. Research
assistance and statistical work were carried out by Véronique Gindrey and Philippe Hervé. Editorial
assistance was provided by Sylviane Yvron. Finally, thanks go to Ken Kincaid for his editing work on
Chapters 2 and 3.
INTERNATIONAL MIGRATION OUTLOOK 2014 © OECD 2014 3


TABLE OF CONTENTS
Table of contents
Editorial: Migration policy in a time of uncertainty . . . . . . . . . . . . . . . . . . . . . . . . . . . . . 9
Executive summary . . . . . . . . . . . . . . . . . . . . . . . . . . . . . . . . . . . . . . . . . . . . . . . . . . . . . . . . . 13
Chapter 1. Recent developments in international migration trends . . . . . . . . . . . . . . . . 17
Key findings . . . . . . . . . . . . . . . . . . . . . . . . . . . . . . . . . . . . . . . . . . . . . . . . . . . . . . . . . . . . 18
Recent trends in international migration . . . . . . . . . . . . . . . . . . . . . . . . . . . . . . . . . . . 19
Notes. . . . . . . . . . . . . . . . . . . . . . . . . . . . . . . . . . . . . . . . . . . . . . . . . . . . . . . . . . . . . . . . . . 33
Chapter 2. Labour market integration of immigrants and their children:Developing, activating and using skills . . . . . . . . . . . . . . . . . . . . . . . . . . . . . . . . . . . . 35
Key policy findings . . . . . . . . . . . . . . . . . . . . . . . . . . . . . . . . . . . . . . . . . . . . . . . . . . . . . . 36
Introduction. . . . . . . . . . . . . . . . . . . . . . . . . . . . . . . . . . . . . . . . . . . . . . . . . . . . . . . . . . . . 45
The labour market integration context . . . . . . . . . . . . . . . . . . . . . . . . . . . . . . . . . . . . . 46
What policies matter for immigrant integration? . . . . . . . . . . . . . . . . . . . . . . . . . . . . 69
Conclusion: Integration as investment . . . . . . . . . . . . . . . . . . . . . . . . . . . . . . . . . . . . . 106
Notes. . . . . . . . . . . . . . . . . . . . . . . . . . . . . . . . . . . . . . . . . . . . . . . . . . . . . . . . . . . . . . . . . . 108
Bibliography. . . . . . . . . . . . . . . . . . . . . . . . . . . . . . . . . . . . . . . . . . . . . . . . . . . . . . . . . . . . 110
Annex 2.A1. Supplementary tables and figures . . . . . . . . . . . . . . . . . . . . . . . . . . . . . . 115
Chapter 3. Managing labour migration: Smart policies to supporteconomic growth . . . . . . . . . . . . . . . . . . . . . . . . . . . . . . . . . . . . . . . . . . . . . . . . . . . . . . . 133
Key policy findings . . . . . . . . . . . . . . . . . . . . . . . . . . . . . . . . . . . . . . . . . . . . . . . . . . . . . . 134
Introduction. . . . . . . . . . . . . . . . . . . . . . . . . . . . . . . . . . . . . . . . . . . . . . . . . . . . . . . . . . . . 145
The changing landscape of labour migration. . . . . . . . . . . . . . . . . . . . . . . . . . . . . . . . 146
Setting and balancing goals for migration policy intervention . . . . . . . . . . . . . . . . . 152
The policy toolbox for achieving labour migration policy goals . . . . . . . . . . . . . . . . 160
Building a migration management infrastructure. . . . . . . . . . . . . . . . . . . . . . . . . . . . 204
Conclusions . . . . . . . . . . . . . . . . . . . . . . . . . . . . . . . . . . . . . . . . . . . . . . . . . . . . . . . . . . . . 214
Notes. . . . . . . . . . . . . . . . . . . . . . . . . . . . . . . . . . . . . . . . . . . . . . . . . . . . . . . . . . . . . . . . . . 215
Bibliography. . . . . . . . . . . . . . . . . . . . . . . . . . . . . . . . . . . . . . . . . . . . . . . . . . . . . . . . . . . . 218
Annex 3.A1. Labour migration policy tables . . . . . . . . . . . . . . . . . . . . . . . . . . . . . . . . . 221
INTERNATIONAL MIGRATION OUTLOOK 2014 © OECD 2014 5

TABLE OF CONTENTS
Chapter 4. Country notes: Recent changes in migration movements and policies . . . 233
Sources and notes of the country tables of Chapter 4. . . . . . . . . . . . . . . . . . . . . . . . . . . . . 310
Statistical annex. . . . . . . . . . . . . . . . . . . . . . . . . . . . . . . . . . . . . . . . . . . . . . . . . . . . . . . . . . . . 313
Introduction. . . . . . . . . . . . . . . . . . . . . . . . . . . . . . . . . . . . . . . . . . . . . . . . . . . . . . . . . . . . 314
General comments . . . . . . . . . . . . . . . . . . . . . . . . . . . . . . . . . . . . . . . . . . . . . . . . . . . . . . 314
Inflows and outflows of foreign population . . . . . . . . . . . . . . . . . . . . . . . . . . . . . . . . . 316
Inflows of asylum seekers . . . . . . . . . . . . . . . . . . . . . . . . . . . . . . . . . . . . . . . . . . . . . . . . 341
Stocks of foreign and foreign-born populations. . . . . . . . . . . . . . . . . . . . . . . . . . . . . . 361
Acquisitions of nationality . . . . . . . . . . . . . . . . . . . . . . . . . . . . . . . . . . . . . . . . . . . . . . . 400
Abbreviations . . . . . . . . . . . . . . . . . . . . . . . . . . . . . . . . . . . . . . . . . . . . . . . . . . . . . . . . . . . . . . 421
List of the members of the OECD Expert Group on Migration . . . . . . . . . . . . . . . . . . . . . 423
List of OECD Secretariat members involved in the preparation of this publication . . 425
Australia. . . . . . . . . . . . . . . . . . . . . . . . . . 234
Austria . . . . . . . . . . . . . . . . . . . . . . . . . . . 236
Belgium . . . . . . . . . . . . . . . . . . . . . . . . . . 238
Bulgaria . . . . . . . . . . . . . . . . . . . . . . . . . . 240
Canada . . . . . . . . . . . . . . . . . . . . . . . . . . . 242
Chile . . . . . . . . . . . . . . . . . . . . . . . . . . . . . 244
Czech Republic . . . . . . . . . . . . . . . . . . . . 246
Denmark . . . . . . . . . . . . . . . . . . . . . . . . . 248
Estonia . . . . . . . . . . . . . . . . . . . . . . . . . . . 250
Finland . . . . . . . . . . . . . . . . . . . . . . . . . . . 252
France. . . . . . . . . . . . . . . . . . . . . . . . . . . . 254
Germany . . . . . . . . . . . . . . . . . . . . . . . . . 256
Greece. . . . . . . . . . . . . . . . . . . . . . . . . . . . 258
Hungary . . . . . . . . . . . . . . . . . . . . . . . . . . 260
Ireland . . . . . . . . . . . . . . . . . . . . . . . . . . . 262
Israel. . . . . . . . . . . . . . . . . . . . . . . . . . . . . 264
Italy. . . . . . . . . . . . . . . . . . . . . . . . . . . . . . 266
Japan. . . . . . . . . . . . . . . . . . . . . . . . . . . . . 268
Korea . . . . . . . . . . . . . . . . . . . . . . . . . . . . 270
Latvia . . . . . . . . . . . . . . . . . . . . . . . . . . . . 272
Lithuania. . . . . . . . . . . . . . . . . . . . . . . . . 274
Luxembourg . . . . . . . . . . . . . . . . . . . . . . 276
Mexico . . . . . . . . . . . . . . . . . . . . . . . . . . . 278
Netherlands . . . . . . . . . . . . . . . . . . . . . . 280
New Zealand. . . . . . . . . . . . . . . . . . . . . . 282
Norway . . . . . . . . . . . . . . . . . . . . . . . . . . 284
Poland . . . . . . . . . . . . . . . . . . . . . . . . . . . 286
Portugal . . . . . . . . . . . . . . . . . . . . . . . . . . 288
Romania . . . . . . . . . . . . . . . . . . . . . . . . . 290
Russian Federation . . . . . . . . . . . . . . . . 292
Slovak Republic . . . . . . . . . . . . . . . . . . . 294
Slovenia. . . . . . . . . . . . . . . . . . . . . . . . . . 296
Spain . . . . . . . . . . . . . . . . . . . . . . . . . . . . 298
Sweden . . . . . . . . . . . . . . . . . . . . . . . . . . 300
Switzerland. . . . . . . . . . . . . . . . . . . . . . . 302
Turkey . . . . . . . . . . . . . . . . . . . . . . . . . . . 304
United Kingdom. . . . . . . . . . . . . . . . . . . 306
United States . . . . . . . . . . . . . . . . . . . . . 308
INTERNATIONAL MIGRATION OUTLOOK 2014 © OECD 20146

Look for the StatLinks2at the bottom of the tables or graphs in this book.
To download the matching Excel® spreadsheet, just type the link into your
Internet browser, starting with the http://dx.doi.org prefix, or click on the link from
the e-book edition.
Follow OECD Publications on:
This book has... StatLinks2A service that delivers Excel files from the printed page! ®
http://twitter.com/OECD_Pubs
http://www.facebook.com/OECDPublications
http://www.linkedin.com/groups/OECD-Publications-4645871
http://www.youtube.com/oecdilibrary
http://www.oecd.org/oecddirect/ OECD
Alerts
INTERNATIONAL MIGRATION OUTLOOK 2014 © OECD 2014 7


EDITORIAL: MIGRATION POLICY IN A TIME OF UNCERTAINTY
Editorial: Migration policy in a time of uncertainty
Migration has become a constant factor in the economic and social landscape. Most
OECD countries are net immigration countries, and the share of immigrants has been
rising in almost all of them. There are now more than 115 million immigrants in
OECD countries, about 10% of the population. A further 5% of the native-born population
has at least one immigrant parent. Migration flows are close to four million annually.
Just as constant as migration are concerns about whether immigrants and their
children will integrate in the labour market. These concerns have only grown since the
crisis, which hit immigrants disproportionately hard. Migrants account for more than one
in five of additional unemployed in the OECD since 2007, and in many countries they have
a harder time in getting back into work. One reason is that, compared to natives there
are fewer immigrants who are outside the labour market. Indeed, in a number of
OECD countries, migrants, notably those with less than upper secondary education, are
more likely to be employed than their native counterparts.
Migration is in constant evolution. The context in which migration happens, as well
as migration flows themselves, is always evolving. Temporary labour migration and free
movement, notably in Europe, have experienced wide swings before and during the crisis.
Free movement for example decreased by more than 35 % between 2007 and 2010. Since
then, it has strongly rebounded, although these flows have shifted from southern Europe
to Germany.
Another change is in where migrants come from. China continues to top the list of
origin countries, but flows from other countries have ebbed and flowed: Migration from
Eastern Europe rose and then fell, while migration from Latin America has been in a more
consistent decline.
There has been a change, too, in the sort of people who are migrating. Today’s
migrants are better educated than their predecessors. The number of foreign-born who are
highly-educated has grown by 70% over the past decade to exceed 31 million in the
OECD area. Over that period, highly educated immigrants accounted for 45% of the
increase in the foreign born population. Despite this boost to the supply of skills, educated
migrants don’t always have a success story to tell. They fare worse on skill tests than
native-born with the same education, largely, but not entirely, because of a language
handicap. They also have a higher rate of unemployment than their native peers. And their
over-qualification rate is 50% higher than that of natives.
Policy needs to keep up. Migration and integration policy need to keep pace with these
changes, some of which have been visible for a long time and so cannot have come as a
shock to policymakers. In the face of more qualified immigrants, for example, countries
such as Germany and Denmark have invested in processes to assess and recognise foreign
INTERNATIONAL MIGRATION OUTLOOK 2014 © OECD 2014 9

EDITORIAL: MIGRATION POLICY IN A TIME OF UNCERTAINTY
qualifications. Growing backlogs of qualified candidates led Canada and other countries to
fast-track skilled migrants with a job offer in hand. A shortage of young people to fill
low-skill jobs led Korea to rethink its temporary labour migration system.
Yet, compared to even five years ago, we are now seeing more disorienting shifts in
migration, which complicate the task of matching policy to changing circumstances. The
policy objectives for migration have also shifted, as has the perception of the role of
migration. Today’s policy debate places greater emphasis on social cohesion and less on
urgent recruitment needs. Greater importance has been given to the ability to adapt to new
circumstances and build in more flexibility. Public opinion clamours for more information
about today’s migrants, wanting more reassurance that integration measures are on track
and that labour migration management is well suited to foster economic growth.
This report puts the spotlight on important challenges facing policy makers:
● First, there is the challenge of reconciling short-term and long-term policy considerations.
Short political cycles and hostile public opinion can work against longer-term planning.
For example, integration programmes may involve an upfront investment, yet may raise
migrants’ employment performance only in the long term. Similarly, permanent migration
has an effect on long-term demographic developments but also has to respond to rapidly
changing economic circumstances.
● Second, there is the challenge of reconciling conflicting objectives. The need to protect
local workers must be balanced against requests from employers to recruit quickly from
the broadest possible pool of candidates. The need to be attractive in a competitive
global market for talent must be weighed against the need to ensure the integrity of
admission processes and to protect the local labour force. Efficiency must be balanced
against procedural safeguards. The objective of filling short-term demand with
temporary migrants may also conflict with the need to offer integration opportunities to
migrants with long-term plans. In the realm of integration policy, the need to target
immigrants with specific and appropriate measures must be balanced against the need
to ensure fair and equal treatment, avoid stigmatising vulnerable categories, and
mainstream services and policies.
● Third, there is the challenge of dealing with uncertainties. Geopolitical events affect
international migration flows as well as public attitudes toward migration. Even though
geopolitical shocks mostly provoke refugee and asylum seeker flows, labour migration
policy is not decided in a sealed compartment. The needs of business are also not easy
to predict: Short-term labour needs may turn out to be protracted, making a temporary
labour force ill-suited to meeting them. At the same time, structural changes may affect
long-standing industries, undermining the need for permanent labour migrants.
Another area of uncertainty is the behaviour of migrants themselves: Migrants are more
mobile than natives and more likely to move on when circumstances change, although
it is impossible to predict how many will do so. It is also impossible to predict how many
natives will leave if the economy turns sour: Since, the crisis struck, a number of
OECD countries have had to react to unexpectedly large outflows of both migrants and
natives. Finally, migration is increasingly multipolar. More and more countries compete
for global talents, and competition may come not just from other OECD countries, but
from non-OECD developing and emerging economies as well.
INTERNATIONAL MIGRATION OUTLOOK 2014 © OECD 201410

EDITORIAL: MIGRATION POLICY IN A TIME OF UNCERTAINTY
The most efficient way to respond to these challenges and uncertainties is to adopt
a dynamic migration management system as well as an adaptable and flexibleintegration framework. This, in itself, is a challenge. First of all, building consensus among
stakeholders on changes in migration and integration policies has proven arduous in many
countries. Secondly, migrants are rational agents who quickly adapt their behaviour
to policy changes, amplifying or possibly neutralising the intended effects. Lastly,
policymakers are expected to justify and explain their policy choices to a sometimes
unforgiving public. It may be tempting to use blunt and direct – if not inflexible – policy
measures, since these are easier to communicate. Dynamic systems, on the other hand,
require informing and communicating with the public about results, and about changes
and adaptations. Sweden is one example of a country that has changed its integration and
labour migration frameworks several times in recent years in response to changing
circumstances and evidence from practice.
There are three main lessons in addressing these challenges:
● Migrants need to be seen as a resource rather than a problem and integration policies as
an investment to make the best use of their skills.
● Even labour migration management systems that work today may not work tomorrow.
The costs, short- and long-term, of standing still in the face of rapidly changing
economic, demographic and geopolitical environments can be high.
● Although underdeveloped in many countries, evaluation and feedback in both
integration and labour migration management are crucial to building public confidence
on migration.
There are many ways for migrants to contribute to economic growth. Getting
migration right is not about the volumes of admission, or the size of public expenditures,
or about finding a magic formula so that “everyone wins”, but about transparently
prioritising objectives and using well-designed tools to achieve them.
This report, prepared for the OECD High-Level Policy Forum on Migration in
December 2014, brings together some of the lessons for dealing with these challenges, and
identifies a number of good practices. The OECD last held a High Level Policy Forum in 2009
and, since then, not only have circumstances changed but so has our knowledge and
understanding of migration and integration policy.
Stefano Scarpetta,
OECD Director for Employment,
Labour and Social Affairs
INTERNATIONAL MIGRATION OUTLOOK 2014 © OECD 2014 11


International Migration Outlook 2014
© OECD 2014
Executive summary
Main trendsPermanent migration flows to the OECD have begun to rebound, according to
preliminary data for 2013. Compared with 2012, they grew slightly by 1.1% to reach around
4 million new permanent immigrants. This modest increase is the consequence of
conflicting evolutions in several major immigration countries. Migration to Germany
recorded a double-digit increase, its fourth consecutive annual rise. By contrast, several
major immigration countries saw declines, notably the United States, Italy, Portugal and
Spain. Net migration is still well below pre-crisis levels, but it remains positive in most
OECD countries. Notable exceptions are Mexico, Iceland, and Ireland.
The rebound in permanent migration is driven mainly by a rise in free-movement
migration, which rose by 10% in 2012. Across OECD countries, most of this free-movement
migration is accounted for by people moving between EU states. In 2012, and for the first
time ever, such movements within Europe matched legal permanent migration from
outside Europe. Germany was the most important destination, receiving almost a third of
free-movement migrants.
Overall, however, family migration continues to account for the bulk of migration
flows in OECD countries, even though it has been declining since 2008. In 2012, it dropped
by 1.7% on the previous year, mainly due to falls in Spain, Italy, the United States, the
United Kingdom and Belgium. Labour migration has also declined continuously since the
economic downturn, falling 12% in 2012. The fall was particularly notable in the European
Economic Area, where labour migration decreased by almost 40% between 2007 and 2012.
As a result, for the first time in 2012, legal permanent migration from third countries to
Europe was slightly lower than legal permanent migration to the United States.
Like permanent migration, temporary migration flows remain below their peak of
2.5 million in 2007. In 2012, they stood at 1.9 million, about a quarter below the figure for 2007.
The conflict in Syria contributed to push asylum claims up by 20% in 2013 to
560 000 applications. Claims to Germany rose for the sixth year in a row, making it the
world’s largest recipient with 110 000 claims. It was followed by the United States, France,
Sweden and Turkey. As a proportion of its population, Sweden received the most asylum
seekers and refugees.
International students continue to attract significant policy attention in many
OECD countries. Worldwide, 4.5 million students were enrolled outside their country of
citizenship in 2012, with 75% of them studying in OECD countries. That share is largely
unchanged on recent years. The number of international students in OECD countries
continues to grow but the rise was only 3% in 2012, well down on average annual growth
rates of 8% in 2000-05 and 6% in 2005-11.
13

EXECUTIVE SUMMARY
Investing in the labour market integration of immigrantsFirst- and second-generation immigrants are playing a growing role in the workforce.
In countries settled through immigration, such as Australia, Canada, New Zealand, and the
United States, as well as in Western Europe, immigrants are well established. Elsewhere, in
Southern Europe for example, they are a relatively recent but growing presence in the
education system and the labour market.
The integration of immigrants and their families has been a prime policy objective in
many OECD countries for at least the past 15 years. Perhaps the most important challenge
is unleashing immigrants’ full skills potential. A number of policy approaches can help
make this happen:
● Make information on foreign qualifications more widely available and improve their
recognition.
● Ensure immigrants have access to active labour market programmes and that they
benefit from them.
● Put immigrants more directly in contact with employers.
● Provide immigrants’ children with high-quality early childhood education and care.
● Provide language training adapted to immigrants’ skills.
Developing smart labour migration management systemsEven though unemployment remains high in OECD countries, migration still has role
to play in meeting labour market needs and in driving economic growth. While this role
varies enormously across countries, there is a shared aspiration to create the conditions for
“better” labour migration, especially against a backdrop of close public scrutiny.
Labour migration policy can be used to achieve different and sometimes competing
goals. These may include satisfying short-term labour needs and contributing to long-term
demographic and labour force development. There may also be wider economic
development objectives in areas like investment and trade, innovation and productivity
and development co-operation. There are inherent trade-offs in balancing these objectives,
and policy actors in different areas should co-ordinate to ensure coherent approaches.
A very wide range of tools can be used to ensure that labour migration meets its policy
objectives. These can range from numerical limits on migration to “points-based” selection
of would-be immigrants, and much more. Flexibility is important in applying these tools to
ensure a dynamic and reactive management system. A range of policy approaches can help
labour migration play a better role in meeting current and future skills needs:
● Develop a clear labour migration framework.
● Assemble a policy toolbox with a range of instruments for different objectives.
● Improve management of admission criteria and adopt a dynamic approach to migration
management.
● Modernise service infrastructure.
INTERNATIONAL MIGRATION OUTLOOK 2014 © OECD 201414

EXECUTIVE SUMMARY
Key figures● Preliminary data suggests permanent migration flows to the OECD rose by about 1%
in 2013 compared to 2012, following a 0.8% drop in 2012 compared to the previous year.
● Labour migration has declined continuously since the economic downturn and fell by
about 12% in 2012. By contrast, free-movement migration rose 10%.
● Asylum seeking increased by 20% in 2013 compared to 2012.
● Worldwide, the number of students enrolled outside their country of citizenship more
than doubled since 2000 to reach 4.5 million in 2012, with 75% enrolled in OECD countries.
● With a little over half a million emigrants, China accounted for almost 10% of all flows to
OECD countries in 2012, followed by Romania (5.6%) and Poland (5.4%).
● There are more than 115 million immigrants in the OECD, about 10% of the total population.
● In 2012, about 12.5% of all 15 year-olds had two foreign-born parents – 50% more than a
decade earlier. Their integration, particularly those with parents with low levels of
education, is a growing concern.
● The crisis hit immigrants disproportionately hard: of the additional 15 million unemployed
in the OECD since 2007, about 1 in 5 is foreign-born.
● Despite the crisis most immigrants are in work. On average, a higher proportion of
low-educated immigrants (54.1%) are in work than their native-born peers (52.6%).
● By contrast, tertiary educated immigrants are less likely to be in work than their
native-born counterparts (77% versus 84%). And when employed, they are 50% more
likely to be over-qualified for their jobs.
INTERNATIONAL MIGRATION OUTLOOK 2014 © OECD 2014 15


International Migration Outlook 2014
© OECD 2014
Chapter 1
Recent developments in internationalmigration trends
This chapter provides an overview of recent developments in internationalmigration movements in OECD countries. It begins with a description, based onpreliminary data and estimates, of permanent migration flows in 2013, before goingon to a more detailed analysis of trends from the start of the financial crisis to 2012.This is followed by an analysis of the changes in the composition of these flows bymain category of migration in which particular attention is paid to labour migration– including employment-related free movement. Permanent migration for family orhumanitarian motives is then analysed. Temporary migration follows with briefhighlights on seasonal and intra-company transfers as well as tracing thecontinuing growth of asylum seekers especially in the wake of the Syrian conflictsince 2011, before turning on to the international mobility of students, a policy focusof many OECD countries. The chapter concludes with a look at the key countries oforigin from which migrants leave for OECD countries and the changing trends in netmigration as international migration movements have responded to the crisis andits aftermath.
The statistical data for Israel are supplied by and under the responsibility of the relevant Israeliauthorities. The use of such data by the OECD is without prejudice to the status of the Golan Heights,East Jerusalem and Israeli settlements in the West Bank under the terms of international law.
17

1. RECENT DEVELOPMENTS IN INTERNATIONAL MIGRATION TRENDS
Key findings● Preliminary data suggest that permanent migration flows to the OECD have begun to
rebound in 2013 – rising by approximately 1% compared with 2012. This rebound has
partially been driven by the large increase recorded in the number of migrants to
Germany. These increased migration flows to Germany were, to some extent, offset by
declining flows to the United States – which remains the largest receiving OECD country
– and to Italy and Spain – where tough economic conditions continued to prevail.
● The full data for 2012 showed a modest fall in permanent migration flows, of
0.8% compared to the previous year. This slowdown reflects the slow pace of the global
economic recovery, as well as the economic climate in Europe. An interesting trend in
Europe is the declining levels of migration from countries outside of the European Union
(EU) area. Even then, migration from third countries to the EU has been substantial, with
an average of 1.2 million per year over the period 2007-12, more than the equivalent for
the United States.
● Labour migration has declined continuously since 2007/08 and fell across the OECD by
about 12% in 2012. Within the EU, the fall has been more substantial still and a large
drop-off in the numbers of migrants arriving in Spain and Italy have contributed to a fall
of almost 40% between 2007 and 2012. However, this has to be nuanced as, in the context
of free-circulation areas, at least half of free-movement migration flows are estimated to
be employment-related.
● The rebound, observed since 2010, in free-movement migration continued in 2012 with
a 10% increase in 2012 compared to 2011. Much of this increase has been driven by the
large increase in the number of migrants to Germany – which has now become the single
most important destination for free-mobility migrants. For several EU/EFTA countries
free-movement migration accounts for a sizeable portion of their permanent inflows
– reaching three-quarters of total inflows in Switzerland and Austria.
● Flows of humanitarian migrants have declined by about 6% in 2012. This has mostly
resulted from decreased flows to the United States, to Canada and to the Netherlands.
Settlement countries1 receive the majority of resettled refugees – hosting 68% of such
flows into the OECD – while the rest are mostly settled in Northern European OECD
countries. In contrast, European OECD countries host approximately three-quarters of
those migrants arriving through the asylum channel where the settlement countries
host only 16%.
● Temporary migration flows, which had been rising until 2007 when they reached a high
of 2.5 million, have since fallen. In 2012, temporary migration flows fell by 4.4% and
stood at approximately 75% of their 2007 peak. Since 2007, Working Holiday Schemes
(WHSs) and intra-corporate transfers (ICTs) have increased while migration flows of
seasonal workers have fallen by almost three-quarters, as Germany, and other European
countries, no longer require a permit for temporary workers from the last countries that
joined the EU.
INTERNATIONAL MIGRATION OUTLOOK 2014 © OECD 201418

1. RECENT DEVELOPMENTS IN INTERNATIONAL MIGRATION TRENDS
● Flows of migrants seeking asylum increased by 20% in 2013. This was primarily due to
the conflict in Syria, and indeed Syria continues to be the major origin country of asylum
seekers. On a per capita basis, Sweden is the country receiving the largest number of
both asylum seekers and refugees.
● Worldwide, the number of students enrolled outside their country of citizenship has
more than doubled since 2000, reaching 4.5 million in 2012, with 75% enrolled in an
OECD country. However, the pace of this growth has slowed, and the number of foreign
students enrolling in OECD countries increased by only 3% in 2012 compared to 8% per
annum during 2000-05 and 6% in 2005-11. More than half of all international students
arrive from Asia, with China representing 22%, followed by India. Outside Asia, the major
countries of origin are Germany and France.
● With over half a million emigrants in 2012, China maintained its position as the country
sending the largest number of migrants to OECD countries – contributing almost 10% of
all flows to the OECD. Romania (5.6%) and Poland (5.4%) also contributed substantially to
migration flows to the OECD. Indeed, relative to their population, these two countries
have much higher expatriation rates to OECD countries than China.
● Overall net migration continues to be positive among OECD countries. However, the
effects of the global slowdown have been reflected in these flows. Average net migration
has almost halved, from 4.4 persons per thousand population in 2005-08 to 2.6 persons
per thousand in 2009-12.
Recent trends in international migrationPreliminary data for 2013 suggest that permanent migration flows to the OECD have
begun to rebound, growing by 1.1% since 2012 (Table 1.1).2 This modest increase is the
consequence of counter-balancing changes in several major immigration countries.
Preliminary estimations indicate another double-digit growth in the number of migrants to
Germany. This fourth consecutive annual increase is driven largely by inflows from Central
and Eastern Europe and, to some extent, Southern Europe and takes Germany well above
400 000 immigrants in 2013. After the United States, Germany is now the OECD’s second
most important destination country, up from eighth position in 2009. Permanent migration
flows to the United States, in contrast, were 4% lower in 2013 than in 2012. And, while the
United States remains by far the OECD’s largest receiving country, for the first time in
ten years, it has received less than 1 million permanent migrants. Reflecting the ongoing
economic situation, migration flows to Italy and Spain appear to have declined rather
markedly. These countries, which were second or third largest immigration countries in
the OECD from 2007 to 2011, now hold seventh and eighth positions, even though flows to
these countries, at around 200 000 persons annually, remain substantial.
Outside of these countries, the United Kingdom saw inflows stabilise at just below
300 000 persons. Permanent migration flows rose by 3% in Australia, by 4% in New Zealand
and a small increase was also recorded in Canada. Switzerland, whose annual immigration
flows represented 1.7% of the population in 2013 – the highest among OECD countries for
which data are available – showed an annual growth in the numbers of arriving migrants
of over 8%, mainly driven by free movement migration. Inflows to Sweden also increased
again and reached a new high, primarily due to the increase in humanitarian flows. This
is likely to continue into 2014, as preliminary data show that the number of refugees
– notably from Syria – continues to rise, while other migration categories remain stable.
INTERNATIONAL MIGRATION OUTLOOK 2014 © OECD 2014 19

1. RECENT DEVELOPMENTS IN INTERNATIONAL MIGRATION TRENDS
012/07
-272
-1721
-559
28-70
3201042
-3836172645
-17-73-28-6933
209
-15
3-28-24
..
..
..
..
2616
-1023
-62-43-8..
-70-45
......
s whountries
157778
Table 1.1. Inflows of permanent immigrants into selected OECD countries, 2007-13
2007 2008 2009 2010 2011 2012 2013Variation (%)
2013/12 2012/11 2
Standardised statisticsUnited States 1 052 400 1 107 100 1 130 200 1 041 900 1 061 400 1 031 000 989 900 -4 -3Germany 232 900 228 300 201 500 222 500 290 800 399 900 .. .. 38United Kingdom 343 300 317 300 359 200 394 800 322 600 286 100 291 000 2 -11France 213 700 222 400 221 400 233 700 240 700 258 900 .. .. 8Italy 571 900 490 400 390 300 355 700 317 300 258 400 .. .. -19Canada 236 800 247 200 252 200 280 700 248 700 257 900 258 600 0 4Australia 191 900 205 900 221 000 208 500 219 500 245 100 253 500 3 12Spain 691 900 409 600 334 100 300 000 291 000 209 800 .. .. -28Switzerland 122 200 139 100 114 800 115 000 124 300 125 600 136 200 8 1Netherlands 80 600 90 600 89 500 95 600 105 600 | 96 800 105 500 9 -8Sweden 74 400 71 000 71 500 65 600 71 800 81 700 86 700 6 14Austria 47 100 49 500 45 700 45 900 58 400 | 67 100 65 000 -3 15Japan 108 500 97 700 65 500 55 700 59 100 66 800 63 600 -5 13Norway 43 900 49 300 48 900 56 800 61 600 59 900 .. .. -3Belgium 50 300 51 200 64 500 61 500 61 800 58 900 .. .. -5Korea 44 200 39 000 36 700 51 100 56 900 55 500 66 700 20 -2Denmark 30 300 45 600 38 400 42 400 41 300 43 800 52 400 20 6New Zealand 51 700 51 200 47 500 48 500 44 500 42 700 44 400 4 -4Ireland 120 400 89 700 50 700 23 900 33 700 32 100 40 200 25 -5Portugal 42 800 71 000 57 300 43 800 36 900 30 700 27 000 -12 -17Czech Republic 98 800 71 800 39 000 30 500 22 600 30 300 .. .. 34Finland 17 500 19 900 18 100 18 200 20 400 23 300 .. .. 14Mexico 6 800 15 100 23 900 26 400 21 700 21 000 | 54 400 159 -3Total number of persons
All countries 4 474 200 4 180 300 3 921 700 3 818 700 3 812 600 3 782 900 3 824 000 1.1 -1
Settlement countries 1 532 800 1 611 400 1 650 900 1 579 600 1 574 100 1 576 700 1 546 400 -2 0EU included above 2 615 900 2 228 300 1 981 200 1 934 100 1 914 900 1 877 800 .. .. -2EU free movements 1 215 700 899 900 734 900 739 300 831 600 929 600 .. .. 12
Annual % changeAll countries .. -7 -6 -3 -0.2 -0.8 1.1 .. ..
Settlement countries .. 5 2 -4 -0.3 0.2 -1.9 .. ..EU included above .. -15 -11 -2 -1.0 -1.9 .. .. ..EU free movements .. -26 -18 1 12 12 .. .. ..
National statistics (unstandardised)Chile 79 400 68 400 57 100 63 900 76 300 100 100 132 100 32 31Poland 40 600 41 800 41 300 41 100 41 300 47 100 .. .. 14Hungary 22 600 35 500 25 600 23 900 22 500 20 300 .. .. -10Luxembourg 15 800 16 800 14 600 15 800 19 100 19 400 20 000 3 2Greece 46 300 42 900 46 500 33 400 23 200 17 700 .. .. -24Slovenia 30 500 43 800 24 100 11 200 18 000 17 300 .. .. -4Israel 18 100 13 700 14 600 16 600 16 900 16 600 16 900 2 -2Slovak Republic 14 800 16 500 14 400 12 700 8 200 | 2 900 .. .. ..Iceland 9 300 7 500 3 400 3 000 2 800 2 800 3 900 39 0Estonia 2 000 1 900 2 200 1 200 1 700 1 100 1 600 45 -35Turkey .. .. .. 29 900 .. .. .. .. ..Total (except Slovenia, Turkey) 279 400 288 800 243 800 222 800 230 000 245 300 .. .. ..% change 12 3 -16 -9 3 7 .. .. ..
Note: Includes only foreign nationals; the inflows include status changes, namely persons in the country on a temporary statuobtained the right to stay on a longer-term basis. Series for some countries have been significantly revised. The total for all coin 2013 (3 824 000) results of a partial estimation. A vertical bar represents a break in the series.Source: OECD International Migration Database.
1 2 http://dx.doi.org/10.1787/888933
INTERNATIONAL MIGRATION OUTLOOK 2014 © OECD 201420

1. RECENT DEVELOPMENTS IN INTERNATIONAL MIGRATION TRENDS
Evolution of immigration since the financial crisis
While data for 2013 are not yet fully available for all OECD countries, a complete
picture is available for 2012, when flows of international migrants saw a modest fall of 0.8%
compared with 2011. After reaching a low in 2009 following the financial crisis, permanent
immigration has slowly recovered, though flows are still below the 2007 level of 4.5 million.
The high number of migrants in 2007 reflects the pre-crisis situation, but also the first
effects of the EU enlargement to Romania and Bulgaria. The numbers were temporarily
inflated by large additional numbers of migrants from these two countries recorded in
some countries, most notably in Italy. The modest fall in overall flows during 2012 reflected
the slow pace of the economic recovery as well as the situation in some EU countries and
continuing caution shown by employers in hiring overseas workers.
In Europe in 2012, flows from “third countries” (countries outside the EU area) dropped
to about 950 000, from a high of 1.4 million in 2007. And, for the first time in 2012, intra-EU
migration in Europe recorded flows equal to those from third countries. Migration from
third countries to Europe is now slightly lower than legal migration to the United States. In
settlement countries, the effects of the financial crisis on permanent migration flows are
more modest and flows since 2007 have been relatively stable, except in Australia where
migration increased more or less continuously during the past five years.
When comparing the inflows in 2012 with the previous five years (Figure 1.1), one
observes that a number of countries such as Germany, Austria, Finland and Korea, have
experienced significant growth in migration flows they receive. The declining flows to
some countries such as Spain, Italy and the United Kingdom, that have traditionally been
large recipients of international migrants, has driven down the number of international
migrants arriving in the OECD as a whole.
Figure 1.1. Change in permanent flows between 2007-11 average and 2012Percentages
Note: The average refers to the countries presented.Source: OECD International Migration Database.
1 2 http://dx.doi.org/10.1787/888933157287
-60
-40
-20
0
20
40
60
80
Irelan
d
Czech
Rep
ublic Ita
ly
Portug
alSpa
in
United
Kingdo
mJa
pan
New Ze
aland
United
States
Averag
e
Belgium
Canad
a
Switzerl
and
Netherl
ands
Denmark
Mexico
Franc
e
Norway
Sweden
Austra
liaKor
ea
Finlan
d
Austri
a
German
y
INTERNATIONAL MIGRATION OUTLOOK 2014 © OECD 2014 21

1. RECENT DEVELOPMENTS IN INTERNATIONAL MIGRATION TRENDS
Trends in the composition of migration flows
Family migration continues to account for the bulk of overall migration flows, despite an
ongoing downward trend in this category since 2008 (Figure 1.2). In 2012, family migration
dropped marginally (-1.7%) from 2011, mainly due to decreases in Spain, Italy, the
United States and the United Kingdom. Family motives continue to account for the vast
majority of migrant inflows into the United States, and are also the main category in France.
Labour migration has declined continuously since the economic downturn and fell
by 12% in 2012. The fall in labour migration has been considerable, especially among
European OECD countries, where it has fallen by almost 40% between 2007 and 2012
(Figure 1.3). This fall is largely driven by reduced inflows to Spain and Italy where economic
conditions remain unfavourable. However, even excluding these two large receiving
countries, the remaining European OECD countries have nonetheless observed a 10%
decrease since 2009. Several countries experienced an increase in the number of labour
migrants they received in 2012 including Australia and Canada where labour migrant
inflows increased by 6%, as well as Japan which showed a sharp increase of 21%.
On average, there was little change in the number of family members accompanying
workers. Interestingly, despite the reduced inflows of labour migration, family migrants
accompanying workers represent the only group whose numbers stand at a level higher
than they were in 2007.
The overall fall in labour migration, however, does not tell the full story of migration for
employment, as substantial work-related migration occurs within the framework of free
movement, as is the case in the EU. Over the past decade, several European OECD countries,
such as the United Kingdom and the southern European countries, received a large number of
migrant workers from third countries. However, when employment-related free movement
flows are taken into consideration, the magnitude of migration for employment reasons is also
Figure 1.2. Permanent immigration in OECD countries by category of entry,standardised statistics, 2007-12
Millions
Note: Excludes the Czech Republic and the countries for which standardised data are not available (see Table 1.1).Source: OECD International Migration Database.
1 2 http://dx.doi.org/10.1787/888933157291
2007 2008 2009 2010 2011 2012
0
0.2
0.4
0.6
0.8
1.0
1.2
1.4
1.6
Work Family Humanitarian Other Free movementsAccompanyingfamily of workers
INTERNATIONAL MIGRATION OUTLOOK 2014 © OECD 201422

1. RECENT DEVELOPMENTS IN INTERNATIONAL MIGRATION TRENDS
significant in a number of other European countries that receive little non-EU/EFTA labour
migration (see Figure 3.1 in Chapter 3). This is the case in Austria, Germany, Ireland, Belgium
and Denmark but also, and especially in the non-EU countries of Switzerland and Norway. In
the traditional settlement countries of Canada, Australia and New Zealand, about 25% of
inflows of permanent migrants are primary applicants under the economic, skill or
employment channels.3
Mobility within the EU/EFTA zone greatly increased following the EU enlargements
of 2004 and 2007. Furthermore, the expansion of the EU has added to labour markets’
adjustment capacity and recent estimates suggest that as much as a quarter of the
asymmetric labour market shock – that is occurring at different times and with different
intensities across countries – may have been absorbed by migration within a year (Jauer
et al., 2014).
The key driver of current inflows is the rebound, observed since 2010, in free-movement
migration, with an increase of 12% in 2012. Much of this is driven by Germany, which has
risen to become the single most important destination for free-mobility migrants. Within the
EU/EFTA, Germany alone receives almost a third of all free-movement flows, followed by
Spain and Italy. For several EU/EFTA countries, such as Switzerland, Austria, Germany,
Ireland, and the Netherlands, free movement accounts for the vast majority, over two-thirds,
of permanent inflows. Elsewhere, free movement of citizens between Australia and
New Zealand under the Trans-Tasman Travel Agreement, sees Australia receiving more
migrants than New Zealand.
Looking at migration flows relative to the total population, in 2012, OECD countries
received on average about six permanent migrants for every thousand persons in the
population (Figure 1.4). For some large countries such as Mexico and Japan, this figure
remains low at less than one migrant per thousand, while for many countries in Europe as
well, as in the settlement countries it is above the average. Switzerland, a large recipient
of free movement flows, stands apart with almost 16 migrant entries per thousand
population, followed by Norway.
Figure 1.3. Labour migration to EuropeThousands
Source: OECD International Migration Database.1 2 http://dx.doi.org/10.1787/888933157309
0
100
200
300
400
500
600
2007 2008 2009 2010 2011 2012
EU OECD countries + Switzerland + Norway Without Spain and Italy
INTERNATIONAL MIGRATION OUTLOOK 2014 © OECD 2014 23

1. RECENT DEVELOPMENTS IN INTERNATIONAL MIGRATION TRENDS
The EU/OECD (based on the countries for which data are available), taken as a whole
– i.e. excluding intra-EU movements – received 2.5 permanent migrants per thousand
population, while in the United States, this ratio stood at 3.2.
In 2012, humanitarian migration flows declined by 6% in the OECD area. This decrease
was largely driven by decreases seen in the United States, Canada and the Netherlands. In
contrast, Sweden witnessed its third consecutive rise in humanitarian migration absorbing
1 800 humanitarian migrants per million inhabitants. Norway and Canada also admitted a
large number of humanitarian migrants, absorbing 1 150, and 920, humanitarian migrants
per million inhabitants respectively – this is well above the OECD average of 455.4
Humanitarian migrants in settlement countries are largely made up of resettled refugees.
Indeed, settlement countries account for 68% of such flows into the OECD, with the
remainder mostly going to Northern European OECD countries. However, when it comes to
those migrants who obtained humanitarian status through the asylum channel, European
OECD countries account for around three-quarters of the total, and the settlement
countries account only for 16%.5
Temporary labour migration
Temporary labour migration is a much larger phenomenon than permanent labour
migration and tends to reflect the prevailing economic conditions and short-term changes
in demand for labour and skills. Flows, which had been rising through the 2000s, reached a
high of 2.5 million in 2007 and have fallen since then. In 2012, such flows stood at just 75%
of their 2007 peak; they fell by 4.4% in 2012 (Table 1.2).6 The sharp decline in the number of
seasonal workers is mainly due to the end of the registration of seasonal workers from the
new EU member states in the temporary labour migration statistics.
Figure 1.4. Permanent immigration by category of entry or of status changeinto selected OECD countries, 2012
Percentage of the total population
Source: OECD International Migration Database.1 2 http://dx.doi.org/10.1787/888933157312
0
0.2
0.4
0.6
0.8
1.0
1.2
1.4
1.6
Other Free movementHumanitarian
Work Accompanying family of workers
2011 total
Family
Mexico
Japa
nKor
ea
EU-O
ECD
Portug
al
United
States
Franc
eIta
ly
Finlan
d
United
Kingdo
m
German
y
Belgium
Netherl
ands
Spain
OECD av
erag
e
Irelan
d
Canad
a
Denmark
Austri
a
Sweden
New Ze
aland
Austra
lia
Norway
Switzerl
and
INTERNATIONAL MIGRATION OUTLOOK 2014 © OECD 201424

1. RECENT DEVELOPMENTS IN INTERNATIONAL MIGRATION TRENDS
The situation in 2012 compared with previous years shows some shifts across entry
categories as well as within countries. The Working Holiday Schemes (WHSs) – more
established in the traditional settlement countries – have the primary objective of fostering
cultural connections and international goodwill by providing short-term work for young
people. The settlement countries account for the bulk of these young global holiday makers
– around 90% between 2007-12 – with the remainder going largely to the United Kingdom
and Japan. The flows of WHS workers have increased by 10% (38 000) from 2007, however,
more than half of this increase is driven by increased WHS flows to Australia. Over the same
period, an increase of 82% was observed in Canada and of 43% in New Zealand. In contrast,
the United States – the main destination country in this category in 2007 – has experienced a
decrease in the number of WHS entries from 148 000 in 2007 to 80 000 in 2012.7
Seasonal workers, who numbered over half a million in 2007, have fallen by 64%
between 2007 and 2012. The main reason behind this substantial drop is the fact that seasonal
workers from new EU countries no longer require a permit to work in EU countries (in
particular Germany). Further, two of those countries that, previously, received large numbers of
seasonal labour migrants from outside of the EU – Italy and Spain – now each receive less than
10 000 annually. In other OECD countries, seasonal worker flows were stable.
Table 1.2. Temporary-type labour migration, by category, 2007-12
2007 2008 2009 2010 2011 2012 2012/11 2012/07 2012/07
Thousands Change (%)Index = 100
in 2007
Intra-company transfers OECD total 110 117 106 124 130 126 -3 15 115
United States 85 84 65 75 71 62 -12 -26 74
United Kingdom .. .. 13 18 21 23 8 72 172
Canada 9 10 10 14 13 14 .. 47 147
Australia .. 7 6 4 8 10 23 46 146
Germany 5 6 4 6 7 7 2 33 133
Seasonal workers OECD total 571 577 520 505 356 203 -43 -64 36
United States 51 64 60 56 55 65 18 29 129
Canada 23 28 23 24 25 25 4 13 113
Mexico 28 23 31 29 28 23 -16 -16 84
Finland 14 12 13 12 12 14 17 .. 100
Belgium 17 20 5 6 6 10 60 -39 61
Trainees OECD total 164 146 114 108 114 117 2 -29 71
Japan 102 102 80 78 82 86 4 -16 84
Korea 14 14 11 12 13 12 -8 -14 86
Germany 5 5 5 5 5 4 -17 -15 85
Australia 6 5 5 4 3 4 10 -40 60
United States 3 3 2 2 2 3 39 -5 95
Working holiday makers OECD total 397 431 423 419 414 435 5 10 110
Australia 135 154 188 176 185 215 16 59 159
United States 148 153 116 118 98 80 -18 -46 54
Canada 32 41 45 50 55 59 8 82 182
New Zealand 36 40 41 45 45 51 13 43 143
United Kingdom 39 35 25 21 21 20 -5 -50 50
Other temporary workers OECD total 1 285 1 234 928 913 945 992 5 -23 77
Total 2 526 2 505 2 091 2 069 1 958 1 873 -4 -26 74
Note: The table includes all the countries for which standardised data are available (see Table 1.1) except theCzech Republic.Source: OECD International Migration Database.
1 2 http://dx.doi.org/10.1787/888933157785
INTERNATIONAL MIGRATION OUTLOOK 2014 © OECD 2014 25

1. RECENT DEVELOPMENTS IN INTERNATIONAL MIGRATION TRENDS
Intra-company transfers (ICTs) have increased by 15% since 2007, indicating sustained
global business demand for specific skills. The United States continues to be the major
destination for such transfer workers, although the number of entries declined slightly
in 2012. Europe has seen approximately 16 500 ICT entries in 2012 – corresponding to about
4% of temporary migrant workers. In 2014, the EU adopted a council directive (2010/0209)
that aims, among other objectives, at facilitating the temporary assignment of highly-
skilled employees of international companies to subsidiaries situated in the EU. The
United Kingdom, which is one of the main destinations for ICT workers, did not opt into
the EU directive.
Asylum seeking
In 2013, 556 000 persons sought asylum in the OECD, a 20% increase from the previous
year (Table 1.3). This growth in the numbers of asylum seekers stems mostly from the
continuing situation in Syria. Not surprisingly Syria, with 47 800 asylum seekers, overtook
Afghanistan (34 500) as the major country of origin of asylum seekers. At the same time,
the number of asylum seekers from the Russian Federation, Iraq, Afghanistan and Serbia
(and Kosovo) has increased considerably, and levels originating from these countries now
reach approximately 35-40 000 each.
Germany has emerged as the world’s largest single recipient of new asylum claims
and, in 2013, recorded its sixth consecutive annual increase. The main origin countries of
asylum seekers in Germany were the Russian Federation, Serbia (and Kosovo) and Syria.
Following Germany, the United States, France, Sweden and Turkey also received a large
number of asylum seekers. The number of asylum seekers has increased substantially in
Turkey as a result of the arrival of asylum seekers from Iraq, Afghanistan and Iran. Hungary
also saw significant increase in the number of asylum seekers, recording 18 900 asylum
applications in 2013, eight times as many as in 2012. Most of these were from Serbia (and
Kosovo), Pakistan and Afghanistan.
When comparing asylum inflows on a per capita basis, all major receiving countries
are in Europe, namely Sweden, Luxembourg, Switzerland, Austria, Norway and Denmark.
Sweden – with about 5 700 asylum seekers per million of the population – hosts the most
asylum seekers on a per capita basis, with most asylum seekers coming from Syria, Eritrea
and Somalia. While typically the smaller countries have had the highest per capita asylum
flows, two large countries – Germany (1 340) and France (950) – host more than the OECD
average of 830 asylum seekers per million inhabitants.
Preliminary data for the first five months of 2014 suggest that some of the countries
receiving the largest numbers of asylum seekers are receiving substantially more asylum
seekers than in the same period the previous year. Much of this is due to the conflict in
Syria which started in 2011. During this 5-month period, Germany has received 53 600
(about 20% of whom are from Syria), followed by the United States (30 560), France (24 400),
Sweden (23 800), and Turkey (19 300). Syria now accounts for about 15% of asylum flows
directed to the OECD (Figure 1.5).
International students
Movements of international students continue to attract policy attention in many
OECD countries, and represent a growing source of skilled labour migration. Indeed, in
contrast to both permanent migration and temporary labour migration, international
mobility of students has been steadily increasing since 2000 (Figure 1.6). Worldwide, the
INTERNATIONAL MIGRATION OUTLOOK 2014 © OECD 201426

1. RECENT DEVELOPMENTS IN INTERNATIONAL MIGRATION TRENDS
sylum
nistan
, Syria
ia
o,
ia
vina,
public
n
ion
deration
n
cases)
157793
Table 1.3. Inflows of asylum seekers by country of destination, 2009-13
Average2009-12
2012 2013Absolutechange2012-13
% change2012-13
Asylumseekers
per millionpopulation
(2013)
Permanenthumanitarian
migrantsper millionpopulation
(2012)
Top three countries of origin of the aseekers (2013)
Germany 44 815 64 540 109 580 45 040 70 1 337 221 The Russian Federation, Serbia(and Kosovo), Syria
United States 51 935 66 100 68 240 2 140 3 217 480 China, Mexico, El Salvador
France 49 352 55 070 60 230 5 160 9 948 188 Serbia (and Kosovo), the DemocraticRepublic of the Congo, Albania
Sweden 32 385 43 880 54 260 10 380 24 5 700 1 823 Syria, Eritrea, Somalia
Turkey 14 888 26 470 44 810 18 340 69 596 .. Iraq, Afghanistan, Iran
United Kingdom 26 799 27 980 29 400 1 420 5 461 179 Pakistan, Iran, Sri Lanka
Italy 19 781 17 350 25 720 8 370 48 432 101 Pakistan, Nigeria, Somalia
Switzerland 18 728 25 950 19 440 -6 510 -25 2 457 532 Eritrea, Syria, Nigeria
Hungary 2 657 2 160 18 570 16 410 760 1 871 .. Serbia (and Kosovo), Pakistan, Afgha
Austria 14 666 17 410 17 500 90 1 2 076 485 The Russian Federation, Afghanistan
Netherlands 12 373 9 660 14 400 4 740 49 859 638 Somalia, Syria, Iraq
Poland 7 844 9 170 13 760 4 590 50 357 .. The Russian Federation, Georgia, Syr
Belgium 20 867 18 530 12 500 -6 030 -33 1 123 273 The Democratic Republic of the CongGuinea, Syria
Australia 10 436 15 790 11 740 -4 050 -26 517 605 China, India, Pakistan
Norway 11 532 9 790 11 470 1 680 17 2 285 1 141 Eritrea, Somalia, Syria
Canada 25 430 20 220 10 360 -9 860 -49 297 917 China, Pakistan, Colombia
Greece 11 272 9 580 8 220 -1 360 -14 742 .. Pakistan, Afghanistan, Bangladesh
Denmark 4 695 6 190 7 560 1 370 22 1 351 462 Syria, the Russian Federation, Somal
Spain 2 936 2 580 4 510 1 930 75 98 11 Mali, Syria, Algeria
Japan 1 751 2 550 3 260 710 28 26 1 Turkey, Nepal, Myanmar
Finland 3 984 2 920 3 020 100 3 558 774 Iraq, the Russian Federation, Nigeria
Israel 2 500 2 000 .. .. .. 253 .. Côte d’Ivoire, South Sudan, Eritrea
Korea 726 1 140 1 570 430 38 31 .. Syria, Pakistan, Nigeria
Mexico 821 810 1 300 490 60 11 3 Honduras, El Salvador, Cuba
Luxembourg 1 325 2 000 990 -1 010 -51 1 863 .. Serbia (and Kosovo), Bosnia-HerzegoMontenegro
Ireland 1 715 940 940 0 0 205 24 Nigeria, Pakistan, the Democratic Reof the Congo
Portugal 218 300 510 210 70 48 5 Syria, Guinea, Nigeria
Czech Republic 961 750 500 -250 -33 48 .. Syria, Ukraine, the Russian Federatio
New Zealand 326 320 290 -30 -9 65 692 Sri Lanka, Fiji, Iran
Slovak Republic 647 730 280 -450 -62 52 .. Afghanistan, Somalia, Eritrea
Chile 183 170 250 80 47 14 .. Colombia, Syria
Slovenia 277 310 240 -70 -23 118 .. Syria, Serbia (and Kosovo), Pakistan
Iceland 69 110 170 60 55 539 .. Croatia, Albania, Iraq
Estonia 53 80 100 20 25 73 .. Viet Nam, Syria, the Russian Federat
OECD total 396 444 461 530 555 690 94 140 20 830 455 Syria, the Russian Federation, Iraq
Selectednon-OECDcountries
Bulgaria 1 000 1 230 6 980 5 750 467 966 .. Syria, Algeria, Afghanistan
Malta 1 613 2 060 2 200 140 7 5 135 .. Somalia, Eritrea, Syria
Romania 1 574 2 510 1 500 -1 010 -40 69 .. Syria, Iraq, Pakistan
Lithuania 379 530 280 -250 -47 91 .. Georgia, Afghanistan, the Russian Fe
Latvia 159 190 190 0 0 90 .. Georgia, Syria, the Russian Federatio
Note: Figures for the United States refer to “affirmative” claims submitted with the Department of Homeland Security (number ofand “defensive” claims submitted to the Executive Office for Immigration Review (number of individuals).Source: UNHCR.
1 2 http://dx.doi.org/10.1787/888933
INTERNATIONAL MIGRATION OUTLOOK 2014 © OECD 2014 27

1. RECENT DEVELOPMENTS IN INTERNATIONAL MIGRATION TRENDS
Figure 1.5. New Syrian asylum seekers in 44 industrialised countriesby quarter, 2011-14
Thousands
Note: The 44 countries are the 28 member states of the EU, Albania, Bosnia and Herzegovina, Iceland, Liechtenstein,Montenegro, Norway, Serbia (and Kosovo), Switzerland, the Former Yugoslav Republic of Macedonia (FYROM), Turkey,Australia, Canada, Japan, New Zealand, Korea and the United States. This group of 44 countries received anestimated 612 700 new asylum applications in 2013.Source: UNHCR.
1 2 http://dx.doi.org/10.1787/888933157329
Figure 1.6. Foreign students worldwide and in OECD countries, 2000-12Millions
Note: Note that Figure 1.6 refers to foreign students, that is, students of foreign nationality, which is not necessarilythe same as international students who are defined as students who are those who left their country of origin andmoved to another country to study. Unfortunately, data on international students are not available for most countriesbefore 2008.Source: OECD, Education Database.
1 2 http://dx.doi.org/10.1787/888933157337
2011 2012 2013 2014
0
5
10
15
20
25
Q1 Q2 Q3 Q4 Q1 Q2 Q3 Q4 Q1 Q2 Q3 Q4 Q1
2000 2001 2002 2003 2004 2005 2006 2007 2008 2009 2010 2011 2012
1.6 1.6 1.9 2.1 2.3 2.4 2.4 2.5 2.6 2.8 3.2 3.3 3.4
2.1 2.1 2.4 2.6 2.8 3.0 3.1 3.2 3.5 3.8 4.2 4.4 4.5
Worldwide OECD countries
INTERNATIONAL MIGRATION OUTLOOK 2014 © OECD 201428

1. RECENT DEVELOPMENTS IN INTERNATIONAL MIGRATION TRENDS
number of students enrolled outside their country of citizenship has more than doubled
since 2000, reaching 4.5 million in 2012. The share of those enrolled in an OECD country
remained relatively stable and stood at 75% in 2012.
However, the pace of growth seems to be slowing down. The number of international
students in OECD countries increased by only 3% in 2012 (Table 1.4), in comparison with
average annual growth rates of 8% between 2000 and 2005, and 6% between 2005 and 2011.
Table 1.4. International tertiary-level students in OECD countries, 2012
International/foreign students Foreign students
Category 2012Change
from 2011(%)
Share in totaltertiary
enrolment2012(%)
Marketshare 2012
(%)
Differencewith 2000(% points)
Shareof students
fromOECD countries
2012(%)
Differencewith 2004(% points)
Australia International 249 588 -5.0 18.3 5.5 0.45 12.6 -0.6
Austria International 58 019 9.4 15.4 1.7 0.24 72.5 3.9
Belgium International 42 926 13.4 9.0 1.2 -0.62 67.6 7.8
Canada International 120 960 13.8 8.2 4.9 0.37 24.1 0.3
Chile International 3 461 17.8 0.3 0.3 0.11 10.1 10.1
Czech Republic Foreign 39 455 3.7 9.0 0.9 0.61 73.1 9.3
Denmark International 22 363 10.4 8.1 0.7 0.10 62.7 2.1
Estonia International 1 573 10.0 2.3 0.1 0.02 37.6 ..
Finland International 15 636 10.7 5.1 0.4 0.12 27.9 -12.3
France Foreign 271 399 1.2 11.8 6.0 -0.57 23.3 -0.9
Germany International 184 594 4.5 .. 6.3 -2.61 47.5 1.0
Greece Foreign 29 012 -11.6 4.4 0.6 0.23 6.2 3.6
Hungary International 17 520 6.4 4.6 0.4 -0.03 53.7 5.7
Iceland International 971 -11.6 5.1 0.0 0.01 80.3 10.6
Ireland International 11 100 -12.6 5.8 0.6 0.26 52.6 ..
Israel Foreign 4 506 14.2 1.2 0.1 .. 86.0 ..
Italy Foreign 77 732 5.8 4.0 1.7 0.52 20.5 -20.3
Japan International 136 215 -1.7 3.5 3.3 0.14 19.7 -3.6
Korea Foreign 59 472 -5.1 1.8 1.3 1.15 5.8 -9.9
Luxembourg International 2 468 10.9 40.6 0.1 0.04 80.3 ..
Mexico Foreign .. .. .. 0.0 -0.07 .. ..
Netherlands International 57 509 49.9 7.2 1.4 0.71 71.6 11.2
New Zealand International 40 994 0.3 15.8 1.6 1.22 31.4 11.1
Norway International 3 956 16.1 1.7 0.4 -0.01 49.1 -4.3
Poland International 23 525 13.6 1.2 0.6 0.28 36.0 9.1
Portugal International 18 525 38.7 4.7 0.6 0.10 32.1 12.3
Slovak Republic International 9 059 3.6 4.1 0.2 0.13 84.7 30.8
Slovenia International 2 357 19.3 2.3 0.1 0.04 14.9 ..
Spain International 55 759 -11.0 2.8 2.2 0.21 34.7 -2.8
Sweden International 28 629 -21.6 6.3 0.9 -0.29 43.2 -30.3
Switzerland International 44 468 6.4 16.5 1.4 0.17 70.9 -2.8
Turkey Foreign 38 590 24.0 0.9 0.9 0.01 14.5 -0.8
United Kingdom International 427 686 1.8 17.1 12.6 1.88 37.3 -7.3
United States International 740 475 4.4 3.5 16.4 -6.41 28.0 -8.3
OECD 2 840 502 3.1 7.6 75.4 -1.52 33.6 -2.2
Source: OECD, Education Database.1 2 http://dx.doi.org/10.1787/888933157808
INTERNATIONAL MIGRATION OUTLOOK 2014 © OECD 2014 29

1. RECENT DEVELOPMENTS IN INTERNATIONAL MIGRATION TRENDS
Where the Netherlands, Portugal and Turkey observed considerable increase of their
international student population in 2012, the number in Sweden declined by more than
20%. And, while it remains a large destination country for international students, the
number studying in Australia also declined by 5%. In contrast, the number of international
students studying in Canada and the United States increased by 14% and 4% respectively
and France and the United Kingdom also saw increases, of 1.2% and 1.8%, respectively.
In spite of the increase in international students studying in the United States, its share
in the global market for international tertiary education has dropped significantly since 2000
– standing at just 16% in 2012. Nevertheless, the United States, followed by the
United Kingdom, continues to be the most popular destination for international students.
Apart from the United States, all English-speaking OECD countries and Spain have increased
their global market share, whereas that of France, Germany and Japan has declined.
International students account, on average, for around 8% of all tertiary students in
OECD countries. This share varies widely, ranging from 1% in Poland to over 40% in
Luxembourg. International students represent between 15% and 20% of the overall student
population in Australia, the United Kingdom, Switzerland, New Zealand and Austria.
More than half of international students in OECD countries come from Asia. China now
represents 22% of all international students in OECD countries, up 4 percentage points
from 2008 (Figure 1.7). India remains the second main origin country though its share has
declined to under 6%. Saudi Arabia on the other hand, has seen its contribution to the
international student population double in four years and, in 2012, had more than
50 000 citizens studying in OECD countries – more than half of them in the United States.
The main non-Asian countries sending international students are Germany and France.
Overall, 30% of all international students in OECD countries are from another OECD country.
This proportion remains virtually unchanged since 2008.
Figure 1.7. Main countries of origin of the international students in tertiaryeducation of OECD countries, 2008 and 2012
Percentages
Source: OECD, Education Database.1 2 http://dx.doi.org/10.1787/888933157349
2008 2012
0
5
10
15
20
25
China
India
German
yKor
ea
Franc
e
Saudi
Arabia
Viet N
am
Malays
ia
United
States Ita
ly
Canad
a
Morocc
o
Russia
n Fed
eratio
n
Slovak
Rep
ublic
Japa
n
INTERNATIONAL MIGRATION OUTLOOK 2014 © OECD 201430

1. RECENT DEVELOPMENTS IN INTERNATIONAL MIGRATION TRENDS
Origin country of international migrants
Turning to the origin of all international migrants to the OECD, China remains the
country sending the largest number of international migrants. With a little over half a
million emigrants, China contributed 9.6% of all flows in 2012 (Table 1.5). As almost every
fifth person in the world is a Chinese, it is thus still underrepresented among migration flows
to the OECD. India, the second most populated country, accounts for a much smaller
percentage than China in total migration flows to the OECD (4.3%). This percentage goes
down to 2.3% in the case of the United States, the third most populated country.
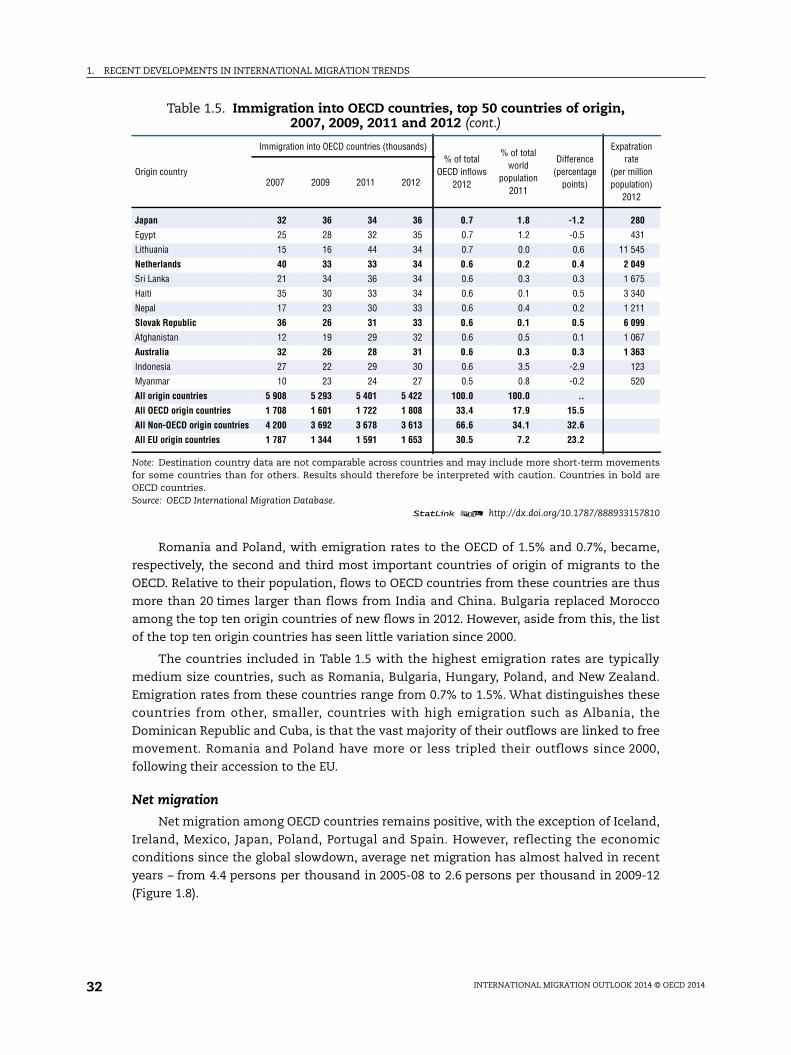
Table 1.5. Immigration into OECD countries, top 50 countries of origin,2007, 2009, 2011 and 2012
Origin country
Immigration into OECD countries (thousands)% of total
OECD inflows2012
% of totalworld
population2011
Difference(percentage
points)
Expatrationrate
(per millionpopulation)
2012
2007 2009 2011 2012
China 520 463 531 507 9.6 19.4 -9.9 375
Romania 557 274 310 294 5.6 0.3 5.2 14 664
Poland 339 221 277 284 5.4 0.6 4.8 7 372
India 213 229 243 228 4.3 17.7 -13.4 184
Mexico 164 180 162 166 3.1 1.6 1.5 1 372
Philippines 169 164 161 159 3.0 1.3 1.7 1 648
United States 117 133 137 123 2.3 4.5 -2.2 393
United Kingdom 149 129 108 111 2.1 0.9 1.2 1 739
Germany 150 126 116 106 2.0 1.2 0.8 1 313
Bulgaria 87 67 98 101 1.9 0.1 1.8 13 857
Italy 66 73 85 99 1.9 0.9 1.0 1 668
France 82 93 96 97 1.8 0.9 0.9 1 475
Morocco 152 143 112 96 1.8 0.5 1.4 2 965
Viet Nam 89 77 95 94 1.8 1.3 0.5 1 054
Hungary 37 43 68 87 1.6 0.1 1.5 8 788
Pakistan 75 77 106 86 1.6 2.5 -0.9 479
Russian Federation 68 68 71 77 1.4 2.1 -0.6 536
Spain 24 40 52 75 1.4 0.7 0.8 1 609
Korea 72 79 71 70 1.3 0.7 0.6 1 408
Peru 110 78 68 69 1.3 0.4 0.9 2 311
Brazil 108 84 69 66 1.2 2.8 -1.6 331
Colombia 89 72 68 65 1.2 0.7 0.6 1 368
Ukraine 110 81 68 64 1.2 0.7 0.5 1 405
Dominican Republic 50 66 65 63 1.2 0.1 1.0 6 096
Portugal 60 43 50 60 1.1 0.2 1.0 5 730
Turkey 60 64 63 60 1.1 1.1 0.1 805
Thailand 48 47 53 59 1.1 1.0 0.1 877
New Zealand 42 43 44 54 1.0 0.1 1.0 12 138
Greece 14 15 39 52 1.0 0.2 0.8 4 683
Cuba 45 53 51 46 0.9 0.2 0.7 4 094
Iran 28 44 45 45 0.8 1.1 -0.2 587
Nigeria 38 46 39 44 0.8 2.3 -1.5 260
Iraq 33 49 48 43 0.8 0.5 0.4 1 323
Canada 35 37 43 42 0.8 0.5 0.3 1 205
Bangladesh 35 51 50 42 0.8 2.2 -1.4 270
Algeria 43 42 39 40 0.8 0.5 0.2 1 038
Serbia 27 27 33 39 0.7 0.1 0.6 5 354
Albania 66 71 39 37 0.7 0.0 0.6 13 179
INTERNATIONAL MIGRATION OUTLOOK 2014 © OECD 2014 31
1. RECENT DEVELOPMENTS IN INTERNATIONAL MIGRATION TRENDS
Romania and Poland, with emigration rates to the OECD of 1.5% and 0.7%, became,
respectively, the second and third most important countries of origin of migrants to the
OECD. Relative to their population, flows to OECD countries from these countries are thus
more than 20 times larger than flows from India and China. Bulgaria replaced Morocco
among the top ten origin countries of new flows in 2012. However, aside from this, the list
of the top ten origin countries has seen little variation since 2000.
The countries included in Table 1.5 with the highest emigration rates are typically
medium size countries, such as Romania, Bulgaria, Hungary, Poland, and New Zealand.
Emigration rates from these countries range from 0.7% to 1.5%. What distinguishes these
countries from other, smaller, countries with high emigration such as Albania, the
Dominican Republic and Cuba, is that the vast majority of their outflows are linked to free
movement. Romania and Poland have more or less tripled their outflows since 2000,
following their accession to the EU.
Net migration
Net migration among OECD countries remains positive, with the exception of Iceland,
Ireland, Mexico, Japan, Poland, Portugal and Spain. However, reflecting the economic
conditions since the global slowdown, average net migration has almost halved in recent
years – from 4.4 persons per thousand in 2005-08 to 2.6 persons per thousand in 2009-12
(Figure 1.8).
Japan 32 36 34 36 0.7 1.8 -1.2 280
Egypt 25 28 32 35 0.7 1.2 -0.5 431
Lithuania 15 16 44 34 0.7 0.0 0.6 11 545
Netherlands 40 33 33 34 0.6 0.2 0.4 2 049
Sri Lanka 21 34 36 34 0.6 0.3 0.3 1 675
Haiti 35 30 33 34 0.6 0.1 0.5 3 340
Nepal 17 23 30 33 0.6 0.4 0.2 1 211
Slovak Republic 36 26 31 33 0.6 0.1 0.5 6 099
Afghanistan 12 19 29 32 0.6 0.5 0.1 1 067
Australia 32 26 28 31 0.6 0.3 0.3 1 363
Indonesia 27 22 29 30 0.6 3.5 -2.9 123
Myanmar 10 23 24 27 0.5 0.8 -0.2 520
All origin countries 5 908 5 293 5 401 5 422 100.0 100.0 ..
All OECD origin countries 1 708 1 601 1 722 1 808 33.4 17.9 15.5
All Non-OECD origin countries 4 200 3 692 3 678 3 613 66.6 34.1 32.6
All EU origin countries 1 787 1 344 1 591 1 653 30.5 7.2 23.2
Note: Destination country data are not comparable across countries and may include more short-term movementsfor some countries than for others. Results should therefore be interpreted with caution. Countries in bold areOECD countries.Source: OECD International Migration Database.
1 2 http://dx.doi.org/10.1787/888933157810
Table 1.5. Immigration into OECD countries, top 50 countries of origin,2007, 2009, 2011 and 2012 (cont.)
Origin country
Immigration into OECD countries (thousands)% of total
OECD inflows2012
% of totalworld
population2011
Difference(percentage
points)
Expatrationrate
(per millionpopulation)
2012
2007 2009 2011 2012
INTERNATIONAL MIGRATION OUTLOOK 2014 © OECD 201432

1. RECENT DEVELOPMENTS IN INTERNATIONAL MIGRATION TRENDS
Increases in net migration between these two periods have been particularly strong in
the Netherlands, Germany, Finland, Belgium, Denmark, Sweden, Norway and Luxembourg.
Luxembourg, experiencing one of the fastest rates of population growth, records very high
net migration rates: 16 persons per thousand population per year. Germany, now the
second most important destination for permanent migration in the OECD, saw its net
migration increase from close to zero in 2005-08 to 370 000 in 2012.
Migration has a negative contribution to the demographic growth in Mexico, Poland
and Japan. The former two, as a consequence of being next to a large prosperous neighbour
or within a free movement area are characterised by relatively large emigration flows. But
both countries have seen the magnitude of migration-related population losses reduce,
with fewer migrants leaving and more coming. Iceland and Ireland also have a negative net
migration rate of around 0.6%; this largely reflects the impact of the global economic crisis.
Some southern European countries (Greece, Portugal and Spain), whose inflows have been
consistently decreasing since the financial crisis, now have negative net migration, or net
migration close to zero.
Notes
1. Australia, Canada, New Zealand and the United States.
2. These preliminary results are to be taken with caution, as they are based on partial data, and/orestimations for a number of countries. Preliminary data or estimates based on partial data for 2013are available for 21 countries representing 93% of the migration flows to the OECD area.
3. For more information on the labour component of free-movement migration, please refer toChapter 3.
Figure 1.8. Average annual net migration rates, 2005-08 and 2009-12Per thousand population
Note: When 2012 data was not available, the 2009-12 average refers to the average from 2009 to the most recentavailable year.Source: OECD International Migration Database.
1 2 http://dx.doi.org/10.1787/888933157350
2005-08 2009-12
-7.5
-5.0
-2.5
0
2.5
5.0
7.5
10.0
12.5
15.0
17.5
Mexico
Netherl
ands
Poland
Japa
n
German
yChil
e
Slovak
Rep
ublic
Franc
e
Portug
al
Hunga
ry
New Ze
aland
Finlan
d
United
States
Denmark
Greece
Austri
a
OECD av
erag
e
Belgium
Sweden
Czech
Rep
ublic Ita
ly
Norway
Canad
a
Switzerl
and
Austra
lia
Irelan
d
Icelan
d
Luxe
mbourg
Spain
INTERNATIONAL MIGRATION OUTLOOK 2014 © OECD 2014 33

1. RECENT DEVELOPMENTS IN INTERNATIONAL MIGRATION TRENDS
4. Australia’s total number of visas granted in 2012-13 under the offshore resettlement component ofthe programme rose by 87% on the previous year to 12 500. A further 7 500 visa grants were madeunder the onshore protection component for asylum seekers.
5. Note that there is generally a time-lag between asylum seeking and the status grant of ahumanitarian migrant. The rising inflows of asylum seekers to European OECD countries in 2012may induce an increase in humanitarian migration in the following years.
6. Assuming there was no change in numbers in the countries for which full 2012 data are notavailable. Countries covered are those for which permit data are available (see Table 1.1) except theCzech Republic.
7. The reduction in the United States coincides with policy changes aimed at tightening proceduresto ensure programme integrity and reduce impact on domestic workers as well as increaseprotection of participants.
INTERNATIONAL MIGRATION OUTLOOK 2014 © OECD 201434

International Migration Outlook 2014
© OECD 2014
Chapter 2
Labour market integration of immigrantsand their children: Developing, activating
and using skills1
Immigrants now account for more than 115 million people in the OECD, whichrepresents almost 10% of the total population. Their share has increased in virtuallyall OECD countries over the past decade, and children of immigrants are alsoentering the labour market in growing numbers. Against this backdrop, theintegration of immigrants and their offspring has become a prime policy objectivefor OECD countries, and a vast array of different integration policies have beenadopted over the past fifteen years. Among the various challenges for integration,perhaps the most important one is releasing the full skills potential of immigrantsand their offspring. Skills of immigrants that are not used represent a wastedresource at a time when economies are increasingly less able to afford such waste,and may also impact negatively on social cohesion.
The chapter takes stock of the broad issues involved in the labour market integrationof immigrants and their offspring from a human capital perspective, as well as of thepolicies at hand to free their full skills potential through the identification andutilisation, the activation, and the development of their skills. It builds on theextensive work of the OECD on integration issues, together with new evidence. Thechapter first identifies the main issues involved, followed by a discussion of theinstruments and policies in OECD countries along the three pillars identified by theOECD Skills Strategy – namely using, developing and activating skills.
The statistical data for Israel are supplied by and under the responsibility of the relevant Israeliauthorities. The use of such data by the OECD is without prejudice to the status of the Golan Heights,East Jerusalem and Israeli settlements in the West Bank under the terms of international law.
35

2. LABOUR MARKET INTEGRATION OF IMMIGRANTS AND THEIR CHILDREN: DEVELOPING, ACTIVATING AND USING SKILLS
Key policy findings
Immigrants make up a growing shareof the workforce in nearly all OECD countries.
There are now 115 million immigrants in the OECD, about 10% of the total population. They
entered for a wide variety of reasons, ranging from labour, humanitarian, and family-
reunification to immigrants who benefited from mobility within free movement zones.
While the share of immigrants has grown in all OECD countries – save Estonia and Israel –
the size of populations varies from over 25% of the total population in Australia,
Luxembourg, and Switzerland to less than 2% in the Asian and Latin American
OECD countries, as well as in most Central and Eastern European OECD countries.
However, a number of them with small immigrant populations – like the Central and
Eastern European Countries and Korea – are preparing themselves for larger inflows.
Others meanwhile, e.g. Southern European countries, have only recently become large-
scale immigration destinations.
New challenges are emerging relatedto the children of immigrants,…
In many countries, particularly in Europe, children of immigrants are entering the labour
market in greater numbers. In 2012, about 12.5% of all 15-year-olds had two foreign-born
parents – 50% more than a decade earlier. Their integration, particularly those whose
parents are low-educated, is a growing concern.
… the impact of the crisis…
Countries, particularly in Southern Europe, which experienced large inflows of low-skilled
labour migration, are grappling with the pressing concerns of the crisis and the long-term
employability of lesser-skilled immigrants. Indeed, the crisis hit immigrants
disproportionately hard and, of the additional 15 million unemployed in the OECD
since 2007, about 3 million, i.e. about one in five, are foreign-born.
… and the integration of highly educatedimmigrants.
Immigrants are also overrepresented at the other end of the qualification scale, and the
number of highly educated has grown by 70% over the past decade. Robust efforts are being
made to make better use of their qualifications. This is a key issue in the OECD countries
that were settled by immigration and host many highly educated immigrants, such as
INTERNATIONAL MIGRATION OUTLOOK 2014 © OECD 201436

2. LABOUR MARKET INTEGRATION OF IMMIGRANTS AND THEIR CHILDREN: DEVELOPING, ACTIVATING AND USING SKILLS
Australia, Canada, and New Zealand. It is also an emerging topic in the United States and
in European OECD countries. Countries with limited inflows until now, however, are only
just starting to consider how to integrate immigrants into the labour market and society.
The growing diversity of the immigrantpopulation poses additional challenges.
Over the past two decades, as immigration flows have become more diverse across the OECD,
integration has become a greater challenge. That diversity applies not only to immigrants’
countries of origin and destination, but to their education levels and the categories to which
they belong – labour, free movement, family reunification, and humanitarian. Migration
category is the single largest determinant of integration outcomes: while integration is more
or less immediate for labour immigrants, this is not the case for humanitarian and family
immigrants. These two groups struggle with labour market integration in all countries. The
different categories that make up immigrant populations account for most of the cross-
country differences in labour market outcomes. And even within the different categories,
there are wide disparities. While many humanitarian migrants, for example, are tertiary-
educated, a significant proportion also lacks basic qualifications. Moreover, there are specific
issues for immigrant women. Many arrive in a host country for family reasons and, in
comparison with immigrant men, are much less likely to be in employment than their
native-born peers.
The majority of immigrants are employed…
In spite of such diversity, however, most immigrants are in work. On average, the
employment rates of low-educated immigrants are actually higher than those of their
native-born peers – although households headed by such immigrants are twice as likely to
suffer from in-work poverty. In contrast, highly educated immigrants show lower
employment rates than their native-born counterparts in virtually all OECD countries.
And, even when they are employed, they are 47% more likely to be in jobs for which they
are formally over-qualified.
… but their potential is underutilised.
As a result, labour markets fail to utilise much of the potential that immigrants offer.
Qualifications and work experience from abroad, particularly non-OECD countries, are
widely undervalued. One reason is that immigrants often acquire their work experience in
different languages and labour markets, and obtain qualifications in education systems
that may perform less effectively than the host country’s. There are implications for the
transferability of skills and their value in the host-country labour market, and employers
have trouble judging them.
INTERNATIONAL MIGRATION OUTLOOK 2014 © OECD 2014 37

2. LABOUR MARKET INTEGRATION OF IMMIGRANTS AND THEIR CHILDREN: DEVELOPING, ACTIVATING AND USING SKILLS
Unlocking the skills potential of immigrants is oneof the most important issues in integration.
The underutilisation of immigrants’ skills is a waste of resources that OECD countries can
scarcely afford. Using them effectively is important if immigrants are to feel part of the
host-country society. Making use of their skills matters, too, for social cohesion and for the
acceptance of future migration by the host-country society. Effective labour market
integration has important spill-overs: it improves language learning, for example, and
enables immigrants to contribute to society at large in their host countries.
Even the children of immigrants face barriers,which extend beyond the education system.
While it might be difficult to assess the skills that immigrants have acquired abroad, the
issue should not arise when it comes to their children who have been raised and educated in
the host country. Their outcomes are widely considered an integration “benchmark”, yet
they, too, are often lower than those of natives’ children. This holds not only regarding
education outcomes, but even for labour market outcomes at given education and skills
levels. Yet, there is also evidence that education is a powerful driver in the labour market
integration of the children of immigrants – more so than for the children of the native-born.
This is due to a mix of factors such as few contactsand little knowledge of how the labour marketfunctions.
Immigrant offspring’s relatively low outcomes in the labour market relate to a series of
obstacles to full integration. They include: little contact with employers, limited access to
the networks through which many vacancies are filled, or merely a lack of knowledge
about the way the host-country labour market functions. For example, job application
covering letters and CVs tend to be highly country-specific. Mentorship programmes, such
as the large-scale programmes in Canada, Denmark, and France tackle those obstacles and
have met with some success.
A further, often underestimated, factor isdiscrimination. Immigrants make particularefforts to compensate for that challenge.
Discrimination against immigrants in the labour market is a serious issue in most
countries. While it is generally difficult to clearly assess, one clear way to measure its
extent is to examine how the labour market treats CVs that are fully equivalent to those of
native-born applicants – except for the name which indicates a migration background.
Studies have revealed a high incidence of discrimination in all 17 OECD countries in which
these were carried out. It is not uncommon that, to get an interview, candidates with an
immigrant-sounding name have to submit twice as many applications as people who have
similar qualifications and experience but a name with a native ring to it. To compensate
for this disadvantage, immigrants and their offspring work disproportionately hard to find
a job.
INTERNATIONAL MIGRATION OUTLOOK 2014 © OECD 201438

2. LABOUR MARKET INTEGRATION OF IMMIGRANTS AND THEIR CHILDREN: DEVELOPING, ACTIVATING AND USING SKILLS
The starting point for integration is to make surethat immigrants’ skills are identified throughrecognition and validation procedures which,however, are often lacking.
To integrate adult immigrants, the point of departure is to take stock of their qualifications
and skills. This first step should be designed into integration programmes which should
themselves be tailored to specific needs. The available evidence suggests that credential
recognition procedures which convert foreign degrees into their host-country equivalents
are highly valued by employers and are associated with better labour-market outcomes.
Yet, few immigrants seek to have their qualifications recognised. One reason is the lack of
transparency surrounding the procedures and the large number of actors involved,
particularly in heavy-regulated professions. Recent reforms in several OECD countries have
sought to respond by putting in place contact points that inform applicants and, ideally,
pass on their applications directly to those in charge of the recognition process. A
much broader issue than the recognition of formal qualifications is the validation of skills
– acquired both formally and informally. It is a measure from which immigrants would be
expected to benefit disproportionately, yet they are under-represented among those who
have their skills evaluated.
Immigrants with foreign qualifications often needbridging courses.
Since not all foreign qualifications are fully equivalent with domestic ones, there is often a
need for supplementary education to bring them up to the standard required in the host
country. Bridging courses meet that purpose. Such courses, a logical complement to the
growing focus on recognition and accreditation, are currently underdeveloped in most
OECD countries and should be stepped up.
Employer involvement is crucial in the recognitionand validation process.
Ultimately, however, it is up to the employer to accept the skills and qualifications of
immigrants as “equivalent”. Validation and recognition procedures should therefore
involve employers. Indeed a feature of many of the most successful integration measures
is precisely strong employer involvement.
Work experience measures help to overcomeemployer uncertainty about immigrants’ skills.
One very important issue for immigrants is to get a chance to demonstrate their skills to
employers and overcome employer resistance to hiring them. Traineeships and other
work-experience measures have proved effective, as has “temping” work – i.e. jobs
in temporary employment agencies – which can be a springboard to more stable
employment. Well-designed and carefully phased-out temporary wage subsidies can also
be a highly efficient tool for disadvantaged groups in the labour market, and the available
evidence – particularly from Denmark and Sweden – points to much greater benefits for
immigrants than for the native-born.
INTERNATIONAL MIGRATION OUTLOOK 2014 © OECD 2014 39

2. LABOUR MARKET INTEGRATION OF IMMIGRANTS AND THEIR CHILDREN: DEVELOPING, ACTIVATING AND USING SKILLS
At the same time, immigrants are oftenunderrepresented in the most effectiveprogrammes.
Yet, immigrants tend to be underrepresented in wage-subsidy schemes and in other active
labour market programmes which have proven particularly effective in enabling quick
transitions into employment. In some countries, such as Austria, Belgium, Germany,
Norway and Sweden, immigrants have become a specific target group of active labour
market policy instruments.
Many promising integration measures aresmall-scale and project-based,with little evaluation and mainstreaming.
While the bulk of integration measures are mainstream across all OECD countries, many
innovative and promising new ones have been developed to address the specific integration
challenges that immigrants and their children grapple with. Such instruments are often
small-scale and project-based, however, and the resources to identify and scale up
successful projects are generally lacking. Since many participants would have found a job
anyway – even in the absence of such measures – a simple comparison of outcomes does not
have much value. Proper evaluation, though costly, should be designed into policy measures
and that includes factoring in an appropriate comparison group of non-participants.
This also raises the issue of policy co-ordination.
There is a need for better communication and co-ordination between the many different
actors involved in integration. Indeed, one key challenge in the design and implementation
of integration policy is precisely the fact that so many stakeholders are involved and
responsibilities are often widely dispersed, both within and across levels of government.
Naturalisation is associated with better outcomes,partly because it is seen by employers as a signalfor integration.
In most host countries, immigrants who have obtained citizenship show better integration
outcomes. One reason is that those who are better integrated are more likely to naturalise.
But there is also growing evidence that naturalisation can, by itself, trigger integration
– notably for immigrants from non-OECD countries – seemingly because employers
interpret naturalisation as a sign of immigrants integrating. Take-up of host-country
citizenship should therefore be encouraged as it is, for example, in Australia, Canada, and
the United States. By the same token, barriers to naturalisation should not be
unreasonably high. What’s more, the fact that employers equate naturalisation with
integration suggests there is a general case for raising immigrant awareness of the benefits
of sending out signals to employers that they are “integrated”.
INTERNATIONAL MIGRATION OUTLOOK 2014 © OECD 201440

2. LABOUR MARKET INTEGRATION OF IMMIGRANTS AND THEIR CHILDREN: DEVELOPING, ACTIVATING AND USING SKILLS
Public opinion about immigration also hasa significant impact on integration, so debateshould be fact-based and balanced.
Society in the host country sends out signals, too – through the public discourse, for
example. It plays a central role in shaping the way immigrants are perceived. The challenge
in this respect is not necessarily to obtain a consensus on immigration issues, but to limit
preconceptions. For example, contrary to what public opinion widely thinks, immigrants
receive fewer benefits than the native-born on average. The public focus on negative
integration outcomes among some immigrant groups tends to obscure all that is positive.
Sending out ambivalent messages on integration risks encouraging discriminatory
attitudes, which may in turn affect the behaviour of immigrants themselves – affecting
their willingness to learn the host-country language, for example.
Employment in the public sector can bean important driver for the integration process.
Public sector recruitment practices also send out signals on integration. Perceptions of
immigrants are shaped, in part, by their being seen to be part of everyday life. By employing
qualified immigrant candidates, the public sector enhances such visibility and acts as a
role model for the private sector. Employment in the public sector can also contribute to
enhancing the understanding of immigrants’ needs by the institutions concerned. When
immigrants are employed in certain key occupations such as teaching, they can serve as a
role model for others – notably youth with immigrant parents. Yet, even the native-born
children of immigrants are underrepresented in the public sector, which should identify
barriers to the employment of immigrants and their offspring and take corrective action.
To that end, some countries, such as Norway and the Netherlands, have implemented
specific policies. Because the authorities can naturally exert more influence on public
employment decisions than on those in the private sector, those policies have been rather
effective.
The single most important skill is knowledgeof the host-country’s language.
While immigrants have many skills that the labour market should value more, they also
need to develop new ones – generally ones that are specific to the host country. The most
important one is the host-country language. Not surprisingly, governments spend more on
language training than any other component of integration policy directly aimed at
immigrants. While the sheer importance of mastering the host-country language in the
integration process can hardly be overstated, care needs to be taken not to demand
standards of language that are so high they rule immigrants out of certain occupations. It
needs to be made clear to employers that immigrants can be productive even if they do not
fully master the host-country language.
INTERNATIONAL MIGRATION OUTLOOK 2014 © OECD 2014 41

2. LABOUR MARKET INTEGRATION OF IMMIGRANTS AND THEIR CHILDREN: DEVELOPING, ACTIVATING AND USING SKILLS
Language training should be adaptedto immigrants’ skills and oriented towardslabour market integration.
The starting point, when it comes to language learning, varies greatly according to
immigrants’ prior qualifications, their intended occupation in the host country, and their
background. In order to be effective, training must account for different needs and be
geared towards labour market integration – by providing vocation-specific language
training, ideally on-the-job. Although such training is costly, it is an investment that
appears to pay off, and the beneficial impact on labour market integration is often
considerable. Immigrants are also more likely to be motivated by training if it is adapted to
their skills needs.
For the children of immigrants, early interventionis crucial.
For the native-born children of immigrants with low-educated parents, early contact with
host-country educational institutions has proven crucial for future integration outcomes.
Yet, while the age of three to four is a critical one in this respect, children of immigrants are
still often underrepresented in early childhood education and care. As for children born
abroad, early family reunification should be encouraged, as each year of delay further sets
back educational outcomes.
The concentration of the offspring of low-educatedin certain schools needs to be addressed.
Creating an appropriate environment for developing the skills of immigrant children
requires tackling the concentrations of the children of low-educated immigrants in certain
schools. It is not, in fact, the actual concentrations that are the issue, but the fact that they
concern the children of immigrants with little education. The effects on the educational
outcomes of the children and of both immigrants and the native-born are highly
detrimental. Addressing such a challenge involves a mix of measures that should include
supporting immigrant parents.
Activating the skills of immigrants who have beenout of the labour market – in particular women –is a particular challenge.
If inactive immigrants are to be coaxed back into the labour market, they need to be
activated. This is a particular challenge when immigrants have been inactive for a number
of years and if they arrived at a time when integration policies were less well developed
(which is frequently the case). One widely affected group is immigrant women. They are
often ineligible for mainstream support, since they are not benefit-dependent if their
partner is working – as he usually is. Measures to integrate immigrant women also benefit
their children considerably. One promising scheme – that has been rolled in Denmark and
Germany – is to offer women language training combined with care and language
stimulation for their children, ideally in the same institution.
INTERNATIONAL MIGRATION OUTLOOK 2014 © OECD 201442

2. LABOUR MARKET INTEGRATION OF IMMIGRANTS AND THEIR CHILDREN: DEVELOPING, ACTIVATING AND USING SKILLS
Supporting the children of immigrantsin the school-to-work transition requiresan individualised approach.
Another group of particular concern to policymakers is young people who do not pursue
further education and who are not in employment or training (NEET). The children of
immigrants are overrepresented among NEETs in many OECD countries, often by a factor
of two or more. Measures that have been successful in promoting their transition into
employment involve an individualised approach with specialised case-workers. The young
people attend targeted additional training courses and internships during which their case
workers continue to accompany them. Switzerland is one country that uses this approach.
Early contact with the population at risk while still in school is crucial.
To encourage employers, diversity policies area promising tool that is sparking renewed interest.
An emerging workplace policy trend is voluntary diversity measures. It includes initiatives
like “diversity labels”, whereby the authorities audit and certify a company’s diversity
management policies on a regular basis with the relevant stakeholders. In such schemes,
companies commit to diversity as part of their corporate social responsibility and are given
an incentive – the labels are a public relations tool – which is in line with the promotion of
equal opportunity. Diversity plans go a step further: companies volunteer to be audited for
potentially discriminatory hiring practices, then implement measures to diversify their
staff – with the support of consultants paid by the public employment services and in
co-operation with social partners.
Ultimately, integration is an investment– and that needs to be designed into integrationmeasures.
Effective policies need not always be accompanied by high costs to the public purse.
However, some certainly do require significant investment at a time when most
OECD countries face severe budget constraints. Here, integration needs to be seen as an
investment, which calls for early intervention and the pursuit of policies where the pay-off
is not always immediate. Access to integration programmes should not, therefore, be
dependent on the group to which the immigrant belongs, but rather on his or her
settlement prospects and needs. Ultimately, integration can only fully succeed if all
immigrant groups have a chance to realise their potential.
INTERNATIONAL MIGRATION OUTLOOK 2014 © OECD 2014 43

2. LABOUR MARKET INTEGRATION OF IMMIGRANTS AND THEIR CHILDREN: DEVELOPING, ACTIVATING AND USING SKILLS
Box 2.1. Effective policies for better using the potential of immigrantsand their children
Take stock of the skills which immigrants bring and value them
● Develop efficient and transparent procedures for recognising foreign credentials andvalidating competences in co-operation with the social partners.
● Start integration programmes by evaluating and validating immigrants’ qualificationsand skills and raising awareness of the benefits of such measures.
● Establish policy measures which bring immigrants into contact with employers and helpthem gain early work experience.
● Make sure that immigrants benefit from effective mainstream active labour marketpolicy instruments, including wage subsidies.
● Encourage the take-up of host-country citizenship.
● Identify and remove barriers to employment in the public sector.
● Tackle stereotypes and false perceptions of immigration by disseminating facts-basedevidence on migration issues.
Develop host-country-specific skills which immigrants need
● Ensure that language training and introduction programmes prepare for labour marketintegration but do not delay it.
● Focus on vocational language training that should be provided, if possible, on the job.
● Equip all immigrants with the basic skills for succeeding in the labour market.
● Provide more bridging course offers for immigrants with foreign qualifications.
● Make sure that immigrants are informed and understand how the host-country labourmarket functions.
● Use mentorship to promote integration.
● Encourage that immigrants’ children enter early childhood education, starting at the ageof three.
● Encourage early family reunification if families have children.
● Make sure that children who arrive in a host country at the end of obligatory schoolingare either in education, employment or training.
● Avoid the geographic concentration of children of low-educated immigrants in the sameschools.
Activate the skills of immigrants
● Ensure that all long-term immigrants have full access to the labour market.
● Implement tailor-made approaches for disadvantaged youth with an immigrantbackground.
● Make sure that immigrant women have equal access to integration measures.
● Link training for immigrant mothers with childcare opportunities.
● Raise awareness of the issue of discrimination and take pro-active measures to tackle it.
● Engage employers through diversity policies and monitor the outcomes.
● Make sure that immigrant entrepreneurs have equal access to credit and start-up support.
INTERNATIONAL MIGRATION OUTLOOK 2014 © OECD 201444

2. LABOUR MARKET INTEGRATION OF IMMIGRANTS AND THEIR CHILDREN: DEVELOPING, ACTIVATING AND USING SKILLS
IntroductionA significant and growing share of the population in OECD countries is made up of
immigrants and their descendants.2 Since 2000-01, that share has grown everywhere,
except Estonia and Israel. There are now 115 million immigrants in the OECD – about
10% of the total population. Around one-half have become nationals of their country of
residence and, of those, two out of three reported voting in the most recent elections. It is
generally expected that the proportion of immigrants will continue to rise in coming
decades, notably because of labour needs related to population ageing.
Immigrants and their native-born offspring account for a growing share of the
workforce across the OECD. They have become part of society in countries of longstanding
immigration – not only those that were settled though immigration like Australia, Canada,
New Zealand, and the United States, but also some Western European OECD countries.
Elsewhere – in Southern Europe, for example – the growing presence of immigrants’
offspring in the education system and the labour market is more recent. Across the OECD
in 2012, 12.5% of all 15-year-olds were either born abroad or had two foreign-born parents
– 50% more than ten years before.
The integration of immigrants and their offspring has become a prime policy objective
in OECD countries, which have adopted a wide array of policies in the past 15 years. They
generally run in parallel to mainstream labour market and social policies and target
specific groups of immigrants, particularly newcomers. They range from “civic” integration
packages and language courses for new arrivals to broader schemes regulating residence
and citizenship.
Although many integration issues are longstanding, policies must nevertheless
continuously adapt to new challenges and target groups. They need also to adjust to
macroeconomic contexts like the recent global economic crisis and draw on experience of
what works and what does not, both domestically and abroad. In addition, a number of
OECD countries, like those in Central and Eastern Europe and Korea, are bracing for larger
immigrant inflows. Others, in Southern Europe, have only recently experienced large-scale
migration and are having to address new issues, such as the long-term employability of
low-skilled immigrants and the integration of their children. One clear trend across the whole
OECD in the past two decades, however, has been the growing diversity of immigration. There
is an increasingly wide cross-section of countries of origin, education levels, and migration
categories (i.e. labour, family reunification, humanitarian, and free movement).
Among the various integration challenges, perhaps the most important is how to
unleash the full skills potential of immigrants and their offspring. The failure to use them
is a waste of resources that economies today can ill afford.
An extensive literature exists on the role of skills in driving economic growth – both in
augmenting human capital and prompting technological change. The skills of immigrants
are already an important part of the human capital on which OECD economies depend
today. They will become even more important in the future. In this sense, investing in
immigrants’ skills to promote integration is a critical element in a broader skills strategy.
Education and skills are important at the individual level, too. Workers with higher
skills are more productive, tend to earn more, and enjoy better employment prospects. Yet,
skills do not automatically translate into higher incomes or higher productivity. Much
depends on which skills are developed, whether they are geared to the labour market, and
INTERNATIONAL MIGRATION OUTLOOK 2014 © OECD 2014 45

2. LABOUR MARKET INTEGRATION OF IMMIGRANTS AND THEIR CHILDREN: DEVELOPING, ACTIVATING AND USING SKILLS
how they are used in the workforce. While many such issues hold true for both the
native-born and the foreign-born, there are a number of specific issues relating to
immigrants and their descendants which this chapter sets out to explore.
The starting point is that immigrants have generally acquired at least some of their
skills in their country of origin, in contexts that are frequently very different from those in
host countries. Does this matter and, if so, why? Are their skills appropriate to the local
labour market? How do they compare with those of the native-born citizens? How can
information on immigrants’ skills be effectively communicated to the general public and,
in particular, to employers so that they can make the appropriate hiring decisions?
These questions are relevant to wider societal integration, since the under-utilisation
of the skills of immigrants and their children has both economic and social costs. Although
freeing up immigrants’ potential skills and using them in the labour market does not
necessarily guarantee social integration, it is certainly a major step towards economic
independence, social inclusion, and acceptance in their new homes. A good job affords
people better protection against poverty, greater recognition in society, and more
opportunities for social interaction.
The question of how to make the best use of immigrants’ skills goes well beyond
issues of over-qualification and the recognition of qualifications and skills obtained
abroad. This chapter takes stock of the broad issues involved in the labour market
integration of immigrants and their offspring from a human capital perspective. It also
considers the policies at hand for unlocking their full skills potential through the
identification, utilisation, activation and development of those skills. It builds on the
extensive work of the OECD on integration issues (Box 2.2), together with new evidence.
The first part of this chapter sets out the overall context and identifies the major
issues for labour market integration from a skills perspective. The second part then
discusses the instruments and policies as they relate to the three pillars identified by the
OECD Skills Strategy – namely using, developing, and activating skills. The chapter ends
with a discussion of some general lessons for policy.
The labour market integration context
Size and structure of immigrant populations
Priorities in integration policy are set in response to the characteristics of past and
present waves of immigration. In order to understand the current state of labour market
integration and the use of immigrants’ skills across the OECD, it is important first to take
stock of the size and make-up of immigrant populations.
The foreign-born population has steadily grown in most OECD countries over the past
15 years and did not decline even during the recent global economic and financial crisis.
Immigrant populations vary widely in size across the OECD. They range from less than
5% of the total population in most Central European countries, Chile, Japan, Korea,
Mexico and Turkey to between 20% and 30% in Australia, Canada, New Zealand, and
Switzerland, and over 40% in Luxembourg (Figure 2.1). Countries with large foreign-born
populations generally also have higher populations of native-born children of immigrants.
Another important factor is the share of recent arrivals in the immigrant population,
as integration generally occurs over time and the need for support is greatest in the first
few years. As a consequence, newcomers tend to receive the bulk of policy attention and
INTERNATIONAL MIGRATION OUTLOOK 2014 © OECD 201446

2. LABOUR MARKET INTEGRATION OF IMMIGRANTS AND THEIR CHILDREN: DEVELOPING, ACTIVATING AND USING SKILLS
support across the OECD. Nowhere, however, do they make up the majority of the
foreign-born population. Nevertheless, in some countries, like Ireland and in Southern
Europe, about one-third of the immigrant population has arrived in the past five years.
A third key issue is the education levels of immigrant populations. Highly and poorly
educated immigrants grapple with different labour-market challenges and overcoming
them requires policy responses that factor in different experiences. On average across the
OECD in 2011-12, the foreign-born were overrepresented both among the low educated
(i.e. lower secondary education or below) and among the highly educated (i.e. those with
tertiary-level degrees). The foreign-born are particularly highly educated in Canada,
New Zealand, Luxembourg, the United Kingdom, Israel, Australia, Ireland, Poland and
Estonia (Figure 2.2), where some 40% or more have a university degree. The shares were
above 30% in Japan, Switzerland, Norway, the United States, Sweden and Mexico. By
contrast, in Italy and Greece, where most immigrants come to take up low-skilled jobs, the
highly educated accounted for less than 15%. Since the beginning of the millennium, the
proportion of tertiary-educated immigrants has risen in virtually all OECD countries.
Box 2.2. OECD work on the integration of immigrants and their children
Over the past decade, the OECD has done extensive work on the integration ofimmigrants and their children. In its Jobs for Immigrants series, the OECD has completed12 in-depth country reviews on the labour market integration of immigrants and theirchildren in Australia, Austria, Belgium, Denmark, France, Germany, Italy, the Netherlands,Norway, Portugal, Sweden, and Switzerland (OECD, 2007, 2008, 2012c, 2014). The OECD hasnow begun a new series that starts with Sweden. It brings together the expertise of localand national stakeholders in order to identify bottlenecks in the integration system,strengthen co-ordination, and build on good practice from elsewhere in the OECD.
Comprehensive cross-cutting information on the integration outcomes of immigrantsand their children in all OECD countries is set out in Settling In: OECD Indicators of ImmigrantIntegration (OECD, 2012e). The International Migration Outlook also regularly analyses trendsand developments in immigrants’ labour market outcomes. They include, amongother issues, the labour market integration of immigrant women (OECD, 2006a),over-qualification (Dumont and Monso, 2007), the wages of immigrants (OECD, 2008), anddiscrimination (Heath, Liebig and Simon, 2013).
With the support of the European Commission, the OECD has shed new light on emergingintegration topics by bringing together the latest research and new comparative evidence onthe following issues: the school-to-work transition of the children of immigrants (OECD 2010a),the links between naturalisation and socio-economic integration (OECD, 2011) and, morerecently, immigrants’ skills (OECD/European Union, 2014). Immigrant entrepreneurship hasbeen a further topic of in-depth investigation (OECD, 2010c), as were local integrationsolutions (OECD, 2006c) and the links between immigration and labour market outcomes(Jean et al., 2010).
The OECD has also analysed the education outcomes of immigrants’ children, chiefly inits Programme for International Student Assessment (PISA) (OECD, 2006b and 2012d). Aspart of the assessments, the OECD also undertook a number of country reviews ofeducation frameworks for the children of immigrants.
INTERNATIONAL MIGRATION OUTLOOK 2014 © OECD 2014 47

2. LABOUR MARKET INTEGRATION OF IMMIGRANTS AND THEIR CHILDREN: DEVELOPING, ACTIVATING AND USING SKILLS
Figure 2.1. Foreign-born as a percentage of the total population, 2012
Note: The data for Korea and Japan are on the stock of foreigners.Source: OECD International Migration Database 2012 except for Australia, Canada, the Czech Republic, Denmark,Estonia, France, Ireland, Israel, New Zealand, Poland and Portugal (2011), Chile and Mexico (2010), and Turkey:Database on Immigrants in OECD Countries (DIOC) 2010/11.
1 2 http://dx.doi.org/10.1787/888933157367
Figure 2.2. Share of the highly educated among the foreign- and native-bornof working age (15-64 years old), 2013
Percentages
Source: European countries and Turkey: Labour Force Surveys 2013 (Eurostat); Australia and Japan (DIOC 2010/11);Canada, New Zealand: Labour Force Surveys 2012; Chile: Encuesta de Caracterización Socioeconómica Nacional(CASEN) 2011; Israel: Labour Force Survey 2011; Mexico: Encuesta Nacional de Ocupación y Empleo (ENOE) 2013;United States: Current Population Survey 2013.
1 2 http://dx.doi.org/10.1787/888933157373
0
5
10
15
20
25
30
35
40
45
Luxe
mbour
g
Switzerl
and
Austra
liaIsr
ael
New Ze
aland
Canad
a
Irelan
d
Austri
a
Eston
ia
Sweden
Sloven
ia
BelgiumSpa
in
German
y
United
States
Norway
OECD
United
Kingdo
m
Netherl
ands
Franc
e
Icelan
dIta
ly
Portug
al
Denmark
Greece
Czech
Rep
ublic
Finlan
dChil
e
Hunga
ry
Slovak
Rep
ublicKor
ea
Poland
Mexico
Japa
n
Turke
y
0
10
20
40
30
50
70
60
Foreign-born Native-born
Canad
a
New Ze
aland
Luxe
mbour
g
United
Kingdo
mIsr
ael
Austra
lia
Irelan
d
Poland
Eston
iaJa
pan
Switzerl
and
Norway
United
States
Sweden
Mexico
OECD
Icelan
d
Hunga
ry
Belgium
Franc
e
Finlan
d
Czech
Rep
ublic
Slovak
Rep
ublic
Portug
alChil
e
Denmark
Spain
Netherl
ands
Turke
y
German
y
Austri
a
Greece
Sloven
iaIta
ly
INTERNATIONAL MIGRATION OUTLOOK 2014 © OECD 201448

2. LABOUR MARKET INTEGRATION OF IMMIGRANTS AND THEIR CHILDREN: DEVELOPING, ACTIVATING AND USING SKILLS
There is also great diversity in countries of origin (Figure 2.3). On average, just over
one-third of foreign-born working-age adults hail from another OECD country, although
the share varies significantly across the OECD. Most foreign-born working-age adults in
Luxembourg, Iceland, Ireland and Switzerland are from the OECD, as they are in the
Czech Republic, the Slovak Republic, and Mexico. Immigrants from neighbouring countries
and within areas of free movement – namely the European Union (EU) and the European
Free Trade Association (EFTA) – account for most of them, as they do in Belgium, the Nordic
countries, and the United Kingdom. Australia and New Zealand also have high shares of
immigrants from OECD countries. In contrast, people born in non-OECD countries make up
the vast majority of foreign-born working-age adults in Southern Europe and some Central
European countries, as well as in Chile, Israel, Japan, and Korea.
Immigrants’ country of origin is often related to migration categories. In many
European OECD countries, for example, high numbers of immigrants from non-OECD
countries have arrived for humanitarian or family reasons. As explained in more detail
below, such immigrants often show lower labour market outcomes than those who migrate
for employment, even if they originate from the same countries and share otherwise
similar characteristics.
Unfortunately, comparative data on the composition of the resident immigrant
population by category of migration are scarce. Some information on self-reported
categories is nevertheless available for selected European OECD countries from an ad hoc
module in the 2008 European Labour Force Survey. It shows that in Belgium, the
Netherlands, Norway, and Sweden, between 61% and 81% of the non-OECD foreign-born
arrived as adult family-reunification immigrants or for humanitarian reasons.
Figure 2.3. Distribution of the working-age foreign-bornby continent of birth, 2010-11
Percentages
Source: Database on Immigrants in OECD Countries (DIOC) 2010/11.1 2 http://dx.doi.org/10.1787/888933157387
0
20
40
60
80
100
Africa Americas Asia Europe Oceania
Austra
lia
Austri
a
Belgium
Canad
a
Switzerl
andChil
e
Czech
Rep
ublic
German
y
Denmark
Spain
Eston
ia
Finlan
d
Franc
e
United
Kingdo
mGree
ce
Hunga
ry
Irelan
d
Icelan
dIsr
aelIta
lyJa
pan
Luxe
mbourg
Mexico
Netherl
ands
Norway
New Ze
aland
Poland
Portug
al
Slovak
Rep
ublic
Sloven
ia
Sweden
Turke
y
United
States
OECD
INTERNATIONAL MIGRATION OUTLOOK 2014 © OECD 2014 49

2. LABOUR MARKET INTEGRATION OF IMMIGRANTS AND THEIR CHILDREN: DEVELOPING, ACTIVATING AND USING SKILLS
Knowledge of the host country’s language is probably the single most important asset
for both the transferability of skills across countries and labour market integration (for
recent overviews, see e.g. Chiswick and Miller, 2014; Sweetman, 2014). In practice, however,
it is difficult to single out its impact – it is closely related to other skills – or to measure it.
Indeed, constructing a reliable language proficiency indicator is no easy task. One basic,
widely used measure is immigrants’ self-reported command of their host countries’
languages. It is, however, prone to error and seldom found in labour force surveys. Another,
more easily available proxy, is the percentage of immigrants from a country which shares
one official language with the host country – even though the official tongue might be
different from the one actually spoken by immigrants, especially in multilingual countries.
Obviously, an OECD host country whose language is widely spoken in countries of
origin will have a much greater share of immigrants who speak their language than one
which does not share that advantage.3 Nevertheless, there is still wide variation even
among English-speaking OECD countries. The proportion of immigrants from countries
with English as a main official language ranges from 24% in the United States to around
50% in Australia, Canada, the United Kingdom, and New Zealand. Among non-English
speaking countries, France, Portugal, and Spain are home to many immigrants from former
colonies where French, Portuguese, and Spanish are official languages. Belgium, Chile, the
Czech Republic, Luxembourg, Mexico, the Slovak Republic, and Switzerland also have
non-negligible shares of immigrants with a command of their languages – mainly because
many are from neighbouring countries. Percentages are, however, very small in OECD
countries whose language is spoken little beyond their national borders. They include
Germany, Greece, Israel, and Italy and Central and Eastern European, Scandinavian, and
Asian countries.
Taken together, the characteristics of immigrant populations in the above overview
paint a picture of widely diverse national contexts in OECD host countries and can be used
to classify them. Figure 2.4 affords an overview of the resulting groups.
Group 1: Longstanding destinations with many recent and high-educated immigrants
Countries in this group boast lengthy traditions as destinations and have many recent
and long-settled immigrants. In all of them, the foreign-born represent at least 12% of the
working-age population, while native-born children of immigrants also make up a
significant share of the overall population. All the countries in the group have sizable
shares of highly educated immigrants– around one-third are university-educated – and
many were exposed to their host country’s language before arrival.4
The traditional destinations – Australia, Canada, New Zealand, and the United States –
see their history of immigration as a generally successful one of integration, and consider it
part of the national heritage. This first group also includes several European countries
– namely Luxembourg, Switzerland, and the United Kingdom – with longstanding
immigrant populations and large shares of new arrivals stemming from free movement
within the EU-EFTA area. All have also experienced significant employment-driven
migration over the past decade.
INTERNATIONAL MIGRATION OUTLOOK 2014 © OECD 201450

2. LABOUR MARKET INTEGRATION OF IMMIGRANTS AND THEIR CHILDREN: DEVELOPING, ACTIVATING AND USING SKILLS
e been
stonia,10-11).
Japan:) 2011;y 2013.
11.
ilateral
157391
100
re
Group 2: Other longstanding destinations
The second group comprises other countries in Europe (plus Israel) that are
longstanding immigrant destinations. They have predominantly long-settled foreign-born
populations who account for between 12% and 16% of the population (24% in the case of
Figure 2.4. Characteristics of immigrants in OECD countries, 2012Percentages
1. If the country of birth and the country of destination have an official language in common, the immigrant is considered to havexposed to the language spoken in the country of destination before his/her migration.
Source:Foreign-born (all ages): OECD International Migration Database 2012 except for Australia, Canada, the Czech Republic, Denmark, EFrance, Ireland, Israel, New Zealand, Poland and Portugal (2011), Turkey (Database on Immigrants in OECD Countries [DIOC] 20The data for Korea and Japan relate to the foreign nationals.
Recent immigrants (aged 15+): DIOC 2010/11; Portugal: Labour Force Surveys 2011-12.
Tertiary-educated immigrants (aged 15-64): European countries and Turkey: Labour Force Surveys 2013 (Eurostat); Australia andDIOC 2010/11; Canada, New Zealand: Labour Force Surveys 2012; Chile: Encuesta de Caracterización Socioeconómica Nacional (CASENIsrael: Labour Force Survey 2011; Mexico: Encuesta Nacional de Ocupación y Empleo (ENOE) 2012; United States: Current Population Surve
Region of birth (aged 15-64): European countries: Labour Force Surveys (Eurostat) 2012, Germany and other countries: DIOC 2010/
Language exposure before migration (aged 15+): French research centre in international economics (CEPII), Trade, Production and BDatabase; DIOC 2010/11.
1 2 http://dx.doi.org/10.1787/888933
0 100 0 100 0 100 0 100 0
Emer
ging
des
tinat
ions
with
sm
all i
mm
igra
ntpo
pula
tions
LuxembourgSwitzerland
AustraliaNew Zealand
CanadaUnited States
United Kingdom
IsraelAustriaEstoniaSwedenBelgium
GermanyFrance
Netherlands
SpainItaly
PortugalGreece
IrelandNorwayIceland
Denmark
SloveniaCzech Republic
FinlandChile
HungarySlovak Republic
KoreaPolandMexico
JapanTurkey
OECD average
Oth
er n
ewde
stin
atio
nsO
ther
long
stan
ding
de
stin
atio
nsN
ew d
estin
atio
ns w
ith m
any
low
-edu
cate
d im
mig
rant
s
n.a.
n.a.
n.a.
n.a.
n.a. n.a. n.a.
Long
stan
ding
de
stin
atio
nsw
ith m
any
rece
ntan
d hi
gh-e
duca
ted
imm
igra
nts
Recent migrants (< 5 years)
Tertiary educated migrants
Migrants bornin an OECD country
Language exposubefore migration1Share of foreign-born
Among the foreign-born population
INTERNATIONAL MIGRATION OUTLOOK 2014 © OECD 2014 51

2. LABOUR MARKET INTEGRATION OF IMMIGRANTS AND THEIR CHILDREN: DEVELOPING, ACTIVATING AND USING SKILLS
Israel). In all these countries, with the exception of Sweden, at least three-quarters of the
foreign-born have lived in the country for more than ten years. The group includes Austria,
Belgium, France, Germany, and the Netherlands, all of which experienced significant
migration of the “guest-worker” type after the Second World War. Guest workers were
generally low-skilled labour migrants seeking work who were later joined by their families.
With the exception of Estonia, all the European countries in this group have also taken
in many humanitarian immigrants. They thus have large shares of immigrants who arrived
for reasons other than employment, and whose integration outcomes tend to be less
favourable. As a result, integration issues are relatively high on the policy agenda. Although
some countries in the group – notably Germany – currently experience significant flows of
immigration, mainly from other EU countries, newcomer populations are relatively small
in comparison with the long-settled populations from lower-income countries. In the case
of France, many long-settled immigrants arrived from the former colonies. As for Estonia,
the high share of foreign-born stems from internal migration within the former
Soviet Union. Since independence, immigration has been very limited.
Group 3: New destinations with many low-educated labour migrants
The third group encompasses the Southern European countries, all of which are
relatively recent destinations with large shares of low-educated labour immigrants from
non-OECD countries. About 14% of the population in Spain is now foreign-born, with the
vast majority having arrived since the year 2000. Greece, Italy, and Portugal have somewhat
smaller immigrant populations, making up around 10% of the working-age population.
In all the countries in this group, labour immigrants filled many of the low-skilled jobs
prior to the global financial and economic crisis. Since the downturn, they have been
disproportionately affected by unemployment. Between 2008 and 2012, the number of
newcomers to all four countries dropped by nearly one-half. Yet, at the same time, the
number of children of immigrants has grown rapidly, which raises new questions related to
integration in the education system, school-to-work transition, and citizenship legislation.
Group 4: Other new destinations
The fourth group comprises relatively recent immigrant destinations in Northern
Europe, Ireland and Scandinavia, where a sizeable share of the foreign-born populations are
relative newcomers. These countries host large numbers of EU citizens who benefited from
free mobility and, in the case of Ireland, immigrants from English-speaking countries. Much
immigration to the Scandinavian countries has been humanitarian and, subsequently,
family-related – in other words, groups only loosely attached to the labour market, at least
initially. As a result, integration tends to be relatively high on the policy agenda.
Group 5: Emerging destinations with small immigrant populations
The remaining group of countries is diverse, consisting of destinations with small
foreign-born populations. It includes the OECD countries in Central Europe, the Americas,
East Asia, and Turkey. In all these countries, foreign-born residents makes up less than
5% of the population. Percentages are higher, however, in Slovenia and the Czech Republic,
where – as in the Slovak Republic – many foreign-born inhabitants are so classified as a
result of border changes.
INTERNATIONAL MIGRATION OUTLOOK 2014 © OECD 201452

2. LABOUR MARKET INTEGRATION OF IMMIGRANTS AND THEIR CHILDREN: DEVELOPING, ACTIVATING AND USING SKILLS
Since the immigrant population across this group is small and new inflows limited,
integration policies are recent and focus on certain categories of newcomers. For example,
the impetus behind the development of integration policy in Japan and Korea was
prompted by, respectively, ethnic and marriage migration. The European countries in this
group generally put integration lower down the political agenda than the emigration of
their own nationals and the transit of non-EU immigrants through their territory to
Western Europe.
The qualifications and skills of foreign-born adults and their offspring
Foreign-born adults’ qualifications and skills
Immigrants’ overrepresentation at both ends of the educational attainment scale (see
Figure 2.5) challenges labour market and social integration in specific ways. It also points
to their underrepresentation at intermediate levels in most countries.
Information on immigrants’ level of education is only a proxy for their actual skills.
Such information is available in countries with significant foreign-born populations
participating in the 2012 OECD Programme for the International Assessment of Adult
Competencies (PIAAC). While a thorough discussion of the findings is beyond the scope of
this chapter (for an overview, see Bonfanti and Xenogiani, 2014), they point to immigrants
having – on average – lower skills than their native-born counterparts in all countries. The
pattern holds true regardless of formal education levels (Figure 2.6). This is partly
Figure 2.5. Difference in the distribution of very low and high education levelsbetween the foreign- and native-born aged 25-54, 2013
Percentage points
Note: ISCED stands for International Standard Classification of Education. ISCED 0/1 refers to persons whose highestcompleted education level is pre-primary or primary. ISCED 5/6 refers to persons who have completed tertiaryeducation. The information on the highest education level attained in the Chilean CASEN does not match ISCEDlevels exactly. It is assumed that those who started but did not complete secondary education at least completedlower secondary education (ISCED 2).Source: European countries and Turkey: Labour Force Surveys 2013; Chile: Encuesta de Caracterización SocioeconómicaNacional (CASEN) 2011; Israel: Labour Force Survey 2011; United States: Current Population Surveys 2013.
1 2 http://dx.doi.org/10.1787/888933157401
-40
-30
-20
-10
0
10
20
30
ISCED 0/1 ISCED 5/6
Turke
y
Portug
alChil
e
Irelan
d
Eston
ia
Czech
Rep
ublic
Hunga
ry
Slovak
Rep
ublic
Sloven
ia
Icelan
d
United
Kingdo
m
Norway
OECD
Austri
a
Finlan
dIsr
ael
Denmark
Poland
Switzerl
and
Italy
Greece
Luxe
mbourg
Netherl
ands
Sweden
German
ySpa
in
United
States
Franc
e
Belgium
Foreign-born are overrepresented
Foreign-born are underrepresented
INTERNATIONAL MIGRATION OUTLOOK 2014 © OECD 2014 53

2. LABOUR MARKET INTEGRATION OF IMMIGRANTS AND THEIR CHILDREN: DEVELOPING, ACTIVATING AND USING SKILLS
157418
ates
Belgium
ark
Finlan
d
attributable to the fact that measured literacy includes command of language. And as tests
are carried out in the host-country’s language, it is not possible to properly disentangle
mastery of that foreign language from command of language itself.
Immigrants’ lower skills at given levels of education stem partly from their
qualifications being obtained in education systems which do not always perform as well as
those of their countries of residence.5 Indeed, there appears to be less of a gap between
native-born and foreign-born residents who graduate in the host country. Nevertheless,
the gap – albeit narrower – still obtains in most countries (Figure 2.7).
Qualifications and skills among the offspring of immigrants
One key trend that emerges from the OECD Programme of International Student
Assessment (PISA) is that the children of immigrants also tend to have lower educational
outcomes than their peers whose parents are not migrants (OECD; 2006b, 2012d, 2013b).
The finding may not be surprising for children who have themselves immigrated,
particularly those who arrive towards the end of the obligatory schooling age. At least part
of their schooling takes place in a system, context, and language that may have been quite
Figure 2.6. Mean literacy scores by country of residence, level of education,and place of birth of 16- to 64-year-olds, 2012
Scores points
Source: Survey of Adult Skills (PIAAC), 2012.1 2 http://dx.doi.org/10.1787/888933
150
170
190
210
230
250
270
290
310
150
170
190
210
230
250
270
290
310
150
170
190
210
230
250
270
290
310
150
170
190
210
230
250
270
290
310
Foreign-born
Austra
lia
Slovak
Rep
.
Czech
Rep
.
Irelan
d
Eston
ia
Canad
a
United
Kingdo
mAus
triaOEC
D
Netherl
ands
Norway
Belgium
German
y
Finlan
d
United
States
Denmark
SwedenSpa
in
Franc
eIta
ly
Native-born
All levels of education
Medium level of education High level of education
Low level of education
Slovak
Rep
.
Eston
ia
Czech
Rep
.
Irelan
d
Austra
lia
German
y
Austri
aOEC
D
Netherl
ands Ita
lySpa
in
Norway
United
Kingdo
m
Denmark
Canad
a
Franc
e
Sweden
Finlan
d
United
St
Slovak
Rep
.
Czech
Rep
.
Austra
lia
Netherl
ands
United
Kingdo
mIre
land
Austri
a
Eston
iaOEC
D
Finlan
d
Canad
a
BelgiumSpa
in
Norway
German
yIta
ly
Sweden
Denmark
Franc
e
United
States
Czech
Rep
.
Slovak
Rep
.
Austra
lia
Austri
a
Irelan
d
United
States
Netherl
ands
BelgiumOEC
D
United
Kingdo
m
Canad
aIta
ly
Norway
Sweden
German
y
Franc
e
Eston
iaSpa
in
Denm
INTERNATIONAL MIGRATION OUTLOOK 2014 © OECD 201454

2. LABOUR MARKET INTEGRATION OF IMMIGRANTS AND THEIR CHILDREN: DEVELOPING, ACTIVATING AND USING SKILLS
different from those in the host country. Yet, even the native-born children of immigrants
show lower educational outcomes in most countries (Figure 2.8). Such outcomes may be
partly attributable to some intergenerational transmission of disadvantage, a still
under-researched question.
Figure 2.7. Literacy scores of highly educated immigrantsand native-born residents between the ages of 16 and 64,
according to the country where the highest qualification was obtainedLiteracy scores points
Source: Survey of Adult Skills (PIAAC), 2012.1 2 http://dx.doi.org/10.1787/888933157427
Figure 2.8. Mean reading scores of 15-year-old native-born studentsby parents’ place of birth, 2012
Source: OECD Programme for International Student Assessment (PISA) 2012.1 2 http://dx.doi.org/10.1787/888933157436
220
240
260
280
300
320
Native-born Foreign-born with host-country qualification Foreign-born with foreign qualification
Finlan
d
Denmark
Sweden Ita
ly
Franc
e
Norway
Spain
German
y
United
States
Canad
a
Netherl
ands
OECD
Eston
ia
Belgium
United
Kingdo
m
Czech
Rep
ublic
Irelan
d
Austri
a
Slovak
Rep
ublic
350
400
450
500
550
600
420 440 460 480 500 520 540 560
AUS
AUT
BEL
CAN
CHE
CHL
CZE DEU
DNKESP
EST
FIN
FRA
GBR
GRC
HUN
IRL
ISL
ISR
ITA
JPN
LUX
MEX
NLD
NOR
NZL
PRT
SVK SVN
SWE
TUR
USA
OECD
Native-born offspring of two foreign-born parents
Offspring of two native-born parents
Equal
INTERNATIONAL MIGRATION OUTLOOK 2014 © OECD 2014 55

2. LABOUR MARKET INTEGRATION OF IMMIGRANTS AND THEIR CHILDREN: DEVELOPING, ACTIVATING AND USING SKILLS
Overall, however, differences in PISA scores are greater between countries than within
countries between students with and without immigrant parents. Native-born children
with parents from the same country of origin and social background are also found to have
substantially different educational outcomes according to their country of residence
(OECD, 2006b; Dronkers and Fleischmann, 2010; Dustmann et al., 2012).
Of particular concern for host country policymakers are young adults who lack the
basic skills to be fully functional in the host-country’s labour market and society. In all the
OECD countries for which data is available, with the exception of Estonia, young
immigrants are largely overrepresented among low achievers in literacy skills (Figure 2.9).
The situation is particularly worrying in the Nordic countries, Germany, Belgium
(Flanders), and France. Again, language difficulties are part of the reason, as are frequently
low-performing education systems in countries of origin.
As expected, therefore, the gap narrows – partly, at least, if not completely – between
native-born offspring of immigrants and non-migrants in all countries where significant
differences are observed (with the exception of Austria). This positive showing suggests
that, in literacy skills at least, the native-born children of immigrants fare much better than
their immigrant peers. They nevertheless remain overrepresented among the low
achievers in many of the European OECD countries which experienced significant
low-skilled labour migration in the 1960s and early 70s, such as those in the second group
identified in Figure 2.4 (Austria, Belgium, Germany, France, the Netherlands), together
with Norway and Denmark.
Figure 2.9. Low achievers in literacy among 16- to 34-year-olds by migrationstatus and parental origin
Percentages
Note: The low achievers in literacy are adults with literacy scores below 226.Source: Survey of Adult Skills (PIAAC), 2012.
1 2 http://dx.doi.org/10.1787/888933157447
0
5
10
15
20
25
30
35
40
45
Foreign-born Native-born (offspring of at least one foreign-born parent)
Native-born (offspring of native-born parents)
Italy
Norway
Sweden
Finlan
d
German
y
Franc
eSpa
in
Denmark
United
States
Belgium
United
Kingdo
mAus
tria
Netherl
ands
Canad
a
Irelan
d
Austra
lia
Czech
Rep
ublic
Eston
ia
INTERNATIONAL MIGRATION OUTLOOK 2014 © OECD 201456

2. LABOUR MARKET INTEGRATION OF IMMIGRANTS AND THEIR CHILDREN: DEVELOPING, ACTIVATING AND USING SKILLS
2013
ata for
urveys;ación y
157454
20
born
Labour market outcomes of immigrants and their children
Foreign-born adults’ labour market outcomes
Overview. When looking at immigrants’ labour market outcomes, the first and most
striking fact is that in virtually all OECD countries, most working-age immigrants are in
employment. The exceptions are Greece, which has been particularly hard hit by the global
economic crisis, and Turkey (Figure 2.10).
Across the OECD, an average of nearly two-thirds of working-age immigrants are in
employment. Rates range from less than 55% in Greece and Turkey, as well as in Spain
– another country hard hit by the crisis – Belgium and Mexico, to 70% or more in Australia,
Canada, Norway, New Zealand, Luxembourg, Switzerland and Iceland. Five of these seven
countries are in Figure 2.4’s group of longstanding destinations and boast many highly
educated immigrants.
Figure 2.10. Employment rates of the foreign-born in contrast to those of the native-born,
Note: Data for Japan relate to foreigners compared with Japanese nationals. Data for Chile and Israel are for the year 2011. DAustralia and New Zealand refer to the year 2012.Source: European countries and Turkey: Labour Force Surveys (Eurostat); Australia, Canada, Israel, New Zealand: Labour Force SChile: Encuesta de Caracterización Socioeconómica Nacional (CASEN); Japan: Population Census; Mexico: Encuesta Nacional de OcupEmpleo (ENOE); United States: Current Population Surveys.
1 2 http://dx.doi.org/10.1787/888933
45 50 55 60 65 70 75 80 85 -20 -10 0 10
TurkeyGreeceSpain
BelgiumMexicoFranceItaly
PolandSloveniaIreland
NetherlandsPortugalSwedenDenmarkFinland
OECD averageJapanIsrael
Slovak RepublicAustria
GermanyUnited Kingdom
HungaryChile
United StatesEstonia
Czech RepublicAustraliaCanadaNorway
New ZealandLuxembourgSwitzerland
Iceland
Employment rates of the foreign-bornPercentage of the population aged 15-64
Difference with the native-Percentage points
INTERNATIONAL MIGRATION OUTLOOK 2014 © OECD 2014 57

2. LABOUR MARKET INTEGRATION OF IMMIGRANTS AND THEIR CHILDREN: DEVELOPING, ACTIVATING AND USING SKILLS
Average employment rates are slightly lower among immigrants than native-born
residents, with significant disparities in the Scandinavian countries, the Netherlands,
Belgium, Austria, France and Germany – all from the second and fourth country clusters
identified in Figure 2.4. Gender is also an important factor, since employment gaps
between immigrant women and their native-born peers tend to be wider than among men.
Among the highly educated, immigrant employment rates are lower than those of the
native-born in all OECD countries except Chile and the Slovak Republic (Figure 2.11). The
gaps are particularly wide in countries which are destinations for significant humanitarian
migration, such as Sweden, and in those hard hit by the crisis, like Greece and Spain.
Nevertheless, more than two-thirds of the university-educated foreign-born are working in
all OECD countries, save Greece.
The picture is much more diverse among low-educated workers (Figure 2.12). In
contrast to the highly educated, low-educated foreign-born residents are often just as
likely to work as their native-born peers. Compared with the latter, immigrants’ labour
situations appear particularly good in countries that have seen significant recent inflows of
low-educated workers, e.g. the United States, Luxembourg, Italy, and Greece. By contrast,
there are wide gaps to the detriment of immigrants in Estonia, the Netherlands, Sweden,
and Denmark. In general, however, most foreign-born resident with low levels of
educational attainment are in work in the bulk of OECD countries. The only exceptions are
Belgium, Spain, France, Ireland, Israel, The Netherlands, Turkey and Central European
countries with small and often older immigrant populations (belonging to the fifth group
identified in Figure 2.4).
Figure 2.11. Employment rates among the highly educated native-bornand foreign-born aged 15-64 who are not in education,
selected OECD countries, 2013Employment rates expressed as percentages
Note: The data for Canada, Japan, New Zealand and Turkey apply to the 25-64 age group and may include people stillin education. The data for Australia refer to the 15-64 age group and may include people still in education.Source: European countries and Turkey: Labour Force Surveys (Eurostat), 2013; Australia: Labour Force Survey 2012;Canada, New Zealand: Labour Force Surveys 2011-12; Chile: Encuesta de Caracterización Socioeconómica Nacional(CASEN) 2011; Israel: Labour Force Survey 2011; Mexico: Encuesta Nacional de Ocupación y Empleo (ENOE) 2013;United States: Current Population Surveys 2013.
1 2 http://dx.doi.org/10.1787/888933157469
95
65 70 75 80 85 90 9550
55
60
65
70
75
80
85
90
AUT
BEL
CHECZE
DEUDNK
ESP
ESTFIN
FRA
GBR
GRC
HUN
IRL
ISL
ITA
LUX
NLD
NOR
POL
PRT
SVK
SVN
SWE
CAN
MEX
NZLUSA
TUR
AUSISR
CHL
Employment rates of the highly educated foreign-born
Employment rates of the highly educated native-born
OECD
Equal
INTERNATIONAL MIGRATION OUTLOOK 2014 © OECD 201458

2. LABOUR MARKET INTEGRATION OF IMMIGRANTS AND THEIR CHILDREN: DEVELOPING, ACTIVATING AND USING SKILLS
The picture that emerges is that, although immigrants’ employment rates rise with
their education levels, they do so to a lesser degree than those of the native-born. The
employment gap thus widens with educational attainment (see Table 2.A1.4 and Damas de
Matos and Liebig, 2014).
Although most of the foreign-born are in work, they are more often to be found in
low-skilled or low-quality jobs than their native peers who have attained the same level of
education. This is generally an issue for the highly educated, although it may also affect
those with intermediate levels of education. Not only are educated immigrants less likely to
be in employment, those who do work are also much more widely over-qualified than their
native-born peers in virtually all countries (Figure 2.13). The incidence of over-qualification
is particularly high in countries from the third and fourth groups in Figure 2.4 – i.e. Southern
European countries, where there has been much recent labour migration into low-skilled
jobs, and the Nordic countries, where many arrivals with university degrees are
humanitarian immigrants. They are far more likely to be over-qualified for their jobs than
other immigrant groups (Table 2.A1.4 and Damas de Matos and Liebig, 2014).
Where the issue for the highly educated in employment is over-qualification, the chief
concerns for the uneducated foreign-born are poor working conditions and low wages,
which are in turn associated with in-work poverty. In nearly all OECD countries for which
such information is available, households headed by poorly educated immigrant workers
are more likely to live in poverty than their native-born peers. The exceptions are Germany,
Switzerland, and Poland (Figure 2.14). Disparities are often considerable and in some
countries – such as Estonia, Greece, Denmark, Belgium, the Netherlands, Austria and
Sweden – the families of low-educated immigrant workers are more than twice as likely to
be affected by in-work poverty as those where the household head is native-born.
Figure 2.12. Employment rates of the low-educated native-born and foreign-born,persons aged 15-64 and not in education, selected OECD countries, 2013
Employment rates expressed as percentages
Note: The data for Canada, Japan, New Zealand and Turkey refer to the 25-64 age group and can include those still ineducation. The data for Australia refer to the 15-64 age group and can include people still in education.Source: Australia: Labour Force Survey 2012; Canada, New Zealand: Labour Force Surveys 2011-12; Chile: Encuesta deCaracterización Socioeconómica Nacional (CASEN) 2011; Israel: Labour Force Survey 2011; European countries and Turkey:Labour Force Surveys (Eurostat), 2013; Mexico: Encuesta Nacional de Ocupación y Empleo (ENOE) 2013; United States:Current Population Surveys 2013.
1 2 http://dx.doi.org/10.1787/888933157477
85
25 8025
35
45
55
65
75
30 35 40 45 50 55 60 65 70 75
AUT
BEL
CHE
CZE
DEU
DNKESPEST
FIN
FRA
GBRGRC
HUNIRL
ISL
ITA
LUX
NLD
NORPOL PRT
SVK
SVN
SWECAN
MEXNZL
USA
TUR
AUS
ISR
CHL
Employment rates of the low-educated foreign-born
Equal
Employment rates of the low-educated native-born
OECD
INTERNATIONAL MIGRATION OUTLOOK 2014 © OECD 2014 59

2. LABOUR MARKET INTEGRATION OF IMMIGRANTS AND THEIR CHILDREN: DEVELOPING, ACTIVATING AND USING SKILLS
Figure 2.13. Over-qualification rates among the highly educated in employment,15- to 64-year-olds, by migration status, 2013
Over-qualification rates expressed as percentages
Note: Highly educated corresponds to tertiary education. They are considered over-qualified if the job is classified asISCO 4 to 9. (ISCO stands for International Standard Classification of Occupations.)Source: European countries and Turkey: Labour Force Surveys (Eurostat), 2013; Chile: Encuesta de CaracterizaciónSocioeconómica Nacional (CASEN) 2011; Israel: Labour Force Survey 2011; New Zealand: Labour Force Survey 2012;United States: Current Population Survey 2013.
1 2 http://dx.doi.org/10.1787/888933157482
Figure 2.14. In-work poverty risk by migration status in householdswith low-educated household head(s), selected OECD countries, 2011
Percentages
Note: “In-work poverty risk” denotes the share of individuals who live in a household where the equivalent incomeis below half of the median income of the whole population living in the country. The equivalent scale used is thesquare root scale. The households considered are those where at least one adult has been at work for at least sevenmonths in the previous twelve. The income considered is the total household income after social transfers that isdisposable in a twelve-month period (previous calendar or tax year or twelve months preceding the interview).Source: European Countries: EU-SILC (Eurostat), 2011; United States: American Community Survey 2012.
1 2 http://dx.doi.org/10.1787/888933157492
0
10
20
30
40
50
60
Foreign-born Native-born
Spain
Italy
Greece
Eston
iaIsr
ael
Irelan
d
United
States
Norway
Icelan
d
New Ze
aland
Sweden
Austri
a
United
Kingdo
m
Belgium
German
yOEC
D
Finlan
d
Franc
e
Turke
y
Denmark
Netherl
ands
Czech
Rep
ublic
Portug
alChil
e
Hunga
ry
Switzerl
and
Poland
Slovak
Rep
ublic
Sloven
ia
Luxe
mbourg
0
10
20
30
40
50
60
Foreign-born household
Eston
ia
Greece
United
States
Denmark
Spain
Finlan
dIta
ly
Belgium
German
yOEC
D
Netherl
ands
Czech
Rep
ublic
Norway
Icelan
d
Switzerl
and
United
Kingdo
mAus
tria
Sweden
Sloven
ia
Franc
e
Portug
al
Luxe
mbourg
Poland
Native-born household
INTERNATIONAL MIGRATION OUTLOOK 2014 © OECD 201460

2. LABOUR MARKET INTEGRATION OF IMMIGRANTS AND THEIR CHILDREN: DEVELOPING, ACTIVATING AND USING SKILLS
Specific labour-related issues for family and humanitarian immigrants. Obviously,
immigrants do not all start out from the same position on the labour market. Labour
immigrants – particularly those who arrive with the offer of a job – usually step into work
immediately or a few months after arrival. Indeed, their employment rates can only
decline over time.
The situation is very different for family and humanitarian immigrants, for whom
employment is generally not the main reason for moving to a new country. Data for the
European OECD countries show that – after controlling for other relevant individual
characteristics – humanitarian immigrant men and women from lower-income countries
have, respectively, employment rates that are 11 and 18 percentage points higher than
their peers who have come as labour migrants (Table 2.A1.3).
With the exception of women from non-OECD countries, former international
students are just as likely to be employed as labour immigrants. Of immigrants who arrive
as adults in European countries, more than 50% of men declare that they come to work and
25% for family reasons. The proportions are reversed among women. Less than 10% of men
and women arrive for humanitarian reasons or to study.
Given the different initial motives for migrating, what one may reasonably expect for one
category of newcomers may not be appropriate for another. Indeed, differences in the
composition of immigrant populations explain many cross-country disparities in integration
outcomes (Bevelander and Pendakur, 2014). Finding work fast is a reasonable benchmark for
labour immigrants and, indeed, having a job upon arrival is a precondition for admission into
European OECD countries and, increasingly, into Australia, Canada, and New Zealand. The
same applies to former international students who change status. Family and humanitarian
immigrants need greater support and more time (years) to achieve labour market integration.6
Immigrant women often face a double disadvantage. As most family migrants are
women, gender is central to that particular migration category. Even after controlling for a
broad range of socio-economic characteristics, it appears that immigrant women have
much lower employment rates than men in relation to their native-born peers, whose
employment rates already fall short of native men’s. Clearly, then immigrant women are at
a “double disadvantage” (OECD, 2006a addresses the issue in depth).
The twin disadvantage is partly attributable to more traditionally separate gender
roles being more pronounced among immigrants, particularly those from countries where
the incidence of women in work is low. Having small children also seems to curb the
employment opportunities of foreign-born women more than it does those of their
native-born peers. Although immigrant women from lower-income countries appear worst
affected (Table 2.A1.4), they, too, tend to show higher employment rates in countries where
large numbers of native-born women are in work. A country’s overall labour market
context for women thus seems to affect immigrant women’s employment.
Outcomes of youth with immigrant parents
Since a significant proportion of young people are still in out comes of education, the
best youth integration indicator is widely considered to be the percentages who are neither
in employment nor in education or training (the NEET group). Figure 2.15 shows the share of
NEETs among foreign-born young people who migrated as children in comparison to those
who are native-born. In most countries, they are overrepresented among the NEET compared
with their native-born peers – and more than twice as much in the Netherlands and Finland.
INTERNATIONAL MIGRATION OUTLOOK 2014 © OECD 2014 61

2. LABOUR MARKET INTEGRATION OF IMMIGRANTS AND THEIR CHILDREN: DEVELOPING, ACTIVATING AND USING SKILLS
Disparities between immigrant and native-born young people are even wider among
the poorly educated NEET (Figure 2.16). In this group, which is of key concern for policy-
makers, immigrant youth are overrepresented in all countries, particularly in Europe. The
only exceptions are the United Kingdom and a few European OECD countries where the
number of immigrants in the 15-to-24 age group is small.
Figure 2.15. Share by place of birth of youth who are neither in employmentnor in education or training (NEET), 2012-13
Percentages among 15- to 24-year-olds
Source: European countries: Labour Force Surveys (Eurostat) 2012; United States: Current Population Survey 2013.1 2 http://dx.doi.org/10.1787/888933157507
Figure 2.16. Share by place of birth of low-educated young peopleneither in employment nor education or training (NEET)
among the total youth (15- to 25-year olds), 2012-13Percentages
Source: European countries: Labour Force Surveys (Eurostat) 2012; United States: Current Population Survey 2013.1 2 http://dx.doi.org/10.1787/888933157510
40
0 300
5
15
25
35
10
20
30
5 10 15 20 25
AUT
BEL
CHE
CZE
DEU
DNK
ESP
ESTFINFRA
GBR
GRC
HUN
IRL
ISL
ITA
LUX
NLD
NOR
POL
PRT
SVN
SWE
USA
Foreign-born who migrated before age 15
Native-born
Twice as high
Equal
OECD
0
5
10
15
20
25
Foreign-born who migrated before age 15Native-born
Switzerl
and
Denmark
Netherl
ands
United
Kingdo
m
United
States
Poland
Icelan
d
Sloven
ia
Czech
Rep
ublic
Austri
a
Sweden
German
y
Hunga
ryOEC
D
Finlan
d
Franc
e
Portug
al
Norway
Luxe
mbourg
Irelan
dIta
ly
Belgium
Greece
Spain
INTERNATIONAL MIGRATION OUTLOOK 2014 © OECD 201462

2. LABOUR MARKET INTEGRATION OF IMMIGRANTS AND THEIR CHILDREN: DEVELOPING, ACTIVATING AND USING SKILLS
Although native-born children of immigrants show higher NEET and lower
employment rates than the children of the native-born in many OECD countries, their
outcomes are better than those of immigrant youth (OECD, 2010a and 2012e; Liebig and
Widmaier, 2009).
That native-born immigrant offspring are overrepresented among NEETs and the
unemployed is true irrespective of education level. However, for those whose parents were
from a non-OECD county, their chances of employment rise faster with education level than
those of children with native-born parents (Table 2.A1.4).This pattern suggests that education
is a strong driver of labour market integration among children of immigrants, particularly
among women.
Irrespective of their education level, native-born immigrant offspring widely show
poorer labour market outcomes than their peers without a migration background – at least
in the European OECD countries (Table 2.A1.2).7 Preliminary analysis based on data from
the PIAAC survey indicates that there are persistent gaps in employment rates between
children of non-immigrants and native-born children of immigrants, even after controlling
for education and literacy skills (Table 2.A1.7).8 The inference is that structural obstacles
other than formal qualifications or mastery of the host-country language undermines use
of the skills of young people from immigrant parents.
Factors that shape differences between the labour market outcomes of immigrantsand their offspring and those of the native-born
Integration takes place over time
Integration is a process that takes time. Labour market outcomes tend to improve with
the years as immigrants gradually acquire the skills required by the host country, which
includes command of the language. However, the gap with those who have no migration
background seldom closes completely.
Comparison of recent and long-settled immigrants reveals that the latter are more
likely to participate in the labour market and less prone to unemployment. In European
OECD countries, an additional year of residence is associated with a 0.2 percentage
point increase in the immigrant employment rate for men and a rise of 0.4 among women
(Table 2.A1.3).9 The improvement is particularly sharp in some immigrant groups,
particularly refugees. Longitudinal data points to similar results in the settlement
countries. The risk of over-qualification also seems to fall – by one percentage point per
year – among employed immigrants born in a lower-income country (Table 2.A1.5).
General labour market conditions matter more for immigrants
General economic conditions obviously shape the labour market outcomes of both
foreign- and native-born workers. Nevertheless, immigrants are, as a rule, much more
widely affected by change because they tend to be overrepresented in cyclical sectors and
occupations. In addition, their jobs are less stable and they tend to enjoy less seniority,
which makes them more likely to be laid off. There is also some, albeit limited, evidence of
employers selectively firing immigrants (Arai and Vilhelmsson, 2003; OECD, 2009). As a
result, the immigrant unemployment rates have grown much faster with the economic and
financial downturn than those of the native-born, particularly in the worst-affected
countries, Greece and Spain (Figure 2.17).
INTERNATIONAL MIGRATION OUTLOOK 2014 © OECD 2014 63

2. LABOUR MARKET INTEGRATION OF IMMIGRANTS AND THEIR CHILDREN: DEVELOPING, ACTIVATING AND USING SKILLS
Examination of how employment rates have evolved since the onset of the crisis
paints an uneven picture (Figure 2.18). On average, the employment rates of both
immigrants and the native-born have fallen by about 2.5 percentage points. And in some
longstanding European destinations – particularly Germany, Austria, and Switzerland – the
foreign-born have actually not been as badly affected as the native-born. In contrast,
however, immigrant joblessness has risen much faster than that of the native-born in the
OECD countries hardest hit by the economic crisis (i.e. those in the third group identified in
Figure 2.4, together with Ireland). Many immigrants in those countries had arrived just
prior to the crisis and struggled hard to find jobs. A protracted period of unemployment,
especially upon arrival, tends to weaken the long-term prospects for successful labour
market integration.
Employers have difficulty judging skills acquired abroad
As noted above, there are often significant differences between immigrants’
qualifications and skills and those of their native-born peers (for more comprehensive
overviews, see Damas de Matos and Liebig, 2014, on qualifications; Bonfanti and Xenogiani,
2014, on skills; and, for a review of the literature, Damas de Matos, 2014).
The previous section pointed to significant, systematic disparities between the labour
market outcomes of the native-born and those of highly educated immigrants, particularly
if they have degrees from non-OECD countries. The same pattern was not necessarily true
of the poorly-educated, however. The inference is that the returns to education are lower
among immigrants than among the native-born, even after controlling for differences in
age, gender, and field of study (Damas de Matos and Liebig, 2014).
Figure 2.17. Evolution of unemployment rates by place of birth,15 to 64 years old, 2007-13
Percentage points
Note: The data for Canada are for the period 2008-12; Turkey: 2008-13; Israel: 2007-11; Chile: 2006-11; Australia andNew Zealand: 2007-12.Source: European countries and Turkey: Labour Force Surveys (Eurostat); Chile: Encuesta de CaracterizaciónSocioeconómica Nacional (CASEN); Australia, Canada, Israel, New Zealand: Labour Force Surveys; Mexico: EncuestaNacional de Ocupación y Empleo (ENOE); United States: Current Population Surveys.
1 2 http://dx.doi.org/10.1787/888933157520
-10
-5
5
15
25
0
10
20
30
Foreign-bornNative-born
German
yIsr
ael
Czech
Rep
ublic
Mexico
Austri
a
Finlan
dChil
e
Austra
lia
Switzerl
and
Belgium
United
Kingdo
m
Canad
a
Turke
y
United
States
Norway
Poland
Luxe
mbour
g
Franc
e
New Ze
aland
Slovak
Rep
ublic
Denmark
Sweden
OECD
Netherl
ands
Eston
ia
Hunga
ry
Icelan
dIta
ly
Sloven
ia
Irelan
d
Portug
alSpa
in
Greece
INTERNATIONAL MIGRATION OUTLOOK 2014 © OECD 201464

2. LABOUR MARKET INTEGRATION OF IMMIGRANTS AND THEIR CHILDREN: DEVELOPING, ACTIVATING AND USING SKILLS
Host-country labour markets tend to devalue foreign qualifications, which affects
employment, leads to over-qualification (see Tables 2.A1.5 and 2.A1.8 for European
OECD countries), and reduces wages (Bonfanti and Xenogiani, 2014). Employment returns to
education abroad – as measured by the increase with an additional year of education in the
probability of being in employment – are only a little more than half the returns of domestic
qualifications, both in Europe and the United States. Indeed, immigrants’ labour market
outcomes seem to be more strongly determined by the country in which they obtained their
qualifications than by the country in which they were born (Damas de Matos and Liebig, 2014).
The downgrading of foreign qualifications on host-country labour markets holds
even after controlling for differences in years of residence and literacy skills (Tables 2.A1.7
and 2.A1.8). It is a key issue in integration, since most immigrants hold foreign degrees
(Figure 2.A1.1).
Estimates suggest that between one-third and one-half of the high observed over-
qualification of immigrants compared with the native-born is associated with lower skills
at given qualification levels (Bonfanti and Xenogiani, 2014; OECD, 2008a; Dumont and
Monso, 2007). Indeed, immigrants with host-country degrees generally enjoy similar labour
market outcomes to their native-born peers. However, it is unclear to what extent the
undervaluing of foreign qualifications may be ascribed to the poor performance of
education systems in countries of origin or to the limited transferability of skills. Further
analysis with PIAAC data should shed some light on this.
Host-country employers downgrade foreign work experience even more than they do
foreign qualifications. However, recent evidence (Picot and Sweetman, 2011) suggests that
attitudes change once immigrants become more familiar with the local labour market and
employers have information that enables them to better judge the value of foreign
qualifications and work experience.
Figure 2.18. Evolution of the employment rates of the foreign- and native-born,15 to 64 years old, 2007-13
Percentage points
Note: The data for Canada are for the years 2008 and 2012, Chile: 2006 and 2011, Israel: 2007 and 2011; Australia,New Zealand: 2007 and 2012; Turkey: 2008 and 2013.Source: Australia, Canada, Israel and New Zealand: Labour Force Surveys; Chile: Encuesta de CaracterizaciónSocioeconómica Nacional (CASEN); European countries and Turkey: Labour Force Surveys (Eurostat); Mexico: EncuestaNacional de Ocupación y Empleo (ENOE); United States: Current Population Surveys.
1 2 http://dx.doi.org/10.1787/888933157538
5
-25 25-15
-10
0
-5
-15 -5 5 15-20 -10 0 10 20
GRC
ESP
BEL
MEXFRA
IRL
ITA
DNK
FIN
SWE
SVN
NLD
ISRHUNEST
GBR
PRT
AUT
DEU
USA AUSCANNZL
LUX
NOR
CHE
ISL
CHL
CZE POL
SVK
TUR
Evolution of the employment rate of the native-born
Evolution of the employment rate of the foreign-born
Worse e
volut
ion of
the f
oreign
-born
vis-à-
vis th
e nati
ve-bo
rn
Better
evolut
ion of
the f
oreign
-born
vis-à-
vis th
e nati
ve-bo
rn
OECD
INTERNATIONAL MIGRATION OUTLOOK 2014 © OECD 2014 65

2. LABOUR MARKET INTEGRATION OF IMMIGRANTS AND THEIR CHILDREN: DEVELOPING, ACTIVATING AND USING SKILLS
Mastering the host-country language is the most important skill for labour market integration
As mentioned above, the single most important skill for succeeding in local labour
markets and, indeed, in society at large is mastery of host countries’ official languages.
Adequately measuring command of language and its links with the labour market is a
challenging task. Literacy, as measured by PIAAC, clearly includes language skills. For
European OECD countries, some self-reported information is available from the 2008
Labour Force Survey on whether immigrants consider that poor language skills are a
barrier to finding a job that matches their qualifications and work experience. Although
self-reporting is far from an objective measure of language skills, it does afford an
immigrant take on language skills and what is adequate for the country’s labour market.
More than one in five immigrants report that language difficulties are a considerable
obstacle to finding a suitable job. Of that proportion, those with low levels of education are
over-represented. Controlling for education level, it appears that immigrants who cite
language as a major difficulty are chiefly those with foreign – particularly non-OECD –
qualifications. Humanitarian immigrants are the most likely to report language difficulties,
followed by family and labour immigrants, while those who state that they immigrated for
the purpose of studying rarely report language problems.
Damas de Matos and Liebig (2014) find that there is a strong negative correlation
between language difficulties and labour market outcomes, notwithstanding entry
categories and the level and country of qualification. After controlling for differences in
other observable characteristics, the authors find that immigrants who struggle with
language are 17 percentage points more likely to be over-qualified for their job than those
who do not report such difficulties. Immigrants’ self-reported language difficulties also
seem to account for much of the disadvantage observed among immigrants compared to
the native-born of a similar age and education level. For labour immigrants who do not
report language problems, the labour market disadvantage seems to disappear entirely.
Immigrants and their children lack networks and understanding of labour markets
Formal qualifications, language, and work experience are only some of the skills
needed to succeed on the labour market. Immigrants also face greater challenges when
seeking jobs and recruitment channels, even when their qualifications are at least
comparable to those of their native-born peers. They are at an obvious disadvantage when
it comes to knowledge of the host-country’s labour market and hiring practices and with
respect to contacts, direct or indirect, with employers.
In all OECD countries, much hiring is through informal contact with employers. The
question of contacts and networks goes well beyond the “I’ll put you in touch with”.
Sometimes, a contact may just be a mere hint that there is an employer who might be
interested. Having contacts is not only an issue for people who immigrated as adults, but
also for the children of immigrants raised and educated in the host country. The reason is
that contact with the first employer – generally for apprenticeship or internships – often
comes about through the parents’ personal networks.
The lack of direct contact between employers and immigrants also fuels the formers’
misgivings about the latters’ skills and productivity. A Swedish study (Åslund et al., 2009)
found that managers are generally much more likely to hire workers with their same
ethnic background, except in cases where the applicant was a former employee.
INTERNATIONAL MIGRATION OUTLOOK 2014 © OECD 201466

2. LABOUR MARKET INTEGRATION OF IMMIGRANTS AND THEIR CHILDREN: DEVELOPING, ACTIVATING AND USING SKILLS
Networks are part of the broader issue of knowledge of a local labour market and how
it functions. Writing applications and presentation in a job interview tend to be highly
country-specific. Differences in this respect are wide even between OECD countries.
Analysis from the Nordic countries (Rosholm et al., 2001) suggests that interpersonal skills
are particularly critical in highly skilled sectors where new technologies and work practices
– e.g. team work, freelancing and virtual offices – are making the workplace more loosely
structured.
Discrimination
Discrimination is also a factor that hinders the access of immigrants and their
native-born offspring to the job market. However, the selective hiring of people from
certain backgrounds and discrimination against those from others is hard to prove (Heath,
Liebig and Simon, 2013; OECD, 2008b). There is always the chance that characteristics that
affect productivity but are not observed directly could account for employer preference for
certain candidates, rather than outright discrimination.
One way to circumvent this are situation and CV-testing studies. These have
demonstrated discrimination in hiring for many OECD countries.10 The results are
summarised in Table 2.1. The tests involve submitting equivalent applications for the same
job from two (fictitious) candidates with the same profile who differ in name alone. Since
applicants’ qualifications need to be very similar, they are given the same level of
attainment in the domestic education system. Test findings therefore chiefly apply to the
offspring of immigrants. They show that it is not uncommon that immigrants and their
offspring have to regularly send out more than twice as many applications before they
secure to a job interview.
Interestingly, given the high incidence of discrimination and the on average lower
educational outcomes of immigrants’ children, it is reasonable to expect that they should
show much higher unemployment rates than are actually observed. One reason seems to be
that immigrants’ offspring compensate for discrimination by making additional efforts to
find work or accepting lower-skilled jobs.11 Survey data from a number of OECD countries
suggest that that is actually what happens – an important finding that merits highlighting.
Although results cannot be directly compared across countries and sectors, one
common finding is that discriminatory practices generally affect immigrant men more
than women. Discrimination is also probably even greater when the labour market is slack,
as companies can afford to pick and choose who they take on. It also tends to be more
pronounced in small- and medium-sized enterprises which not only have fewer contacts
with immigrants, but may also be less willing to take the risk of hiring a person about
whose productivity they know little.
Yet, can uncertainty be justified when it comes to the children of immigrants who
have good host-country qualifications? Indeed, a key finding from Heath, Liebig and Simon
(2013) is that in European OECD countries, native-born children of immigrants report
feeling discriminated against more often than immigrants themselves. The contrast is
stark with non-European OECD countries that have been settled by migration, where the
reverse is the case.
Discrimination has multiple negative effects and its extent, as revealed in testing
studies, is worrying. It not only reduces immigrants’ incentives to invest in education and
training, but also impacts adversely on both the economy and social cohesion.
INTERNATIONAL MIGRATION OUTLOOK 2014 © OECD 2014 67

2. LABOUR MARKET INTEGRATION OF IMMIGRANTS AND THEIR CHILDREN: DEVELOPING, ACTIVATING AND USING SKILLS
Table 2.1. Results from situation testing in 17 OECD countries
Ethnic group Relative call-back rate
Australia Chinese 1.71
Italian 1.1Middle Eastern 1.61
Austria Chinese 1.41
Nigeria 2.01
Serbian 1.31
Turkish 1.51
Belgium Moroccan 1.91
Turkish (compared with Flemish) (Bottleneck jobs) 2.11
Turkish (compared with Flemish) (Non-bottleneck) 1.0Canada (Montreal) African 1.81
Arab 1.61
Latin-American 1.61
Canada (Toronto) Chinese 1.51
Indian 1.31
Pakistani (applicants with Canadian education and experience) 1.41
Finland Russian (names) 2.01
France North African and sub-Saharan African (native-born offspring) 2.01
Germany Turkish 1.41
Greece Albanian 1.81
Ireland African 2.41
Asian 1.81
German 2.11
Italy Moroccan (foreign-born) 1.41
Netherlands Antillean 1.21
Moroccan 1.11
Moroccan (men only) 1.31
Surinamese 1.21
Turkish 1.21
Norway Pakistani (native-born offspring) 1.31
Spain Moroccan (foreign-born) 1.31
Sweden Arabic/African 1.81
Young native Swedes of Middle-Eastern background 2.51
Middle Eastern (men only) 1.51
Switzerland Albanian speakers from former Yugoslavia (in French-speaking areas) 1.31
Albanian speakers from former Yugoslavia (in German-speaking areas) (foreign-born men) 2.51
Portuguese (in French-speaking areas) 1.1Turkish (in German-speaking areas) 1.41
United Kingdom Black African 1.71
Black Caribbean 1.91
Chinese 1.91
Indian 1.91
Pakistani/Bangladeshi 1.51
United States African American 1.51
Latinos 1.2Black 2.01
1. Significantly different from 1.0. The relative call-back rate is the number of applications that a person from thegroup concerned has to send out – relative to a person without an “immigrant background” – before he or she isinvited to a job interview.
Source: For full references and discussion: Heath, Liebig and Simon (2013), except for: Austria: Hofer et al. (2013);Finland: Larja et al. (2012); Germany: SVR (2014).
1 2 http://dx.doi.org/10.1787/888933157823
INTERNATIONAL MIGRATION OUTLOOK 2014 © OECD 201468

2. LABOUR MARKET INTEGRATION OF IMMIGRANTS AND THEIR CHILDREN: DEVELOPING, ACTIVATING AND USING SKILLS
In summary, while immigrants and their offspring face a number of labour market
integration challenges, they should not overshadow the fact that, in most OECD countries,
the majority of immigrants and their children are in work. This is an important point, since
relatively few of the foreign-born in OECD countries arrive with the same advantages and
skills as the native-born, who have domestic degrees, local contacts, and native-speaker’s
advantage on the labour market. Yet immigrants and their children still have much
potential to offer. The next section sets out to explore which policies help tap into it.
What policies matter for immigrant integration?When it comes to integrating immigrants and maintaining employment levels,
appropriate skills investment – to develop, activate, and use them effectively in the
host-country’s labour market – can make immigration a tool for meeting the labour market
challenges that stem from population ageing. In addition to driving long-term growth,
investment in the skills of immigrants and their native-born children can, at the individual
level, help them make the most of their potential and go some way to halting the
transmission of disadvantage from one generation to the next. Workers with higher skills
– be they immigrants or native-born – are more productive, tend to earn more, and have
brighter employment prospects.
The OECD Skills Strategy (OECD, 2012a) is an instrument designed to help governments
better understand how to identify the strengths and weaknesses of their existing training
and education systems. Adapted to immigrants and their children, its holistic approach can
help harness the widely underutilised skills of immigrants and their children as part of an
integration policy that contributes effectively to the overall goals of better jobs, economic
growth, and social inclusion.
The Skills Strategy builds on three pillars:
● Putting existing skills to effective use on the labour market requires effective policies
and investment. The first step is to take stock and “recognise” immigrants’ skills
appropriately. Foreign-born adults bring skills formalised by foreign qualifications and
shaped by work experience that host countries often fail to fully acknowledge.
Successful entry into the labour market has a profound impact on a person’s career
and subsequent use of skills, while the scarring effects of a poor start may lead to
unemployment or over-qualification that workers struggle to overcome later in their
careers. Skills that go unused tend to atrophy, while work experience often brings out
new ones. Integration policies should begin by clearly communicating information about
the skills that are needed and available, so helping to connect qualified workers with
potential employers and averting the risk of unemployment and over-skilling.
● Developing skills that meet the needs of the labour market. Policies to develop skills
seek to ensure that the supply of skills in the labour market is sufficient, in both quantity
and quality, to meet current and emerging needs. Within integration policy, it is
important to foster the right mix of skills through education and training.
● Activating skills currently not supplied to the labour market. Activating skills
encourages inactive working-age people to seek a job or retrain. They may have many
skills but not offer them on the labour market out of choice, for personal or family
reasons, because of poor perceived employment prospects, or financial disincentives to
work or hire. To activate skills effectively, governments can create financial incentives
INTERNATIONAL MIGRATION OUTLOOK 2014 © OECD 2014 69

2. LABOUR MARKET INTEGRATION OF IMMIGRANTS AND THEIR CHILDREN: DEVELOPING, ACTIVATING AND USING SKILLS
that make work pay and dismantle non-financial barriers to labour market participation.
Activating skills effectively may require galvanising employers and tackling their
reluctance to hire individuals who are inactive or drifting away from the labour force.
The diagram below (Figure 2.19) shows how the skills strategy can be adapted to
integrating immigrants.
Investing in skills involves all three of the inter-linked pillars. Ultimately, policies can
enhance the use only of skills that have been developed and activated. If their skills are
used effectively workers are more likely to be inclined to invest in developing them and feel
encouraged to remain active. When it comes to the foreign-born, proper assessment and
recognition of their existing skills will avoid any unnecessary investment in developing
them and will focus any additional training on the critical missing skills. At the same time,
activating existing skills – through early integration in the labour market – may facilitate
the development of further ones, like language, among new arrivals.
This chapter draws on the three pillars of the OECD Skills Strategy – developing,
activating, and putting skills to effective use. For the offspring of immigrants and the
native-born, the Strategy rightly takes the development of skills as its starting point. The
first part of this chapter considers the importance of recognising and harnessing existing
skills to bring foreign-born adults into the labour market. Immigrant adults bring
qualifications and skills with them and getting them into employment early has become a
key policy goal. The second part goes on to demonstrate how immigrants and their
offspring can effectively activate and develop the right skills for participating in the labour
market on an equal footing with the native-born and their offspring.
Figure 2.19. Using the OECD Skills Strategy framework to integrate immigrants
Using
Developing Activating
Make sure skills are used to their full potential:• Recognising skills• Gaining experiences• Accessing help
Developing critical missing skills with strategic investments in:• Children: ECEC and apprenticeships • Adults: Bridging courses and
further training• All: Language training
Ensuring shills are not wasted by remaining inactive• Activating immigrants:
Particularly NEET and women• Activating employers:
Overcoming discrimination• Activating immigrants as
employers: Promoting entrepreneurialism
INTERNATIONAL MIGRATION OUTLOOK 2014 © OECD 201470
2. LABOUR MARKET INTEGRATION OF IMMIGRANTS AND THEIR CHILDREN: DEVELOPING, ACTIVATING AND USING SKILLS
Putting skills to use
Putting the skills of the foreign-born to effective use requires recognising them and
putting them into practice. It can involve overcoming additional hurdles and may, at times,
require extra help to connect immigrants with employers so that they can evaluate
immigrants’ skills rather than acting on preconceptions.
Assessing and recognising immigrants’ skills
The first step in putting immigrants’ skills and qualifications to effective use is to
gather information about these qualifications and to make them available to potential
employers. Employers, the public and even immigrants themselves may be uncertain
whether a foreign qualification actually represents the skills that are needed in the labour
market. Assessing and recognising these qualifications is often a helpful first step in the
integration process and helps immigrants to access jobs that are appropriately matched to
their skills and qualifications. Assessing the skills of foreign-trained immigrants can help
to identify needs for additional training and work experience.
Many actors are involved in ensuring that the skills and qualifications of immigrants
are appropriately recognised and used:
● Educational authorities assess and certify the comparability of qualifications from
abroad, often to decide whether an applicant qualifies for a specific study programme.
● Professional bodies assess and recognise qualifications in their regulated field of expertise.
● Dedicated recognition bodies may certify qualifications, provide information, co-ordinate
other actors involved and are often a first point of contact for potential applicants.
● Co-operation with employers in the recognition process can improve their appreciation
of immigrants’ foreign qualifications.
Recognising immigrants’ skills primarily takes two forms: assessment and recognition
of formal qualifications and the validation of competences.
Assessment and recognition of formal qualifications. The formal assessment and
recognition of foreign qualifications is an important tool for authorities as they seek to help
employers overcome their misgivings about the skills of immigrants. Formal recognition by
educational or professional bodies certifies the authenticity of the qualification and its (full
or partial) equivalence with a domestic qualification that is better known to employers or
grants a domestic degree directly. Formal recognition is needed to exercise regulated
professions, such as medicine or law. Such professions, however, are generally only a small
share of the labour market. In other cases, the assessment and recognition procedure
can nevertheless be useful as an official certification of qualifications and a touchstone
for employers who are unsure about the true value of immigrants’ foreign qualifications
– particularly those obtained in education systems that are very different from the host
country’s. Ultimately, however, “recognition” of immigrants’ skills lies with employers who
decide if they want to accept the foreign qualifications, whether they have undergone a
formal assessment and recognition procedure or not. It is thus important that they have
confidence in the outcome of the accreditation process.12
Data from selected EU countries shows that completion of a formal assessment and
recognition procedure is associated with higher employment and better jobs for
immigrants. It helps, for example to reduce over-qualification, as measured in the
percentage of the highly educated who are employed below their formal education level.
INTERNATIONAL MIGRATION OUTLOOK 2014 © OECD 2014 71

2. LABOUR MARKET INTEGRATION OF IMMIGRANTS AND THEIR CHILDREN: DEVELOPING, ACTIVATING AND USING SKILLS
The over-qualification gap between the foreign- and native-born is significantly narrower
among immigrants who obtained recognition than among those who do not even apply.
The improvement in labour market outcomes associated with recognition is particularly
pronounced among immigrants from lower-income countries, i.e. those whose education
systems tend to differ widely from those of OECD countries (Figure 2.20).
Some benefits derive from the fact that formal assessment and recognition is often the
starting point for obtaining a host-country qualification that is highly valued in the labour
market. For example, foreigners generally require formal certification that their
qualifications are equivalent to at least to an upper secondary degree before they can enter
the country’s tertiary education system.
Across the European OECD countries, those most likely to apply for recognition are
non-EU immigrants who arrive as students or ultimately obtain a tertiary-level degree in
the host country. This finding indicates that accreditation is used mainly within the
confines of the higher education system by immigrants pursuing their studies. Application
rates are much lower among humanitarian and family immigrants and lowest among
labour immigrants. Those with degrees in the health sector are also most likely to apply,
Figure 2.20. Shares of highly educated foreign-born workers in jobs matchingtheir formal qualifications in selected European OECD countries,
by recognition of qualifications, 2008Percentage points differences with native-born
Note: “-10” means that the highly educated immigrants in employment have a probability to be in a job according totheir qualification that is 10 percentage points lower than the native-born. Highly educated corresponds to tertiaryeducation. They are considered to hold a job “according to their qualification” if the job is classified as ISCO 1 to 3(ISCO stands for International Standard Classification of Occupations). High-income countries include EU27,North America and Oceania. No finer categorisation is possible with the level of precision of the Labour Force Survey.Source: Labour Force Surveys (Eurostat) 2008 ad hoc module on the labour market situation of migrants and theirimmediate descendants.
1 2 http://dx.doi.org/10.1787/888933157551
-70
-60
-40
-20
0
20
-50
-30
-10
10
30
Recognition grantedDid not apply for recognition
Low
er-in
com
e co
untri
es
High
-inco
me
coun
tries
Low
er-in
com
e co
untri
esHi
gh-in
com
e co
untri
es
Low
er-in
com
e co
untri
esHi
gh-in
com
e co
untri
es
Low
er-in
com
e co
untri
es
High
-inco
me
coun
tries
Low
er-in
com
e co
untri
esHi
gh-in
com
e co
untri
es
Low
er-in
com
e co
untri
esHi
gh-in
com
e co
untri
es
Low
er-in
com
e co
untri
esHi
gh-in
com
e co
untri
es
Low
er-in
com
e co
untri
esHi
gh-in
com
e co
untri
es
Low
er-in
com
e co
untri
esHi
gh-in
com
e co
untri
es
Low
er-in
com
e co
untri
esHi
gh-in
com
e co
untri
es
Low
er-in
com
e co
untri
esHi
gh-in
com
e co
untri
es
ITA ESP DEU SWE IRL PRT AUT NLD CHE BEL LUX
INTERNATIONAL MIGRATION OUTLOOK 2014 © OECD 201472

2. LABOUR MARKET INTEGRATION OF IMMIGRANTS AND THEIR CHILDREN: DEVELOPING, ACTIVATING AND USING SKILLS
with rates 16 percentage points above the second most common field of study, which is
teaching and education. Recognition thus appears to be only standard practice within
certain highly regulated professions. Nevertheless, it yields positive results for a wide
range of applicants, regardless of their reasons for migrating, their field of study, or where
they obtained their degrees (Damas de Matos and Liebig, 2014).
In most countries for which data are available, though, it seems that despite the apparent
career benefits, and the fact that full or partial recognition is generally granted to applicants,
only a minority of immigrants with foreign qualifications actually do apply (see Figure 2.21).
Possible explanations for the low application rates point to the fact that assessment
and recognition is not yet a standard part of most countries’ integration policies. Outside
higher education and the health sector, immigrants and integration service-providers may
simply not know that there is such a procedure or that it can convey benefits.
A further explanation is that immigrants know about assessment and recognition but
perceive the procedure as too burdensome or complex. Indeed, authorities responsible for
this process are often numerous, disconnected from and unrelated to the bodies generally
responsible for integration and employment. Additional formalities often surface,
depending on the level and regulation of professions. For example, while universities are
often in charge of the assessment and recognition of tertiary-level qualifications, it is the
Figure 2.21. Percentages of highly educated immigrants, aged 15-24,who apply for accreditation of their foreign qualifications,
selected European OECD countries, 2008
Note: Highly educated corresponds to tertiary education. The sample excludes persons who are not working, havenot found a job which will start later and would not like to have work. High-income countries include EU27,North America and Oceania. No finer categorisation is possible with the level of precision of the Labour Force Survey.Source: Labour Force Surveys (Eurostat) 2008 ad hoc module on the labour market situation of migrants and theirimmediate descendants.
1 2 http://dx.doi.org/10.1787/888933157565
0
10
30
50
20
40
60
AUT BEL ESP FRA DEU GRC IRL ITA LUX NLD PRT SWE CHE
Recognition granted Other applications (not or not yet granted)
Low
er-in
com
e co
untr
ies
Hig
h-in
com
e co
untr
ies
Low
er-in
com
e co
untr
ies
Hig
h-in
com
e co
untr
ies
Low
er-in
com
e co
untr
ies
Hig
h-in
com
e co
untr
ies
Low
er-in
com
e co
untr
ies
Hig
h-in
com
e co
untr
ies
Low
er-in
com
e co
untr
ies
Hig
h-in
com
e co
untr
ies
Low
er-in
com
e co
untr
ies
Hig
h-in
com
e co
untr
ies
Low
er-in
com
e co
untr
ies
Hig
h-in
com
e co
untr
ies
Low
er-in
com
e co
untr
ies
Hig
h-in
com
e co
untr
ies
Low
er-in
com
e co
untr
ies
Hig
h-in
com
e co
untr
ies
Low
er-in
com
e co
untr
ies
Hig
h-in
com
e co
untr
ies
Low
er-in
com
e co
untr
ies
Hig
h-in
com
e co
untr
ies
Low
er-in
com
e co
untr
ies
Hig
h-in
com
e co
untr
ies
Low
er-in
com
e co
untr
ies
Hig
h-in
com
e co
untr
ies
INTERNATIONAL MIGRATION OUTLOOK 2014 © OECD 2014 73

2. LABOUR MARKET INTEGRATION OF IMMIGRANTS AND THEIR CHILDREN: DEVELOPING, ACTIVATING AND USING SKILLS
job of professional bodies to grant recognition of qualifications in regulated professions.
And overly cumbersome procedures can effectively exclude certain professional and
academic qualifications. Administrative complexities are even greater in countries where
education and employment authorities are decentralised or whose duties overlap.
Immigrants may encounter additional procedural hurdles, such as complicated
documentation requirements, high fees, a potentially long wait for a decision, and a lack of
transparency in the whole process. In some cases, too, a host country’s authorities are unable
to check on the degree from the country of origin – if, for example, the applicant is a refugee
from a conflict zone or failed state. All such obstacles can deter foreign-educated immigrants
from applying for recognition, so that only those certain to succeed in the end may apply.
Facilitating and promoting assessment and recognition of foreign qualifications has
been a key recent policy trend in OECD countries, especially those seeking to attract highly
educated immigrants. Germany’s Federal Recognition Act instituted the right to an
assessment in federally regulated professions through a more standardised, transparent
procedure. In 2012, its first year in force, the act prompted 30 000 applications – mostly
from EU citizens and in the health sector – and a high recognition rate.
Other countries, such as Denmark and Slovenia, also set forth the assessment and
recognition procedure through laws that create the clear entitlement to assessment
in regulated and non-regulated professions. Canada has drawn up a non-binding
framework – the 2009 Pan-Canadian Framework for the Assessment and Recognition of
Foreign Qualifications – which spells out to all provinces and territories common principles
for improving fairness, transparency, timeliness, and consistency. A few countries have
introduced uniform structures for the assessment and recognition of all foreign
qualifications. Examples are some Nordic and Central European countries and the
United Kingdom. Even without such structures, some countries have put in place one-stop
shops to process all applications (e.g. the Netherlands) and counselling services to assist
applicants (e.g. Austria, Canada, Germany, Denmark, and Sweden).
Validation of competencies. A related issue is the broader validation of competencies,
obtained both formally and informally. This “accreditation of prior learning” is increasingly
widespread among OECD countries and often focuses on the certification of intermediate-level
skills of individuals who do not have a formal – or formally recognised – educational degree.
However, while it might be expected that immigrants are overrepresented, as they would seem
to benefit overwhelmingly from such certification, data on programmes from a number of
OECD countries reveal that they are in fact underrepresented (OECD, 2008a and 2012c).
In several OECD countries – such as Belgium, Denmark, France, the Netherlands,
Norway, Sweden and Switzerland – the public employment services have well established
general procedures for assessing and validating skills, competencies, and work experience.
Some countries have also developed immigrant-specific validation tools. One such tool is
Denmark’s “Competence Card”.
The Competence Card helps to make immigrants’ skills more visible to prospective
employers and to connect them with labour market needs. The relevant institution assesses
and documents individuals’ professional, linguistic, and general skills. Competencies are
placed on a digital competence card that can be used to seek jobs or further education. As
with formal recognition of qualifications, accreditation of prior learning should involve
employers in the certification process if it is to be successful. It is ultimately up to them to
INTERNATIONAL MIGRATION OUTLOOK 2014 © OECD 201474

2. LABOUR MARKET INTEGRATION OF IMMIGRANTS AND THEIR CHILDREN: DEVELOPING, ACTIVATING AND USING SKILLS
accept the outcome. Denmark has again taken an innovative approach here, drawing not
only the public employment service into the validation process, but the social partners, too.
Gaining experience: Integrating immigrants and their skills into the workplace
Working can be just as effective as formal study for developing a wide range of skills.
Yet beyond the accreditation of foreign qualifications and competences, there are many
hurdles still facing the effective use of immigrant skills on domestic labour markets. They
relate to employers’ experience with using those skills and public perceptions of them.
Practical experience – in both the private and public sectors – is a valuable tool for
debunking preconceptions and misinformation. It also helps to ensure that immigrants are
given the opportunity to integrate and develop their skills.
Early integration in the labour market can set off a virtuous circle in the development
and use of immigrants’ skills as on-the-job learning, language use, and social integration
mutually reinforce one another. Indeed, early labour market integration is a good predictor
of outcomes in the long run. However, even when qualifications have been formally
recognised, employer reticence as to the level and relevance of skills and experience
obtained abroad can limit their willingness to hire foreign-born applicants. Against this
backdrop, policies that bring immigrants into contact with employers and allow them to
familiarise themselves with immigrants have proven particularly effective.
Work experience schemes – a chance to demonstrate skills. Instruments through which
private-sector employers can be encouraged to offer work experience to foreign-born workers
include subsidised wages, work placements, and internships. Policies that involve some
element of employment experience can give them an opportunity to demonstrate to potential
employers the relevance of their skills and qualifications. Such policies offset the employer
uncertainty that widely affects demand for immigrant workers. Indeed, many of the most
effective active labour market programmes (ALMPs) – for both native and foreign-born
beneficiaries – combine work experience with on-the-job training.
Available evaluations from North-West Europe (see e.g. the meta-analysis by Butschek
and Walter, 2013; and Nekby, 2008) suggest that private-sector incentive schemes,
specifically wage subsidies and work placements, can be effective instruments. They are
utilised to varying degrees in OECD countries and have been found to be most effective when
implemented early – within the first six months of unemployment or in the first year(s) after
arrival. The evaluations also found that such measures, particularly wage subsidies, often
have a much stronger positive impact on immigrants than on their native-born peers.
The risk, however, associated with such private-sector incentive schemes of the wage
subsidy sort is that they may crowd out hiring. In other words, employers may choose to
rely on subsidised labour instead of regular contracts and therefore be reluctant to offer
permanent jobs to programme participants when subsidies comes to an end. Such policies
must therefore be carefully designed, targeted at the jobseekers most in need, used on a
temporary basis, and made conditional on firms not substituting existing workers with
subsidised ones. Combining subsidised work with on-the-job-training can help overcome
that risk, as job-specific training will raise the productivity of the programme participant
as subsidies are reduced. Sweden’s “Step-in” jobs programme, for example – introduced
in 2007 – grants a subsidy of 80% of gross wage costs for up to 24 months to employers who
hire new arrivals. This employment subsidy can be combined with Swedish language
training to prevent language hurdles from holding back rapid labour market integration.
INTERNATIONAL MIGRATION OUTLOOK 2014 © OECD 2014 75

2. LABOUR MARKET INTEGRATION OF IMMIGRANTS AND THEIR CHILDREN: DEVELOPING, ACTIVATING AND USING SKILLS
Other programmes targeted at the rapid integration of foreign-born workers in Sweden
include: “New Start Jobs”, which gives tax relief to employers who hire foreign-born (or
long-term unemployed) workers; funded apprenticeships; and the new “Applied Basic Year”
which combines on-the-job vocational training with language instruction.
Similarly, the Danish “Stepmodel” applies three steps combining language training,
work placements, and wage subsidies that are phased out as workers’ productivity
increases. Unemployed newcomers from non-Western countries first undergo intensive
language training and labour market orientation. They are then given a state-financed
work placement and, where possible, on-the-job language training. In the third and last
phase, employers are expected to offer workers a job which the state may subsidise for up
to one year while they acquire further language and skills trainings.
Despite the benefits that wage subsidies and similar policy measures seem to afford
immigrants, they are rarely explicitly designated as a target group and are largely
underrepresented among beneficiaries. Generally speaking, while the foreign-born tend to
be more or less fairly represented among the participants in ALMPs as a whole, they are
often underrepresented in the schemes from which they benefit most. Such a pattern has
emerged, for example, in Austria, Belgium, Denmark, the Netherlands, Norway, and
Switzerland (OECD; 2007, 2008a, 2012c).
There are several possible explanations for the underrepresentation. In the first place,
immigrants may not know programmes are available and may instead be directed towards
classroom-based vocational and language training, which can be difficult to combine with
work. A second reason for the low take-up among the foreign-born may lie – as with
regular employment – on the demand side. Employers may not have much contact with
foreign-born workers or not realise that immigrant candidates are eligible for the schemes
concerned. It is also conceivable that some employers are simply unwilling to give
immigrants a chance. Finally, in some countries – such as Ireland, Korea and several
Central European countries – there are legal barriers preventing some categories of
newcomers from accessing public employment services.
Temporary employment agency work as a stepping stone. Another channel of work
experience in host countries is through contracts arranged by temporary employment
agencies. Indeed, in some countries – such as the Netherlands, Sweden, and Germany –
there is evidence that the proportion of ethnic minorities among temporary agency
workers is higher than among other employees. While the expansion of “temping” has
raised concerns that it may be crowding out more stable forms of employment, it can
actually be a valuable stepping stone into such work for foreign-born workers – whose
skills often prompt misgiving when they lack domestic qualifications and experience.
Depending on the country, between around one-third and two-thirds of temporary workers
move into a permanent position within two years, and there is some evidence that foreign-
born “temps” are more likely to make the transition (see OECD, 2008a).
However, private temporary employment agencies play no formal role in the
integration process and have little connection with integration service providers and
immigrant communities. The risk of relying on them to help immigrants gain experience
is that they train their sights on the most employable workers, the “easy ones” who are
most likely to reflect employer preferences. Ultimately, therefore, they may actually
sideline foreign-born who face greater obstacles to labour market integration.
INTERNATIONAL MIGRATION OUTLOOK 2014 © OECD 201476

2. LABOUR MARKET INTEGRATION OF IMMIGRANTS AND THEIR CHILDREN: DEVELOPING, ACTIVATING AND USING SKILLS
Employment in the public sector and the role of the public discourse. An important
factor in shaping the way immigrants’ skills are perceived by employers and society at
large is the public discourse on migration and integration issues (Huddleston et al., 2013).
The challenge with respect to public opinion is not to secure a consensus on immigration
and integration issues, but rather to halt the perpetuation of preconceptions. A fact-based,
solution-oriented public discourse helps to counter stereotypes about immigrants and
dispel employers’ doubts about their skills.13 The public discourse not only influences
public acceptance of future immigration in OECD countries, it may also play a crucial part
in the integration of existing immigrant populations. Negative messages with regard to
immigrants encourage discrimination, which may in turn affect the behaviour of
immigrants themselves and lead to under-investment in their skills and labour market
integration. In that event, anxieties over immigration would become self-fulfilling
prophecies (OECD, 2010b; Liebig, 2011).
Negative public discourse also affects immigrants’ self-confidence and their ability to
give their best in host countries. Experiments show that exposing the foreign-born to
negative stereotypes and anti-immigrant messages substantially lowers their performance
on cognitive tests.14 Those who internalise stereotypes become more anxious, more
distracted, less confident, and less motivated.
Perceptions of immigrants are partly shaped by their visibility in normal, everyday life.
And, while the private sector, too, has its part to play, the public sector has proven
particularly important in influencing perceptions. By employing qualified immigrant
candidates, it acts as a role model for the private sector. Working in the public sector
heightens the visibility of immigrants’ as playing a normal part in everyday life. Greater
diversity in public sector staff can help to enhance understanding of immigrants’ needs by
government institutions. And, when immigrants work in key occupations such as teaching,
they can also serve as role models for others, particularly immigrant youth. Finally,
employment in the public sector gives the government a lever with which to further labour
market integration, as it has a more direct bearing on its own employment decisions than
on those in the private sector.
With the exception of some healthcare professions, relatively few jobs in the public
service are typical entry jobs for new arrivals, so it is not surprising that immigrants tend
to be underrepresented even in the longer run. However, as Figure 2.22 shows, even the
native-born children of immigrants are more under-represented in the public than in the
private sector in most European OECD countries, which include those with large,
longstanding populations of native-born offspring, such as Austria, Belgium and Germany.
The reason may, in some cases, be that not all children born in a host country have its
nationality, although that is generally not a major obstacle. A further explanation is that
people are more likely to join the public service if one of their parents is or was employed
there. There is less chance of that among immigrants and their children.
In recent years, several OECD countries have stepped up their efforts to promote the
employment of immigrants and (particularly) their children in the public sector. Most
OECD countries have now removed legal restrictions on foreign nationals working in public
sector and civil service jobs unrelated to the exercise of public authority.15 Some have gone
further and actively encouraged the employment of immigrants and their offspring in the
public sector, often as part of broader equal employment policies (EEPs) (Heath, Liebig and
Simon, 2013). EEPs generally take as their benchmark the equitable representation of
INTERNATIONAL MIGRATION OUTLOOK 2014 © OECD 2014 77

2. LABOUR MARKET INTEGRATION OF IMMIGRANTS AND THEIR CHILDREN: DEVELOPING, ACTIVATING AND USING SKILLS
immigrants and their children at all levels of the public sector. Policymakers make a
commitment to the benchmark and develop promotional activities and diversity
management practices.
Countries with well-developed public sector EEPs in the public sector have often
managed to improve the representation of immigrants and their descendants over time,
compared with those countries that have not done so. In addition to the well-known
examples of affirmative action in the US and employment equity policies in Canada, the
United Kingdom has had policies in place since 2000 and broader equality duties since 2010.
Similarly, Sweden introduced measures for ethnic and religious affirmative action in 1999
and reinforced them in 2009. In 2012, the proportion of new hires in the public sector who
have an immigrant background succeeded their population share for the first time. Indeed,
monitoring should rather focus on new hiring than on the stock of those employed.
The Netherlands, too, has a long tradition of such policies in the public sector. They
were particularly robust in the late 1980s and early 1990s, though some of the more
pro-active policies have recently been replaced by monitoring and reporting requirements.
They may nevertheless have an impact as awareness-raising tools. Over the past decade,
Norway has introduced legal obligations for the public sector to interview immigrant
candidates, set up diversity recruitment plans, set targets, and provided diversity training
Figure 2.22. How immigrants’ native-born offspring are represented in the publicand private sectors compared to the children of the native-born
in selected OECD countries, 2008-09Percentage points difference between native-born children of two immigrant parents
and children of two native-born parents, persons aged 15-34
Note: Employment in the public sector is defined as the population working in public administration, human health,and social work activities or in education with the exception of Australia where it includes only employment innational, state/territory and local governments. The striped bars indicate that the differences are not statisticallysignificant (at a 5% level), excluding the OECD average. A 5 percentage point negative difference means that native-bornchildren of immigrants are five percentage points less likely to work in the given sector than children of the native-born.Source: European countries: Labour Force Surveys (Eurostat) 2008 ad hoc module on the labour market situation ofmigrants and their immediate descendants and the 2009 ad hoc module on the entry of young people into the labourmarket; Australia: Population Census 2011; Israel: Labour Force Surveys 2008-09; United States: Current PopulationSurveys 2008-09.
1 2 http://dx.doi.org/10.1787/888933157576
-25
-20
-10
0
10
-15
-5
5
15
Public employment Private employment
Israe
l
Hunga
ry
Austra
lia
Eston
ia
Franc
eIta
ly
United
States
United
Kingdo
m
Czech
Rep
ublic
Sloven
ia
Irelan
dOEC
D
Greece
Norway
Sweden
Switzerl
and
Austri
a
Netherl
ands
Spain
Denmark
German
y
Belgium
Luxe
mbourg
INTERNATIONAL MIGRATION OUTLOOK 2014 © OECD 201478

2. LABOUR MARKET INTEGRATION OF IMMIGRANTS AND THEIR CHILDREN: DEVELOPING, ACTIVATING AND USING SKILLS
for hiring managers. The available evidence suggests that Norwegian action has yielded
improved outcomes, with the public sector making a disproportionate contribution to the
higher employment rates among immigrants from lower-income countries in recent years.
Denmark’s 2003 diversity agenda also set an equity benchmark for all state and municipal
governments, investing funds and introducing major pilot schemes. Specific targets have
been set, a regular employment statistics watch has been put in place, and small financial
incentives provided.16 Such measures have been backed by relatively good monitoring
mechanisms and shown some positive results.
Naturalisation as a signal of motivation and intentions to stay. There are a number of
other ways to overcome employer reticence apart from government equity measures. One
way would be if immigrants were able to send out signals about their employability.
Naturalisation is one such message. Employers tend to interpret it as a sign of integration
and higher productivity – maybe because it denotes a better command of language or
greater motivation. Multivariate and longitudinal analyses from several OECD countries
have identified a “citizenship premium”, although it cannot necessarily be observed in all
countries and for all immigrant groups (Liebig and Von Haaren, 2011).17
Immigrants who have naturalised generally enjoy better employment outcomes than
their peers with similar characteristics and years of residence. Naturalised men from
non-OECD countries are 3.7% more likely to be employed than foreigners, controlling for
other individual factors (Table 2.A1.3 in the annex). Young native-born adults with
foreign-born parents are also slightly more likely to be employed if they are nationals of their
country of birth, even after controlling for their age, education level, and family situation.
Such a “naturalisation premium” has also been observed in longitudinal studies that
followed the same people over time (see the overview in OECD, 2011). Furthermore,
CV testing experiments have found that employers more frequently give a naturalised
immigrant a job interview than a foreign applicant with the same qualifications (Heath,
Liebig and Simon, 2013).
There are three possible explanations for the citizenship or naturalisation premium,
which tends to have its most pronounced effect among immigrants from lower-income
countries (OECD, 2011). Firstly, as indicated above, naturalisation allows immigrants to
signal that they are, or intend to be, settled and “integrated” citizens of their host countries.
Employers and the public respond positively, harbouring less doubts about immigrants’
intentions of staying on and inferring a greater determination to integrate.
Secondly, although legal and administrative barriers to taking on foreigners are few
and, where they do exist, not widely restrictive – at least for foreigners with a permanent
status, some employers may still think formal barriers are in place.18 However, there is no
need to check a naturalised person’s right to work or sponsor them for a work permit.
Thirdly, naturalisation gives immigrants additional incentives and opportunities to invest
in country-specific skills, both during and after the naturalisation process. Employers may
also be more willing to invest in training naturalised immigrants who now have a secured
future in the country. As for the native-born children of immigrants, their acquisition of
citizenship at birth or when young, sends the signal that they are considered part of
society. Indeed, data from the 2008 European Value Survey show that being born in a
country is the determinant most widely cited by nationals of what it means to be a citizen
of that country.
INTERNATIONAL MIGRATION OUTLOOK 2014 © OECD 2014 79

2. LABOUR MARKET INTEGRATION OF IMMIGRANTS AND THEIR CHILDREN: DEVELOPING, ACTIVATING AND USING SKILLS
While naturalisation can be a useful tool for integration, it should be used with caution
– not least because public opinion may need convincing that reforms to ease naturalisation do
not “devalue” citizenship. Indeed, many OECD countries with liberal access to citizenship in
terms of duration-of-residency requirements have reinforced other criteria for naturalisation
to avoid the misperception that citizenship is being “given away”. Interestingly, however, there
is no evidence that the integration outcomes associated with the acquisition of citizenship are
weaker in countries with more inclusive naturalisation policies. Nor does dual nationality
seem to harm immigrants’ labour market integration (Mazzolari, 2009).
There is, however, a case for encouraging citizenship take-up through public campaigns
and by removing barriers to citizenship in countries where they are particularly restrictive.
Over the past 15 years citizenship reforms in many countries have, to varying degrees:
accepted dual nationality; set basic requirements for immigrant adults; removed practical
obstacles in the naturalisation procedure, and created some form of birthright citizenship for
the native-born children of immigrants. As for duration-of-residence requirements, there
seems to be a general swing towards the five-to-eight year range. Promotional campaigns are
also increasingly popular, encouraging eligible applicants to apply and assisting them in
meeting requirements. Promoting citizenship is a longstanding policy in many OECD
countries that have been settled by migration – e.g. Australia, Canada, New Zealand, and the
United States – and is gradually spreading to European OECD countries.
Tools for promoting citizenship include information campaigns and free preparatory
courses, materials and practice tests. Citizenship ceremonies that publicly recognise
naturalised immigrants are now the practice in most OECD countries. These and other
measures are being increasingly adopted in European countries with large foreign
populations, from Portugal and Sweden to the Baltic States and, most recently, Ireland, and
more specifically in cities in Austria, Germany, and Italy (Huddleston, 2013). A number of
countries, such as Korea, make it easier for migrants who have successfully attended
integration courses to naturalise.
Notwithstanding the recent policy efforts, many migrants who would in principle be
eligible for citizenship have not yet naturalised (Figure 2.23). Between 50% and 80% of
immigrant adults have not naturalised, even after living for ten years or more in countries
such as Austria, Chile, Switzerland, Estonia, Italy, Spain, Greece, and Luxembourg. Among
the countries with significant immigrant populations not affected by border changes, the
share of naturalised immigrants exceeds 80% only in Australia, Sweden, the Slovak
Republic, Slovenia and Canada, all of which have generous provisions for naturalisation.
Indeed, the shares of even native-born children of immigrants with host-country
nationality are relatively low in countries like Estonia, Germany, Luxembourg, Switzerland,
and most Southern European countries.
Accessing help: Improving immigrants’ use of job-search support
The public employment service. In many OECD countries, the public employment service
(PES) is the primary actor connecting jobseekers with employers. While structures differ
from one country to another, the PES generally plays a key role in matching labour supply
and demand by providing information, placing workers, and enhancing their employability
through active labour market policies (ALMPs).19 Labour force survey data suggest that, in
many countries across the EU, less than 10% of the population relied on the PES when
searching for their current job or setting up a business. In Spain, Ireland, Italy, Luxembourg,
and Portugal – i.e. countries where many labour immigrants have arrived in recent years –
INTERNATIONAL MIGRATION OUTLOOK 2014 © OECD 201480

2. LABOUR MARKET INTEGRATION OF IMMIGRANTS AND THEIR CHILDREN: DEVELOPING, ACTIVATING AND USING SKILLS
the foreign-born population rely on the PES even less than their native-born counterparts
(Figure 2.24). The reverse is the case in Austria, Germany and the Netherlands, which all to
some degree include immigrants in their ALMP target groups.
The role PESs play in integrating immigrants varies widely, although many countries
have assigned it a key role and have taken specific measures to back it up:
● PESs in countries such as Austria, the United Kingdom, the Nordic countries, and
Belgium’s Flemish region, have made immigrants and their children explicit ALMP target
groups. PESs may thus devote greater resources to people from an immigrant
background in the form of training, outreach activities, staff specialisation, and the
provision of one-stop shops or contact points on integration. Other countries, like
Australia, seek to give immigrants equal representation in ALMPs.
● In other countries, PESs lead efforts to connect labour market actors with immigration
authorities, immigrant-support NGOs, municipalities, and other bodies involved in
integration. Norway’s Labour and Welfare Service (NAV) started prioritising immigrants as
a target group before putting in place NAV Intro, a specialised unit that helps immigrants
seek work and advises local authorities on how to adapt their general services.
● Sweden has tasked its PES with administering its integration programme in order to
strengthen the labour market focus of policy. Japan has also transferred responsibility
for labour market integration to its PES and satellite offices in immigrant-dense areas
(known as Employment Service Centres for Foreigners).
Figure 2.23. Percentage of nationals among the foreign-born populationwith at least ten years of residence in 2013 and among the native-born offspring
of two immigrant parents in 2008-09
Note: The percentage of nationals among foreign-born is based on the 15- to 64-year-old population (except inCanada and Australia where it is based on the population aged 15 and above) with at least ten years of residence inthe country. The percentage of nationals among the offspring of immigrants is based on the 15- 34-year-old native-born offspring of two immigrant parents. In the Czech Republic, Hungary, Poland, the Slovak Republic and Slovenia,the percentage of nationals among the foreign-born population might be influenced by the border changes in andbetween these countries in the past. The OECD average includes only countries that have some information on thepercentage of nationals among the offspring of immigrants.Source: European countries: Labour Force Surveys (Eurostat) 2013; 2008 ad hoc module on the labour market situationof migrants and their immediate descendants and the 2009 ad hoc module on the entry of young people into thelabour market; Australia: Population Census 2011; Canada: National Household Survey 2011; Chile: Encuesta deCaracterización Socioeconómica Nacional (CASEN) 2011; United States: Current Population Surveys, 2008-09 and 2013.
1 2 http://dx.doi.org/10.1787/888933157583
0
10
20
30
40
50
100
90
80
70
60
Foreign-born Offspring of immigrants
Luxe
mbourg
Greece
Spain
Italy
Eston
ia
Switzerl
and
Chile
Austri
a
Denmark
United
States
German
y
Irelan
dOEC
D
Poland
Franc
e
Czech
Rep
ublic
Belgium
United
Kingdo
m
Finlan
d
Norway
Netherl
ands
Portug
al
Austra
lia
Hunga
ry
Icelan
d
Sweden
Slovak
Rep
ublic
Sloven
ia
Canad
a
INTERNATIONAL MIGRATION OUTLOOK 2014 © OECD 2014 81

2. LABOUR MARKET INTEGRATION OF IMMIGRANTS AND THEIR CHILDREN: DEVELOPING, ACTIVATING AND USING SKILLS
Another strategy designed to encourage immigrants to take up ALMPs is to bring all
job-seeking support together in integration programmes for newcomers. Reforms in
Sweden in 2010 and Finland in 2010, for example, have steered that course. Such moves
encourage PESs to adapt their general service provision and improve uptake among
newcomers. This often involves informally assessing skills and advising on labour market
functioning, then offering specific, tailored solutions. PES involvement is generally a key
element in mainstreaming integration policies (Box 2.3).
Accessing help through networks and mentors. As mentioned in the first part of this
chapter, informal networks of friends and relatives are an important source of employment
information and contacts in many countries. Indeed, when they are looking for work, the
foreign-born tend to rely on such networks even more heavily than the native-born
population (see Figure 2.24). However, their networks are likely to be less extensive or
professionally useful, while their reliance on them can compound integration challenges
– particularly when immigrants are concentrated in certain areas.
One approach to extending networks of the foreign-born in host countries has been to
create mentoring programmes. Mentoring has been particularly cost-effective almost
everywhere for the highly skilled foreign-born and their children, helping them also to
develop the knowledge about the host-country labour market and its functioning that is
required to find adequate employment. It matches jobseekers with volunteers who have
basic training and generally a similar background in age, gender, neighbourhood, or field of
study. Volunteers with an immigrant background bring with them the added value of being
Figure 2.24. Main source of support used by 15- to 64-year-oldsfor finding current jobs or creating business by place of birth,
in selected European OECD countries, 2008Percentages
Note: The respondent could also respond “migrant or ethnic organisation” or “other”.Source: Labour Force Surveys (Eurostat) 2008 ad hoc module on the labour market situation of migrants and theirimmediate descendants.
1 2 http://dx.doi.org/10.1787/888933157598
0
10
50
90
30
70
40
80
20
60
100
AUT BEL DEU ESP FRA GBR IRL ITA LUX NLD PRT
Relatives/friends Public employment office Private employment agencies NoneN
ativ
e-bo
rnFo
reig
n-bo
rn
Nat
ive-
born
Fore
ign-
born
Nat
ive-
born
Fore
ign-
born
Nat
ive-
born
Fore
ign-
born
Nat
ive-
born
Fore
ign-
born
Nat
ive-
born
Fore
ign-
born
Nat
ive-
born
Fore
ign-
born
Nat
ive-
born
Fore
ign-
born
Nat
ive-
born
Fore
ign-
born
Nat
ive-
born
Fore
ign-
born
Nat
ive-
born
Fore
ign-
born
INTERNATIONAL MIGRATION OUTLOOK 2014 © OECD 201482

2. LABOUR MARKET INTEGRATION OF IMMIGRANTS AND THEIR CHILDREN: DEVELOPING, ACTIVATING AND USING SKILLS
Box 2.3. Mainstreaming in labour market integration policies
The concept of mainstreaming, as developed in the field of gender equality, refers toefforts to facilitate access to and take-up of policies and services which do not target aparticular disadvantaged group, but address disadvantage among the entire population,irrespective of gender or migration status.
The first step is to monitor access to and take-up of policies aimed at disadvantage– among the foreign-born, their children, and their native-born counterparts in similarsocio-economic circumstances. It is a critical step designed to ascertain the extent towhich certain disadvantaged groups struggle to access policies and programmes that aretargeted not at them but at their circumstances.
If migrants are found to be significantly under-represented in access to or take-up ofgeneral programmes, it may be that they face additional hurdles, such as lack ofinformation about their eligibility. In that event, specific policies become necessary, suchas further investment in outreach to immigrant groups, pre-investment in the skillsrequired for take-up (e.g. language), or additional support like childcare. The distinctionbetween general and specific policies, therefore, is not always clear-cut. General policiesmay require specific targeting measures and outreach in order to ensure equal access andtake-up across all disadvantaged groups. Similarly, specific policies may be most effectivewhere they enable disadvantaged groups to access general policies. In addition, somemainstream policies may have strong indirect targeting – when, for example, they focus ongroups with language difficulties.
Successfully mainstreaming integration into general policy development andimplementation requires commitment from all relevant ministries. Germany, Portugal,and Norway have developed strong co-ordination structures that involve differentstakeholders in the mainstreaming process.
Since 2006, Germany’s annual national integration summit has brought togetherpolicymakers at various levels of governance, service providers, and immigrantorganisations. The summits have led to the drawing up of National Integration Plans withhundreds of voluntary commitments from all actors. The Commissioner of the FederalGovernment for Migration, Refugees and Integration supports them in their work toimplement their commitments, set targets, and monitor outcomes.
Portugal’s High Commission for Immigration and Intercultural Dialogue (ACIDI)co-ordinates the commitment of the different ministries in the Plan for ImmigrantIntegration and monitors implementation through a network of focal points, annualreports, and the Consultative Council for Immigration Affairs.
Norway’s Ministry of Children, Equality and Social Inclusion plays the samemainstreaming role by helping to secure commitments from related ministries and thenmonitoring them in four main fields – labour and employment, education andqualification, living conditions, and social cohesion and participation. An annual report onthese is submitted to Parliament within the national budget.
One new co-ordination structure under development is Australia’s “Multicultural Accessand Equity Policy”, adopted in March 2013. It requires most departments and agencies todesign and report on biennial plans in order to make their services accessible to allbeneficiaries, responsive to their needs, and equally effective for all, regardless of culturalor linguistic background.
INTERNATIONAL MIGRATION OUTLOOK 2014 © OECD 2014 83

2. LABOUR MARKET INTEGRATION OF IMMIGRANTS AND THEIR CHILDREN: DEVELOPING, ACTIVATING AND USING SKILLS
“role models”.20 In the mentoring schemes, they share with participants the unwritten
rules and tricks of the trade for interviews, tests, job-seeking, and career advancement.
Mentors help to make better use of participants’ skills by building their self-confidence and
connecting them with other professionals and employers through matching and
recommendations.
Nearly every Western European country and countries of settlement have used
immigrant mentoring programmes. Governments include them in their general policies
(France’s sponsorship scheme,) and introduction programmes (introduction guides in
Sweden). The programmes often involved the civil society and rely on broad networks of
native-born volunteers and mentors, such as the Toronto Region Immigrant Employment
Council in Canada, KVinfo in Denmark and Finland’s FIKA programme. In some countries,
including Austria and Norway, employers’ organisations have also developed mentorship
programmes. Political representatives in countries such as Canada and Ireland have even
developed mentoring schemes for immigrant candidates (Bird et al., 2011).
Building closer social contact with the native-born not only opens up employment
opportunities for the foreign-born (Kanas et al., 2011; Facchini et al., 2014), it also improves
attitudes towards them (Coenders et al., 2005; Ward and Masgoret, 2006) at a relatively low
cost and to the satisfaction of participants and volunteers. Finding a sufficient number of
volunteers is seldom an obstacle. One study in France, a country which makes wide use of
mentoring, also suggests that they are effective in helping immigrant participants into jobs
(see OECD, 2008a).
Developing skills
Developing the skills of foreign-born adults
Policies to develop immigrants’ skills are often couched in a language of deficit,
suggesting they fall short of requirements and need extensive (re-)training and assistance.
Such an assumption is often inaccurate and actually runs counter to the parallel goal of
recognising – and thus valuing – their skills. Policies that begin with assessing and
recognising them may then take a more individual approach to developing the skills
needed to succeed in the local labour market. Obviously, learning trajectories will differ
depending on immigrants’ educational background. Most will develop skills specific to the
host country over the length of time they live there. The challenge is to invest in developing
immigrants’ skills so as to speed up rather than delay labour market integration. It will be
easier to achieve if learning eventually moves out of the classroom and into the workplace.
There are particular concerns for those without a lower secondary degree (ISCED 0-1),21
often considered the minimum level required for long-term employability and the ability to
function properly in society. Figure 2.25 shows how the foreign-born are overrepresented in
the lowest education strata in most OECD countries. Only in Chile, Estonia, Ireland, Portugal
and Turkey are shares of very poorly educated adults higher among the native- than the
foreign-born.
Participation in lifelong learning. The evidence is mixed on the effectiveness of
ALMP-type training. Although results appear to be slightly better for the foreign- than the
native-born (Butschek and Walter, 2013; Nekby, 2008), ALMP training schemes that do not
lead to a degree – the most common kind – show only modest benefits for both foreign- and
native-born. The reasons may be that they have lock-in effects in the short term while
INTERNATIONAL MIGRATION OUTLOOK 2014 © OECD 201484

2. LABOUR MARKET INTEGRATION OF IMMIGRANTS AND THEIR CHILDREN: DEVELOPING, ACTIVATING AND USING SKILLS
failing to offer any long-term guarantee of work. Programmes leading to a post-secondary
degree (ISCED 3 or higher) tend to protect more effectively against unemployment and also
help to limit the incidence of over-qualification among foreign-educated immigrants.
One type of lifelong learning relates to second-chance campaigns for adults with low
or no formal qualifications. They have been rolled out in several countries – such
as Austria, Germany, Korea, the Netherlands, Norway, Poland, and Sweden (OECD, 2012a)
– often with an implicit focus on immigrants. Some schemes target reluctant adults by
providing non-formal environments compatible with their daily lives. When combined
with part-time work, they tend to be more effective at helping immigrants find work, as
joint work and study programmes generally overcome employers’ reticence over
immigrants’ skills. The same holds for work placements and private-sector incentive
schemes. Working part-time also help adults meet the costs of studying and some of their,
and their families’, basic needs. Programmes where there is basic financing are also more
likely to be completed.
Bridging courses. Foreign-educated immigrants whose qualifications have been only
partially recognised, or not at all, suffer from higher risks of unemployment and
over-qualification (see OECD, 2007, on Australia and Sweden). Bridging programmes give
them a chance to train and secure a host-country qualification in their field without having
to study all over again. Starting from scratch may well delay labour market integration and
lead to underutilisation of the skills of immigrants who cannot afford to study and have to
work in positions for which they are over-qualified.
Figure 2.25. Share of the population aged 25 to 54 with educational levelsof ISCED 0-1 levels, 2013
Percentages
Note: ISCED 0-1 levels denote primary education level only. The information on the highest education level attainedin the Chilean CASEN does not match ISCED levels exactly. It is assumed that those who have started and notcompleted secondary education have at least completed lower secondary education (ISCED 2).Source: European countries and Turkey: Labour Force Surveys 2013; Chile: Encuesta de Caracterización SocioeconómicaNacional (CASEN) 2011; Israel: Labour Force Surveys 2011; United States: Current Population Surveys 2013.
1 2 http://dx.doi.org/10.1787/888933157608
0
5
15
20
10
25
33 54
Foreign-bornNative-born
Belgium
Greece
Spain
Franc
e
Portug
al
Icelan
d
Turke
y
United
States
Netherl
ands
German
yIsr
ael
Italy
Sweden
Luxe
mbourg
OECD
Chile
Switzerl
and
Poland
Finlan
d
Irelan
d
Denmark
Austri
a
Sloven
ia
Hunga
ry
Norway
United
Kingdo
m
Slovak
Rep
ublic
Eston
ia
Czech
Rep
ublic
INTERNATIONAL MIGRATION OUTLOOK 2014 © OECD 2014 85

2. LABOUR MARKET INTEGRATION OF IMMIGRANTS AND THEIR CHILDREN: DEVELOPING, ACTIVATING AND USING SKILLS
Effective bridging programmes deliver domestic qualification which employers know
and value. This was a key finding in the recent evaluation of a Swedish programme that
included bridging courses (Niknami and Schröder, 2012). Bridging picks up where
accreditation finishes. Ideally, applicants follow an individual learning plan and receive the
missing profession-specific training and/or workplace experience required to obtain the
host country qualification. Subsidies can cover the sometimes substantial costs of
training and taking exams, as they do in countries such as Australia, Canada, and Israel.
Vocation-specific language training is almost always part of the package. Bridging’s
topping-up approach is the most direct and efficient path to re-qualification for educated
immigrants as it avoids any duplication of their foreign education or training.
A further benefit of bridging is that it may also prompt greater interest in formal and
informal recognition procedures, since educated immigrants who fear there is little chance
of recognition may be more likely to apply when alternatives exist.
Bridging courses are becoming the standard follow-up to unsuccessful accreditation
procedures and are expanding across countries and professions. While they are well
established in longstanding labour immigration destinations – such as Australia, Canada,
New Zealand, and the United States – they have recently begun to spread to other host
countries, especially in Europe. For example, Sweden’s complementary education scheme
offers supplementary courses for university-trained non-EU nationals with foreign
qualifications, like lawyers, and teachers. However, most new initiatives concern the
healthcare sector.22 Programmes seem to be particularly effective if they involve all
relevant stakeholders, from labour market service providers and employers to professional
organisations and universities. If immigrants are able to successfully re-qualify, bridging
programmes are cost-effective. A programme for foreign-trained medical doctors in
Portugal – run by non-governmental organisations, the health ministry and a university –
saw 106 of the 120 participants find work in their profession. The cost of the nine-month
programme was only a fraction of the average annual cost of medical training in the
country (OECD, 2008). Likewise, a programme for foreign-trained nurses in Australia cost
only 10% of the higher-education alternative (Konno, 2006).
Ensuring country-specific skills for all: Language training and introduction programmes
State-funded language training represents the bulk of public integration expenditure
in most OECD countries – from traditional settlement countries and Europe to Japan and
Korea. It is also the single most important component in introduction programmes for
newcomers, which are gradually being opened up to all legal categories of newcomers,
including immigrants in areas of free movement (see Box 2.4). Some OECD countries make
participation or successful completion of such courses a requirement for acquiring
long-term residence permits or naturalisation.
Many European countries include civic orientation in their immigrant introduction
courses. Traditional settlement countries, on the other hand, provide such information
chiefly through booklets, websites, and voluntary pre-arrival courses in immigrants’
languages of origin (see annex Tables 2.A1.9 and 2.A1.10).
Language courses are seldom scientifically evaluated to determine whether they
contribute effectively to labour market integration. This is somewhat surprising given the
significant investment required. Evaluation was designed into very few courses from the
INTERNATIONAL MIGRATION OUTLOOK 2014 © OECD 201486

2. LABOUR MARKET INTEGRATION OF IMMIGRANTS AND THEIR CHILDREN: DEVELOPING, ACTIVATING AND USING SKILLS
start, due to the lack of pilot or randomised studies and the necessary administrative or
survey data. Existing evaluations are mostly devised ex post to measure attendance rates
and test scores. They use before-after comparisons to assess participants, often without
the necessary comparison group. Designing scientific evaluations of language and
orientation courses would be a timely move that would help improve the efficiency of such
major investment in integration (Box 2.5).
The available evidence suggests that language courses have a limited effect on labour
market integration, and civic orientation courses even less. Frequently, no direct link
emerges between immigrants’ overall employment rate and course attendance. One
reason is a trade-off between language fluency and early work experience. If newcomers
spend too much time becoming fully fluent, they are less likely to gain early work
experience, which delays their chances of finding the right job. This so-called “lock-in”
effect has been found to be substantial in scientific evaluations of integration programmes
in the Nordic countries and in Germany (Djuve, 2003; Svantesson and Aranki, 2006; Clausen
et al., 2009; Nekby, 2008; Nordin, 2009; Sarvimaki and Hamalainen, 2012). While the few
long-term studies undertaken reveal positive employment effects in some groups (Clausen
et al., 2009; Sarvimaki and Hamalainen, 2012), they are not necessarily robust enough to
outweigh the potential “scarring effects” associated with employers shunning job
applicants with long absences from the labour market.23
The demands and content of most language and civic orientation courses do not
appear to be particularly relevant to the realities of the labour market. The one exception
is vocation-specific language training – ideally undertaken on the job – which has been
found to be highly effective in improving labour market integration. It would seem that
people with basic skills in the language learn significantly more quickly when applying
their skills to real-life situations. Clausen et al. (2009) find that, in Denmark, people who
attended evening classes or were in work progressed much more quickly through the
programme, even after controlling for other socio-economic characteristics. Sweden’s
SESAME Pilot 2001-3, which combined work-oriented language training with work
placements, was also found to accelerate newcomers’ transition into employment and
mainstream training. On-the-job language courses may also address reticence about
Box 2.4. The integration of immigrants in free-movement areas
With growing intra-European mobility, the integration of free moving European Unioncitizens is an increasingly important issue in European OECD countries. EU citizens do notgenerally have to contend with the same employment, over-qualification, and wageproblems as immigrants from other, particularly non-OECD countries. Their relative easeof labour market integration is due partly to the greater return to and easier recognition oftheir qualifications. They are also more likely to move for reasons of work and study andto return home in the event of labour market difficulties.
The question which arises in this context is whether or not free-mobility migrantsshould have access to immigrant-specific integration measures, notably language training.Some EU citizens will make the investment themselves, while others may only do so if(part of) the cost is covered. Subsidised integration programmes are now also open to EUcitizens in Belgium (Flanders), Denmark, Estonia, Germany and, most recently, Austria(Vienna). Free voluntary language training is also available in Ireland, Italy, Luxembourg,Portugal, Sweden, and the United Kingdom.
INTERNATIONAL MIGRATION OUTLOOK 2014 © OECD 2014 87

2. LABOUR MARKET INTEGRATION OF IMMIGRANTS AND THEIR CHILDREN: DEVELOPING, ACTIVATING AND USING SKILLS
thedhe
the
is
ostof
ndorot.ot.elf.heis
asion
ant.
011thex).is
otthehe
rstayes.athe
tededin
forhor –
Box 2.5. Integration policy evaluation
Across the OECD, the quality of integration policy evaluation varies widely and the authorities in bolongstanding and newer destination countries have trouble assessing whether their policies have improvintegration or not. Data constraints are part of the problem, as is an incomplete understanding of tprocess of rigorous impact evaluation. Ideally, an evaluation is factored in from the outset and part ofbudget is set aside for that purpose.
All too often, however, evaluations are designed as an afterthought, once policy implementationalready underway and cannot therefore isolate the effects of the instruments.
No accurate picture of an intervention’s impact may be gleaned from merely monitoring the ex poutcomes of participants. They need to be compared with the outcomes of a comparison groupnon-participants who had the same ex ante outcomes and who are similar in age, gender, education aother key criteria that may influence outcomes. The reason is that those migrants that choose –are picked – to participate in a programme are often systematically different from those who do nImmigrants who do choose may do so because they are more motivated than those who do nImprovements in outcomes may therefore reflect motivation rather than the impact of a programme itsSimilarly, if certain migrants are targeted for additional support, it may be because they are struggling. Timpact of the programme is therefore underestimated. Occasionally, the “success” of a programmemeasured by participant satisfaction – not necessarily the best metric of effectiveness.
Slightly better are evaluations that at least compare outcomes before and after a policy wimplemented. However, even with such comparisons, evaluation of policy is problematic. Take integratpolicy, for example. Although some immigrants are found to have secured work after taking part inparticular programme, it is not necessarily because the programme is effective – let alone cost-efficieThey may just as easily have found a job without the aid of the programme.
Across all European OECD countries, an average of almost one-third of the foreign-born unemployed in 2found a job a year later, regardless of policy intervention. And rates reached upwards of 40% in Iceland,Netherlands, the Slovak Republic, Switzerland, Turkey and the United Kingdom (Figure 2.A1.2 in the anneConsequently, concluding that when an immigrant finds work it is the fruit of a particular policy interventionnot a straightforward matter of comparing their employment situation before and after the programme.
Rigorous evaluation relies on the ability to identify an appropriate counterfactual group that does nhave access to a programme – i.e. a group of individuals who are similar ex ante to those who undergopolicy intervention. Comparing the ex post outcomes of the people who attend the programme with tcounterfactual group yields an evaluation of the impact of the policy intervention.
In practice, such rigorous evaluations are seldom undertaken. There are a number of reasons. In the fiplace, they are costly and require long-term cost-benefit calculations. Secondly, smaller-scale projects mnot involve sufficient numbers of participants to enable an evaluation, even under ideal circumstancLast, identifying an appropriate counterfactual group often requires randomisation, or a policy roll-out this random in the timing with which different individuals, or groups of individuals, have access to tprogramme. Policy can be randomly implemented either through implementing it in randomly selecareas (e.g. schools, neighbourhoods, or municipalities) or in all areas but only for randomly selectparticipants. The Nordic countries, for example, are increasingly using pilots with such randomisationorder to assess the effectiveness of new integration policies. An alternative that is often used, notablyintroduction programmes, is to compare the outcomes of different cohorts of migrants – e.g. those wenter a new programme just prior to the cut-off date for eligibility with those who enter just afteprovided that the two groups have otherwise similar characteristics.
INTERNATIONAL MIGRATION OUTLOOK 2014 © OECD 201488

2. LABOUR MARKET INTEGRATION OF IMMIGRANTS AND THEIR CHILDREN: DEVELOPING, ACTIVATING AND USING SKILLS
immigrants’ language qualifications among employers who – particularly those who have
little experience with immigrant workers – may overestimate the language knowledge and
fluency required for jobs (Chiswick and Miller, 2009).24
Relatively few immigrants in OECD countries benefit from such effective courses
because there are none, or very few, as they are costly and difficult to organise.25 There
need to be enough students interested in a sector of activities for providers in a given area
to develop the capacity to stage courses on a regular basis. And only a few employers are
able or willing to accommodate language learning in the workplace. Countries which have
no vocation-specific language training find it difficult to integrate language and vocational
training: they are generally offered in parallel by separate providers and funded by
stakeholders with different objectives.
Many stakeholders are involved in language training, but there is often little
co-ordination between offers. In many countries, for example, standard language courses
are funded by municipalities or agencies under the remit of the Ministry of Interior. The
public employment service, by contrast, finances training that is geared to the labour
market. Vocational training providers often lack accredited language teachers and offer
syllabuses that are disconnected from language courses. Conversely, language training
providers usually lack expertise in relevant job sectors. Even where the content of language
courses content is partly job-specific, providers and participants widely focus on the
standard language test required for long-term residence or naturalisation.
Several OECD countries have built extensive experience in vocation-specific language
training, which is gradually becoming more widespread:
● Canada offers such a provision nationwide through its federal, provincial and territorial
taxpayer-funded programmes.
● Since 1991, the authorities in Australia have, together with employers, co-financed
on-the-job training to improve their workplace English language and literary. Australia’s
free extensive Adult Migrant English Programme also includes “Settlement Language
Pathways to Employment and Training”, where participants are entitled to up to
200 hours of vocation-specific language tuition and up to 80 hours of work placements.
● In Israel, Jewish immigrants can attend one of around 100 free institutes or schools
specialised in the intensive study of Hebrew. The institutes offer specific courses for
youngsters, seniors, immigrants with academic degrees and those with vocational
degrees in fields such as medicine and engineering.
● Language is also part of on-the-job training in the introduction programmes of Sweden
(“Step-in jobs”) and Denmark (“Stepmodel”).
● In Belgium, the third step in the integration programme in place in Belgium (Flanders) is
to direct participants to the Flemish employment service (VDAB), whose programmes
then offer job-oriented language courses, including “Dutch in the Workplace”.
● Germany has put in place a wide-reaching new system of free courses in “German for
professional purposes”. They are aimed at foreign-born jobseekers and their children
who have completed mandatory schooling and intermediate German courses. The
vocation-specific language courses mix technical instruction, work placement and site
visits. Germany has also taken an innovative approach to tackling the co-ordination
issue, as part of the vocation-specific language training is co-funded by the Federal
Office for Migration and Refugees – an agency under the aegis of Ministry of the Interior
– and the Ministry of Labour.
INTERNATIONAL MIGRATION OUTLOOK 2014 © OECD 2014 89

2. LABOUR MARKET INTEGRATION OF IMMIGRANTS AND THEIR CHILDREN: DEVELOPING, ACTIVATING AND USING SKILLS
● Vocation-specific language courses are also part of Portugal’s “Portuguese for All” training
schemes and of the new Intervention Programme for Unemployed Immigrant Workers.
General language courses also need to be adapted to learners’ education levels and
language backgrounds. At the one end of the educational scale, adults with limited literacy
take much longer to become fluent in a country’s language – a significant investment for
both the country and immigrant concerned. But pay-offs can be far-reaching in that they
benefit also the immigrants’ children, whose chances of academic success are strongly
influenced by their parents’ educational level, particularly their mother’s. At the other end
of the scale, the university-educated need a faster-paced, more demanding classroom
dynamic in order to achieve the higher degrees of fluency required for highly skilled jobs.
As well as the education level, language background also affects how quickly immigrants
learn a new language. The effects of linguistic difference have been investigated in a number
of OECD countries such as Australia, Canada, Germany, Israel, and the United States
(Chiswick, 2008; Isphording and Otten, 2011). They have also been tested with data from the
International Adult Literacy Survey in nine European countries (Isphording, 2013). The rough
indications are that immigrants of very different linguistic origins (e.g. a Korean or a Japanese
person in France or Germany) are at significant initial disadvantage to those whose languages
are not so far removed from the host-country’s.Their language skills do progress over time, but
not generally enough to offset the initial disadvantage.
The powerful influence of education level and linguistic difference on language
learning ensures that no one type of course, or amount of support, is appropriate for all
immigrants. This finding has emerged from course evaluations in several OECD countries,
such as Australia, Germany and Sweden. When the evaluation was conducted, for
example, Germany’s programme of 600 hours of language training – high in comparison
with other countries – was not enough for almost half of the participants to reach the
required level (B1 in the Common European Framework of Reference for Languages, CEFRL)
(Schuller, Lochner and Rother, 2011).
The challenge is to provide high-quality personalised language courses across a
country at a reasonable cost. Urban areas and those with high numbers of immigrants
naturally develop the infrastructure to offer more specialised courses, as was also
evidenced by programme evaluations in Germany (Ramboll, 2007) and Sweden (Åslund and
Engdahl, 2012). In Norway, the lack of appropriate courses was one important reason given
for non-participation: 60% of municipalities could not offer adequate language courses and
work placements for highly educated immigrants (OECD, 2012c). Several OECD countries
have reformed language and integration courses, developing specific pathways and
programmes for different types of learners:
● In the wake of its 2007 programme evaluation, Germany introduced federally funded
specialised schemes with literacy, catch-up and intensive courses, and additional
specific pathways for young adults, parents, and women. A more recent assessment that
used a longitudinal survey with a control group found significant improvements in
language skills, employment, and other integration outcomes (Schuller et al., 2011).
● Sweden’s adult language courses were also reformed following an evaluation in 2009
which advocated courses that were more flexible and geared to individuals so as to
account for learners’ different education levels, professions, and work schedules. It also
recommended that language courses should be tied more closely to other employment
and social activities.
INTERNATIONAL MIGRATION OUTLOOK 2014 © OECD 201490

2. LABOUR MARKET INTEGRATION OF IMMIGRANTS AND THEIR CHILDREN: DEVELOPING, ACTIVATING AND USING SKILLS
● The development of more flexible courses and support arrangements does not necessarily
come at a higher cost, as there is often a certain overlap between different language offers.
Finland, for example, seeks to offer a more differentiated, better targeted provision through
the efficient reallocation of existing resources (Sarvimaki and Hamalainen, 2012).
Developing the skills of immigrants’ offspring
Promoting equal opportunities in education: Early childhood education, literacy, andsocio-economic concentration in schools. Achieving basic language and literacy skills is
a challenge for a significant number of pupils, particularly the children of low-educated
immigrants. Data from Programme for International Student Assessment (PISA) 2012
revealed that, in most OECD countries, at least one in four of 15-year-old pupils with
immigrant parents lacked basic reading proficiency. Given that high proportion,
participation in remedial language courses is surprisingly low among children of
immigrants, as Figure 2.26 shows.
Growing evidence suggests that access to early childhood education and care (ECEC)
from the age of two to three yields high returns in educational and, ultimately, labour
market and social outcomes. The finding is especially true for the native-born children of
low-educated immigrants. ECEC provides them not only with a basic education but
exposure to the host-country language that they would not otherwise get. For example,
native-born children of immigrants who attend ECEC are a full one year ahead in reading
skills at the age of 15, according to PISA data. These effects persist even after controlling for
Figure 2.26. Shares of students attending test language remedial classes,by migration status
Percentages
Note: Countries are ranked in descending order of the share of native-born offspring of two immigrant parentsattending test language remedial classes.Source: OECD, PISA Database in OECD (2012d), Untapped Skills: Realising the Potential of Immigrant Students, OECDPublishing, Paris.
1 2 http://dx.doi.org/10.1787/888933157613
0
5
15
25
35
10
20
30
40
Native-born offspring of two native-born parents
Foreign-born Native-born offspring of two immigrant parents
Mexico
United
Kingdo
mFra
nce
Austri
a
Portug
al
Denmark
Greece
Spain
German
yIta
ly
Sloven
iaOEC
DIsr
ael
Sweden
Netherl
ands
Switzerl
and
United
States
New Ze
aland
Eston
ia
Norway
Luxe
mbourg
Austra
lia
Canad
a
Belgium
Finlan
d
Czech
Rep
ublic
Irelan
d
INTERNATIONAL MIGRATION OUTLOOK 2014 © OECD 2014 91

2. LABOUR MARKET INTEGRATION OF IMMIGRANTS AND THEIR CHILDREN: DEVELOPING, ACTIVATING AND USING SKILLS
parental education, reasons for migration, and the language spoken at home. Attendance
rates in ECEC are generally lower among the children of immigrants in countries with
comparatively small, late, or fee-based programmes (OECD, 2012h).
The challenge is to boost immigrant offspring’s often disproportionately low ECEC
attendance rates, particularly at early ages, which are widely related to issues of cost,
information, and outreach. Evaluations of the US Head Start programme found that the
proximity of Head Start Centers helped overcome the underrepresentation of immigrant
children, especially newcomers, in ECEC (Neidell and Waldfogel, 2009) and increased their
English and mathematics proficiency (Magnuson et al., 2006). Reviews of the evidence (Burger,
2010; and Ruhm andWaldfogel, 2011) find the benefits are significant for disadvantaged pupils,
including immigrants, even though they do not cancel out disadvantage.
Greater access to existing remedial courses may not be enough in schools with high
numbers of pupils from low-educated families, where low literacy skills are frequent.
Moreover, developing fluency in a language takes years of proper teaching. Early
intervention and long-term support are both part of a comprehensive approach to basic
literacy and language fluency.
A further finding is that the language spoken at home has less of an impact on academic
performance in countries with higher ECEC attendance rates and after-school-support than
in countries where children spend more time at home (Schnepf, 2004). The introduction of
universal language diagnostic tests and support in pre-school has helped practitioners in
Austria and Germany to better identify the language and literacy needs of children –
including those without a migration background – and offer additional language bridging
support. Such programmes have met with some success, both in the high take-up rates for
remedial language classes and in education outcomes that are superior to those of non-
participants (see Liebig, 2007).
During compulsory education, systematic ongoing support may be required across grade
levels. In parallel to explicit language and literacy support, an “open-school” approach can
offer additional support after school and over the summer with tutors, homework centres, and
extracurricular activities that engage language skills (OECD, 2012d).
Specific issues arise from high concentrations of children of low-educated immigrant
parents in the same areas and schools (see Box 2.6). A key challenge is to weaken the
systemic link between academic performance and school socio-economic concentration.
In some countries, the Netherlands and France, for example, schools with large numbers of
pupils from low-educated families receive disproportionately high state funding. Funds
may go into greater financial and technical support for such schools, staffing them with
the most highly qualified and experienced teachers, and paying those teachers higher
wages. However, evidence on the impact of such additional funding is mixed.
Disadvantaged pupils, who would benefit disproportionally from high-quality teaching, are
often the least likely to receive it, especially when there are shortages of qualified teachers
(Nusche, 2009). In education systems with several educational tracks that run in parallel
there is also a case for enhancing efforts to inform immigrant parents about the various
choices available to their children, and the labour market prospects that are associated
with them.
INTERNATIONAL MIGRATION OUTLOOK 2014 © OECD 201492

2. LABOUR MARKET INTEGRATION OF IMMIGRANTS AND THEIR CHILDREN: DEVELOPING, ACTIVATING AND USING SKILLS
Participation in vocational education and apprenticeship. Vocational degrees and
apprenticeships have been found to be highly effective in facilitating school-to-work
transitions and so averting high rates of inactivity and incidences of young people neither
in employment nor education or training (NEET). They are particularly effective among the
children of immigrants, especially in countries with high quality apprenticeships and
vocational training and education (VET) systems such as Austria, Germany, and
Switzerland. The problem is nevertheless that the children of immigrants are often
underrepresented and are also more likely to drop out. There are several possible reasons
for underrepresentation, which also often help to understand the high drop-out rates.
Box 2.6. Socio-economic concentration in schools and its effectson the children of immigrants
Evidence from the OECD’s Programme for International Student Assessment (PISA)shows that the school performance of children of immigrants tends to lag significantlybehind that of children of the native-born. The same finding applies to settlementcountries – like Australia, Canada and New Zealand – and European OECD countries. Onedriver is the fact that, because immigrants are concentrated in certain housing areas, theirchildren are concentrated in local schools.
At first glance, the concentrations of immigrants’ children appears to account for muchof the gap with children of the native-born in their educational outcomes. However, acloser look at the data suggests that it is rather the concentration of pupils from lowsocio-economic backgrounds (whose parents are often educated to a lower level) thathinders academic achievement. The two are often confused since children of immigrantsare strongly overrepresented in disadvantaged schools in nearly all OECD countries, evenafter controlling for parental education (Lemaître, 2012). Indeed, in many OECD countries,going to a disadvantaged school – that is, a school with many children of low-educatedparents – has a greater effect on educational attainment than parental country of origin.Concentration in disadvantaged schools negatively impacts the school performance of thechildren of immigrants and the native-born. However, the penalty (as measured in PISAscores) for going to a disadvantaged school is higher for children of immigrants.
OECD countries have adopted a number of approaches to prevent socio-economicconcentrations in disadvantaged schools or to improve the academic performance ofchildren in such schools. The Netherlands and France have addressed the latter bytargeting financial and technical support at schools with many pupils from low-educatedfamilies. Such action has included higher pay – and other measures – to attract the mosthighly qualified and/or experienced teachers to disadvantaged schools.
A more fundamental solution, however, is to address the level of school socio-economicconcentration within the school system. It is partly attributable to the housing market andto the structural characteristics of the school system itself, such as the number of differenttracks and the age at which streaming first takes place (OECD, 2013b; Alegre and Ferrer,2010). Schemes to ease institutional differentiation include the mandatory assignment ofstudents to certain schools and “controlled choice” approaches. Their success dependspartly on the discretionary power that the authorities enjoy over schools in their area (seeKarsten, 2010a). Most promising, however, seems to be the focus on early interventionssuch as universal early childhood education and care in order to overcome disadvantageprior to admission into primary school (OECD, 2013b).
INTERNATIONAL MIGRATION OUTLOOK 2014 © OECD 2014 93

2. LABOUR MARKET INTEGRATION OF IMMIGRANTS AND THEIR CHILDREN: DEVELOPING, ACTIVATING AND USING SKILLS
A first possible explanation is that immigrant parents and pupils may prefer academic
study or paid work to apprenticeships, particularly if they originate from countries without
a well-respected VET and apprenticeship system. A second possibility is that the children
of immigrants who perform poorly in compulsory schooling may need some additional
preparatory skills development. Although a number of countries have responded by
offering bridging years for this group, results have been mixed because of the stigma
attached to them. The more successful bridging schemes identify target groups at early
stage and implement a highly individual approach with a low student-to-trainer ratio. To
prevent students dropping out and ensure they successfully complete apprenticeships,
Austria, for example, has introduced “apprenticeship coaching”. In addition, the country
has a broad offer of preparatory courses and supra-company training opportunities in
which children of immigrants are overrepresented.
It is also conceivable that immigrant students may lose out in competition for limited
numbers of apprenticeship placements. In some countries, students need to have an
apprenticeship placement before they can start the programme. In others, students do not
need to find a placement with an employer to enter a programme and are supposed to find
one later on. In these cases, not securing a placement with a private employer is often the
reason for drop-outs, as the alternative – placement in a firm chosen by, or part of, the
national education system – is seen as less prestigious.
Yet another possible reason why immigrants’ children are underrepresented in VET
programmes is that their parents often find apprenticeship placements through their
contacts. However, the networks might not include the right employers. Those closest
to immigrant parents, i.e. immigrant entrepreneurs, are the least likely to offer
apprenticeships. The reason may be the relatively small size of immigrant businesses,
limited knowledge of the apprenticeship system, and fewer links with Chambers of
Commerce. Some countries – like Germany with Netzwerk IQ and KAUSA – have initiated
schemes to reach out to immigrant businesses and/or to involve host-country employers
through co-operation with the Chambers of Commerce and trade and crafts associations.
Others, like the Netherlands and Norway, as well as some Länder in Germany, have
implemented measures to offer the children of immigrants apprenticeship places in the
public sector, where they are generally underrepresented. One project in the Netherlands
provides specific preparatory training for children of immigrants if they fail the entry exam
because of their lack of knowledge of Dutch society.
Finally, there is the issue of discrimination. This chapter previously described that the
children of immigrants have to write up to twice as many applications to get a job
interview as their peers without a migration background. Discrimination may ultimately
breed a sense of exclusion from the host-country society and discourage the children of
immigrants from applying for apprenticeships in sectors or occupations where they
perceive discrimination as being particularly rife.26
Indeed, in systems where experience in the workplace comes at the end of a VET
programme, the children of immigrants have trouble finding placements and
apprenticeships. They often end up in less highly prized alternatives, which (as mentioned
above) appears to account for drop-out.
INTERNATIONAL MIGRATION OUTLOOK 2014 © OECD 201494

2. LABOUR MARKET INTEGRATION OF IMMIGRANTS AND THEIR CHILDREN: DEVELOPING, ACTIVATING AND USING SKILLS
Links with family reunification policies. The legal and administrative framework for
family reunification can either hasten or delay the age at which children enter a country
and its school system. Requirements for sponsors – a common practice in most countries
but one that differs widely in scale and scope – may slow down the procedure and penalise
children insofar as it postpones their integration at a critical age (Table 2.2). This
“late-arrival” penalty is true of nearly all OECD countries (Figure 2.27).27 The penalty is
more marked for those originating from a low-income country and not speaking the
language of the host country at home. These are generally also the groups with the greatest
obstacles to family reunification from immigration policy. The merit of such policies thus
has to be weighed against the fact that, when children arrive young, rapid family
reunification is generally good for their skills development and future opportunities in the
host country.
Table 2.2. Average age of foreign-born pupils at time of immigration in PISA 2012,children aged 15
Average age at immigration Percentage arrived at 12 or later
Slovak Republic 10 51
Chile 9 37
Slovenia 9 35
Hungary 8 31
United Kingdom 8 31
Australia 8 28
Belgium 7 28
New Zealand 8 28
Portugal 8 28
Czech Republic 8 26
France 7 24
Sweden 8 24
Canada 7 23
Ireland 8 23
Switzerland 7 21
Italy 7 20
Luxembourg 7 20
Norway 7 20
Japan 7 19
Finland 7 18
OECD average 7 18
Spain 8 17
Iceland 8 15
Denmark 6 14
Estonia 6 14
Austria 6 12
United States 6 12
Turkey 4 10
Mexico 3 9
Germany 5 9
Greece 5 8
Israel 5 8
Netherlands 4 4
Source: OECD Programme for International Student Assessment (PISA) 2012.1 2 http://dx.doi.org/10.1787/888933157839
INTERNATIONAL MIGRATION OUTLOOK 2014 © OECD 2014 95

2. LABOUR MARKET INTEGRATION OF IMMIGRANTS AND THEIR CHILDREN: DEVELOPING, ACTIVATING AND USING SKILLS
Activating the skills of immigrants and their children
General skills activation policies include measures to strengthen motivation for
entering the labour market through enhanced incentives to work, job search requirements,
and benefit sanctions. They also seek to improve employability and manage employment
services and other labour market instruments so that they effectively promote and support
the return to work (OECD, 2013d).28
This section focuses on activating immigrants themselves, while also taking a broad
view that includes policies to encourage employers to hire and train disadvantaged
job-seekers on the labour market, including immigrants and their descendants. The
section concludes with a discussion of how to activate immigrants by facilitating
entrepreneurship so that they become employers themselves.
Activation policy design depends on countries’ employment and social policies.
However, a full discussion of activation policy and how it ties in with immigrants’ labour
market integration is beyond the scope of this chapter (see OECD, 2012b, for a discussion of
that issue). The rest of this section looks at how specific issues and policies affect
immigrants.
Activating immigrants’ skills
Effective activation begins with an analysis of the reasons for inactivity. The obstacles
that immigrants face are best identified by comparing reasons for inactivity among the
foreign-born and their descendants with those that account for inactivity among the
native-born with similar profiles – gender, age, level of educational attainment, and
family background.
Figure 2.27. The advantage of early arrival for immigrant studentsPISA point differences in reading scores at 15 years old compared with immigrant students
who arrive at or before the age of 5
1. Difference between immigrant students who arrived at or before the age of 5 and immigrants who arrived betweenthe ages 6 and 11 is not significant.
2. Difference between immigrant students who arrived at or before the age of 5 and immigrants who arrived betweenat the age of 12 or older is not significant.
Source: OECD Programme for International Student Assessment (PISA) 2012.1 2 http://dx.doi.org/10.1787/888933157624
-140
-120
-80
-40
20
-100
-60
0
-20
40
Arrived at age 6-11 Arrived at age 12 or older
Israe
l
Icelan
d
German
y
Franc
e1
Norway
1
Chile1
, 2
Sloven
ia1
Belgium
New Ze
aland
Italy1
Finlan
d1
Sweden
1
Greece
1, 2
Austra
lia
Denmark
2
Canad
a1
Czech
Rep
ublic
1, 2
Spain
1
Netherl
ands
1, 2
United
States
1, 2
Luxe
mbourg
2
Portug
al2
Switzerl
and1
, 2
Irelan
d1, 2
United
Kingdo
m1,
2
Austri
a1, 2
INTERNATIONAL MIGRATION OUTLOOK 2014 © OECD 201496

2. LABOUR MARKET INTEGRATION OF IMMIGRANTS AND THEIR CHILDREN: DEVELOPING, ACTIVATING AND USING SKILLS
However, even within the foreign-born population, inactivity can be ascribed to factors
that vary widely. New arrivals are inactive for very different reasons than immigrants who
settled a long time ago and have become increasingly distant from the labour market over
a length of time. Similarly, the obstacles to activation can be quite different for the
educated, young people, and women. Specific issues affect all four groups – newcomers,
the highly educated, youth, and women. They will be discussed in turn below.29
Unemployment and inactivity traps. A particular concern for activation policy is that
unemployment benefits and/or social assistance may weaken the incentive to look for
work, particularly among low-skilled newcomers who expect only low wages. The result is
what is often referred to as “unemployment/inactivity traps”. It affects both immigrants
and the native-born, of course. But because they are widely socio-economically
disadvantaged and expect lower wages, immigrants are generally overrepresented among
the entrapped, which has an adverse impact on employment. Any policy to eliminate
unemployment/inactivity traps by enhancing the net benefit of being in employment will
also tend to promote employment.
Supply-side incentives in the tax and benefit system try to make work more attractive
by lowering the marginal effective tax rates on entry-level low-skilled jobs. The
disincentives of high marginal tax rates affect immigrants in the same way as the
low-skilled native-born, making both groups prone to inactivity traps. The worst-affected
tend to be potential second earners, many of whom can only look forward to low wages
in the labour market. Immigrant women are often overrepresented in this group.
Restructuring the tax and benefit system can therefore help to alleviate such inactivity and
avert the unemployment/inactivity trap. Adults able to work can be supported through
unemployment benefit that is made conditional on active job-seeking, accepting suitable
job offers, and taking in active labour market programmes (ALMPs). The activation tool set
also includes tax credits for work and training and transitional into-work benefits that
combine benefits and training with work for a certain period.
Schemes initiated by countries include:
● Norway’s “qualification programme”, which is targeted at people with reduced work
capacity and provides a salary-type benefit to participants who follow a tailor-made
integration plan to improve their education and work-related training.
● Combined work and disability benefit programmes in the Netherlands (Snel and Linder,
2008) also yield positive employment effects for the foreign- and native-born, according
to research.
Such incentive programmes seek less to decrease the use of benefits than to reduce
barriers to retraining and employment as part of a broader activation strategy. The
challenge in redesigning the tax and benefit structure is to determine the amount of
support that different types of jobseekers need if they are to successfully pursue their
training and job hunting and transition into regular employment.
Evidence from many OECD countries (Liebig and Mo, 2013; Zimmermann and Barrett,
2011) shows that even though the foreign-born are often overrepresented among those
targeted by benefits (i.e. the poor, the unemployed, parents), they are actually less likely to
use benefits than the native-born with the same characteristics (i.e. age, gender, education,
employment, and family situation).
INTERNATIONAL MIGRATION OUTLOOK 2014 © OECD 2014 97

2. LABOUR MARKET INTEGRATION OF IMMIGRANTS AND THEIR CHILDREN: DEVELOPING, ACTIVATING AND USING SKILLS
Specific issues for newcomers. Legally permitted access to the labour market is a
precondition for activation. If immigrants, and new arrivals in particular, are prevented by
law from working in their new country of residence, they risk turning to informal work or
drifting further away from the labour force.
The bulk of OECD countries now grant immediate access to the labour market to most
new arrivals who are expected to stay even if – as happens in European OECD countries –
they initially have only a temporary permit. Family migrants, for example, are now
generally granted the same labour market access as their sponsors. In the past, several
European OECD countries enforced waiting periods, which may have contributed to the
low employment rates among immigrant women widely seen in those countries (Krause
and Liebig, 2011). Recent reforms in Austria, Germany, Greece and Spain have extended
equal access to reunited family members.
The reforms are indicative of the growing emphasis that policymakers are placing on
early labour market participation for all newcomers on the path to permanent residence.
However, there are still restrictions on the full, immediate right to work of provisionally or
temporarily admitted humanitarian immigrants. Yet many will stay in the host country for
good, so there seems to be a good case for removing these last remaining obstacles – unless
it is evident that their stay will only be temporary.
The unemployment/inactivity traps discussed above are an issue only if immigrants
do indeed have access to benefits. In several OECD countries, such as Australia and
Denmark, the law specifically restricts access to benefits for newcomers or at least some of
these. Although they may consequently move swiftly into employment, it might be with
unintended consequences. Newcomers may be overly exposed to poverty, for example,
especially if they have no job. There might also be a higher incidence of over-qualification
if higher-skilled immigrants are compelled to accept low-skilled employment prematurely:
● While the evidence suggests that Denmark’s lower social benefits for newcomers – the
“Start Help” – slightly increased employment rates, it has also cut their income levels.
Furthermore, it seems that it has not increased labour market participation among
newcomers and has had little effect on the groups furthest from the labour market, such
as women and the low educated (Rosholm and Vejlin, 2010; Pedersen, 2013).
● Along the same lines, the United States’ 1996 restrictions on welfare benefits for
newcomers have been associated with increases in employment rates among immigrant
women (Kaushal and Kaestner, 2007; Hall et al., 2010). At the same time, however, it has
also affected immigrants’ exposure to poverty and social exclusion (Fix, 2009; Nam, 2011).
● Australia’s introduction of a two-year waiting period for social benefits for labour
immigrants and their families has boosted their employment rate but has had a negative
impact on their job quality and over-qualification rate (Junankar and Mahuteau, 2005).30
● Similarly, there seems to be a link between the high incidence of over-qualification in
Austria and the fact that immigrants were, until recently, required to be in work in order
to enjoy secure residence status (Krause and Liebig, 2011).
Introducing immigrant-specific restrictions on access to benefits also conflicts with
the objective of welcoming immigrants and risks sending out the message that they are
different. The restrictions raise the question of trade-off between short-term gains and
negative long-term impacts on career mobility and social integration.
INTERNATIONAL MIGRATION OUTLOOK 2014 © OECD 201498

2. LABOUR MARKET INTEGRATION OF IMMIGRANTS AND THEIR CHILDREN: DEVELOPING, ACTIVATING AND USING SKILLS
Specific issues for the children of immigrants. When low income, poor education, andlimited command of a host country’s language limit immigrants’ resources, their children maywell be particularly vulnerable to dropping out of school early. And, as described in the firstpart of this chapter, they find themselves in disproportionately high numbers among NEETs.
Activating young people goes hand-in-hand with skills development. Across theOECD, remedial policies for early school leavers are paying ever greater attention toimmigrant pupils, especially late arrivals, as they are overrepresented among pupilsquitting education prematurely.
● Switzerland’s “Motivation Semester” provides individual vocational, language andconfidence-building support to coax young people onto the right track to starting anapprenticeship or educational programme.
● Denmark’s campaigns, “We need all youngsters” and “Retention Caravan”, are bothmainstream assistance programmes for young people with immigrant backgrounds thatencourage them to take up courses in sectors such as social work, healthcare, and the police.
● Austria uses a range of tools such as youth coaching and supra-company apprenticeships.It also runs workshop-based dual programmes and complementing (preparatory)measures that integrate vocational training and language support measures.
● France has also rolled out numerous initiatives, including the CIVIS programme tosupport young people who have family, social, or cultural difficulties in finding a job.
● Germany is currently putting in place an initiative called “Strengthen Youth”. It comprisesfour key programmes, one of which is specific to migrant youth.
Working with young people who are struggling in school is a challenge. But when theyhave dropped out it can be even more challenging. It is important, therefore, to identifythem early and give them the support they need to stop them from slipping into adownward spiral. Promising approaches in this respect include the “Work-Up” project inBelgium, where youth counsellors – generally themselves of immigration background –work on the street with the children of immigrants. Although it is a resource-intensiveapproach, it could nevertheless pay off significantly in the long run.
In addition to such remedial policies, Belgium has also undertaken preventative actionto improve school graduation rates by raising the minimum school-leaving age, limitingthe practice of requiring students to repeat a year, and improving VET upper-secondaryoptions (De Witte et al., 2013; and European Commission, 2010). In this context,co-operation is key, since school-to-work transition is often an area in which the roles andresponsibilities of different stakeholders such as schools, municipalities, and the publicemployment service are not clear-cut. One group of immigrant youth for which theschool-to-work transition is a particularly problematic time are those who arrive at the endof compulsory schooling. Indeed, family reunification policies should, as far as possible,seek to avoid immigrant children from arriving at such a late age.
Specific issues for immigrant women. Activating foreign-born women also entailsspecific challenges. Low labour market participation among women frequently stems fromhousehold or childcare duties which stand in the way of job-seeking and employment.They also can prevent women from taking part in introduction programmes and languagetraining. In most countries, immigrant women are more likely than their native-born peersto cite family and childcare as their main reason for not looking for work (Figure 2.28). Thegap is particularly stark in the Nordic countries, where they are up to twice as likely tomention these reasons.
INTERNATIONAL MIGRATION OUTLOOK 2014 © OECD 2014 99

2. LABOUR MARKET INTEGRATION OF IMMIGRANTS AND THEIR CHILDREN: DEVELOPING, ACTIVATING AND USING SKILLS
Childcare duties can be particularly burdensome on foreign-born women, who tend to
enjoy more limited access to childcare than the native-born. While few countries place
access restrictions on children of foreign nationality, the fact that supply cannot match
demand and places are often costly tends to put immigrant women at a disadvantage. And
women from countries where there is little formal childcare may also be unaware of the
benefits the provision can bring.
Particular issues arise from cash-for-care subsidies. They often disproportionately
curb the labour market supply of immigrant mothers as the wages they can expect from
working are lower than those of the native-born (Hardoy and Schøne, 2008). According
to studies from Nordic countries, replacing cash-for-care with free or low-cost early
childhood education and afterschool care for all tends to improve both children’s
educational outcomes and their mothers’ labour market participation. Immigrant mothers
stand to gain considerably (Ellingsæter, 2012).
One example of an effective way to activate immigrant women is the “District
Mothers” programme in Denmark, where unemployed immigrant mothers are trained to
visit and advise other women in their neighbourhood on how to enrol in education or find
work. Similar schemes are in place in other OECD countries, such as Germany where some
Länder have taken action.
Also promising are policies that combine measures to activate immigrant mothers
– which include language training – with care and early language stimulation for their
children, ideally in the same institution. Such an approach helps to overcome immigrant
parents’ reticence about the way their children may be treated in childcare and preschool
institutions.
Figure 2.28. Inactive women who cite family commitmentsas the main reason for not looking for work, 2012-13
Ratio between foreign-born and native-born, women aged 25-54
Note: Family commitments include child care, looking after incapacitated adults or other family reasons.Source: European countries and Turkey: Labour Force Surveys (Eurostat) 2012-13; Israel: Labour Force Surveys 2011;United States: Current Population Surveys 2013.
1 2 http://dx.doi.org/10.1787/888933157638
0.5
1.0
1.5
2.0
2.5
Eston
ia
Turke
y
Switzerl
and
Finlan
d
Slovak
Rep
ublic
Luxe
mbour
g
Irelan
d
Netherl
ands
Czech
Rep
ublic
Spain
United
States
Hunga
ry
German
y
Austri
a
Greece
Poland
OECD
United
Kingdo
m
Portug
al
Franc
eIta
ly
Belgium
Sloven
iaIsr
ael
Norway
Sweden
Denmark
Icelan
d
INTERNATIONAL MIGRATION OUTLOOK 2014 © OECD 2014100

2. LABOUR MARKET INTEGRATION OF IMMIGRANTS AND THEIR CHILDREN: DEVELOPING, ACTIVATING AND USING SKILLS
Facilitating mothers’ involvement in school, preschool, and childcare not only benefits
their children, it can also help to activate mothers themselves as it improves their language
learning and brings them more into social mainstream. Several OECD countries have
introduced the international programme “Home Instruction for Parents of Preschool
Youngsters” (HIPPY) and other programmes of mother and child education. There is
evidence that they have helped connect educationally disadvantaged parents with the
labour market and improved their children’s education outcomes.
Norway has initiated a scheme to enhance immigrant parents’ self-confidence and
awareness of their role in their children’s learning. Similar projects have also been rolled
out at national and local level in Denmark and the Netherlands (OECD; 2007, 2008a).
Germany and France run programmes that organise language and vocational training for
parents at their children’s school. The aim is also to generate positive side-effects on the
school climate and parent-teacher relations. In Korea, support centres provide basic
services directed specifically at immigrant mothers. The services include family education,
language courses, translation and interpretation, childcare and child education support.
Immigrant women across the OECD are also addressing these issues themselves by
creating self-help groups focused on empowerment. Countries where they are taking
matters into their own hands include Australia, Denmark, Finland, Ireland, and Sweden.
Family commitments, particularly childcare, are not the only obstacles to efforts to
activate foreign-born mothers. In some countries, women who arrive as family-reunification
immigrants are not entitled to welfare, which also makes them ineligible for ALMP. Indeed,
provisions for family formation and reunification in many countries formally prohibit access
to social benefit. Where integration schemes are time-bound – as introduction programmes
usually are – foreign-born women who have spent their first few years in a host-country busy
with childcare duties may find that they are no longer entitled to them. Action to activate
foreign-born women should therefore carefully factor in formal obstacles to activity.
Specific issues for highly educated immigrants. One of the most striking findings from
the first part of this chapter is the wide gap in employment rates between the highly
educated foreign- and native-born. It stems chiefly from inactivity, which is particularly
high among immigrants from non-OECD countries. And even when they are in
employment, they are often over-qualified for the jobs they do. The fact, though, that so
many are inactive, and therefore not even looking for a job, is a puzzle. It points to
issues of discouragement. The reasons are not entirely clear, but seem related to the
non-recognition of their foreign credentials and discrimination, as well as language
obstacles.
Positive versus negative incentives. The activation approach adds a new perspective to
the on-going political debate over compulsory versus voluntary integration programmes.
Many mainstream schemes carry the threat of benefit sanctions for refusal to participate.
In fact, that is now standard practice and there is no reason to distinguish between
immigrants and the native-born in this respect.31 Yet, several European OECD countries –
including Austria, Denmark, France, Germany, and Norway – have also made integration
programmes obligatory for specific categories of newcomers.32 Obligation is further
reinforced by penalties for non-participation. They do not necessarily entail shutting off
access to benefits – indeed, as mentioned, many family immigrants are not eligible,
anyway – but, rather, the denial of permanent residence permits.
INTERNATIONAL MIGRATION OUTLOOK 2014 © OECD 2014 101

2. LABOUR MARKET INTEGRATION OF IMMIGRANTS AND THEIR CHILDREN: DEVELOPING, ACTIVATING AND USING SKILLS
A frequently aired motive for compelling immigrants to attend integration
programmes is that many of those who have been resident in a host country for years still
do not master its language well. There has been less focus on the underlying barriers to
participation in integration programmes or the use of positive incentives.
Like other integration policy approaches, activation should start by spotting
immigrants who struggle with the language and identifying their reasons for non-
participation in integration programmes. Reasons can range from simple disinterest to
ignorance of available courses, lack of time due to work or family commitments,
inconvenient or inadequate offers, the perceived high costs or low benefits of programmes
for labour market integration.
A number of well-designed voluntary integration measures in OECD countries have
had take-up rates of well above 90%. Their popularity suggests that the widespread
concern over immigrants’ “lack of willingness to integrate” – reflected in the mandatory
nature of many programmes – is a problem that concerns only a small minority. The
question is not only whether making integration measures obligatory is an effective way of
reaching the few immigrants who would not otherwise participate, but whether it may
have an adverse effect on the vast majority who would have participated anyway. After all,
obligation sends out the message that the host-country presumes that immigrants do not
want to learn the language or settle down permanently. That sentiment can discourage the
foreign-born from investing in their skills and training and reinforce negative stereotypes
about immigrants, which may put employers off from hiring them.
The activation approach focuses both on expanding the demand for and the supply of
integration support, since high-quality courses and high levels of participation are
mutually reinforcing. In addition, incentives should be directed not only at immigrants
– after all, participation is generally in their own best interest. Providers, too, should be
incentivised to ensure quality training. They should be paid – in part, at least – only if they
achieve the stated objectives of improving language proficiency and labour market
integration.33
Engaging with employers
Making hiring more attractive. Several OECD countries have addressed the issue of
encouraging employers to hire people who have drifted away from the labour market. They
do so through mechanisms such as wage subsidies (see previous section) and cuts in
employer-based contributions to social security.34 Recent structural reforms in Italy and
Spain have sought to reduce barriers to employment by facilitating part-time work and
introducing more flexible working arrangements (OECD, 2012b).
Making informal work into formal employment may also be an effective strategy,
particularly in lower-income OECD countries with large estimated informal sectors, such
as domestic services, where immigrants are widely over-represented. While greater
enforcement seems to have had only a modest effect, potentially effective measures are
tax and wage incentives and cuts in red tape to ease hiring formalities (OECD, 2004).
Personal and household service vouchers that lower the price in the formal market can
also help to move people out of informal to formal employment. The use of such vouchers
in Italy and Belgium, for example, has improved the employment prospects of low-skilled
workers, particularly women, in domestic service.
INTERNATIONAL MIGRATION OUTLOOK 2014 © OECD 2014102

2. LABOUR MARKET INTEGRATION OF IMMIGRANTS AND THEIR CHILDREN: DEVELOPING, ACTIVATING AND USING SKILLS
As with active labour market policies in general, a recurring problem with action
primarily aimed at the labour demand side is that immigrants are often underrepresented
among beneficiaries. The inference is that there are further structural barriers to
employers’ willingness to employ immigrants – at least in the formal sector – that need to
be addressed. Some schemes, like one targeted at refugees in Australia and local initiatives
in Sweden, have reached out to employers in an effort to better understand their business
needs and give immigrant participants training that responds specifically to those needs.
Anti-discrimination law and equal employment policies. As was described in the first
part of this chapter, discrimination – on the grounds of ethnicity, race, religion, and nationality
– is still a major obstacle to immigrants’ participation in the labour market. Yet, there is a wide
lack of awareness of discrimination – 40% of EU residents think ethnic discrimination is rare or
non-existent in their country, according to a 2012 Eurobarometer Survey.35
The most basic instrument for preventing discrimination is legislation formally outlawing
it. Victims in employment and training can now turn to dedicated laws and agencies in the
vast majority of OECD countries. Anti-discrimination legislation seeks to go beyond solely
securing redress for victims to actually changing public behaviour. People who believe they
have been discriminated against are encouraged to report cases and file complaints.
Unfortunately, though, legislation in most OECD countries is generally not strong or accessible
enough to effectively prevent employers and others from discriminating against immigrants.
Some OECD countries actually do have comprehensive legislation with strong
enforcement mechanisms and agencies. They include countries of settlement and
European OECD countries like Sweden and the United Kingdom. In most European
OECD countries, frameworks build on recent laws and agencies adopted them some time
after 2000 in the wake of the European Union’s Employment Equality Framework
Directive.36 The Czech Republic (2009), Estonia (2009), and Poland (2010) are the most
recent member countries to incorporate the directive. And even countries with small
immigrant populations outside Europe, like Chile and Mexico, are increasingly adopting
anti-discrimination framework laws.
However, legislation in a number of countries does not cover discrimination on all
grounds and in all areas of public life. The failure to explicitly prohibit it on the basis of
nationality or citizenship opens the way to discrimination against immigrants. Plaintiffs
often carry the entire burden of proof, while government equality agencies which advise
victims are frequently not allowed to file suits themselves and lack independent
investigatory powers. Moreover, the penalties meted out to employers found guilty of
discrimination are often merely token (European Union Agency for Fundamental
Rights, 2008). As a result, few cases find their way into the courts, while some are settled
informally.
The robustness and enforcement of legislation and anti-discrimination agencies’
powers determine whether employers comply with the law and victims lodge complaints.
Evidence from the US indicates that sterner anti-racism laws improve minorities’
long-term employment prospects and, to some extent, their earnings (Neumark and Stock,
2001; Donohue, 2005). While the under-reporting of discrimination is a major problem
across countries, immigrant survey respondents said they were more likely not to report a
case or to think that nothing would come of it in countries with weak anti-discrimination
laws (European Union Agency for Fundamental Rights, 2009). Stronger, comprehensive
INTERNATIONAL MIGRATION OUTLOOK 2014 © OECD 2014 103

2. LABOUR MARKET INTEGRATION OF IMMIGRANTS AND THEIR CHILDREN: DEVELOPING, ACTIVATING AND USING SKILLS
laws and empowered agencies improve plaintiffs’ chances of redress and increase the
number of deterrent sanctions. But the chief merit of anti-discrimination legislation is the
signal it provides – i.e. that discrimination is unacceptable and policy is watchful.
To offset the known weaknesses of anti-discrimination legislation, a number of
countries have gone a step further and introduced equal employment policies (EEPs). They
have done so to promote equal opportunity for disadvantaged groups on the labour
market, and are increasingly making immigrants and their children a key target group.
EEPs seek to remove obstacles to employment through action that ranges from targets
regarding immigrant employment and monitoring to quotas and affirmative action.
Diversity policies, like Belgium’s, for example, include administrative and financial support
to employers who agree to take measures that give disadvantaged groups a better chance
(OECD, 2008a). Within the OECD, the most robust EEPs seek to enforce gender parity
and incorporate measures to ensure equal employment opportunity for women. The
foreign-born and their descendants benefit from relatively firm private-sector EEPs mainly
in the United Kingdom and countries of longstanding settlement, such as Australia,
Canada and the United States. Elsewhere, there are no obligatory EEPs for the foreign-born
or their descendants in the private sector, although some countries – like Norway – have
introduced them in the public sector.37
A recent trend is diversity management whereby employers voluntarily agree to
promote diversity and equal opportunity in the workplace for all individuals regardless of
race, ethnic origin, or religion. Twelve European OECD countries have introduced national
diversity charters,38 which businesses and public institutions voluntarily sign, pledging to
foster diversity. However, the scale and scope of such instruments often remains limited,
as implementation is not monitored and only a few large companies commit to them.
Belgium and France, however, have taken matters further. They have introduced diversity
labels, whereby authorities audit and certify a company’s diversity management policies
on a regular basis with relevant stakeholders. The labels testify to a company’s
commitment to its corporate social responsibility, while the labels give it a public relations
incentive to be an equal opportunity employer.
EEPs, whether voluntary or obligatory, do not appear to be effective if they are not
backed by reporting and accountability requirements. In the United States, affirmative
action programmes – which are a management responsibility and hold firms accountable –
have improved employment outcomes for minorities, especially those working in firms
with federal government contracts (see Holzer, 2010). In comparison, voluntary EEPs have
a number of shortcomings.
First, comparatively few businesses participate in EEPs in Europe compared with
the United States. Second, small and medium-sized enterprises (SMEs) tend to be
underrepresented, even though they not only generally account for the bulk of new jobs,
but are the companies where discrimination against immigrants is worst.39 Moreover,
participating businesses often do not have to answer to any monitoring or reporting
requirement as to the results of their voluntary diversity action (European Commission,
2008). Greater evaluation and better piloting would strengthen the business case for
voluntary EEPs and help design more effective ones, whether voluntary or obligatory.
Clearly, there is room for an evidence-based approach to designing more effective
EEPs. One good example is a pilot scheme to monitor anonymous CVs in the hiring process.
The idea behind anonymous CVs is that there is nothing to tie them to people who are
INTERNATIONAL MIGRATION OUTLOOK 2014 © OECD 2014104

2. LABOUR MARKET INTEGRATION OF IMMIGRANTS AND THEIR CHILDREN: DEVELOPING, ACTIVATING AND USING SKILLS
exposed to discrimination on the grounds of age, gender, ethnicity, race, nationality, or
religion. They thus contribute to reducing discrimination. Pilots in Belgium, Germany,
the Netherlands, and Sweden suggest that anonymous CVs can indeed help curb
discriminatory hiring (Heath, Liebig, and Simon; 2013).40 However, they may be difficult to
implement in SMEs where there is no separate human resources department which would
normally be the intermediary between an applicant and the recruitment manager to whom
the anonymous application is sent.
Activating immigrants as employers
A third channel of activation is immigrants as employers themselves. In most
OECD countries, the foreign-born are slightly more likely than the native-born to be
self-employed and open new businesses, even after controlling for their individual
characteristics (Figure 2.29).
There are several positive aspects to immigrants becoming self-employed or setting up
their own businesses, such as the significant contribution they make to employment and
tentative evidence of growing trade with their countries of origin (OECD, 2010c). Still,
doing so is no panacea for labour market integration. Many foreign-born end up in
self-employment to escape from marginalisation in the labour market. In other words,
self-employment is not always related to entrepreneurial skills. The foreign-born are more
likely to both enter and exit self-employment, while new immigrant-run businesses have
a lower survival rate than businesses founded by the native-born.
Figure 2.29. Percentage of self-employed 15- to 64-year-oldsamong non-agricultural workers by place of birth, 2012-13
Note: Hatched bars indicate that the percentage of self-employed is higher among the native-born and white barsindicate that the percentage is higher among the foreign-born.Source: European countries and Turkey: Labour Force Surveys (Eurostat) 2012-13; Chile: Encuesta de CaracterizaciónSocioeconómica Nacional (CASEN) 2011; Israel: Labour Force Surveys 2011; Mexico: Encuesta Nacional de Ocupación yEmpleo 2013 (ENOE); United States: Current Population Surveys 2013.
1 2 http://dx.doi.org/10.1787/888933157640
0
5
15
30
10
25
20
35
Foreign-born Native-born
Icelan
d
Norway
Luxe
mbourg
Eston
ia
Switzerl
and
Denmark
Austri
aIsr
ael
Sweden
Irelan
d
Sloven
ia
German
y
United
States
Franc
e
Finlan
d
Greece
OECD
Portug
al
Hunga
ry
Belgium
Turke
yIta
ly
Netherl
ands
Spain
United
Kingdo
mMex
ico
Slovak
Rep
ublic
Chile
Czech
Rep
ublic
Poland
INTERNATIONAL MIGRATION OUTLOOK 2014 © OECD 2014 105

2. LABOUR MARKET INTEGRATION OF IMMIGRANTS AND THEIR CHILDREN: DEVELOPING, ACTIVATING AND USING SKILLS
There are barriers to entrepreneurship that are particularly difficult to overcome for
immigrants. Among these is access to credit. On the borrower’s side, foreign-born
entrepreneurs have a more limited credit history in their country of residence than their
native-born counterparts. One reason is the lack of cross-border information sharing on
credit histories. And because host-country credit institutions have more misgiving about
foreign- than native-born entrepreneurs, they apply more stringent lending criteria and
even discriminate against them. Research from Italy (Albareto and Mistrulli, 2010 and 2011)
shows that immigrant entrepreneurs who obtained a loan had to pay interest rates that
were, on average, 70 base points higher than those charged to their native-born peers.
Knowledge of host-country administrative requirements and country-specific ways of
running a business can also be an obstacle.
However, greater attention is being paid to immigrant entrepreneurs. Specific
support is well established in several countries – such as Israel, the United Kingdom, and
the United States – and start-ups using them seem to have higher survival rates than the
national average. Mainstream programmes, too, can be particularly effective for
immigrants. For example, Australia’s New Enterprise Incentive Scheme looks to have had
good results in helping non-English-speaking immigrants set up stable businesses.
Support for immigrant entrepreneurs is still on the limited side in most European
OECD countries, although it is on the increase in France, Germany, and Norway among others.
Sweden’s national entrepreneurship support agency, ALMI, has even created a dedicated
branch – a fine example of how immigrant-specific support can be part of the mainstream.
Conclusion: Integration as investmentSuccessful integration requires comprehensive, well-tailored measures that factor in
considerations specific to immigrants’ countries of origins, the groups to which they
belong, their entry categories, education background, and family situation. As immigration
flows grow more diverse in most countries, they must increasingly customise their
integration policy instruments. That being said, immigrants’ needs are not necessarily
different from those of the native-born, once they have settled in. Indeed, effective general
programmes often have an even greater impact on immigrants than on native-born in
similar situations, provided that they are accessible. Greater mainstreaming should thus
address immigrants’ under-representation in more effective general policies that is widely
observed to date.
Nevertheless, the reasons for underrepresentation are not always clear. Is it due to
lack of information? Are immigrants and employers just not interested enough? If not, why
not? Or are integration programmes not properly targeted or incentives wrongly set?
Effective policies do not always need to cost the public purse much. Instruments like
volunteer-based mentoring, public sector recruitment, the promotion of naturalisation and
stronger anti-discrimination legislation do not entail significant financial investment.
Similarly, supplying information on the integration programmes available and the benefits
they bring is often just as important as actually providing the programmes. A balanced
public discourse is also a “measure” that does not come at a financial cost, but produces
potentially valuable gains.
Ultimately, however, the success of labour market integration policy depends not only
on the take-up of the programmes and on the investment that goes into them, but – above
all – on employers’ willingness to hire and train immigrant workers. To that end, aligning
INTERNATIONAL MIGRATION OUTLOOK 2014 © OECD 2014106

2. LABOUR MARKET INTEGRATION OF IMMIGRANTS AND THEIR CHILDREN: DEVELOPING, ACTIVATING AND USING SKILLS
employers’ incentives with the objective of harnessing the skills potential of immigrants
and their children is critical. Employers need to be part of the integration process and to
see integration as an investment, if only for securing future labour supply. Well-designed
diversity polices are a promising direction in that respect.
Investing in the skills that bring immigrants into the labour market can pay off
handsomely. OECD work on the fiscal impact of migration (Liebig and Mo, 2013) has shown
that lifting immigrants’ employment rates to native-born levels would deliver fiscal
benefits of one-half of a percentage point of GDP or more annually in OECD countries like
Belgium, France, and Sweden. Successful integration not only improves the economic and
fiscal benefits of immigration, it is also an important factor in social cohesion. Viewing
integration as an investment also has implications for the way that integration policies are
designed.
First, policy should incorporate early intervention – critical both for newcomers on the
way to permanent residence and for the children of immigrants. While the early labour
market integration of newcomers is the best predictor of employment in the long-term, an
immigrant’s first job may well not make full use of his or her skills and thereby not be very
stable. Yet, if support does not end with the first day of employment, there need not be a
trade-off between rapid employment and lasting integration. As for the offspring of
immigrants, the most effective policy is to ensure their participation in early childhood
education and care from around the age of three. It is precisely the age at which the fewest
children of immigrants tend to be in the education system.
Second, if they consider integration an investment, policies should not seek to pay off
immediately. All the immigrants who settle need to build the basic skills that enable them
to function in the host society. It is undoubtedly a costly approach and may not even pay
off in fiscal terms if only immigrants themselves are considered – particularly if they lack
basic skills and have drifted well outside the confines of the labour market. However, the
benefits extend beyond the labour market to social cohesion and across generations,
where immigrants’ children may reap them.
Viewing integration as an investment does not necessarily mean that the state should
fund all integration measures. Nevertheless, if the benefits of effective integration are to be
felt across the whole of society, there is a strong case for significant subsidies. Especially in
situations where immigrants are not in a position themselves to invest the amount they
need, government intervention to provide support is warranted.
Finally, policy that takes the long view means that access to integration support
should be dependent not on the group to which an immigrant belongs, but on his or her
settlement prospects and needs. Family-reunification immigrants, for example, are still
too often out of the focus of integration policy. Yet there is a high probability that they will
stay on in the host country.
Most immigrants and their offspring, be they educated or not, work in OECD countries.
Their situation and skills improve over time. Nevertheless, they have a great fund of
still-underused skills and potential to offer. Tapping into their skills and investing to
unleash their potential are critical to the future of OECD countries.
INTERNATIONAL MIGRATION OUTLOOK 2014 © OECD 2014 107

2. LABOUR MARKET INTEGRATION OF IMMIGRANTS AND THEIR CHILDREN: DEVELOPING, ACTIVATING AND USING SKILLS
Notes
1. This chapter was prepared by Thomas Liebig (OECD) and Thomas Huddleston (Consultant).
2. The terms “foreign-born”, “migrant” and “immigrant” are used synonymously in this chapter. Theyrefer to the population born abroad – not only to the population which has a foreign nationality.The terms “descendants”, “offspring of immigrants” and “children of immigrants” are also usedsynonymously. They encompass both youth who immigrated with their parents at school age andthe native-born children of immigrants. For the latter, some countries use the term “second-generation immigrants”, which risks the connotation that the immigrant status is perpetuated.The OECD countries that have been settled by migration also occasionally use the term “secondgeneration” but give it a different connotation. Canada, for example, refers to “second-generationCanadians”, to reflect the fact that both they and their parents are considered an integral partof society.
3. The OECD countries which are English-speaking have the additional advantage that English iswidely spoken. Thus, even many – if not most – immigrants from countries which are not formallyEnglish-speaking master the language well.
4. In the United States, the shares of recent arrivals, of highly educated and of immigrants who wereexposed to their host country’s language before arrival are lower than in the other countries inthis group.
5. Again, however, part of the higher scores for immigrants with domestic qualifications may also bedue to the fact that they master the host-country language better.
6. As a result, humanitarian migrants generally tend to be the main target group of integrationprogrammes in OECD countries. However, this is less often the case for family migrants.
7. Although the integration of the native-born children of immigrants is of particular concern in theEuropean OECD countries, the outcomes of this group are also an important considerationelsewhere (see Hugo [2011] on the children of humanitarian immigrants in Australia).
8. However, the sample sizes are small in most countries, so the results are only statisticallysignificant in a few European OECD countries with large populations of children of immigrants.
9. Note, however, that these results are not based on longitudinal data following the same immigrantsover time, but on cross-sectional data based on length of stay. Nonetheless, the pattern observed isgenerally as expected, i.e. immigrants who have been longer in the host country have better outcomes.
10. Beyond this well-documented discrimination against immigrants in hiring, evidence exists ofdiscrimination in career advancement and in the education system.
11. Along the same line, PISA data show that children of immigrants have on average highermotivation and higher aspirations regarding their careers than the children of native-born.
12. For example, in Canada’s Red Seal programme for skilled trades’ workers, employer organisationsand associations are closely involved in determining standards and accreditation.
13. Many OECD countries have developed media projects and awards to encourage the reporting ofobjective stories, statistics, and research on migration and integration. One interesting initiative inGermany is “Mediendienst Integration” (Integration Media Service), funded by the governmenttogether with private foundations, and located in the House of the German Press Conference. Thisservice provides information, summarises research, highlights new and missing topics, and buildsup networks of expertise among researchers and journalists.
14. This is known as the “stereotype threat” which has been confirmed by experiments amongwomen, ethnic minorities, and immigrants. For the United States, see Massey and Fischer (2005);Ward-Schofield (2006); Deaux et al. (2007); Owens and Lynch (2012). For an Austrian example: Appeland Kronberger, 2012.
15. For example, in 2012, the Belgian regions of Brussels and Wallonia granted non-EU nationals equalaccess to the civil service and teaching jobs in 2013. In Italy, the Law 97/2013 opened the publicsector to several legal categories of non-EU nationals.
16. Similar initiatives have been started in cities and federal states in Germany, such as “Berlin brauchtdich!” and “Wir sind Hamburg” to raise the proportion of public sector trainees with a migrationbackground. Workforce diversity targets have also been set for the public sector in the region ofFlanders in Belgium (Equal Opportunities and Diversity Plan) and cities in Austria (Vienna’sIntegration and Diversity Monitor), Denmark (Copenhagen’s Integration Barometer) and theNetherlands (Amsterdam’s Programma Diversiteit). For more such initiatives in Europe, see theEuropean Commission’s website on integration.
INTERNATIONAL MIGRATION OUTLOOK 2014 © OECD 2014108

2. LABOUR MARKET INTEGRATION OF IMMIGRANTS AND THEIR CHILDREN: DEVELOPING, ACTIVATING AND USING SKILLS
17. See, for example, the literature review in Liebig and Von Haaren (2011) and the studies collected inOECD (2011).
18. Some barriers remain for certain jobs in the public sector. These again tend to be small in mostcases and there has been great improvement in recent years, but hiring nationals might still bepreferred. In Canada, where barriers to naturalisation are low, there are no administrative barriersto hiring permanent residents (that is, immigrants who have not yet naturalised), but citizens aregiven preferential treatment when applying for jobs in the federal public service.
19. In many countries, the PES offers early and intensive coaching focused on immediate employmentwith individualised follow-up. This policy seems to have met with some success, notably in theScandinavian countries (Sianesi, 2004; Aslund and Johansson, 2006; Joona and Nekby, 2012).
20. Examples of the systematic use of immigrant-origin mentors are Denmark’s “We Need AllYoungsters” campaign and its “Retention Caravan” that use youth and parent role models todiscuss their experiences and give advice on how to choose and successfully complete educationprogrammes.
21. ISCED stands for International Standard Classification of Education.
22. For instance, Ireland allows the temporary registration of non-EU doctors to work undersupervision and receive further training for a period of up to seven years. The United Kingdom alsoallows temporary registration for certain healthcare professionals. Since 2002, Portugal has put inplace a bridging programme for immigrant doctors with a training, exam, and registrationprocedure. The programme includes financial support covering fees and medicine-specificlanguage courses and textbooks.
23. Similarly, most surveyed participants and teachers in Estonia’s language training developmentprogrammes did not think it improved labour market participation (Saar Poll OÜ, 2013).
24. Vocational-specific language specialists can also work with employers to help properly define thelanguage skills actually needed for specific jobs, as in the “Work-Up Project” in the Flemish regionof Belgium.
25. For example, the Austrian Public Employment Service (AMS) offers vocation-specific on-the-joblanguage training, but this is only 5% of its total language training (see Krause and Liebig, 2011). InBrussels, non-EU immigrants are strongly under-represented among users of its language-chequeprogramme, providing 20-40 hours of one-to-one language training.
26. Heath, Liebig and Simon (2013) show, using data from social surveys in European OECD countries,Canada, New Zealand and the United States, that native-born children of immigrants in EuropeanOECD countries feel more often discriminated against than their parents. Exactly the reverse isobserved in the OECD countries which have been settled by migration.
27. While this pattern is observed in the vast majority of countries, it does not hold everywhere. Thisis probably due to cohort effects: children who arrived in a host country more recently may havedifferent backgrounds than earlier arrivals. For example, they may have parents who are highereducated on average.
28. Training and education for the inactive are also generally considered activation measures.However, they are discussed in the previous section on developing skills since their focus is on thedevelopment of new skills rather than on the activation of existing ones.
29. For example, beneficiaries of international protection in European OECD countries are 10 percentagepoints more likely to be inactive for health reasons than other immigrants of the same age andgender.
30. Note, however, that Australia’s social security system differs from that of most other OECD countriesas it is government-funded (tax transfers) rather than insurance/contributory based.
31. There may nevertheless be some indirect targeting, if, for example participation in programmes toovercome language obstacles – presumably an issue mainly for immigrants – is a precondition forbenefit access. For example, the United Kingdom recently introduced an English LanguageRequirement for all jobseekers whose English speaking and listening skills are below Entry Level 2.Where levels are below, participation in measures is compulsory. Such measures have theadvantage of targeting the issue, rather than immigrants themselves.
32. The Netherlands does not require participation, but does require an integration test to be taken.
33. At the same time, incentives should reflect the fact that immigrants with different skills also havedifferent integration pathways.
INTERNATIONAL MIGRATION OUTLOOK 2014 © OECD 2014 109

2. LABOUR MARKET INTEGRATION OF IMMIGRANTS AND THEIR CHILDREN: DEVELOPING, ACTIVATING AND USING SKILLS
34. Indeed, the objective of wage subsidies is two-fold. On the one hand, they aim at encouragingemployers to give disadvantaged groups a chance – by compensating for actual or perceived lowerproductivity. On the other hand, they help to give immigrants a chance to demonstrate their skillsin a context where employers are reticent. This is probably the reason why they tend to be moreeffective for immigrants than for other disadvantaged groups.
35. Particularly in Austria, Germany, Ireland, and most Southern European countries.
36. http://eur-lex.europa.eu/LexUriServ/LexUriServ.do?uri=CELEX:32000L0078:en:HTML.
37. The Netherlands also had strong policies in this respect in the past, but most have been abolishedover the past decade (see OECD [2008a] for a discussion of the issue).
38. Austria, Belgium, Estonia, Finland, France, Germany, Ireland, Italy, Luxembourg, Poland, Spain andSweden.
39. SMEs often have little experience in hiring immigrants. In addition, in situations where there isuncertainty about a candidates’ skills, SMEs may tend to be more risk-averse since a single lessproductive employee would have a relatively stronger impact on the company’s performance thanin a larger firm. As a result, testing studies have confirmed that discrimination tends to be morepronounced in SMEs (Heath, Liebig and Simon; 2013).
40. In France, one evaluation of a pilot scheme point to a negative impact of anonymous CVs. However,the companies that took part had volunteered, making it likely that the participating companieswanted to diversify their staff and were thus not representative.
Bibliography
Albareto, G. and P.E. Mistrulli (2011), “Bridging the gap between migrants and the banking system”,Temi di discussione (Economic Working Papers), No. 794, Bank of Italy, Economic Research andInternational Relations Area.
Alegre, M.A. and G. Ferrer (2010), “School Regimes and Education Equity: Some insights based onPISA 2006”, British Education Research Journals, Vol. 36, No. 3, pp. 433-461.
Appel, M. and N. Kronberger (2012), “Stereotypes and the Achievement Gap: Stereotype threat prior totest taking”, Educational Psychology Review, Vol. 24, No. 4, pp. 609-635.
Aslund, O. and M. Engdahl (2012), “The Value of Earning for Learning: Performance bonuses inimmigrant language training”, IZA Discussion Paper, No. 7118, IZA, Bonn, Germany.
Aslund, O. and P. Johansson (2006), “Virtues of SIN: Effects of an immigrant workplace introductionprogram”, Working Paper, No. 7, Institute for Labour Market Policy Evaluation, Uppsala, Sweden.
Bevelander, P. and N. Irastorz (2014), “Economic Integration of Intermarried Labour Migrants, Refugeesand Family Migrants to Sweden: Premium or Selection?”, IZA Discussion Paper, No. 8065, IZA, Bonn,Germany.
Bird, K et al. (eds.) (2011), The Political Representation of Immigrants and Minorities, Routledge, New York,United States.
Bonfanti, S. and T. Xenogiani (2014), “Migrants’ skills: Use, mismatch and labour market outcomes – Afirst exploration of the International Survey of Adult Skills (PIAAC)”, in OECD and European Union,Matching Economic Migration with Labour Market Needs, OECD Publishing, Paris, http://dx.doi.org/10.1787/9789264216501-11-en.
Burger, K. (2010), “How Does Early Childhood Care and Education Affect Cognitive Development? AnInternational review of the effects of early interventions for children from different socialbackgrounds”, Early Childhood Research Quarterly, Vol. 25, pp. 140-165.
Butschek, S. and T. Walter (2013), “What Active Labour Market Programmes Work for Immigrants inEurope? A Meta-analysis of the evaluation literature”, Discussion Paper, No. 13-056, ZEW, Mannheim,Germany.
Chiswick, B. (2008), “The Economics of Language: An Introduction and overview”, IZA Discussion Paper,No. 3568, IZA, Bonn, Germany.
Chiswick, B. and P. Miller (2014), “International Migration and the Economics of Language”, inChiswick, B. and P. Miller (eds.), Handbook on the Economics of International Migration, forthcoming.
Chiswick, B. and P. Miller (2009), “The International Transferability of Immigrants’ Human Capital”,Economics of Education Review, Vol. 28, No. 2, pp. 162-169.
INTERNATIONAL MIGRATION OUTLOOK 2014 © OECD 2014110

2. LABOUR MARKET INTEGRATION OF IMMIGRANTS AND THEIR CHILDREN: DEVELOPING, ACTIVATING AND USING SKILLS
Clausen, J. et al. (2009), “The Effect of Integration Policies on the Time until Regular Employment ofNewly Arrived Immigrants: Evidence from Denmark”, Labour Economics, Vol. 16, pp. 409-417.
Coenders, M. et al. (2005), “Majority Populations’ Attitudes Towards Migrants and Minorities”, Report forthe European Monitoring Centre on Racism and Xenophobia, Ref. No. 2003/04/01.
Damas de Matos, A. (2014), “Immigrant skills, their measurement, use and return: A literature review”,in OECD and European Union, Matching Economic Migration with Labour Market Needs, OECDPublishing, Paris, http://dx.doi.org/10.1787/9789264216501-8-en.
Damas de Matos, A. and T. Liebig (2014), “The qualifications of immigrants and their value in the labourmarket: A comparison of Europe and the United States”, in OECD/EU, Matching Economic Migrationwith Labour Market Needs, OECD Publishing, Paris, http://dx.doi.org/10.1787/9789264216501-9-en.
De Witte, K. et al. (2013), “The Impact of Institutional Context, Education and Labour Market Policieson Early School Leaving: A Comparative analysis of EU countries”, European Journal of Education,Vol. 48, No. 3, pp. 331-345.
Deaux, K. et al. (2007), “Becoming American: Stereotype threat effects in Afro-Caribbean immigrantgroups”, Social Psychology Quarterly, Vol. 70, No. 4, pp. 384-404.
Djuve et al. (2003), “From Social Benefits to Paid Qualification: Findings from 26 trial projects withcompulsory introductory programs for newly arrived refugees”, Council of Europe, Strasbourg,France.
Donohue, J. (2005), “The Law and Economics of Anti-Discrimination Law”, Working Paper, No. 11631,National Bureau of Economic Research, Cambridge, Massachusetts, United States.
Dronkers, J. and F. Fleischmann (2010), “The Educational Attainment of Second Generation Immigrantsfrom Different Countries of Origin in the EU Member States”, in Dronkers, J. (ed.), Quality andInequality of Education: Cross-national Perspectives, Springer, New York, pp. 163-204.
Dumont, J.C. and O. Monso (2007), “Matching Educational Background and Employment: A Challengefor Immigrants in Host Countries”, in OECD, International Migration Outlook 2007, OECD Publishing,Paris, http://dx.doi.org/10.1787/migr_outlook-2007-4-en.
Dustmann, C. et al. (2012), “Educational Achievement of Second-Generation Immigrants: An Internationalcomparison”, Economic Policy, pp. 143-185.
Ellingsaeter, A. (2012), “Cash for Childcare: Experiences from Finland, Norway and Sweden”, InternationalPolicy Analysis, Friedrich Ebert Stiftung, Berlin, Germany.
European Commission (2010), “Reducing Early School Leaving: Accompanying document to the Proposalfor a Council Recommendation on policies to reduce early school leaving”, European Commission,Brussels, Belgium.
European Commission (2008), “Voluntary Diversity Initiatives in and for Europe: The Role of diversitycharters”, European Commission, Brussels, Belgium.
European Union Agency for Fundamental Rights (2009), EU-MIDIS European Union Minorities andDiscrimination Survey: Main results report, Vienna, Austria.
European Union Agency for Fundamental Rights (2008), Annual Report 2008, Vienna, Austria.
Facchini, G. et al. (2014), “Migration, Friendship Ties and Cultural Assimilation”, IZA Discussion Paper,No. 7881, IZA, Bonn, Germany.
Farvaque, N. (2013), “Developing Personal and Household Services in the EU: A Focus on houseworkactivities”, European Commission, Brussels, Belgium.
Fix, M. (ed.) (2009), Immigrants and Welfare: The Impact of welfare reform on America’s newcomers, RussellSage Foundation, New York, United States.
Hall, M. et al. (2010), “Economic self-sufficiency among immigrant TANF-leavers: Welfare eligibility asa natural experiment”, Social Science Research, No. 39, pp. 78-91.
Hardoy, I. and P. Schøne (2089), “Incentives to Work: Labour supply effects of a cash-for-care subsidy fornon-Western female immigrants”, Working Paper from Institute for Social Research, Oslo, Norway.
Heath, A., T. Liebig and P. Simon (2013), “Discrimination against immigrants – measurement, incidenceand policy instruments”, in OECD, International Migration Outlook 2013, OECD Publishing, Paris,http://dx.doi.org/10.1787/migr_outlook-2013-7-en.
Hofer, H. et al. (2013), “Diskriminierung von MigrantInnen am österreichischen Arbeitsmarkt”, Researchreport, Institute for Advanced Studies (IHS), Vienna, Austria.
INTERNATIONAL MIGRATION OUTLOOK 2014 © OECD 2014 111

2. LABOUR MARKET INTEGRATION OF IMMIGRANTS AND THEIR CHILDREN: DEVELOPING, ACTIVATING AND USING SKILLS
Huddleston, T. et al. (2013), Using EU Indicators of Immigrant Integration, European Commission, Brussels,Belgium.
Hugo, G. (2011), “Economic, Social and Civic Contributions of First and Second GenerationHumanitarian Entrants”, Report for the Australian Department of Immigration and Citizenship,Canberra.
Isphording, I. (2013), “Disadvantages of Linguistic Origin: Evidence from Immigrant Literacy Scores”,Ruhr Economic Papers, No. 397, Bochum/Dortmund/Duisburg/Essen, Germany.
Isphording, I. and S. Otten (2011), “Linguistic Distance and the Language Fluency of Immigrants”,Ruhr Economic Papers, No. 274, Bochum/Dortmund/Duisburg/Essen, Germany.
Jean, S. et al. (2011), “Migration and labour market outcomes in OECD countries”, OECD Journal:Economic Studies, Vol. 2010/1, OECD Publishing, Paris, http://dx.doi.org/10.1787/eco_studies-2010-5kmhf827kws6.
Joona, P.A. and L. Nekby (2012), “Intensive Coaching of New Immigrants: An Evaluation based onrandom program assignments”, The Scandinavian Journal of Economics, Vol. 114, No. 2, pp. 575-600.
Kanas, A. et al. (2011), “The Role of Social Contacts in the Employment Status of Immigrants: A Panelstudy of immigrants in Germany”, International Sociology, Vol. 26, No. 1, pp. 95-122.
Karsten, S. (2010), “School Segregation”, in OECD, Equal Opportunities: The Labour Market Integration of theChildren of Immigrants, OECD Publishing, Paris, http://dx.doi.org/10.1787/9789264086395-en.
Kaushal, N. and R. Kaestner (2005), “Welfare Reform and Health Insurance of Immigrants”, HealthServices Research, Vol. 40, No. 3, pp. 697-722.
Konno, R. (2006), “Support for Overseas Qualified Nurses in Adjusting to Australian Nursing Practice: ASystematic review”, International Journal of Evidence-Based Healthcare, Vol. 4, No. 2, pp. 83-100.
Krause, K. and T. Liebig (2011), “The Labour Market Integration of Immigrants and their Children inAustria”, OECD Social, Employment and Migration Working Papers, No. 127, OECD Publishing, Paris,http://dx.doi.org/10.1787/5kg264fz6p8w-en.
Larja, L. et al. (2012), Discrimination in the Finnish Labor Market: An Overview and a Field Experiment onRecruitment, Helsinki: Edita/Työ- ja elinkeinoministeriön julkaisuja (Publications of the Ministry ofEmployment and the Economy).
Lemaître, G. (2012), “Parental Education, immigrant concentration and PISA Outcomes”, in OECD,Untapped Skills: Realising the Potential of Immigrant Students, OECD Publishing, Paris, http://dx.doi.org/10.1787/9789264172470-8-en.
Liebig, T. (2011), “Views on Immigration – the impact of public opinion on global migration”, HarvardInternational Review, Endpaper Article, in Vol. 38/2011.
Liebig, T. (2007), “The Labour Market Integration of Immigrants in Germany”, OECD Social, Employmentand Migration Working Papers, No. 47, OECD Publishing, Paris, http://dx.doi.org/10.1787/238411133860.
Liebig, T. and J. Mo (2013), “The fiscal impact of immigration in OECD countries”, in OECD, InternationalMigration Outlook 2013, OECD Publishing, Paris, http://dx.doi.org/10.1787/migr_outlook-2013-6-en.
Liebig, T. and F. Von Haaren (2011), “Citizenship and the Socio-economic Integration of Immigrants andtheir Children: An Overview across European Union and OECD Countries”, in OECD, Naturalisation:A Passport for the Better Integration of Immigrants?, OECD Publishing, Paris, http://dx.doi.org/10.1787/9789264099104-4-en.
Liebig, T. and S. Widmaier (2009), “Children of Immigrants in the Labour Markets of EU and OECDCountries: An Overview”, OECD Social, Employment and Migration Working Papers, No. 97, OECDPublishing, Paris, http://dx.doi.org/10.1787/220823724345.
Magnuson, K. et al. (2006), “Preschool and School Readiness of Children of Immigrants”, Social ScienceQuarterly, Vol. 87, No. 5, pp. 1241-1262.
Massey, D. and M. Fischer (2005), “Stereotype Threat and Academic Performance: New findings from aracially diverse sample of college freshmen”, Du Bois Review, Vol. 2, No. 1, pp.45-67.
Mazzolari, F. (2009), “Dual Citizenship Rights: Do they make more and richer citizens?”, Demography,Vol. 46, No. 1, pp. 169-191.
Nam, Y. (2011), “Welfare Reform and Immigrants: Noncitizen eligibility restrictions, vulnerableimmigrants, and the social service providers”, Journal of Immigrant and Refugee Studies, Vol. 9, No. 1,pp. 5-19.
INTERNATIONAL MIGRATION OUTLOOK 2014 © OECD 2014112

2. LABOUR MARKET INTEGRATION OF IMMIGRANTS AND THEIR CHILDREN: DEVELOPING, ACTIVATING AND USING SKILLS
Neidell, M. and J. Waldfogel (2009), “Program Participation of Immigrant Children: Evidence from thelocal availability of Head Start”, Economics of Education Review, No. 28, pp. 704-715.
Nekby, L. (2008), Active Labour Market Programs for the Integration of Youths and Immigrants into the LabourMarket: The Nordic experience, United Nations Publication, Santiago, Chile.
Neumark, D. and W. Stock (2001), “The Effects of Race and Sex Discrimination Laws”, Working Paper,No. 8215, National Bureau of Economic Research, Cambridge, Massachusetts, United States.
Nordin, M. (2009), “Immigrants’ Return to Schooling in Sweden”, International Migration, Vol. 49, No. 4,pp. 144-166.
Nusche, D. (2009), “What Works in Migrant Education? A Review of Evidence and Policy Options”, OECDEducation Working Papers, No. 22, OECD Publishing, Paris, http://dx.doi.org/10.1787/227131784531.
OECD (2014), Jobs for Immigrants (Vol. 4): Labour Market Integration in Italy, OECD Publishing, Paris, http://dx.doi.org/10.1787/9789264214712-en.
OECD (2013a), International Migration Outlook 2013, OECD Publishing, Paris, http://dx.doi.org/10.1787/migr_outlook-2013-en.
OECD (2013b), PISA 2012 Results: Excellence through Equity (Volume II): Giving Every Student the Chance toSucceed, PISA, OECD Publishing, Paris, http://dx.doi.org/10.1787/9789264201132-en.
OECD (2013c), “Do Immigrant Students’ Reading Skills Depend on How Long they Have Been in their NewCountry?”, PISA in Focus, No. 29, OECD Publishing, Paris, http://dx.doi.org/10.1787/5k44zcpqn5q4-en.
OECD (2013d), “Activating jobseekers: Lessons from seven OECD countries”, in OECD, OECD EmploymentOutlook 2013, OECD Publishing, Paris, http://dx.doi.org/10.1787/empl_outlook-2013-7-en.
OECD (2012a), Better Skills, Better Jobs, Better Lives: A Strategic Approach to Skills Policies, OECD Publishing,Paris, http://dx.doi.org/10.1787/9789264177338-en.
OECD (2012b), OECD Employment Outlook 2012, OECD Publishing, Paris, http://dx.doi.org/10.1787/empl_outlook-2012-en.
OECD (2012c), Jobs for Immigrants (Vol. 3): Labour Market Integration in Austria, Norway and Switzerland,OECD Publishing, Paris, http://dx.doi.org/10.1787/9789264167537-en.
OECD (2012d), Untapped Skills: Realising the Potential of Immigrant Students, PISA, OECD Publishing, Paris,http://dx.doi.org/10.1787/9789264172470-en.
OECD (2012e), Settling In: OECD Indicators of Immigrant Integration 2012, OECD Publishing, Paris,http://dx.doi.org/10.1787/9789264171534-en.
OECD (2011), Naturalisation: A Passport for the Better Integration of Immigrants?, OECD Publishing, Paris,http://dx.doi.org/10.1787/9789264099104-en.
OECD (2010a), Equal Opportunities? The Labour Market Integration of the Children of Immigrants, OECDPublishing, Paris, http://dx.doi.org/10.1787/9789264086395-en.
OECD (2010b), International Migration Outlook 2010, OECD Publishing, Paris, http://dx.doi.org/10.1787/migr_outlook-2010-en.
OECD (2010c), Open for Business: Migrant Entrepreneurship in OECD Countries, OECD Publishing, Paris,http://dx.doi.org/10.1787/9789264095830-en.
OECD (2009), International Migration Outlook 2009, OECD Publishing, Paris, http://dx.doi.org/10.1787/migr_outlook-2009-en.
OECD (2008a), Jobs for Immigrants (Vol. 2): Labour Market Integration in Belgium, France, the Netherlands andPortugal, OECD Publishing, Paris, http://dx.doi.org/10.1787/9789264055605-en.
OECD (2008b), “The Price of Prejudice: Labour Market Discrimination on the Grounds of Gender andEthnicity”, in OECD, OECD Employment Outlook 2008, OECD Publishing, Paris, Paris, http://dx.doi.org/10.1787/empl_outlook-2008-5-en.
OECD (2007), Jobs for Immigrants (Vol. 1.): Labour Market Integration in Australia, Denmark, Germany andSweden, OECD Publishing, Paris, http://dx.doi.org/10.1787/9789264033603-en.
OECD (2006a), International Migration Outlook 2006, OECD Publishing, Paris, http://dx.doi.org/10.1787/migr_outlook-2006-en.
OECD (2006b), Where Immigrant Students Succeed: A Comparative Review of Performance and Engagement inPISA 2003, PISA, OECD Publishing, Paris, http://dx.doi.org/10.1787/9789264023611-en.
INTERNATIONAL MIGRATION OUTLOOK 2014 © OECD 2014 113
2. LABOUR MARKET INTEGRATION OF IMMIGRANTS AND THEIR CHILDREN: DEVELOPING, ACTIVATING AND USING SKILLS
OECD (2006c), From Immigration to Integration: Local Solutions to a Global Challenge, Local Economic andEmployment Development (LEED), OECD Publishing, Paris, http://dx.doi.org/10.1787/9789264028968-en.
OECD (2004), “Informal Employment and Promoting the Transition to a Salaried Economy”, in OECD, OECDEmployment Outlook 2004, OECD Publishing, Paris, http://dx.doi.org/10.1787/empl_outlook-2004-7-en.
OECD/European Union (2014), Matching Economic Migration with Labour Market Needs, OECD Publishing,Paris, http://dx.doi.org/10.1787/9789264216501-en.
Owens, J. and S. Lynch (2012), “Black and Hispanic Immigrants’ Resilience to Stereotype Threat atSelective Colleges and Universities in the United States”, Working Paper, Princeton, United States.
Pedersen, P. (2013), “Immigration and Welfare State Cash Benefits: The Danish case”, InternationalJournal of Manpower, Vol. 34, No. 2, pp. 113-125.
Picot, G. and A. Sweetman (2011), “Canadian Immigration Policy and Immigrant Economic Outcomes:Why the differences in outcomes between Sweden and Canada?”, IZA Policy Paper, No. 25, IZA,Bonn, Germany.
Prokic-Breuer, T., J. Dronkers and M. Vink (forthcoming), “Do Liberal Citizenship Policies Decrease theCitizenship Premium? Assessing the Relation between Naturalization and Employment amongMale Immigrants in 16 European Destination Countries”, Working Paper.
Ramboll Management (2007), Evaluation of the Nation-wide Integration Courses, Federal Ministry of theInterior, Berlin, Germany.
Rosholm, M. and R. Vejlin (2010), “Reducing Income Transfers to Refugee Immigrants: Does start-helphelp you start?”, Labour Economics, No. 17, pp. 258-275.
Rosholm, M. et al. (2001), “The Times They are A-Changin’: Organizational change and immigrantemployment opportunities in Scandinavia”, IZA Discussion Paper, No. 258, IZA, Bonn, Germany.
Ruhm, C. and J. Waldfogel (2011), “Long-Term Effects of Early Childhood Care and Education”, IZADiscussion Paper, No. 6149, IZA, Bonn, Germany.
Sarvimäki, M. and K. Hämäläinen (2012), “Assimilating Immigrants: the Impact of an integrationprogram”, Discussion Paper, No. 306, Helsinki Center of Economic Research, Helsinki, Finland.
Schnepf, S. (2004), “How Different are Immigrants?: A Cross-country and cross-survey analysis ofeducational achievement”, IZA Discussion Paper, No. 1398, IZA, Bonn, Germany.
Schuller, K., S. Lochner and N. Rother (2011), “Integration Panel: Results of a longitudinal study on theeffectiveness and sustainability of integration courses”, Federal Office for Migration and Refugees,Nürnberg, Germany.
Sianesi, B. (2004), “An Evaluation of the Active Labour Market Programmes in Sweden”, Review ofEconomics and Statistics, Vol. 86, No. 1, pp. 133-155.
Snel, E. and F. Linder (2008), “Back to Work After Incapacity Benefit: Differences between ethnicminority and native Dutch workers”, Social Policy and Administration, Vol. 42, No. 7, pp. 768-788.
Svantesson, E. and T. Aranki (2006), “Do Introduction Programs Affect the Probability of Immigrantsgetting Work?”, Working Paper, Örebro University, Örebro, Sweden.
SVR (2014), Diskriminierung am Ausbildungsmarkt (Discrimination in the apprenticeship market), ExpertCouncil of German Foundations on Integration and Migration (SVR), Berlin.
Ward, C. and A.M. Masgoret (2006), “An Integrative Model of Attitudes Toward Immigrants”, InternationalJournal of Intercultural Relations, Vol. 30, pp. 671-682.
Ward Schofield, J. (2006), “Migration Background, Minority-Group Membership and AcademicAchievement: Research evidence from social, educational and developmental psychology”,AKI Research Review, No. 5, Social Science Research Center, Berlin, Germany.
Zimmermann, K. and A. Barrett (2011), Study on Active Inclusion of Migrants: Final report, IZA and ESRI,Bonn, Germany.
INTERNATIONAL MIGRATION OUTLOOK 2014 © OECD 2014114

2. LABOUR MARKET INTEGRATION OF IMMIGRANTS AND THEIR CHILDREN: DEVELOPING, ACTIVATING AND USING SKILLS
ANNEX 2.A1
Supplementary tables and figures
Figure 2.A1.1. Where the foreign-born obtained their qualificationsin selected OECD countries, persons aged 25-64, 2011-12
Source: European countries: Labour Force Surveys (Eurostat) 2011-12; Canada, United States: Survey of Adult Skills(PIAAC) 2012.
1 2 http://dx.doi.org/10.1787/888933157659
0
20
60
80
40
100
10
50
70
30
90
Foreign education Host-country education
Eston
ia
Portug
al
United
States
Slovak
Rep
ublic
Netherl
ands
Franc
e
Poland
Canad
a
Sloven
ia
Czech
Rep
ublic
OECD
Finlan
d
United
Kingdo
m
Sweden
Denmark
Norway
Belgium
Hunga
ry
Icelan
d
Switzerl
and
Austri
a
German
y
Irelan
dIta
ly
Luxe
mbourg
Greece
Spain
INTERNATIONAL MIGRATION OUTLOOK 2014 © OECD 2014 115

2. LABOUR MARKET INTEGRATION OF IMMIGRANTS AND THEIR CHILDREN: DEVELOPING, ACTIVATING AND USING SKILLS
Figure 2.A1.2. Percentage of employed among people aged 15-64who were unemployed one year earlier, by place of birth, 2013
Source: European countries and Turkey: Labour Force Surveys (Eurostat) 2013.1 2 http://dx.doi.org/10.1787/888933157662
0
10
20
30
40
50
60
Foreign-born Native-born
Sloven
ia
Greece
Belgium
Portug
alIta
lySpa
in
German
y
Finlan
d
Franc
e
Hunga
ry
Poland
Norway
OECD
Denmark
Czech
Rep
ublic
Austri
a
Sweden
Luxe
mbourg
Eston
ia
Slovak
Rep
ublic
Turke
y
United
Kingdo
m
Switzerl
and
Icelan
d
Netherl
ands
INTERNATIONAL MIGRATION OUTLOOK 2014 © OECD 2014116

2. LABOUR MARKET INTEGRATION OF IMMIGRANTS AND THEIR CHILDREN: DEVELOPING, ACTIVATING AND USING SKILLS
Table 2.A1.1. Associated likelihood of being employed, 25 to 64-year-olds notin education, European OECD countries, 2011-12
Percentage points
A. Men
Born in a high-income country -1.0** -1.1** -1.9***
Born in a lower-income country -9.7*** -8.4*** -9.4***
High level of education 17.3*** 16.7***
Medium level of education 10.9*** 10.4***
Does not live with a partner or spouse -15.0***
Has one or more child under 6 0.5**
N 1 988 123 1 981 617 1 981 617
B. Women
Born in a high-income country -4.5*** -5.0*** -4.9***
Born in a lower-income country -16.9*** -14.3*** -13.8***
High level of education 29.2*** 29.2***
Medium level of education 18.0*** 18.0***
Does not live with a partner or spouse 0.8***
Has one or more child under 6 -12.3***
N 2 112 745 2 106 213 2 106 213
Note: * p < 0.05, ** p < 0.01, *** p < 0.001. The probit regressions control for age and country fixed effects. High-incomecountries include EU27, North America and Oceania. No finer categorisation is possible with the level of precision ofthe Labour Force Survey.Source: European Labour Force Surveys 2011-12 (Eurostat).
1 2 http://dx.doi.org/10.1787/888933157846
Table 2.A1.2. Associated likelihood of being employed among 15 to 34-year-oldswho are not in education, European OECD countries, 2008
Percentage points
A. Men
Native-born sons of two foreign-born parents -4.4*** -2.4*** -3.3***
High level of education 12.5*** 12.4***
Medium level of education 11.7*** 11.5***
Does not live with a partner or spouse -9.6***
Has one or more child under 6 -2.0**
N 110 061 109 543 109 543
B. Women
Native-born daughters of two foreign-born parents -18.2*** -13.5*** -12.3***
High level of education 30.8*** 29.3***
Medium level of education 22.2*** 21.5***
Does not live with a partner or spouse 2.1***
Has one or more child under 6 -20.1***
N 104 941 104 522 104 522
Note: * p < 0.05, ** p < 0.01, *** p < 0.001. The probit regressions control for age and country fixed effects.Source: European Labour Force Survey ad hoc module on the labour market situation of migrants and theirimmediate descendants, 2008 (Eurostat).
1 2 http://dx.doi.org/10.1787/888933157859
INTERNATIONAL MIGRATION OUTLOOK 2014 © OECD 2014 117

2. LABOUR MARKET INTEGRATION OF IMMIGRANTS AND THEIR CHILDREN: DEVELOPING, ACTIVATING AND USING SKILLS
Table 2.A1.3. Associated likelihood of being employed, 15 to 64-year-olds notin education, European OECD countries, 2008
Percentage points
Born in a high-income country Born in a lower-income country
A. Men
Citizen 0.1 3.7**
Years of residence in this country 0.2** 0.2**
High level of education 6.1*** 4.6***
Medium level of education 3.4** 4.0***
Reason to migrate: Study -3.8 -4.5
Reason to migrate: Family -4.4** -3.5*
Reason to migrate: Humanitarian -0.9 -11.3***
Reason to migrate: Other -0.1 -0.3
Has language limitations -6.9*** -6.3***
Does not live with a partner or spouse -8.7*** -5.4***
Has one or more child under 6 -2.2 2.0
N 10 717 12 336
B. Women
Citizen -5.5** 0.9
Years of residence in this country 0.4*** 0.4***
High level of education 5.9*** 7.9***
Medium level of education 3.6* 6.7***
Reason to migrate: Study -5.9 -8.6*
Reason to migrate: Family -8.7*** -13.3***
Reason to migrate: Humanitarian -9.2 -18.4***
Reason to migrate: Other -9.8** -12.9***
Has language limitations -10.5*** -13.8***
Does not live with a partner or spouse 3.3* 0.9
Has one or more child under 6 -6.8** -8.6***
N 10 351 11 208
Note: * p < 0.05, ** p < 0.01, *** p < 0.001. The probit regressions control for 5-year age groups and country fixed effects.Belgium, the Czech Republic, Denmark, Estonia, Hungary, Poland, Slovenia and the Slovak Republic, are not included inthe analysis as they did not collect all the information necessary to run the regression. High-income countries includeEU27, North America and Oceania. No finer categorisation is possible with the level of precision of the Labour ForceSurvey. Labour is the reference category for the reason to migrate.Source: European Labour Force Survey ad hoc module on the labour market situation of migrants and theirimmediate descendants, 2008 (Eurostat).
1 2 http://dx.doi.org/10.1787/888933157869
INTERNATIONAL MIGRATION OUTLOOK 2014 © OECD 2014118

2. LABOUR MARKET INTEGRATION OF IMMIGRANTS AND THEIR CHILDREN: DEVELOPING, ACTIVATING AND USING SKILLS
e-bornldrentwoe-bornents34 notcation)
.3***
.2***
.3***
.5***
209
.0***
.5***
.1
.1***
600
ssionsnd the
level of
ts 2008
157874
m, thecollect
o finerigrate.s, 2008
157881
Table 2.A1.4. Associated likelihood of being employed, European OECD countries, 2008Percentage points
Native-bornadults
(25-64)
Foreign-born (25-64)Native-born children
of immigrants(15-34 not in education)
Foreign-born who migratedbefore the age of 16
(15-34 not in education)
Nativchiof
nativpar
(15-in edu
Born in ahigh-income
country
Born in alower-income
country
The twoparents
were born in ahigh-income
country
The twoparents
were born in alower-income
country
Born in ahigh-income
country
Born in alower-income
country
A. Men
High level of education 14.2*** 10.6*** 10.0*** 11.0*** 24.3*** 14.6*** 16.8*** 12
Medium level of education 9.0*** 5.9*** 8.5*** 16.5*** 12.6*** 16.2*** 10.5*** 12
Does not live with a partner or spouse -15.0*** -11.1*** -10.5*** -13.5*** -7.3 -11.7* -17.8*** -10
Has one or more child under 6 0.3 -2.1 0.7 3.3 5.1 -1.0 -2.9 -2
N 353 271 16 103 18 790 861 1 491 1 185 2 474 96
B. Women
High level of education 29.0*** 14.3*** 23.5*** 23.5*** 42.6*** 29.8*** 38.8*** 29
Medium level of education 17.8*** 7.6*** 19.4*** 21.4** 24.1*** 20.1*** 19.9*** 21
Does not live with a partner or spouse 1.5*** 13.1*** 10.5*** 12.6* -3 10.3 -0.3 0
Has one or more child under 6 -12.0*** -16.7*** -17.4*** -32.2*** -25.0*** -20.8** -24.1*** -19
N 374 860 18 182 21 454 815 1 564 1 269 2 359 89
Note: * p < 0.05, ** p < 0.01, *** p < 0.001. The probit regressions controls for 5-year age groups and country fixed effects. The regreon the native-born children of immigrants exclude Denmark and Norway. The regressions on 15-34 foreign-born exclude Poland aSlovak Republic. High-income countries include EU27, North America and Oceania. No finer categorisation is possible with theprecision of the Labour Force Survey.Source: European Labour Force Survey ad hoc module on the labour market situation of migrants and their immediate descendan(Eurostat).
1 2 http://dx.doi.org/10.1787/888933
Table 2.A1.5. Associated risks of over-qualification, employed peoplebetween 15 and 64 years old, European OECD countries, 2008
Percentage points
Born in a high-income country Born in a lower-income country
Citizen -4.5 -17.2***
Years of residence in this country -0.1 -1.1***
Reason to migrate: Study -6.4 -15.4***
Reason to migrate: Family 5.6 4.3
Reason to migrate: Humanitarian 21.4 27.2***
Reason to migrate: Other -4.9 -4.1
Has language limitations 20.9*** 16.2***
Does not live with a partner or spouse 1.0 1
Has one or more child under 6 -5.2 -0.5
N 6 620 4 473
Note: * p < 0.05, ** p < 0.01, *** p < 0.001. The probit regressions control for 5-year age groups and country fixed effects. BelgiuCzech Republic, Denmark, Estonia, Hungary, Poland, Slovenia and the Slovak Republic are not included in the analysis as they did notall the information necessary to run the regression. High-income countries include EU27, North America and Oceania. Ncategorisation is possible with the level of precision of the Labour Force Survey. Labour is the reference category for the reason to mSource: Labour Force Surveys ad hoc module on the labour market situation of migrants and their immediate descendant(Eurostat).
1 2 http://dx.doi.org/10.1787/888933
INTERNATIONAL MIGRATION OUTLOOK 2014 © OECD 2014 119

2. LABOUR MARKET INTEGRATION OF IMMIGRANTS AND THEIR CHILDREN: DEVELOPING, ACTIVATING AND USING SKILLS
Table 2.A1.6. Associated risk of in-work poverty, European OECD countries, 2011Percentage points
Native-born household -7.5***
Medium level of education -4.3***
High level of education -8.6***
One adult working, with children 8.4***
Two adults or more, two workers or more, without children -6.9***
Two adults or more, one worker, without children -1.8***
Two adults or more, two workers or more, with children -5.0***
Two adults or more, one worker, with children 4.3***
N 355 449
Note: * p < 0.05, ** p < 0.01, *** p < 0.001. “In-work poverty risk” represents the share of individuals who live in ahousehold whose equivalent income is below half of the median income of the whole population living in thecountry. The equivalent scale used is the square root scale. The households considered are the ones where at leastone adult has been at work at least seven months in the last twelve months. The income considered is the totalhousehold income after social transfers disposable in a twelve-month period (previous calendar or tax year or twelvemonths preceding the interview). The ordinary least squares regression controls for country fixed effects.Source: European Union Statistics on Income and Living Conditions (SILC) 2011.
1 2 http://dx.doi.org/10.1787/888933157892
Table 2.A1.7. Probability of being employed, 2012Percentage points
Native-born offspring of two immigrant parents(aged 16 to 34) compared to the native-born offspring
of two native-born parents
Foreign-born (aged 16 to 64) comparedto the native-born
Australia -4.8 -3.21
Austria -10.3 -8.31
Canada -4.1 -1.7
Czech Republic -8.7 -1.2
Denmark 5.9 -6.31
Estonia -8.71 -7.51
France -15.71 -6.41
Germany -3.4 -1.9
Ireland 4.6 -5.01
Italy 25.6 1.6
Netherlands -19.41 -14.31
Norway -9.9 -3.5
Slovak Republic -0.1 -2.1
Spain -7.0 -3.8
Sweden -13.3 -2.7
United States -11.7 7.01
Belgium -25.71 -4.1
United Kingdom -1.1 -2.9
1. Results significant at a 5% level. The coefficients are obtained from separate linear probability models whichinclude controls for literacy score and fixed effects for 5-year age groups, gender and education level. The sampleexcludes the persons in education.
Source: Survey of Adult Skills (PIAAC) 2012.1 2 http://dx.doi.org/10.1787/888933157903
INTERNATIONAL MIGRATION OUTLOOK 2014 © OECD 2014120

2. LABOUR MARKET INTEGRATION OF IMMIGRANTS AND THEIR CHILDREN: DEVELOPING, ACTIVATING AND USING SKILLS
Table 2.A1.8. Probability of being employed and over-qualified,tertiary-educated foreign-born, 2012
Percentage points
Probability of being employed of the highly educatedforeign-born aged 16 to 64
Risk of being over-qualified of the highly educatedemployed foreign-born aged 16 to 64
Association with foreign qualifications
Austria 5.2 28.21
Belgium 6.4 0.8
Canada 0.4 12.91
Czech Republic -0.3 -3.0
Denmark 2.3 14.01
Estonia 12.41 14.8
Finland -16.0 5.6
France 0.4 13.9
Germany 8.6 14.4
Ireland -4.4 5.5
Italy 0.3 31.3
Netherlands -21.91 25.41
Norway 8.0 3.5
Spain -26.81 21.6
Sweden 8.0 34.81
United Kingdom -13.81 2.4
United States 0.0 8.9
1. Results significant at a 5% level. The coefficients are obtained from separate linear probability models whichinclude controls for literacy score and fixed effects for 5-year age groups, gender and years of residence. Thesample excludes the persons in education.
Source: Survey of Adult Skills (PIAAC) 2012.1 2 http://dx.doi.org/10.1787/888933157913
INTERNATIONAL MIGRATION OUTLOOK 2014 © OECD 2014 121

2. LABOUR MARKET INTEGRATION OF IMMIGRANTS AND THEIR CHILDREN: DEVELOPING, ACTIVATING AND USING SKILLS
ts
ce.
quality
tion.
urate
veetwork.
-workater
riginlent
Table 2.A1.9. Overview and timeline of possible integration measures for adult immigran
Phase Abroad Orientation Settlement Participation
Duration 6 months prior to departure. Arrival to six monthsof residence.
6 months to 3 years. After 3-5 years of residen
Location Countries of origin and residence. One-stop shop (per area/region). General and specificservice-provider.
General service-provider.
Securing future in country ● Information/tools on whereto settle in the countryof residence.
● Equivalence of countryof origin/identitydocumentation.
● Renewal of residence and pathto long-term residence.
● Goal: Secure access tohousing.
● Advice on areaof residence/housing.
● Promote early familyreunification.
● Goal: Path to naturalisa
Learning the languageof the country
● Free/online language coursesfor immigrants with a securedvisa.
● Right to language assessment. ● Shift to job-specific/basedcourse.
● Goal: Fluency commenswith level of education.
● Free courses trackedby education level, flexiblefor workers and parents.
● Certification by professional.
Developing and activatingjob-specific skills
● Free information and advisefor newcomers on jobshortages and job-huntingadvice.
● Short orientationcourse/session.
● Any necessary job training. ● Goal: All newcomers hajob-specific skills and n
● Assessment of skillsand information on specifictraining options.
● Equal uptake of effectiveALMPs (work placement/wagesubsidies).
● Goal: Employment,over-qualification and inpoverty rate similar to rfor native-born in similacircumstances.
● Early, intensive,and individualised supportby public/temp emp. agency.
● Volunteer mentoring networks.
● Entrepreneursorientation/loans.
Recognisingthe qualificationsof high-educatedimmigrants
● Obtain diploma (and officialinformation on equivalencefrom country of origin).
● Start recognition procedure;right to assessment of foreignqualifications.
● Partial recognition Bridgingprogramme (e.g. on the job).
● Goal: Fully recognisedor bridged country of oqualifications or equivaqualification in countryof residence.
● No recognition Supportfor training or equivalentqualification.
INTERNATIONAL MIGRATION OUTLOOK 2014 © OECD 2014122

2. LABOUR MARKET INTEGRATION OF IMMIGRANTS AND THEIR CHILDREN: DEVELOPING, ACTIVATING AND USING SKILLS
yment
.
tion
Table 2.A1.10. Overview and timeline of possible integration measuresfor children of immigrants
Phase Orientation for newcomers Pre-primary and compulsory Transition-to-work
Duration Arrival to six months in country. Until age of compulsory education. Young adulthood.
Location Schools with support of one-stop shop(per area/region).
School system and local community. General service-providers.
Specific policy in school ● Obtain documentation from countryof origin required for school.
● Goal: Near-universal early uptake of earlychildhood education and care.
● Equal uptake and completionof school-to-work and youth emploprogrammes.
● Assessment by experts of new pupils’ priorlearning/language skills.
● Early literacy intervention for all and rightto extra language hours until academicfluency and academic support hoursto catch-up.
● Equal uptake and completionof apprenticeships.
● Orientation programme with intensivelanguage support until basiccommunicative fluency.
● Intercultural approach across schooland autonomy to adapt curriculum.
● Goal: Youth NEET rate not higherthan that of children of native-born
● Goal: Equal uptake of mentoringprogrammes and homework centres.
● Goal: Equal uptake and successin “second-chance” programmes,academic and vocational tracks comparedto children of native-born in similarcircumstances.
Specific policy outsideof school
● Facilitate family reunification as earlyas possible.
● Affordable childcare and recreationalservices during working hours.
● Support in finding apprenticeshipsin immigrant-owned enterprisesand promotion of apprenticeshipsamong immigrant employers.
● Language/orientation coursesfor newcomer parents at child’s school.
● Inform parents about school choiceoptions in due time for school enrolment.
● Promote greater diversity in educasector.
● Access to nationality for foreign-and native-born children.
● Avoid socio-economic concentrationin schools.
● Outreach to immigrant parents for ECEC,volunteering and school governance.
● Support mentoring among immigrantparents and community.
INTERNATIONAL MIGRATION OUTLOOK 2014 © OECD 2014 123

2.LA
BO
UR
MA
RK
ETIN
TEG
RA
TIO
NO
FIM
MIG
RA
NT
SA
ND
TH
EIRC
HILD
REN
:DEV
ELOPIN
G,A
CT
IVA
TIN
GA
ND
USIN
GSK
ILLS
INT
ERN
AT
ION
AL
MIG
RA
TIO
NO
UT
LOO
K2014
©O
ECD
2014124 countries, 2009-13
D NOR NZL POL PRT SVK SVN SWE TUR USA
.8 77.4 75.0 58.9 66.6 61.0 66.9 73.8 41.2 66.5
.7 77.8 74.3 59.3 66.3 60.4 67.8 74.9 44.6 66.5
.6 76.8 73.6 59.9 65.4 60.1 68.6 74.9 45.8 66.2
.1 76.4 74.6 59.4 65.5 59.2 67.5 73.3 44.9 65.1
.6 77.1 74.4 59.4 66.0 60.2 67.7 74.2 44.1 66.1
.6 75.6 74.1 58.2 65.5 58.0 66.3 73.1 43.6 64.6
.0 76.5 73.5 59.3 65.3 58.6 66.4 75.4 47.3 65.3
.4 76.2 73.8 60.0 65.1 59.2 66.6 76.5 47.4 65.6
.3 76.0 74.0 59.6 64.9 59.3 65.9 75.3 46.4 65.2
.2 76.1 73.9 59.3 65.2 58.8 66.3 75.1 46.2 65.2
.0 75.5 73.6 58.9 64.4 59.0 64.0 75.1 46.0 64.6
.5 75.8 73.2 59.7 64.4 59.6 64.6 77.1 49.2 65.1
.8 76.4 73.3 60.2 64.0 59.9 65.4 78.0 49.9 65.4
.0 76.2 73.9 59.9 62.3 59.5 64.7 76.1 48.3 65.3
.6 76.0 73.5 59.7 63.8 59.5 64.7 76.6 48.4 65.1
.7 76.2 73.4 59.2 61.7 59.6 64.0 75.4 46.3 64.7
.8 76.7 72.9 60.0 62.0 59.8 63.8 77.0 49.9 65.7
.0 76.7 72.4 60.2 61.5 60.1 64.3 78.2 49.9 66.0
.9 76.2 72.2 60.0 60.1 59.3 64.2 75.9 49.6 65.9
.9 76.5 72.7 59.7 61.3 59.7 64.1 76.2 48.9 65.6
.3 76.0 .. 58.7 59.5 59.8 62.8 75.5 47.9 65.0
.4 76.5 .. 59.8 60.6 59.8 63.2 77.2 50.8 65.9
.4 76.6 .. 60.7 61.4 60.0 64.7 78.7 50.3 66.2
.1 75.9 .. 60.8 61.9 59.8 63.5 77.2 49.2 65.8
.3 76.3 .. 60.0 60.9 59.8 63.5 77.2 49.6 65.7
.8 70.5 69.4 43.4 71.0 64.9 64.7 62.2 46.2 67.3
.9 71.0 69.6 44.4 71.3 61.4 66.1 61.9 48.2 68.3
.6 70.5 68.1 43.1 69.0 56.6 66.0 62.8 47.5 67.9
.0 68.9 68.2 52.6 68.0 58.1 67.4 61.5 47.2 67.4
.6 70.2 68.8 45.7 69.8 60.6 66.1 62.1 47.2 67.7
.6 69.4 68.1 47.3 68.8 55.9 66.8 60.6 47.9 66.1
.4 69.1 67.8 49.1 69.5 56.2 67.1 60.9 49.6 68.8
.0 68.6 68.0 54.7 69.3 55.9 63.1 62.5 49.7 68.2
.2 68.5 69.3 53.0 68.7 57.9 64.1 61.4 50.9 67.4
.4 68.9 68.3 50.7 69.1 56.5 65.3 61.3 49.5 67.6
.1 68.2 70.1 54.2 66.8 58.7 61.7 61.3 49.4 66.7
.7 70.7 70.2 55.8 69.2 59.0 63.1 62.1 49.8 67.8
.1 71.4 69.6 56.6 69.6 - 61.6 63.5 49.0 67.5
.4 70.4 70.8 55.1 69.2 61.3 61.2 63.3 50.5 68.2
.6 70.2 70.2 55.3 68.7 59.7 61.9 62.6 49.7 67.5
.5 69.3 71.0 58.5 67.7 60.7 63.5 62.2 45.2 67.0
.8 72.4 70.5 63.2 67.9 63.0 63.5 63.8 45.2 67.9
.6 71.9 70.3 66.1 66.8 62.9 64.3 63.7 48.1 68.0
.8 70.0 70.6 61.3 63.9 67.4 64.2 62.6 47.0 67.8
.6 70.9 70.6 61.9 66.6 63.7 63.9 62.8 46.4 67.7
.4 68.8 .. 60.0 61.9 - 57.4 61.7 46.4 67.4
.3 70.2 .. 59.6 62.4 64.5 61.0 63.6 48.1 68.7
.8 71.1 .. 59.5 63.3 64.4 62.8 63.5 47.0 69.0
.2 70.9 .. 58.0 63.5 67.6 60.8 62.5 44.7 68.4
.7 70.3 .. 59.2 62.8 66.4 60.5 62.9 46.5 68.4
Table 2.A1.11. Quarterly employment rates by gender and place of birth in OECDPercentages
Men + women
AUS AUT BEL CAN CHE CHL CZE DEU DNK ESP EST FIN FRA GBR GRC HUN IRL ISL ISR ITA LUX MEX NL
Nativ
e-bo
rn
Q1 2009 73.9 72.4 63.2 71.4 .. .. 65.5 72.0 77.1 60.7 64.2 68.6 64.8 71.0 60.5 54.9 62.8 - 57.8 56.8 60.2 59.4 78Q2 2009 74.0 73.1 63.2 72.9 80.3 .. 65.4 72.3 77.2 60.3 63.0 70.0 65.4 70.3 61.0 55.4 62.1 - 57.9 57.3 63.3 59.5 78Q3 2009 73.8 73.8 63.1 73.1 .. .. 65.2 72.5 76.8 60.1 63.3 69.5 65.3 70.4 61.0 55.3 61.9 - 57.2 56.9 62.9 60.0 78Q4 2009 74.0 73.0 63.4 71.9 .. .. 65.3 73.2 75.2 59.5 61.2 67.5 64.5 70.4 60.2 55.3 60.5 - 57.2 56.5 61.0 60.6 782009 73.9 73.1 63.2 72.3 .. 54.2 65.4 72.5 76.6 60.1 62.9 68.9 65.0 70.5 60.7 55.2 61.8 78.4 57.5 56.9 61.9 59.9 78Q1 2010 73.4 71.9 63.6 70.6 80.3 .. 64.1 71.8 74.0 58.7 59.0 66.7 64.6 69.7 59.5 54.3 59.7 - 57.5 56.1 60.5 59.4 77Q2 2010 73.8 72.7 63.1 73.0 79.9 .. 64.8 72.4 75.3 59.0 59.9 69.5 65.0 69.9 59.6 55.1 60.4 - 58.7 56.6 60.3 60.4 78Q3 2010 74.0 73.7 63.6 73.5 80.2 .. 65.3 72.7 75.0 59.1 62.6 69.7 65.3 70.5 59.1 55.8 60.5 - 58.7 56.0 62.0 60.0 76Q4 2010 74.4 73.4 64.2 72.6 80.5 .. 65.4 73.2 74.2 58.9 63.7 68.1 64.4 70.2 57.8 55.6 59.6 - 59.1 56.5 59.9 59.2 762010 73.9 72.9 63.6 72.4 80.3 .. 64.9 72.5 74.7 58.9 61.3 68.5 64.7 70.1 59.0 55.2 60.1 78.5 58.5 56.3 60.7 59.7 76Q1 2011 73.8 72.3 63.0 71.3 80.9 .. 64.9 72.8 74.3 58.3 63.6 67.6 64.3 69.9 56.6 54.5 58.6 - 59.0 56.1 60.0 59.1 76Q2 2011 74.0 73.2 64.3 73.5 81.1 .. 65.6 73.6 74.9 58.9 64.8 70.4 64.9 69.9 56.0 55.7 59.1 - 59.5 56.5 58.8 59.9 76Q3 2011 73.8 74.3 63.5 73.9 80.7 .. 66.1 74.0 75.2 58.6 67.2 70.7 65.3 70.0 55.1 56.3 58.6 - 59.0 56.3 60.5 60.1 76Q4 2011 73.9 73.5 64.0 72.6 81.4 .. 66.0 74.6 74.5 57.7 65.8 68.9 64.7 70.2 53.3 56.3 59.0 - 59.1 56.4 58.8 61.2 772011 73.9 73.3 63.7 72.8 81.0 56.8 65.7 73.8 74.7 58.4 65.3 69.4 64.8 70.0 55.2 55.7 58.8 78.7 59.2 56.3 59.5 60.1 76Q1 2012 73.3 72.7 63.5 71.2 80.6 .. 65.6 73.3 73.9 56.6 66.0 68.2 64.3 70.1 52.4 55.6 58.3 - .. 56.1 58.8 60.1 76Q2 2012 73.8 73.7 63.9 73.4 80.5 .. 66.5 73.7 74.4 56.6 67.1 70.7 65.0 70.4 51.9 57.0 58.7 - .. 56.6 60.6 61.4 76Q3 2012 73.6 75.0 64.1 73.7 81.1 .. 67.0 74.2 74.4 56.2 68.2 70.9 65.3 71.0 51.0 57.9 59.0 - .. 56.4 62.2 61.5 77Q4 2012 73.9 73.8 63.8 72.8 81.3 .. 67.0 74.4 74.0 55.3 67.4 68.7 64.8 71.4 50.5 57.6 59.3 - .. 56.1 61.3 60.8 762012 73.7 73.8 63.8 72.8 80.9 .. 66.5 73.9 74.2 56.2 67.2 69.6 64.9 70.8 51.4 57.0 58.9 79.8 .. 56.3 60.7 60.9 76Q1 2013 73.2 72.5 63.0 71.6 81.3 .. 66.8 73.8 73.5 55.0 67.1 67.7 64.6 70.9 49.4 56.3 59.4 - .. 55.1 59.5 60.0 76Q2 2013 73.5 73.7 64.1 73.6 80.7 .. 67.8 74.4 74.3 55.4 69.1 70.5 65.2 71.0 49.8 58.1 60.2 - .. 55.4 60.4 61.1 76Q3 2013 73.3 74.6 64.1 73.9 80.8 .. 68.0 74.6 74.4 56.0 69.0 70.3 65.6 71.6 49.7 59.0 60.9 - .. 55.3 59.3 60.9 76Q4 2013 73.4 73.9 63.3 73.1 81.9 .. 68.2 75.0 73.6 55.8 68.6 68.2 65.1 71.8 48.9 59.5 61.4 - .. 55.3 61.9 61.6 762013 73.3 73.7 63.6 73.1 81.2 .. 67.7 74.4 73.9 55.6 68.5 69.2 65.1 71.3 49.4 58.2 60.5 81.2 .. 55.3 60.3 60.9 76
Fore
ign-
born
Q1 2009 67.8 63.4 53.3 68.3 .. .. 66.3 63.1 67.7 58.7 73.2 64.8 58.4 67.0 65.0 64.8 62.9 - 63.6 62.9 69.6 46.4 67Q2 2009 67.0 64.8 51.4 68.4 75.7 .. 66.9 63.4 67.0 58.3 69.4 64.5 58.2 65.5 66.3 66.0 62.9 - 62.9 63.5 68.6 50.3 65Q3 2009 66.8 65.1 51.4 68.4 .. .. 65.1 63.7 71.8 58.2 64.0 64.1 57.7 66.0 67.1 65.3 61.5 - 64.4 62.6 69.4 49.5 66Q4 2009 67.6 65.5 52.6 68.8 .. .. 64.9 64.0 65.6 56.8 65.1 61.8 56.9 65.5 65.6 65.8 60.7 - 63.8 62.3 69.6 46.8 662009 67.3 64.7 52.2 68.5 .. 64.7 65.8 63.5 68.1 58.0 67.8 63.8 57.8 66.0 66.0 65.5 62.0 77.2 63.7 62.8 69.3 48.2 66Q1 2010 67.9 64.5 51.8 67.9 72.3 .. 65.5 62.7 64.1 56.4 57.8 61.6 56.9 65.0 64.4 64.3 59.7 - 63.2 61.4 70.1 48.4 64Q2 2010 67.7 65.6 52.5 69.0 75.3 .. 67.5 64.2 63.6 56.8 56.6 61.9 58.4 66.0 64.3 66.2 60.4 - 65.3 62.6 69.8 48.3 65Q3 2010 68.5 67.4 53.2 69.3 75.8 .. 69.8 65.3 63.8 57.8 58.8 59.5 58.1 67.1 64.9 67.1 59.4 - 65.3 62.5 71.1 49.8 65Q4 2010 69.9 67.6 54.5 68.8 74.9 .. 69.8 64.2 62.2 56.3 63.4 59.0 57.8 66.6 62.4 64.2 58.5 - 64.9 61.0 71.7 50.4 652010 68.5 66.3 53.0 68.8 74.6 .. 68.1 64.1 63.4 56.8 59.2 60.5 57.7 66.2 64.0 65.5 59.5 74.8 64.7 61.9 70.7 49.2 64Q1 2011 69.9 65.6 52.4 67.8 74.0 .. 68.5 65.0 59.7 54.6 61.0 57.5 57.6 66.6 59.6 61.1 57.8 - 64.9 61.5 72.3 50.2 64Q2 2011 69.6 67.1 52.9 69.0 75.7 .. 67.9 66.9 61.6 55.7 60.7 62.6 58.4 66.7 60.5 60.9 59.4 - 66.4 63.0 69.4 52.1 62Q3 2011 69.9 67.2 52.0 69.5 76.1 .. 67.1 67.1 63.4 54.5 67.4 61.8 57.7 66.8 58.2 63.2 59.7 - 66.0 61.5 70.0 54.9 63Q4 2011 69.7 66.8 53.0 69.0 76.1 .. 67.9 66.9 61.8 52.7 66.2 62.8 56.3 65.9 55.3 62.9 58.9 - 65.8 60.1 69.7 54.4 642011 69.8 66.7 52.6 68.8 75.5 68.1 67.8 66.5 61.7 54.4 63.9 61.1 57.5 66.5 58.4 62.1 59.0 76.3 65.8 61.5 70.3 52.9 63Q1 2012 69.9 65.8 51.8 68.5 75.4 .. 66.3 66.3 60.8 51.4 66.1 61.7 56.8 65.2 51.3 61.6 58.1 - .. 59.5 70.8 52.1 63Q2 2012 69.9 67.5 51.7 70.2 76.4 .. 66.6 67.9 60.9 51.9 67.4 64.7 57.4 66.6 50.0 65.4 59.3 - .. 61.1 71.4 53.6 63Q3 2012 69.8 67.4 52.1 70.8 76.8 .. 68.0 68.0 61.9 52.6 67.3 65.5 58.1 67.5 50.6 68.5 59.0 - .. 60.4 71.3 53.2 64Q4 2012 69.9 66.1 52.3 70.8 75.9 .. 68.0 68.0 61.0 51.2 66.0 63.4 57.3 67.5 47.9 70.1 59.0 - .. 59.5 71.9 55.8 622012 69.9 66.7 52.0 70.1 76.1 .. 67.3 67.5 61.1 51.8 66.7 63.8 57.4 66.7 49.9 66.5 58.8 79.0 .. 60.1 71.3 53.6 63Q1 2013 70.0 64.9 53.0 69.7 75.0 .. 67.6 66.9 61.9 50.0 69.8 62.0 56.0 66.9 46.2 68.3 58.7 - .. 58.2 71.5 54.7 61Q2 2013 70.1 66.9 51.8 71.1 76.3 .. 69.9 67.8 63.6 51.1 71.3 65.8 57.3 67.3 47.8 68.1 60.2 - .. 57.8 70.5 53.3 61Q3 2013 69.6 67.9 53.3 71.5 76.0 .. 70.6 68.6 63.4 50.8 67.2 63.4 57.7 68.3 49.0 66.7 61.7 - .. 57.9 73.6 55.5 61Q4 2013 69.4 66.0 52.8 69.7 76.3 .. 71.1 67.7 62.7 51.0 65.5 62.5 57.2 68.7 49.0 68.4 61.6 - .. 58.0 70.6 52.6 622013 69.8 66.4 52.7 70.5 75.9 .. 69.8 67.8 62.9 50.7 68.4 63.4 57.1 67.8 48.0 67.9 60.5 79.9 .. 58.0 71.5 54.0 61

2.LA
BO
UR
MA
RK
ETIN
TEG
RA
TIO
NO
FIM
MIG
RA
NT
SA
ND
TH
EIRC
HILD
REN
:DEV
ELOPIN
G,A
CT
IVA
TIN
GA
ND
USIN
GSK
ILLS
INT
ERN
AT
ION
AL
MIG
RA
TIO
NO
UT
LOO
K2014
©O
ECD
2014125
untries, 2009-13 (cont.)
D NOR NZL POL PRT SVK SVN SWE TUR USA
.8 79.0 80.1 65.7 71.7 68.6 69.8 75.1 61.6 69.3
.9 79.8 80.0 66.1 71.2 68.0 71.4 76.0 64.8 69.5
.6 78.7 78.2 66.9 70.2 67.4 71.9 76.3 66.7 69.8
.8 77.8 79.7 65.9 70.0 66.1 71.1 74.8 65.5 68.0
.5 78.8 79.5 66.2 70.8 67.5 71.0 75.6 64.6 69.1
.0 77.2 79.2 64.3 70.0 64.3 69.8 74.4 63.7 67.0
.4 78.1 78.6 65.5 69.6 65.2 68.9 76.9 67.8 68.5
.4 78.2 79.4 66.6 69.7 65.5 70.3 78.2 68.3 69.2
.1 77.8 79.2 66.2 69.5 65.7 69.3 76.9 67.2 68.2
.2 77.8 79.1 65.6 69.7 65.2 69.6 76.6 66.7 68.2
.6 76.8 78.6 65.1 68.6 65.5 67.2 76.4 66.7 67.2
.9 77.3 78.5 66.4 68.4 66.4 67.3 78.5 69.9 68.4
.4 78.3 78.6 67.3 68.5 66.7 68.5 79.3 71.3 69.2
.5 78.0 78.9 66.7 66.1 66.4 67.5 77.5 69.5 68.8
.6 76.0 78.7 59.7 63.8 59.5 64.7 76.6 48.4 68.4
.0 77.8 78.8 65.4 65.1 66.4 66.1 76.4 66.1 68.0
.2 78.2 77.9 66.7 65.3 66.6 66.5 78.0 70.0 69.4
.1 78.4 77.0 67.1 64.6 67.2 67.8 79.4 70.7 70.2
.8 77.5 77.4 66.6 63.3 66.4 67.6 77.2 70.0 69.7
.0 78.0 77.8 66.3 64.6 66.7 67.0 77.4 69.2 69.3
.8 77.1 .. 65.2 62.4 66.5 65.7 76.7 67.5 68.5
.1 78.0 .. 66.5 63.6 66.6 66.2 78.2 70.6 69.5
.3 78.3 .. 67.5 64.7 66.5 68.0 80.1 70.8 70.1
.1 77.1 .. 67.2 65.0 65.7 66.8 78.2 69.3 69.2
.1 77.6 .. 66.6 63.9 66.3 66.6 78.3 69.6 69.3
.1 72.6 77.2 46.2 76.1 75.7 67.9 66.8 59.8 76.7
.5 75.2 77.2 52.9 75.7 71.6 71.4 66.3 63.3 78.8
.8 74.0 74.7 53.8 73.5 67.7 71.3 67.5 62.4 77.8
.7 74.0 75.3 66.2 73.7 73.7 72.7 66.1 62.6 76.6
.8 74.0 76.1 54.2 74.8 72.4 70.9 66.7 61.9 77.5
.3 73.0 76.1 60.1 73.5 74.8 71.2 65.9 61.5 75.2
.2 73.4 75.0 60.8 75.0 74.3 70.5 66.8 64.3 78.8
.5 72.3 75.5 55.4 74.8 74.9 69.9 68.3 66.1 78.7
.2 72.3 76.5 60.1 73.7 73.8 69.4 68.0 66.3 76.8
.7 72.7 75.7 59.3 74.3 74.5 70.3 67.3 64.5 77.4
.5 70.8 77.8 59.6 69.4 71.6 66.7 66.7 64.6 76.7
.8 74.5 76.0 58.7 71.0 75.2 69.8 67.6 67.1 78.5
.1 75.1 76.4 63.6 71.5 76.0 69.2 69.3 65.4 78.4
.9 73.6 77.2 69.9 71.0 70.6 68.3 68.5 66.5 78.6
.8 73.5 76.8 62.7 70.7 73.3 68.4 68.0 65.9 78.1
.6 72.5 78.4 - 70.1 - 70.7 66.5 61.5 77.2
.5 75.9 76.2 67.9 68.8 - 71.4 69.2 60.1 78.7
.5 76.3 75.9 76.5 68.9 67.4 70.5 68.7 70.0 79.4
.9 75.8 76.9 74.9 66.1 - 73.0 67.6 63.8 78.6
.1 75.2 76.8 71.1 68.5 68.4 71.4 67.5 64.0 78.5
.6 74.4 .. 72.8 63.7 75.8 69.6 66.3 61.2 78.1
.6 74.7 .. 68.9 64.9 70.7 70.1 67.9 65.9 80.2
.6 75.2 .. 70.6 63.9 68.7 74.1 68.2 65.0 80.4
.4 75.7 .. 65.7 64.9 75.4 71.0 67.1 63.5 79.8
.8 75.0 .. 69.5 64.3 72.5 71.3 67.4 63.9 79.6
Table 2.A1.11. Quarterly employment rates by gender and place of birth in OECD coPercentages
Men
AUS AUT BEL CAN CHE CHL CZE DEU DNK ESP EST FIN FRA GBR GRC HUN IRL ISL ISR ITA LUX MEX NL
Nativ
e-bo
rn
Q1 2009 79.0 76.5 68.4 72.3 .. .. 74.2 76.0 79.5 68.7 65.0 69.2 68.8 75.5 72.6 60.5 67.4 - 60.6 67.6 67.3 78.1 83Q2 2009 78.7 77.7 67.8 74.5 84.5 .. 73.9 76.1 79.4 67.9 62.8 70.6 69.2 74.6 73.1 61.3 66.3 - 60.9 68.1 71.1 77.7 83Q3 2009 78.6 78.6 67.9 75.8 .. .. 73.7 76.6 79.1 67.5 65.4 70.6 69.1 74.6 73.1 61.0 66.0 - 60.4 67.9 70.0 77.9 83Q4 2009 78.9 78.2 68.5 73.4 .. .. 73.6 76.9 77.3 66.6 60.8 67.9 68.2 74.6 72.0 60.8 64.2 - 59.8 67.3 68.4 78.4 822009 78.8 77.7 68.1 74.0 .. 68.8 73.8 76.4 78.8 67.7 63.5 69.6 68.8 74.8 72.7 60.9 66.0 80.3 60.4 67.7 69.2 78.0 83Q1 2010 78.6 76.0 68.3 71.4 85.2 .. 72.2 75.8 75.3 65.5 56.7 67.2 68.1 73.6 71.1 59.0 63.2 - 60.6 66.8 67.6 77.6 82Q2 2010 79.0 78.0 68.3 74.8 85.1 .. 73.3 76.5 76.6 65.9 58.7 70.4 68.5 74.3 70.9 60.2 64.1 - 62.0 67.0 67.6 78.5 82Q3 2010 79.3 78.8 68.6 76.4 85.1 .. 74.1 77.0 77.5 66.0 65.1 71.4 68.9 75.2 70.3 61.0 64.4 - 62.0 66.4 70.5 78.2 81Q4 2010 79.9 78.7 68.7 74.5 85.6 .. 73.9 77.4 77.2 65.1 66.0 69.1 68.3 74.7 68.6 60.7 63.0 - 61.5 66.7 67.7 77.3 812010 79.2 77.9 68.5 74.3 85.3 .. 73.4 76.7 76.6 65.6 61.6 69.5 68.4 74.5 70.2 60.2 63.7 80.6 61.5 66.7 68.4 77.9 81Q1 2011 79.2 76.8 67.5 72.6 85.7 .. 72.9 76.7 76.5 64.6 65.7 68.8 68.1 74.1 67.0 59.5 62.1 - 61.6 66.3 67.5 77.3 80Q2 2011 79.1 78.4 69.1 75.5 85.6 .. 74.0 77.5 77.0 64.8 66.6 72.0 68.7 74.2 66.6 61.0 62.4 - 62.8 66.6 65.6 77.8 80Q3 2011 78.5 79.4 67.4 77.1 86.0 .. 74.4 78.0 77.7 64.8 69.7 72.1 69.1 74.4 65.4 61.8 62.2 - 63.0 66.7 66.0 78.2 81Q4 2011 78.9 78.8 68.7 74.7 86.0 .. 74.2 78.7 77.0 63.3 67.7 70.1 68.2 74.5 63.0 61.8 62.5 - 62.0 66.2 64.4 78.6 812011 78.9 73.3 68.2 75.0 81.0 70.7 65.7 73.8 74.7 58.4 65.3 69.4 64.8 70.0 55.2 55.7 58.8 78.7 62.3 56.3 59.5 78.0 76Q1 2012 78.3 76.9 68.1 72.5 85.2 .. 73.5 77.1 75.8 61.8 67.6 68.9 67.7 74.1 61.9 60.7 61.8 - .. 65.5 63.9 77.8 81Q2 2012 78.6 78.6 68.8 75.7 85.3 .. 74.5 77.7 76.3 61.6 68.3 71.8 68.4 74.7 61.4 62.1 62.0 - .. 65.9 66.9 79.0 81Q3 2012 78.1 79.6 68.4 76.9 85.9 .. 75.1 78.3 76.5 61.5 71.6 71.9 68.8 75.4 60.5 63.3 62.8 - .. 66.2 66.8 79.2 81Q4 2012 78.8 78.4 67.5 74.9 86.2 .. 74.8 78.4 76.6 60.3 70.9 69.9 68.0 75.5 59.7 63.1 62.6 - .. 65.4 67.6 78.3 802012 78.4 78.4 68.2 75.0 85.6 .. 74.5 77.9 76.3 61.3 69.6 70.6 68.3 75.0 60.9 62.3 62.3 81.4 .. 65.8 66.3 78.6 81Q1 2013 78.1 76.2 67.0 72.9 85.5 .. 74.5 77.1 76.0 59.6 69.9 67.9 67.6 74.8 58.4 61.2 63.3 - .. 64.1 64.0 77.7 79Q2 2013 78.2 77.6 68.7 75.6 84.9 .. 75.6 78.0 76.3 60.1 71.6 71.4 68.3 75.0 59.0 64.0 64.0 - .. 64.3 64.8 78.3 80Q3 2013 78.0 78.6 67.4 76.9 85.0 .. 76.0 78.2 75.9 61.0 72.4 71.8 68.7 75.8 59.0 65.2 65.1 - .. 64.6 66.1 78.3 80Q4 2013 78.0 78.3 67.1 75.1 85.5 .. 76.0 78.6 75.8 60.5 71.2 68.8 67.9 76.0 58.1 65.4 65.9 - .. 64.3 66.6 79.0 802013 78.1 77.7 67.5 75.1 85.2 .. 75.5 78.0 76.0 60.3 71.3 70.0 68.1 75.4 58.6 64.0 64.6 83.2 .. 64.3 65.3 78.3 80
Fore
ign-
born
Q1 2009 75.5 70.0 62.1 73.8 .. .. 73.9 71.5 73.3 62.6 75.6 68.6 66.2 76.9 80.3 75.6 69.5 - 69.2 77.8 76.4 62.9 76Q2 2009 74.7 72.4 61.3 73.6 84.1 .. 74.2 71.1 70.0 61.8 74.9 67.9 65.4 74.6 80.9 75.7 68.8 - 69.0 77.9 79.0 65.5 74Q3 2009 74.8 74.1 61.7 74.0 .. .. 74.8 72.3 76.8 60.7 63.3 68.5 65.9 75.2 81.3 71.2 66.7 - 69.2 77.5 78.8 65.2 74Q4 2009 75.6 73.4 60.4 74.1 .. .. 75.4 71.9 74.0 59.4 61.0 65.7 64.6 73.7 79.3 73.0 65.8 - 67.8 76.0 78.2 67.6 732009 75.1 72.5 61.4 73.9 .. 73.4 74.6 71.7 73.5 61.1 68.8 67.7 65.5 75.1 80.5 74.0 67.7 76.5 68.8 77.3 78.1 65.4 74Q1 2010 76.7 70.7 58.7 72.6 82.7 .. 76.1 71.1 72.1 58.5 55.3 66.3 64.9 72.9 77.6 69.4 64.8 - 67.0 74.5 78.3 64.4 71Q2 2010 76.2 73.3 61.6 74.3 79.7 .. 78.9 72.7 66.0 60.0 57.6 68.6 67.0 74.2 76.6 67.9 66.3 - 70.4 76.4 77.4 65.9 72Q3 2010 76.7 75.0 62.1 75.7 84.0 .. 81.3 74.2 65.3 61.5 59.7 65.0 67.3 76.1 77.4 69.0 65.1 - 70.5 78.1 79.7 69.1 72Q4 2010 78.2 75.1 63.4 75.4 83.0 .. 80.5 73.3 67.6 60.1 70.4 65.1 66.4 76.1 75.3 70.3 63.8 - 69.4 75.3 80.1 70.4 732010 77.0 73.5 61.4 74.5 82.8 .. 79.1 72.9 67.6 60.0 60.8 66.2 66.4 74.8 76.7 69.2 65.0 74.6 69.3 76.1 78.9 67.4 71Q1 2011 78.7 72.4 60.9 73.7 82.4 .. 80.7 74.0 63.2 58.2 68.0 64.3 65.7 75.5 71.7 67.0 62.2 - 68.9 74.4 80.5 67.9 70Q2 2011 77.8 76.1 60.4 75.6 84.4 .. 80.5 75.8 66.4 58.6 64.6 68.1 66.3 75.7 71.8 69.7 64.1 - 71.6 77.7 77.3 68.7 69Q3 2011 78.2 76.4 61.9 76.0 85.4 .. 79.7 75.8 67.7 57.7 73.4 66.6 66.2 75.5 70.2 75.2 65.3 - 71.6 76.3 79.4 67.0 71Q4 2011 77.8 75.0 62.1 75.2 84.7 .. 80.0 76.6 67.0 56.3 72.1 68.2 64.5 75.1 66.0 72.1 64.1 - 71.1 73.8 78.6 65.1 712011 78.1 75.0 61.3 75.1 84.2 79.3 80.2 75.6 66.1 57.7 69.6 66.8 65.7 75.5 70.0 71.1 63.9 77.9 70.8 75.6 78.9 67.2 70Q1 2012 78.9 73.3 60.6 74.6 83.0 .. 77.8 75.6 66.1 54.1 68.8 67.3 64.2 75.5 61.4 69.8 62.4 - .. 71.9 79.2 62.2 71Q2 2012 78.5 76.2 60.1 76.1 84.6 .. 77.9 76.5 65.0 54.6 73.2 69.4 65.8 77.2 58.2 71.5 64.3 - .. 73.6 79.4 64.1 71Q3 2012 78.0 77.3 59.4 77.1 85.3 .. 81.5 77.2 65.7 55.3 72.8 71.0 67.0 78.0 58.7 76.8 64.7 - .. 73.1 78.9 62.9 71Q4 2012 78.5 74.0 59.8 76.8 83.5 .. 80.8 76.8 67.5 53.8 68.3 67.6 66.8 76.9 54.9 76.6 65.4 - .. 70.7 79.2 66.9 692012 78.5 75.2 60.0 76.1 84.1 .. 79.5 76.5 66.1 54.4 70.7 68.9 66.0 76.9 58.4 73.8 64.2 82.1 .. 72.3 79.2 64.0 71Q1 2013 78.4 71.9 60.1 75.1 82.1 .. 79.3 75.3 66.3 51.7 70.9 67.7 65.0 75.3 53.8 75.6 64.5 - .. 68.2 79.2 67.0 69Q2 2013 78.3 75.7 60.0 77.3 83.4 .. 80.4 76.7 67.5 54.1 79.2 70.2 66.5 76.0 56.0 81.0 67.1 - .. 68.2 77.1 68.8 68Q3 2013 77.2 76.4 61.2 78.1 83.3 .. 81.5 77.4 67.2 52.8 71.6 69.6 67.7 78.5 58.3 79.7 68.9 - .. 69.0 81.2 70.1 67Q4 2013 77.3 73.7 60.8 75.4 84.6 .. 81.3 76.9 68.1 54.3 66.1 68.1 66.4 78.1 58.5 80.8 68.9 - .. 68.4 80.0 67.1 692013 77.8 74.4 60.5 76.5 83.3 .. 80.6 76.5 67.3 53.2 71.9 68.9 66.4 77.0 56.6 79.2 67.4 82.7 .. 68.5 79.4 68.2 68

2.LA
BO
UR
MA
RK
ETIN
TEG
RA
TIO
NO
FIM
MIG
RA
NT
SA
ND
TH
EIRC
HILD
REN
:DEV
ELOPIN
G,A
CT
IVA
TIN
GA
ND
USIN
GSK
ILLS
INT
ERN
AT
ION
AL
MIG
RA
TIO
NO
UT
LOO
K2014
©O
ECD
2014126 untries, 2009-13 (cont.)
D NOR NZL POL PRT SVK SVN SWE TUR USA
.8 75.7 70.1 52.3 61.6 53.3 63.8 72.5 21.5 63.8
.5 75.7 68.9 52.7 61.3 52.8 64.0 73.7 24.9 63.6
.4 74.9 69.1 53.1 60.7 52.8 65.0 73.4 25.4 62.8
.3 74.9 69.8 53.0 61.1 52.3 63.7 71.7 24.8 62.4
.5 75.3 69.5 52.8 61.2 52.8 64.1 72.8 24.2 63.2
.1 74.1 69.2 52.3 61.1 51.7 62.6 71.7 24.2 62.3
.6 74.7 68.7 53.3 61.1 52.1 63.7 73.8 27.3 62.3
.2 74.2 68.5 53.6 60.5 52.9 62.6 74.8 27.0 62.1
.4 74.1 68.9 53.1 60.3 53.0 62.4 73.7 26.1 62.2
.1 74.3 68.8 53.1 60.8 52.4 62.8 73.5 26.1 62.2
.2 74.2 68.7 52.8 60.2 52.5 60.6 73.7 25.9 62.0
.0 74.4 68.1 53.2 60.5 52.8 61.7 75.6 29.0 61.9
.1 74.3 68.1 53.2 59.5 53.0 62.2 76.6 28.9 61.7
.4 74.2 69.1 53.3 58.6 52.5 61.9 74.7 27.6 61.9
.6 76.0 68.5 59.7 63.8 59.5 64.7 76.6 48.4 61.9
.3 74.5 68.2 53.0 58.4 52.7 61.9 74.3 26.5 61.6
.4 75.1 68.1 53.5 58.6 52.9 60.9 76.0 29.8 62.1
.7 74.9 68.0 53.4 58.4 52.9 60.7 77.0 29.2 62.0
.0 74.8 67.2 53.4 57.0 52.2 60.6 74.6 29.1 62.3
.6 74.8 67.9 53.1 58.1 52.7 61.0 75.0 28.7 62.0
.6 74.8 .. 52.3 56.7 53.0 59.9 74.3 28.3 61.6
.5 74.8 .. 53.0 57.7 53.0 60.0 76.2 31.0 62.4
.3 74.9 .. 54.0 58.2 53.5 61.2 77.1 29.9 62.4
.0 74.7 .. 54.4 58.8 53.8 60.0 76.1 29.1 62.5
.4 74.8 .. 53.4 57.9 53.3 60.3 75.9 29.6 62.2
.4 68.5 62.3 41.2 66.6 54.7 61.3 58.0 26.7 57.4
.2 66.8 62.2 37.1 67.4 53.4 60.9 57.9 27.3 57.4
.2 67.0 61.8 35.7 65.2 47.7 60.2 58.7 25.8 57.4
.2 63.8 61.2 43.8 63.1 45.1 61.5 57.2 25.5 57.6
.3 66.5 61.9 39.4 65.6 50.6 61.0 58.0 26.4 57.4
.8 65.7 60.4 36.9 64.8 39.5 62.0 55.8 27.4 56.6
.4 64.6 60.8 39.4 64.7 39.9 63.4 55.5 28.0 58.1
.2 64.7 60.9 54.2 64.4 36.5 56.2 57.3 26.7 57.4
.9 64.5 62.5 46.8 64.3 39.9 58.0 55.5 29.3 57.7
.8 64.8 61.1 43.7 64.5 38.9 59.8 56.0 27.8 57.4
.2 65.5 62.7 - 64.6 - 55.7 56.5 27.3 56.4
.5 66.9 64.7 - 67.7 - 55.3 57.0 25.1 56.5
.9 67.7 63.3 50.7 67.7 45.6 53.3 58.1 26.7 56.1
.6 67.2 64.7 43.4 67.4 53.4 52.8 58.5 28.7 57.6
.0 66.8 63.8 48.5 66.8 46.9 54.3 57.5 27.0 56.7
.3 66.1 64.2 50.9 65.2 56.2 54.6 58.1 33.1 56.7
.8 69.0 64.8 57.9 67.1 56.4 54.6 58.8 34.1 57.1
.4 67.4 64.8 - 64.9 - 57.3 59.0 31.0 56.7
.3 64.1 64.5 45.4 61.9 66.0 54.6 57.9 32.8 57.2
.9 66.7 64.6 51.7 64.7 59.7 55.2 58.4 32.7 56.9
.3 63.0 .. - 60.2 - 44.2 57.3 35.2 56.8
.0 65.7 .. 49.3 60.1 58.8 51.2 59.5 35.2 57.4
.7 66.7 .. 48.5 62.8 60.2 50.5 59.0 32.6 58.1
.7 66.0 .. 48.2 62.3 59.3 49.5 58.3 29.3 57.2
.4 65.4 .. 47.7 61.4 60.5 48.9 58.5 33.0 57.4
within a given year.
terización Socioeconómica Nacional (CASEN); Mexico: Encuesta
1 2 http://dx.doi.org/10.1787/888933157944
Table 2.A1.11. Quarterly employment rates by gender and place of birth in OECD coPercentages
Women
AUS AUT BEL CAN CHE CHL CZE DEU DNK ESP EST FIN FRA GBR GRC HUN IRL ISL ISR ITA LUX MEX NL
Nativ
e-bo
rn
Q1 2009 68.7 68.2 57.9 70.4 .. .. 56.7 67.9 74.6 52.4 63.5 68.1 61.0 66.5 48.5 49.5 58.1 - 54.9 46.0 53.1 42.5 73Q2 2009 69.4 68.5 58.5 71.4 75.9 .. 56.7 68.5 74.9 52.4 63.1 69.3 61.7 66.0 49.0 49.7 57.8 - 55.0 46.4 55.3 43.0 73Q3 2009 68.9 69.0 58.3 70.5 .. .. 56.6 68.3 74.5 52.4 61.3 68.4 61.7 66.3 48.9 49.7 57.8 - 53.8 45.6 55.4 44.0 73Q4 2009 69.0 67.7 58.2 70.5 .. .. 56.7 69.4 73.0 52.2 61.5 67.1 60.8 66.3 48.3 50.0 56.9 - 54.5 45.6 53.5 44.5 732009 69.0 68.4 58.2 70.7 .. 40.9 56.7 68.5 74.3 52.3 62.4 68.2 61.3 66.3 48.7 49.7 57.6 76.4 54.5 45.9 54.4 43.5 73Q1 2010 68.1 67.6 58.9 69.8 75.5 .. 55.8 67.7 72.7 51.8 61.1 66.2 61.2 65.7 47.9 49.8 56.2 - 54.3 45.2 53.1 42.9 73Q2 2010 68.6 67.4 57.7 71.2 74.6 .. 56.2 68.1 74.0 51.8 61.0 68.6 61.5 65.5 48.3 50.3 56.8 - 55.4 46.0 53.2 43.9 73Q3 2010 68.6 68.6 58.6 70.5 74.8 .. 56.4 68.3 72.5 52.0 60.2 68.1 61.8 65.8 47.9 50.7 56.5 - 55.4 45.4 53.3 43.5 71Q4 2010 68.9 68.0 59.5 70.6 75.3 .. 56.8 69.0 71.1 52.4 61.5 67.0 60.5 65.6 46.9 50.6 56.2 - 56.7 46.2 51.4 42.7 712010 68.5 67.9 58.7 70.5 75.1 .. 56.3 68.3 72.6 52.0 61.0 67.5 61.1 65.7 47.8 50.4 56.4 76.4 55.5 45.7 52.8 43.2 71Q1 2011 68.2 67.7 58.4 70.0 75.9 .. 56.7 68.8 71.9 51.9 61.6 66.4 60.5 65.7 46.0 49.7 55.2 - 56.3 45.9 52.4 42.5 71Q2 2011 68.9 67.9 59.4 71.4 76.4 .. 57.2 69.6 72.8 52.8 63.1 68.8 61.2 65.5 45.3 50.5 55.8 - 56.2 46.2 51.8 43.5 72Q3 2011 69.1 69.1 59.5 70.6 75.2 .. 57.6 69.9 72.7 52.3 64.8 69.2 61.6 65.6 44.8 50.8 55.0 - 54.9 45.7 54.7 43.6 72Q4 2011 69.0 68.1 59.3 70.4 76.6 .. 57.8 70.5 71.8 51.8 64.0 67.7 61.3 66.0 43.5 51.0 55.6 - 56.1 46.6 53.1 45.4 722011 68.8 73.3 63.7 70.6 81.0 44.1 65.7 73.8 74.7 58.4 65.3 69.4 64.8 70.0 55.2 55.7 58.8 78.7 55.9 56.3 59.5 43.7 76Q1 2012 68.4 68.4 58.8 69.9 75.9 .. 57.5 69.4 71.9 51.3 64.4 67.5 61.0 66.1 42.7 50.7 54.9 - .. 46.6 53.4 43.9 72Q2 2012 69.0 68.8 58.9 71.2 75.7 .. 58.2 69.7 72.5 51.3 65.9 69.5 61.7 66.2 42.3 52.0 55.4 - .. 47.1 54.0 45.4 72Q3 2012 68.9 70.2 59.7 70.5 76.3 .. 58.7 70.0 72.2 50.7 65.0 69.9 61.9 66.6 41.4 52.8 55.2 - .. 46.4 57.6 45.3 72Q4 2012 69.0 69.2 60.0 70.7 76.3 .. 59.0 70.4 71.3 50.2 64.0 67.6 61.7 67.2 41.2 52.2 56.0 - .. 46.7 54.7 44.9 732012 68.8 69.2 59.4 70.6 76.0 .. 58.3 69.8 72.0 50.9 64.8 68.6 61.6 66.5 41.9 51.9 55.4 78.2 .. 46.7 54.9 44.9 72Q1 2013 68.2 68.7 58.9 70.4 77.0 .. 58.9 70.4 70.8 50.2 64.4 67.6 61.6 67.0 40.2 51.5 55.6 - .. 46.0 54.7 43.9 72Q2 2013 68.8 69.7 59.5 71.6 76.5 .. 59.7 70.7 72.2 50.6 66.5 69.6 62.2 66.9 40.4 52.3 56.4 - .. 46.3 55.7 45.4 72Q3 2013 68.5 70.5 60.8 70.9 76.4 .. 59.8 71.0 72.8 50.9 65.6 68.8 62.7 67.3 40.2 53.0 56.7 - .. 45.8 52.4 45.0 72Q4 2013 68.8 69.5 59.5 71.1 78.1 .. 60.2 71.3 71.2 51.1 66.1 67.7 62.3 67.6 39.7 53.8 56.9 - .. 46.3 57.3 45.7 722013 68.5 69.6 59.7 71.0 77.0 .. 59.6 70.8 71.7 50.7 65.7 68.4 62.2 67.2 40.1 52.7 56.4 79.1 .. 46.1 55.0 45.0 72
Fore
ign-
born
Q1 2009 60.1 57.3 44.7 63.2 .. .. 58.5 54.9 62.5 54.9 71.2 60.5 51.2 57.6 49.2 56.9 55.8 - 58.7 49.6 62.3 30.9 60Q2 2009 59.4 57.7 42.2 63.5 67.6 .. 59.4 56.0 64.3 54.8 64.4 60.8 51.5 56.9 51.4 58.8 57.0 - 57.5 51.0 58.2 37.3 58Q3 2009 58.8 56.8 41.4 63.3 .. .. 55.5 55.4 67.4 55.7 64.5 59.9 50.0 57.3 52.3 60.9 56.1 - 60.2 49.9 60.1 34.9 59Q4 2009 59.7 58.3 45.2 63.8 .. .. 53.9 56.5 58.6 54.2 68.1 58.4 49.8 57.7 51.5 60.6 55.5 - 60.3 50.2 60.6 27.4 592009 59.5 57.5 43.4 63.4 .. 57.1 56.8 55.7 63.2 54.9 67.0 59.8 50.6 57.4 51.1 59.2 56.1 77.7 59.2 50.2 60.3 32.5 59Q1 2010 59.2 58.9 45.3 63.5 65.0 .. 54.4 54.6 57.5 54.4 59.8 57.1 49.3 57.4 50.7 60.5 54.6 - 59.9 50.0 61.9 33.1 58Q2 2010 59.4 58.6 44.1 64.0 66.9 .. 55.0 56.1 61.5 53.9 55.7 55.5 50.5 57.9 51.9 64.8 54.7 - 60.7 50.5 61.5 32.7 59Q3 2010 60.6 60.6 44.5 63.2 67.5 .. 57.3 56.9 62.6 54.2 58.1 54.3 49.4 58.5 52.5 65.5 53.8 - 60.6 48.9 62.6 29.7 58Q4 2010 61.8 60.9 46.3 62.7 67.1 .. 58.3 55.6 58.2 52.6 58.1 53.7 50.0 57.9 49.8 59.1 53.2 - 61.1 48.6 63.6 30.0 572010 60.3 59.8 45.0 63.3 66.6 .. 56.2 55.7 60.0 53.8 58.0 55.1 49.7 58.0 51.2 62.4 54.1 75.0 60.5 49.5 62.4 31.5 57Q1 2011 61.4 59.4 44.6 62.5 65.9 .. 55.3 56.5 57.0 51.3 55.5 51.0 50.3 58.4 47.7 56.3 53.5 - 61.4 50.4 63.6 31.9 58Q2 2011 61.5 59.0 45.7 62.9 67.3 .. 53.7 58.3 57.7 53.0 57.6 57.4 51.2 58.2 49.2 53.9 54.8 - 61.7 50.3 61.1 34.5 56Q3 2011 61.7 59.0 42.7 63.3 67.1 .. 53.1 58.8 59.6 51.7 62.8 57.1 50.0 58.6 46.3 53.0 54.3 - 61.0 48.7 60.3 42.4 55Q4 2011 61.5 59.4 44.8 63.3 67.7 .. 54.4 57.7 57.5 49.3 61.3 57.8 49.0 57.3 44.8 55.6 53.8 - 61.3 48.5 60.6 42.8 572011 61.6 59.2 44.4 63.0 67.0 59.7 54.1 57.8 58.0 51.3 59.4 55.8 50.1 58.1 47.0 54.7 54.1 74.9 61.4 49.4 61.4 38.0 57Q1 2012 61.0 59.1 43.4 62.7 68.1 .. 54.1 57.2 56.3 48.9 64.2 56.5 50.1 55.7 41.4 54.6 54.0 - .. 48.8 62.5 40.6 56Q2 2012 61.4 59.9 44.1 64.7 68.3 .. 55.1 59.6 57.5 49.5 63.6 60.2 49.7 56.7 41.7 60.0 54.6 - .. 50.3 63.5 43.0 56Q3 2012 61.8 58.9 45.2 65.0 68.2 .. 54.5 59.1 58.5 50.2 63.1 60.1 50.0 57.6 42.6 60.9 53.9 - .. 49.6 63.1 42.4 58Q4 2012 61.6 59.2 45.4 65.3 68.2 .. 54.7 59.5 55.1 48.8 64.2 59.4 48.5 58.8 41.0 64.1 53.1 - .. 49.9 64.5 42.6 562012 61.4 59.3 44.5 64.4 68.2 .. 54.6 58.9 56.8 49.3 63.8 59.1 49.6 57.2 41.7 59.9 53.9 75.8 .. 49.7 63.4 42.2 56Q1 2013 61.9 58.7 46.2 64.7 67.8 .. 55.3 58.7 57.6 48.5 68.9 56.6 47.9 58.8 38.9 61.6 53.2 - .. 49.5 63.9 40.6 54Q2 2013 62.1 59.3 44.3 65.4 69.2 .. 58.9 59.3 60.3 48.3 65.7 61.8 48.9 59.2 39.8 56.6 53.9 - .. 48.9 63.8 37.3 55Q3 2013 62.2 60.3 45.7 65.2 68.7 .. 58.8 60.2 60.4 49.0 64.0 57.0 48.8 58.8 40.2 55.3 54.8 - .. 48.6 65.5 40.5 56Q4 2013 61.8 59.2 44.9 64.3 68.2 .. 60.6 58.9 58.1 47.9 65.0 57.2 49.0 59.9 39.9 58.2 54.5 - .. 49.1 60.6 38.0 552013 62.0 59.4 45.3 64.9 68.5 .. 58.4 59.3 59.1 48.4 65.9 58.2 48.6 59.2 39.7 58.0 54.1 77.5 .. 49.0 63.4 39.0 55
Note: Data are not adjusted for seasonal variations. Comparisons should therefore be made for the same quarters of each year, and not for successive quartersInformation on data for Israel: http://dx.doi.org/10.1787/888932315602.Source: European countries and Turkey: Labour Force Surveys (Eurostat); Australia, Canada, Israel, New Zealand: Labour Force Surveys; Chile: Encuesta de CaracNacional de Ocupación y Empleo (ENOE); United States: Current Population Surveys.

2.LA
BO
UR
MA
RK
ETIN
TEG
RA
TIO
NO
FIM
MIG
RA
NT
SA
ND
TH
EIRC
HILD
REN
:DEV
ELOPIN
G,A
CT
IVA
TIN
GA
ND
USIN
GSK
ILLS
INT
ERN
AT
ION
AL
MIG
RA
TIO
NO
UT
LOO
K2014
©O
ECD
2014127
D countries, 2009-13
D NOR NZL POL PRT SVK SVN SWE TUR USA
.7 2.7 5.6 8.3 9.0 10.5 5.1 6.9 14.4 8.9
.8 3.0 5.7 8.0 9.3 11.3 5.5 8.0 12.4 9.4
.0 3.0 6.4 8.2 10.1 12.5 6.2 7.0 12.3 9.7
.3 2.5 6.6 8.6 10.4 13.9 6.7 7.1 11.9 9.7.9 2.8 6.1 8.3 9.7 12.1 5.9 7.2 12.8 9.4.9 3.2 6.5 10.7 10.9 15.2 7.0 8.0 13.2 10.5.7 3.3 6.4 9.6 10.9 14.4 7.0 8.0 10.0 9.9.8 2.9 6.2 9.2 11.2 14.2 7.0 6.4 10.3 9.8.8 2.7 6.7 9.4 11.2 13.9 7.7 5.9 9.9 9.2.0 3.0 6.5 9.7 11.0 14.4 7.2 7.1 10.8 9.9.9 2.7 7.1 10.2 12.3 13.9 8.1 6.6 10.5 9.6.5 3.0 6.7 9.6 12.3 13.2 7.5 6.8 8.6 9.2.6 2.7 6.4 9.5 12.7 13.2 7.7 5.3 8.4 9.4.1 2.5 6.4 9.9 14.5 14.0 8.6 5.5 8.2 8.5.8 2.7 6.7 9.8 13.0 13.6 8.0 6.0 8.9 9.2.5 2.6 7.2 10.7 15.3 14.1 8.5 6.4 9.5 8.8.4 2.8 6.8 10.1 15.5 13.7 8.1 7.0 7.4 8.3.5 2.7 7.2 10.0 16.3 13.7 9.1 5.7 7.9 8.4.8 2.6 6.9 10.2 17.4 14.5 9.5 6.0 8.4 7.7.6 2.7 7.0 10.2 16.1 14.0 8.8 6.5 8.3 8.3.7 2.8 .. 11.4 18.0 14.6 10.5 7.1 9.6 8.3.9 3.0 .. 10.6 16.6 14.1 10.0 7.4 8.1 7.8.0 2.8 .. 9.9 15.8 14.1 9.2 5.7 8.9 7.7.0 2.6 .. 9.9 15.6 14.3 9.3 5.7 9.0 6.9.9 2.8 .. 10.4 16.5 14.3 9.7 6.5 8.9 7.7.3 6.9 6.3 - 12.6 - 8.6 14.3 16.8 9.8.2 7.1 6.7 - 12.4 - 7.5 16.7 13.8 9.1.6 5.9 6.8 - 13.9 - 8.1 15.0 16.1 10.0.3 7.3 8.3 - 13.6 - 5.5 15.5 14.1 10.0.8 6.8 7.0 - 13.1 - 7.4 15.4 15.1 9.7.7 8.6 7.6 - 14.4 - 9.7 16.2 15.1 11.4.7 9.1 8.2 - 13.9 - 9.6 17.4 13.3 8.7.9 8.5 6.9 - 14.6 - 8.9 15.7 10.8 9.2.8 8.0 7.1 - 16.9 - 10.1 15.7 11.8 9.9.5 8.5 7.4 11.6 15.0 11.8 9.6 16.3 12.8 9.8.2 8.3 7.5 - 19.2 - 13.2 16.9 13.2 10.1.3 8.4 6.2 9.6 16.7 - 10.9 17.0 11.4 8.7.0 - 7.1 - 15.9 - - 15.3 9.8 9.0.1 7.4 6.9 15.3 16.0 15.9 11.2 14.8 9.7 8.7.2 7.7 6.9 12.1 16.9 15.3 11.5 16.0 11.1 9.1.4 7.8 8.0 4.7 18.6 13.9 10.6 15.8 12.6 9.2.6 6.7 7.1 4.5 18.2 - 10.2 15.9 13.3 7.7.0 5.7 7.9 - 19.2 - 11.4 15.3 9.4 7.8.1 7.0 7.3 10.9 21.5 - 11.4 16.2 11.6 7.9.5 6.8 7.6 6.9 19.4 11.6 10.9 16.1 11.6 8.1.4 8.7 .. - 23.1 - - 16.9 10.6 8.1.5 7.8 .. 10.7 23.1 - 15.7 16.5 11.1 6.6.8 7.7 .. 14.2 21.1 13.6 12.5 16.0 10.3 6.7.3 7.1 .. 13.1 20.2 - 14.5 16.3 10.7 6.5.7 7.8 .. 12.2 21.9 - 15.3 16.4 10.7 7.0
Table 2.A1.12. Quarterly unemployment rates by gender and place of birth in OECPercentages
Men + women
AUS AUT BEL CAN CHE CHL CZE DEU DNK ESP EST FIN FRA GBR GRC HUN IRL ISL ISR ITA LUX MEX NL
Nativ
e-bo
rn
Q1 2009 5.7 3.7 6.6 8.1 .. .. 5.8 7.1 4.9 15.2 12.3 7.5 8.2 7.0 9.2 9.7 9.4 - 7.4 7.8 3.9 5.2 2Q2 2009 5.4 3.9 6.3 8.0 3.2 .. 6.3 6.9 5.6 15.9 13.5 9.4 8.1 7.5 8.7 9.7 11.4 - 7.8 7.0 3.2 5.4 2Q3 2009 5.2 4.3 6.8 8.1 .. .. 7.3 7.0 5.9 16.1 14.4 7.3 8.4 7.9 9.2 10.4 12.0 - 8.6 7.0 3.5 6.4 3Q4 2009 5.1 3.8 6.8 7.4 .. .. 7.3 6.4 6.4 16.7 15.6 8.0 9.1 7.5 10.1 10.6 11.9 - 8.1 8.2 2.7 5.5 32009 5.3 3.9 6.6 7.9 .. 10.8 6.7 6.9 5.7 16.0 14.0 8.0 8.5 7.5 9.3 10.1 11.2 7.0 8.0 7.5 3.3 5.6 2Q1 2010 5.8 3.9 7.1 8.4 3.5 .. 8.1 7.2 7.4 17.9 20.1 9.1 9.0 7.9 11.4 11.9 12.5 - 7.3 8.8 2.6 5.5 3Q2 2010 5.3 3.6 6.7 7.6 3.1 .. 7.2 6.3 6.6 18.1 18.3 9.3 8.3 7.6 11.5 11.3 13.3 - 6.4 8.0 2.7 5.3 3Q3 2010 5.0 3.8 7.0 7.7 3.7 .. 7.2 6.1 6.6 17.9 14.0 6.9 8.4 7.9 12.2 11.0 13.3 - 7.7 7.4 2.7 5.8 3Q4 2010 4.9 3.4 6.6 6.8 3.1 .. 7.0 5.8 6.9 18.4 13.2 7.2 8.8 7.7 14.0 11.0 13.4 - 6.8 8.3 4.0 5.4 32010 5.3 3.7 6.9 7.6 3.3 .. 7.4 6.3 6.9 18.1 16.4 8.1 8.7 7.8 12.3 11.3 13.1 7.2 7.1 8.1 3.0 5.5 4Q1 2011 5.6 3.6 5.9 7.9 3.2 .. 7.3 6.1 7.3 19.2 14.1 8.4 8.7 7.7 15.5 11.7 13.8 - 5.9 8.3 3.5 5.3 3Q2 2011 5.0 3.4 5.1 7.2 2.6 .. 6.8 5.3 6.6 18.8 12.8 8.7 8.0 7.8 16.2 10.9 14.3 - 5.5 7.4 - 5.4 3Q3 2011 5.1 3.1 6.5 7.0 3.4 .. 6.6 5.2 6.8 19.4 10.6 6.5 8.3 8.4 17.5 10.8 14.9 - 6.8 7.4 3.4 5.7 3Q4 2011 5.1 3.4 5.8 6.5 3.0 .. 6.5 4.8 6.8 20.6 11.1 6.6 8.8 8.1 20.3 10.8 14.2 - 5.9 9.0 4.0 5.0 42011 5.2 3.4 5.8 7.2 3.0 8.1 6.8 5.4 6.9 19.5 12.1 7.6 8.4 8.0 17.4 11.0 14.3 6.7 6.0 8.0 3.4 5.4 3Q1 2012 5.8 3.5 5.4 7.6 3.1 .. 7.1 5.4 7.3 22.1 11.6 7.8 9.1 8.0 21.9 11.8 14.6 - .. 10.5 - 5.1 4Q2 2012 5.2 3.6 5.5 7.0 2.7 .. 6.7 4.9 7.1 22.5 10.1 8.5 8.6 7.8 22.7 10.9 14.7 - .. 10.2 3.2 4.9 4Q3 2012 5.2 3.7 6.2 7.1 3.6 .. 7.0 4.9 6.7 23.3 9.3 6.9 9.0 7.9 24.0 10.5 14.8 - .. 9.6 - 5.3 4Q4 2012 5.1 3.6 6.5 6.4 3.2 .. 7.2 4.7 6.3 24.1 9.0 6.8 9.7 7.5 25.0 10.9 13.4 - .. 11.2 3.6 5.0 42012 5.3 3.6 5.9 7.0 3.1 .. 7.0 5.0 6.8 23.0 10.0 7.5 9.1 7.8 23.4 11.0 14.4 5.7 .. 10.4 3.8 5.1 4Q1 2013 6.0 4.2 6.6 7.3 3.1 .. 7.5 5.3 7.2 24.9 10.1 8.6 9.5 7.7 26.2 11.9 13.1 .. .. 12.2 3.9 5.0 5Q2 2013 5.6 3.7 6.6 6.9 2.9 .. 6.8 4.8 6.2 24.4 8.0 9.0 8.9 7.6 26.1 10.4 13.5 .. .. 11.3 - 5.2 5Q3 2013 5.6 4.2 7.1 6.9 3.5 .. 7.0 4.7 6.6 23.8 7.7 6.8 8.7 7.7 26.1 9.9 12.7 .. .. 10.8 5.0 5.4 6Q4 2013 5.7 4.1 7.0 6.2 2.9 .. 6.8 4.6 5.9 24.0 8.4 7.5 9.2 7.0 26.8 9.2 11.4 .. .. 12.2 - 4.8 62013 5.7 4.0 6.8 6.8 3.1 .. 7.0 4.9 6.5 24.3 8.6 8.0 9.1 7.5 26.3 10.3 12.7 .. .. 11.7 4.1 5.1 5
Fore
ign-
born
Q1 2009 6.6 10.0 16.2 9.7 .. .. 8.5 13.2 9.1 27.1 8.1 14.0 13.9 7.9 12.0 9.2 14.2 - 7.0 10.6 7.7 8.1 6Q2 2009 7.1 9.2 15.3 10.6 6.9 .. 9.5 13.0 10.1 26.9 14.2 17.2 13.8 9.0 11.4 8.9 15.2 - 7.7 10.7 7.3 2.4 7Q3 2009 6.8 9.5 17.4 10.8 .. .. 10.3 13.0 8.8 26.5 18.6 14.9 14.0 9.7 11.4 10.1 16.6 - 6.6 10.4 5.4 8.2 6Q4 2009 6.2 9.5 16.0 9.7 .. .. 10.0 12.2 11.5 28.3 17.8 15.6 15.2 9.0 13.2 8.2 15.8 - 6.8 12.3 8.1 9.0 72009 6.7 9.5 16.2 10.2 .. 8.2 9.6 12.8 9.9 27.2 14.8 15.4 14.3 8.9 12.0 9.1 15.4 11.8 7.0 11.0 7.1 7.0 6Q1 2010 6.2 9.2 18.0 10.2 9.8 .. 8.3 13.0 13.4 29.6 22.6 16.8 15.5 9.1 15.7 9.5 15.5 - 6.5 12.6 7.3 6.3 8Q2 2010 5.7 8.6 16.9 10.2 7.4 .. 7.5 11.6 14.8 29.1 25.5 18.7 14.0 9.2 15.7 7.6 16.2 - 5.2 11.5 5.6 6.0 7Q3 2010 5.2 7.7 17.9 10.5 7.4 .. 6.6 10.7 13.9 28.3 26.0 17.8 14.3 8.9 15.4 6.9 17.3 - 6.4 9.7 5.1 6.4 7Q4 2010 5.1 7.4 15.5 8.9 7.1 .. 6.3 11.3 12.2 29.3 17.3 15.5 15.1 8.4 17.9 6.1 18.1 - 6.4 12.2 5.1 7.8 72010 5.6 8.2 17.1 10.0 7.9 .. 7.2 11.6 13.6 29.1 22.8 17.2 14.8 8.9 16.2 7.5 16.8 13.4 6.1 11.5 5.8 6.6 8Q1 2011 5.5 9.4 14.6 9.3 7.7 .. 7.3 10.4 15.7 30.9 19.1 17.1 15.7 8.7 21.2 - 17.7 - 5.5 11.8 - 7.6 9Q2 2011 5.3 7.8 15.5 8.7 6.1 .. 8.1 9.5 14.4 30.5 19.5 14.1 14.3 8.9 19.5 10.5 17.2 - 4.8 10.8 7.6 6.1 9Q3 2011 5.1 6.8 15.6 9.1 6.5 .. - 9.1 14.1 31.3 - - 14.5 9.7 21.9 - 17.2 - 5.0 10.1 - 4.0 9Q4 2011 4.9 8.6 14.8 8.7 6.9 .. 7.7 9.0 13.8 33.4 14.5 14.4 15.8 10.0 26.3 8.7 17.2 - 4.9 13.9 5.4 7.4 92011 5.2 8.2 15.1 8.9 6.8 5.9 8.0 9.5 14.5 31.5 16.9 15.2 15.1 9.3 22.2 9.5 17.3 11.1 5.0 11.7 6.3 6.2 9Q1 2012 5.5 8.6 17.0 8.8 7.5 .. 9.3 9.6 16.0 35.4 13.1 15.2 16.5 10.1 31.2 11.4 18.1 - .. 15.1 7.1 9.0 10Q2 2012 5.3 8.0 15.5 8.6 6.5 .. 8.9 8.4 14.9 34.5 13.3 14.4 15.5 8.7 33.0 10.7 17.3 - .. 13.3 4.8 8.8 10Q3 2012 5.3 7.8 16.6 8.6 6.5 .. 8.6 8.3 14.5 33.4 13.4 13.0 14.8 9.2 33.5 8.1 17.3 - .. 11.8 7.5 6.5 10Q4 2012 5.6 8.6 18.3 7.8 7.6 .. 8.7 8.4 13.4 35.4 12.2 14.2 16.3 9.1 37.3 6.2 16.4 - .. 15.2 6.4 4.9 112012 5.4 8.3 16.9 8.5 7.0 .. 8.9 8.7 14.7 34.7 13.0 14.2 15.8 9.3 33.7 9.0 17.3 9.5 .. 13.9 6.4 7.3 10Q1 2013 6.2 11.0 18.1 8.6 8.5 .. - 9.1 13.5 37.3 - - 17.4 9.5 39.8 - 17.0 - .. 17.6 - 5.8 12Q2 2013 5.9 8.6 16.6 8.1 7.4 .. 8.1 8.5 12.2 35.2 10.4 14.6 15.7 8.7 37.8 8.0 16.4 - .. 17.4 8.5 5.6 12Q3 2013 5.8 8.3 17.1 8.4 7.8 .. 8.0 7.9 11.7 35.5 10.6 15.1 14.9 9.1 36.8 11.1 15.4 - .. 15.2 6.3 7.1 12Q4 2013 5.6 9.3 17.2 8.2 7.3 .. 8.1 7.8 12.3 35.0 12.0 14.3 16.7 7.8 36.4 10.3 14.3 - .. 16.7 8.1 8.8 132013 5.9 9.3 17.2 8.3 7.7 .. 8.3 8.3 12.4 35.8 11.0 14.8 16.2 8.8 37.7 9.9 15.7 - .. 16.7 7.5 6.9 12

2.LA
BO
UR
MA
RK
ETIN
TEG
RA
TIO
NO
FIM
MIG
RA
NT
SA
ND
TH
EIRC
HILD
REN
:DEV
ELOPIN
G,A
CT
IVA
TIN
GA
ND
USIN
GSK
ILLS
INT
ERN
AT
ION
AL
MIG
RA
TIO
NO
UT
LOO
K2014
©O
ECD
2014128 ountries, 2009-13 (cont.)
D NOR NZL POL PRT SVK SVN SWE TUR USA
.7 3.0 5.5 7.8 8.3 9.7 5.2 7.1 14.6 10.6
.7 3.4 5.4 7.6 8.9 10.5 5.4 8.2 12.5 10.8
.9 3.1 6.5 7.7 9.2 11.9 6.4 7.3 12.0 10.4
.3 2.9 6.7 8.3 9.8 13.5 6.6 7.5 12.0 11.0.9 3.1 6.1 7.9 9.0 11.4 5.9 7.5 12.7 10.7.9 3.7 6.2 10.6 10.2 15.1 7.2 8.5 13.2 12.4.7 4.0 6.3 9.4 10.2 14.2 7.4 8.4 9.7 11.0.8 3.1 5.6 8.7 10.0 14.0 7.2 6.6 9.8 10.3.6 3.1 6.5 9.0 10.3 13.9 7.9 6.1 9.4 10.1.9 3.5 6.1 9.4 10.2 14.3 7.4 7.4 10.5 10.9.9 3.0 6.6 10.1 12.0 14.0 8.3 6.5 10.2 10.9.6 3.1 6.5 9.1 12.1 13.5 8.0 6.8 8.2 9.8.6 2.6 6.3 8.4 12.2 13.1 8.1 5.5 7.5 9.5.0 2.8 6.3 9.0 14.6 13.8 8.4 5.6 7.7 9.0.8 2.9 6.4 9.1 12.7 13.6 8.2 6.1 8.4 9.8.6 3.2 6.8 10.3 15.2 13.9 8.5 6.7 9.3 9.5.3 3.4 6.4 9.4 15.6 13.4 7.9 7.2 7.1 8.7.6 2.8 6.9 9.1 16.8 13.0 8.5 5.8 7.1 8.4.0 3.2 6.6 9.5 17.4 14.0 9.3 6.2 7.7 8.0.6 3.1 6.7 9.6 16.2 13.6 8.6 6.7 7.8 8.6.2 3.2 .. 10.9 18.3 14.2 10.4 7.3 9.0 9.0.4 3.5 .. 10.0 16.7 13.8 9.9 7.6 7.4 8.3.3 2.7 .. 9.2 15.5 13.7 8.5 5.6 7.9 8.0.3 2.8 .. 9.3 15.1 14.5 8.9 5.9 8.0 7.4.3 3.1 .. 9.8 16.4 14.0 9.4 6.6 8.1 8.2.3 9.9 6.4 - 11.6 - 10.1 14.7 16.5 10.4.5 7.3 6.7 - 12.6 - 8.9 18.0 13.8 9.3.1 7.8 7.2 - 14.9 - 6.3 16.2 16.0 10.2.0 8.8 8.1 - 13.8 - 5.1 16.0 12.7 10.6.2 8.5 7.1 - 13.2 - 7.5 16.2 14.7 10.1.4 9.5 6.9 - 12.9 - 10.6 16.3 14.6 12.1.1 10.3 8.6 - 10.9 - 9.7 16.8 14.2 8.8.0 9.7 6.6 - 12.0 - 7.5 15.3 9.5 9.0.3 9.6 6.8 - 14.9 - 9.7 15.1 11.1 10.0.8 9.8 7.2 12.1 12.7 8.9 9.4 15.9 12.4 10.0.8 9.2 7.4 - 20.2 - 13.0 16.9 12.6 10.4.1 9.3 6.2 8.4 17.4 - 8.8 16.8 10.1 8.4.4 6.8 6.5 11.7 18.0 - 8.2 15.0 9.0 8.2.5 7.8 7.9 11.2 16.4 - 8.2 15.4 9.2 8.4.7 8.3 7.0 9.9 18.0 - 9.7 16.0 10.3 8.9.0 - 7.3 - 19.2 - - 17.0 - 9.0.7 8.1 6.6 - 20.0 - - 16.0 13.1 7.1.2 5.6 8.2 - 19.1 - - 16.3 6.7 6.9.1 6.2 6.4 - 21.7 - - 17.2 11.4 7.0.5 7.2 7.1 3.5 20.0 14.1 8.3 16.9 11.0 7.5.1 7.8 .. 6.9 23.7 - 14.5 17.6 12.3 7.6.1 7.9 .. - 22.8 - 11.8 17.3 9.9 6.2.2 7.0 .. 5.1 22.8 15.6 7.7 16.2 8.8 6.1.7 7.0 .. 7.9 21.2 - 10.1 16.8 9.9 6.1.2 7.4 .. 5.7 22.6 11.8 11.0 17.0 10.2 6.5
Table 2.A1.12. Quarterly unemployment rates by gender and place of birth in OECD cPercentages
Men
AUS AUT BEL CAN CHE CHL CZE DEU DNK ESP EST FIN FRA GBR GRC HUN IRL ISL ISR ITA LUX MEX NL
Nativ
e-bo
rn
Q1 2009 5.8 3.8 6.3 10.1 .. .. 5.0 7.5 5.7 14.3 15.1 8.3 8.0 8.0 6.5 10.1 12.3 - 7.0 6.7 4.3 5.3 2Q2 2009 5.8 3.8 6.3 9.6 3.0 .. 5.5 7.2 6.2 15.0 17.9 10.3 7.8 8.8 6.0 10.0 14.7 - 7.9 6.2 2.6 5.6 2Q3 2009 5.5 4.2 6.2 8.6 .. .. 6.4 7.3 6.5 15.3 16.7 7.5 8.0 9.1 6.3 10.6 15.1 - 8.2 6.2 2.7 6.0 2Q4 2009 5.4 3.9 6.7 8.8 .. .. 6.5 6.7 7.1 15.9 19.6 8.7 9.0 8.7 7.3 10.8 15.3 - 8.2 7.2 2.7 5.7 32009 5.6 3.9 6.4 9.3 .. 9.3 5.9 7.2 6.4 15.1 17.3 8.7 8.2 8.7 6.5 10.4 14.4 8.3 7.8 6.6 3.0 5.6 2Q1 2010 6.0 4.2 6.7 10.3 3.1 .. 7.6 7.8 9.1 17.3 25.9 10.4 9.1 9.3 8.5 12.7 16.2 - 7.5 7.9 2.8 5.5 3Q2 2010 5.4 3.7 6.6 8.8 3.2 .. 6.3 6.7 7.9 17.2 22.7 10.0 8.2 8.6 8.7 11.9 16.7 - 6.5 7.4 2.7 5.4 3Q3 2010 4.9 3.9 6.8 7.7 2.9 .. 6.1 6.4 6.7 17.1 14.7 7.2 8.1 8.6 9.2 11.1 16.5 - 7.3 6.7 1.9 5.7 3Q4 2010 4.8 3.3 6.5 7.5 2.9 .. 6.0 6.0 7.2 17.7 14.3 7.8 8.2 8.6 11.1 11.2 16.9 - 6.6 7.5 2.7 5.8 32010 5.3 3.8 6.7 8.6 3.1 .. 6.5 6.7 7.7 17.3 19.4 8.8 8.4 8.7 9.4 11.7 16.6 7.9 7.0 7.4 2.5 5.6 3Q1 2011 5.4 3.6 5.9 9.2 3.0 .. 6.5 6.6 7.9 18.5 15.7 9.1 8.2 8.6 12.7 12.2 17.4 - 6.3 7.7 - 5.5 3Q2 2011 5.0 3.3 4.8 8.0 2.6 .. 5.9 5.7 7.2 18.3 13.7 9.3 7.6 8.5 13.2 10.9 17.8 - 5.6 6.9 - 5.4 3Q3 2011 5.3 3.1 6.3 7.0 2.9 .. 5.6 5.3 6.7 18.6 10.4 6.9 7.8 9.2 14.5 10.7 18.1 - 5.9 6.6 3.6 5.5 3Q4 2011 5.1 3.0 5.7 7.2 2.7 .. 5.6 4.9 6.8 20.0 12.5 7.5 8.7 8.8 17.2 10.7 17.8 - 5.4 8.4 3.8 5.1 42011 5.2 3.3 5.7 7.8 2.8 6.7 5.9 5.6 7.2 18.8 13.1 8.2 8.1 8.8 14.4 11.1 17.8 7.6 5.8 7.4 3.0 5.4 3Q1 2012 5.9 3.3 5.2 8.9 3.0 .. 6.3 5.8 7.7 21.5 12.9 8.7 9.1 8.9 18.7 12.2 18.0 - .. 9.8 5.1 5.2 4Q2 2012 5.1 3.6 5.4 7.6 2.5 .. 5.8 5.1 7.4 22.2 11.5 9.3 8.5 8.7 19.5 11.4 18.4 - .. 9.7 3.4 4.9 4Q3 2012 5.6 3.6 5.9 7.0 3.7 .. 5.9 5.0 6.8 22.5 9.3 7.1 8.8 8.6 20.4 10.7 18.1 - .. 8.8 3.6 5.2 4Q4 2012 5.2 3.5 6.9 7.1 3.2 .. 6.2 4.8 6.4 23.4 9.4 7.4 9.6 8.1 21.7 11.0 16.8 - .. 10.4 - 5.0 52012 5.4 3.5 5.8 7.6 3.1 .. 6.0 5.2 7.1 22.4 10.8 8.1 9.0 8.5 20.1 11.3 17.8 6.1 .. 9.7 3.7 5.1 4Q1 2013 6.1 4.3 6.5 8.4 3.1 .. 6.6 5.8 7.3 24.3 10.8 9.6 9.8 8.4 23.1 12.6 15.7 - .. 11.4 4.9 5.0 6Q2 2013 5.6 3.8 6.4 7.7 2.9 .. 5.7 5.1 5.9 23.7 8.4 10.0 9.0 8.4 22.7 10.3 16.1 - .. 10.9 - 5.2 6Q3 2013 5.8 4.1 7.1 6.8 3.5 .. 5.8 5.0 6.8 22.9 8.0 7.2 8.7 8.3 22.8 9.8 15.0 - .. 10.3 5.2 5.3 6Q4 2013 6.0 3.8 7.3 6.9 3.2 .. 5.6 4.8 5.5 23.2 8.6 8.0 9.2 7.6 23.5 9.1 13.3 - .. 11.7 3.8 4.7 62013 5.9 4.0 6.8 7.5 3.2 .. 5.9 5.2 6.4 23.5 9.0 8.7 9.2 8.2 23.0 10.4 15.0 5.4 .. 11.1 4.3 5.1 6
Fore
ign-
born
Q1 2009 6.3 11.6 15.9 10.4 .. .. 7.8 13.6 8.8 29.1 - 12.1 13.7 7.8 10.3 7.4 16.2 - 7.3 8.9 6.0 9.0 6Q2 2009 7.3 10.6 15.4 11.3 6.2 .. 9.6 14.3 10.2 29.5 13.1 19.9 14.1 8.9 9.8 8.0 18.2 - 8.0 8.9 6.2 2.8 7Q3 2009 6.6 10.1 17.0 11.1 .. .. 8.2 13.2 9.9 29.3 23.0 15.7 13.5 10.0 9.8 10.6 19.2 - 6.8 9.4 4.9 8.8 7Q4 2009 5.9 10.5 17.0 10.0 .. .. 8.2 13.3 11.2 31.4 26.5 16.1 15.4 8.9 11.5 8.6 19.3 - 7.9 10.4 6.4 7.1 82009 6.5 10.7 16.3 10.7 .. 7.4 8.5 13.6 10.0 29.8 17.7 16.1 14.2 8.9 10.4 8.6 18.2 14.8 7.5 9.4 5.9 7.0 7Q1 2010 5.7 10.6 18.6 10.7 7.4 .. 7.1 14.3 14.9 32.5 26.5 17.3 14.7 9.4 14.2 9.1 19.1 - 7.7 11.2 6.5 6.5 9Q2 2010 5.2 9.2 17.1 10.5 9.8 .. 5.4 12.1 17.8 31.4 26.2 19.7 13.2 9.4 15.2 8.2 18.5 - 5.9 10.0 5.7 5.3 8Q3 2010 5.0 8.4 16.9 10.1 6.3 .. 4.6 11.4 15.0 29.8 26.8 19.8 13.0 8.7 14.9 6.8 20.0 - 7.2 8.0 3.8 7.2 8Q4 2010 4.5 7.1 15.0 8.7 6.4 .. 5.0 11.7 12.4 30.7 15.5 16.7 13.7 7.8 16.6 6.4 21.0 - 6.7 11.0 4.7 7.7 82010 5.1 8.8 16.9 10.0 7.2 .. 5.6 12.4 15.1 31.1 23.6 18.4 13.7 8.8 15.2 7.6 19.7 16.5 6.9 10.0 5.2 6.7 8Q1 2011 4.7 10.2 16.0 9.1 7.3 .. - 10.9 16.3 31.9 - 17.2 14.3 8.6 19.7 - 20.8 - 6.2 10.4 - 5.3 9Q2 2011 4.6 7.9 16.0 8.2 5.9 .. 6.5 9.8 12.9 31.8 19.0 15.7 13.8 9.0 19.4 9.7 19.8 - 5.1 8.2 5.9 4.5 10Q3 2011 4.5 6.0 15.0 8.3 5.4 .. 7.4 9.3 13.1 33.1 13.6 16.4 13.6 9.3 21.3 8.5 19.3 - 5.8 8.4 3.5 4.0 9Q4 2011 4.6 7.9 14.9 8.0 6.2 .. 6.2 9.0 13.2 34.6 14.3 14.7 14.7 9.5 25.9 7.1 19.3 - 5.1 11.9 4.7 6.7 92011 4.6 8.0 15.5 8.4 6.2 3.9 6.1 9.7 13.8 32.9 15.6 16.0 14.1 9.1 21.5 8.9 19.8 - 5.6 9.7 4.7 5.1 9Q1 2012 4.8 8.2 17.8 8.7 7.3 .. - 9.9 - 36.9 - - 16.8 9.4 30.6 - 21.0 - .. 13.2 - 10.9 10Q2 2012 4.7 8.9 15.1 8.6 5.7 .. - 8.6 13.9 36.4 - 14.4 14.8 7.5 34.0 - 19.5 - .. 12.1 - 9.6 10Q3 2012 4.8 8.0 17.7 8.4 5.4 .. 6.2 8.5 13.8 35.7 13.0 12.8 14.4 7.9 34.5 8.8 18.9 - .. 10.2 - 6.6 10Q4 2012 5.3 9.8 19.6 7.5 6.7 .. - 8.6 11.2 36.9 - 15.9 15.8 8.3 39.0 - 18.2 - .. 14.1 - 4.0 112012 4.9 8.7 17.6 8.3 6.3 .. 7.3 8.9 13.5 36.5 14.9 14.5 15.5 8.2 34.5 9.9 19.4 9.1 .. 12.4 5.4 7.8 10Q1 2013 6.1 12.2 20.1 8.6 8.1 .. 8.5 9.8 12.6 39.6 12.9 14.7 17.4 9.0 40.4 9.5 18.6 - .. 16.9 6.2 5.7 12Q2 2013 5.8 8.9 17.9 7.7 7.2 .. 7.0 8.5 11.0 35.9 7.2 15.7 15.8 8.2 37.6 4.2 17.2 - .. 16.8 7.9 5.3 13Q3 2013 5.7 8.3 17.6 7.9 7.6 .. 6.8 8.0 12.0 38.1 9.1 14.5 14.5 8.0 35.0 8.3 16.1 - .. 14.8 5.7 7.1 14Q4 2013 5.6 9.2 17.1 8.3 6.0 .. 7.1 8.0 9.8 35.8 15.6 13.0 16.1 6.7 35.0 6.5 15.2 - .. 15.1 6.3 9.3 132013 5.8 9.6 18.2 8.1 7.2 .. 7.3 8.6 11.4 37.4 11.2 14.5 16.0 8.0 37.0 7.2 16.7 9.1 .. 15.9 6.5 6.9 13

2.LA
BO
UR
MA
RK
ETIN
TEG
RA
TIO
NO
FIM
MIG
RA
NT
SA
ND
TH
EIRC
HILD
REN
:DEV
ELOPIN
G,A
CT
IVA
TIN
GA
ND
USIN
GSK
ILLS
INT
ERN
AT
ION
AL
MIG
RA
TIO
NO
UT
LOO
K2014
©O
ECD
2014129
ountries, 2009-13 (cont.)
D NOR NZL POL PRT SVK SVN SWE TUR USA
.7 2.3 5.6 9.0 9.9 11.4 5.0 6.6 13.9 7.1
.8 2.5 6.1 8.4 9.8 12.3 5.6 7.8 12.3 8.0
.1 2.8 6.2 8.7 11.1 13.3 5.9 6.6 13.2 9.0
.3 2.0 6.5 8.9 11.1 14.4 6.7 6.6 11.9 8.30 2.4 6.1 8.7 10.5 12.9 5.8 6.9 12.8 8.1.9 2.6 6.8 10.7 11.6 15.4 6.8 7.5 13.1 8.3.7 2.6 6.6 9.9 11.6 14.7 6.5 7.7 10.6 8.8.8 2.8 7.0 9.8 12.5 14.3 6.9 6.2 11.6 9.3.0 2.2 6.9 10.0 12.2 14.0 7.5 5.6 11.0 8.30 2.5 6.8 10.1 12.0 14.6 6.9 6.8 11.6 8.7.0 2.4 7.7 10.3 12.7 13.9 8.0 6.6 11.2 8.2.5 2.8 6.9 10.2 12.6 12.8 6.9 6.7 9.7 8.5.6 2.9 6.6 10.7 13.3 13.3 7.4 5.0 10.5 9.2.2 - 6.6 10.9 14.5 14.3 8.9 5.4 9.6 7.98 2.5 7.0 10.5 13.3 13.6 7.8 5.9 10.2 8.5.4 1.9 7.6 11.2 15.4 14.5 8.5 6.2 10.1 8.0.4 2.2 7.2 10.9 15.4 14.1 8.4 6.7 8.2 7.9.4 2.5 7.5 11.0 15.7 14.6 9.7 5.6 9.7 8.4.7 2.1 7.3 11.1 17.4 15.1 9.7 5.8 10.2 7.35 2.2 7.4 11.0 16.0 14.6 9.1 6.3 9.5 7.9.1 2.4 .. 12.0 17.7 15.1 10.5 6.9 11.0 7.6.3 2.5 .. 11.3 16.4 14.5 10.1 7.2 9.6 7.3.6 2.9 .. 10.9 16.1 14.6 10.0 5.9 11.2 7.4.7 2.4 .. 10.6 16.1 14.2 9.7 5.5 11.3 6.54 2.6 .. 11.2 16.6 14.6 10.1 6.4 10.8 7.2.3 3.5 6.2 - 13.5 - 6.8 13.9 17.5 8.9.8 6.8 6.8 - 12.2 - 5.8 15.3 13.8 9.0.1 3.6 6.2 - 12.8 - 10.1 13.7 16.4 9.7.5 5.5 8.5 - 13.4 - 6.1 15.0 18.5 9.34 4.9 7.0 - 13.0 - 7.2 14.5 16.6 9.2.9 7.5 8.5 - 15.8 - 8.5 16.2 16.5 10.3.4 7.5 7.7 - 16.8 - 9.5 18.1 10.4 8.6.8 7.1 7.3 - 17.1 - 10.5 16.1 15.1 9.4.4 6.0 7.4 - 19.0 - 10.7 16.4 14.2 9.82 7.0 7.7 11.1 17.2 16.7 9.8 16.7 14.1 9.5.6 7.3 7.5 8.1 18.1 - 13.5 16.8 15.1 9.6.5 7.3 6.3 - 16.1 - - 17.1 15.9 9.1.4 6.4 7.9 18.2 13.7 - 13.2 15.6 12.3 10.1.6 7.0 5.8 19.9 15.6 - 15.5 14.2 11.3 9.25 7.0 6.9 14.5 15.9 20.8 14.0 15.9 13.6 9.5
.0 6.2 8.7 - 18.0 - 13.9 14.5 11.2 9.4
.4 5.2 7.6 - 16.3 - 14.3 15.8 13.6 8.5
.6 5.9 7.6 12.8 19.3 - 14.2 14.3 13.6 9.0
.2 7.9 8.3 22.3 21.3 - 15.7 14.9 11.9 9.05 6.3 8.1 11.7 18.8 9.1 14.5 15.1 12.6 9.0
.8 - .. - 22.6 - - 16.2 - 8.8
.8 7.7 .. 21.1 23.3 - 20.7 15.4 12.6 7.2
.4 8.7 .. 24.6 19.4 - 19.1 15.7 12.7 7.4
.7 7.3 .. 20.9 19.3 - 20.6 15.8 12.2 7.12 8.3 .. 21.1 21.1 - 21.4 15.8 11.5 7.6
within a given year.
terización Socioeconómica Nacional (CASEN); Mexico: Encuesta
1 2 http://dx.doi.org/10.1787/888933157951
Table 2.A1.12. Quarterly unemployment rates by gender and place of birth in OECD cPercentages
Women
AUS AUT BEL CAN CHE CHL CZE DEU DNK ESP EST FIN FRA GBR GRC HUN IRL ISL ISR ITA LUX MEX NL
Nativ
e-bo
rn
Q1 2009 5.6 3.6 7.1 5.9 .. .. 6.8 6.7 4.1 16.4 9.5 6.6 8.5 5.8 12.9 9.4 5.7 - 7.8 9.2 3.3 5.2 2Q2 2009 5.0 4.0 6.3 6.2 3.4 .. 7.4 6.5 5.0 17.1 9.1 8.4 8.4 6.1 12.5 9.2 7.3 - 7.8 8.3 3.9 5.0 2Q3 2009 4.7 4.5 7.5 7.5 .. .. 8.5 6.6 5.2 17.0 12.0 7.2 8.8 6.4 13.1 10.1 8.1 - 9.0 8.2 4.5 7.1 3Q4 2009 4.7 3.7 7.0 5.9 .. .. 8.2 6.1 5.5 17.8 11.5 7.2 9.3 6.2 14.0 10.3 7.6 - 7.9 9.6 2.8 5.3 32009 5.0 3.9 7.0 6.4 .. 13.0 7.7 6.5 5.0 17.1 10.5 7.4 8.8 6.1 13.2 9.8 7.2 5.5 8.1 8.8 3.6 5.7 3.Q1 2010 5.6 3.5 7.6 6.3 3.7 .. 8.9 6.6 5.5 18.8 14.3 7.7 9.0 6.4 15.3 11.1 8.0 - 7.1 10.1 2.3 5.4 3Q2 2010 5.1 3.5 6.9 6.3 3.4 .. 8.3 5.8 5.2 19.3 13.8 8.5 8.4 6.4 15.3 10.6 9.0 - 6.3 8.9 2.8 5.3 3Q3 2010 5.2 3.6 7.3 7.6 4.1 .. 8.6 5.7 6.5 19.0 13.4 6.7 8.8 7.1 16.2 10.9 9.3 - 8.3 8.3 3.8 5.9 3Q4 2010 5.0 3.6 6.8 6.0 3.3 .. 8.2 5.5 6.7 19.3 12.2 6.5 9.4 6.7 17.9 10.8 9.1 - 7.0 9.5 5.8 4.9 42010 5.2 3.6 7.1 6.6 3.6 .. 8.5 5.9 6.0 19.1 13.4 7.4 8.9 6.6 16.2 10.8 8.9 6.4 7.2 9.2 3.6 5.4 4.Q1 2011 5.8 3.6 5.9 6.5 3.5 .. 8.2 5.6 6.6 20.1 12.4 7.6 9.2 6.7 19.2 11.2 9.4 - 5.4 9.1 - 5.0 4Q2 2011 5.0 3.4 5.4 6.4 2.7 .. 8.0 4.9 5.9 19.4 11.9 8.1 8.4 6.9 20.2 10.9 9.9 - 5.4 8.2 - 5.4 3Q3 2011 4.9 3.1 6.7 7.1 3.8 .. 7.8 5.1 6.8 20.4 10.9 6.1 8.9 7.4 21.5 10.9 11.0 - 7.7 8.5 - 6.0 3Q4 2011 5.2 3.9 5.9 5.7 3.3 .. 7.6 4.8 6.8 21.3 9.6 5.6 9.0 7.2 24.5 10.9 9.8 - 6.4 10.0 - 4.9 42011 5.2 3.5 6.0 6.4 3.3 10.0 7.9 5.1 6.5 20.3 11.2 6.9 8.9 7.0 21.4 11.0 10.0 5.8 6.2 8.9 4.0 5.3 3.Q1 2012 5.8 3.7 5.8 6.3 3.3 .. 8.1 4.8 6.8 22.8 10.2 6.8 9.1 7.0 26.1 11.4 10.4 - .. 11.4 3.9 4.8 4Q2 2012 5.3 3.5 5.6 6.3 2.9 .. 7.9 4.7 6.8 23.0 8.7 7.7 8.7 6.9 27.0 10.4 10.2 - .. 10.9 - 5.0 4Q3 2012 4.8 3.8 6.6 7.3 3.4 .. 8.3 4.8 6.5 24.3 9.3 6.7 9.3 7.2 28.7 10.3 10.6 - .. 10.7 - 5.5 4Q4 2012 5.0 3.7 5.9 5.7 3.1 .. 8.5 4.6 6.1 25.0 8.6 6.1 9.8 6.9 29.3 10.7 9.4 - .. 12.3 4.6 5.0 42012 5.2 3.7 5.9 6.4 3.2 .. 8.2 4.7 6.6 23.8 9.2 6.8 9.2 7.0 27.8 10.7 10.1 5.2 .. 11.3 3.9 5.1 4.Q1 2013 5.9 4.1 6.7 6.2 3.2 .. 8.6 4.8 7.0 25.7 9.4 7.5 9.2 6.8 30.3 11.0 10.0 - .. 13.2 - 5.0 5Q2 2013 5.6 3.6 6.8 6.1 3.0 .. 8.2 4.4 6.5 25.2 7.5 7.9 8.7 6.7 30.5 10.5 10.5 - .. 11.9 - 5.1 5Q3 2013 5.4 4.3 7.1 7.0 3.4 .. 8.5 4.4 6.4 24.9 7.4 6.4 8.6 7.0 30.6 10.0 9.8 - .. 11.5 4.7 5.6 5Q4 2013 5.4 4.4 6.7 5.4 2.5 .. 8.1 4.4 6.2 25.0 8.2 7.0 9.3 6.3 31.1 9.3 9.0 - .. 13.0 4.4 4.8 52013 5.6 4.1 6.8 6.2 3.0 .. 8.4 4.5 6.5 25.2 8.1 7.2 9.0 6.7 30.6 10.2 9.8 4.9 .. 12.4 3.9 5.1 5.
Fore
ign-
born
Q1 2009 6.9 8.1 16.6 8.8 .. .. 9.3 12.6 9.4 24.8 - 16.1 14.2 8.1 14.8 10.9 11.4 - 6.8 12.8 9.8 6.4 6Q2 2009 6.8 7.4 15.3 9.9 7.8 .. 9.3 11.2 10.1 23.8 15.4 13.6 13.5 9.2 13.7 9.6 11.2 - 7.4 12.9 8.8 1.8 6Q3 2009 7.1 8.8 17.9 10.5 .. .. 13.0 12.7 7.7 23.2 15.0 14.1 14.6 9.4 13.8 9.7 13.1 - 6.4 11.7 6.2 7.1 6Q4 2009 6.7 8.3 14.7 9.3 .. .. 12.4 10.9 11.8 24.7 11.0 15.2 15.0 9.0 15.6 7.9 11.2 - 5.8 14.6 10.1 13.0 62009 6.9 8.2 16.1 9.6 .. 9.0 11.0 11.8 9.7 24.1 12.3 14.7 14.3 8.9 14.5 9.6 11.7 8.6 6.6 13.0 8.8 7.1 6.Q1 2010 6.9 7.6 17.3 9.6 9.8 .. 9.9 11.3 11.8 26.2 19.4 16.2 16.6 8.7 17.9 9.7 10.8 - 5.4 14.3 8.3 5.8 7Q2 2010 6.3 8.0 16.5 9.8 8.8 .. 10.5 10.9 11.8 26.4 25.0 17.4 15.0 9.0 16.6 7.1 13.2 - 4.3 13.4 5.5 7.1 7Q3 2010 5.5 7.0 19.2 11.0 8.7 .. 9.4 10.0 13.0 26.6 25.3 15.4 16.0 9.1 16.2 7.0 13.7 - 5.5 11.9 6.6 4.6 7Q4 2010 5.9 7.7 16.2 9.2 7.9 .. 8.1 10.7 12.0 27.6 18.9 14.1 16.6 9.0 19.9 - 14.4 - 6.0 13.7 5.7 8.0 72010 6.1 7.6 17.3 9.9 8.8 .. 9.5 10.7 12.1 26.7 22.2 15.8 16.0 9.0 17.7 7.4 13.0 10.4 5.3 13.3 6.5 6.4 8.Q1 2011 6.5 8.5 12.8 9.4 8.1 .. 11.6 9.8 15.2 29.9 21.8 16.9 17.3 8.9 23.3 8.2 13.8 - 4.4 13.5 9.5 12.4 8Q2 2011 6.2 7.6 14.9 9.1 6.3 .. - 9.1 15.7 29.1 20.0 - 14.9 8.9 19.7 - 14.1 - 4.2 14.1 - 9.2 8Q3 2011 5.9 7.8 16.3 9.9 7.8 .. 11.0 9.0 15.1 29.4 16.2 13.6 15.6 10.2 22.8 10.3 14.6 - 4.6 12.3 7.8 4.0 8Q4 2011 5.3 9.4 14.6 9.4 7.6 .. 10.2 8.9 14.4 32.1 14.7 14.0 17.0 10.6 26.9 10.4 14.6 - 4.5 16.5 6.4 8.5 82011 6.0 8.3 14.6 9.5 7.5 7.7 10.9 9.2 15.1 30.1 18.1 14.2 16.2 9.6 23.2 10.1 14.3 - 4.5 14.1 8.4 8.2 8.Q1 2012 6.3 9.1 15.8 9.0 7.6 .. 11.0 9.2 16.9 33.8 11.2 15.7 16.0 10.9 32.0 11.4 14.6 - .. 17.5 7.7 5.4 11Q2 2012 6.0 7.0 16.0 8.5 7.4 .. 10.1 8.2 15.9 32.5 12.2 14.4 16.3 10.2 31.6 8.0 14.8 - .. 14.8 6.3 7.7 10Q3 2012 5.8 7.6 15.2 8.9 7.9 .. 12.0 8.1 15.3 30.9 13.9 13.1 15.4 10.8 32.0 7.2 15.5 - .. 13.8 9.9 6.3 9Q4 2012 5.9 7.3 16.7 8.1 8.8 .. 11.5 8.2 15.7 33.8 8.4 12.2 16.9 10.0 34.9 5.9 14.2 - .. 16.4 7.1 6.6 112012 6.0 7.7 15.9 8.6 7.9 .. 11.2 8.4 15.9 32.8 11.4 13.8 16.2 10.5 32.6 8.0 14.8 9.9 .. 15.6 7.8 6.5 10.Q1 2013 6.4 9.6 15.4 8.5 8.9 .. - 8.3 14.5 34.9 - - 717.4 10.1 39.0 - 15.1 - .. 18.4 - 5.9 12Q2 2013 6.1 8.2 14.9 8.4 7.5 .. 9.8 8.5 13.3 34.4 12.9 13.4 15.5 9.3 38.2 12.4 15.4 - .. 18.0 9.2 6.3 11Q3 2013 6.0 8.2 16.4 9.0 8.0 .. 9.7 7.8 11.5 32.8 11.7 15.9 15.5 10.4 39.1 14.5 14.5 - .. 15.7 7.1 7.1 11Q4 2013 5.7 9.5 17.3 8.1 8.8 .. 9.5 7.7 14.7 34.2 9.0 15.7 17.4 9.0 38.3 14.2 13.2 - .. 18.5 10.6 7.8 122013 6.1 8.9 16.0 8.5 8.3 .. 9.7 8.1 13.5 34.1 10.8 15.2 16.5 9.7 38.7 13.0 14.5 - .. 17.7 8.6 6.8 12.
Note: Data are not adjusted for seasonal variations. Comparisons should therefore be made for the same quarters of each year, and not for successive quartersInformation on data for Israel: http://dx.doi.org/10.1787/888932315602.Source: European countries and Turkey: Labour Force Surveys (Eurostat); Australia, Canada, Israel, New Zealand: Labour Force Surveys; Chile: Encuesta de CaracNacional de Ocupación y Empleo (ENOE); United States: Current Population Surveys.

2.LA
BO
UR
MA
RK
ETIN
TEG
RA
TIO
NO
FIM
MIG
RA
NT
SA
ND
TH
EIRC
HILD
REN
:DEV
ELOPIN
G,A
CT
IVA
TIN
GA
ND
USIN
GSK
ILLS
INT
ERN
AT
ION
AL
MIG
RA
TIO
NO
UT
LOO
K2014
©O
ECD
2014130 countries, 2009-13
D NOR NZL POL PRT SVK SVN SWE TUR USA
.0 79.5 79.4 64.3 73.3 68.1 70.5 79.3 48.2 73.0
.0 80.2 78.9 64.4 73.1 68.1 71.7 81.4 50.9 73.4
.0 79.2 78.6 65.3 72.8 68.8 73.1 80.5 52.2 73.4
.8 78.3 79.8 65.0 73.1 68.7 72.3 78.9 51.0 72.1
.9 79.3 79.2 64.7 73.1 68.4 71.9 80.0 50.6 73.0
.3 78.1 79.2 65.2 73.5 68.4 71.3 79.5 50.3 72.2
.3 79.1 78.6 65.6 73.3 68.5 71.4 82.0 52.5 72.5
.4 78.5 78.8 66.1 73.3 69.0 71.6 81.8 52.9 72.7
.3 78.1 79.3 65.8 73.1 68.9 71.4 80.0 51.5 71.8
.3 78.5 79.0 65.7 73.3 68.7 71.4 80.8 51.8 72.3
.1 77.6 79.2 65.5 73.5 68.6 69.6 80.4 51.4 71.4
.3 78.2 78.5 66.0 73.5 68.7 69.8 82.7 53.9 71.7
.7 78.5 78.3 66.5 73.3 69.0 70.9 82.3 54.5 72.2
.3 78.1 79.0 66.5 72.9 69.2 70.8 80.5 52.7 71.3
.6 78.1 78.8 66.1 73.3 68.8 70.3 81.5 53.1 71.7
.4 78.2 79.1 66.3 72.8 69.4 70.0 80.6 51.2 71.0
.4 78.9 78.2 66.7 73.3 69.3 69.4 82.8 53.9 71.6
.6 78.8 78.0 66.9 73.5 69.6 70.7 82.9 54.2 72.0
.8 78.3 77.6 66.8 72.8 69.4 70.9 80.8 54.1 71.4
.5 78.6 78.2 66.5 73.1 69.4 70.3 81.5 53.4 71.5
.9 78.2 .. 66.3 72.6 70.0 70.2 81.3 53.0 70.9
.2 78.8 .. 66.8 72.7 69.6 70.2 83.4 55.3 71.5
.2 78.8 .. 67.4 73.0 69.9 71.3 83.4 55.3 71.7
.0 78.0 .. 67.4 73.4 69.8 70.0 81.9 54.0 70.7
.1 78.5 .. 67.0 72.9 69.8 70.4 82.5 54.4 71.2
.4 75.7 74.1 51.3 81.3 70.9 70.8 72.6 55.5 74.6
.0 76.4 74.7 51.0 81.3 71.2 71.5 74.3 55.9 75.2
.3 74.9 73.0 48.9 80.1 68.5 71.8 73.9 56.6 75.4
.2 74.4 74.4 55.6 78.7 67.7 71.4 72.8 54.9 74.9
.5 75.3 74.0 51.6 80.4 69.7 71.3 73.4 55.7 75.0
.2 75.8 73.8 54.8 80.4 64.1 74.0 72.3 56.3 74.6
.0 76.0 73.8 56.7 80.8 63.4 74.2 73.7 57.2 75.4
.6 75.0 73.0 59.5 81.2 61.9 69.3 74.2 55.7 75.1
.7 74.5 74.6 59.4 82.8 66.8 71.3 72.8 57.7 74.8
.4 75.3 73.8 57.4 81.3 64.0 72.2 73.3 56.8 75.0
.6 74.4 75.8 59.1 82.7 66.5 71.1 73.8 56.9 74.2
.2 77.2 74.8 61.7 83.1 70.6 70.8 74.8 56.2 74.3
.3 76.4 75.0 66.6 82.7 - 68.7 74.9 54.4 74.1
.8 76.1 76.1 65.0 82.4 72.9 68.9 74.4 55.9 74.7
.0 76.0 75.4 62.9 82.7 70.5 69.9 74.5 55.9 74.3
.9 75.2 77.2 61.4 83.2 70.5 71.1 73.9 51.7 73.7
.3 77.7 75.8 66.2 83.0 70.6 70.8 75.8 52.2 73.6
.7 76.3 76.4 70.8 82.7 73.0 72.6 75.2 53.1 73.7
.6 75.3 76.2 68.7 81.4 73.6 72.5 74.7 53.1 73.5
.1 76.1 76.4 66.4 82.6 72.0 71.7 74.9 52.5 73.7
.1 75.3 .. 67.3 80.5 - 71.0 74.3 51.9 73.3
.1 76.2 .. 66.7 81.1 73.4 72.3 76.2 54.1 73.6
.9 77.1 .. 69.4 80.2 74.5 71.7 75.6 52.5 74.0
.7 76.4 .. 66.7 79.6 73.3 71.0 74.7 50.1 73.1
.7 76.2 .. 67.5 80.4 74.4 71.5 75.2 52.1 73.5
Table 2.A1.13. Quarterly participation rates by gender and place of birth in OECDPercentages
Men + women
AUS AUT BEL CAN CHE CHL CZE DEU DNK ESP EST FIN FRA GBR GRC HUN IRL ISL ISR ITA LUX MEX NL
Nativ
e-bo
rn
Q1 2009 78.3 75.2 67.6 77.7 .. .. 69.6 77.5 81.1 71.6 73.2 74.2 70.7 76.3 66.6 60.8 69.2 - 62.4 61.6 69.2 62.6 81Q2 2009 78.3 76.1 67.4 79.3 82.9 .. 69.8 77.7 81.9 71.7 72.8 77.2 71.2 76.0 66.9 61.3 70.1 - 62.9 61.7 69.6 62.9 81Q3 2009 77.8 77.2 67.7 79.6 .. .. 70.4 77.9 81.6 71.6 74.0 75.0 71.3 76.5 67.2 61.7 70.3 - 62.5 61.2 70.1 64.2 81Q4 2009 78.0 75.8 68.1 77.7 .. .. 70.4 78.2 80.3 71.5 72.5 73.4 70.9 76.1 66.9 61.8 68.7 - 62.2 61.5 69.6 64.1 802009 78.1 76.1 67.7 78.6 .. 60.8 70.0 77.9 81.2 71.6 73.1 74.9 71.0 76.2 66.9 61.4 69.6 84.3 62.5 61.5 69.6 63.5 80Q1 2010 77.9 74.8 68.5 77.1 83.2 .. 69.8 77.4 80.0 71.6 73.8 73.4 71.0 75.6 67.2 61.7 68.3 - 62.1 61.5 69.2 62.8 79Q2 2010 78.0 75.4 67.6 79.0 82.5 .. 69.9 77.2 80.7 72.0 73.3 76.6 70.9 75.7 67.4 62.2 69.7 - 62.8 61.5 69.3 63.8 79Q3 2010 77.9 76.6 68.4 79.6 83.3 .. 70.4 77.4 80.3 72.0 72.8 74.9 71.3 76.5 67.3 62.7 69.7 - 63.7 60.4 71.2 63.6 79Q4 2010 78.3 76.0 68.8 77.9 83.1 .. 70.3 77.7 79.8 72.1 73.4 73.3 70.6 76.0 67.2 62.5 68.8 - 63.4 61.6 62.4 62.6 792010 78.0 75.7 68.3 78.4 83.0 .. 70.1 77.4 80.2 71.9 73.3 74.6 70.8 76.0 67.3 62.3 69.1 84.6 63.0 61.2 62.6 63.2 79Q1 2011 78.1 75.0 66.9 77.4 83.6 .. 70.0 77.6 80.1 72.2 74.0 73.8 70.4 75.8 66.9 61.8 68.0 - 62.7 61.2 62.2 62.4 79Q2 2011 77.9 75.7 67.7 79.2 83.3 .. 70.4 77.7 80.3 72.5 74.3 77.2 70.6 75.8 66.8 62.5 69.0 - 63.0 61.0 60.4 63.3 79Q3 2011 77.8 76.7 67.9 79.5 83.5 .. 70.7 78.1 80.7 72.8 75.2 75.6 71.2 76.4 66.8 63.1 68.9 - 63.3 60.8 62.6 63.7 79Q4 2011 77.9 76.1 67.9 77.6 83.9 .. 70.6 78.4 79.9 72.6 74.0 73.8 71.0 76.4 66.9 63.1 68.8 - 62.8 62.0 61.2 64.4 802011 77.9 75.9 67.6 78.5 83.6 61.7 70.4 77.9 80.2 72.5 74.4 75.1 70.8 76.1 66.8 62.6 68.7 84.4 62.9 61.3 61.6 63.5 79Q1 2012 77.9 75.3 67.1 77.1 83.2 .. 70.6 77.5 79.7 72.7 74.6 74.0 70.8 76.2 67.0 63.1 68.3 - .. 62.7 61.6 63.3 80Q2 2012 77.8 76.5 67.6 79.0 82.8 .. 71.2 77.5 80.1 73.0 74.6 77.3 71.2 76.4 67.2 64.0 68.8 - .. 63.0 62.6 64.6 80Q3 2012 77.6 77.8 68.3 79.4 84.1 .. 72.1 78.0 79.7 73.2 75.2 76.2 71.8 77.1 67.2 64.8 69.3 - .. 62.4 64.7 64.9 80Q4 2012 77.9 76.6 68.2 77.8 83.9 .. 72.2 78.1 78.9 72.9 74.0 73.7 71.8 77.2 67.3 64.6 68.5 - .. 63.2 63.6 64.0 802012 77.8 76.5 67.8 78.3 83.5 .. 71.5 77.8 79.6 73.0 74.6 75.3 71.4 76.8 67.2 64.1 68.7 84.6 .. 62.8 63.1 64.2 80Q1 2013 77.9 75.7 67.4 77.3 84.0 .. 72.2 77.9 79.1 73.3 74.7 74.1 71.4 76.7 66.9 63.9 68.4 - .. 62.8 61.9 63.2 80Q2 2013 77.9 76.6 68.7 79.1 83.2 .. 72.7 78.1 79.2 73.3 75.1 77.5 71.6 76.8 67.3 64.8 69.7 - .. 62.5 62.6 64.4 81Q3 2013 77.6 77.8 69.1 79.4 83.7 .. 73.1 78.3 79.6 73.5 74.8 75.4 71.9 77.5 67.2 65.5 69.7 - .. 62.0 62.4 64.4 81Q4 2013 77.8 77.1 68.1 77.9 84.3 .. 73.1 78.6 78.1 73.5 75.0 73.8 71.7 77.2 66.8 65.5 69.2 - .. 63.1 64.6 64.7 812013 77.8 76.8 68.3 78.4 83.8 .. 72.8 78.2 79.0 73.4 74.9 75.2 71.6 77.1 67.1 64.9 69.3 85.6 .. 62.6 62.9 64.1 81
Fore
ign-
born
Q1 2009 72.6 70.4 63.7 75.6 .. .. 72.4 72.6 74.5 80.5 79.7 75.3 67.9 72.7 73.9 71.4 73.3 - 68.4 70.3 72.2 50.5 72Q2 2009 72.1 71.3 60.8 76.5 81.4 .. 73.9 72.9 74.6 79.8 80.9 77.9 67.6 72.0 74.8 72.4 74.2 - 68.1 71.1 79.1 51.5 71Q3 2009 71.7 72.0 62.3 76.8 .. .. 72.6 73.2 78.8 79.2 78.6 75.3 67.1 73.1 75.7 72.6 73.7 - 69.0 69.9 74.4 53.9 71Q4 2009 72.1 72.3 62.6 76.1 .. .. 72.0 72.9 74.1 79.2 79.3 73.2 67.1 72.0 75.6 71.7 72.0 - 68.5 71.0 73.3 51.4 712009 72.1 71.5 62.3 76.3 .. 70.4 72.7 72.9 75.5 79.7 79.6 75.4 67.4 72.4 75.0 72.0 73.3 87.4 68.5 70.6 74.7 51.9 71Q1 2010 72.4 71.0 63.2 75.6 80.1 .. 71.4 72.1 74.0 80.2 74.7 74.0 67.3 71.5 76.3 71.1 70.6 - 67.6 70.3 76.6 51.6 69Q2 2010 71.8 71.8 63.2 76.9 81.4 .. 73.0 72.6 74.6 80.1 76.0 76.1 67.9 72.7 76.4 71.6 72.1 - 68.8 70.7 77.0 51.4 71Q3 2010 72.3 73.1 64.9 77.4 81.9 .. 74.7 73.2 74.2 80.6 79.5 72.3 67.8 73.7 76.8 72.1 71.9 - 69.7 69.2 78.2 53.2 70Q4 2010 73.7 73.1 64.6 75.6 80.6 .. 74.4 72.4 70.9 79.5 76.7 69.9 68.0 72.7 76.1 68.4 71.4 - 69.3 69.4 75.6 54.7 702010 72.6 72.3 64.0 76.4 81.0 .. 73.3 72.6 73.4 80.1 76.7 73.0 67.7 72.7 76.4 70.8 71.5 86.4 68.9 69.9 75.0 52.7 70Q1 2011 74.0 72.5 61.4 74.7 80.1 .. 73.9 72.6 70.9 79.1 75.4 69.3 68.4 73.0 75.6 67.4 70.2 - 68.7 69.7 77.6 54.3 70Q2 2011 73.5 72.7 62.7 75.6 80.6 .. 73.8 73.9 72.0 80.1 75.4 72.9 68.2 73.2 75.2 68.1 71.7 - 69.7 70.6 75.1 55.5 69Q3 2011 73.7 72.2 61.5 76.4 81.3 .. 73.5 73.9 73.9 79.4 79.3 72.7 67.5 74.0 74.5 69.7 72.2 - 69.5 68.4 74.0 57.1 69Q4 2011 73.3 73.1 62.2 75.6 81.7 .. 73.5 73.5 71.8 79.1 77.5 73.3 66.8 73.2 75.1 68.9 71.2 - 69.2 69.8 73.7 58.7 702011 73.6 72.6 61.9 75.6 80.9 72.4 73.7 73.5 72.1 79.4 76.9 72.0 67.7 73.4 75.1 68.6 71.3 85.8 69.3 69.6 75.1 56.4 70Q1 2012 73.9 72.0 62.3 75.1 81.5 .. 73.1 73.3 72.4 79.5 76.1 72.8 68.0 72.5 74.5 69.5 70.9 - .. 70.1 76.2 57.2 70Q2 2012 73.8 73.4 61.2 76.8 81.7 .. 73.1 74.1 71.5 79.3 77.7 75.5 68.0 72.9 74.5 73.2 71.7 - .. 70.4 75.0 58.8 71Q3 2012 73.7 73.2 62.4 77.5 82.1 .. 74.5 74.2 72.4 79.0 77.8 75.2 68.2 74.4 76.0 74.5 71.4 - .. 68.5 77.0 56.8 71Q4 2012 74.0 72.4 64.1 76.8 82.1 .. 74.5 74.2 70.4 79.2 75.2 73.9 68.4 74.3 76.3 74.7 70.5 - .. 70.1 76.8 58.7 702012 73.9 72.7 62.5 76.6 81.9 .. 73.8 74.0 71.7 79.3 76.6 74.3 68.2 73.5 75.3 73.1 71.1 87.3 .. 69.8 76.2 57.9 71Q1 2013 74.6 72.9 64.6 76.2 81.9 .. 74.3 73.6 71.5 79.7 78.3 73.3 67.8 73.8 76.8 76.1 70.7 - .. 70.6 76.8 58.0 70Q2 2013 74.5 73.2 62.1 77.4 82.3 .. 76.1 74.1 72.4 78.8 79.6 77.0 67.9 73.8 76.9 74.0 72.1 - .. 70.0 77.0 56.5 70Q3 2013 73.9 74.0 64.3 78.1 82.4 .. 76.8 74.5 71.9 78.8 75.1 74.7 67.8 75.1 77.5 75.1 72.9 - .. 68.3 78.5 59.7 70Q4 2013 73.6 72.8 63.7 75.9 82.3 .. 77.4 73.5 71.5 78.4 74.4 72.9 68.7 74.5 77.0 76.2 71.8 - .. 69.6 76.9 57.6 712013 74.1 73.2 63.7 76.9 82.2 .. 76.2 73.9 71.8 78.9 76.9 74.4 68.1 74.3 77.0 75.4 71.9 87.4 .. 69.6 77.3 58.0 70

2.LA
BO
UR
MA
RK
ETIN
TEG
RA
TIO
NO
FIM
MIG
RA
NT
SA
ND
TH
EIRC
HILD
REN
:DEV
ELOPIN
G,A
CT
IVA
TIN
GA
ND
USIN
GSK
ILLS
INT
ERN
AT
ION
AL
MIG
RA
TIO
NO
UT
LOO
K2014
©O
ECD
2014131
untries, 2009-13 (cont.)
D NOR NZL POL PRT SVK SVN SWE TUR USA
.1 81.5 84.8 71.3 78.2 76.0 73.6 80.8 72.1 77.5
.2 82.6 84.6 71.5 78.2 76.0 75.5 82.8 74.0 77.9
.0 81.2 83.7 72.5 77.3 76.6 76.9 82.3 75.8 77.9
.6 80.1 85.4 71.9 77.6 76.4 76.1 80.9 74.4 76.4
.0 81.3 84.6 71.8 77.8 76.2 75.5 81.7 74.1 77.4
.5 80.1 84.4 71.9 77.9 75.7 75.2 81.3 73.4 76.5
.5 81.4 83.9 72.2 77.5 76.0 74.5 84.0 75.1 77.0
.7 80.7 84.1 72.9 77.5 76.2 75.7 83.7 75.7 77.1
.2 80.3 84.8 72.7 77.5 76.3 75.2 81.9 74.2 75.8
.4 80.6 84.3 72.5 77.6 76.0 75.1 82.7 74.6 76.6
.9 79.1 84.2 72.3 78.0 76.2 73.3 81.8 74.3 75.4
.9 79.7 84.0 73.0 77.8 76.8 73.2 84.3 76.1 75.8
.4 80.4 83.9 73.4 78.0 76.8 74.5 84.0 77.1 76.5
.9 80.3 84.3 73.2 77.3 77.0 73.6 82.1 75.3 75.6
.3 79.9 84.1 73.0 77.8 76.7 73.7 83.0 75.7 75.8
.0 80.4 84.5 72.9 76.8 77.1 72.2 81.8 72.9 75.1
.8 80.9 83.3 73.6 77.4 76.9 72.2 84.0 75.3 76.0
.0 80.7 82.7 73.8 77.7 77.3 74.1 84.3 76.1 76.6
.1 80.1 82.9 73.6 76.6 77.2 74.6 82.3 75.9 75.8
.0 80.5 83.3 73.3 77.1 77.1 73.3 82.9 75.1 75.9
.1 79.7 .. 73.2 76.4 77.5 73.3 82.8 74.2 75.3
.6 80.8 .. 73.9 76.4 77.2 73.5 84.6 76.3 75.8
.7 80.5 .. 74.4 76.6 77.1 74.3 84.9 76.8 76.2
.4 79.3 .. 74.1 76.6 76.8 73.3 83.1 75.3 74.7
.5 80.1 .. 73.9 76.5 77.2 73.6 83.8 75.7 75.5
.2 80.5 82.5 59.5 86.1 80.8 75.5 78.3 71.6 85.6
.5 81.2 82.7 60.9 86.7 80.8 78.4 80.8 73.5 86.8
.6 80.3 80.5 58.1 86.4 83.3 76.1 80.5 74.2 86.6
.1 81.2 82.0 67.4 85.5 85.3 76.6 78.7 71.7 85.7
.6 80.8 81.9 61.2 86.2 82.3 76.6 79.6 72.6 86.2
.6 80.6 81.7 68.4 84.4 82.8 79.7 78.7 72.0 85.5
.3 81.8 82.0 67.8 84.2 82.7 78.0 80.3 74.9 86.5
.8 80.1 80.8 62.5 85.0 79.9 75.6 80.6 73.1 86.5
.7 80.0 82.1 70.1 86.6 81.6 76.9 80.1 74.5 85.3
.6 80.6 81.6 67.4 85.1 81.7 77.5 79.9 73.6 86.0
.2 78.0 84.0 65.1 86.9 79.1 76.7 80.3 73.9 85.6
.7 82.1 81.0 64.1 85.9 81.8 76.6 81.4 74.6 85.7
.5 80.6 81.6 72.0 87.3 86.5 75.4 81.5 71.9 85.5
.5 79.8 83.8 78.7 85.0 83.1 74.3 80.9 73.3 85.8
.4 80.1 82.6 69.6 86.3 82.5 75.8 81.0 73.5 85.6
.5 79.9 84.5 86.7 - 77.2 80.2 71.1 84.9
.1 82.6 81.6 70.4 86.0 - 77.0 82.4 69.1 84.7
.7 80.8 82.7 78.0 85.1 80.2 77.7 82.0 75.1 85.2
.7 80.8 82.2 77.6 84.4 - 79.5 81.7 72.0 84.5
.5 81.0 82.8 73.6 85.6 79.7 77.8 81.3 71.9 84.9
.2 80.7 .. 78.2 83.4 85.0 81.4 80.4 69.8 84.6
.0 81.1 .. 70.5 84.1 82.1 79.5 82.1 73.2 85.5
.8 80.9 .. 74.4 82.8 81.4 80.3 81.5 71.2 85.6
.5 81.3 .. 71.3 82.3 81.1 79.0 80.6 70.4 84.9
.3 81.0 .. 73.7 83.2 82.2 80.0 81.1 71.1 85.1
Table 2.A1.13. Quarterly participation rates by gender and place of birth in OECD coPercentages
Men
AUS AUT BEL CAN CHE CHL CZE DEU DNK ESP EST FIN FRA GBR GRC HUN IRL ISL ISR ITA LUX MEX NL
Nativ
e-bo
rn
Q1 2009 83.9 79.6 72.9 80.5 .. .. 78.0 82.1 84.3 80.1 76.5 75.5 74.6 82.1 77.6 67.3 76.9 - 65.2 72.5 70.3 82.5 86Q2 2009 83.5 80.8 72.3 82.4 87.1 .. 78.2 81.9 84.7 80.0 76.5 78.7 74.9 81.8 77.7 68.1 77.8 - 66.1 72.6 73.0 82.3 86Q3 2009 83.2 82.1 72.4 82.9 .. .. 78.7 82.5 84.6 79.7 78.5 76.3 75.0 82.1 78.0 68.3 77.7 - 65.8 72.4 72.0 82.9 86Q4 2009 83.5 81.3 73.4 80.4 .. .. 78.7 82.3 83.2 79.2 75.6 74.4 74.8 81.6 77.6 68.2 75.8 - 65.1 72.5 70.3 83.1 852009 83.5 80.9 72.8 81.6 87.1 75.8 78.4 82.2 84.2 79.8 76.8 76.2 74.9 81.9 77.7 67.9 77.0 87.5 65.6 72.5 71.4 82.7 86Q1 2010 83.6 79.4 73.2 79.6 87.9 .. 78.1 82.1 82.9 79.1 76.5 75.0 74.8 81.1 77.7 67.6 75.5 - 65.5 72.5 69.5 82.1 84Q2 2010 83.5 81.0 73.1 82.0 87.6 .. 78.3 82.1 83.2 79.7 75.9 78.2 74.5 81.3 77.6 68.3 77.0 - 66.3 72.3 69.5 83.0 84Q3 2010 83.4 82.0 73.6 82.8 88.3 .. 78.9 82.2 83.0 79.5 76.3 76.9 74.9 82.2 77.4 68.7 77.1 - 66.9 71.2 71.9 82.9 84Q4 2010 83.9 81.4 73.5 80.6 88.1 .. 78.6 82.3 83.1 79.1 76.9 74.9 74.4 81.7 77.2 68.4 75.8 - 65.8 72.0 69.7 82.0 842010 83.6 80.9 73.4 81.3 88.0 .. 78.5 82.2 83.1 79.4 76.4 76.2 74.7 81.6 77.5 68.2 76.3 87.4 66.1 72.0 70.1 82.5 84Q1 2011 83.7 79.7 71.7 80.0 88.3 .. 78.0 82.2 83.1 79.2 77.9 75.7 74.2 81.1 76.8 67.7 75.1 - 65.7 71.9 68.6 81.7 83Q2 2011 83.3 81.1 72.6 82.1 87.9 .. 78.6 82.1 83.0 79.3 77.1 79.4 74.4 81.2 76.7 68.5 76.0 - 66.5 71.6 67.5 82.3 83Q3 2011 82.9 82.0 71.9 82.9 88.6 .. 78.8 82.3 83.3 79.6 77.8 77.4 74.9 81.9 76.5 69.3 76.0 - 66.9 71.5 68.5 82.8 84Q4 2011 83.2 81.2 72.8 80.5 88.4 .. 78.5 82.7 82.7 79.1 77.4 75.8 74.6 81.7 76.0 69.2 76.1 - 65.5 72.2 66.9 82.9 842011 83.3 81.0 72.3 81.4 88.3 75.8 78.5 82.3 83.0 79.3 77.5 77.1 74.5 81.5 76.5 68.6 75.8 87.2 66.2 71.8 67.9 82.4 84Q1 2012 83.1 79.5 71.8 79.5 87.8 .. 78.5 81.9 82.1 78.7 77.6 75.5 74.5 81.3 76.1 69.1 75.3 - .. 72.6 67.3 82.1 85Q2 2012 82.8 81.5 72.7 81.9 87.4 .. 79.1 81.8 82.3 79.2 77.2 79.2 74.8 81.8 76.3 70.1 76.0 - .. 73.0 69.2 83.1 84Q3 2012 82.7 82.6 72.7 82.6 89.2 .. 79.9 82.5 82.0 79.3 79.0 77.4 75.4 82.5 76.1 70.9 76.7 - .. 72.6 69.3 83.6 85Q4 2012 83.1 81.3 72.5 80.6 89.0 .. 79.7 82.3 81.8 78.7 78.2 75.5 75.3 82.2 76.2 71.0 75.3 - .. 73.1 69.6 82.5 852012 82.9 81.2 72.4 81.2 88.4 .. 79.3 82.1 82.1 79.0 78.0 76.9 75.0 82.0 76.2 70.3 75.8 86.7 .. 72.8 68.9 82.8 85Q1 2013 83.2 79.6 71.7 79.5 88.3 .. 79.7 81.9 82.0 78.7 78.4 75.1 75.0 81.6 76.0 70.0 75.1 - .. 72.4 67.3 81.8 85Q2 2013 82.9 80.7 73.3 81.9 87.4 .. 80.2 82.2 81.1 78.7 78.3 79.3 75.1 81.9 76.4 71.4 76.3 - .. 72.2 67.0 82.6 85Q3 2013 82.8 82.0 72.6 82.5 88.1 .. 80.7 82.3 81.4 79.2 78.7 77.3 75.2 82.7 76.4 72.3 76.6 - .. 72.0 69.7 82.7 85Q4 2013 83.0 81.4 72.3 80.7 88.3 .. 80.5 82.5 80.3 78.7 78.0 74.8 74.8 82.3 75.9 71.9 76.0 - .. 72.8 69.3 82.9 852013 83.0 80.9 72.5 81.1 88.0 .. 80.3 82.2 81.2 78.8 78.3 76.6 75.0 82.1 76.1 71.4 76.0 88.0 .. 72.3 68.3 82.5 85
Fore
ign-
born
Q1 2009 80.6 79.2 73.8 82.4 .. .. 80.2 81.9 80.4 88.2 82.5 78.1 76.6 83.4 89.6 81.6 83.0 - 74.6 85.4 81.3 69.1 81Q2 2009 80.6 81.0 72.4 83.0 89.6 .. 82.1 82.3 78.0 87.6 86.1 84.7 76.1 81.8 89.7 82.3 84.0 - 74.9 85.5 84.2 67.4 80Q3 2009 80.1 82.5 74.3 83.2 .. .. 81.4 82.5 85.2 85.9 82.2 81.2 76.1 83.6 90.2 79.6 82.5 - 74.2 85.6 82.9 71.4 80Q4 2009 80.3 82.0 72.8 82.3 .. .. 82.1 82.3 83.3 86.5 83.1 78.3 76.4 80.9 89.6 79.9 81.5 - 73.5 84.8 83.5 72.8 802009 80.4 81.2 73.3 82.7 89.6 79.3 81.5 82.2 81.8 87.0 83.6 80.6 76.3 82.4 89.8 80.9 82.8 89.9 74.3 85.3 83.0 70.3 80Q1 2010 81.4 79.1 72.1 81.3 88.4 .. 81.9 83.1 84.7 86.7 75.2 80.2 76.1 80.5 90.4 76.4 80.1 - 72.6 83.9 83.7 68.9 76Q2 2010 80.4 80.7 74.3 83.0 89.6 .. 83.4 82.8 80.3 87.4 78.1 85.4 77.1 81.9 90.3 73.9 81.3 - 74.8 84.9 82.1 69.6 79Q3 2010 80.8 81.8 74.8 84.2 90.1 .. 85.3 83.7 76.9 87.7 81.6 81.1 77.3 83.4 90.9 74.1 81.4 - 75.9 84.9 82.9 74.5 78Q4 2010 81.9 80.8 74.6 82.5 88.7 .. 84.7 83.0 77.2 86.8 83.3 78.1 76.9 82.5 90.2 75.2 80.7 - 74.4 84.7 84.0 76.3 792010 81.1 80.6 74.0 82.8 89.2 .. 83.8 83.1 79.7 87.1 79.6 81.2 76.9 82.1 90.4 74.9 80.9 89.3 74.4 84.6 83.2 72.3 78Q1 2011 82.6 80.6 72.4 81.1 88.9 .. 84.4 83.0 75.5 85.5 81.0 77.7 76.7 82.6 89.4 74.8 78.5 - 73.5 83.0 84.6 71.7 78Q2 2011 81.5 82.6 71.9 82.4 89.7 .. 86.1 84.0 76.2 85.9 79.7 80.7 76.9 83.2 89.1 77.2 79.9 - 75.5 84.7 82.1 72.0 77Q3 2011 81.9 81.2 72.8 82.9 90.2 .. 86.1 83.6 77.9 86.1 84.9 79.7 76.6 83.3 89.2 82.2 80.9 - 76.0 83.3 82.2 69.8 78Q4 2011 81.6 81.5 73.0 81.8 90.2 .. 85.3 84.2 77.2 86.1 84.2 80.0 75.6 83.0 89.1 77.6 79.5 - 74.9 83.7 82.4 69.8 792011 81.9 81.5 72.5 82.0 89.8 82.6 85.5 83.7 76.7 85.9 82.5 79.5 76.4 83.0 89.2 78.1 79.7 88.2 75.0 83.7 82.8 70.8 78Q1 2012 82.9 79.8 73.7 81.7 89.5 .. 84.7 83.9 77.8 85.7 81.4 79.0 77.2 83.3 88.5 78.9 79.0 - .. 82.9 84.8 69.8 79Q2 2012 82.4 83.6 70.8 83.3 89.8 .. 84.6 83.7 75.5 85.8 85.7 81.1 77.2 83.4 88.2 82.3 79.9 - .. 83.8 82.2 70.9 80Q3 2012 82.0 84.0 72.2 84.2 90.2 .. 86.9 84.5 76.2 85.9 83.7 81.5 78.3 84.6 89.6 84.2 79.8 - .. 81.4 83.5 67.4 79Q4 2012 82.9 82.0 74.4 83.0 89.5 .. 86.8 84.0 76.0 85.3 81.9 80.4 79.4 83.8 90.0 82.0 80.0 - .. 82.4 84.1 69.7 782012 82.5 82.3 72.8 83.0 89.7 .. 85.7 84.0 76.4 85.7 83.1 80.5 78.0 83.8 89.1 81.9 79.6 90.3 .. 82.6 83.7 69.4 79Q1 2013 83.5 81.8 75.1 82.2 89.4 .. 86.6 83.4 75.9 85.6 81.4 79.3 78.7 82.7 90.3 83.6 79.3 - .. 82.2 84.5 71.1 79Q2 2013 83.2 83.2 73.0 83.8 89.9 .. 86.4 83.8 75.8 84.5 85.4 83.3 79.0 82.8 89.7 84.6 81.0 - .. 82.0 83.7 72.6 79Q3 2013 81.8 83.3 74.2 84.7 90.1 .. 87.4 84.1 76.3 85.3 78.8 81.4 79.1 85.3 89.7 86.9 82.2 - .. 81.0 86.1 75.4 78Q4 2013 81.8 81.1 73.4 82.3 90.0 .. 87.4 83.5 75.5 84.6 78.4 78.2 79.1 83.7 90.0 86.5 81.2 - .. 80.6 85.4 74.1 802013 82.6 82.3 73.9 83.3 89.8 .. 87.0 83.7 75.9 85.0 80.9 80.5 79.0 83.6 89.9 85.3 80.9 91.0 .. 81.4 84.9 73.3 79

2.LA
BO
UR
MA
RK
ETIN
TEG
RA
TIO
NO
FIM
MIG
RA
NT
SA
ND
TH
EIRC
HILD
REN
:DEV
ELOPIN
G,A
CT
IVA
TIN
GA
ND
USIN
GSK
ILLS
INT
ERN
AT
ION
AL
MIG
RA
TIO
NO
UT
LOO
K2014
©O
ECD
2014132 untries, 2009-13 (cont.)
D NOR NZL POL PRT SVK SVN SWE TUR USA
.8 77.4 74.3 57.5 68.4 60.2 67.2 77.7 24.9 68.7
.6 77.7 73.4 57.6 68.0 60.2 67.8 79.9 28.4 69.2
.8 77.1 73.7 58.2 68.3 61.0 69.1 78.7 29.3 69.0
.8 76.5 74.6 58.2 68.7 61.1 68.3 76.7 28.1 68.0
.8 77.2 74.0 57.9 68.3 60.6 68.1 78.2 27.7 68.7
.1 76.0 74.3 58.6 69.2 61.1 67.2 77.5 27.8 68.0
.4 76.7 73.5 59.2 69.2 61.1 68.2 79.9 30.5 68.3
.0 76.3 73.6 59.5 69.2 61.8 67.3 79.7 30.5 68.5
.4 75.8 74.0 59.0 68.7 61.6 67.4 78.1 29.3 67.9
.1 76.2 73.9 59.0 69.1 61.4 67.5 78.8 29.5 68.1
.2 76.0 74.5 58.9 69.0 61.0 65.8 79.0 29.1 67.6
.6 76.5 73.2 59.2 69.2 60.6 66.3 81.0 32.2 67.7
.8 76.5 72.9 59.6 68.7 61.2 67.1 80.6 32.3 68.0
.6 75.8 73.9 59.8 68.5 61.3 67.9 78.9 30.5 67.2
.8 76.2 73.6 59.4 68.8 61.0 66.8 79.9 31.0 67.6
.6 76.0 73.9 59.7 69.0 61.6 67.7 79.2 29.5 67.0
.7 76.8 73.4 60.0 69.3 61.6 66.5 81.5 32.5 67.4
.0 76.9 73.5 60.1 69.3 62.0 67.3 81.6 32.3 67.7
.5 76.4 72.5 60.1 69.0 61.5 67.1 79.2 32.4 67.2
.0 76.5 73.3 59.7 69.2 61.7 67.1 80.1 31.7 67.3
.6 76.6 .. 59.4 68.9 62.4 66.9 79.8 31.8 66.6
.6 76.7 .. 59.8 69.1 62.0 66.7 82.0 34.4 67.4
.6 77.1 .. 60.6 69.4 62.6 68.0 81.9 33.7 67.3
.3 76.6 .. 60.8 70.1 62.7 66.4 80.5 32.8 66.8
.5 76.8 .. 60.1 69.4 62.4 67.0 81.1 33.2 67.0
.4 70.9 66.4 45.4 77.0 61.4 65.8 67.4 32.4 63.0
.4 71.7 66.8 41.8 76.8 63.4 64.7 68.4 31.7 63.0
.1 69.5 65.9 42.4 74.8 56.4 67.0 68.1 30.8 63.5
.4 67.6 66.9 47.3 72.9 53.0 65.4 67.3 31.2 63.5
.3 69.9 66.5 44.2 75.4 58.9 65.7 67.8 31.6 63.3
.9 71.1 66.0 43.7 77.0 47.7 67.7 66.5 32.8 63.1
.1 69.8 65.9 47.5 77.7 45.9 70.0 67.7 31.2 63.6
.1 69.7 65.6 57.3 77.7 43.6 62.8 68.4 31.4 63.3
.5 68.6 67.4 49.9 79.3 50.0 65.0 66.4 34.1 64.0
.0 69.7 66.2 49.1 77.9 46.8 66.3 67.3 32.4 63.5
.6 70.6 67.8 52.5 78.9 53.5 64.4 67.8 32.1 62.4
.7 72.2 69.0 59.3 80.7 - 64.2 68.8 29.8 62.2
.1 72.3 68.7 62.0 78.5 60.0 61.5 68.9 30.5 62.5
.0 72.3 68.7 54.2 79.9 64.3 62.5 68.2 32.4 63.4
.4 71.9 68.6 56.8 79.5 59.2 63.1 68.4 31.2 62.6
.2 70.5 70.3 53.4 79.4 64.8 63.4 68.0 37.2 62.6
.4 72.8 70.2 61.5 80.1 61.7 63.7 69.8 39.5 62.4
.6 71.6 70.1 62.8 80.4 66.6 66.7 68.8 35.9 62.3
.4 69.6 70.3 58.4 78.7 69.0 64.7 68.1 37.2 62.8
.7 71.1 70.3 58.5 79.7 65.7 64.6 68.9 37.4 62.5
.2 69.7 .. 54.7 77.7 - 59.7 68.4 38.4 62.3
.4 71.2 .. 62.6 78.3 65.3 64.6 70.4 40.2 61.9
.0 73.0 .. 64.4 77.9 67.7 62.4 70.1 37.3 62.7
.8 71.2 .. 60.9 77.2 65.1 62.4 69.1 33.4 61.6
.1 71.3 .. 60.5 77.8 66.9 62.3 69.5 37.3 62.1
within a given year.
terización Socioeconómica Nacional (CASEN); Mexico: Encuesta
1 2 http://dx.doi.org/10.1787/888933157963
Table 2.A1.13. Quarterly participation rates by gender and place of birth in OECD coPercentages
Women
AUS AUT BEL CAN CHE CHL CZE DEU DNK ESP EST FIN FRA GBR GRC HUN IRL ISL ISR ITA LUX MEX NL
Nativ
e-bo
rn
Q1 2009 72.8 70.8 62.3 74.8 .. .. 60.9 72.8 77.9 70.2 62.8 72.9 66.7 70.6 55.7 54.6 61.6 - 59.5 50.7 55.0 44.8 75Q2 2009 73.0 71.3 62.5 76.1 78.6 .. 61.2 73.2 78.9 69.4 63.2 75.7 67.4 70.3 56.0 54.8 62.3 - 59.6 50.6 57.5 45.3 75Q3 2009 72.3 72.3 63.0 76.2 .. .. 61.8 73.2 78.6 69.6 63.1 73.7 67.7 70.9 56.4 55.3 62.9 - 59.1 49.7 58.0 47.3 75Q4 2009 72.4 70.3 62.6 74.9 .. .. 61.8 73.9 77.3 69.5 63.5 72.4 67.1 70.6 56.2 55.7 61.6 - 59.1 50.4 55.1 47.0 752009 72.6 71.1 62.6 75.5 .. 47.0 61.4 73.3 78.2 69.7 63.2 73.7 67.2 70.6 56.1 55.1 62.1 80.9 59.3 50.4 56.4 46.1 75Q1 2010 72.1 70.1 63.8 74.5 78.4 .. 61.2 72.5 77.0 71.3 63.8 71.7 67.2 70.2 56.6 56.0 61.1 - 58.5 50.3 54.4 45.4 76Q2 2010 72.3 69.8 61.9 76.0 77.2 .. 61.3 72.3 78.1 70.8 64.1 75.0 67.2 70.0 57.0 56.3 62.4 - 59.1 50.5 54.8 46.3 76Q3 2010 72.4 71.2 63.2 76.3 78.0 .. 61.6 72.5 77.5 69.6 64.2 72.9 67.8 70.8 57.2 56.9 62.4 - 60.4 49.5 55.4 46.2 74Q4 2010 72.5 70.5 63.9 75.1 77.9 .. 61.9 73.0 76.2 65.0 70.0 71.7 66.8 70.3 57.2 56.7 61.8 - 60.9 51.0 54.6 44.9 742010 72.3 70.4 63.2 75.5 77.9 .. 61.5 72.6 77.2 64.3 70.4 72.8 67.1 70.3 57.0 56.5 61.9 81.6 59.7 50.3 54.8 45.7 74Q1 2011 72.4 70.3 62.1 74.9 78.6 .. 61.8 72.9 77.0 65.0 70.3 71.8 66.6 70.4 57.0 56.0 61.0 - 59.5 50.4 55.6 44.8 74Q2 2011 72.5 70.3 62.7 76.3 78.5 .. 62.1 73.2 77.4 65.5 71.6 74.8 66.8 70.4 56.8 56.6 62.0 - 59.5 50.4 53.3 45.9 74Q3 2011 72.6 71.3 63.8 76.1 78.2 .. 62.5 73.7 78.0 65.7 72.7 73.7 67.6 70.9 57.1 57.1 61.8 - 59.5 49.9 56.5 46.4 74Q4 2011 72.7 70.9 63.0 74.7 79.2 .. 62.5 74.0 77.0 65.8 70.8 71.7 67.4 71.0 57.6 57.3 61.6 - 59.9 51.7 55.4 47.7 752011 72.6 70.7 62.9 75.5 78.6 49.0 62.2 73.5 77.3 65.5 71.3 73.0 67.1 70.7 57.1 56.7 61.6 81.5 59.6 50.6 55.2 46.2 74Q1 2012 72.6 71.0 62.4 74.5 78.4 .. 62.5 72.9 77.1 66.4 71.8 72.4 67.1 71.1 57.8 57.3 61.3 - .. 52.6 55.5 46.1 75Q2 2012 72.8 71.3 62.4 75.9 77.9 .. 63.2 73.1 77.8 66.6 72.1 75.3 67.6 71.1 58.0 58.0 61.7 - .. 52.9 55.6 47.7 75Q3 2012 72.4 73.0 63.9 76.0 79.0 .. 64.0 73.5 77.2 66.9 71.6 74.9 68.2 71.8 58.2 58.9 61.8 - .. 52.0 60.1 48.0 76Q4 2012 72.7 71.9 63.8 75.0 78.7 .. 64.5 73.8 75.9 66.9 70.1 72.0 68.4 72.1 58.3 58.5 61.8 - .. 53.2 57.3 47.3 762012 72.6 71.8 63.1 75.4 78.5 .. 63.6 73.3 77.0 66.7 71.4 73.7 67.8 71.5 58.0 58.2 61.6 82.5 .. 52.7 57.2 47.3 76Q1 2013 72.5 71.6 63.1 75.0 79.6 .. 64.5 73.9 76.2 67.6 71.1 73.1 67.9 71.9 57.7 57.9 61.8 - .. 53.0 56.3 46.2 76Q2 2013 72.8 72.3 63.8 76.2 78.9 .. 65.0 73.9 77.2 67.7 71.9 75.6 68.2 71.7 58.1 58.4 63.1 - .. 52.6 57.9 47.8 76Q3 2013 72.4 73.6 65.5 76.3 79.2 .. 65.3 74.2 77.8 67.7 70.9 73.5 68.6 72.4 57.9 58.9 62.9 - .. 51.8 55.0 47.7 76Q4 2013 72.7 72.7 63.8 75.2 80.2 .. 65.5 74.6 75.9 68.1 72.0 72.7 68.7 72.1 57.6 59.3 62.5 - .. 53.2 59.9 48.0 762013 72.6 72.6 64.1 75.7 79.4 .. 65.1 74.2 76.8 67.8 71.5 73.7 68.3 72.0 57.8 58.6 62.5 83.2 .. 52.6 57.3 47.4 76
Fore
ign-
born
Q1 2009 64.6 62.3 53.6 69.3 .. .. 64.5 62.8 69.0 77.4 73.0 72.2 59.6 62.6 57.8 63.9 62.9 - 63.0 56.9 69.1 33.0 64Q2 2009 63.7 62.4 49.8 70.4 73.3 .. 65.5 63.1 71.5 76.0 71.9 70.4 59.5 62.7 59.5 65.1 64.2 - 62.1 58.6 63.8 38.0 62Q3 2009 63.3 62.3 50.5 70.7 .. .. 63.7 63.4 73.1 75.9 72.5 69.6 58.6 63.2 60.7 67.4 64.6 - 64.4 56.5 64.0 37.6 63Q4 2009 64.0 63.5 53.0 70.3 .. .. 61.5 63.4 66.4 76.5 72.0 68.8 58.6 63.4 61.1 65.8 62.5 - 64.0 58.8 67.4 31.5 632009 63.9 62.6 51.7 70.2 .. 62.8 63.8 63.2 70.0 76.4 72.4 70.2 59.1 63.0 59.8 65.5 63.5 85.0 63.4 57.7 66.1 34.9 63Q1 2010 63.6 63.7 54.7 70.2 72.0 .. 60.4 61.6 65.2 74.2 73.7 68.1 59.1 62.9 61.8 67.0 61.2 - 63.3 58.3 67.5 35.2 63Q2 2010 63.4 63.7 52.8 71.0 73.4 .. 61.5 62.9 69.7 74.3 73.2 67.2 59.4 63.7 62.3 69.8 63.0 - 63.4 58.4 65.0 35.2 64Q3 2010 64.1 65.2 55.1 71.0 73.9 .. 63.2 63.1 71.9 77.8 73.9 64.1 58.8 64.4 62.7 70.4 62.3 - 64.1 55.5 67.0 31.1 63Q4 2010 65.7 66.0 55.2 69.1 72.8 .. 63.4 62.2 66.2 72.7 71.7 62.5 59.9 63.6 62.2 62.7 62.2 - 65.0 56.3 67.5 32.6 622010 64.2 64.7 54.5 70.3 73.0 .. 62.1 62.4 68.2 73.4 74.5 65.4 59.2 63.7 62.2 67.4 62.2 83.7 63.9 57.1 66.8 33.6 63Q1 2011 65.7 65.0 51.1 68.9 71.7 .. 62.5 62.7 67.3 73.2 71.0 61.4 60.8 64.1 62.2 61.2 62.0 - 64.5 58.2 70.3 36.4 63Q2 2011 65.6 63.8 53.7 69.2 71.9 .. 60.2 64.2 68.4 74.7 72.0 65.5 60.2 63.9 61.2 60.8 63.8 - 64.6 58.5 67.8 38.0 61Q3 2011 65.6 64.1 51.0 70.3 72.8 .. 59.7 64.6 70.2 73.2 75.0 66.0 59.3 65.2 60.0 59.1 63.6 - 63.8 55.6 65.4 44.2 61Q4 2011 65.0 65.6 52.4 69.8 73.3 .. 60.5 63.3 67.3 72.6 71.9 67.2 59.0 64.0 61.3 62.0 63.1 - 64.2 58.0 64.8 46.8 632011 65.5 64.6 52.1 69.6 72.4 64.7 60.7 63.7 68.3 73.4 72.5 65.1 59.8 64.3 61.2 60.8 63.1 83.6 64.3 57.6 67.0 41.4 62Q1 2012 65.1 65.0 51.6 68.9 73.7 .. 60.8 63.1 67.8 73.8 72.3 67.0 59.6 62.5 60.9 61.6 63.2 - .. 59.2 67.7 43.0 63Q2 2012 65.3 64.4 52.5 70.7 73.8 .. 61.3 64.9 68.3 73.3 72.4 70.3 59.4 63.1 61.0 65.3 64.1 - .. 59.1 67.8 46.6 63Q3 2012 65.6 63.8 53.3 71.4 74.0 .. 61.9 64.3 69.0 72.7 73.2 69.2 59.1 64.6 62.7 65.6 63.8 - .. 57.5 70.1 45.2 64Q4 2012 65.5 63.8 54.5 71.1 74.8 .. 61.8 64.9 65.3 73.6 70.0 67.7 58.4 65.3 63.0 68.1 61.9 - .. 59.7 69.4 45.7 632012 65.4 64.2 53.0 70.5 74.1 .. 61.5 64.3 67.6 73.4 72.0 68.5 59.1 63.9 61.9 65.1 63.2 84.1 .. 58.9 68.7 45.1 63Q1 2013 66.1 65.0 54.6 70.7 74.5 .. 61.3 64.0 67.4 74.5 76.1 67.5 57.9 65.3 63.7 69.3 62.7 - .. 60.7 69.2 43.1 62Q2 2013 66.1 64.6 52.1 71.4 74.8 .. 65.3 64.8 69.5 73.7 75.4 71.4 57.9 65.3 64.5 64.6 63.6 - .. 59.6 70.3 39.8 62Q3 2013 66.2 65.7 54.6 71.7 74.7 .. 65.2 65.3 68.2 72.8 72.5 67.8 57.7 65.6 66.0 64.7 64.1 - .. 57.6 70.5 43.6 64Q4 2013 65.5 65.4 54.3 70.0 74.8 .. 67.0 63.8 68.1 72.9 71.4 67.8 59.4 65.9 64.7 67.8 62.8 - .. 60.2 67.7 41.2 632013 66.0 65.2 53.9 70.9 74.7 .. 64.7 64.5 68.3 73.5 73.9 68.6 58.2 65.5 64.7 66.6 63.3 84.3 .. 59.5 69.4 41.9 63
Note: Data are not adjusted for seasonal variations. Comparisons should therefore be made for the same quarters of each year, and not for successive quartersInformation on data for Israel: http://dx.doi.org/10.1787/888932315602.Source: European countries and Turkey: Labour Force Surveys (Eurostat); Australia, Canada, Israel, New Zealand: Labour Force Surveys; Chile: Encuesta de CaracNacional de Ocupación y Empleo (ENOE); United States: Current Population Surveys.

International Migration Outlook 2014
© OECD 2014
Chapter 3
Managing labour migration:Smart policies to support
economic growth1
This chapter provides a systematic and comparative overview of labour migrationmanagement, identifying key elements which can help policy makers match concretemeasures to overarching objectives. It discusses how the landscape for labourmigration policy is changing, due to both structural factors and the breakdown oftraditional categories, posing new challenges for policy makers. Labour migrationpolicy can be used to achieve different and sometimes competing goals, and thechapter discusses inherent trade-offs in balancing these policy objectives. Achievinglabour migration policy objectives involves the use of tools, and the chapter discussesmany instruments comprising the policy toolbox, from well-known and broad toolssuch as numerical limits to detailed selection and ranking criteria. The role andapplicability of shortage occupation lists is discussed. Tools are matched to objectives,and the conditions under which the tool may be appropriate, as well as potentialshortcomings, are identified. The chapter underlines the importance of flexibility anddiscusses how to apply these tools to maintain a dynamic management system toreact to changes. The infrastructure needs of a management system are identified,and possible solutions in the case of limited resources are listed.
The statistical data for Israel are supplied by and under the responsibility of the relevant Israeliauthorities. The use of such data by the OECD is without prejudice to the status of the Golan Heights,East Jerusalem and Israeli settlements in the West Bank under the terms of international law.
133

3. MANAGING LABOUR MIGRATION: SMART POLICIES TO SUPPORT ECONOMIC GROWTH
Key policy findings
Migration increasingly contributesto the population and workforcein OECD countries.
Over the period 2002-12 migration accounted, on average, for 59% of population growth
across the OECD, although variations were considerable from country to country. How
migration will continue to contribute to workforce growth in the future is a key question.
Although most immigrants do not come to work…
Labour migration is a common feature of all OECD economies. Even in the depths of the
economic crisis, many workers were recruited from abroad – about 600 000 annually. Yet
labour migrants represent no more than one-third of all permanent migration, and much
less in most OECD countries – about 13% outside Europe. Even considering the roughly two
million temporary workers entering OECD countries each year, most migration comes
through other channels.
… labour migration is where policymakersare held most accountable.
To a considerable extent, labour migration policy is the public face of migration policy, since it
is where choices are most visible and the channel over which governments have the most
control.There is growing demand from the public for migration management and for clarity in
communication from policymakers. While better information systems and statistics mean
that more information than ever before is available about the magnitude and characteristics of
migration flows, it also means more scrutiny from public opinion and greater scope for
evaluation. Policy makers need to get facts across and explain policy decisions.
It is harder than ever to get labour migrationpolicy right.
The rapidly changing economic conditions and skills needs of today’s labour market
complicate efforts by policymakers to get labour migration policy right. Doing so requires a
more smoothly functioning labour market, fewer unfilled vacancies, better skills matching,
and less irregular migration. Public opinion often keenly focuses on migration, putting
pressure on policy makers to ensure that the return to labour migration is visible and that
risks are mitigated.
INTERNATIONAL MIGRATION OUTLOOK 2014 © OECD 2014134

3. MANAGING LABOUR MIGRATION: SMART POLICIES TO SUPPORT ECONOMIC GROWTH
Labour migration is expected to addressmany different goals…
Most OECD countries do not have huge manpower shortages on the horizon. What they do
have is skills mismatches and specific labour needs. While the role that migration is meant
to play in the labour market varies enormously from one country to another, it can
contribute to economic growth everywhere, and “better” labour migration remains a shared
aspiration. While no one expects migration to reverse population ageing, labour migration is
expected to support innovation and the development of knowledge-based societies, and to
address certain shortages related to the changing make-up of the workforce.
… even as traditional policy distinctionshave blurred.
Traditional distinctions which have guided migration policies for decades have become less
helpful. For instance, it is difficult to categorise migrants into basic skill groups – high and
low – when designing migration policies for today’s labour markets, where the skills required
and tasks performed are becoming increasingly complex. Identifying and verifying skills
across borders have also proven increasingly tricky. Similarly, it is hard to distinguish
between temporary and permanent migration systems. Demand- and supply-driven
admission (i.e. where employers and governments choose, respectively) have merged,
making most systems a sort of hybrid. Further, many OECD countries receive more
immigrant workers through family and humanitarian channels than through classic labour
migration, over which they have more discretionary control. In European countries, the free
movement of people for reasons of employment often dwarfs other labour migration flows,
complicating efforts to target policy. Finally, while governments can, in theory, choose who
enters, increasingly their pool of candidates is determined by the choices of other actors,
whose criteria may not support the same policy objectives.
Despite the complexity, a successful policyresponse can be made.
The experience of OECD member countries yields insights into ways of better managing
labour migration for economic growth, while addressing the changing, increasingly complex
policy landscape. Fundamental policy elements and proven good practice will help manage
labour migration better regardless of the political, economic and social settings.
Start with a clear labour migration frameworkand objectives, address possible trade-offs…
Although labour migration is primarily about meeting the needs of employers, it sits at
the nexus of a number of different objectives: short-term labour needs, long-term
demographic and labour force development, wider economic development, investment
and trade policy, sector-specific policy, innovation and productivity, and development
co-operation – to name but a few. One objective may suggest measures which run counter
to another one, requiring an assessment of the trade-offs and promoting coherence across
policy domains.
INTERNATIONAL MIGRATION OUTLOOK 2014 © OECD 2014 135

3. MANAGING LABOUR MIGRATION: SMART POLICIES TO SUPPORT ECONOMIC GROWTH
… and ensure there is policy coherence.
Policy actors in areas related to migration should, at all times, co-ordinate to ensure policy
coherence, especially with relation to domestic education and training. While overall
labour migration brings benefits, not all groups benefit equally. Some may even be
negatively affected, which requires compensatory policies.
Make sure policies are informed by in-depthknowledge of the labour market and its needs.
Management of labour migration requires a clear understanding of how the labour market
is evolving. Such understanding is important for regulating temporary migration for
short-term needs and planning longer-term labour migration. Long- and short-term needs,
in turn, require an understanding of how – in which regions, sectors, and occupations –
demand and supply are changing, and what longer-term labour market prospects
are likely.
Adapt visa categories to today’s realities.
Many migrants go through multiple status changes once in the host country. Most of those
with permanent residence rights were previously temporary. Yet permanent status is no
guarantee that they will stay. Visa categories need to reflect the realities of today. Status
change criteria should be clarified from the beginning so that employers and migrants
understand the pathways to and requirements for transition to permanent residence and
naturalisation. Countries should ensure that their statistical systems capture status changes
and monitor how different programmes contribute to temporary and permanent stay.
The policy toolbox for meeting these goalscontains both old and new elements.
Once a country has drawn up its migration policy framework it has a number of tools it can
use to achieve the objectives it has set. Some tools will have been tried and tested, and
others will be recent innovations. The tools that policy makers use vary, but setting clear
goals makes it easier for them not only to pick the right tools but to evaluate them and
explain them to the public. Whatever migration toolbox they assemble, they should
consider the key tools discussed below.
Numerical limits are appealing but susceptibleto public opinion and difficult to set.
Setting caps on numbers of immigrants is a domestic employment safeguard and a
powerful way to reassure public opinion. However, headline numbers may contribute to
over-politicising labour migration debates and ultimately to making systems less flexible.
The methods of setting numerical limits vary across countries and generally mix
quantitative indicators with reviews and stakeholders’ viewpoints. In some countries, such
as the United States and the United Kingdom, caps are an absolute ceiling. Most
INTERNATIONAL MIGRATION OUTLOOK 2014 © OECD 2014136

3. MANAGING LABOUR MIGRATION: SMART POLICIES TO SUPPORT ECONOMIC GROWTH
settlement countries set numerical targets that are based on long-term forecasts and
processing capacity. Another downside to numerical limits is that, when demand outstrips
availability, not everyone is successful, and picking winners can be difficult. Lotteries are
one way to do that, but they do not select the best candidates. Rankings may be preferable,
but are complex to design and manage. One solution might be the recently introduced
“expression of interest” system, where eligible candidates are picked from a pool so that
admissions are managed within the set limit.
Charging higher costs for internationalrecruitments may achieve a similar safeguardeffect.
Ensuring fairness in the local labour market involves making sure that not only local
workers know about job vacancies but that recruiting abroad should not be employers’ first
choice. Higher costs, longer delays, and other obstacles can indirectly steer employers
towards choosing local workers first. The fees that labour migrants and employers are
charged range from zero to many thousands of dollars across OECD countries. Only a few
countries, such as Israel, deliberately charge high fees to discourage employers from
recruiting foreign workers. Fees do not, in fact, put employers off hiring long-term, highly
paid workers. Nor does it deter them from recruiting workers where there are acute skills
shortages. Although it may make sense for employers to pay more for longer-term permits,
long processing times are usually more of a concern to them than fees.
Labour market tests provide a case-specific meansof protecting local workers, but they are difficultto put into practice.
Labour market tests (LMTs) are another way to ensure local workers’ precedence over
recruits from abroad and to avert any adverse effects on the local labour market. Many
countries require employers to advertise vacancies, usually with public employment
services. Despite decades of experience with labour market tests, there is still debate, even
controversy, over their efficiency and about how to address the trade-off between the need
for prompt responses to job vacancies and the need to give locals the opportunity to see
and apply for a job first. Advertising requirements are in place in most labour market tests,
although the question of where to advertise and how long – and what to do if local
applicants are turned down – remains controversial. Labour market tests, to be legitimate,
should be designed to ensure employers make real efforts to fill positions locally and to
reflect the way vacancies are effectively filled.
A shortage occupation list can focus on immediateand longer term needs.
Shortage occupation lists are useful instruments under certain circumstances. When they
express short-term needs, they complement LMTs, providing the grounds for exempting
employers from the tests or facilitating foreign recruitment. When their focus is on
long-term needs, they provide the facts for employing migrant workers and for
determining whether an application is eligible. They supply the public with evidence that
INTERNATIONAL MIGRATION OUTLOOK 2014 © OECD 2014 137

3. MANAGING LABOUR MIGRATION: SMART POLICIES TO SUPPORT ECONOMIC GROWTH
migration is targeted and not indiscriminate. Lists are, however, exposed to pressure from
interest groups and may deter employers from investing in training workers for
occupations where they have ready access to labour through shortage lists. Potential
migrants may “game” shortage occupation lists to identify easier channels of entry. Most
such risks can, however, be averted by transparent processes and the use of empirical
evidence. Longer-term shortage lists should focus on occupations where there are
structural shortages.
A “points-based” selection system is only as goodas the parameters it includes and the weightsit assigns.
Points-based selection is a feature of migration systems in around 10 OECD countries. In
itself, a points-based system is simply a way to apply multiple, variously weighted criteria,
rather than a guarantee of selecting or favouring the most promising candidates. Designing
an efficient points system takes time and should be built on evidence that explains what
makes migrants succeed in the labour market. Otherwise, a points system may not ensure
migrants end up in employment, especially when it allows migrant candidates into a
country without a job offer. The points-based system may, however, help further other
goals, and can be used as an incentive to encourage workers to learn the language or
acquire country-specific skills (either before they enter or after), if doing so improves their
status or otherwise facilitates their integration.
Salary thresholds are a good proxy for skillsbut cannot be the only admission criteria.
When qualifications are difficult to assess or where they do not exist for a specific
occupation, salary thresholds are a useful gauge of a job’s skill level. However, salary
thresholds, when applied together with other qualification criteria, may penalise younger
workers. While salary tiers add complexity, lower thresholds for younger workers make
sense. Thresholds also require follow-up to ensure that the employer has indeed paid the
promised salary.
Job-search visas can be introduced competitivelyand gradually.
Job-search visas are a way to admit into a country talented people – especially young
people – without experience or a job offer, who would otherwise not be able to enter. The
experience with job-search visas has been mixed. Resource-intensive selection procedures
have not always led to the selection of good candidates. It is difficult to ensure the
departure of recipients of job-search visas who fail to find work. Such visas should
therefore be introduced as capped pilots to test the selection criteria and outcomes.
Nonetheless, a job-search visa can be a good addition to a skill-oriented labour migration
policy, although it is important that both the public and the immigrants themselves
understand that not all visa recipients will be successful, and those who do not find a
qualifying job will have to leave the host country.
INTERNATIONAL MIGRATION OUTLOOK 2014 © OECD 2014138

3. MANAGING LABOUR MIGRATION: SMART POLICIES TO SUPPORT ECONOMIC GROWTH
Investor programmes need oversight.
Most OECD countries have visas for investors who bring substantial capital, although
evidence suggests that not all programmes yield the hoped-for benefits, especially when
thresholds or requirements are low. Due diligence on the origins of funds can be
particularly challenging and require considerable oversight.
International cultural exchange programmescan have significant labour market effects.
Some discretionary migration channels are not primarily designed for labour migration,
but are nevertheless a sizable labour supply. Working holiday programmes and youth
mobility programmes are examples. The employment component in these lightly
regulated programmes has grown, especially as more origin countries are involved. As the
source countries and time spent in work and on holiday changes, the cumulative impact of
such programmes on labour markets, especially on local youth employment, must be
monitored. International students offer another such example as most of them will be
allowed to work at least part-time during their studies.
International students can be better utilisedin labour migration streams.
International graduate students are an appealing source of highly skilled recruits, since they
generally speak the language of the destination country and employers understand their
qualifications. Not all OECD countries, however, specifically consider international students
in their labour migration planning channels. Conditions are more favourable for
international students than for foreign recruits in many OECD countries, but there is often
room for increasing post-graduation stay rates. However, restrictions on the types of jobs
which allow students to stay on could be relaxed in most OECD countries for graduates with
excellent language skills or fields of study where job prospects are good and shortages noted.
Clearer information about staying on after graduation could be provided prior to enrolment
and before graduation to better ensure that students who are interested in remaining do not
miss their chance. In light of the demand for medium-skill occupations that are hard to fill,
countries with apprenticeship systems should allow potential workers to enter
apprenticeship pathways with the promise of being able to stay upon completion – even
if their qualifications are below those of skilled migrant programmes.
Bilateral agreements have a role to playin managing less skilled labour migration,addressing specific skills needs…
Bilateral agreements in the field of labour migration are particularly suited for temporary
and less skilled migration when supply from abroad is much greater than demand, and
where job requirements are less specific than in professions and trades. However, the
supply-demand imbalance heightens the risk of rent seeking, increases the incentive to
INTERNATIONAL MIGRATION OUTLOOK 2014 © OECD 2014 139

3. MANAGING LABOUR MIGRATION: SMART POLICIES TO SUPPORT ECONOMIC GROWTH
overstay, and makes labour migrants vulnerable. Bilateral agreements can address those
risks and improve oversight of recruitment and working conditions. They are not easy to
arrange, though, and work best when negotiated with multiple partners.
… and in reducing the risk of illegal migration.
A persistent challenge in many OECD countries has been to ensure that illegal recruitment
channels are controlled. The risk may be higher for the less skilled and lower wage-
occupations, where there are more aspiring immigrants than jobs available and the risk of
illegal employment practices is greater. Yet it also applies to other categories, including
intra-corporate transfers, business visa holders, and international students who work.
Bilateral agreements have been used to test selection and compliance in seasonal
programmes. Temporary programmes for longer periods have also been trialled with the
emphasis on key features – a large roster of approved candidates, a strong management
and oversight system, and non-punitive compliance incentives. Such programmes are
expensive to run, but reduce costs associated with irregular migration and the illegal
employment of foreigners.
It may be necessary to regularise irregularmigrants to correct past shortcomings in labourmigration frameworks.
The best means to avoid irregular migration is to provide labour migration programmes that
meet demand while preventing the illegal employment of foreigners. Where programmes
have been unable to meet those conditions and numbers of undocumented labour migrants
have ballooned, it may be necessary to regularise them along with policy reform.
Regularisation is difficult to design and manage, but evidence suggests that clear rules and a
realistic means of maintaining the post-regularisation legal status are successful elements.
One alternative to broad one-off regularisation programmes is to grant status on the basis of
a history of employment. It could slow the growth in undocumented labour migrants,
especially where they fill structural gaps in the labour market.
Dynamic management means not settingmechanisms in stone.
One lesson of the crisis years is that the levers of labour migration policy can be adjusted
to useful effect without necessarily forcing a reversal of the policy infrastructure. The
dynamic management of migration also means discarding or modifying tools in the policy
toolbox as the situation requires, while keeping a focus on the policy objectives. It is
important not to set mechanisms in stone, create path dependency, or confuse the
mechanism with the goal it is meant to achieve.
INTERNATIONAL MIGRATION OUTLOOK 2014 © OECD 2014140

3. MANAGING LABOUR MIGRATION: SMART POLICIES TO SUPPORT ECONOMIC GROWTH
Evaluation and monitoring must be builtinto the process.
As policy experimentation leads to complex and rapidly adjusted initiatives, it may
occasionally outstrip the capacity to evaluate. Indeed, many of today’s labour migration
programmes have not been evaluated. Once goals are set, it is important to evaluate
whether a programme is achieving its goals. Investing in an evaluation and monitoring
capability is vital to informing choices more effectively. In this context pilot programmes
can be useful for testing whether a programme can achieve its goals and building public
consensus around initiatives.
Countries should play to their unique advantages.
While all OECD countries are interested in attracting labour migrants, not all are
competing for the same type or have the same benefits to offer. Yet almost all
OECD countries have comparative advantages which they can leverage to attract certain
migrants. Understanding the economic and non-economic factors that draw migrants can
help countries target their policies towards those most likely to contribute to economic
growth. Strength may lie in quality of life, gender equality, safety, education opportunities,
work/life balance, language, innovation, and many other factors.
Good policy requires sound implementationand service infrastructure…
Proper rationalisation of procedures and customer-focused delivery help realise policy
intent more effectively. Smart tools, adequately trained staff, well signposted information,
and the means and the will to ensure compliance make the migration process work better
for all actors.
… and stakeholder involvement, especiallyemployers, educators, and intermediaries.
Compliance with regulations governing migration applies to all stakeholders. It is clearly
easier to enforce, however, if rules meet stakeholders’ needs. That is especially true for the
principal direct beneficiaries of labour migration in destination countries – employers.
Ensuring that they have a voice in the decision-making process is critical. Compliance
mechanisms need also to be developed with trade unions. Similarly, recruitment agents
and immigration advisers play an influential role in sustaining the supply chain and need
to be included in oversight and integrity measures. While a number of OECD countries
have regulated labour migration intermediaries, they are not indispensable. Transparency
and simplicity can reduce the need for them.
INTERNATIONAL MIGRATION OUTLOOK 2014 © OECD 2014 141

3. MANAGING LABOUR MIGRATION: SMART POLICIES TO SUPPORT ECONOMIC GROWTH
Target groups would benefit from improvingemployer-worker matching.
The bulk of OECD countries admit labour migrants only, or mostly, with a job offer in hand.
In countries aiming to access international talent and meet demand which cannot be
satisfied locally, employers are not always active in going global. There are a number of
means of doing so, and matching tools can help. Matching tools can include pools of
candidates selected either with public infrastructure or through private agencies. SMEs
would benefit especially from assistance in identifying candidates, since they do not have
the advantages of larger firms (HR departments, economies of scale, a reputation with
candidates) or multinationals (who further benefit from a shared language and existing
pools of recruits). As a matter of fairness, favourable conditions for intra-company transfers
should not be at the expense of efforts to support access to recruits by small firms.
Simple, transparent procedures easethe processing burden and improve equalityof access.
Admission categories vary enormously from one country to another. Transparency,
however, remains a criterion for evaluating systems and a benchmark for all users of the
system. Clear criteria reduce refusal rates and lower costs. SMEs report the most difficulty
in filling positions and benefit most from better information, orientation, and simpler
processes. The involvement of intermediaries in procedures can be an indicator that the
system is too complex for users.
Use technology better to improve processing times,customer service, and compliance.
The processing of migrants’ applications should seek to move as many processes as
possible online and collate the key information (education, occupation, region of
employment, and applicants’ wage data) necessary for efficiency, integrity, risk triage and
analysis. The use of technology also allows applicants to track their applications and status
and reduce the risk of rent-taking by private intermediaries.
Fees can be used in a more targeted way.
Migration involves high costs, but in most OECD countries they are further inflated by
intermediaries. Simplifying procedures and making them more transparent can reduce the
role of mediators and allow some of the associated costs to be recovered by public agencies
for investment in service quality. Processing efficiency can also be supported by charging
higher filing costs for paper applications, for example.
INTERNATIONAL MIGRATION OUTLOOK 2014 © OECD 2014142

3. MANAGING LABOUR MIGRATION: SMART POLICIES TO SUPPORT ECONOMIC GROWTH
There is little justification for a labour migrationbacklog in today’s world.
In countries where selection processes are restrictive, the large number of eligible migrants
often leads to backlogs. Backlogs prevent new applications, put countries at a disadvantage
in competing for workers, increase processing costs, and reduce public support for the
migration system in general. Recently developed mechanisms to avoid backlogs – rankings
and expressions of interest – can also be a solution to issues of fairness. When candidates
have broadly similar profiles, lotteries ensure equity because all are equal in a game of
chance. Participants may not necessarily support that solution.
Countries with no language basin abroadmay have to provide incentives and supportfor labour migrants to learn their language,before or after arrival.
For many countries, language skills are the single largest barrier for businesses trying to draw
on a global talent pool. For English-speaking countries, and to a lesser extent French and
Spanish-speaking countries, labour migration is much facilitated by the wide pool
of language speakers in origin countries. For other countries, language learning is a
country-specific investment which can improve outcomes, productivity, employer
satisfaction, and retention. Strong interest in migration in origin translates into a willingness
to invest in language training if it enhances migration opportunities. This willingness can be
leveraged to expand language knowledge prior to migration. There is a role for public
involvement in supporting language infrastructure in the country of origin and helping
employers arrange workplace language training once migrants have arrived.
Employer compliance mechanisms are essential,especially for employers of migrants in less skilledoccupations.
Employer-driven admission is based on the conditions of employment. Review of job
conditions and employer legitimacy generally occurs prior to first approval, and follow-up
in many countries is less thorough. Yet tax records and more active reviews can ensure that
workers are properly paid and safeguards respected. For employment in less skilled
occupations, where the potential for abuse is greater, close supervision is required,
including site visits. Temporary programmes – including, but not limited to, seasonal
programmes – can include exit interviews and other forms of enforcement. Some countries
have adopted sponsorship approval, introduced systems to favour high compliance, or
worked with trusted employers.
INTERNATIONAL MIGRATION OUTLOOK 2014 © OECD 2014 143

3. MANAGING LABOUR MIGRATION: SMART POLICIES TO SUPPORT ECONOMIC GROWTH
Box 3.1. Key policy principles for labour migration management
Develop a clear labour migration framework
● Be aware of multiple goals, both economic and otherwise, and communicate goals andtrade-offs explicitly.
● Prioritise goals and ensure policy coherence from a labour migration perspective, takinginto account domestic education and training and labour market effects.
● Ensure visa categories take into account multi-step migration and the passage fromtemporary to permanent migration.
● Base labour migration objectives on knowledge of the labour market and its changingdemands. Build flexibility into tools.
Assemble a policy toolbox that has a range of instruments for different objectives
● Design labour market tests and their complement – shortage lists – in response to howvacancies are really filled.
● Pilot job-search visas for labour migrants who do not fit into traditional categories withthe knowledge that not all recipients will be successful, and that those who are not willhave to leave.
● Introduce matching tools to complement the market for certain regions, occupations,and employers.
● Leverage the interest in migration in origin countries to promote language andvocational training specific to the destination country.
● Curb illegal migration by considering legal recruitment channels – including bilateralagreements and post-entry follow-up – for occupations where illegal employment is aproblem.
Improve admission criteria and adopt a dynamic approach to migration management
● Use skill thresholds for migration which take into account the whole spectrum of skills.
● Use salary thresholds as a proxy for skills where other means of verification are inadequate,but fine-tune them so that they take into account age differences and other factors.
● Calibrate the points and weights in points-based systems using empirical evidence ofwhich attributes contribute to sustainable employment and longer-term positiveoutcomes.
● Conduct evaluation to inform public discourse and feed results back into policy designand the choice of appropriate tools.
Modernise service infrastructure
● Rationalise procedures, focus delivery on the customer, ensure trained staff, andsignpost information.
● Make pathways and chances of transition transparent and upfront for both migrantsand employers.
● Where possible deploy online technologies and, over other channels, provide incentivesfor their use in order to reap maximum efficiency gains and minimise the burden onmigrants and administrative staff.
● Charge employers and migrants proportionately for client services and use revenues toimprove capability for processing and decision making.
● Ensure compliance mechanisms are in place, especially for employers dealing withvulnerable workers.
INTERNATIONAL MIGRATION OUTLOOK 2014 © OECD 2014144

3. MANAGING LABOUR MIGRATION: SMART POLICIES TO SUPPORT ECONOMIC GROWTH
IntroductionWith public opinion and a wide range of stakeholders closely scrutinising the way it is
managed, labour migration is a high-stakes issue. It is no surprise, then, that most
OECD countries have been adjusting, reforming, and even reformulating their migration
policies at an accelerating rate.
However, policy making is difficult in today’s labour migration landscape, for it is more
challenging than in previous decades. The nature of labour market demand has changed,
with skills mismatches now mattering more than general manpower shortages. Post-crisis
labour demand has grown in some areas but remains very slack in others. Migrants cut a
more diverse profile than ever before, coming from a wider range of countries and different
education and skills backgrounds. In expanded free movement areas, discretionary labour
migration now merely complements the larger, more fluid labour supply.
The policy environment in all OECD countries is marked by public scrutiny of
migration and its outcomes. Never before has there been so much information about the
number and nature of migrants, their employment choices, and outcomes. Public opinion
demands greater accountability from policy choices, even as it becomes more difficult to
sift through evaluations and statistics.
Most immigrants come not to work, but for family and humanitarian reasons or from
freedom of movement areas. While about 600 000 permanent labour migrants arrive
annually in OECD countries, they account for less than 40% of migration in European
countries and for 13% in the rest of the world. Temporary labour migration – which
includes seasonal workers and working holiday makers – runs at higher levels – some
2 million workers annually.
However, even if labour migration is not the largest channel, it is often the most
visible. It is also the one most closely associated with policy choices, since it is directly
under government control and regulation.
The management of labour migration cannot stand still in the face of structural changes
in the labour market and the make-up of the working-age population, in demographic
trends, and in growing competition. At the same time, not all policy changes have been
successful and, given the risks of poorly managed labour migration – first and foremost,
irregular immigration – it is essential that policy be based on what has proven effective.
This chapter discusses the choices facing policy makers and the solutions they have
tried or are exploring for the first time. No OECD country allows completely unrestricted
entry or recruitment, just as none locks its doors to international recruitment. Yet on
the continuum between those two extremes, the distribution of policy settings is,
unsurprisingly, very wide. The question is not so much whether more or less migration is
the right choice, but what goals are appropriate for labour migration policy, and how they
can be achieved while minimising risks and maximising returns.
Rather than a how-to guide for admitting foreign workers, the chapter seeks to
identify the major shifts in the labour migration landscape that policy making must
incorporate, the competing policy goals it must balance, and how different tools can help
achieve its set objectives.
INTERNATIONAL MIGRATION OUTLOOK 2014 © OECD 2014 145

3. MANAGING LABOUR MIGRATION: SMART POLICIES TO SUPPORT ECONOMIC GROWTH
The changing landscape of labour migration
Migration to OECD countries in a context of structural change
Some structural features underlie the labour migration landscape. Although the
general demographic scenario in OECD countries has changed little in the past five years,
population ageing is still a concern in most European and Asian OECD countries. By 2020,
retiree cohorts are projected to be, on average, 17% larger than youth cohorts across the
OECD, with the gap much wider in some countries than others.
In Germany and Japan, for example, population ageing is already a driving factor in the
changing labour force and behind the search for adequate activation policies for the years
to come. And although it is not a major consideration in the medium term elsewhere, the
general issue of demography nevertheless looms in the background.
While migration already contributes to population growth – 59% between 2002
and 2012 across the OECD – it is not a solution to population ageing, as migrants
themselves age. It can, however, cushion the impact when combined with other policies.
Changes in the nature of employment and labour market participation are more dynamic
than those in the population and labour force (OECD, 2012c) which are relatively slower and
more predictable. Not only is there now a substantial margin for increasing the
employment rates of women and older people, the current downturn has also seen youth
unemployment soar. Such labour market slack delays the urgency of counteracting ageing.
Another structural issue is the changing nature of skills in labour supply and demand.
Demand is shifting towards more highly skilled occupations. Over the 2000s in Europe, for
example, their share of employment rose by 6%, while medium- and low-skilled jobs fell
by 4% and 2%, respectively. Yet expected gaps in the labour market paint an even more
complex picture. Rising educational attainment among young people in OECD countries
– along with shrinking youth cohorts – is yielding smaller pools of less well educated
workers just at a time when the older generation with low education levels moves into
retirement. In fact, trends in the last decade and projections for OECD Europe point to a
surplus of low-qualified workers becoming a deficit by 2020, as their aggregate
employment drops from 60 to 40 million. The opposite is true for highly qualified workers,
whose total employment is forecast to rise from 49 to 78 million, with a shortfall in supply
of several million. More immediately, certain occupations remain hard to fill, suggesting a
persistent problem of skills mismatches.
Today’s policy landscape is more complex than in the past
Migration policy has traditionally involved a series of apparently distinct choices that
reflect different underlying concepts.2 The chief distinctions separate permanent
from temporary migration, labour migration from other forms, discretionary from
non-discretionary control, and highly skilled from low-skilled labour. The distinctions are
indeed useful. They underlie policy planning and determine migration visa categories,
permit classes, and entitlements or benefits. Legislation can reflect them clearly, and
regulations – e.g. duration of permits and education admission requirements – do in fact
formalise them in concrete fashion.
Discretionary and non-discretionary categories are no longer so distinct
Labour migration is discretionary because, unlike other categories of migration,
governments can easily regulate and restrict it. Yet migration for employment is not about
INTERNATIONAL MIGRATION OUTLOOK 2014 © OECD 2014146

3. MANAGING LABOUR MIGRATION: SMART POLICIES TO SUPPORT ECONOMIC GROWTH
labour migrants alone. Not only are there many non-labour migrants in the labour market,
non-labour flows are built into labour supply projection models in countries such as
Norway and Australia. Labour migration is also a category that encompasses many
different forms of migration – ranging from traditional contract and seasonal workers and
selected economic migrants to intra-corporate transfers, posted workers, and even
investors, entrepreneurs, and the self-employed.
In addition, countries do not always enjoy full discretion over labour migration
inflows. They have little control over the free mobility of workers (discussed below), for
example, while within the European Union (EU), directives have given rise to special
admission criteria for categories such as researchers, highly qualified workers, and long-
term residents which member countries have less scope to restrict. Similarly, trade
agreements may compel countries to accept labour migrants. The United States, for
example, included its H-1B visa for temporary workers (and the L-1 visa for intra-corporate
transfers) in its commitments under the General Agreement on Trade in Services (GATS)
in 1994. Trade agreements may also oblige countries to introduce certain permit categories.
Finally, governments have added a wide range of conditions of entry to categories such
as family and humanitarian migration, even though they were traditionally considered
non-discretionary. While family reunification is often rights-based, there are numerous
economic and integration criteria which may now affect the ability of sponsors to bring
family members into a host country.
Free mobility for employment complicates European labour migration
Expanding areas of free movement – particularly in Europe but also between Australia
and New Zealand – limit room for manoeuvre in labour migration policies (OECD, 2012b).
Policy makers must take into account not only the labour supply within their own borders,
but within the broader freedom-of-movement area to which they belong. Flows can be
substantial, both in absolute terms and relative to labour migration. In Europe, at least
one-half of free movement is for employment and, in some European countries – Austria,
Switzerland and Norway, for example – it far exceeds discretionary labour migration flows
(Figure 3.1).3
The free movement of labour is not subject to restrictions on occupation, duration or
employer characteristics. In practice, it has generally filled lower- and medium-skilled
occupations in most European countries. However, while it can ease labour market pressure
at times of low unemployment, it can also complicate efforts to identify jobs that cannot be
filled locally, since workers from anywhere in a free movement area could be recruited.
Within free mobility areas, workers face lower migration costs and few obstacles to
their freedom of movement. Indeed they are more likely than other migrants to relocate
when employment conditions change (Jauer et al., 2014). Yet freedom of movement for
employment has shown significant shifts in a number of European countries in recent
years, which have not always reflected changes in labour migration flows (Figure 3.2).
While Southern European countries and Ireland saw labour migration decline in 2012
relative to the previous five years, free movement for employment fell less steeply.
In Germany, it was much higher in 2012 than in previous years, while labour migration
– widely limited to employment in occupations requiring tertiary qualifications – was
constant. In Sweden, where all occupations are open to both labour and free-mobility
migrants, the former increased sharply, while the latter did not.
INTERNATIONAL MIGRATION OUTLOOK 2014 © OECD 2014 147

3. MANAGING LABOUR MIGRATION: SMART POLICIES TO SUPPORT ECONOMIC GROWTH
Figure 3.1. Labour migration as a share of total migrationto selected OECD destination countries, 2007-12 average
Percentages
Note: Half of free movements are estimated to be employment related for EU countries. Exceptions where data areavailable: Sweden (52%), Denmark (65%), Switzerland (66%) and Norway (66%). For Australia and New Zealand, noestimates are available, and free movement is not shown.Source: OECD International Migration Database.
1 2 http://dx.doi.org/10.1787/888933157673
Figure 3.2. Labour migration and free movement for employment,change between 2007-11 average and 2012, selected European OECD countries
Percentages
Note: Half of free movements are estimated to be employment related for EU countries. Exceptions, where data areavailable, are Sweden (52%), Denmark (65%), Switzerland (66%) and Norway (66%).Source: OECD International Migration Database.
1 2 http://dx.doi.org/10.1787/888933157685
0
30
50
10
20
40
60
Labour flows (non-free movement) % of total
Estimated labour flows (free movement) % of total
Austri
a
Switzerl
and
Korea
Sweden
Norway
United
States
Irelan
d
German
y
Franc
e
Belgium
Denmark
New Ze
aland
Austra
lia
Portug
alSpa
inIta
lyJa
pan
United
Kingdo
m
-100
50
-50
0
100
150
Labour flows (non-free movement) Estimated labour flows (free movement)
Portug
alIta
ly
Irelan
d
Switzerl
and
Denmark
Spain
United
Kingdo
m
Belgium
German
y
Franc
e
Norway
Austri
a
Sweden
INTERNATIONAL MIGRATION OUTLOOK 2014 © OECD 2014148

3. MANAGING LABOUR MIGRATION: SMART POLICIES TO SUPPORT ECONOMIC GROWTH
Such varying trends raise the question of how to factor free movement for
employment into the design and management of labour migration systems. Public opinion
often does not distinguish between the two, even though policy makers have very different
degrees of control over them.
The division between “high skills” and “low skills” is ill defined
The first distinction that practice has blurred is the one between highly and
low-skilled migration. Skills generally lie on a continuum, and any classification into
discrete skill levels is to some degree arbitrary. The skills that today’s occupations require
are more varied than in the past, and some contexts may call for mixes. What’s more,
traditional markers based on educational attainment do not work well all the time. For
example, the skills sought by employers are not always conferred by tertiary-level
education, and tertiary-level education is not necessarily a guarantee or proof of
possessing certain skills. In short, the skills required by a job may not match those of the
person doing the job, which in turn may not map directly to formal qualifications.
Skill classifications of occupations are still a relevant tool to policymakers, however.
According to the 2013 OECD Survey of Adult Skills (PIAAC), there is a positive correlation
between the frequency of skills use in an occupation and the skills level generally associated
with respondents’ occupations. Workers in highly skilled occupations are more likely to
utilise key information-processing skills like literacy, numeracy, and problem-solving in their
jobs than those in medium-skilled positions. At the same time, literacy proficiency is
positively correlated with educational attainment, with better-qualified individuals earning
higher scores than their lower-qualified peers. In a nutshell, then, qualifications do reflect
actual skills, and occupational skills requirements are markedly different across the board.
However, formal qualifications are less useful in indicating an individual’s ability to
perform specific tasks. The 2013 PIAAC survey shows that, for example, some countries
(Italy, Spain, and the United States) rank much higher internationally in the proportion of
25-34-year-olds with tertiary attainment than they do in literacy and numeracy rankings
for the same age group. Conversely, Japanese and Dutch 25-34-year-olds who have only
completed high school tend to outperform Italian or Spanish university graduates of the
same age. The survey results also suggest real differences in the relevance and quality of
education in different countries, and that skills boundaries and their relationship to
traditional markers or proxies are shifting.4 This has significance for the way in which
countries identify skill needs or shortages and the related immigration policies that specify
qualifications in admission criteria.
It has always been more difficult to assess immigrants’ skills than the qualifications
and experience of natives. The difficulty affects immigrant labour market outcomes, the
ability of employers to recruit from abroad, and labour migrants’ opportunities to use their
qualifications. One paradox is that many labour migration programmes aimed at
low-skilled workers have attracted those who are highly skilled or, at least, highly
educated. For example, 13.4% of “non-professional” workers in Korea’s employment permit
system (EPS) hiring scheme actually have tertiary qualifications.
There are therefore two challenges to labour migration policies founded on rigid skills
classifications:
● Assessing skills accurately.
● Setting thresholds for highly skilled workers and limits on their low-skilled peers.
INTERNATIONAL MIGRATION OUTLOOK 2014 © OECD 2014 149

3. MANAGING LABOUR MIGRATION: SMART POLICIES TO SUPPORT ECONOMIC GROWTH
The distinction between temporary and permanent does not always reflect migrant pathways
The distinction between temporary and permanent migrants has also become
increasingly blurred in practice. Effective return rates by migrants’ lengths of stay are
similar, regardless of whether they are granted temporary (renewable) or permanent
status. Depending on the destination and period of residence being considered,
international studies find that between 20% and 60% re-migrate within five years of taking
up residence in a host country (OECD, 2008c). Recent findings for New Zealand confirm the
trend. They reveal that around one-quarter of the country’s skilled permanent migrants
headed elsewhere within five years of settling (Krassoi-Peach, 2013). Retaining permanent
immigrants is a growing policy concern in a number of countries.
Migrants admitted on a temporary basis, on the other hand, often stay on. Migrant
numbers have been steadily increasing in most European countries, even though they offer
only renewable temporary permits to first-time arrivals. In practice, they eventually grant
permanent residence to temporary migrants who have stayed for an extended period and
meet criteria. In Italy, in 2013, of all resident non-EU migrants who had stayed at least five
years in the country, about one-half had acquired permanent status. Figures were similar
for Spain. Overall, there were more than 7.2 million non-EU citizens holding long-term
residence permits in European OECD countries in 2012.5
The high proportion of status changes within OECD countries indicate that many
temporary migrants eventually acquire permanent or quasi-permanent status. In 2012 in
the United States, around 89% of employment-based Green Card approvals were issued to
foreigners already in the country. One-half of the principal applicants that Australia
admitted permanently as skilled migrants in 2011-12, were already onshore (in the
country). In 2011, under Tier 1 of the United Kingdom’s points-based system for highly
skilled migrants, 88% of visas and extensions were issued to main applicants already in the
country (OECD, 2013c). As for New Zealand, 87% of skilled permanent migrants approved
in 2012-13 were already in the country with a different status.
There is still a clear role for time-limited stays. These include seasonal contracts,
longer-term temporary residence and intra-company transfers (ICTs). Yet the
temporary-to-permanent track is an increasingly prevalent model that accounts for a
growing share of permanent migrants. One example of how distinctions blur is that of two-
and multiple-step migration, where migrants who first stayed on time-limited visas
(students, time-limited temporary workers, even working holiday makers) then transition
to permanent status, either directly or through a series of temporary visas.
Students are temporary migrants, yet many stay beyond their studies (Figure 3.3). In
most countries where it is possible to work out the numbers of such students, the stay rate
ranges between 20% and 30% (OECD, 2011d). And while not all end up settling permanently,
they are among the migrants who are most likely to.
In sum, then, permanent and temporary status do not alone determine whether
labour migrants remain. Put another way, offering permanent residence to some categories
of immigrants and restricting others to temporary status does not condition whether they
will stay or go.
INTERNATIONAL MIGRATION OUTLOOK 2014 © OECD 2014150

3. MANAGING LABOUR MIGRATION: SMART POLICIES TO SUPPORT ECONOMIC GROWTH
Demand is a growing factor in supply-driven migration, and vice versa
In “demand-driven” migration, it is essentially the employer who decides whom to
hire from abroad as labour migrants, offering them a contract which entitles them to enter
and stay in a country. “Supply-driven” migration is where the host country invites or
admits immigrants without a job offer. As the numbers of eager candidates are generally
high, there is some selection and limiting of numbers. In practice, it is increasingly difficult
to find a purely supply- or demand-driven system. Employers tend to prefer the demand
side, as they can choose and sponsor their own recruits. Supply-driven migration, however,
makes workers immediately available on the labour market and grants them full
contractual freedom.
Supply-driven models prevailed in Australia, Canada, and New Zealand in the 1980s
and 1990s. While the selection system is meant to pick immigration applicants likely to be
successful, evaluations have revealed their faltering labour market outcomes. One of the
main explanations has been the rising share of migrants selected on the basis of
qualifications, but whose education and experience were obtained in a non-OECD country.
As a result, countries are now placing greater emphasis on foreigners having a job in hand
or on employability proven by experience in the country.
In European OECD countries and in Asia, demand-driven migration has been the rule.
Yet small-scale supply-driven measures have been introduced. Denmark and the
Netherlands have introduced points-based systems for issuing conditional job-search
visas, while Germany has instituted a job-search visa for university graduates. The
United Kingdom takes employer demand as the key criterion for admission under Tier 2 of
its points-based immigration system, while also using points to rate migrants’ longer-term
employability and allot permits within a quota.
Figure 3.3. International students changing status and stayingon in selected OECD countries, 2008 or 2009
Percentages
Note: Data for European countries cover only students from outside the European Economic Area. Data for Canadainclude changes from student to both permanent status and other temporary statuses.Source: National student permits statistics.
1 2 http://dx.doi.org/10.1787/888933157693
0
5
10
15
20
25
30
35
Austri
aSpa
in
Irelan
dJa
pan
New Ze
aland
Finlan
d
Norway
United
Kingdo
m
German
y
Netherl
ands
Austra
lia
Czech
Rep
ublic
Franc
e
Canad
a
INTERNATIONAL MIGRATION OUTLOOK 2014 © OECD 2014 151

3. MANAGING LABOUR MIGRATION: SMART POLICIES TO SUPPORT ECONOMIC GROWTH
Such practices reflect the fact that most employers do not recruit directly from abroad,
but from the foreign-born population resident in the country. The special module in the
European Union’s 2008 Labour Force Survey (LFS) indicates that 66.3% of foreign-born
labour migrants entered without a job offer in hand, even in countries where it was a
condition.6 The same held true even for the highly educated.
To recapitulate: supply-driven systems now take into account employer demand and job
offers while, on the demand side, governments have added increasingly elaborate filters to
pick out workers most likely to succeed over time. Certainly, not all OECD countries have
gone hybrid, but ever fewer use job offers alone as grounds for leave to enter.
The four paradoxes of migration policy
It is no surprise that the labour migration landscape has changed. Migratory flows
have always shown ups and downs in response to economic, social, political and
demographic conditions. Some underlying trends have long been clear – changes in
population growth, for example, in OECD countries. Other developments are less
predictable, such as political changes in countries of origin, the increasingly multipolar
global economy, and the emergence of new occupations and engines of growth.
Nonetheless, with a few exceptions, the policy driver in the past five years has not been
concern over shrinking working-age populations, but specific demand for workers and
rising concern over competition for global talent.
The last five years have laid bare a number of paradoxes in migration policy:
● Despite the focus of public opinion and policy makers on discretionary labour migration,
it accounts for a small share of migrants going into employment.
● Although policy makers have emphasised selection from abroad and the global
competition for talent, the bulk of employers recruit foreign-born workers on the
domestic labour market.
● Policies focus on global, highly skilled talented incomers, yet have a hard time accurately
identifying them (in part because of wide discrepancies between skills and education
levels). Yet employers report demand for medium-skilled occupations.
● Temporary and permanent residence remain the main conceptual categories in the
minds of policy makers. Yet changes in status have become steadily more frequent, and
how to retain talented permanent migrants is a growing policy consideration.
Policy makers should bear in mind the four paradoxes when determining labour
migration goals and matching instruments to them. The next section addresses precisely
the issue of setting migration policy goals.
Setting and balancing goals for migration policy interventionThis section discusses the policy goals to which labour migration policy can
contribute, and how policy makers may articulate and reconcile them.
Policy trade-offs in labour migration
The primary goal of labour migration is essentially to contribute to an effective labour
supply and so provide economic benefits. Yet labour migration policy has an array of goals,
not all economic and many linked or contrasting. As policy makers and stakeholders share
some and differ over other goals, balancing them involves trade-offs and tensions – both
within labour migration policy and relative to other policy objectives.
INTERNATIONAL MIGRATION OUTLOOK 2014 © OECD 2014152

3. MANAGING LABOUR MIGRATION: SMART POLICIES TO SUPPORT ECONOMIC GROWTH
Ideally, foreign workers should complement local workers, rather than substituting or
displacing them, or otherwise having an adverse impact on the labour market. In practice,
perfect complementarity is hard to achieve. The policy challenge is thus to ensure a labour
supply while limiting any adverse effects. Although a basic policy objective, it is a
complex task.
Labour migration can contribute to some broad goals – in full or in part. For example,
national and regional demographic policy helps to structure labour migration policy.
Economic development aims – such as stimulating industry, innovation, and investment –
help guide labour migration policy choices. Weighing the trade-offs between those choices
is the policy maker’s challenge.
Policy objectives may seem obvious at first glance and unfettered by any serious
trade-offs. Yet trade-offs lurk. Even a core goal as straightforward as “meeting labour needs”
requires that specific objectives be articulated. Is the goal of labour migration to meet
specific shortages as they arise or to increase overall labour supply? The latter may mean
that, even in times of slack labour markets, migration can still address the goal of
contributing to future growth, innovation, or productivity. The trade-off here is, for example,
to accept periods of higher unemployment in exchange for expected longer-term growth.
Similarly, an objective may be to support the expansion of talent pools. In recent years,
countries have widely leveraged labour migration as a means to increase numbers of
highly qualified workers, especially in the health sector, science and technology, and
mathematics. The goal may draw on a perception or finding that there are too few local
graduates in those disciplines. It may also assume that employers will utilise the new
labour supply well. The trade-off here is to use migration instead of creating incentives for
local training opportunities in order to build a skilled labour supply. A further trade-off is
accepting the risk that such a supply may not be utilised as planned.
Countries that seek to meet the goal of increasing the overall labour supply rather than
fill individual vacancies may apply it only to specific skills rather than to the entire skills
spectrum. Such an approach is in fact in place in much of the OECD and entails confining
labour migration to skilled individuals and those who boast high levels of education. The
underlying assumption is that any unemployed local worker should be able to fill vacancies
for low-skilled positions. The result is a trade-off between the goal of keeping low-skilled
labour migration in check and supporting certain economic activities. Concern to ensure
the labour supply may outweigh fears over unemployment. It is worth noting in that
respect that some OECD countries with no labour migration skills thresholds have chosen
not to impose them even when there are high levels of unemployment among less
educated workers, both foreign- and native-born.
While labour migration is primarily about labour supply, the reverse is not true. The
domestic population – and its education and training pathways – is and will remain the
main source of labour in all OECD countries. The goal of delivering a labour supply guides
policy choice in immigration for employment, but is also linked to the level of investment
in local education, training, and upskilling. Drawing on international immigrant labour
may lessen opportunities for local training and its value, and affect the goals of upskilling
and coaxing local youth into certain industries.
Meeting labour demand through migration also means responding to changing labour
market conditions. Labour migration may be an easy tap to loosen when the employment
market is tight and to tighten when conditions change, but workers who have been allowed
INTERNATIONAL MIGRATION OUTLOOK 2014 © OECD 2014 153

3. MANAGING LABOUR MIGRATION: SMART POLICIES TO SUPPORT ECONOMIC GROWTH
into a host country do not disappear when their jobs do. The employment crisis in many
OECD countries in the late 2000s saw policymakers struggle to balance the temporary,
conditional nature of some labour migration schemes with the goal of not penalising
migrants during a downturn that was no fault of theirs’. The solutions developed – extended
job-search periods, assisted return programmes – reflected those balancing acts.
Broader economic objectives sit alongside labour migration goals, and not always easily.
As migration and trade become increasingly entwined, certain kinds of immigration may be
seen as factors for competitiveness and innovation. Fostering the competitiveness of an
economy by opening it up to highly skilled migration exposes local firms and workers to new
ideas, which in turn spawns the development of new goods, services, and processes.
Labour migration can also become the subject of bargaining between countries, especially
when countries of origin seek to increase their export of labour and skills. It may well be drawn
in to free trade agreements (FTAs), regional economic agreements, and security co-operation
accords, regardless of actual labour market demand. For example, working-holiday and
youth-mobility schemes are typically negotiated as part of bilateral relations – which include
trade – with no real thought for whether they square with labour market policy goals, like
protecting local employment for low-skilled workers or young people. Some countries are,
however, now beginning to factor labour market impacts into negotiations.
Policy must reconcile labour migration with a raft of non-economic objectives.
Commitment to the development of countries of origin, for example, is increasingly cited in
relation to migration, as the competition for global talent may contradict the goal of
mitigating their skills deficits. Migration policy makers often state that positive development
in countries of origin is a goal, albeit one that is difficult to operationalise. Sweden has taken
concrete measures, such as facilitating relocations to countries of origin without forfeiting
permanent residence.
Last but not least, there is the aim of developing a well defined, robust labour
migration policy while maintaining the ability to respond to the unexpected. Recent
history has shown how countries fare when faced with migration shocks over which they
have little discretionary control, or when geo-political turmoil produces sudden influxes of
migrants. Equally, people may move abroad in large numbers in search of opportunities
elsewhere. In certain East European countries, for example, native-born emigration has
rewritten the labour migration policy script.
Policy makers can struggle to make all the goals and trade-offs cited here explicit. Yet,
wider, better understanding of what is at stake in migration policy helps define appropriate
mechanisms, bring in stakeholders, and guide change when conditions evolve. That it is
difficult to set goals is evident from the sheer scarcity of explicitly stated goals in
legislation. Policy intent is not always clear. Nor is it any clearer how policy mechanisms
are meant to work.
Arriving at a consensus on the objectives of labour migration policy can be more
difficult than negotiating measures to be undertaken to achieve those objectives. In some
countries, like Sweden and Norway, parliamentary commissions or white papers explicitly
state goals. In Korea, the government has its Basic Plan wherein it articulates legislative
and regulatory goals. Italy, like some other OECD countries, clarifies its goals in extensive
preambles to its legislation. Others do not. Immigration legislation in the United States, for
example, does not include statements of objectives, although executive regulations do
contain explanatory preambles.7 The different practices reflect the political culture in
INTERNATIONAL MIGRATION OUTLOOK 2014 © OECD 2014154

3. MANAGING LABOUR MIGRATION: SMART POLICIES TO SUPPORT ECONOMIC GROWTH
individual countries, so a general guide to policy development cannot apply to all.
Nonetheless, this section seeks to explore the goals that may be set and to which labour
migration policy must respond.
Labour migration policy can strictly address labour market needs…Labour migration policy can strictly address labour market needs. To do so, however, it
has to set specific labour-market goals – e.g. filling vacancies, providing a complement to
the domestic workforce, or righting skill mismatches. It can also seek to meet more general
objectives, such as ensuring that the working age population stays roughly the same size.
Indeed, that is the objective underlying permanent residence targets in most settlement
countries – which are independent of specific-sector needs and formulated to contribute
to balanced demographic development. The Canadian and New Zealand migration
programmes are built on that rationale.
A similar objective underlies the official German government strategy adopted, in
June 2011, as a “concept for securing the skilled labour base”. The five-pronged strategy
sets the explicit goal of sustaining the supply of skilled workers in Germany in the medium
and long term in light of the decline in the working-age population. The ensuing labour
migration policy decisions were designed to achieve that goal.
The objective of labour migration policy may be more specific – to secure industries or
employers access to a broader pool of labour, as in seasonal work programmes and other
schemes to support industries where demand is cyclical. Similarly, occupations may be the
focal point. Many countries are not self-sufficient in specialist medical personnel, and
there will always be a certain structural demand for their skills. Likewise, “sunrise”
industries – such as information technology or high-end engineering – may struggle to find
workers in their early phases of expansion.
As well as meeting demand for certain skills, labour migration policy might seek to
boost the supply of workers whose skills drive innovation in, and the strategic
development of, certain sectors. One frequent focus is science, technology, engineering
and mathematics (STEM), a set of disciplines which enjoys special treatment in the
migration policies of several OECD countries: the United States, where immigrants in STEM
occupations benefit from flexible post-graduation leaves of stay; Germany, where STEM
goes by the acronym MINT (maths, informatics, natural sciences and technology), has
given foreigners with MINT skills their own residence category and listed MINT
occupations as ones with skills shortages; Japan, too, has a special permit scheme for
engineers. The preference for STEM graduates may be prompted by structural needs, hotly
debated in some countries. It may also spring from an interest in acquiring – or even
hoarding – specialised human capital for long-term comparative advantage and
supporting the general science and technology ecosystem.
All the above policy objectives explicitly seek to change the supply side of the labour
market. Their aim may also be to improve compliance with labour law by reducing or
preventing illegal employment.
… demographic policy…Population ageing affects many OECD countries. While migration is nowhere seen as a
solution, the longer-term objective of ensuring growth influences labour migration
planning. One consideration in settlement countries is how to maintain the size of the
working age population. Those countries set migration targets and draw up plans
INTERNATIONAL MIGRATION OUTLOOK 2014 © OECD 2014 155

3. MANAGING LABOUR MIGRATION: SMART POLICIES TO SUPPORT ECONOMIC GROWTH
accordingly, although they define admission criteria in light of other objectives. Conversely,
demographic policy might also seek to check or maintain population growth and so curb
labour migration. In 2011, the United Kingdom set a goal of reducing net migration to slow
the increase in the labour force – with direct consequences for all migration channels.
… and broader economic development goals…
Over and above sustaining the labour supply and contributing to demographic growth,
policy has other general economic development objectives that have little to do with the
labour market. One such may be to boost trade and open up markets. Many free trade
agreements contain provisions on labour migration. Among recent examples are the
economic partnership agreements between Japan and the Philippines and Indonesia, for
example, which incorporate clauses on mobility. The United States has also tied migration
opportunities to free trade in its agreements with Singapore and Chile. New Zealand has a
free trade agreement with China which, while not geared to labour market demand or
supply, does contain clauses on labour migration.
Another common goal is to support the education export industry. It is particularly
important where fee-paying international students make a significant contribution to the
economy, whether enrolled in public or private institutions. The objective of attracting
international students has a direct impact on labour migration policy in that students may
often work or stay on after graduation. In countries where university enrolment is
declining as numbers of young people dwindle, the objective may simply be to maintain
current student levels, either in order to support the education sector or sustain the supply
of university graduates.
Other objectives are more to back innovation or productivity by increasing the number
of highly skilled workers. The Japanese government, for example, sets a policy objective of
“encouraging highly skilled non-Japanese human resources to engage in activities in Japan”,
as part of its 2013 Revitalisation Strategy. In Korea, the goal of “increasing overall research
capacities” has translated into a 2014 target for bigger grants to researchers from abroad.
Youth mobility is another non-economic goal. The Working Holiday Maker
programmes in place in a number of OECD countries are instruments primarily to increase
youth mobility (including opportunities for nationals to travel abroad), raise a country’s
profile internationally, and create goodwill. Such programmes can make substantial
contributions to the labour market – as they do in Australia, New Zealand, and the
United States – even though that is not their initial purpose and they are not contingent on
their contribution to the labour supply.
Policies may also have the foreign-policy objective of closer co-operation in the fight
against illegal migration. It is in fact a labour migration policy objective in a number of
European OECD countries, especially those on the Mediterranean coast. Italy, for example,
has set-asides within its labour migration (regardless of employer preferences) for
countries which co-operate in stemming the flow of illegal migration.
Development objectives, too, may be formulated in such a way that they affect labour
migration policy. Bilateral agreements on co-development and migration management
signed by France and a number of African countries, for example, spell out such mutual
goals as containing illegal migration and preventing brain drain. Such agreements have
repercussions for labour migration policy in France, but are not designed with the prime
objective of increasing the labour supply.
INTERNATIONAL MIGRATION OUTLOOK 2014 © OECD 2014156

3. MANAGING LABOUR MIGRATION: SMART POLICIES TO SUPPORT ECONOMIC GROWTH
Attracting financial capital is another economic goal that can become an increasingly
two-way street and prompts movements of labour to service and bolster globalised
investment. OECD countries are thus embarking on programmes that combine investment
and migration.
Most offer investor visas, with a recent trend towards using them to support the real
estate market – whether residential, as in Portugal, Spain or Greece, or commercial, as in
Korea. The suite of investor policies reflects the desire to attract financial capital that has
knock-on effects from investors’ human and social capital, such as business linkages, new
business processes, or entrepreneurship skills. However, investment and migration are
very different animals and the limited evidence to date of the impact of programmes
highlights how combining them may distort market decisions and yield fewer benefits
than hoped for.
… or have little to do with economics
Many OECD countries harbour the goal of embracing far-flung national communities
and/or their descendants. Measures to include co-ethnic communities from outside
national boundaries can also affect labour migration policies:
● Finland has long offered preferential treatment to foreign nationals of Finnish extraction
wishing to immigrate.
● Italy’s labour immigration legislation incorporates a quota of South Americans of Italian
origin.
● Korea grants extended work permits to foreign citizens of Korean origin.
● Germany grants favourable migration conditions to ethnic Germans living in East
European countries.
● Greece admitted a large number of Pontian Greeks in the 1990s.
● In the 1990s, Japan opened up recruitment in less-skilled occupations for South
Americans of Japanese descent.
● Israel proactively encourages Jews abroad to migrate to Israel. In the absence of a
permanent labour migration stream, recruitment efforts focus on candidates who meet
this ethnic preference.
Public support in destination countries for such programmes has traditionally been
strong and draws on solidarity or a sense of belonging.
An additional non-economic goal affecting labour migration policy may be to maintain
respect for certain rights. In countries where a right to family life is broadly interpreted, for
example, temporary labour migration programmes which restrict family reunification are
constrained in terms of duration.
Development co-operation is another non-economic aim. For example, for scholarships
or grants for international students from developing countries enrolling in university in
developed economies, the thinking behind such subsidies has been that students will return
home with their newly formed human capital as a kind of development assistance. This can
constrain the possibility to recruit them as labour migrants, and a number of OECD countries
denied students who have benefited from this form of “aid” leave to remain, even when they
found employment. A case in point was Norway until the early 2000s. Some countries still
require students who are awarded scholarships to have the approval of their country of
origin before they can receive a post-study residence permit.8
INTERNATIONAL MIGRATION OUTLOOK 2014 © OECD 2014 157

3. MANAGING LABOUR MIGRATION: SMART POLICIES TO SUPPORT ECONOMIC GROWTH
Political economy of labour migration policy reform
The previous section identified a number of different labour migration policy goals
and discussed the importance of policy makers clarifying which ones they pursue. In the
end, it is up to them to set and prioritise goals and decide what to trade off. This section
examines how they do that.
There is nothing unusual about assigning different overall goals to migration policy.
Political parties often express their migration policy objectives in campaigning documents,
identifying broad areas, and making sweeping promises. Governments, too, may issue
official statements that encompass different policy areas and achievements. The challenge
is to identify and tackle trade-offs.
There are several steps to meeting the coherence challenge. The first is to make goals
explicit, then to articulate the logic of policy intervention. However, even clearly articulated
goals are not, in themselves, any guarantee of coherence with the instruments used to
achieve them.
Mechanisms for identifying and reconciling diverging objectives can be found. They
require inter-ministerial co-ordination and the involvement of different stakeholders
through consultation phases, hearings, and the drafting of policy planning documents
– “white papers”, “green papers”, “basic plans”, etc. All that is a political task, but trade-offs
themselves should be made as explicit and evidence-based as possible. Such a requirement
is especially important when it comes to migration, where economic objectives with
different horizons must be reconciled with other goals. While politicians, their staff and
stakeholders may well know what is being traded off when they hammer out deals or draw
up different-coloured papers, the terms of a trade-off are rarely made explicit. When
parties which lost out are not identified, it is difficult to compensate them.
Public opinion may tend toward restrictiveness
The political decision-making process is affected by a wide range of factors and actors.
Labour migration interest groups press governments for greater immigrant inflows. Yet, as
governments themselves share the objective of economic growth – one of the main
benchmarks against which electorates judge them – most are sensitive to business
concerns about migration’s impact on growth (Boswell, 2013).
The very few comparative international surveys on perceptions of labour migration
suggest that economic arguments for labour migration are given greater weight by public
opinion in countries that were historically built on immigration and now implement
selective policies. In one example, there was a high level of support in 2012 for all
immigration categories in Australia,9 with the public most favourable towards skilled
migrants. The Department of Citizenship and Immigration Canada has found that a
majority – albeit a shrinking one – of Canadian respondents said they felt immigration was
having a positive effect on the economy. Yet opinion surveys within most OECD countries
reveal that people tend to take a negative view of the economic and cultural impact of
migration, disapprove policies to increase migratory flows (OECD, 2010), and express a
preference for less, rather than more, migration.
Overall, public opinion on migration favours limits. One survey, the Transatlantic Trends
Survey in 2013, reveals that over one-half of the public in the United Kingdom and many
European countries believe that the number of immigrants in their country is an issue.
INTERNATIONAL MIGRATION OUTLOOK 2014 © OECD 2014158

3. MANAGING LABOUR MIGRATION: SMART POLICIES TO SUPPORT ECONOMIC GROWTH
The default political stance in most OECD countries is broadly in line with public
opinion – i.e. to keep in place restrictive measures on labour and other forms of migration.
Policy changes can therefore be difficult to promote, as many European countries have
demonstrated (Boswell, 2013). Nonetheless, despite public aversion to migration as a
whole, perceptions of labour migration are different and, when it is specifically described
as migration for employment, opposition tends to weaken.
Political parties support policy changes linked to economic growth
In most OECD countries, there is broad political consensus that government’s
overarching goal should be economic growth, that labour migration should meet the needs
of the labour market, and that managing it should seek to further the economy and
business. At times, governments may struggle to strike a balance between economic
objectives – which may point to recruitment from abroad – with public opposition to
migration.10 One means to strike a balance is through mechanisms within their migration
management systems. But policy makers can also adopt political stances and speak out on
the economic impact of labour migration in order to justify policy changes in legislation
that affect the magnitude and characteristics of labour migration flows.
Regardless of circumstances and the direction of proposed reform, policy makers need
to make a strong case for change. It requires calculating and understanding the impact of
reform, acknowledging the costs of inaction, and recognising winners and losers – since
the latter will have to be compensated, albeit not indefinitely.
Countries that reformed labour migration policy and made it more liberal in recent years
were those where there was a strong case made for change and a broad consensus. Cases in
point are Spain, Sweden and, in the 2000s, the United Kingdom. Consensus also enabled
Germany’s move to open up to labour migration, although the negative sentiment associated
with the guest-worker programmes of the 1960s confined it to skilled immigrants.11
Institutional arrangements affect policy design and delivery
The political economy of labour migration policy regards not only parties but the
institutional organisation of migration management. The seat of immigration policy – itself
a result of political choice – affects the priorities and decisions made in policy
administration, which is the job of different ministries, depending on the country. In some
OECD members, responsibility is split between ministries, while in others the portfolio
may change over time.
Where the seat of migration management is located reflects and influences its
priorities. A labour ministry will have a more employment-slanted perspective, a
department of justice will stress issues of law and order, and an independent migration
ministry may well focus primarily on border security. The importance of migration policy
is reflected in government bodies’ standing: a migration minister may be cabinet-ranked in
some administrations, in others he or she may be a junior minister or undersecretary. And
there might be no ministry at all tasked with migration, which may be assigned to a
department or division within another ministry.
Canada considers “nation building” as tied to immigration and citizenship, which it
starts promoting as soon as migrants with permanent residence arrive. The emergence of
a ministry that manages immigration, integration, the naturalisation process, and citizens’
civic duties and rights mirrors the nation-building project (van Selm, 2005). In Spain, the
INTERNATIONAL MIGRATION OUTLOOK 2014 © OECD 2014 159

3. MANAGING LABOUR MIGRATION: SMART POLICIES TO SUPPORT ECONOMIC GROWTH
employment ministry has chiefly administered migration since the mid-2000s as it did in
New Zealand, where immigration was long the duty of the Department of Labour until the
Ministry of Business, Innovation and Employment took charge. Spain and New Zealand
are examples of the approach that puts immigration planning in a labour- and
economy-related perspective.
Institutional configurations reflect domestic contexts and the approaches and
backgrounds of the personnel responsible for implementing policy. There is no single
one-size-fits-all solution.
Migrants are also important actors
Against a backdrop of political economy dynamics and domestic institutional set-ups,
the objectives and choices of migrants themselves make them key actors. While intentions
may not match destinations, they are important gauges of wanderlust. In 2010-12, the
Gallup World Poll found that 13% of the adults surveyed – equivalent to 630 million
people – said they would like to leave their country and move somewhere else
permanently. That high figure nonetheless was down on the 16% of respondents who
expressed their desire to migrate in 2008-09.12
OECD countries were the most popular destinations. The United States came top with
nearly one-fifth of would-be migrants naming it as their desired future residence. With an
additional estimated 46 million (7.3%) saying they would like to relocate to Canada,
North America stood out as the most desirable region in the world. The best of the rest of
popular destinations were European. Seven per cent of those who wished to live elsewhere
– 42 million people – cited the United Kingdom, 5% chose France, while 4.5% wished to
relocate to Germany. Outside Europe, 4% named Australia as their destination of choice
and 4.5% Saudi Arabia.
In summary, setting labour migration goals is an exercise fraught with difficulty but
essential to implementing policy. Unlike other policy areas which have clear benchmarks
and goals – like health and employment policy – labour migration is about more than
quantity and quality. The core goal of labour migration policy is still to meet labour needs
that cannot be satisfied domestically while ensuring that the domestic workforce is not
adversely affected. That goal, however, must compete with other policy goals. Articulating
them explicitly will help in choosing the tools that will help achieve them.
The policy toolbox for achieving labour migration policy goalsPolicy tools translate policy goals into practice. This part of the chapter describes some
of them – standard regulatory measures, market-type instruments, and information tools –
then looks at how to use them effectively.13 It concludes with a discussion of tools’ pros
and cons, drawing on country experience, and suggests where and under what conditions
they are applicable.
The policy toolbox
Numerical limits
Numerical limits are an integral part of many managed migration policy regimes
(Table 3.A1.1). They come in many forms – quotas, targets, ceilings, caps, etc. They reflect
different policy objectives: a minimum that should be attained (target), an upper limit that
cannot be exceeded (ceiling, cap), or a pre-established number or proportion (quota).
INTERNATIONAL MIGRATION OUTLOOK 2014 © OECD 2014160

3. MANAGING LABOUR MIGRATION: SMART POLICIES TO SUPPORT ECONOMIC GROWTH
Different controls for different objectives. The nature of a numerical limit depends on
the objective. Caps and quotas, for example, ensure that entries do not exceed a certain
threshold, generally so as to safeguard local employment and labour market conditions.
Limits may also be set to meet the needs of specific industries or a country of origin’s
development objectives. Limits are a way to control migrant flows as a safeguard when
governments introduce new policies of which they are unsure. They enable countries to
match numbers of cases to processing capacity, even though they may lead to backlogs in
the case of oversubscription. And finally, a limit is a number that signals political control
over labour migration.
Targets are used primarily to manage permanent residence streams in settlement
countries. Australia and Canada base their targets on planning levels. Setting them
involves factoring in:
● Social, demographic and economic trends.
● Government migration and population policies.
● Expected demand for skilled labour.
● Estimated demand for family reunification places.
● Net overseas migration levels.
New Zealand’s residence target, in place and unchanged since 2000, takes into account
natural growth and high net migration outflows.14 Some targets are shorter-term: in 2011,
the United Kingdom targeted the reduction of net migration to the “tens of thousands”.
Caps may be stated in legislation. The United States’ employment-based permanent
visas for skilled workers have been enshrined in legislation since 1990: no more than
140 000 individuals are admitted annually, which includes accompanying dependents.
However, ceilings or caps can be benchmarked to the size of the labour market or
population in order to contain any adverse effect on the domestic labour market. Estonia
sets its quotas with reference to the total population: in 2013, the quota was 0.075% of the
country’s permanent population, i.e. 1 000 people.15
Norway caps the number of skilled workers it admits – 5 000 each year from 2011
to 2013. Above that limit, a labour market test applies. Switzerland caps the number of
both long-term and short-term work permits it issues to labour migrants.16
Many seasonal and time-limited programmes are capped, especially where supply is
potentially so large it could distort the labour market or undermine compliance measures.
That is the principle behind the H-2B programme in the United States, where legislation
sets an annual ceiling of 66 000.17 Israel and Korea both cap their multi-year temporary
worker programmes. Israel sets a stock cap to control the aggregate number of immigrant
workers in the country at any time, while Korea puts a quota on new admissions. Annual
caps on seasonal workers are the practice in Italy, Norway and Spain.
There are many models for setting limits. Numeric limits are determined through a mix
of political and bureaucratic processes, but are generally subject to periodic review and
revision based on labour market data and consultation with stakeholders (Chaloff, 2014).
As already noted, numbers are sometimes set in legislation. Most countries, however,
establish them through annual, non-legislative processes.
INTERNATIONAL MIGRATION OUTLOOK 2014 © OECD 2014 161

3. MANAGING LABOUR MIGRATION: SMART POLICIES TO SUPPORT ECONOMIC GROWTH
Using estimates of demand to set limits is no straightforward task. There are several
reasons, chief among which are the frequent unreliability of vacancy or hiring data and the
rapidity of change in demand. Most countries, however, base their limits, at least in part,
on vacancy or shortage indicators and demand from employers.
In Korea, the Foreign Workers Policy Committee uses a benchmark shortage indicator
drawn from a purpose-built employer survey. The survey examines employer demand by
skill level and preference for Korean or foreign workers. The ratio of filled to unfilled
vacancies for foreign workers is taken as the shortage indicator. Israel allocates permits to
each sector. It determines the number through inter-ministerial consultation with
substantial input from industry interests (OECD; 2010 and 2013). In Greece, from 2014, a joint
ministerial decision establishes overall biannual “volumes of admission” by occupation and
region through a consultation procedure.
Controls can be combined and targeted. Ceilings and caps may also extend to nationalities
and sector- and firm-level limits. Italy is one example of a country which has set aside
capped quotas for certain nationalities, sectors, occupations, and provinces. Countries with
which the government has signed bilateral agreements or has on-going co-operation
arrangements receive set-asides, while certain sectors – primarily domestic work – receive a
share, too. Each province is also issued a quota, which it must then divide according to
nationality and, sometimes, occupation in order to meet employer demand.
Other countries also use firm-related limits. In Korea, the Foreign Workers Policy
Committee sets overall ceilings on non-professional workers and reserves individual
quotas for employers. The quotas are ratios of foreign workers to insured Korean workers
in a firm. The committee then allocates foreign workers to employers on the basis of
criteria like past compliance and need. Chile and Turkey apply firm-level limits, 15% and
20% respectively, although exemptions apply.
In Israel, the government sets ceilings for work permits in two sectors – agriculture
and construction – but quotas are allocated to employers in the sector by a Ministry of
Agriculture formula. For example, in 2010, every employer was given a set number out of
the 26 000 agricultural workers allowed that year.
Italy’s seasonal work programme sets annual limits on foreign workers – from
80 000 annually in 2006-10, it was gradually lowered to 15 000 in 2014. New Zealand sets aside
up to 8 000 vacancies (according to estimates of peak seasonal demand) as part of its
Recognised Seasonal Employer (RSE) scheme in the horticulture and wine-growing industries.
It also gives preferential treatment to workers from select Pacific island states who account for
at least 50% of seasonal recruits. Australia, too, has a seasonal worker programme (SWP) with
12 000 places over four years to 2016, chiefly for nationals of select Pacific countries.18 All the
countries above cap their quotas at below 0.1% of the total population. The United States
applies a country quota within its ceiling on employment-based visas: no more than 7% of all
employment-based visas may be issued to any one country.
Dealing with over- and under-subscription. The very concept of a limit means the
rejection of excess demand – from employers wishing to recruit and workers to migrate.
Oversubscription can be a challenge as economic conditions change and demand
fluctuates, which raises the practical issue of determining who gets to go through the
selection process. Generally, applicants are notified in advance of an appropriate time
INTERNATIONAL MIGRATION OUTLOOK 2014 © OECD 2014162

3. MANAGING LABOUR MIGRATION: SMART POLICIES TO SUPPORT ECONOMIC GROWTH
window within which to apply. All things being equal, everyone meeting policy criteria
should stand the same chance of being chosen. However, in practice, some form of ranking
criteria needs to be used.
To address oversubscription, settlement countries (New Zealand and Australia, and
Canada from 2015) use a points-based system (PBS) and its extension, the so-called
“expression of interest”. The pass mark can be shifted according to demand and when
supply exceeds the set number of places (see below). Tier 2 of the United Kingdom’s 5-tier
visa system for skilled non-EU citizens with a job offer has a monthly allotment. If
exceeded, applicants are ranked according to the nature of the job – shortage occupations
take precedence over PhD-level occupations which come before other occupations – and
the prospective salary.
In the United States and Italy, the system is “first in, first served”. Applications are
filed by date then processed in that order. The United States applies a lottery system to
determine processing order when the H-1B cap is exceeded within the first week.
New Zealand also uses a lottery to choose candidates for its Samoan Quota and Pacific
Access permanent residency programmes. When the family migration cap is reached in
Australia, applicants are put in a queue for visa grant consideration the following year,
subject to places becoming available. Queues can lead to lengthy processing backlogs, so
some countries limit the time validity of applications.
Where there is excess demand, another response is to apply more stringent
requirements to overflow applications. Norway requires skilled workers to take its labour
market test when the quota is exhausted.
Limits or targets can, of course, also be undersubscribed. That may, in fact, be the very
intention of policy and some limits, like Hungary’s, have never been reached.
Under-subscription, however, can pose problems, especially if a public commitment has
been made to attract a certain number of migrants. That was what happened with
Germany’s “green card” for IT workers in the mid-2000s, where the low visa take-up
undermined shortage claims and raised questions as to how attractive the scheme was to
labour migrants. Responses to under-subscription have included transferring the left-over
visas into the following year’s annual quotas or into another visa category. In fact, whether
unused places can be rolled over is a separate policy question. In the United States, unfilled
places from any of the five permanent labour migration streams are added to streams
where there is excess demand.
An alternative method proposed by some economists – but in practice used nowhere –
is to auction work permits (Freeman, 2006). Auctions as market-based instruments may
achieve efficiency gains, but making them work in practice is problematic. For instance,
they require clear rules for identifying the number of visas for a given time period and
determining reservation price. This in itself can be counter-productive because, instead of
rationalising supply, it might lead to supply being fixed.
Numerical limits may also serve the broader political purposes of participative
democracy and the assertion of governance. In principle, the process of setting quotas
involves consultations with a wide range of stakeholders to ensure political legitimacy
(Ruhs, 2005). Efforts to build consensus – with the social partners in Ireland, for example,
or the public in Canada – reflect a political will to build consensus or at least participation
into the process.
INTERNATIONAL MIGRATION OUTLOOK 2014 © OECD 2014 163

3. MANAGING LABOUR MIGRATION: SMART POLICIES TO SUPPORT ECONOMIC GROWTH
Points-based systems for skilled migrants
Points-based systems (PBSs) give points to requirements deemed essential to
successful labour market integration and settlement. Points are awarded for qualifications,
skills, language proficiency, age, experience, and even wages (Table 3.1). The points that
work-permit applicants accrue determine if they are suitable for selection and enable
scores to be balanced against each other. The system was first developed with a supply
focus for migrants to Canada, Australia and New Zealand in order to select skilled migrants
with transferable skills and long term employability – which were difficult to capture with
a single criterion. For decades, the PBS was the main tool of discretionary migration control
and remains so in Australia, Canada and New Zealand. In recent years, other countries
have adapted it to their own ends, while the countries that first used it have reworked it
substantially.
Common criteria with differential emphasis. The earliest PBSs sought to identify highly
skilled immigrants by awarding more points to higher levels of education, relevant work
experience, and local language proficiency. There was no precise identification of skills.
Age was a standard criterion from the start since it is a known determinant of economic
and fiscal contribution over time. It is also an indicator of potential contribution to
population growth.
Besides meeting absolute minimum standards of health and character, some criteria
are mandatory even before an applicant scores any points. They include language
proficiency (Canada, New Zealand), a job offer in the host country (the United Kingdom
and Austria), wages (the United Kingdom requires salaries of at least GBP 20 000) and
maximum age.19 In Australia a skills assessment is now compulsory for primary visa
applicants before they apply under any PBS scheme. Countries also insist on prior
registration for occupations where such licensing is mandatory.
Korea recently introduced its own PBS as a minor component in its overall system. It is
designed to give fast-track residence to immigrants already in the country rather than those
seeking to enter. Japan also introduced a PBS in 2012 to support highly skilled migration.
Points systems differ significantly. Academic qualifications stand out across all systems
as a key requirement. The only exception is the United Kingdom’s “General” category in its
Tier 2 visa application. How general qualifications are scored varies. Although scores range
from 22% in Quebec to 86% in the Netherlands, they generally lie somewhere between 25%
and 50%-plus. While some countries award extra points for qualifications gained in the
destination country, particularly Australia which gives them between 23% and 38% in the
General Skilled Migration visa requirement, most rate foreign and domestic qualifications
as equivalent. A few countries, like Korea and Japan, require mandatory minimum
qualification levels.
The next most widely used standard criterion is language proficiency, which accounts
for up to 30% of an applicant’s total score – in line with the overwhelming evidence that
language proficiency is a determinant of successful labour market outcomes. New Zealand
awards it no points because it considers language a prerequisite for reaching the threshold
criteria. Australia insists on a minimum “competence” level and, though it does not award
points for that level, higher levels grant more points. Likewise Canada stipulates an
eligibility threshold then scores proficiency in listening, speaking, reading, and writing.
INTERNATIONAL MIGRATION OUTLOOK 2014 © OECD 2014164

3.M
AN
AG
ING
LAB
OU
RM
IGR
AT
ION
:SMA
RT
POLIC
IEST
OSU
PPOR
TEC
ON
OM
ICG
RO
WT
H
INT
ERN
AT
ION
AL
MIG
RA
TIO
NO
UT
LOO
K2014
©O
ECD
2014165
lected OECD countries,
alia Canada Korea New Zealand
Charaskilledtion
FederalQuebec(single)
Quebec(with
spouse)
Permanent admission
Requ No No No No
Chara
Jo 15-22* 11 10 50
Qu 0-29 0-25 0
Quoc 0* 10-40
Previ
W 22-31 0-15 0-13 10-30
Adoc 3 10-30
Ad 1 2-15* 2-13* 5-25
Acade
Ac 1* 7-37 4-22 3-19 31-44 50-55
Ador 8* 7 2-15* 2-13* 5-10
Adat
Langu
La 1 1-24 0-29 0-25 12.5-25 0
La 1-12 0-11 0-10
Age 8 3-15 0-29 0-25 22.5-31 5-30
Finan
Su
Pr
Cu 6.25-12.5
Table 3.1. Points attributed under different recruitment systems in seas a percentage of the pass mark, 2014
Austria Denmark Japan Netherlands United Kingdom Austr
cteristicTier 1;
highly-qualified
Tier 2;key workeror shortageoccupation
Tier 2;general
(employer-sponsored)
Generalmigra
Temporary admission, renewable
irement of job offer? No Yes No No Yes No
cteristics of the intended occupation
b offer or current employment in country 42
alified for/job offer in a skilled occupation 0* 28* 0
alified for/job offer in a shortage or growthcupation 0* 10 63*
ous work experience
ork experience (in general) 3-29* 4-20** 5 7-21
ditional points for work experience in specificcupations 5-10 8-2
ditional points for work experience in country 14* 8-20** 5-10* 14 8-3
mic qualifications
ademic qualification (in general) 29-57** 40-60 30-80 29-43 71-86 15-3
ditional points for academic qualification in countryregion 7-14 5-10* 7 0*-14 23-3
ditional points for academic qualificationtop6Hranked university 5-15 0*
age
nguage ability in first language 7-14 20-30 5-25 14 14* 14 0-3
nguage ability in second language 5-10 8
14-29 30-40 10-15 7-21 14 0-3
cial requirements
fficient funds for initial period 0 14
evious salary 29-43** 0
rrent salary 14-57 31-69

3.M
AN
AG
ING
LAB
OU
RM
IGR
AT
ION
:SMA
RT
POLIC
IEST
OSU
PPOR
TEC
ON
OM
ICG
RO
WT
H
INT
ERN
AT
ION
AL
MIG
RA
TIO
NO
UT
LOO
K2014
©O
ECD
2014166
Spou
So 4-7 0-25 20
Sk 7 20
Ot 7 5* 5* 10
Ch 4-15 3-13
Regioin rur 8 7 6 10
Other 0-15 0-13
Pass 100 100 100 100 100
Note:The p le maximum score is higher than the pass mark, percentagesadd uDenm rdic language, German or English. Five bonus points are givenfor D ce.Cana emic qualifications of partners and spouses may not exceed10 poCana l of 55 for single applicants and 63 for applicants who bringtheirAustr e there is a minimum income requirement. Tier 2 in Austriaand U In the United Kingdom, the latter requirement does not applyto gra hile a monthly cap applies to other (restricted) categories. Todeter d Australia, candidates who score the pass mark submit anExpreSourc
1 2 http://dx.doi.org/10.1787/888933157970
lected OECD countries,
alia Canada Korea New Zealand
Charaskilledtion
FederalQuebec(single)
Quebec(with
spouse)
Permanent admission
se and family characteristics
cio-demographic characteristics of spouse/partner 8
illed job offer of spouse/partner
her family characteristics
ildren
nal elements (study/settlement/employmental areas, sponsorship, etc.) 8-3
(personal impression, etc.)
mark 100 100 100 100 100 100 100
Asterisks denote */**/*** alternative requirements. Obligatory criteria are in bold.ercentages refer to the points that can be attributed under each criterion as a percentage of the pass mark. Since the possibp to more than 100%. In all countries in the table, temporary admission is generally renewable if the applicant has a job.ark: A maximum of 105 points may be awarded for academic qualification. Language skills can be proven in either one No
anish language skills. A maximum of 15 points may be awarded for country/region-specific work or educational experienda/Federal: All country/region-specific criteria also apply to spouses/partners. The country/region-specific points and acadints out of the required 67.da/Quebec: The maximum number of points for work/study/family in Quebec is altogether 8 points out of a required totapartners or spouses.ia: In the Highly-Qualified Scheme research activity scores extra academic qualifications points. In the Key Worker Schemnited Kingdom: In addition to a job offer, either employment in a shortage occupation or a labour market test is required.duates from British universities and to jobs where earnings exceed GBP 150 000. Both categories are also unrestricted, wmine admission within the capped limit, candidates are ranked by the number of points they score. In New Zealand anssion of Interest and are then sorted by their scores and invited to apply.
e: OECD Secretariat.
Table 3.1. Points attributed under different recruitment systems in seas a percentage of the pass mark, 2014 (cont.)
Austria Denmark Japan Netherlands United Kingdom Austr
cteristicTier 1;
highly-qualified
Tier 2;key workeror shortageoccupation
Tier 2;general
(employer-sponsored)
Generalmigra
Temporary admission, renewable
3. MANAGING LABOUR MIGRATION: SMART POLICIES TO SUPPORT ECONOMIC GROWTH
Some countries do not have the luxury of a language widely spoken outside theirborders, so recognise a second language (usually English). Two examples are Denmark andAustria. Canada, though, has the advantage of two languages that are spoken by a largenumber of people outside the country and awards points for both.
The United Kingdom, Japan and Korea are the only three systems that score salary,with the first two weighting the score highly as a proxy for labour market integration.20
Work experience, too, counts, with some systems awarding extra points for experiencein the destination country or in specific occupations. Reflecting the shift to demand-drivenpolicies, a prior job offer is becoming mandatory, as in the United Kingdom’s Tier 2 visarequirement. New Zealand gives job offer points a high 50% weighting. Consequently mostapplicants already on temporary status score well on the experience criterion.
Bonus points are also awarded for criteria such as jobs in remote areas, skilled andshortage occupations, qualifications in select disciplines, and close family ties. Extrapoints may also be awarded to applicants whose partner has a job offer and, as in Canadaand New Zealand, for socio-demographic characteristics that point to a family unit’spotential as economic contributors. In the case of Canada’s regional programmes, pointsare awarded for the personal impression that an applicant’s readiness for integrationmakes. Austria has bonus points specifically for professional athletes and sports coaches.
Overall points systems have two chief focuses: the labour market and settlement.Although most countries consider applicants’ labour market potential, the Canadian federalsystem and the province of Quebec look at adaptability and settlement. Both systems areexpected, however, to shift towards a greater focus on labour demand from 2015.
Recalibrating points-based systems can be difficult. PBSs are not set in stone. They areconstantly evolving, and the challenge is to design the points system that ultimatelydelivers the best labour market outcomes. Points are assigned according to the hostcountry’s migration-related objectives and on evidence of how the migrant applicant’sattributes contribute to achieving those objectives.
Monitoring and research on the outcomes of migrants admitted through PBSs in anumber of countries have shown that labour market outcomes are not always positive. Onepiece of Canadian research has suggested using a hybrid method that combines anactuarial approach along with employer preference21 and the Express Entry system(i.e. EoI) currently under development, is based on a combination of factors that predictemployment earnings.
Consequently, PBSs have changed over time, adding new criteria and scoringdifferentially. Points are awarded for a job offer or an actual job, for host-countryqualifications and experience (though research from New Zealand shows they yield nodifferential gains), local language proficiency, and wages earned in the host-country orcountry of origin. Australia also awards extra points to visa applicants whose nominatedoccupation is on the Migration Occupations in Demand List. However, in 2012, it alsolowered the new visa pass mark from 65 to 60 to encourage interest in migration from abroader range of people with the skills and attributes needed in Australia.
Recent changes in Canadian selection criteria in 2013 include more points for youngerapplicants and greater language proficiency. Canada has also ushered in an EducationalCredential Assessment (ECA) so that the education points awarded reflect foreigncredentials’ true value in Canada. New Zealand removed the points allocated to vocationalqualifications in preference for higher tertiary qualifications.
INTERNATIONAL MIGRATION OUTLOOK 2014 © OECD 2014 167

3. MANAGING LABOUR MIGRATION: SMART POLICIES TO SUPPORT ECONOMIC GROWTH
liaareperredndnt,nts
nyntsemes
isrolentoheto
viaces
isaedell.da
In other cases, points-based systems have been adjusted because of low uptake. Japan,
for example, loosened its stringent PBS criteria to that end in 2014.
Dealing with oversubscription. PBSs that are not purely job-oriented often attract large
numbers of applicants, since anyone can apply theoretically. However, evaluating each
application, even cursorily, leads to administrative overburden and backlogs. One solution
to this is the Expression of Interest (EoI) model, which relieves administrative personnel of
having to review all applications.
Under the EoI model, applicants who meet the self-assessed qualifying cut-off mark
and threshold requirements submit an expression of interest for consideration. EoIs are
placed in a pool and ranked against each other. Those which reach a pre-approved level
automatically receive an invitation to apply, while to those who fall short – between the
qualifying mark and the pre-approved level – invitations are issued according to demand
and the criteria for that period. If numbers of EoIs exceed the quota for one round, they can
be considered in the next round depending on how long the EoI is valid.
New Zealand first introduced the EoI model in 2003, followed by Australia in 2012
(Box 3.2). It was viewed as a second-step selection mechanism within the PBS that enabled
Box 3.2. How Expression of Interest (EoI) and Invitation to Apply (ITA) models work
The Expression of Interest (EoI) system was introduced in New Zealand in 2003. It was followed by Austrain 2012, with Canada poised to launch its own version in 2015. Although the two Australasian systemsbroadly similar, some key differences exist. New Zealand applicants can apply both online and using paforms. Applicants in Australia have to do so via the SkillSelect online portal which, however, registeemployers can access to seek suitable migrants directly.The Skilled Migrant Category is the only New Zealavisa category served by the EoI system while in Australia it covers the sub-classes, Skilled IndependeSkilled Nominated and Business Innovation. (New Zealand has a PBS for its Entrepreneur visa but applicado not have to undergo an EoI process, which may reflect the smaller numbers coming through.)
As for processing, SkillSelect system sorts all Skilled Independent sub-class applications without astaff input, while scores of above 140 points in New Zealand trigger an auto-pass. The rest of the applicago through a second-order sorting that prioritises on criteria such as job offers. In other words, the systdoes not automatically continue sorting. The Australian Skilled Nominated stream, though, involvassessment by state or territory.
Selection in New Zealand is based on criteria relevant on the date when the residence applicationmade – not on the date when the EoI was filed or the application drawn from the EoI pool, to ensure contover selectivity. In practice, however, successful invitations to apply (ITAs) typically progress even whcriteria have changed. Furthermore, an EoI’s validity is six months, while Australia leaves it open for uptwo years with applicants having the option of improving their scores if circumstances change. On tother hand, the NZ system provides temporary 9-month Skilled Migrant Category (SMC) Job Search visathose who have not made the cut-off but are assessed as having potential. System transparencyperiodical publication of pass marks and numbers selected means applicants have a sense of their chanof being invited to apply and gaining admission.
EoIs have noticeably shortened processing times in both countries. Because Australia has multiple vapplication streams, it uses a ranking system for processing with the regional stream being assignnumber one priority. As for outcomes from both systems, principal applicants appear to be faring wOversubscription to PBS selection systems continues in Australia and in countries without EoI (e.g. Canaand the United Kingdom).
INTERNATIONAL MIGRATION OUTLOOK 2014 © OECD 2014168

3. MANAGING LABOUR MIGRATION: SMART POLICIES TO SUPPORT ECONOMIC GROWTH
greater control over the selection process. Canada plans to implement its Express Entry EoI
model in order to attract the best and brightest candidates and to address backlogs in the
selection system resulting from the requirement to process every application accepted.
New Zealand has eliminated its pre-EoI oversubscription problem by deciding to
examine only those applications that score the pass mark. Most are actually approved. The
country then had to grapple with a new issue – that of a fall in numbers of applications
(Figure 3.4) prompted by dwindling labour market demand.22 The dilemma was to take few
immigrants or to lower the pass mark and take lower-scoring applicants. New Zealand
chose the first option.
The PBS can be used with multiple pathways. When originally introduced, PBSs
generally used an “automatic” pass mark above which all applications had to be processed
or approved. Where PBSs are used in conjunction with overall targets, applications that
stand no chance are weeded out with quotas and floating pass-marks so as to maintain
minimum immigration standards.
Because they rank each and every applicant, PBSs allows countries to build up reserve
pools of applicants who miss out on a threshold or initial quota. In the event of
oversubscription, pool thresholds can be raised to the pass mark, which is Australia’s
current practice.
PBSs can also be used to group applications into second tiers. New Zealand has a
second-tier group comprising candidates who have scored the pass mark, but do not meet
other criteria, such as having a skilled job offer. Applicants in this situation are interviewed
to determine their settlement prospects. If they are thought to have the right potential,
they may be offered a Skilled Migrant Job Search visa (Figure 3.5, Panel A). It grants them
nine months to find skilled employment which qualifies them for permanent residence.
The Netherlands, Denmark, and Austria issue similar job-search permits on the basis of
PBS performance. They offer only temporary residence but include provisions for
transitioning to permanent leave to stay.
Figure 3.4. Expression of interest submitted and selected, New Zealand, 2006-13
Source: Ministry of Business, Innovation, and Employment, New Zealand.1 2 http://dx.doi.org/10.1787/888933157703
0
1 000
2 000
3 000
4 000
5 000
6 000
0
30
60
90
120
150
180
2006/09
2006/12
2007
/03
2007
/06
2007
/09
2007
/12
2008/03
2008/0
6
2008/09
2008/12
2009/03
2009/0
6
2009/09
2009/12
2010
/03
2010
/06
2010
/09
2010
/12
2011
/03
2011
/06
2011
/09
2011
/12
2012
/03
2012
/06
2012
/09
2012
/12
2013
/03
EOIs submitted EOIs selected
Average points at selection (right-hand scale)
INTERNATIONAL MIGRATION OUTLOOK 2014 © OECD 2014 169

3. MANAGING LABOUR MIGRATION: SMART POLICIES TO SUPPORT ECONOMIC GROWTH
s
fiedoups
1
g
nts
st
s
tion st int.
Figure 3.5. Expression of Interest Systems (EoI) make ITA
Potential candidates maybeinvited to apply for 9 month temporary SMC Job Searchvisa.
Independent/State/Reg/Family nominatedset at 44 990 (57.5%) of total 128 550 for Skill/Business stream in 2013-14 (includes family of Skilled/Business principals).
Independent (permanent), Nominated (permanent), State/Regional nominated/sponsored (provisional),Business talent (permanent), Business innovation and investment (provisional).
Independent (permanent), Nominated (permanent), State/Regional nominated/sponsored (provisional), Businestalent (permanent), Business innovationand investment (provisional).
SKILL SELECT(only on-line)Access for Employersto database – employersponsored will not receive ITA.
Visa processing phaseHealth, Character and points veri
− processing is prioritised into 5 gre.g. Regional Sponsored is No.
Visa processinphase
Full verification of poiclaimed
Fortnightly release of newpass mark – EOI is validfor 6 months.
Two invitation rounds per month. Invitation score can change. EOI valid for 2 years.
SMC (60% ofNew Zealand residence programme of annual 45 000-50 000 range).
Skilled Migrant Category SMC (permanent) Skilled Migrant Category
EOIOn-line + paper
EOICan mark preference
for multiple visas, regions.
ITA
ITA
• Health, character, English language are pre-requisties, points for employability, capacity and bonus pointsfor e.g. job outside Auckland, Long term Skill Shortage (minimum 100 points).
• Independent – Age, English language, nominate SOL occupation, Skills assessment (60 points).
• Nominated/sponsored – Age, English language, nomination/sponsorship for CSOL/SOL occupation, Skills assessment (60 points).
• Business innovation and investment – Age, English language, business history, assets (65 points).
• Independent – system auto-selects by higheEOI above pass-mark (not staff), subjectto occupational ceilings.
• Nominated – assessment by state/territorybut no occupational ceiling.
• Business innovation and investment – Statecan assign additional points for innovation –subject to cap.
• Auto-pass above 140, partial verification – staff select EOIs with score between 100 and 139 that include pointsfor a skilled job or job offer, if spaces still available then use additional criteria to select lower-scoring EOIs.
Submit residence applica– final assessment againcriteria is made at this po
60 days limit to submit residence application.
Panel A. New Zealand
Panel B. Australia
SKIL
L SE
LECT
INTERNATIONAL MIGRATION OUTLOOK 2014 © OECD 2014170

3. MANAGING LABOUR MIGRATION: SMART POLICIES TO SUPPORT ECONOMIC GROWTH
As PBSs identify applicants who are eligible to work, they can be linked to job vacancy
registers so that employers can pick from a pool of pre-approved workers. Australia’s
electronic SkillSelect portal allows PBS applicants to match their skills to the needs of
employers who signed into the system (Figure 3.5, Panel B).
Although PBSs were originally developed as a supply-side tool, there is no reason why
they should not incorporate demand – or even, as in Japan, be exclusively demand-
oriented. The evidence to date on labour migrant outcomes underlines how stepping into
a job on arrival has positive effects on skills matching and employability (Box 3.2).
Incorporating a regional dimension into selection and admission
There are, in many OECD countries, wide labour market disparities between regions,
with some experiencing more acute labour shortages than others. Traditionally, labour
migration to settlement countries has been disproportionately to metropolitan areas,
where labour markets are larger and networks better consolidated. Indeed, the drawing
power of networks and urban agglomerations can run counter to targeted migration
policies meant to attract newcomers to regions. Australia and Canada have given regions a
role in picking labour migrants, although they have to contend with the challenge of
appealing to migrants who have access to an entire country’s labour market. Spain, for
example, has responded by requiring labour migrants who are admitted to fill a job
vacancy to stay in the region for at least the first year.
Labour market tests are a key part of labour migration frameworks
Protecting the jobs and working conditions of host-country workers is a prime concern
pretty much everywhere. One of the chief regulatory tools for ensuring that labour migration
does not impair local workers’ prospects or situations is the labour market test (LMT).
The LMT dates back at least 60 years and was codified as early as 1953 by the
Manpower Committee of the OEEC,23 which opened member states to labour migration “as
soon as it [was] established that suitable labour, national or foreign, forming part of its
regular labour force, [was] not available within the country for the employment in
question”. Variously called a “labour market test” or “opinion”, the LMT assesses whether
a job could be done by an available home-grown worker, whether citizen or resident.
Procedures and criteria vary across countries (see Table 3.A1.2), but are generally designed
to ensure that jobs are advertised locally and that employers are in good faith when they
claim they must recruit from abroad.
LMT processes and requirement varies. The first step is widely to advertise a vacancy
with the public employment service (PES) or, for some jobs, with the national or regional
visa processing agency. Once the position has been advertised for a set time, it is opened
up to migrant recruitment or the employer receives authorisation to hire from abroad. The
OEEC set the job advertising time at one month, with an additional month possible.24
Currently, it can be anywhere between 10 days in some countries to 35 days in, for
example, the Netherlands. Some countries have no statutory limit, and respond in due
time (Figure 3.6).
LMTs may require European countries in the European Employment Service (EURES)
to list vacancies with the national PES as well as the EURES network, though PESs often
do automatically transfer them. Many countries require employers to pay for job
advertisements, with varying criteria attached to their duration, choice of media channels,
INTERNATIONAL MIGRATION OUTLOOK 2014 © OECD 2014 171

3. MANAGING LABOUR MIGRATION: SMART POLICIES TO SUPPORT ECONOMIC GROWTH
geographical coverage, and actual descriptive content. For instance, Ireland, in addition to
the PES/EURES listing, requires a vacancy to be advertised in a national newspaper for at
least three days and in either a local newspaper or job website for three days. Countries
may also stipulate how a job is advertised to ensure it actually reaches and encourages
local workers to apply. In the United States, employers wishing to hire a foreign worker
through H-2 temporary work programmes must advertise in two Sunday newspapers,25
while Canada requires jobs to be listed for four weeks with the PES and through two media.
Employers are required to demonstrate they are seeking to fill vacancies, though the
burden of proof varies according to country and to programme. Additional evidence for
local recruitment efforts may include labour market research, attendance at jobs fairs,
interview records, and rejection letters. In Spain, the PES evaluates applications and
requires employers to justify any rejection of candidates sent for interviews. In Korea,
employers wishing to recruit non-professional foreign workers through the Employment
Permit Scheme must explain their inability to fill positions locally. In New Zealand an
employer’s “genuine attempts” to recruit include assessing the number of local candidates
who applied and were interviewed.
In addition to the LMT, further assessment includes checking if a job offer is
“reasonable” insofar as it matches the conditions of a similar job for a host-country worker
(comparable wages, working hours, duties, etc.). For wages, this would typically mean
considering the market or prevailing rate for the specific occupation and whether it is in
line with the average wage. In the United States, such checks, called “labour certifications”,
are conducted automatically online. In Canada, the wage offered is reviewed and compared
to the prevailing wage paid to Canadians (i.e. the median hourly wage paid in an
occupation and specific geographical area).
Figure 3.6. Duration of the labour market test for various typesof labour migration permits, 2013
Days
Notes: Where countries have varying durations for different visa/permits, the lower end of the range is used. Forinstance Germany takes up to 14 days for seasonal work, Spanish Seasonal Work takes 25 days and Finland 2-4 weeksfor low-skill work. In some instances, numbers denote the average days used in practice as in New Zealand. Austria,Australia, Denmark and Switzerland have no fixed duration. Estonia, Greece, Israel, Japan and Mexico have no LMT.Source: OECD Secretariat.
1 2 http://dx.doi.org/10.1787/888933157728
0
10
20
30
40
5
15
25
35
None or variable
German
y
New Ze
aland
United
States
Sweden
Finlan
d
Irelan
dKor
ea
Poland
Hunga
rySpa
in
Luxe
mbour
gIta
ly
United
Kingdo
m
Canad
a
Turke
y
Belgium
Czech
Rep
ublic
Portug
al
Slovak
Rep
ublic
Netherl
ands
Austra
lia
Austri
aChil
e
Denmark
Eston
ia
Franc
e
Greece
Israe
l
Japa
n
Mexico
Norway
Poland
Sloven
ia
Switzerl
and
INTERNATIONAL MIGRATION OUTLOOK 2014 © OECD 2014172

3. MANAGING LABOUR MIGRATION: SMART POLICIES TO SUPPORT ECONOMIC GROWTH
Generally the final decision to authorise the recruitment of foreign workers comes
from the PES or equivalent body. In some countries – like Germany, New Zealand, and
Sweden – the decision is made by the immigration agency in consultation with the relevant
PES agencies or, where their advice is non-binding, the social partners. In Sweden, the
Swedish Migration Board encourages employers to seek the opinion of the relevant trade
union, although it is not binding. Similarly, union consultation and involvement in job
seeking is a positive factor in reviewing applications. In New Zealand, the Labour Market
Check (LMC), by which advice is sought from the Work and Income office (the country’s
PES), is a component in the Labour Market Test. LMC results are factored in when
determining whether an LMT has been duly performed, but are not the only or final
determinant of approval. Officers also consider the employer’s needs and efforts to
recruit – whether the position requires special skills, evidence of attempts to hire
New Zealanders, and any other relevant information when making a decision.
There are exemptions to the LMT. A job may be exempted if it is on a shortage list,
meets certain thresholds (e.g. minimum wage levels or qualifications), or falls into certain
categories. Intra-company transferees, for example, usually have the LMT waived. In some
cases it is waived for employers with sponsor status or who have prior approval for
overseas recruitment. Exemptions can also affect the period of validity of a visa or work
permit, as well as whether it will be automatically renewed or whether a candidate will
have to apply afresh when it expires.
Issues in applying the labour market test. As a means of managing labour migration,
several countries use LMTs in conjunction with shortage lists (Table 3.2) and across all skill
levels. The United States uses them extensively across categories, with some listed
occupations exempted. Norway uses LMTs when its quota for highly skilled workers is
exhausted.
One issue with the LMT is that it further lengthens the process of deciding whether to
allow the use of a migrant worker. And where countries exercise discretionary control, it
may be applied unevenly by different officials and regions, so raising the issue of quality
assurance and fairness of assessments. Such issues can be further compounded by
conflicting views between a PES and employers on the “availability”, “suitability” or
“willingness” of candidates on the unemployment register to fill vacancies.
Determining prevailing, average/median, or market wage rates is not straightforward,
and raises the question of regulating the market rate rather than letting the market
determine the rate. There may also be integrity issues, such as whether an employer has
inflated a job description and shown preferences for foreign workers, particularly in
certain occupations and sectors. A toothless or token LMT cannot counteract such risks.
If an LMT’s rejection rates are low, which often is the case in times of growth or tight
labour markets, the LMT may effectively become nominal. Both Sweden and Finland have
moved away from requiring LMTs, while Canada and Australia have, on the contrary,
further tightened reviews. In late 2013, Canada imposed new requirements on LMTs for
more detailed information and closer scrutiny of job advertising content criteria. Australia,
which had given up its LMT in favour of minimum salary levels, revived it in its Skilled
Temporary Work programme in late 2013. It does, however, incorporate exemptions.26 By
contrast, high rejection rates can be a further disincentive for employers, especially during
periods of labour market slack.
INTERNATIONAL MIGRATION OUTLOOK 2014 © OECD 2014 173

3. MANAGING LABOUR MIGRATION: SMART POLICIES TO SUPPORT ECONOMIC GROWTH
While LMTs can help ensure that employers effectively attempt to recruit locally
before looking abroad, their processing resources and delays mean they come at a cost.
Total processing time for visa applications can be affected by LMT processing times,
increasing the length of time a company has to wait before the worker it needs steps into
the job. While such delays may actually encourage employers to prioritise local
recruitment, they can be a thorn in their side in the event of labour shortage. This is one of
the main reasons why shortage occupations have been added to exemptions.
Shortage and occupation lists
A shortage occupation list is a tool used primarily alongside LMTs for protecting the
domestic workforce from being displaced or replaced by migrant workers. Inclusion on
shortage lists denotes an occupation in demand. Such lists either exempt employers from
going through individual labour market tests or make it otherwise easier for employers to
employ foreign workers. As a tool the lists are slightly less extensively used than LMTs
(Table 3.2).
Table 3.2. Use of shortage list and labour market tests in OECD countries, 2014
Shortage List Labout market tests
Australia ✓ ✓
Austria ✓ ✓
Belgium ✓
Canada ✓ ✓
Chile
Czech Republic ✓
Denmark ✓
Estonia
Finland ✓ ✓
France ✓ ✓
Germany ✓ ✓
Greece ✓ ✓
Ireland ✓ ✓
Israel
Italy
Japan
Korea ✓
Luxembourg ✓
Mexico
Netherlands ✓ ✓
New Zealand ✓ ✓
Norway ✓
Poland ✓
Portugal ✓ ✓
Slovak Republic ✓
Slovenia ✓
Spain ✓ ✓
Sweden ✓
Switzerland ✓
Turkey ✓
United Kingdom ✓ ✓
United States ✓ ✓
Source: OECD Secretariat.
INTERNATIONAL MIGRATION OUTLOOK 2014 © OECD 2014174

3. MANAGING LABOUR MIGRATION: SMART POLICIES TO SUPPORT ECONOMIC GROWTH
Shortage lists typically identify those occupations in demand in the short term and are
at times used interchangeably with occupation lists. The Spanish hard-to-fill-jobs
catalogue is oriented towards immediate shortages. Lists like the Australian Skilled
Occupation List (SOL) or the New Zealand Long-term Skill Shortage List (LTSSL) generally
refer to occupations in demand over the medium term that express a structural need.
The function of a shortage list. By removing individual labour market testing, the list in
one sense becomes a variant of the LMT or acts as a blanket LMT approval applied to
individual occupations for a defined period. In fact, the lists are usually – but not always –
a consequence of the LMT process and the need to accelerate the processing of applicants
for certain occupations.
Evolving criteria and process. Shortage lists draw on objective criteria that are generally
built on vacancy rates (OECD, 2008a). In practice, they incorporate quantitative and
qualitative factors: labour supply-and-demand trends, the availability of local workers
(who include regular migrants in the country), the duration of vacancies, unemployment
rates by sector, the ratio of vacancies to unemployment rates or job seekers, and
consultation with social partners and key experts (see Table 3.A1.3).
France’s shortage list contains jobs for which the ratio of the unemployed to vacancies
is one or less for at least one year. Spain uses a similar formula, although the PES then
discusses the jobs on the list at a regional and national level with the social partners. In the
United Kingdom, the Migration Advisory Committee (MAC) uses a more detailed algorithm,
with 12 vacancy, wage and employment indicators as parameters. The MAC then takes into
account qualitative evidence ranging from training data to stakeholder testimony. The
Swedish shortage list draws on the National Occupational Barometer, a general orientation
index that uses vacancies reported by local PES offices. New Zealand, where there is no
administrative data on the ratio of the unemployed to vacancies or the average vacancy
duration, uses a number of indicators. It takes long training times and the number of years
an occupation is on the shortage list as indicators of long-term shortage.
In 2014 Greece passed a new law that requires “volumes of admission” to be established
every two years. The numbers of and criteria for admissions are determined through a
consultation procedure that brings together the social partners (the Economic and Social
Council of Greece) and actors who have good knowledge of the local labour market (the
Regions’ Directorates for Development, employers’ unions and the Manpower Employment
Organisation). Determining labour force needs involves taking into account, among other
factors, the national economic interest, the supply of labour from the domestically available
labour force (Greek and EU citizens and third-country nationals legally residing in Greece),
and the unemployment rate per economic sector. Employers can then submit applications
that “invite” non-EU workers to apply for jobs identified as shortage occupations.
Where shortage lists cater to the demand for high-level skills, they are linked to
specific occupations in national occupation classification systems and their corresponding
qualification and experience requirements. For highly skilled occupations, the
requirement is a trade-related, vocational, or university degree of three years and above.
Lists will also specify where registration or licensing is required. National occupation
classification systems vary in their specifics: Spain, Canada, and the United Kingdom use
4 digits, France 5, and New Zealand and Australia the 6-digit ISCO system.27 Experience is
seldom considered a substitute for qualifications.
INTERNATIONAL MIGRATION OUTLOOK 2014 © OECD 2014 175

3. MANAGING LABOUR MIGRATION: SMART POLICIES TO SUPPORT ECONOMIC GROWTH
Usually local, regional and national government agencies whose mandate is the labour
market, such as the PES, help compile shortage lists in consultation with employers and
trade unions. In some instances, it is the job of statutory bodies, like in the United Kingdom.
Some countries use more extended-phase processes. New Zealand’s MBIE makes a public
call for nominated occupations to be added, removed, or kept on the list. It then produces a
preliminary evidence report on the selected occupations which it completes with a final
round of consultations.
The frequency of list review periods varies between once every 6 months and up to
two years. More frequent revisions are exceptions: New Zealand’s skills shortage list for the
earthquake-hit Canterbury area or Spain’s hard-to-fill jobs catalogue are revised quarterly.
There are also some much less regular revisions: the United States’ Schedule A shortage
occupation list was drawn up in 2005 and has not been modified since, while the German
EU Blue Card shortage list enshrines occupations in legislation.
Different applications of the lists. Lists serve different purposes. Some, for example, cut
across the entire skills spectrum. In France, Germany, Spain, the United Kingdom, and the
settlement countries, they are confined to jobs requiring specific skills, while in Finland
they mainly include certain low-skilled jobs. Irrespective of the skills level, however, many
countries use lists for their temporary worker admission programmes. Examples include
the Danish Positive List, the Belgian general lists of “bottleneck” occupations, the Finnish
and Swedish occupational barometers, France’s shortage list, Greece’s “volumes of
admission”, Germany’s Positive List, Spain’s “hard-to-fill job catalogue”, and New Zealand’s
Immediate Skill Shortage List.
The occupational lists that reflect medium- to long-term demand are the Long-Term
Skills Shortages List (LTSSL) of New Zealand, Australia’s SOL, Canada’s Eligible Occupations
List (EOL), and the United Kingdom’s Shortage Occupation (SOL). All are aimed at
independent, highly skilled workers and usually offer direct pathways to permanent
residence. In Austria, Australia, Canada and the United Kingdom (Tier 2), nominating a
shortage occupation or having worked in it is a boon under the points-based system. In
New Zealand applicants can claim bonus points for any occupation on the LTSSL.28 The
United Kingdom structures its PBS so that under Tier 2, priority is given to migrants who
arrive via the shortage occupation list.
Lists are linked to numerical immigration controls through overall and sub-group
quotas with built-in provisions for adjustment to changing priorities and demand.
Australia has occupational ceilings for those arriving through permanent residence routes,
as does Canada. The idea is that no occupational group dominates entries and there is an
even distribution of migrant workers across the occupational groups.
Lists can also be specific to regions or industrial sectors, as in the settlement countries
that have regional or provincial lists. The US uses a shortage list (Schedule A) for its
employer driven EB2 and EB3 programmes. Lists may also be tied to bilateral agreements,
as in France, as a way of encouraging labour mobility from countries with historical ties
and common language. Sweden uses shortage lists only to allow within-country changes
of status.
Some countries draw up “ineligibles lists” that specifically exclude migrants from
certain occupations. Examples are Portugal, Ireland, and France, although they do not use
them extensively and Portugal never. The possibility was actually entertained in 1953 as
INTERNATIONAL MIGRATION OUTLOOK 2014 © OECD 2014176

3. MANAGING LABOUR MIGRATION: SMART POLICIES TO SUPPORT ECONOMIC GROWTH
part of the OEEC Manpower Committee’s decision which allowed states to apply exceptions
to recruitment or set caps on migrants in specific industries and occupations. Canada
introduced a “negative list” in 2013 for its Canadian Experience Class (CEC) programme.
How extensive and detailed lists are depends on what the objectives behind them
are – whether it is to meet permanent migration or temporary worker demands and, more
importantly, at what skills levels. The list may cover few occupations. In 2008, the
United Kingdom’s Migration Advisory Committee (MAC) list spanned occupations which
accounted for a mere 2.5% of employment, while contemporaneous Spanish and French
lists applied to jobs with an even smaller share of employment (OECD, 2011d).
Identifying shortages in the labour market that can be addressed through labour
migration may have an effect on training policy. In several countries, migration and
training are explicitly linked, with the labour migration system subsidising training and
training focusing on occupations where recruitment is often from abroad (Box 3.3).
Box 3.3. A training link to migration policy
Where temporary labour migration is perceived as meeting needs which cannot be metlocally, admission may be tied to the provision of training to local workers in order toreduce future recourse to migration.
In the United States, the H-1B programme requires employers to contribute to a trainingfund. Grants from the fund provide much-needed skills training in high-growth industrieslike healthcare and information technology. The overall idea is to keep Americans employedin jobs that pay well, to sustain training programmes targeted to occupations in demand,and to reduce American dependence on foreign labour. Grants are distributed nationallywithout consideration of metro areas which request the highest number of H-1B visas.
In Israel, in the early 2010s, the government subsidised training courses for local workersso that they could fill specific construction jobs which had been filled by temporary workschemes.
Australia expects sponsors whom they approve to invest in training and make an effortto employ local workers. The country also requires that employers should devote no lessthan 2.5% of their annual budgets to training. Similarly, a consideration in New Zealand’slabour market test is whether employers provide training programmes for local workers.
Concerns along the same lines have been voiced about shortage occupation listsfacilitating international recruitment. A “sunset clause” placing a time limit on theshortage-list recruitment period has been considered in the United Kingdom* and inNew Zealand to prevent disinvestment in local training by employers who may get used toeasy access to international recruitment.
Recently, however, lists have been tightened as some of the less skilled occupations havebeen removed so reducing the overall number of occupations. But providing advancenotice of impending changes to key stakeholders and clients has been a further step. Theexample of a sunset clause for occupational groups in skill shortage lists is an example ofhow to give advance warning to employers, training providers, local trainees, and foreignworkers so that they can adjust to the new regime.
* Migration Advisory Committee, 2013.
INTERNATIONAL MIGRATION OUTLOOK 2014 © OECD 2014 177

3. MANAGING LABOUR MIGRATION: SMART POLICIES TO SUPPORT ECONOMIC GROWTH
Challenges in using shortage lists. Even allowing for data limitations, there is no
universal consensus on the definition of a skills shortage. Accordingly, the methodology
appears to be moving towards mixed methods that use multiple indicators and qualitative
factors, including consensus, to determine shortage occupations. Overall, the use of lists is
spreading, even though they are becoming increasingly selective and scaling back. Most
have seen reductions in numbers of occupations and a shift in their nature from trades
to professional occupations. Caps and quotas have been strengthened and requirements
– like qualifications, experience, and wages – have become more stringent for occupations
on the list. Canada caps the number of labour migrants admitted as part of all its
occupational allotments, but is also moving away from shortage occupation lists with its
new Express Entry PBS which it will usher in 2015.
Still, shortage lists do offer advantages. They are tighter and more consistent than
individual decentralised labour market tests carried out across various offices. However,
they are only periodically reviewed and so may not be responsive to addressing shortages.
Governments must therefore choose between investing in decentralised individual or
centralised mass assessments of shortage occupations and the certainty they afford
migrants and employers of faster processing.
Lists are visible, mirror demand, are revised, and signal that labour migration is
focused on specific occupations. Further, they can be used to reflect medium- to long-term
demand for occupations by linking with and drawing on education, training, and workforce
planning. They can also serve the more strategic purpose of linking with other policy
objectives (as do Australia’s SOL and CSOL occupational lists, Canada’s SOL, and Germany’s
“job monitor”). Lists can also help international students wishing to work in a host country
after graduating there to identify fields of study with employment prospects. As for
employers, because they can use lists to identify occupations that afford immediate or
eventual residence, they are able to offer more reliable packages to foreign workers.
On the downside, lists where some occupations appear persistently for long stretches
may have unintentionally adverse impacts, like lack of investment in local training or path
dependency. One response is to introduce a sunset clause that time-limits occupations to
a set number of years or cycles.
Another concern is that list finalisation processes may introduce an element of
discretionary control, exposing processes to interest and stakeholder groups who plead the
cause of keeping or removing certain occupations. To some extent, the United Kingdom
has countered that eventuality through a statutory body that compiles lists with the aim of
offering independent advice.
Lists may be targeted by would-be migrants looking for the simplest means of access.
That risk was one reason for Australia making changes to its lists. It removed occupations
like hairdressing for which the relatively low qualification criteria had led to large numbers
of applications. Similar considerations prompted Canada to review provincial lists
admitting temporary workers in the 2000s.
Finally, lists may simply not play a major role in determining labour migration flows.
Denmark’s Positive List, for example, accounts for less than 2% of admissions. In the year
to September 2012, the United Kingdom issued only 1 400 out-of-country certificates of
sponsorship for shortage occupations, a fraction of the total. In such cases, it is legitimate
to wonder whether producing lists is a worthwhile exercise when efficiency gains are so
meagre. This is in contrast to countries where most inflows are under the shortage list. For
INTERNATIONAL MIGRATION OUTLOOK 2014 © OECD 2014178

3. MANAGING LABOUR MIGRATION: SMART POLICIES TO SUPPORT ECONOMIC GROWTH
example, since 2008-09, of all the temporary workers in the Essential Skills category
admitted into New Zealand, one-third boasted skills that were on the shortage list, while a
few permanent migrants claimed bonus points for occupations on the LTSSL. In Sweden,
half of labour migrants were in occupations on the shortage list, even though the list was
not the grounds for entry (OECD, 2011b).
Where it is too difficult to identify skilled occupations, or where occupations are so
unusual as to defy classification or merit inclusion on a list, wage thresholds may be used
as a proxy for skills. They are the criterion underlying the EU Blue Card Directive, which
sets a wage threshold of 1.5 times the average national salary, with the option of 1.2 for
occupations where there is an identified shortage. Germany and Norway also used wage
thresholds, although both have discontinued them. In Denmark, most labour migrants are
admitted through a channel which uses a minimum wage as a main criterion.
New Zealand requires migrant applicants to earn a minimum base salary of NZD 45 000
under its LTSSL-related work-to-residence policy, which accounts for a tiny share of all
temporary work visas. Its Skilled Migrant Category permanent residence visa also has a
salary threshold, in addition to qualifications and work experience or, for a small number
of semi-skilled occupations (Skills Level 3), work experience alone.29
Services for employers
Critically, employer-driven migration requires employers and migrant workers to
share information and negotiate. Governments help mediate in ways that complement the
interaction that takes place through labour market channels. In this sense their role is to
generally facilitate labour markets.
Job fairs. Job fairs are a key forum for providing and seeking information and matching
employers with employees. A number of countries stage them to give employers and
prospective migrant workers an opportunity to meet face to face. They are particularly
widespread in countries with proactive labour migration policies that set targets, like the
settlement countries. But many other OECD countries hold them in attempts to offset their
regional or occupation labour shortages, and representatives from industry, regions, and
local communities attend in order to pitch themselves to migrant workers.
The Destination Canada Job Fair affords Canadian employers access to workers with a
wide variety of skills in French-speaking countries like Belgium, Tunisia, and France. The
Canadian Embassy in Paris and Brussels presents to pre-screened participants Canada’s
diversity and the opportunities it offers for working temporarily or settling permanently.
Representatives of Canada’s provinces, territories, and Francophone communities take
part. Employers seeking to meet demand in specific sectors such as hospitality, translation,
IT, multimedia, etc. can register directly on the Destination Canada website.
Canada’s Settlement Program also funds employment-related interventions delivered
by community organisations to help newcomers connect with local businesses,
understand the Canadian labour market, and seize opportunities to work in their field of
expertise. Such initiatives may focus on specific sectors of the labour market and can also
take place through an online platform.
Immigration New Zealand (OECD, 2014) stages recruitment fairs in the main countries
of origin. They are a chance for interested candidates to make visa queries and obtain
information about living and working in New Zealand. Employer representatives are often
INTERNATIONAL MIGRATION OUTLOOK 2014 © OECD 2014 179

3. MANAGING LABOUR MIGRATION: SMART POLICIES TO SUPPORT ECONOMIC GROWTH
present. Similarly, the Australian immigration department attends skilled migration
events (e.g. Australian Futures) around the world, though chiefly in Europe, to provide
information on migration options and skills requirements.
The European EURES network also regularly holds job fairs where employers have the
opportunity to meet applicants from other EU countries. They present their company, the
jobs available, the qualifications they are looking for and may even take the opportunity of
conducting job interviews. In Germany, for example, the foreign branch of the Employment
Agency, ZAV – originally created to place unemployed Germans abroad – has expanded its
incomer services, organising recruitment fairs for German employers in co-operation
with local employment agencies in EU countries only (OECD, 2013b). Norway’s public
employment service also draws on the EURES network to arrange job fairs for specific
occupations in other countries in the European Economic Area (EEA). In Japan, the Ministry
of Health, Labour and Welfare recently started supporting businesses by organising job
fairs for international graduates to foster in-country campus recruitment.
Job matching. Job fairs are limited in scope and serve to target specific sector or occupation-
related needs. On the other hand, governments also create virtual marketplaces that take
advantage of digital online technologies through web portals and databases where employers
and migrants can advertise vacancies and submit CVs to enable faster matching. Governments
are not competing with private recruitment agencies and matching services in this way, since
they are only gatekeepers who determine which labour migrants are admitted.
Australia’s SkillSelect is an electronic system where skilled workers and business
people interested in migrating to Australia have been able to submit their details and
expressions of interest (EoIs) since 2012. They may then be contacted and nominated for
skilled visas by Australian employers or state and territory governments, or the Australian
government may ask them to lodge a visa application. Migrants who submit EoIs may also
indicate that they would like to be contacted directly by employers with registered access
to SkillSelect. Equally they can choose to go no further with the EoI process.
Immigration New Zealand’s employer website incorporates a database called
SkillFinder. Employers can search it for individuals – by occupation, academic
qualification, residence, and years of experience – who have stated their interest in
working and living in New Zealand. SkillFinder and its matching tool helps employers
looking to fill an occupation that is highly skilled30 or is on skills shortage lists to find
candidates who meet accredited employer requirements. When employers locate a
potential worker, SkillFinder emails him or her. Migrants have to register on Immigration
New Zealand’s website (NewZealandNow) if they want to be in the SkillFinder database.
However, unlike the Australian SkillSelect system, there is no prior screening of skills that
meet immigration requirements. That is the next step.
WorkinDenmark is an Internet portal that includes a job-and-CV bank for highly
skilled individuals. Employers can view posted CVs but need to be registered to access
candidates’ contact details. WorkinDenmark is a one-stop shop that also combines other
services for migrants and employers described in greater detail in the last part of this
chapter. The Czech Republic’s PES lists vacancies which employers have shown interest in
filling from abroad as well as locally. For professional migrants already legally in the
country and entitled to work, Canada’s SkillsInternational.ca website provides a searchable
database of qualified applicants. An employment preparation agency screens applicants
for work in a field related to their education and experience.
INTERNATIONAL MIGRATION OUTLOOK 2014 © OECD 2014180

3. MANAGING LABOUR MIGRATION: SMART POLICIES TO SUPPORT ECONOMIC GROWTH
EURES, the European Job Mobility Portal, advertises job vacancies from 31 European
countries, CVs from interested candidates, and guidance on recruiting migrants. It is
supported by PES and EURES advisors in European countries and regions. Confined to the
EU, it matches employers and less skilled workers. Bilateral agreements also incorporate
similar matching provisions (see below).
Outreach. Incorporating labour migration into human resource strategies would usually
be expected to be an employer initiative. Some outreach schemes may now get them
thinking about it. One example is the Australian Outreach Officers Network for three
different stakeholder groups – regions, industries, and national unions. The Outreach
Officers are posted out or operate from departmental offices and provide information
about skilled migrant recruitment, immigration options for managing skill shortages,
employer obligations, and migrant worker rights. In Japan, the Ministry of Health, Labour
and Welfare has started organising fairs, and developed a manual to explain to companies
how to bring high skilled foreigners with non-Japanese qualifications into their business
operations. Similar initiatives can be found in a number of European countries.
Employer sponsorship and accreditation
In the first instance the rationale behind sponsorship is to shift the burden of compliance
towards the employer and emphasise the importance of local recruitment. In the case of
seasonal workers, a vulnerable group, it is also to protect them by monitoring employers.
The sponsorship approach is aimed at mostly medium-sized and large companies that
require a number of workers over a period of time and have the scale and systems in place
to manage their accredited status. Its appeal and utility for smaller employers may be
limited. Still, few countries use the approach. Where the LMT process is well established
and easy to manage, pre-approval may not be an efficiency gain.
Because skill matching and recruitment are so important, some countries have devised
sponsorship measures to afford employers more efficient access to the workers they need
(Table 3.3). Sponsorship status in this regard involves employers meeting specific policy
thresholds relating to their ability to recruit responsibly and manage overseas workers rather
than sponsoring specific jobs or workers. Criteria used include employers’ past annual
recruitment numbers, human resource and training systems, history of compliance with
employment and immigration laws, and efforts to recruit and train local workers. By tying
these requirements to the employer, the United Kingdom – where sponsorship lies at the
heart of the PBS – aims to improve compliance with its immigration system and reduce
abuse. Compliance is also a factor in Korea’s temporary labour migration system, which
allows employers to take on workers on the strength of their past employment practices.
Qualification for sponsorship may be restricted to large-scale users of programmes. In
New Zealand approved sponsors can involve discussions with social partners and other
government agencies. In Sweden, certification occurs only if an employer requires at least
25 non-EU workers a year.
Once they have been granted an accreditation or sponsor status, employers are free to
recruit overseas workers. In New Zealand the employer has to renew accreditation every
year, while employers in the United Kingdom are rated either A or B. A-rated employers
meet all requirements, while those who are B-rated must roll out time-limited action plans
to acquire the A rating or lose their sponsor status. In New Zealand there are no caps on
the number of foreign workers an accredited employer may hire. The United Kingdom
INTERNATIONAL MIGRATION OUTLOOK 2014 © OECD 2014 181

3. MANAGING LABOUR MIGRATION: SMART POLICIES TO SUPPORT ECONOMIC GROWTH
bleration
status)
practices an overall annual cap on the Tier 2 General Skills visa under which most non-EU
temporary workers enter. Individual employers therefore receive a set number of
sponsorship certificates (Table 3.3). Canada, Australia, and New Zealand use similar
processes to approve employer sponsorship of seasonal workers.
In all cases, individual migrants (barring seasonal workers) must meet all the
conditions (experience, qualifications, and wage thresholds related to the occupations)
required of the labour migration channel.
Employer approval or accreditation is a sunk administrative cost – and often fee-paying.
However, its subsequent benefits make it attractive. New Zealand waives the LMT for
employers who have been granted pre-approval to recruit migrant workers. In Australia, the
validity of sponsorship is doubled to six years for employers who gain accreditation, which
requires meeting additional conditions such as a turnover of AUD 4 Million, past recruitment
non-approval rates of less than 3%, and at least 30 skilled temporary workers recruited in the
past 12 months. Such employers enjoy priority processing. The United Kingdom waives the
self-supporting requirement for Tier 5 temporary workers if an A-rated sponsor certifies that
they will not claim public funds during their stay. For an additional fee, A-rated sponsoring
Table 3.3. Employer sponsorship certificates and pre-sponsorship
Provision Criteria Duration
Australia Sponsorship accreditation may be afforded to employerswho meet the requirements to become a Standard BusinessSponsor for the subclass 457 programme and haveadditional characteristics. Accredited sponsors receivepriority processing of all nomination and visa applications.
In addition to Standard Business Sponsorship criteria,the following characteristics are required to be affordedaccredited status:● Historically have a high volume of decision-ready
applications (low rejection rate).● Record of compliance with relevant laws.● Be a government, publicly-listed or high-turnover
company.● Active continuous sponsor for three years, with at least
30 visas granted in previous year.● Ensure Australian workers comprise at least
75% of workforce in Australia.
6 years (douthe normal duof subclass457 sponsor
Seasonal Worker Programme ● Agreement between Department of Employmentand Employer, followed by sponsorship process.
New Zealand Accredited employers: pre-approved to recruit migrantworkers for skilled work (no labour market test). Also grantsbenefits to worker who can gain a resident visa after workingfor two years.
● Financially viable.● Committed to training and employing New Zealanders.● Demonstrate attempts to recruit (and if appropriate, train)
New Zealanders for the vacancy.● Sound human resource and workplace policies
and practices;● Check out with agencies, relevant unions and other
employee representatives;● Salary and full-time requirement.
12 months
United Kingdom Sponsor licence allows an employer to be a sponsorof a worker under Tier 2 or 5 of the points-based system.Benefits: Sponsors of Tier 2 and 5 can avail a “premier”or “SME+” service (for additional fee) to avail individualisedservice. However, there is no exemption from labourmarket test.
● A legitimate organisation working within the lawin the United Kingdom.
● No reasons to believe that they are a threat to immigrationcontrol or that the organisation will not meetits sponsorship duties.
● Sponsors are also awarded a sponsor rating (A or B),evaluated by looking at organisation’s processes andhuman resource practices. If there are significant doubts,a B rating is awarded. B-rated sponsors must qualifyfor A-rating within a certain period or losetheir sponsorship ability.
● Migrants meet set thresholds and criteria for admissione.g. annual wages of GBP 20 300 for Tie 2 General Skillsand a cap of 20 700.
4 years
INTERNATIONAL MIGRATION OUTLOOK 2014 © OECD 2014182

3. MANAGING LABOUR MIGRATION: SMART POLICIES TO SUPPORT ECONOMIC GROWTH
employers can benefit from individualised services. In New Zealand, immigration
instructions also allow an employer to support a potential employee’s application for a work
or residence visa by offering a job that meets relevant policy criteria. A skilled migrant who
works for an accredited employer in New Zealand can apply for a visa in the Talent Work
Category which may lead to residence.
Changing pathways to permanent migration
The term “permanent” denotes a status that the host country considers is for the long
term. It may not turn out to be so in practice, of course, because intentions change
(Lemaitre et al., 2007). Permanent does not mean that a person is necessarily granted
unlimited leave to stay, but rather that he/she is on a “migration track” that normally leads
to permanent residence in the host country. Permanent or permanent-type migrants could
include people admitted with a permit of limited duration that is more or less indefinitely
renewable, or people entering a country because they enjoy freedom of movement (e.g. EU
citizens within the European Union). Long-term EU residents receive a permanent
residence permit that is standard in all EU countries, valid for at least five years, and
automatically renewable.
In settlement countries, immediate permanent migration was meant to facilitate a
one-step move where migrants transitioned directly into permanent residence after
meeting policy thresholds and criteria – whether under traditional points-based systems
or other requirements, like the Green Card in the United States. Outside settlement
countries, immediate permanent residence for labour migrants existed in only a few
cases – e.g. indefinite leave to remain in the United Kingdom and permanent residence for
the highly skilled under the pre-2008 Swedish system and in Germany. Some countries
grant immediate permanent residence to other categories, e.g. through co-ethnic
programmes as in Israel.
Permanent residence typically confers entitlements not granted to temporary permit
holders. They include the eligibility to apply for citizenship, access to social security and
health services, eligibility for citizenship of children born after arrival in the host country,
and the right to vote. In settlement countries very little separates the entitlements enjoyed
by a long-term permanent resident from those of a citizen.
One-step permanent migration still exists in traditional settlement countries, but is by
no means the rule – in practice or in policy:
● In the United States, 89% of employment-based Green Card approvals in 2012 were for
people already in the country.
● In the United Kingdom, under Tier 1 of the PBS for highly skilled migrants, 75 200 visas
and extensions were issued for main applicants in 2011. Of those 88% were already in
the country (OECD, 2013c).
● In 2011-12, half of all skilled migrants who acquired permanent residence in Australia
were already onshore. Of permanent residents who arrived through the family stream
28% were also already onshore.
● In 2012-13 in New Zealand, most skilled permanent migrants were already in the
country under a different status – 87% of principal applicants in the Skilled Migrant
Category were approved onshore.
INTERNATIONAL MIGRATION OUTLOOK 2014 © OECD 2014 183

3. MANAGING LABOUR MIGRATION: SMART POLICIES TO SUPPORT ECONOMIC GROWTH
The changes in settlement countries reflect policy. Less-than-positive labour market
outcomes of previous one-step permanent migrants led to PBS prioritising experience in
the country as a better way of minimising labour market risks for migrants and host
countries. In non-settlement countries, two-step permanent migration has long been the
default, but growing importance is accorded to facilitating temporary-to-permanent
transitions to both attract and retain skills. Permanent migration also continues to be
relevant, however, because migrants seek a sense of certainty and belonging that enables
them to make long-term investment decisions, all of which countries explicitly or
otherwise use in their bids to attract and retain talent.
Different criteria for residence. Pathways and options to permanent residence from work
or study or from study to work to residence usually involve consideration of: a) the total
period of time spent in the destination country for work and/or study; and b) whether
migrants meet prescribed conditions, such as an offer of permanent employment, wage
and skill levels, and language proficiency.
Permanent residence is offered to both low-skilled and highly skilled workers. For
those with low skills the deciding factor is having held a work permit for an uninterrupted
period of time, which may vary between two years in Canada to ten years in Greece.
Foreign nationals who arrive under the live-in care-giver programme in Canada may be
eligible to apply for permanent residence if they have had the following work experience:
24 months or 3 900 hours of authorised full-time employment completed within a
minimum of 22 months and acquired within four years of the migrant’s date of arrival.
Canada also offers residence to lower-skilled workers through its Provincial Nominee Class
visa. With the exception of Poland, residence also provides pathways to naturalisation.
As for highly skilled workers, those holding United Kingdom Tier-1 or Tier-2 visas or
US employment-based visas are eligible for permanent residence after five years.31 The
usual duration required in EU Blue Card schemes is five years, though German Blue Card
holders may apply after two if they demonstrate working knowledge of German. Similarly,
Korea stipulates five years, with the longest length of time being in Japan, where it is ten
years. In the settlement countries (other than the United States), permanent residence is
immediate, although indefinite permanent residence is granted after three years of stay.
Besides duration, other conditions may attach to the acquisition of permanent residence.
In Europe they often include language proficiency and civic integration, though meeting such
requirements is sometimes facilitated for labour migrants and their family members.
Some settlement countries have built a multi-step process into residence pathways for
labour migrants. The New Zealand Work to Residence visas (for those overseas) and the
Australian Employer Sponsored and Regional Nominated visas are examples of pathways
that lead gradually to residence. They are provisional visas that bring eligibility for
permanent residence after two years. For example, in New Zealand the associated
conditions are having the offer of a job that lasts 24 months, is on the long-term skills
shortage list, is in the category of exceptional talent in the arts, culture or sports, or is
sponsored by an employer at a specified minimum salary level. In Australia migrants must
also undergo skills assessments and meet language standards and, where applicable,
should have resided in a province for two years. In the case of Canada, the Canadian
Experience Class (CEC) provides a pathway for applicants who have held a job in Canada for
12 months and meet language standards. Under the new Express Entry system, the CEC
has no provision for an occupational filter.
INTERNATIONAL MIGRATION OUTLOOK 2014 © OECD 2014184

3. MANAGING LABOUR MIGRATION: SMART POLICIES TO SUPPORT ECONOMIC GROWTH
A few OECD countries – such as Australia, Austria, Denmark, Germany and New Zealand –
allow in immigrants without employment in search of a job (see below). Exceptions to job
search visas that subsequently convert directly to residence are the nine-month-long
New Zealand Silver Fern visa and its twin the Silver Fern Practical Experience visa (up to two
years) for young people aged 20-35. Denmark’s Green Card is valid for up to three years (subject
to scoring over 100 points for educational level, language skills, work experience, adaptability,
and age). Both are supply-driven options, though for New Zealand, residence is granted only if
an applicant meets all the requirements for a Skilled Migrant Category visa.32 The Danish
Green Card, on the other hand, can be renewed.
Post-study job-search and work experience admission. International students are an
attractive proposition for many countries as they generate revenue, help establish cultural
and economic ties, and are a potential source of supplementary labour and prospective
skilled workers. In this regard many OECD countries allow university students to look for a
job on completion of their tertiary-level studies. It is a particularly appealing prospect
when they have studied and worked part-time in the country and are familiar with its
institutions, language, and workplace culture and expectations. Duration varies between
six months in countries like Norway, Slovenia, Switzerland, Denmark, and Finland to one
year in Japan and the Netherlands, two in Korea, and up to three in Canada.33 In Australia
students with doctorates can work for as long as four years (Figure 3.7).
However, many other countries have no special provisions for staying on, and
graduates must use the existing labour migration channels if they are to find qualifying
employment. That is the case in Belgium, Estonia, Greece, Hungary, Israel, Portugal, Spain
and Sweden, the United Kingdom34 and the United States. In Sweden, unusually, foreign
students enjoy ease of access to the labour market during their studies and, if they do find
work, may switch to work status even before they complete their studies.
Figure 3.7. Duration of job-search periods for post-graduate schemesin different OECD countries, 2014
Months
Source: Secretariat analysis.1 2 http://dx.doi.org/10.1787/888933157734
0
30
10
20
40
50
Minimum Maximum
Austra
lia
German
y
New Ze
aland
Franc
eIta
ly
Netherl
ands
Poland
Canad
aKor
ea
Irelan
d
Sweden
Austri
a
Denmark
Eston
ia
Finlan
dJa
pan
Norway
Switzerl
and
Turke
y
Belgium
Greece
Hunga
ry
Luxe
mbour
g
Mexico
United
Kingdo
m
United
States
None
INTERNATIONAL MIGRATION OUTLOOK 2014 © OECD 2014 185

3. MANAGING LABOUR MIGRATION: SMART POLICIES TO SUPPORT ECONOMIC GROWTH
Settlement countries (with the exception of the United States), along with Korea and
Slovenia place no restrictions on the type of employment or hours worked during the
job-search period, while Japan allows part-time work of up to 28 hours per week. In most
countries (apart from Italy), however, work permits are issued only if job-search permits
lead to students finding jobs that match their qualifications. In this respect, definitions of
“matching criteria” can be quite strict when it comes to the level of education and subject
matter of qualifications.35
Post-study work experience visas are another potential pathway to residence.
Australia proposes a number of such schemes:
● The Post Study Work Stream is open to overseas students who have recently graduated
with an eligible higher education degree from an Australian educational institution.
● The Australian Temporary Graduate Visa allows recent graduates to gain work
experience in Australia.
● The Graduate Work Stream is open to graduates with an eligible qualification that
relates to an occupation considered in demand in the Australian labour market.
In Canada, graduates of a Canadian post-secondary educational institution with one
year of post-graduate full-time work experience in the country may apply for a CEC visa. It
affords a transition pathway from temporary to permanent residence. If New Zealand
employers can offer a graduate a long-term skilled job relevant to his or her qualification,
he or she can apply for an employer-assisted post-study Work visa. Its duration is two to
three years for occupations requiring registration and may afford the opportunity to apply
for residence under the skilled migration policy.
The United States offers post-study stay extensions of up to 12 months (extended to
29 months for STEM graduates) for Optional Practical Training (OPT). It is not, however,
linked to a job-search pathway that leads to automatic residence. It makes it easier,
though, for employers to recruit student visa holders with skills that are much in demand,
and gives them a chance to retain them by sponsoring them for an H-1B visa (Specialty
Occupation). The extended period for STEM graduates is meant to allow employers two
opportunities to file an application to sponsor the graduate the capped H-1B visa, since in
practice filing is held once a year. Ireland’s Third-Level Graduate Scheme allows non-EEA
graduates of Irish institutions (excluding language students) to look for a job and/or work
for up to 12 months. However, anyone who has been a student for more than seven years
is ineligible.
Patterns of transition towards permanent residence have gradually evolved
as migrants are increasingly able to change status while they are in the host country
– something that almost all OECD countries allow students and labour immigrants to do.
The challenge, however, is to offer incentives to migrant groups for whom the gradual
transition to permanent residence, together with any associated delays, makes for an
insecure, precarious existence that can be difficult to cope with. Such predicaments
prompt questions over long-term permanent residency and the role it will continue to play
in labour migration.
Most OECD countries allow international students to work during their studies
(Table 3.A1.4). The right to work can influence their post-study careers, but it also raises a
number of issues (Box 3.4).
INTERNATIONAL MIGRATION OUTLOOK 2014 © OECD 2014186

3. MANAGING LABOUR MIGRATION: SMART POLICIES TO SUPPORT ECONOMIC GROWTH
Some countries have reflected on their overall international student recruitment
approaches and made a number of policy changes. These include improved provision of
information, more closely targeted compliance measures, and partnering with established
tertiary education providers to ensure system integrity and on-going monitoring.
What happens when temporary labour migrants are unemployed. One principle of
temporary labour migration is that migrants will leave when their jobs disappear. With
the consolidation of pathways from temporary to permanent migration, spells of
unemployment can interrupt the pathway. However, as unemployment rose during the
recent financial and economic crisis in a number of OECD countries, the expected outflow
of labour migrants did not happen. Policy reactions differed. European countries like Italy
and Spain relaxed the conditions for migrants to maintain their status in order to enable
them to seek work or to renew their permits even if their employment fell below the
income or hours threshold previously required. Other OECD countries, especially those
with strict limits on less skilled labour migration, maintained their criteria.
Some countries implemented programmes to encourage migrants with legal status to
return to their countries of origin, although target populations and conditions varied.
Spain introduced a scheme called “Accrued Payment for Foreigners Returning to
Non-Community Countries”. It offered non-EU foreigners holding work permits the chance
to take up their unemployment benefits as a lump sum on the condition that they should
not return for three years. Between 2008 and 2010, about 12 000 applications were
approved, although a larger number, who had exhausted their unemployment
entitlements, applied for a separate repatriation assistance programme. Most of the
hundreds of thousands of potential beneficiaries remained in Spain.
Box 3.4. International students and work rights
Most countries allow international students some level of access to the labour marketthat is contingent on their course level and duration. In this way countries may attractstudents, as working helps them offset travel and study costs to some extent, whileensuring that their primary purpose remains higher education. It also gives students muchvalued exposure to the local labour market and new networks. And for some countries itbrings additional revenue to educational institutions and is part of a strategy to driveexport education. Students who work also form a skills pool from which employers mayrecruit future workers and residents. They are also an attractive way for countries tomarket their education industry.
However, there may be issues for students who do not have a clear understanding of thelaw and their rights (e.g. minimum wage levels and employment contracts). And mattersare compounded if students are unwilling to complain because the balance of power restswith employers or because regulating agencies are unable to monitor their employmentproperly. Indeed, there is no easy way to identify international student workers, calculateweekly or aggregate hours worked, or check on the employers of migrant students.* Afurther factor is the adverse impact on the labour market. When there is a heavyconcentration of unregulated international students, they may displace local workers,especially young ones, or depress wages.
* See ILO (2010).
INTERNATIONAL MIGRATION OUTLOOK 2014 © OECD 2014 187

3. MANAGING LABOUR MIGRATION: SMART POLICIES TO SUPPORT ECONOMIC GROWTH
In Japan some 20 000 foreigners accepted financial assistance under a return-
migration scheme active until May 2009. It was for unemployed foreigners – including
permanent residents – who had come from South America with a visa for people of
Japanese origin and pre-arranged employment. However, as participants were not allowed
to come back to Japan under the same visa arrangement, the number of Brazilians and
Peruvians of Japanese origin leaving without taking advantage of the scheme was twice as
high as those who participated. In 2013, Japan lifted those re-entry restrictions for former
beneficiaries of the return scheme with a one-year job offer in hand.
In 2009 the Czech Republic, too, introduced a voluntary return plan for temporary
workers who had lost their jobs. Those that relocated were awarded a cash payment and
given travel costs. Several thousand labour migrants left the country, although it is unclear
how many would have gone anyway, and many more remained.
The examples show how difficult it is, in times of slack demand, to enforce the
departure of temporary labour migrants who are contemplating a pathway to permanent
residence.
How to make a country more attractive: Rolling out the red carpet
Existing research on the determinants of labour migration does not yield an
unequivocal list of the factors affecting skilled migrants’ decisions to move or choose one
destination over another. Migration patterns certainly suggest that job opportunities and
wages, shared language, proximity, and existing channels promote migration flows. Policy,
too, plays a role, but it is difficult to identify a single policy as a determinant.
Countries tend to provide sets of policy measures to attract skilled workers – advantages
and rights – that may include family migration, access to permanent residence, etc. The
rationale is that migrants’ choice of destination and desire to stay in a host country are
influenced by measures that make their move worthwhile. The number of advantages
provided, how soon after arrival they are extended to migrants, and whether they take into
account other policies, such as education or tax settings, could also play a role in migration
decisions. Taken together, these policy measures could be called “red carpet treatment”.
The “red carpet treatment” draws on key elements from the migration framework
as well as other relevant policy domains. The extent to which an integrated or
inter-connected set of policies is available also reflects a host country’s attitude. Policies
offer a number of perks that can constitute a red carpet, whether offered as a formal
package or perceived as one.
The first perk is the promise of permanent residence (both long-term stays and
indefinite leave to remain), attractive to migrants for the certainty it offers and the access
to public services such as health, education and social security that it provides. Almost all
countries propose permanent residence, especially for highly skilled migrants. Some, like
the settlement countries, offer provisional permanent residence straightaway, with
long-term permanent residence established after three years.
Pathways to permanent residence from temporary work or study can be a major
incentive, as suggested by the changing pattern of migration that comprises two or even
three steps (from study to work to residence). The approach is proactive compared to the
default residence setting that usually comprises a time-limited period of working or
residence. An essential aspect is the upfront provision of explicit residence pathways with
INTERNATIONAL MIGRATION OUTLOOK 2014 © OECD 2014188

3. MANAGING LABOUR MIGRATION: SMART POLICIES TO SUPPORT ECONOMIC GROWTH
clear milestones and requirements. Signposted pathways to permanent residence for
workers are not always provided, even when provisions are actually in place. The settlement
countries promote “provisional” visas by highlighting that they can lead to residence.
A second perk central to attracting and retaining migrants is family reunification.
Most workers – other than those on limited duration temporary work such as seasonal
work – are allowed to bring families (accompanying spouses and dependents) on specific
conditions, such as meeting income thresholds. Where permanent residence has been
gained, policies in settlement countries and a few others also have provisions for
sponsoring non-accompanying family members such as adult children and parents.
If families are to be effectively integrated they need to have access to the labour
market. Unrestricted access to employment is available to most family members coming to
join workers, usually highly skilled ones. A few countries insist on family members
applying for a separate work permit, and the United States, Korea, and Japan all restrict the
employment of skilled workers’ spouses.
A “red carpet” may mean smoothing the path to permanent residence. Permanent
residence criteria, like language tests, can discourage skilled migrants. However, they are
requirements in many European countries (e.g. Sweden, Italy, and Denmark which has
introduced a points system). Besides language proficiency, understanding of the host
country’s culture and society is a condition in Austria, the Czech Republic, France,
Germany, and the United Kingdom. Those requirements, too, may put off migrants. In
settlement countries, such as Canada and Australia, the integration measures kick in with
naturalisation, although language thresholds are screened for selection and admission.
Japan and Korea both reduce permanent residence waiting times for certain highly
qualified migrants on the basis of a PBS. In the United States, the time it takes to actually
secure a permanent residence visa (Green Card) for employment depends on three criteria:
the application filing date, priority preferences, and country of citizenship.
A further perk is the prospect of naturalisation. Long-term residents have invested
time in the country and naturalisation should therefore normally flow from permanent
residence.36 Eligibility for naturalisation depends on the time a migrant has been in a
country since obtaining long-term or indefinite leave to remain (Figure 3.8). That time
varies between five years in the settlement countries, the Czech Republic, France, Sweden
and Turkey, to up to ten in Austria, Belgium, Italy, Slovenia, and Spain. There are
exceptions. For instance, in Germany permanent residence is generally obtained after five
years and naturalisation after eight. However, permanent residence may be granted
immediately to highly qualified researchers and university professors, while the residence
requirement for naturalisation may be cut by one to two years for individuals judged to
have a high integration capacity.
Fiscal advantages can be offered. Several countries offer tax concessions to specific
groups of highly skilled workers. In Belgium, for example, the state grants a 75% exemption
from wage-withholding taxation to temporary and permanent foreign migrants if they are
research workers. Italy gives such migrants a 90% exemption from personal income tax on
earned income for three years, while Sweden offers a 25% tax and social security
contribution exemption. Switzerland allows foreign migrants – if they keep their
temporary status – to deduct migration-related costs from their tax burden.
INTERNATIONAL MIGRATION OUTLOOK 2014 © OECD 2014 189

3. MANAGING LABOUR MIGRATION: SMART POLICIES TO SUPPORT ECONOMIC GROWTH
Migrants in Australia and New Zealand do not have to pay income tax on foreign-
sourced income for up to four years and in Canada for up to five years. The measure
addresses concerns that the taxation of capital income may affect migration decisions
(OECD, 2011c) and it appears that income tax rates can influence the choice of location. An
evaluation of the effects of income tax on the international migration and earnings of top
earners using a Danish preferential tax scheme for foreigners showed the scheme did
indeed double the number of highly paid foreigners in Denmark relative to slightly less well
paid ineligible foreigners (Kleven et al., 2013).
Finally, there is the red carpet treatment where potential migrants are regarded as
clients. They are courted and plied with premium services to facilitate their migration
process. In practice, it is rare for public services to provide the kind of procedural and
relocation assistance offered by private services. In Germany, the Hamburg Welcome
Centre provides a free, comprehensive information and advice service and, for in-depth
advice and solutions to particular problems, clients are referred to the relevant contact
partners. A 2014 pilot scheme in the United Kingdom, the “GREAT Club”, provides an
invitation-only and personalised visa service programme for high-level executives.
Individual employees of selected firms are offered their own immigration account manager
who helps them through the immigration process, as they must nevertheless comply with
all the standard requirements and formalities.
The mixed success of the job-search visa
Job search visas for a set period of time are meant to make a destination country more
attractive. They are an alternative channel for employers to meet potential foreign workers
face-to-face and a chance for migrants to take an investment risk and reconnoitre the
Figure 3.8. Eligibility for permanent residence and naturalisationfor “high skilled” labour migrants in different OECD countries, 2014
Years
Note: “High skilled” follows national definition; in the absence of specific categories, general criteria for labourmigrants (work permit holders) are used. In France, naturalisation eligibility starts after 5 years of residence eventhough in practice citizenship grant may take longer.Source: OECD Secretariat analysis.
1 2 http://dx.doi.org/10.1787/888933157748
0
6
2
8
4
10
12
Permanent residence Naturalisation
Austra
lia
Canad
a
Finlan
d
Franc
e
Mexico
New Ze
aland
Sweden
Turke
y
United
States
Portug
al
United
Kingdo
mGree
ce
Norway
Eston
ia
German
y
Hunga
ry
Denmark
Austri
a
Czech
Rep
ublic Ita
lyKor
ea
Sloven
iaSpa
inJa
pan
INTERNATIONAL MIGRATION OUTLOOK 2014 © OECD 2014190

3. MANAGING LABOUR MIGRATION: SMART POLICIES TO SUPPORT ECONOMIC GROWTH
labour market. They are also a managed policy risk for migrants who do not meet other
policy criteria but whose skills may well be required in the labour market. Put simply,
job-search visas are a supply option with time limitations.
In-country status changes from tourist visas to work permits may be a form of
job-search permit, especially between countries which have no visa requirements. Norway
and Germany allow in-country issuance of a work permit while Sweden does the same for
shortage occupations. The main beneficiaries are countries where there are no visa
requirements. As most OECD countries allow visa-free travel to and from each other, the
measures favour intra-OECD mobility in practice.
Job-search visas have been tried out in several countries – in the Netherlands, Denmark,
New Zealand, Austria, Australia, and Germany – with different criteria and conditions
attaching to eligibility, the right to work, and the duration of the job-seeking period. Austria,
Denmark and the Netherlands use a PBS to assess job-search visa candidates, while Norway
actually discontinued its job-search visa because of difficulty identifying the migrants most
likely to succeed. The Netherlands offers a one-year search period under restrictive
conditions and job-seeking visa holders may not work during that time.
New Zealand introduced the Silver Fern Visa to allow young people – including those
who do not qualify for the mainstream admission system – to find skilled work. They are
given nine months to do so. They may then transition to the Silver Fern Work Experience
Visa that opens a pathway to permanent residence. With an annual limit of 300 places, the
scheme is tightly managed.
One fundamental question about job-search visas is whether the recipients eventually
find employment and, if not, whether they leave as they are supposed to. Evidence is
mixed. In the United Kingdom, evidence of Tier 1 points-based system outcomes is
contradictory. A survey in 2009 found that 70% were in skilled employment, but an analysis
of occupations the following year revealed that fewer than half were in jobs which would
qualify for one of the existing skilled migrant programmes (UKBA, 2010).
In Denmark, flows have been substantial, but evaluation indicates that far fewer find
qualifying jobs. An evaluation in 2010 found that of all Green Card recipients in 2008-09,
27% never entered Denmark, and of those who did, 30% found skilled employment,
42% were in unskilled employment, and the remainder unemployed (Ramboll, 2010).37 In
the Netherlands the number of permits issued to applicants from abroad in the first two
years of the programme, 2009 and 2010, was low – about 40. Less than-half of those found
jobs that allowed them to qualify for the skilled migrant programme. In Norway, the share
transitioning to skilled work permits was less than one in four.
Finally, job-search visas may also be offered not on the basis of skills, but of individual
guarantees by current residents. Italy had such a visa in 1998-2001. Many of the recipients
were sponsored by resident foreigners, but there is no evidence that their outcomes were
different from labour migrants entering under other streams.
Where job-search programmes require an applicant to find a qualifying job in order to
remain in the country, the fact that few qualify is not a major concern if they return home.
Nonetheless, all the programmes were designed to select candidates with a high
probability of labour market success. The fact that so few find qualified jobs suggests a
problem with selection criteria. It is hard to pinpoint why it is difficult to choose candidates
likely to be successful. The problem may lie with admission procedures (e.g. poor screening
in consulates or fraudulent documents) or with the labour market (low demand for
INTERNATIONAL MIGRATION OUTLOOK 2014 © OECD 2014 191

3. MANAGING LABOUR MIGRATION: SMART POLICIES TO SUPPORT ECONOMIC GROWTH
foreign-trained workers). It may also lie in the reluctance of employers to hire migrants
with foreign credentials and – in some cases – limited language proficiency. The poor
economic conditions during the period covered may also be a factor.
Even if such issues could be solved, the job-search visa may not actually be an ideal
solution to matching employers and employees across borders. In many OECD countries
citizens from visa-free countries are still able to stay three to six months and search for a
job. Few appear to do so, though, which suggests that migrants view the option as risky
or unattractive.
International agreements – multilateral, regional and bilateral
A number of countries have international migration agreements which can be both
public and private goods.38 The advantage of such agreements is that they can achieve
specific policy objectives that general systemic policy settings cannot.
Overall bilateral arrangements between origin and destination countries are a
relatively diffuse form of international co-operation, particularly for seasonal workers, and
those with low and medium skills. Instances of collaboration between two destination
countries are rarer. Since the 1950s, groups of select countries have banded together to
facilitate labour mobility among their members. Regional arrangements, such as EU
directives, help with harmonising entry arrangements, access to privileges, and mobility
across member states for non-EU citizens.
Regional co-operation for labour mobility. Countries that share close geographical,
historical, political, and economic ties have liberalised access to their labour markets for
each others’ nationals to different degrees (OECD, 2012b). The EU’s acquis, in particular,
recognise that mobility rights have economic and social benefits for individuals and for
member states, reducing skills mismatches, addressing unemployment, and supporting
growth at EU level. Those benefits are reflected in the rights of EU citizens and their family
members to move and reside freely within the territory of the member states.
The EU acquis also offer a framework for understanding subsequent facilitations in
intra-European mobility targeted at various categories of non-EU nationals, such as
long-term residents, highly skilled workers, Blue Card holders, researchers, students, and
posted workers (EMN, 2013). For non-EU nationals, measures have been adopted at the EU
level. They include the Long Term Residents Directive (LTRD) designed to bring the status
of longer-term residents closer to that of EU citizens, and the Family Reunification
Directive (FRD), which promotes harmonised family reunion as an aid to integration.
On the other hand, the Trans-Tasman Travel Agreement between Australia and
New Zealand is not a binding bilateral treaty. It acts, rather, as a string of procedures in the
immigration policies of both countries (APC and NZPC, 2012). The arrangement is part of
the wider Closer Economic Relations Agreement between both countries and is meant to
facilitate the free movement of people, capital, goods, and services.
Other examples of regional mobility come in the context of regional trade and
economic integration agreements. Free trade areas, however, function at a lower level of
regional economic integration than common markets. They have provisions that facilitate
mobility between signatory countries and access to each others’ markets for certain groups
of workers – e.g. traders, service providers, intra-company transferees, business visitors
and, in some cases, selected categories of professionals. Those workers do not usually,
however, enjoy immigration rights.
INTERNATIONAL MIGRATION OUTLOOK 2014 © OECD 2014192

3. MANAGING LABOUR MIGRATION: SMART POLICIES TO SUPPORT ECONOMIC GROWTH
The North American Free Trade Agreement (NAFTA) between Canada, Mexico and the
United States has been in force since 1 January 1994. The agreement creates a stream of
temporary immigration between the NAFTA signatory countries that facilitates access to
specific occupations in local labour markets for qualified professionals who may be
nationals of any of the three NAFTA members.
Special NAFTA visas (Treaty NAFTA, or TN, visas) may be issued to nationals of
Canada, Mexico and the United States, provided that they have the offer of a job that is one
of the professional occupations listed in the Treaty,39 that they can prove that they possess
the required qualifications and professional experience for the job, and that they do not
intend to establish permanent residence in the country. NAFTA nationals qualifying under
the TN stream are exempted from labour market tests and need not re-qualify under the
host country’s certification standards. Special NAFTA visas are temporary and are valid for
no more than three years and, although indefinitely renewable, do not confer permanent
immigration rights.
Free trade agreements (FTAs) increasingly incorporate labour mobility, which becomes
an important aspect of negotiations to finalise FTAs. The Pacific Agreement on Closer
Economic Relations (PACER) Plus Two is a proposed trade, development, and economic
co-operation agreement currently being negotiated by the 13 Pacific Forum Island
Countries (FICs) plus Australia and New Zealand. The Pacific island governments are
pushing in the current PACER Plus free trade negotiations for firm commitments by
Australia and New Zealand to provide greater access to their labour markets in exchange
for the removal of tariffs on goods and services.40
Another significant FTA in Asia-Pacific region is the 2010 ASEAN-Australia-
New Zealand Free Trade Area (AANZFTA) agreement that incorporates migration-linked
concessions, including the movement of intra-company transferees and independent
service providers.
A wide variety of bilateral arrangements. Many bilateral arrangements typically cover
the movements of seasonal, guest and holiday workers between the countries that are
party to such agreements. Bilateral agreements can take the form of treaties, travel
agreements, memorandums of understanding or even inter-agency agreements between
government agencies. The objectives are multiple – cultural, social, and economic.
Working holiday visas are generally the result of formal treaties or agreements
between countries which, on a reciprocal basis, place caps or quotas on the annual
numbers of each others’ nationals who are entitled to such visas. While the rationale
behind the visas is cultural and social in nature, they appear to produce a large
supplementary source of labour and may therefore have economic implications. The
Working Holiday Maker visa programme, for instance, plays an important role in the
Australian labour force (Tan and Lester, 2012).
The cumulative impact of such schemes can be a concern if flows become substantial
and are concentrated in specific local areas (OECD, 2014a). The Summer Work Travel
scheme in the United States involves an average of more than 100 000 participants
annually. While the make-up of such flows and the average time spent between work and
holiday varies over time and by country of origin, working holiday schemes are also
becoming a channel, in some countries, for temporary workers.41 In New Zealand, almost
one in five first-time approvals in 2011-12 went to people who had previously held working
holiday visas (OECD, 2014a).
INTERNATIONAL MIGRATION OUTLOOK 2014 © OECD 2014 193

3. MANAGING LABOUR MIGRATION: SMART POLICIES TO SUPPORT ECONOMIC GROWTH
Bilaterally organised seasonal programmes, designed to help specific sectors with
seasonal demand for workers, also have other purposes, such as ensuring the protection of
vulnerable workers and addressing development goals and ethical concerns in countries
of origin.
The OECD country where bilateral agreements account for the highest number of
workers is Korea. It has signed accords with 15 countries for recruiting non-professional
workers and currently employs more than 240 000 such foreign workers. The agreements,
which have been operating since 2004, govern the selection of workers, with the countries of
origin responsible for preparing a roster of candidates who have passed a basic Korean
language test. From the roster, employers choose workers who they provide with additional
training and support throughout their stay in Korea. The programme has been successful in
reducing costs for migrants and ensuring their working conditions are good. Relative to the
trainee programme it replaced, overstay is low, although it does remain an issue.
European bilateral arrangements also cover vocational training and the filling of
vacancies in shortage occupations. Italy, for example, has attempted for a number of years
to shift its labour migration channels to recruitment based on training in the country of
origin. Accordingly, it sets aside a quota within its migration programme for training
scheme graduates and funds training programmes. In practice, employers have not made
much use of this channel, and while courses have been organised in countries of origin, the
number of labour migrants has been in the hundreds, rather than the thousands
anticipated in the visa allocation (OECD, 2014b).
Maximising non-labour migration
A substantial proportion of migrant inflows are people who have not been explicitly
selected and admitted on the strength of their labour market attributes. Family formation
migrants, whether accompanying their immediate family or subsequently joining them,
stem from labour migration. On the other hand, other streams of non-labour immigration,
such as humanitarian migrants and students, are independent.
Spillover or derived migration accounts for a sizeable proportion of total admission
quotas. In the case of permanent migration, countries tend to manage such flows on an
annual basis because of the fiscal considerations involved. In the United States,
employment-based visas account for about 20% of annual admissions while the family
category accounts for 40%. In New Zealand, the residence programme is split between
Business/Skills, Family-sponsored and International/Humanitarian migration. Australia
shows a similar distribution, although there is a separate planning level for the
humanitarian stream.42
While the right to family reunification is granted to many migrants – whether labour
or other, permanent or temporary – the question arises as to how to maximise contribution
from the whole family as an economic or migratory unit. This is an area for integration, yet
there is some leeway for policy criteria, too. On the face of it, self-selection usually helps
address some of the issue. Skilled migrants also tend to select partners from within similar
socio-economic groups, a pattern known as “assortative mating”.
The labour market outcomes for secondary applicants or spouses compare well to
those of the average native or migrant in some settlement countries. In Australia, partner
migrants coming through the family stream experienced participation rates of 73% at
12 months.43 The Longitudinal Immigration Survey in New Zealand showed how skilled
INTERNATIONAL MIGRATION OUTLOOK 2014 © OECD 2014194

3. MANAGING LABOUR MIGRATION: SMART POLICIES TO SUPPORT ECONOMIC GROWTH
secondary migrants saw big improvements in labour force participation rates over six and
36 months after gaining permanent residence. The increase was from 67% to 74%. Skilled
secondary migrants also experienced the largest increases in median income over three
waves of interviews, reflecting an increase in the number of such migrants in paid work.44
If an accompanying family is a multiplier of the effects of labour migration, what
policy measures can be applied to maximise such benefits? There are limits to the criteria
and thresholds that can be applied to family migrants, as there is no explicit labour
objective attached to them. However, language acquisition is fundamental to family
adjustment and many countries accordingly set language levels or charge for language
learning – by, for example, requiring the pre-purchase of language tuition for parents and
children who will not otherwise meet the criteria for permanent migration. Some
destinations (e.g. Quebec) build in incentives by allocating bonus points in the PBS for a
spouse’s qualifications or job offers, and favour family units where both adults have
language skills.
Addressing irregular migration
A number of OECD countries have substantial irregular migrant populations in their
labour force, often with high employment rates. Irregular labour migration occurs when
effective channels are not in place to meet labour demand and measures to prevent the
illegal employment of foreigners are inadequate. Border enforcement cannot prevent
illegal overstay, while the enforcement of labour laws within the country will never
completely eliminate irregular employment. Although both kinds of enforcement are
necessary, it may be advisable to regularise undocumented labour migrants in conjunction
with policy changes in order to address employer demand and improve compliance. The
advantages of regularisation are improved compliance with labour law, increased fiscal
contributions, and greater use of migrant skills as career mobility is enhanced.
Regularisation in the absence of structural policy change that addresses the root
causes of the growth in irregular sections of population is no solution. Yet carefully
designed regularisation can ensure that beneficiaries do not slip back into an irregular
status. Temporary migrants can be allowed to stay under temporary programmes. Korea,
for example, allowed overstaying trainees to transfer into its new work permit system
when the latter was introduced. Italy and Spain rolled out several employment-based
regularisation programmes in the 2000s. Italy granted temporary permits. But because so
many beneficiaries did not hold formal employment contracts allowing them to renew
their permits, they eventually fell back into the cycle of undocumented status. Spain
instituted a mechanism whereby irregular migrants obtain permits on the basis of
demonstrable employment and contribution to local life, attested by certification from the
local government.
Integrity measures
Immigration requires a range of regulatory obligations from all stakeholders,
especially workers and employers. Non-compliance with regulations governing
employment conditions can have adverse consequences for workers, employers, and the
overall labour market. Policy regimes, therefore, use a range of mechanisms to ensure that
all players play by the rules, penalising defaulters but also using incentives to promote
mutually beneficial outcomes.
INTERNATIONAL MIGRATION OUTLOOK 2014 © OECD 2014 195

3. MANAGING LABOUR MIGRATION: SMART POLICIES TO SUPPORT ECONOMIC GROWTH
Withholds. Withholds are a way of holding back a financial sum to ensure that a party to
a contractual agreement fulfils his or her side of the bargain – specifically that temporary
workers depart at the end of their contract period. In Israel, the government holds on to
one-fifth of a temporary worker’s earning which it then hands over as a lump sum when
the worker leaves the country legally and within the terms of his or her visa. The practice
has the advantage of encouraging workers to return home at the end of their spell of work.
A withhold, however, requires that the net wage remains above the minimum wage
and is sufficient for living expenses.45 Migrants can also be encouraged to go home by
provisions stipulating that a portion of their wage earnings will be paid directly to their
home country.46 A drawback of withholds is that they penalise workers who are unable to
abide by their visa conditions through no fault of their own – through employer fraud or
abuse, for example. Withholds are thus ill-suited for systems where workers’ mobility is
restricted and they can easily slide into irregular status.
Bonds. Bonds, too, are an incentive that can be redeemed upon fulfilling a condition. In
New Zealand, a secondary or dependent permanent migrant who fails to meet language
thresholds has to pay a substantial sum of money that he or she can recoup as a bond on a
sliding time scale – the sooner a migrant meets a certain language level, the higher the
amount he or she can claim back.47
Bonds have also been discussed as a guarantee against overstay, with migrants forfeiting
a deposit if they outstay their visa. But such a measure would pose serious problems, such as
having to build up deposits to a deterrent level. Nowhere has it been implemented.
Accreditations, sponsoring, rating systems. Systems of accreditation, sponsorship and
rating entail employers undertaking to meet employment and immigration compliance
standards. Those who demonstrate systems and histories of proven compliance with
relevant immigration and employment laws are offered a status that exempts them from
normal regulatory procedures. For example, an accredited company in New Zealand
does not have to put its vacancies through the individual LMT as long as it meets a
minimum salary threshold. In contrast, the employer and sponsor rating system in the
United Kingdom is mandatory and offers no such advantages.48
Repeat entry. Repeat entry (as opposed to multiple entry visa) is one tool that may apply
when overstay is a significant concern for both host and origin countries. Guaranteeing
workers a future season for which they can return if they have met the conditions of the
work visa (and satisfied their employer) can mitigate issues over overstay. To some extent,
repeat entry is a tacit recognition of so-called circular migration, with alternating periods
of labour migration and employment at home.
Preferential tax rates. Examples of preferential tax rates are tax-free thresholds for certain
labour migrants, as in working holiday schemes and seasonal worker programmes. They
have often been used, like provisions for tax refunds at the end of the fiscal year, once the
migrant has returned home. A less coercive approach might be to allow migrants, upon their
return home, to recover all or part of the contributions they have made to unemployment
insurance and old-age security programmes – even if they are not eligible for benefits under
those programmes due to insufficient periods of contribution (OECD, 2008a).
INTERNATIONAL MIGRATION OUTLOOK 2014 © OECD 2014196

3. MANAGING LABOUR MIGRATION: SMART POLICIES TO SUPPORT ECONOMIC GROWTH
Cost recovery. Under cost recovery in OECD countries like Korea, Italy, New Zealand, and
Australia, the employer must undertake to foot the bill in the event of an expulsion order.
However, it is questionable whether employers have the means to verify, much less
guarantee, that the migrant will leave at the end of his or her contract. It is just as doubtful
whether the employer requirement can be enforced (OECD, 2008a).
Cost-sharing. When employers undertake to share costs for seasonal workers – for
example, a portion of travel expenditure – it adds to the cost wedge involved in recruiting
from overseas. Employers also have to pay for going through accreditation processes, a
further cost designed to act as a deterrent from employing foreign labour when local
workers are available. The sharing of costs, however, also works as an incentive for workers
(and sending communities) to participate in seasonal work, as it cuts the fixed costs of
entry and means less reason to overstay.
Foreign-worker levies. Foreign-worker levies are a salary-based tax on the employment
of foreigners, and are used in a number of non-OECD countries to discourage employment
of foreign workers. The only OECD country to use it is Israel, where fees are the highest
among all OECD countries, at 10%-15% of an agricultural or construction worker’s salary.
The levy has been unsuccessful in achieving its policy goal, as real wages paid to foreign
workers remain well below those paid to Israelis (OECD, 2013d). The combination of high
rents that employers obtain and low compliance enforcement have prevented levies from
functioning properly.
Estonia does not levy a charge but requires that employers pay to a worker a premium
that is 24% of the average wage for the worker’s occupation.
Summary of the policy toolbox
Surveying the range of tools used across the OECD reveals that most are of a regulatory
nature and few are incentive- or price-based. Most instruments also seem to have
universal coverage: the same ones are used across skill streams and applied to temporary
and permanent migrants alike. There are exceptions, however. One is the PBS, which seeks
to sort highly skilled migrant applicants and select the best.
Over time, certain tools have become prevalent. They include labour market testing,
skills shortage lists, and numerical limits. Others, like job-search visas, are less widely
used because of the risks involved and the poor outcomes to date. The collective
experience of these tools suggests that no single one may be used in isolation, and that a
policy mix within the labour migration framework may work to varying effect in a number
of different contexts.
The pros and cons of the different policy tools discussed are set out in Table 3.4, along
with the indications as to where they might best be used.
Making the tools work
The discussion so far has examined the policy tools for a labour migration
management system. It has looked at what they are and how they function and explored
their technical appropriateness. While policy choices are, in a sense, substitutable – in that
any means could be used to achieve any end – the usefulness and attractiveness of policy
instruments are heavily context-dependent.
INTERNATIONAL MIGRATION OUTLOOK 2014 © OECD 2014 197

3. MANAGING LABOUR MIGRATION: SMART POLICIES TO SUPPORT ECONOMIC GROWTH
ally be
ses
ationause
)
be
ketrs).
tively
s
d.oad.
.broad.
ed
eekers .
liance,
Table 3.4. Summary of the migration policy toolbox
Tool Advantages Disadvantages
Labour market test ● Ensure that jobs are offered locally, demonstrate no localsupply.
● Employers understand job search techniques.
● Easy to distort (job description).● Often no standardised testing within country, PES may not actu
real location for matching.● Beyond nominal listings, difficult to enforce.● Requires administrative machinery to be effective, which impo
delays and costs.
Salary threshold ● Simple.● Means to proxy skills when no other indicators exist
or when recognition is difficult.● Easy to explain to public.
● Subject to fraud, difficult to verify post-entry, pegging to occuprequires good data, can be controversial for public opinion beceasy to point to anomalies.
● It appears to regulated the market rate.
Shortage list ● Easy to explain to public and labour supply chain, can haveshort and medium term demand focus, exempts useof individual LMT, can be combined with other tools suchas quotas.
● Possibly inappropriate for unskilled occupations.● Complicated to develop.● Difficult to assess experience component.● Subject to interest group lobbying.● Frequency of revision affects responsiveness to demand.● Risk of negative incentives for training local workers.
Numerical limits ● Can be based on planning levels.● Sends public a message of political control.● Allows planning processing capacity.● Clearly signals that access to migrant labour
is not open-ended, so employers maintain local recruitmentand development.
● Difficult to define means for setting limits.● Potentially inflexible.● Potentially unfair.● Subject to political pressure.● Can lead to backlogs or waiting list.
Multi-step migration ● Testing period for integration.● Allows both migrant and country to “try before buy”.
● Leaves migrants in precarious status.● Can delay family reunification.● Potentially less attractive in global competition for talent.● Increases administrative complexity (managing status changes
for both migrant and public authorities.
Bilateral agreements ● Reduce costs, ensure quality and quantity for specific sectoror occupation, incorporate development objectives,reduce overstay.
● Achieve foreign policy, cultural and social objectives.● Adds to supplementary labour force.● Increase youth mobility.
● Unfair to privilege specific countries, employer preference mayfor different nationalities or specific groups.
● May be signed without regard to real labour market.● For circular programme, first movers are prime beneficiaries
(for origin country).● High administrative oversight costs.● Cumulative impact of uncapped agreements on the labour mar
may be negative (e.g. negative impact of working holiday make
Employer sponsorshipand pre-approval
● Accelerates recruitment process.● Increases and rewards compliance.
● Favours current and larger users of migrant labour.● Processes/costs may discourage some employers, administra
complex.● Requires monitoring and good information.
Points based system ● Ensuring minimum human capital and settlement criteriawhile meeting current demand and long term employability.
● Takes entire family into account.● Hybrid systems adapt to demand and supply orientations.● Linked to limits.● Prompts positive self-selection.
● Post-entry retention not assured.● Requires investment in ongoing evaluation to recalibrate point
criteria.● Complex for migrants.● Verification of skills is cumbersome.● If linked to target, threshold varies with demand.
Services for employers(job fairs, web portalsfor matching,specialist staff)
● Filling or complementing gaps that the market cannotprovide.
● May be less expensive than private recruitment servicesfor public sector employment (e.g. health care).
● Government services signal public support.
● Direct government involvement in matching may not be allowe● Represents government subsidy to employers to hire from abr● Competes with private services.● Coverage is limited.● May be expensive.
Providing a “Red Carpet”for selected migrants
● Appropriate for global competition for talent.● Signals a welcoming host country.● Allows added effect of spousal employment.
● Many determinants are unrelated to migration decision making● Public opinion may be against subsidies for recruitment from a● Institutional culture may not be client-oriented.
Job search visa ● Retaining a supply side option with limited time duration,helps overcome matching from afar.
● Selection criteria difficult to identify and need to be revised bason experience.
● Matching and skills verification can be difficult.● Few qualify, so managing return of unsuccessful migrant job s
(Dis-)incentives (withholds,bonds, sponsor or trustedpartner status, repeat entry)
● Reduces overstay.● Uses market measures to increase compliance
from employers and migrants.
● High costs of managing administration and enforcement.● Risk of penalising migrants in the case of employer non-comp
and vice versa.
INTERNATIONAL MIGRATION OUTLOOK 2014 © OECD 2014198

3. MANAGING LABOUR MIGRATION: SMART POLICIES TO SUPPORT ECONOMIC GROWTH
In times of budget constraints and personnel reduction, for example, it may make
sense to focus on industry and various third parties, using more incentive-based
instruments and different forms of self-regulation, rather than have the public sector take
on additional tasks. The emergence of “trusted partnerships”, or systems for accrediting
employers, have come about over the past few years – partly in response to the need to
better target the oversight provided by stretched public authorities and inspectorates.
Public opinion may also be the driving force behind the choice of some instruments
rather than others – particularly when there are calls for more restrictive approaches to
selection and admission. The idea of numerical control in a demand-driven policy is a
strong signal to the public that the government controls the numbers of foreign workers it
is allowing into the country (Chaloff, 2014). The re-introduction and strengthening of
labour market tests in Australia49 and Canada in 2013, for example, was partly influenced
by public concern over temporary work programmes.
The trend towards shortage lists, for example, shows how technical exercises have
been wedded to consultation phases in order to build consensus and reduce political
conflict. The public consultation phase used by Canada as one element in setting its
annual planning levels is another example. The increasing use of advisory committees in
policy development reflects the use of network-type instruments in a complex decision-
making environment where much information is ambivalent.
Institutional infrastructure and the culture of the country also affect the applicability
and attractiveness of certain tools. For example, the relationship of citizens and users to
public administration can determine the success of some tools. Tools requiring substantial
discretion by individual civil servants in evaluating applications, for example, work best
where they develop expertise and where strong integrity measures are in place to prevent
corruption. No tool can be chosen without considering the prevailing national practices of
implementation – i.e. the social norms guiding behaviour in the public sector (Linder and
Peters, 1990).
Managing flexibility amidst constraints
The ability to show policy flexibility and agility is essential for adapting to changes in
the policy environment. While doing nothing is a legitimate policy option in some cases, in
many others the opportunity costs of inaction or deferred action could be high. Flexibility
serves many purposes – to seize emergent opportunities, manage unexpected events and
shocks, or make mid-course corrections.
Institutional arrangements can be facilitators or barriers. The flexibility of policy is
related to the level of legislation into which policies are written (law, regulations,
instructions, etc.), the frequency and speed at which legislative changes can be introduced,
and the related machinery of government for policy making and delivery.
In the United States, for example, some of the most important aspects of labour
migration programmes are written into legislation, giving them less flexibility to respond
to changing market conditions or technology. Shortage lists, for example, are set in statute.
Other institutional characteristics can make change more complex, but still achievable.
Canada has introduced a number of changes, some through legislative amendment,
although it must reckon with a prescriptive constitution, independent provinces, and a
strong judiciary which has overturned various legal changes.
INTERNATIONAL MIGRATION OUTLOOK 2014 © OECD 2014 199

3. MANAGING LABOUR MIGRATION: SMART POLICIES TO SUPPORT ECONOMIC GROWTH
Limits to flexibility can also come from rigid administrative systems. In many
countries, policy changes can happen only at certain times of the year for cost-related or
administrative reasons. IT infrastructure may also be a limit. The capacity of institutions to
adapt to changes needs to be taken into account, since ambitious reforms may be
hamstrung by limited capacity or an unrealistic timeframe for realisation.
Moving with change, seizing opportunities. Policy flexibility signals the ability to
change instruments and, at times, objectives. The growing shift towards demand-oriented
permanent migration is an example of learning from outcomes and being able to shift the
means to achieve the same ends. Similarly, re-introducing new forms of supply channels
such as job-search visas is an example of the willingness to experiment with alternative
tools, albeit on a limited scale.
Policy experimentation can involve looking to seize opportunities to trial new
concepts. Major infrastructure investment may call for special permits to be issued or
conditions adjusted. Italy created a channel for construction workers for an international
exposition, for example, and Japan has planned additional options for recruiting foreign
construction workers through the 2020 Olympic Games. Two initiatives were taken in
New Zealand in the wake of the 2011 Canterbury earthquakes, which required a significant
rebuild. One was to extend work rights to international students in limited duration
language courses so as to attract students to language providers in the region. The second
was to set up a Canterbury skills and employment hub to provide job-matching,
information-sharing, and immigration facilitation services, with a dedicated team of skills
brokers. The hub helps employers access international labour markets through a
streamlined immigration process.50
National policy can also build on local initiatives. One example is the New Scotland
Initiative, a regional scheme to attract international skills for mitigating a regional
demographic issue. While it was not set up as a pilot, the concept was mainstreamed
across the United Kingdom and subsequently integrated into one of the tiers of the
country’s Points-Based System.
Agility appears to be the exception. No policy, even one with self-correcting measures,
can run on autopilot. Sweden’s purely demand-driven system, for example, was
introduced in 2008 to reflect real demand, but required adjustments to procedures in 2012
to prevent abuse of the system. Australia’s subclass 457 visa (for skilled temporary workers)
has historically paralleled changes in demand. Yet, even tighter requirements have been
introduced to ease the adverse impacts on domestic workers and possible misuse of the
system. One response in many countries has been to create monitoring and advisory
bodies, such as migration directorates or advisory councils. The ever more frequent
appearance of such bodies indicates increased policy activity.
Overall, pilot programmes (Box 3.5) may be a way to assess the validity of a new policy
approach before scaling it up to the national level.
Consultation and continuous improvement
Public consultation in migration policy making appears more widely used when
identifying skill shortages. Public consultation can take different forms: in Sweden,
stakeholder meetings; in Italy, a cap-setting process; in Slovenia, a tri-partite consultative
body. Other examples of measures developed through public consultation include France’s
INTERNATIONAL MIGRATION OUTLOOK 2014 © OECD 2014200

3. MANAGING LABOUR MIGRATION: SMART POLICIES TO SUPPORT ECONOMIC GROWTH
finalisation of its shortage lists, MAC’s bottom-up consultation for the Shortage
Occupation List, and the New Zealand public submissions and consultations for the
Essential Skills in Demand List.
Box 3.5. Pilot programmes and periodic reviews: Learning what to keep,modify or stop altogether
Good practice postulates that the full-scale introduction of new policies and deliverymechanisms should, wherever possible, be preceded by closely monitored pilots. Phasedintroductions help not only to inform implementation, but to identify and preventunintended consequences. A pilot is an important first stage in regular, longer-term policymonitoring and evaluation.
Migration policy has seen a number of pilots, some of which were later mainstreamed. BothAustralia and New Zealand trialled their seasonal worker programmes. At the beginningof 2009, the Netherlands introduced a programme (the “Regeling Hoogopgeleiden”) that allowsrecent graduates of highly ranked universities abroad to spend up to a year searching for workon the Dutch labour market. An evaluation of the programme after two years concluded thatits uptake had remained disappointingly low.Yet it argued that it could be expected to increaseand that even a small number of highly skilled migrants were valuable. Ultimately, theprogramme was continued and uptake has been rising considerably.
Some pilots have served to show that projects should not be mainstreamed. Oneexample is the Czech Republic’s “Selection of Qualified Foreign Workers” pilot, 2003-10.Another was the “Dutch Bluebirds” pilot for circular migration from South Africa which,although it closed prematurely, provided valuable lessons. A pilot that reveals a policy tobe flawed or ineffective should be viewed as a success rather than a failure, as it has helpedto avert a potentially larger political and/or financial embarrassment. In this sense eventruncated pilot programmes can be worthwhile.
A number of countries have introduced regular or specific reviews of the outcomes oflabour migration programmes. Canada regularly conducts such reviews and evaluations.Evaluating programme progress and reporting on results are meant to provide seniormanagers with evidence-based information to improve programming, shape new policiesand programmes, and ensure value for money. Evaluation studies consider a programme’son-going need, intended outcomes, and whether there are alternative, more cost-effectiveways to meet objectives.
The United Kingdom created its Migration Advisory Committee (MAC) in 2008 to adviseon the make-up of the shortage occupation list. Its remit has since expanded to looking atspecific policy issues on non-EU labour immigration. Issues include the impact of non-EUmigration and means for imposing limits on migration.* The MAC-style approach toinforming government migration policy was among the first of its kind anywhere in theworld and is a model that is now being considered or adopted by other countries. InJuly 2012, Australia set up the Ministerial Advisory Council on Skilled Migration (MACSM)with a remit to provide the Australian government with expert advice on the role of skilledmigration in the Australian economy. Ireland and Canada have followed suit. Finally, aspart of proposed immigration reform in the United States, a government-funded Bureau ofImmigration and Labour Market Research that conducts monitoring and analysis wouldhave been created.
* www.ukba.homeoffice.gov.uk/sitecontent/documents/aboutus/workingwithus/mac/role-mac.
INTERNATIONAL MIGRATION OUTLOOK 2014 © OECD 2014 201

3. MANAGING LABOUR MIGRATION: SMART POLICIES TO SUPPORT ECONOMIC GROWTH
Other areas of consultation are determining planning levels and even integration
measures. Canada has a strong tradition of consultation across various policy issues. In
late 2012, the immigration agency, Citizenship and Immigration Canada (CIC), held
consultations with Canadian employers on building the EoI system – a commitment made
in the Economic Action Plan 2012. Similarly public consultation has occurred to some
extent for setting CIC’s annual Immigration Levels Planning. The United Kingdom Home
Office undertakes full consultation on significant issues, such as (recently) the principles
and measures included in the fees and charges proposals of the Immigration Bill 2013.
There are few instances of more joined-up and innovative policy-making practices,
although the emergence of the New Zealand seasonal work programme is one (Box 3.6).
Feedback loops: Monitoring, research and evidence in policy making. The different
feedback arrangements in place across OECD countries reflect their different accountability
and learning priorities. Such variety of arrangements is the result of many factors, not least
the evaluative culture and organisational learning in public sector environments. Legislative
or ministerial requirements may impose routine evaluation and reporting on new and
established policy initiatives.The capacity and capability for undertaking such work also
determine what kind of arrangements are put in place. Further, the nature of funding
available for evaluating and reporting, whether one-off allocations or from portfolio budget
Box 3.6. Policy co-production and participatory policy-making processes
The value of public participation can be viewed through an instrumental lens – as a toolfor increasing public trust and confidence, gathering evidence on complex issues thattechnical analyses may not discover, and a way of limiting risk and finding partners toimplement complex solutions.
The New Zealand Recognised Seasonal Employer (RSE) scheme is the result of a joined-uppolicy production process (New Zealand Department of Labour, 2010). The impetus forjoined-up government intervention in the horticulture and wine-growing labour marketscame from several policy agencies: Labour, Economic Development, Social Development,Agriculture and Forestry, Trade and Enterprise, and the Inland Revenue Department.Problems with seasonal labour supply and compliance led to the formation of theHorticulture and Viticulture Seasonal Working Group, which was styled as a partnershipbetween industry, government, and other organisations. The working group sought tointegrate the concerns and on-going initiatives of multiple government agencies andlobbying by different industry groups, working to shift control away from contractors, whohad become central, but under-scrutinised and largely unregulated players, in bothindustries. The working group subsequently developed the Medium-Long-Term Horticultureand Viticulture Seasonal Labour Strategy, from which the RSE Policy eventually emerged.The policy was thus a part of the broader strategy to address systemic seasonal labourmarket issues.
More specifically the Seasonal Labour Strategy was developed through systems analysisand action learning processes, involving time-intensive iterative sessions withgovernment agencies, industry actors, and union representatives. While the payoff can besignificant for robust policy making, the huge up-front investment in such learningexercises can deter some agencies from considering such approaches especially inconstrained times.
INTERNATIONAL MIGRATION OUTLOOK 2014 © OECD 2014202

3. MANAGING LABOUR MIGRATION: SMART POLICIES TO SUPPORT ECONOMIC GROWTH
baselines, can also influence such evidence collation. Longitudinal surveys, after all, are
expensive to run. Where there is a link to routine performance reporting, dedicated funding
is more likely.
The role of evaluations, while significant, can vary both in scope and the way in which
they are utilised for further change. They can focus on the wider economic and, at time,
social impacts of immigration, as well on specific policy and programmes like the skilled
visa stream or the operational efficiency of handling visas. Many settlement countries
undertake periodic evaluations – examples are Canada’s on-going evaluation work
programme or the programme reviews by the United States Government Accountability
Office (GAO).
The United Kingdom Home office undertakes evaluation and research while the
Migration Advisory Committee provides independent advice and evaluation-type reviews
of overarching policy streams rather than individual service-level programmes. Systematic
evidence collation can also come through other mechanisms such as the Swedish
Independent Parliamentary Committee report or Norway’s white paper on refugee and
migration policy. The Netherlands, like many other countries, undertakes mostly one-off
evaluation – especially when introducing a new policy accompanied by a directive for
officials to evaluate and report back.
Having arrangements for systematic feedback helps in knowing what policy outcomes
are being achieved and how well they meet intended objectives. Such on-going information
should, however, be linked to appropriate policy changes, corrections or enhancements, for
both agencies and governments.
Beyond monitoring flows and stocks: Forecasting. Some OECD countries undertake
systematic forecasts of labour demand and supply and estimate the potential role of
migration factors in the equation. One example is the model used by Statistics Norway.
Its 2013 analysis modelled the demand and supply of labour by educational level to 2030,
yielding a forecast of surplus and shortage for each level. The model builds in a level of net
immigration comparable to that seen in the late 2000s – about 40 000 annually – and
applies the education distribution of immigrants from that period, most of whom were
from within the EEA. The work and its findings were not directly related to migration
policy, however.
In Australia, since 2010, the Department of Immigration and Border Protection (DIBP)
has developed a short-term forecasting model of net migration arrivals and departures
over a four-year horizon. Revised quarterly, they are published on the department’s
website.51 The model offers the advantage of forecasting the consequences on population
growth of the rise in numbers of temporary visas – especially among international
students – so allowing the governments to factor such effects into policy design. Such
modelling was not available in the mid-2000s, when population growth from migration
was inaccurately forecast.
New Zealand carries out bi-annual econometric forecasting of visa volumes to inform
residence planning and budget management. Australia and Canada, too, adjust their
permanent residence targets on an annual basis, drawing upon forecasting tools and other
information like varying labour market conditions (OECD 2014a). In Germany, a Federal
Employment Agency forecast of skilled labour shortages quantified needs for skilled migrants,
taking into account the limits of upskilling and participation increases (OECD, 2013b).
INTERNATIONAL MIGRATION OUTLOOK 2014 © OECD 2014 203

3. MANAGING LABOUR MIGRATION: SMART POLICIES TO SUPPORT ECONOMIC GROWTH
In summary, policy makers have at their disposal a wide range of increasingly
sophisticated tools to achieve their policy goals. Not all institutional settings are capable of
using them to their full potential, or even appropriately. It is important not to confuse the
tool with the objective it is supposed to achieve. Further, simple tools may also be the most
effective, especially when matched with efficient migration infrastructure.
Building a migration management infrastructureIn migration, as in other policy areas, implementation matters and can determine the
success of any policy in achieving its goal. The ability to realise policy goals depends on the
capacity for delivery. Capacity, in turn, hinges on the human and capital resources,
processes, and practices involved. There is, however, no single ideal labour migration
management infrastructure.
Sound policy settings are a necessary condition, but not in themselves sufficient to
realise intended policy outcomes. Policy objectives often require a range of operational
and/or service delivery infrastructure and programmes to achieve their intent. Service
delivery can, in the rush of policy making, become an afterthought rather than a priority.
Furthermore, well designed service support becomes more important as countries
increasingly consider “active” immigration policies (Chaloff and Lemaître, 2009) that aim at
enhancing the attractiveness of admission policies.
Effective engagement with migrants and employers, two key users of immigration
services, is essential to how migration policy works in practice. Studies of employers in a
number of countries have found that they are frustrated by the burdensome processes and
bureaucracy they endure in recruiting migrant workers (MBIE, 2013). As a result, they use
agents or other channels. Migrants, too, have concerns with cumbersome procedures.
While improvements to processing address such barriers to migration, they also
reflect the general sharpening of administrative machinery in many countries, which is
prompted by changing economic conditions and greater emphasis on public sector
efficiency and value for money.
Improving processing channelsOne means of improving system efficiency is through faster processing. A system
characterised by significant delays or backlogs is an incentive to bypass official channels or
hire before approval is granted. A cross-country comparison of how long it takes to process
highly skilled immigrants (Figure 3.9) shows significant variations in the shortest and the
longest times.
Against this background there is a growing trend towards online submission and
outsourcing visa application acceptance as part of customer focus and efficiency (Box 3.7).
A number of countries are moving online as a way of increasing efficiency, cutting down
backlogs, and responding better to client needs. Part of the rationale for online submissions
is that case officers can spend more time on decision making than on paper work. Examples
of online submission include the United Kingdom’s system, Australia’s SkillSelect,
New Zealand’s Immigration Global Management System (IGMS), (CIC Online in Canada), the
United States’ DS-160 Non-immigrant Visa Electronic Application, and systems in Sweden.
In Sweden the online processing of applications takes four weeks, half the time it takes paper
applications (OECD, 2011b). One reason is that online applications must be formally
complete, so no time is wasted with incomplete ones. The United Kingdom charges higher
fees for paper applications to discourage them, while Italy accepts applications online only.52
INTERNATIONAL MIGRATION OUTLOOK 2014 © OECD 2014204

3. MANAGING LABOUR MIGRATION: SMART POLICIES TO SUPPORT ECONOMIC GROWTH
157753
orsenctsert’s
omisalia
alhendoftoof
P
lic –
ICT
Figure 3.9. Processing times for work permits, various categories, 2014 or latestDays
Source: OECD Secretariat.1 2 http://dx.doi.org/10.1787/888933
Box 3.7. Customer/client satisfaction surveys and reviews
A number of OECD countries benchmark their service channels and processes by measuring indicatlike efficiency and client satisfaction. Clients may be the migrants themselves, their employers, or evtheir representatives (agents, lawyers, etc.). In the United States, a customer survey evaluated key aspeof the E-Verify programme such as registration, tutorials, ease of use, technical assistance, and customservice. It compared the score on the American Customer Satisfaction Index scale with the governmenoverall score.1 Since 2013, migrants applying for a visa from outside, as well as inside, the United Kingdhave been responding to a customer satisfaction survey. After they receive a decision on their vapplication, they are sent an email that invites them to answer a questionnaire via a web link.2 Austrauses market research approaches to understand the needs and target services of client groups.3
Managing customer satisfaction involves going beyond service delivery into wider organisationfunctions and quality control frameworks. Some countries also focus on quality assurance, i.e. t“integrity or accuracy” of final immigration decisions, to ensure they are correct, consistent, and robust ato minimise the number of wrong decisions. The United Kingdom, for instance, set a target of 98%correct decisions for Tier 4 visa applications and runs quality control checks on a sample of decisionsmonitor performance and identify common errors and training needs.4 New Zealand targeted 90%accurate decisions. Every quarter, a sample of visa decisions is audited for quality.
1. See USCIS (2014).2. www.gov.uk/government/news/new-customer-satisfaction-survey.3. www.immi.gov.au/about/department/cep/.4. See UKBA (2012).
0
50
100
150
200
250
300
350
400
450
Minimum Maximum
Belgium
– High
-skille
d
Finlan
d – Spe
cial e
xpert
New Ze
aland
– Te
mp WP
Korea
– E-7
New Ze
aland
– Wor
k-to-re
siden
ce
Austra
lia –
Temp.
Irelan
d – Gree
n card
Sweden
– WP
Korea –
High
-skille
d
Spain
– High
-skille
d
German
y – W
P
German
y – H
igh-sk
illed
Denmark
– WP
Mexico
– WP
Hunga
ry – W
P
Turke
y – W
P
United
States
– H-1B
Poland
– WP
Spain
– WP
Switzerl
and –
WP-L
/B
Canad
a – Te
mp.
Netherl
ands
– WP
Israe
l – W
P-spec
ialty
Norway
– High
-skille
d
Finlan
d – W
P
United
Kingdo
m – WP-Tier
2
Czech
Rep
ublic
– Gree
n card
Korea
– E-
9
Italy
– WP
New Ze
aland
– Perm
skille
d
Chile –
WP
Czech
Rep
ublic
– WP
Czech
Rep
ublic
– High
-skille
d
Slovak
Rep
ublic
– WP
Irelan
d – W
Czech
Rep
ub
INTERNATIONAL MIGRATION OUTLOOK 2014 © OECD 2014 205

3. MANAGING LABOUR MIGRATION: SMART POLICIES TO SUPPORT ECONOMIC GROWTH
Systems boast varying levels of functionality. In Canada the “check your application
status” tool allows some CIC clients to securely view the status of their immigration and/or
citizenship application(s) online. Australia’s SkillSelect rules engine determines who gets
invited to apply (through the PBS), so reducing the time it takes to process a visa application.
SkillSelect also helps address regional skills shortages by asking would-be migrants if they
are willing to live and work in regional Australia. Employers and state and territory
governments can then use online tools to pluck out those applicants who say “yes”.
New digital and web-based technology allows processing platforms to give migrants a
better sense of the application status. A number of countries track their processing times
as part of internal performance management, but also to obtain feedback from migrants
and employers on service standards (Box 3.7).
The joint Australian and Canadian “e-medical system” processes admission-related
medical requirements like health certificates. The two countries co-developed the system
which can be used to process medical examinations. In 2012 and 2013, the system was rolled
out to approximately 100 locations globally, widening access to the online processing of bills
of health, with consequent speed and efficiency benefits. More than 100 000 Australian cases
were processed during its first six months of operation, with more than 72% of them being
auto-cleared, i.e. with no manual intervention required and results available in minutes.53
Fast-tracking processes
Fast-track processes allow some migration categories, employers or individuals to
benefit from faster processing, either because their applications are handled as a matter of
priority or because they do not have to go through certain stages.
Some are trusted employers. For example, Australia’s migration policy, which focuses
on the country’s regions Australia, uses regional certifying bodies (e.g. regional economic
development agencies or chambers of commerce) to certify employer nominations and
requests. Sweden certifies good employers, usually large organisations, with the Swedish
Migration Board, which can reduce the turnaround time for work and residence permits
from up to seven months to seven calendar days. Intra-company transferees in some
countries may also be fast-tracked.
Other fast-tracking processes are sector- or occupation-specific. One example comes
from Ireland, which introduced arrangements in June 2010 in response to a shortage of
doctors. Non-EEA doctors offered employment in the Irish public health system were
exempted from the need to hold a work permit. This provision ended in 2014.
New Zealand is currently trialling a new skills hub in Canterbury that will help
fast-track immigrant admissions when employers cannot source local workers to fill their
vacancies. This system of “front loading”, where the labour market test is conducted at an
earlier stage in the process, may be replicated nationwide if found to work well.
In other cases, fast-tracking comes at a price. The United States offers Premium
Processing Services for employers who file applications to sponsor a migrant on a
non-immigrant, temporary employment visa which guarantees processing within
15 calendar days. Similar services are offered in the United Kingdom.
There is, however, concern that while fast-tracked processes do help employers recruit
foreign workers, particularly temporary migrants, they are generally not accessible to
SMEs. Such firms may not have the funds or the need for intra-company transfers or may
not submit a high enough volume of applications to reach fast-tracked status (IOM, 2012).
INTERNATIONAL MIGRATION OUTLOOK 2014 © OECD 2014206

3. MANAGING LABOUR MIGRATION: SMART POLICIES TO SUPPORT ECONOMIC GROWTH
Dedicated staff resources
The case manager model, where applicant migrants and employers have a single point
of contact, is not widespread in migration systems, although some cases have been cited
above. More common are information and orientation resources.
Scotland introduced its “Fresh Talent Initiative” in response to its declining population
and skills. A key aspect was establishing and running the Relocation Advisory Service, an
advice centre for those interested in moving to or staying on in Scotland. It targeted
particular groups, e.g. universities and international students. Similarly, New Zealand
relationship managers provide services to employers in need of migrant workers, while
liaison officials manage investor clients. Some services may be outsourced (see Box 3.8).
Simplifying procedures
Procedural complexities can overwhelm migrants and employers and add to the costs of
migration. The number of steps in the work permit application procedure varies across
countries. In Norway, for example, the procedure is through a single two-page form submitted
to a single authority. However, most countries require applicants to interact with different
government departments or go through procedures that involve a number of agencies.
Box 3.8. Outsourcing migration business processes
As more people than ever are on the move for multiple reasons, destination countriesare gearing up to meet both increased caseload volumes and wider geographical coverageby outsourcing the administrative functions of visa processing. With immigrationbranches and diplomatic missions around the world, often with fewer resources, countriesare moving away from brick-and-mortar business models and turning to visa applicationcentres (VACs) as the front office of immigration agencies. The United States, theUnited Kingdom, Denmark, Australia, Canada, and New Zealand have been using VACs forsome time.
Tendering an application to a VAC ensures that all the associated administrativeformalities are completed to a high standard and in a timely manner that minimisesrejection rates or re-submissions. One key rationale is to reduce the administrative burdenon staff and improve the quality of visa decision making itself.
Service providers typically carry out the administrative tasks for most visa categories(barring residence applications).The following are the main tasks undertaken by theInternational Organisation for Migration (IOM) for Australia when operating VACs: clientinformation, receiving applications, data capture, fee receipt, passport/visa return, andreporting. VACs have no say in decision making or any influence whatsoever on theoutcome of an application. Administrative support can also include collecting biometricinformation (BLS International does this for Denmark). However, over time the scaling upof secure online submissions via IT platforms will make for greater efficiency in managingapplication submissions.
Providers must be capable of respecting privacy and confidentiality. Since VACs tend towork on at least a cost-recovery basis, if not for profit, applicant costs may rise and feesneed to be stated in tenders. Similar service outsourcing trends can also be seen inappointment booking services, for example, to shield consulates from being overwhelmedwith telephone calls.
INTERNATIONAL MIGRATION OUTLOOK 2014 © OECD 2014 207

3. MANAGING LABOUR MIGRATION: SMART POLICIES TO SUPPORT ECONOMIC GROWTH
One possible strategy is to rationalise the issuing of separate work and residence
permits. The EU “single permit” directive was designed to simplify and harmonise the rules
currently applicable in EU states, and create a more efficient procedure both for non-EU
nationals and their employers. The directive (EC Directive 2011/98/EU) requires EU member
countries to implement a single application procedure for initial, amended, and renewal
permit applications. Not only does the directive designate a single authority, it also sets out
a four-month period for adjudication from submission time. Member countries remain free
to require separate labour market testing requirements.54
The single permit is for both residence and work. The permit must be in a card format
and contain a variety of security and biometric features, such as the holder’s fingerprints
and a digital photograph. They may include additional information related to the holder’s
employment status, such as his or her employer’s name and address, place and type of
work, working hours, and/or remuneration. Other than the single permit, member states
may not require any additional permits as proof of the entitlement to work.
Holders of single permits will be entitled to freely access and reside in any part of the
EU member state that issued their permit, though they will be allowed to work only at the
location and for the employer if specified in their permit. Single permit holders will
generally be entitled to the same rights as EU nationals with regard to working conditions,
labour organisation, education and vocational training, recognition of qualifications and
degrees, and tax benefits.
The single residence permit clarifies employment eligibility. Separate work and stay
documents can be complex for employers to understand. That is one reason why the
United States, where dozens of documents can attest employment eligibility, has
introduced its web-based E-Verify system for employers.
One-stop shops to improve co-ordination and client experience
There is a wide range of information services for migrants relating to work and living
in OECD countries. However, there are few instances of one-stop shops that connect
migrants to the many non-migration services that they may need.
Portugal’s High Commission for Immigration and Intercultural Dialogue (ACIDI)
connects migrants to permits services, the police, healthcare, schools, etc. (OECD, 2008b).
One of ACIDI’s special features is the presence of 30 intercultural mediators in the offices
of Portugal’s Services for Foreigners and Border Control (SEF), but who nevertheless remain
employees of the main immigrant support groups. ACIDI also has a highly flexible delivery
approach that includes buses to proximity services in areas with high migrant
concentrations, weekend hours, and online documentation.
The WorkinDenmark initiative includes an Internet portal, service centres in three of
Denmark’s largest cities, and a job and CV bank for highly skilled individuals. Employers
can view migrants’ posted CVs but need to be registered to access their contact details.
Services offered to employers include: finding appropriate candidates, a hotline service
and, more importantly, a single point of contact for both employers and migrants that
supplies information on residence permits, social security numbers, health insurance
cards, authorisations, taxation, etc. The same service also assists with settlement, job
seeking for spouses, and facilitating the return home when stays are temporary.
INTERNATIONAL MIGRATION OUTLOOK 2014 © OECD 2014208

3. MANAGING LABOUR MIGRATION: SMART POLICIES TO SUPPORT ECONOMIC GROWTH
The Norwegian police, the Directorate of Immigration, the Tax Directorate, and the
labour inspection authorities have established joint service centres in three cities for
foreign workers. The centres serve EEA citizens on Norwegian job contracts and citizens
from outside the EEA who have received offers of employment and are applying for
specialist work permits. The centres also serve family members of both migrant categories.
At the service centre workers or their employers can apply for the following: first-time
work and residence permits and renewals, tax deduction cards, personal identification
numbers (or temporary tax numbers), and entry in the Norwegian Population Register.
Setting the optimum fee structure
Fees depend on how administrative services are priced and funded. In a “cost
recovery/user pays” model the migrant bears a substantial cost. It is usually intended to
cover the administrative costs of processing visas and managing compliance.
In most cases, visa fees account for only a little of total migration costs. Nonetheless,
there is wide variation in fees applied (Figure 3.10) and for low-wage workers with
short-term stays fees can soak up a significant portion of their expected return to labour
migration. Excessive costs can deter potential migrants and a reasonable expectation is
that fees and associated costs should be only a small proportion of average earnings and
that high fees should not add to existing system inefficiencies.
Most fees do not depend on migrants’ earnings – only in France and Israel are they
related to wages. France charges the worker EUR 70 and levies from the employer 60% of
one month’s salary, which can be up to 2.5 times the minimum wage. The highest fee is
USD 4 500 for a worker earning a monthly salary of more than USD 7 700. The fee for
construction workers in Israel is USD 4 500 for admission into the country and a 15% levy
on gross wages every month. The idea in Israel is to deter employers from hiring overseas
workers, as the country uses none of the local labour safeguard mechanisms applied in
other OECD countries (OECD, 2013d).
Among skilled workers, there is no evidence that migrants are sensitive to fee price
movements. Other categories, such as temporary workers, low-skilled workers and
international students, may be more sensitive. In this regard, Australia and the
United Kingdom have undertaken exercises to estimate the elasticity of demand.
In some instances, an overall pricing strategy goes beyond the cost of permit, as in
Australia. From July 2013, an additional applicant charge was introduced, as were a
non-Internet application charge and a temporary application charge. Australia provides an
upfront visa pricing estimator for migrants to check total prices at the outset of the process.
Deciding whether to regulate private actors
In the migration supply chain, several actors are involved in getting migrant workers
from origin to destination countries, and even assisting them in status changes within
borders. These third-party actors may be immigration advisers, recruitment agents and
accredited employers. They may both help match jobs and workers and steer migrants and
their families through cumbersome administrative systems and processes. Intermediaries
in the migration process exist in all OECD countries, with varying degree of regulation. In
some countries, they are integrated into the migration process. In others, they are seen as
external or superfluous actors and their intervention unacknowledged.
INTERNATIONAL MIGRATION OUTLOOK 2014 © OECD 2014 209

3. MANAGING LABOUR MIGRATION: SMART POLICIES TO SUPPORT ECONOMIC GROWTH
Labour supply can outstrip demand and the bargaining position of migrants,
especially the lower-skilled ones, can be weak. Accordingly, governments use a number of
tools to regulate these intermediaries and other third-party actors (see Box 3.9). The
rationale for “pre-screening” such actors through some sort of certifying process is to
prevent the exploitation of migrants, maintain a level playing field for all intermediaries,
Figure 3.10. Government-applied fees for obtaining work visas and permits, 2014USD
Note: Exchange rate as of March 2014.Source: OECD Secretariat.
1 2 http://dx.doi.org/10.1787/888933157763
0 2 000 4 000 6 000 8 000 10 000
0 200 400 600 800 1 000 1 200 1 400
Minimum Maximum
United States – L1
United Kingdom – WP-T2
New Zealand – SMP
Denmark – GC
France – WP
Ireland – GC, WP
United States – EB2/3
United States – H1B
Australia – ENS
Australia – RSMS
Israel – HS
Belgium – HSPoland – WPTurkey – WP
Germany – WP §18Hungary – WPFrance – WP-T
Italy – WPIceland – WP
Czech Republic – GCCzech Republic – HSNew Zealand – W2R
New Zealand – WPCanada – TFW
Czech Republic – WPNorway – HS/ICT
Germany – HS §19Spain – HSSpain – WP
Finland – HSSweden – WP
France – ICTFrance – HS
Finland – WPDenmark – WP
Netherlands – WPIreland – WP
Australia – 457Switzerland – L-Long
INTERNATIONAL MIGRATION OUTLOOK 2014 © OECD 2014210

3. MANAGING LABOUR MIGRATION: SMART POLICIES TO SUPPORT ECONOMIC GROWTH
and to shift the burden of compliance from the public authorities to private stakeholders.
The key question is the nature and form of regulation and how governments manage it
through incentives and disincentives, including periodic monitoring.
Box 3.9. Regulating intermediaries – immigration advisersand recruitment agents
There are several actors along the migration supply chain whom states may attempt toregulate for a number of reasons. Immigration advisers and recruitment agents are two ofthe key actors, with the latter sometimes operating on the fringes of immigration advice aswell. Both advisors and agents fill gaps caused by information complexity and asymmetry– immigration laws can be cumbersome even for skilled migrants and job matching in adistant and different labour market difficult or even impossible without an intermediary.
In principle, a licensed immigration adviser or lawyer has specialised expertise in a givenimmigration system and, more importantly, is regulated by a code of conduct that sets outthe required standards of professional and ethical behaviour. This affords protection tomigrants or employers if services are found wanting. In the event of a complaint, thereare processes for redress outside of legal channels and, when this fails, arbitrationmechanisms are available.
Such non-state intermediaries play an important role in mediating and handling labourmigration procedures in most countries. Some, such as Canada (Immigration Consultants ofCanada Regulatory Council), the United Kingdom (Office of the Immigration ServicesCommissioner), New Zealand (Immigration Advisers Authority), and Australia (Office of theMigration Agents Registration Authority) have well established regulatory regimes in place.These bodies perform license certification and offer training. Advisers need to demonstratecompetence in several areas including immigration law and running businesses. They aresubject to a code of conduct that covers ethical issues and conflicts of interest.
Typical issues with immigration advice include regulating advisors based overseas,soliciting for business, misleading advertisements relating to visa options, andovercharging. Lawyers tend to be outside the regime. In some cases, regulation applieswithin the legal profession as well. In the United States, only an attorney or an accreditedrepresentative working for an organisation recognised by the Board of ImmigrationAppeals may give legal advice.
Different set of issues arise with recruitment agents. They include placement fees,invisible deductions, and abuse of low-skilled workers that add to issues of exploitationand overstay. The migrant labour recruitment industry is far more complex to regulate.The insidious issue of overcharging (above what is permitted legally) is generally dealt withthrough Convention 181 of the International Labour Organisation that provides aframework for national governments in regulating private recruitment agents.
There are some examples of attempts to legislate, such as the California Transparency inSupply Chains Act, which requires companies to report publicly on their efforts to preventhuman trafficking in their supply chains.* New Zealand regulates recruitment agents inthe way it manages its seasonal worker programmes and through inter-agency agreementswith sending countries.
* See Klett (2013).
INTERNATIONAL MIGRATION OUTLOOK 2014 © OECD 2014 211

3. MANAGING LABOUR MIGRATION: SMART POLICIES TO SUPPORT ECONOMIC GROWTH
Assessing qualifications and skills
Qualifications and skills mismatch are widespread in most OECD countries. They are
difficult to address in general and even more so for migrants who obtained their
qualifications and skills in different educational and labour market settings. If the human
capital that migrants bring is not to be wasted, host countries must prioritise assessment
of their qualifications and skills.
Cross-national assessment is a resource-intensive task that has to marshal
information on the specifics of national labour markets and skills and occupational
classification systems. It is also an area with an elevated risk of fraud and potentially large
efficiency gains for international collaboration. Another complex aspect of international
assessment is regulated professions where registration is generally performed by
professional bodies to rigorous standards. This is especially true in the health sector. Then
come trade bodies and vocational education.
One example of multilateral co-operation comes in the shape of the National Academic
Recognition and Information Centres (NARIC), which share information about origin country
education. The NARIC centres provide information about studies in the countries of the
European Union and EEA. They work with the European Network of National Information
Centres (ENIC) established by the Council of Europe and UNESCO. There is one in each
country. However, there is currently no multilateral entity that verifies non-EU qualifications,
although a few countries have developed specific assessment systems.
In 2004, Denmark established regional knowledge centres for the assessment of the
skills and qualifications of immigrants – a joint project by the Ministry of Employment and
the social partners. Assessments are generally conducted in workplace situations in
companies, with participants being given “competence cards” that match their skills to
labour market needs. The centres also assist immigrants in actually finding jobs in line
with their skills (OECD, 2007).
Starting in May 2013, all migrants applying for admission to Canada under its Federal
Skilled Worker Program (FSWP) must obtain an Educational Credential Assessment
(ECA) of their completed foreign educational credentials. Designated organisations, which
include professional bodies, evaluate degrees and transcripts before confirming their
validity and determining their equivalence to a Canadian credential.
Recently Australia set up a system of assessing skills for migration purposes.55 Under
the system, the ability of skilled migrants to work in their nominated occupation at the
required skills level is assessed before a decision is made on their visa application. The
assessment authority – a statutory body – attempts to relate qualifications and experience
to standards set out under the Australian Qualifications Framework. For some registered
occupations the skills assessment simply takes the form of evidence of the registration
required to practice the occupation in question in Australia (e.g. medicine or law). For
others, the registration or licensing process comes on top of the skills assessment process.
Ensuring fairness in policy criteria and procedural practices
Access to international migration is not fairly distributed between all employers. SMEs, for
example, experience labour shortages, just as large businesses do, yet cannot draw so easily on
international recruitment. Big employers enjoy economies of scale and the chance to develop
specialised recruitment channels and staff in-house. Equal access to the migration system and
lower overheads for SMEs is a reasonable objective. But it may be difficult to operationalise.
INTERNATIONAL MIGRATION OUTLOOK 2014 © OECD 2014212

3. MANAGING LABOUR MIGRATION: SMART POLICIES TO SUPPORT ECONOMIC GROWTH
Nor is there much fairness when it comes to migrants themselves. If there was, all
qualifying migrants with identical qualifications would stand an equal chance of obtaining
a work permit. Yet, the equity principle does not operate in the selection of seasonal
workers. Employers show a preference for the same employees to return, while origin
countries seek to rotate migration opportunities across communities and regions. The
result is an apparent trade-off between equity and efficiency.
Similarly, selection may favour certain nationalities. Indian nationals, for example,
dominate recipients of the United States H-1B visa for skilled workers, primarily in
IT-related occupations. This is in contrast to the longer waiting list for their transition to
permanent residence, since employment-based visas are country-capped, which
disproportionately penalises larger countries and those with many temporary-visa
holders. Other countries – like Italy, the United Kingdom, Canada, and Australia – also
place ceilings on occupations or countries of origin so that no one dominates the rest.
The first-in, first-served principle may not in itself be an issue in the acceptance of
applications for work categories with a quota or cap. But it can arbitrarily cut some
applicants out of the selection process, as in the Italian selection procedure where on-line
filing times mean that successful applicants are separated from the unlucky ones by only
the thinnest of time margins. A fairer solution might be a reasonable window of time
within which migrants submit their applications, followed by a lottery or ballot with the
lucky ones being drawn from the hat, as is the practice for the H-1B visa.
Building compliance mechanisms
Countries use a number of mechanisms in order to ensure compliance with the law.
They range from deterrents and penalties to facilitating tools. Most countries levy fines or
apply other penalties to deter employers from recruiting and retaining illegal workers.
Employer sanctions are a relatively recent addition to labour and immigration laws – since
the mid-1970s in most of Western Europe, the late 1980s in the United States, and
since 1997 in the United Kingdom (Martin and Miller, 2001). Periodic inspections are a basic
tool. However, they depend on the capacity to deliver robust monitoring with adequate
coverage and on how well administrative and judicial systems function.
Illegal hiring has always been an area of concern in compliance with immigration
laws. The European Directive 2009/52/EC institutes minimum levels of sanctions and
measures against employers for illegally retaining non-EU nationals. The European
Parliament recently issued a non-binding resolution that calls for greater enforcement of
EU directives on employer compliance and sanctions. The resolution specifically calls for
more worksite inspections, greater regional co-operation among government enforcement
agencies, and the creation of centralised compliance monitoring mechanisms.
ICT and web-based applications are proactive information tools, which in theory make
it inexcusable not to know worker status. New Zealand, Australia, Canada, and the
United Kingdom, for example, have web-based systems in place. Visa Entitlement
Verification Online (VEVO), is an Australian online service that gives visa holders,
employers, and other registered organisations access to visa entitlements and status
information. Similarly, in the United States the USCIS’s e-Verify system is an online
resource for employers to check the employment eligibility of migrant workers.
INTERNATIONAL MIGRATION OUTLOOK 2014 © OECD 2014 213

3. MANAGING LABOUR MIGRATION: SMART POLICIES TO SUPPORT ECONOMIC GROWTH
Australia’s Dob-in Service encourages community members and the public to
anonymously report on individuals and employers whom they suspect of falling foul of
immigration laws and being in the country illegally.56
Compliance issues are also addressed through educational tools such as clearly posted
explanatory information on web portals. The United States’ Unit I-9 Central, named after
the employment eligibility form for new hires, is designed to afford employers and
employees access to resources, tips and guidance for better understanding the form and
filling it in properly. It includes samples of acceptable I-9 documents, information on
penalties and employee rights, and a link for customer support.
The overall trend suggests that countries are more serious than ever about tightening
up on employers who evade their obligations.
ConclusionsThis chapter has reviewed labour migration policy issues and practices in
OECD countries, stating the case for a migration management system with clear goals, a
range of policy tools, and a dynamic, modern infrastructure.
Judging a labour migration management system is difficult, because there is no single
indicator for success. And yet public opinion continuously asks whether it is working, and
not always in purely labour market terms. Because policy makers have more control over
labour migration than other forms of migration, they are held accountable for its
outcomes. Nonetheless, public opinion is not always aware of the distinction between the
different kinds of migration.
Still, compared with a decade ago, policy makers can draw on much broader, deeper
knowledge of what makes labour migration – and labour migrants – successful. Many policy
instruments have been experimented across the OECD countries, demonstrating that different
tools and approaches are effective and fit for purpose in different contexts. Improved data
collection paints a fuller picture of labour migrants’ longer-term outcomes across countries
and in changing economic circumstances. While each OECD country faces specific challenges,
all can make better use of labour migration to meet those challenges. Smarter labour migration
management means going beyond the traditional categories and distinctions.
With no absolute benchmark for success, it is the task of the political process to set goals
for labour migration policies bearing in mind the trade-offs between what is beneficial to the
wider public, the economy, and the interests of specific groups and migrants themselves.
However, some questions persist. How can policy makers best attract, select, and
retain migrants? Should they limit numbers of migrants in certain categories? If so, how?
And which categories? What are the likely labour market outcomes and impacts of those
selected and family members who accompany them?
No single policy design will solve all those questions in all countries. The tools
discussed in this chapter show the growing sophistication of the options available today.
The proliferation of the Points-Based System and how it has evolved to include the
Expression of Interest is one example of how countries are thinking about managing
numbers and sustaining quality by exercising greater selectivity. Clearly EoI is not easy, nor
is a points-based system suited for all, as not all countries yet know which labour migrants
will be best suited to their labour markets. Long-standing tools such as a labour market test
or skills shortage lists continue to evolve as criteria and processes are modified. They are
not, in the end, the only ways to safeguard local labour markets.
INTERNATIONAL MIGRATION OUTLOOK 2014 © OECD 2014214

3. MANAGING LABOUR MIGRATION: SMART POLICIES TO SUPPORT ECONOMIC GROWTH
Today’s policy tools are better able to respond to the needs of multiple actors, but the
question of which actors should have priority is one which can be decided only in national
contexts. For example, employers are often the principal beneficiaries of labour migration.
But their key role as gatekeepers of the labour market must be balanced against their
compliance obligations. Here, new arrangements at industry or individual employer level,
such as quotas or fast-track channels, have been matched with new forms of oversight.
Other tools such as matching services or red carpet treatment for migrant workers also
serve employers, although what employers must offer in exchange is another question.
Further, good policy is not just about clear goals and appropriate tools. It also needs to
be implemented properly. Rationalisation procedures and customer-focused delivery can
achieve better policy outcomes. In this regard, smart new technology, adequately trained
staff, and well signposted information makes the whole migration process work better for
key actors.
Finally, feedback mechanisms are one government infrastructure investment that can pay
off. Incorporating evaluation and monitoring into a feedback loop in the policy development
cycle enables countries to manage policy settings dynamically and to step away from the
policies that do not work. Whether evaluation, research, and monitoring are in-house,
external, or collaborative, it is critical that they should inform and provide accountability.
In the end, labour migration policy cannot stand still. It needs to evolve and factor in
evidence of what works and what does not. And, as economic conditions and labour
market contexts undergo changes, policy makers need to be able to explain those changes
to public opinion. That task is greatly facilitated when there are clear goals, appropriate
tools and safeguards, dynamic management, and sound infrastructure. If they are in place,
OECD countries stand to gain more from the labour migrants whom they choose to admit
in the future.
Notes
1. This chapter was prepared by Jonathan Chaloff (OECD) and Sankar Ramasamy (OECD).
2. These concepts are explained in depth in (OECD, 2009) – see Box II.1, pp. 95-96.
3. There is free movement of citizens between Australia and New Zealand under the Trans-TasmanTravel Agreement but the share of employment may be smaller relative to other motives.
4. While formal qualifications are a close proxy of skills, the two are not the same, for a number ofreasons (OECD, 2013a). First, qualifications only reflect skills learnt in formal education andcertified training. Second, at each qualification level, student performance varies significantly, asdo fields of study. Evidence from surveys that seek to measure skills has also shown that theperformance of education systems varies greatly across countries. Third, skills learnt on the jobthrough labour market experience are not measured. And finally, some of the skills reflected informal qualifications may deteriorate over time if unused or not kept up-to-date.
5. The issuance of a permanent permit after five years residence is the principle enshrined in the EULong Term Residents Directive (Directive 2003/109/EC) although not all long-term residents holdthis particular permit, even in countries covered by the directive.
6. Countries covered in this module were AUT, BEL, CHE, DEU, ESP, FRA, GBR, GRC, IRL, LUX, NLD,NOR, PRT, SWE. The definition of “labour migrant” was based on self-reporting, rather than actualpermit category.
7. The 2013 draft legislation which passed the US Senate (S. 744), at 1 200 pages long, included a shortstatement of the goals of “maintain and secure … borders, and to keep our country safe andprosperous… to harness the power of [immigrant] tradition in a balanced way that secures a moreprosperous future for America”.
INTERNATIONAL MIGRATION OUTLOOK 2014 © OECD 2014 215
3. MANAGING LABOUR MIGRATION: SMART POLICIES TO SUPPORT ECONOMIC GROWTH
8. Some examples include the Commonwealth Shared Scholarship Scheme of the United KingdomDepartment for International Development (DfID), which requires students to promise to returnhome, and the Development Scholarships in New Zealand, whose recipients promise in writing toreturn home.
9. See the Scanlon Foundation Mapping Social Cohesion Survey.
10. This is what Boswell (2013) describes as “liberal constraint”, where public opinion imposes arestrictive approach, and liberal economic goals and institutional requirements (such as treaties orcourt rulings) push for less restriction.
11. The guestworker programmes played a prominent role in meeting post-war German labourdemand, mainly in manufacturing. It came to a halt with the oil price shock, and subsequentlymany workers settled permanently in Germany (OECD, 2013b). The economic contribution ofguestworkers and the success of the programme have been somewhat obscured since then.
12. These results are based on a rolling average of Gallup interviews with about 500 000 adults in154 countries between 2010 and 2012. Those countries represent more than 98% of the world’sadult population. Despite the decline in desire to migrate, the net gainers would remain theAmericas, Europe, and the Middle East and North Africa, and the net losers sub-Saharan Africa andAsia. See Gallup’s Potential Net Migration Index (PNMI).
13. The simplest mechanism is to leave this completely unregulated, and allow the inflow of foreignworkers to be determined exclusively by employers’ demand for foreign workers, so that migrationreflects an “unplanned aggregate of firm-wise decisions” (Bhagwati et al., 1984). In practice, this isnever the case. Even where policy tools play a minimal regulatory role, they still providesubstantial state control over labour migration.
14. More recently the New Zealand annual permanent residence point target (45 000) changed to athree-year guideline range (135 000-150 000) to increase flexibility in meeting annual targets in theface of cyclical fluctuations in demand.
15. Estonia phases in distribution of the quota – half every six month.
16. Limits are set to long- and short term employment permits issued for periods exceeding fourmonths. It has also applied quarterly limits during transitional phases of its free circulationagreement with the EU, covering citizens of newly acceding EU countries.
17. The cap is introduced in six-monthly periods, with half reserved for the first semester, and unusedvisas carried over to the second semester.
18. The SWP allocates 10 450 places to horticulture between 1 July 2012 and 30 June 2016 and1 550 places to trial industries of aquaculture, cane, cotton and tourism over the three years to30 June 2015.
19. In Canada, no points are awarded after the age of 46, though workers aged 47 or older will continueto be eligible for the programme.
20. Japan initially used only income earned in Japan, but later extended it to include foreign-earned salary.
21. There are limits to modelling, however, due to the availability of data and ethical and legalconsiderations around potential discriminatory policies if factors such as nationality come to the fore.
22. Since points allocated to a job offer have a higher weighting, and are mandatory criteria, theEoI system favours those with a job in hand, most of whom are already in New Zealand through itstemporary labour migration programmes. A smaller pool of temporary workers translated intofewer applications under the EoI system.
23. OEEC Council Decision 1953-251-Final.
24. “Suitable labour shall be deemed not to be available within the country if no suitable applicant hasbeen found within the period of one month, at the latest, after the employer has both notified thevacancy in question to the employment service or any other service recognised officially ascompetent in the matter, and has also made known his intention to apply for a permit to employ aforeign worker if suitable labour is not forthcoming within the country, always provided that theemployer has taken such other steps as are customary in the case of the kind in question to try andfill the vacancy.” Member states could apply to extend this period for up to two months. Memberstates could also apply exceptions to recruitment or set caps for specific industries and occupations.
25. Even if technology has largely obviated Sunday newspaper listings, this requirement remains.
26. ANZSCO Skill Levels 1 and 2 occupations (except engineers and nurses) and international obligations.
INTERNATIONAL MIGRATION OUTLOOK 2014 © OECD 2014216

3. MANAGING LABOUR MIGRATION: SMART POLICIES TO SUPPORT ECONOMIC GROWTH
27. Some countries do not use codes, although in these cases shortage occupations are still definednarrowly.
28. In practice, few skilled migrants actually do, as most gain the pass-mark with points for a job orjob offer.
29. Part C of the Skilled Occupation List as per the Australian and New Zealand Standard Classificationof Occupations (ANZSCO).
30. Skill Levels 1-3 of the ANZSCO classification system
31. However, issuance of Green Cards in the United States varies in actual time taken because of thebacklog and resulting queue and processing prioritisation.
32. Including the Expression of Interest (EoI) process.
33. The Australian PGWPP allows students who have graduated from a participating Canadianpost-secondary institution to gain valuable Canadian work experience. The PGWPP helps graduatesqualify for permanent residence in Canada through the Canadian Experience Class (CEC).
34. The United Kingdom’s Tier-1 Post Study Work closed in 2012.
35. Very strict definitions used in France from 2010 were loosened in 2012.
36. Not all immigrants naturalise even when eligible. Take-up can vary depending on destination andorigin country policies towards dual citizenship and the economic status of the origin country(OECD, 2010).
37. In both the Danish and the United Kingdom’s reviews, Pakistani nationals, one of the main groupsusing the high-skilled visa, had high shares of employment in unskilled jobs (79% and 80%respectively). Indian nationals were more successful in the United Kingdom (half in skilledemployment), but not in Denmark (71% in unskilled jobs). Chinese nationals, by contrast, had ahigh rate of skilled employment in Denmark (73%).
38. One framework identifies three levels of migration governance and co-operation – multilateral,regional and bilateral or unilateral – and hypothesises that multilateral serves public good,regional helps club good, and bilateral private good. See OECD (2012b) for discussion of migrationas an international public good.
39. The list of NAFTA-recognised occupations can be modified over time based on the parties’ agreement.It currently comprises 63 occupations, including accountants, engineers, management consultants,technicians, physicians, nurses and college teachers. Minimum education requirements andalternative credentials for each occupation are specified. At least a baccalaureate degree is required foralmost all the occupations listed.
40. See DFAT (2013).
41. Australia has made representations to include specific sectors (e.g. as part of the regional workexperience) that will then allow such visitors to extend their stay by 12 months to work in thespecific industry and help address regional shortages.
42. Larsen, G. (2013).
43. See Smith et al. (2012).
44. See New Zealand Department of Labour (2012b).
45. While withholds also represent a form of forced saving, they could merely reduce remittances.
46. For example, the Bracero programme under which more than 4.5 million Mexican workers wererecruited into US agriculture between 1942 and 1964 required that 10% of workers’ wages bewithheld until after they returned to Mexico.
47. This has now been replaced with a fixed pre-paid levy.
48. Immigration agencies can also borrow ratings provided by other agencies. New Zealand uses therating of tertiary education providers by the New Zealand Qualification Authority (NZQA) as aquality marker for extending work rights to certain international students. For instance, aneducation provider in Canterbury must hold a Category One status under the NZQA’s ExternalEvaluation Review (EER) quality assurance system or should be a university.
49. Temporary Work (Skilled) (subclass 457) includes exemptions for ANZSCO Skill Levels 1 and 2(except engineers and nurses) and international obligations.
INTERNATIONAL MIGRATION OUTLOOK 2014 © OECD 2014 217

3. MANAGING LABOUR MIGRATION: SMART POLICIES TO SUPPORT ECONOMIC GROWTH
50. If this streamlined process works well, there is a policy intention to extend the approach acrossthe country.
51. www.immi.gov.au/media/publications/statistics/.
52. Paper-based renewals in Italy are now handled by the post office rather than through policestations, although an in-person appointment is still necessary.
53. See DIAC (2013).
54. EU states are free to determine whether applications for their single permit will be submitteddirectly by third-country nationals or through their employers. EU states are free to determinewhether applications will be submitted from abroad or in country. EU states are allowed to retainseparate visa application procedures for the initial entry of third-country nationals.
55. www.immi.gov.au/asri/.
56. The United Kingdom has experimented information campaigns aimed at over-stayers andundocumented foreigners, through billboards and text messages encouraging departure, althoughthese were judged unsuccessful.
Bibliography
APC and NZPC (2012), Strengthening trans-Tasman economic relations, Final Report, Australian ProductivityCommission and New Zealand Productivity Commission, www.transtasman-review.productivity.govt.nz/sites/default/files/trans-tasman.pdf.
Bhagwati, J.N., K.W. Schatz and K. Wong (1984), “The West German gastarbeiter system of immigration”,European Economic Review, Vol. 26, No. 3, pp. 277-294.
Boswell, C. (2013), “Why do States Liberalise Labour Migration Policies? Germany, Spain and the UK inComparison”, Working Paper, for OECD (unpublished).
Chaloff, J. (2014), “Evidence-based regulation of labour migration in OECD countries: settingquotas, selection criteria, and shortage lists”, in Migration Letters, Vol. 11, No. 1, pp. 11-22,www.metapress.com/content/u193r57512k023u0/fulltext.pdf.
Chaloff, J. and G. Lemaître (2009), “Managing Highly-Skilled Labour Migration: A Comparative Analysisof Migration Policies and Challenges in OECD Countries”, OECD Social, Employment and MigrationWorking Papers, No. 79, OECD Publishing, Paris, http://dx.doi.org/10.1787/225505346577.
DFAT (2013), “December 2013 update on the Pacific Agreement on Closer Economic Relations (PACER)Plus negotiations”, DFAT, Canberra, www.dfat.gov.au/fta/pacer/pacer-update-201312.html.
DIAC (2013), “Annual Report 2012-13: Management Accountability”, DIAC, Canberra, http://immi.gov.au/about/reports/annual/2012-13/pdf/management-accountability.pdf.
EMN (2013), Intra-EU Mobility of third-country nationals, European Commission, Brussels, http://ec.europa.eu/dgs/home-affairs/doc_centre/immigration/docs/studies/emn-synthesis_report_intra_eu_mobility_final_july_2013.pdf.
Freeman, G. (1995), “Modes of immigration politics in liberal democratic states”, International MigrationReview, Vol. 29, pp. 881-902.
ILO (2010), “Labour inspection in Europe: undeclared work, migration, trafficking”, Working Document,No. 7, International Labour Organization, Geneva, www.ilo.org/wcmsp5/groups/public/–ed_dialogue/–lab_admin/documents/publication/wcms_120319.pdf.
IOM (2012), “Improving access to labour market information for migrants and employers”, InternationalOrganisation for Migration, Brussels, www.labourmigration.eu/research/report/23-improving-access-to-labour-market-information-for-migrants-and-employers.
Jauer, J., T. Liebig, J.P. Martin and P. Puhani (2014), “Migration as an Adjustment Mechanism in theCrisis? A Comparison of Europe and the United States”, OECD Social, Employment and MigrationWorking Papers, No. 155, OECD Publishing, Paris, http://dx.doi.org/10.1787/5jzb8p51gvhl-en.
Klett, E. (2013), “A private sector perspective on regulating the migrant labour recruitment industry”,UN General Assembly – 68th Session, New York, www.un.org/esa/population/meetings/HLD2013/documents/presentations/Klett_Statement%20to%20the%20Interactive%20Hearings%20of%20the%20UNHLD%20-%20header.pdf.
INTERNATIONAL MIGRATION OUTLOOK 2014 © OECD 2014218

3. MANAGING LABOUR MIGRATION: SMART POLICIES TO SUPPORT ECONOMIC GROWTH
Kleven, H.K. et al. (2013), “Migration and wage effects of taxing top earners: Evidence from theforeigners’ tax scheme in Denmark”, Working Paper, No. 18885, NBER, Cambridge, www.nber.org/papers/w18885.
Krassoi-Peach, E. (2013), “How Permanent is permanent migration? Identifying the Determinants ofRemigration for Skilled Migrants in New Zealand”, Ministry of Business, Innovation and Employment,Wellington.
Larsen, G. (2013), “Family migration to Australia”, Research Paper 2013-14, Parliamentary Library,Canberra, http://apo.org.au/files/Resource/ParliamentaryLibrary_FamilyMigrationToAustralia_Dec_2013.pdf.
Linder, S.H. and B.G. Peters (1990), “Policy Formulation and the Challenge of Conscious Design”,Evaluation and Program Planning, Vol. 13, pp. 303-11.
Martin, P. and M. Miller (2001), “Employer sanctions: French, German and US experiences”, InternationalMigration Papers, No. 36, International Migration Programme, International Labour Office, Geneva.
MBIE (2013), “Employers’ Role and Influence in Migration: A literature review”, Ministry of Business,Innovation and Employment, Wellington.
McLeod, K. and D. Maré (2013), “The rise of temporary migration in New Zealand and its impact on thelabour market”, Ministry of Business, Innovation and Employment, Wellington.
Migration Advisory Committee (2013), Skilled Shortage Sensible: Full review of the recommended shortageoccupation lists for the United Kingdom and Scotland, a sunset clause and the creative occupations,Migration Advisory Committee, London, www.gov.uk/government/uploads/system/uploads/attachment_data/file/257241/mac-report.pdf.
New Zealand Department of Labour (2012a), “Points of Difference – Does the skilled Migrant Categorypoints system predict wages?”, Labour and Immigration Research Centre, Wellington, New Zealand,www.dol.govt.nz/publications/research/points-of-difference.
New Zealand Department of Labour (2012b), “Labour Market Integration of Recent Migrants inNew Zealand”, Labour and Immigration Research Centre, Wellington, www.dol.govt.nz/publications/research/labour-market-integration/at-a-glance-labour-market-integration.pdf.
New Zealand Department of Labour (2010), “Final Evaluation Report of the Recognised SeasonalEmployer Policy (2007-2009)”, Evalue Research and New Zealand Department of Labour, Wellington,http://dol.govt.nz/publications/research/rse-evaluation-final-report/rse-final-evaluation.pdf.
OECD (2014a), Recruiting Immigrant Workers: New Zealand 2014, OECD Publishing, Paris, http://dx.doi.org/10.1787/9789264215658-en.
OECD (2014b), Jobs for Immigrants (Vol. 4): Labour Market Integration in Italy, OECD Publishing, Paris,http://dx.doi.org/10.1787/9789264214712-en.
OECD (2013a), OECD Skills Outlook 2013: First Results from the Survey of Adult Skills, OECD Publishing,Paris, http://dx.doi.org/10.1787/9789264204256-en.
OECD (2013b), Recruiting Immigrant Workers: Germany 2013, OECD Publishing, Paris, http://dx.doi.org/10.1787/9789264189034-en.
OECD (2013c), International Migration Outlook 2013, OECD Publishing, Paris, http://dx.doi.org/10.1787/migr_outlook-2013-en.
OECD (2013d), Review of Recent Developments and Progress in Labour Market and Social Policy in Israel: SlowProgress Towards a More Inclusive Society, OECD Publishing, Paris, http://dx.doi.org/10.1787/9789264200401-en.
OECD (2012a), Better Skills, Better Jobs, Better Lives: A Strategic Approach to Skills Policies, OECD PublishingParis, http://dx.doi.org/10.1787/9789264177338-en.
OECD (2012b), Free Movement of Workers and Labour Market Adjustment: Recent Experiences from OECD,Countries and the European Union, OECD Publishing, Paris, http://dx.doi.org/10.1787/9789264177185-en.
OECD (2012c), International Migration Outlook 2012, OECD Publishing, Paris, http://dx.doi.org/10.1787/migr_outlook-2012-en.
OECD (2012d), Settling In: OECD Indicators of Immigrant Integration 2012, OECD Publishing, Paris, http://dx.doi.org/10.1787/9789264171534-en.
OECD (2011a), “International Migration to Israel and its Impact”, in OECD, International MigrationOutlook 2011, OECD Publishing, Paris, http://dx.doi.org/10.1787/migr_outlook-2011-9-en.
INTERNATIONAL MIGRATION OUTLOOK 2014 © OECD 2014 219

3. MANAGING LABOUR MIGRATION: SMART POLICIES TO SUPPORT ECONOMIC GROWTH
OECD (2011b), Recruiting Immigrant Workers: Sweden 2011, OECD Publishing, Paris, http://dx.doi.org/10.1787/9789264167216-en.
OECD (2011c), “Taxation and Employment”, OECD Tax Policy Studies, No. 21, OECD Publishing, Paris,http://dx.doi.org/10.1787/9789264120808-en.
OECD (2011d), International Migration Outlook 2011, OECD Publishing, Paris, http://dx.doi.org/10.1787/migr_outlook-2011-en.
OECD (2010), International Migration Outlook 2010, OECD Publishing, Paris, http://dx.doi.org/10.1787/migr_outlook-2010-en.
OECD (2009), International Migration Outlook 2009, OECD Publishing, Paris, http://dx.doi.org/10.1787/migr_outlook-2009-en.
OECD (2008a), International Migration Outlook 2008, OECD Publishing, Paris, http://dx.doi.org/10.1787/migr_outlook-2008-en.
OECD (2008b), Jobs for Immigrants (Vol. 2): Labour Market Integration in Belgium, France, the Netherlands andPortugal, OECD Publishing, Paris, http://dx.doi.org/10.1787/9789264055605-en.
OECD (2008c), “Return Migration: A New Perspective”, in OECD, International Migration Outlook 2008,OECD Publishing, Paris, http://dx.doi.org/10.1787/migr_outlook-2008-7-en.
OECD (2007), Jobs for Immigrants (Vol. 1): Labour Market Integration in Australia, Denmark, Germany andSweden, OECD Publishing, Paris, http://dx.doi.org/10.1787/9789264033603-en.
Ramboll (2010), “Undersøgelse af Greencard-Ordningen”, Report for the Integration Ministry, Ramboll,Copenhagen.
Ruhs, M. (2005), “Managing the Immigration and Employment of Non-EU nationals in Ireland”, ThePolicy Institute, Dublin.
Smith, D., E. Kovac and M. Woods (2012), “The Continuous Survey of Australia’s Migrants, Cohorts 1to 5 Report 2009-11”, Department of Immigrant and Citizenship, Canberra, www.immi.gov.au/media/publications/research/_pdf/continuous-survey-aus-migrants.pdf.
Tan, Y. and L.H. Lester (2012), Labour Market and Economic Impacts of International Working HolidayTemporary Migrants to Australia, http://onlinelibrary.wiley.com/doi/10.1002/psp.674/pdf.
UKBA (2012), The UK Border Agency’s response to the Independent Chief Inspector’s Report on Tier 4 of the UKBorder Agency’s Points Based System (Students), Home Office – UK Border Agency, www.gov.uk/government/uploads/system/uploads/attachment_data/file/257221/pbs-students.pdf.
UKBA (2010), Points Based System Tier 1: An Operational Assessment, International Group, Home Office – UKBorder Agency, October 2010, www.gov.uk/government/uploads/system/uploads/attachment_data/file/115913/occ91.pdf.
USCIS (2014), “E-Verify: 2013 Customer Satisfaction Survey. Final Report”, USCIS, Washington, DC,www.uscis.gov/sites/default/files/USCIS/Verification/E-Verify/E-Verify_Native_Documents/USCIS_E-Verify_Report_2013.pdf.
van Selm, J. (2005), “Where migration policy is made: starting to expose the labyrinth of nationalinstitutional settings for migration policy making and implementation”, Global Commission onInternational Migration, Geneva.
INTERNATIONAL MIGRATION OUTLOOK 2014 © OECD 2014220

3. MANAGING LABOUR MIGRATION: SMART POLICIES TO SUPPORT ECONOMIC GROWTH
edrdoesourial
a limit
quotas.
ANNEX 3.A1
Labour migration policy tables
Table 3.A1.1. Numerical limits
Numerical limit PurposeHow much of totalmigration doesthe quota cover
Quota – most recent How determined
Australia Targets Permanent – ensurestability of working agepopulation.
Almost all permanent. 240 000-265 000 perannum
Annual planning of levels.
Cap + quota Caps for seasonalprogrammes withquotas for industries.
Small percentageof temporary flows.
12 000 over 4 years(2012-16).
Bilateral agreements/MoU.
Austria Ceiling/cap Temporary workers– limit percentageof labour supply.
Most non-EU labourpermits issued.
The total number of work permits is capp(Federal State quotas) so that the numbeof employed and unemployed foreignersnot exceed 8% of the total dependent labsupply (291 000 for 2010). In some speccases, a work permit can be grantedby the governor beyond this quota up toof 9% of the labour supply.
Canada Targets + sub-caps Permanent – severalfactors includingabsorptive capacity.
Almost all permanent. 240 000-265 000 perannum.
Annual planning is an elaborate processthat includes public consultation plusprojections, etc.
Sub-caps foroccupations.
Small share. 500 per occupation(now ended).
Quotas Quotas for InternationalExperience Canada(IEC), Canada’s youthmobility programme.
About 30% oftemporary foreignentries annually.
Global cap for 2014is 68 500, Quotasfor all bilateral partnercountriesexcept Australia(e.g. France 14 000,Ireland 10 700,Japan 6 500, theUnited Kingdom 5 350).
Annual planning for global cap; annualnegotiation for individual partner country
Chile Limit per employer Almost all labourmigration.
Estonia Quotas Limit percentageof population.
Only non-EU labourmigration.
About 1 000. After consultation with relevant bodies,a government regulation is issuedand the minister may set quotas.
Germany Quotas For contracted workers. Non-EU only. 19 400 contractedworkers (2011).
Bilateral agreements.
INTERNATIONAL MIGRATION OUTLOOK 2014 © OECD 2014 221

3. MANAGING LABOUR MIGRATION: SMART POLICIES TO SUPPORT ECONOMIC GROWTH
esr
l
nclude
sector
serned –
uedverageported
r
nistries
ral
tasmittee.
tasmittee.
abinet.
gencyrigin
r makes
cultureabour
Greece Numbers identifiedas per anticipatedneed (10% increasepossibleas a contingencymeasure).
The volumesof admission is similarto an anticipatedshortage listfor the followingtwo years.
Non-EU only. Maximum of 10 456 jobposts in 2014 (729 fordependentemployment,8 074 for seasonalemploymentand 1 653 in the fisherysector)(pre-2014 procedure).
Joint Ministerial Decision (JMD) – Volumof Admission drawn up every second yeaby region and speciality. The numberof residence permits for the purposeof employment established through aconsultation procedure involving nationaand local social partners, the PES andgovernment bodies. Factors considered ithe national economic interest; supplyfrom the legal available labour force andunemployment rates.
Hungary Cap Safeguard againstexcess demand.
Only non-EU labourmigration. About40% of non-EUapplications in 2012,34% in 2013.
85 000 (2012). The minister responsible for labour affair– in consensus with other ministers concsets the highest number of work permits(including the number of TCNs employedon the basis of an EU Blue Card) to be issto TCNs. This quota may not exceed the amonthly sum of the requested workers reduring the previous year. Publishedin the Hungarian Official Gazette each yeabefore 1 February.
Israel Stock capsby industry
Low skilled workers,allocated to industries.
100%. All temporaryforeign workers in theseindustries are subjectto caps.
27 000 (agriculture),6 000 (construction).
Lobbying by interest groups, relevant midecide.
Italy Cap + quotas Overall cap plus quotasallocated via bilateralagreements.
Only non-EU labourmigration. Capsand quotas applyto all non-EU labourmigration.
15 000(seasonal 2014); mostrecent cap for contractwork of about 103 580(2010), quotasfor nationalitiesand for care workers.
Nationalities allocated according to bilateagreements, sectors by negotiation.
Japan Quota Bilateral workingholiday agreements.
Negligible. E.g. 250 for Hong Kong,China (2014).
Korea Stock cap for ethnicKoreans on H-2 visas
All H-2s arecap-subject.
303 000 for workingvisit stock quota.
Overall cap set by Cabinet, employer quoallocated by Foreign Workers Policy Com
Annual entry capand quotaper industry
Cap for admittingtemporary foreignworkers annuallyby industry, plus aset-aside for returningworkers.
All E-9s are cap-subject. 62 000 for E-9non-professional(10 000 returns)in 2013.
Overall cap set by Cabinet, employer quoallocated by Foreign Workers Policy Com
New Zealand Planning range 3-year target rangeto accommodate annualfluctuations in orderto maintain working agepopulation.
Plan applies to almostall permanentadmissions.
135 000-150 000. Residence programme numbers set by c
Caps + (soft quota),quotas
Seasonal workers(preference for somesource states),WHS agreements.
All seasonal workersare subject. HoweverWHMs are largelyuncapped.
RSE 8 000 per annum;WHS 49 000 (2013).
Bilateral agreements for WHS, and inter-aagreements with Pacific seasonal work ocountries.
Norway Quota + exemption Quota for seasonalworkers and highlyskilled workers– for latter LMT appliesbeyond the quota.
Most non-EU labourmigrants, excludingthose similar to ICTs.
5 000 (skilled)and 2 000 (seasonal)in 2013.
For skilled workers, the Ministry of Labouproposal to Ministry of Finance, Ministryof Industry. For seasonal work in the agriand forestry industry the Directorate of Land Welfare stipulates a quota.
Table 3.A1.1. Numerical limits (cont.)
Numerical limit PurposeHow much of totalmigration doesthe quota cover
Quota – most recent How determined
INTERNATIONAL MIGRATION OUTLOOK 2014 © OECD 2014222

3. MANAGING LABOUR MIGRATION: SMART POLICIES TO SUPPORT ECONOMIC GROWTH
asedheafterocialr
inisterccount
market.ctivelyannual
ations
blished
lected
tion
e needsbour
Portugal Cap Low-skilled workers. All non-EU labourmigrants.
An overall quota is fixed for third-countrynational workers in Portugal every year, bon the annual estimates of the needs of tlabour market established by the Cabinetreports from the Permanent Council for SCo-ordination and the Ministry for Labouand Social Solidarity.
Slovenia Total cap and sectorquotas
Only non EU labourmigration.
No decree since 2010. Proposed by the Mfor Labour and set annually. It takes into afluctuations and conditions of the labourThe quota may never exceed 5% of the aworking population in the country, on anbasis.
Spain Quotasfor anonymousrecruitment(seasonaland contract)
Collective managementof contracts in origincountries.
Since 2008, very smallshare of inflows.
A ministerial decree with the list of occupoffered in the Collective Managementof Contracts in the Country of Origin is puyearly. It considers the informationon the national employment situation colby the Autonomic Employment Services.The final proposal is discussed within theTripartite Labour Commission of Immigraand by the Inter-ministerial Commissionfor Aliens.
Switzerland Cap (in additionto LMT)
Regulating accessto the labour market.
(2013) 3 500 B permitsfor longer than1 year + 500 (EU/EFTAservice providers)5 000 L permits(4 months to 1 year)+ 3 000 (EU/EFTAservice providers).
Quotas are determined annuallyby the government, taking into account thof the economy and the situation of the lamarket. It shall first consult the cantonsand the social partners.
Turkey Limit per employer– percentage of localworkers
20% limit per firm– most of the24 200 work permitsissued in 2011.
By regulation. Exemptions are in place.
United Kingdom Policy target To limit overall netmigration.
Below 100 000. MAC advises, Cabinet sets limits.
Annual programmelimits
Quota for Tier 2 skilledworkers.
Small share of Tier 2,since most arecap-exempt ICTsand others
20 700 (April 2013-March 2014).
Quota for short-termwork schemes (phasedout in 2013), workingholiday schemes.
Working holidayschemes and specificindustries subjectto cap.
WHS 54 500 (2013),industry-specificquotas3 500 (2007).
United States Cap to temporaryspecialty workers.
H-1B Cap. All H-1B. 33 000 per 6 months(66 000 annually).
Set in legislation (1990 and subsequent).
Cap for short-termnon-agriculturalworkers
H-2B Cap. All H-2B. 65 000 plus 20 000with a Master’s Degreefrom a US University.
Annual limit topermanent entriesfor employment(EB Green Cards)
EB-1, EB-2, E-B3 Caps.Country limit (7%)to prevent over-representation. Includesaccompanying family.
100% of permanentlabour migration, about14% of all permanentmigration.
140 000 annually,with cascading priority.
Table 3.A1.1. Numerical limits (cont.)
Numerical limit PurposeHow much of totalmigration doesthe quota cover
Quota – most recent How determined
INTERNATIONAL MIGRATION OUTLOOK 2014 © OECD 2014 223

3. MANAGING LABOUR MIGRATION: SMART POLICIES TO SUPPORT ECONOMIC GROWTH
cepturses)l
gperiod
tisingr somehorker.
ossibleinment
dent
ed
ationlente Card.
tions.
Table 3.A1.2. Labour market test processes in OECD countries
Agency responsible LMT ProcessDuration of advertisingrequirements
Exemptions
AustraliaSeasonal WorkerProgram (416)
Departmentof Employment.
Department of Immigration and Border Protection (DIBP)confirms seasonal demand in negotiation with industryand has fixed a quota for 4 years to 2016.
Temporary Work (Skilled)(subclass 457)
Departmentof Immigrationand Border Protection(DIBP).
Sponsors for subclass 457 provide information aboutall advertising/other recruitment efforts takenin the preceding twelve months. They include locationsand dates of recruitment activities; geographic targetaudience; outcome of the recruitment such as the numberof applications received, number of applicants hired,and the general reasons why other candidates were notselected.
No fixed period. ANZSCO SkillLevels 1 and 2occupations (exengineers and nand internationaobligations.
AustriaSeasonal WorkerProgrammeRWR card
PES – Servicefür Unternehmen(Servicefor Companies).
The labour market test (Arbeitsmarktprüfung) must showthat there is no Austrian or eligible non-Austrian workerregistered with the Austrian Migration Services available forthe job.
No fixed period, butin practice 2-3 weeks.
CanadaTemporary Foreign WorkerProgram – includes:Seasonal AgriculturalWorker Program;Live-in Caregivers; and,Lower-Skilled WorkerStreams.
Employment and SocialDevelopment Canada(ESDC)/Service Canada.
Labour Market Opinion (LMO) is mandatory.It encompasses an assessment of expected impacton the labour market – a review of wages, occupationand working conditions, and advertising efforts. In mostcases the employer must seek Canadians/permanentresidents through the Canada Job Bank before receivinga LMO. The advertisement must be posted and accessibleto the general public for the duration of LMO processing.In addition, 2 types of advertising (e.g. local newspaper,magazines, monster.ca) must be used for 4 weeks.
Minimum 4 weeks. Variationsin the advertisinand a number ofalternative advermethods exist fooccupations sucas agriculture w
Federal Skilled WorkerProgramme
For migrants arriving through the arranged employmentstream, the sponsoring employer requires a LMO. The joboffer must be permanent, non-seasonal, and full-time– National Occupational Classification, Type 0 or Aposition – and have wages and working conditionscomparable to those offered to Canadians workingin the same occupation.
Advertising/LMOexemptions are pfor some entertaand film-relatedoccupations,international studegree courses,or international-agreement-relatoccupations,e.g. NAFTA.
Czech RepublicGreen Card – Type CGreen Card – A and B,EU Blue Card
Ministry of Labourand Social Affairs,Ministry of Industryand Trade.
The Ministry of Labour and Social Affairs maintains aregister of vacancies lodged by employers. The Ministryof Industry and Trade declares it open to migrants when itis not filled by a citizen of the Czech Republic or the EUwithin 30 days.
30 days.
FinlandResidence permit
Labour Office. Labour Office collects information on working contractdetails, (wages, collective agreement, working hours, etc.).The labour office makes a partial decision whereit determines the professional field or fields, salary level,relevant collective agreement, type of the permit (temporaryor permanent) and the validity of the permit (normallyfirst permit is for one year).
14-28 days.
FranceSeasonal WorkerProgrammeTemporary Work Permitfor Salariés(Salaried Worker)
PES. Publication with the public employment service or throughprivate channels.Employer must submit application to the Departmentof Labour, Employment and Vocational Training Servicefor a discretionary review of professional qualifications,contract wage and conditions, technological andcommercial added value, and to determine whether the jobcould be performed by a resident.
Shortage OccupList, skills and tacriteria or EU Blu
GermanyResidence permitfor temporary employment
Local PES/ZAV. PES checks conditions of offer and then decides to lista vacancy.
7-14 days. Shortage occupa
INTERNATIONAL MIGRATION OUTLOOK 2014 © OECD 2014224

3. MANAGING LABOUR MIGRATION: SMART POLICIES TO SUPPORT ECONOMIC GROWTH
stem isicipatedid
t,
steds.
receiveof
000.
ist,oyer,ciple
lylled.iedral/liday
GreeceResidence permitfor purpose of work
Service for Foreignersand Migrationof the DecentralisedAdministrationapproves employerapplication “inviting”specific third-countrynational (TCN) workers.
There is no individual labour market test. Employers have to“invite” an employee from the pool of occupations identifiedthrough a centrally managed Volumes of Admissionprocess and subject to satisfying the criteria set forthat occupation.
.. The Volumesof Admission sysimilar to an antshortage list valfor 2 years.
HungaryWork permit/seasonal workpermitEU Blue card
PES. Employer must advertise the job through the employmentcentre of the district where the business is located, by fillingin and submitting a data sheet and a “demand for labour”reporting sheet.
15 days.
IrelandWork Permit
Department of SocialProtection.Employment Services.
Listing in the FAS/EURES system for 2 weeks andadvertisements in national press for 3 days – advertisementin local newspaper is optional, showing that the positionscould not be filled from within the EEA/EU.
3-14 days. Highly SkilledOccupations LisIneligibles List.
ItalySeasonal ProgrammeWork Permit(open and fix termcontracts)
PES. Listing with public employment service for 20 days– positive opinion of provincial labour and police officerequired. In the absence of response, approval is automatic.If the PES proposes local candidates, employers may rejectthem by confirming their intention to recruit from abroad.
20 days.
KoreaNon-professionalemployment (E-9)
PES. In principle at least 14 days of recruitment efforts (throughpublic employment service); or 7 days in exceptional cases(a. participation in Job Festival; b. job placement throughemployment service centres or regional governments;c. when the employer conducts a job interview after postinga vacancy and d. when employers advertise vacanciesin newspapers, magazines or broadcast media for at least3 days).
In principle at least14 days; 7 daysin exceptional cases.
LuxembourgTravailleur salarié(Salaried Worker)Travailleur salariétransféré/détaché(Intra-company Transfereeor Posted Salaried Worker)
PES (ADEM). Job must be submitted to the public employment service(ADEM). If no candidates are registered, the applicationmay be approved after a 3-week period.
18 days. Researchers, poworkers, athlete
NetherlandsLabour Migrant Work Permit
PES (WERKbedrijf– UWV).
The employer must notify the Dutch employment agencyof vacancy and conduct recruitment to determine whetherthere are qualified and available workers in the EEA labourmarket. Employers must advertise the vacant position for atleast five weeks through standard recruitment channels,such as Dutch newspapers, professional or trade journals,online job boards, or placement agencies.
5 weeks. Intra-companytransferees whoan annual salaryat least EUR 50
New ZealandRecognised SeasonalEmployerEssential SkillsEssential Skills in Demand
ImmigrationNew Zealand.
Employers must make “a genuine attempt” (suchas advertising and the use of a recruiting company)to recruit suitable resident workers. The application isrejected if suitable workers are available, but not “preparedto do the work on the terms and conditions proposedby the employer”, or if the employer could “readily train”residents. Involves seeking advice from industryrepresentatives and the appropriate New Zealandgovernment agencies to determine current skill shortages.Generally for less skilled jobs, a Labour Market Check(LMC) is performed as part of the LMT.
No fixed period– 10 days in practice.
Skills Shortage LAccredited EmplApproval in PrinEmployers.
NorwaySeasonal Work ProgrammeSkilled Worker(ARBDTAKFAGORD)
PES (NAV). LMA (labour market assessment) applies when there isno set quota, or when the quota (for the agricultureand forestry industry and for skilled workers) has beenfilled. The Labour and Welfare Service (NAV) carry outthe LMT (guidelines issued by the Directorate of Labourand Welfare).
.. LMA required onwhen quota is fiSo far, only applfor non-agricultuforestry seasonaworkers and holreplacements.
Table 3.A1.2. Labour market test processes in OECD countries (cont.)
Agency responsible LMT ProcessDuration of advertisingrequirements
Exemptions
INTERNATIONAL MIGRATION OUTLOOK 2014 © OECD 2014 225

3. MANAGING LABOUR MIGRATION: SMART POLICIES TO SUPPORT ECONOMIC GROWTH
hichnd;
stic-giver
d.
lerical
hortage
ers, etc.
erned
origin
bs.
-level
e,eople.
PolandWork Permit
PES. Regional employment service authorises an employercompany once it has advertised with the public employmentservices and local media.Duration maximum 14 days for decision by Starosta(local labour office) if local unemployed or job seekers areavailable. Otherwise, 7 days.
14 days. Work in the listof occupations ware in high demawork as a domeworker or a carefrom a countrybordering Polan
PortugalResidence Visa/WorkPermit/Seasonal Temporarystay work
PES. Regional employment service issues authorisation once anemployer has advertised vacancy with public employmentservices and local media.
30 days.
Slovak Republic Office of Labour, SocialAffairs and the Family.
Advertised by local public employment office, website,information board, EURES portal.
30 days. Posted workers,workers definedby WTO rules, cworkers, etc.
SloveniaWork Permit
PES. Employers must register the job vacancy before submittingan application for the issuance of a work permit. The PEShas 8 working days to notify the employer of appropriateregistered unemployed. The PES may considerif the employment of a foreign national adversely affectsthe Slovenian labour market.
30 days. Provisions for soccupation list,scientists, teach
SpainSeasonal WorkEU Blue Card
PES. Job must be listed with the public employment servicesfor 25 days, and employers must interview candidates sentby the public employment service, although they may rejectthem.
25 days. Shortage listoccupations govby collectivemanagementof contractsagreements withthe countries ofor the Catalogueof Hard-to Fill Jo
SwedenWork Permit
PES(Arbetsformedlingen).
Vacancies should be advertised for 10 days with the publicemployment services (automatic listing with EURES).
10 days.
SwitzerlandResidence Permit
PES. No time limit specified for listing with Cantonal PublicEmployment Service, EURES or other channels, otherthan taking steps within a “reasonable time”. Federal Officefor Migration must also approve the request.
Intra-companytransferees, highexecutives andinvestors, servicau pairs, sportsp
TurkeyWork Permit
PES. The public employment service has 4 weeks to finda suitable candidate in Turkey before approving the workpermit application.
28 days.
United KingdomSector Based Scheme (SBS)Tier 2 Skilled worker
PES. Resident Labour Market Test (RLMT) – employers mustadvertise for EEA workers, submit proof of advertisementwithin past 6 months, supply information on applicantsand selection process, and justify not hiring applicants.Since 2009 employers are required to advertise throughJobcentre Plus and at least one other medium. Employersare free to select media outlet but must follow specificrequirements for the medium chosen.
28 days – eitherconsecutively orin separate periodsof no less than 7 days.
Intra-companytransfers.
United StatesH2-A, H2-B
Department of Labor. Employers should pre-file vacancies by filing a job orderno more than 120 calendar days prior to their date of needwith the State Workforce Agency (SWA). The job ordermust be open for a minimum of 10 days. Employers shouldadvertise positions in two print media outlets, one of whichmust be a Sunday newspaper. The job order and the printadvertisement must contain specific informationthat includes working hours and days, expected startand end dates of employment, etc.
10 days.
Table 3.A1.2. Labour market test processes in OECD countries (cont.)
Agency responsible LMT ProcessDuration of advertisingrequirements
Exemptions
INTERNATIONAL MIGRATION OUTLOOK 2014 © OECD 2014226

3. MANAGING LABOUR MIGRATION: SMART POLICIES TO SUPPORT ECONOMIC GROWTH
ncy
.
.
Table 3.A1.3. Shortage lists: Characteristics
Country (visa category) Name Role Agency Process/criteria ClassificationNumberof occupations
Revisiofrequen
AustraliaPoints Tested SkilledMigrationNominated SkilledMigrationTemporary Work(Skilled) (subclass 457)
SkilledOccupationList (SOL) andConsolidatedSponsoredOccupation list(CSOL).
It is not a shortage listand determinesoccupationseligible for the medium-and long term needsof the Australian economyto be met by training,education and migration.Applicants for residencemust nominatean occupation thoughno points are awarded.Applicants must nominatean occupation from the SOLor CSOL if nominatedby a state or territorygovernment, subclass 457,etc. All state and regionallists were brought underthe consolidated listin 2012.
Policyoversight ofSOL by DIBPwith advicefrom AWPA(AustralianWorkforceand Productivity Agency).
Labour market, educationand training, economic,demographic and migrationdata, and advicefrom a number ofdepartments, annualconsultationon submissions by industry,unions, trade, etc.
AustraliaNew ZealandStandardClassificationofOccupations(ANZSCO)skilllevels 1-3at the 6-digitlevel.
2013 SOLhas 188occupationsand CSOL hasover 658.
Annual
AustriaRed White Red Card
Fachkräftever-ordnung.
Nominating any shortageoccupations is one optionfor meeting the minimumpoints requirementof 50/75 for the RWR Card.
Ministryof Labour.
The social partners draftthe list of shortageoccupations basedon the unemployedto vacancy ratio andobjectifiable shortageindicators (e.g. increasedtraining activitiesof employers; aboveaverage wage developmentin respective sector).The list must then beapproved by the FederalMinister of Labourin consultation withthe Federal Ministerof Science, Researchand Economics.
AMS-Classification– 4 digit.
RWR cardhas 18occupations.
Annual
BelgiumB-Permit
Bottleneck list. To grant work permitsflexibly to EU citizensin transitional periods(not for third countrynationals).
PES. Each of the 3 regional publicemployment services drawup the list for labourmigration purposesfrom their general listsof “bottleneck” occupations(e.g. secretary, salesperson), regardless ofthe sectors (e.g. healthcaresector) to whichthey belong.
ISCOcategories 6to 8.
CanadaFederal Skilled WorkerProgramme, FederalSkilled Trades Workerprogramme
EligibleOccupationsList.
The EOL reflectsthe short-term andlonger-term needsof the economy.Nominatingan occupation on the listis one option for skilledmigration. Also, points areawarded for experiencein that occupation.
CIC –ImmigrationandCitizenship.
Consultation with severalactors, including provincesand territories, employersand other federaldepartments,e.g. Employment and SocialDevelopment Canada.
CanadianNationalOccupationClassificationList (NOC);levels O, A, B.
EOL – 24 Annual
INTERNATIONAL MIGRATION OUTLOOK 2014 © OECD 2014 227

3. MANAGING LABOUR MIGRATION: SMART POLICIES TO SUPPORT ECONOMIC GROWTH
yeararyly.
.
hs.
ncy
DenmarkPositive List WorkPermit
Positive List. The Positive Listof occupations –generallymasters level – inhealthcare, science,management, architectureand engineering, law, etc.Foreign nationals hiredwithin professional fieldswith a lack of well-qualifiedmanpower on the list haveeasier access to a residenceand work permit.
DanishAgencyfor LabourRetention andInternationalRecruitment.
Based on surveys showingsectors with a structurallack of workforce.
The minimumeducationallevel requiredfor a positionon the PositiveList isa professionalbachelor’sdegree.
Currently 31occupations.
Twice a– Januand Ju
FinlandResidence Permit for anOccupational BarometerEmployed Person
OccupationalBarometer.
The Occupational Barometerpresents a viewof the development ofthe labour market situationin the coming half year.It has multiple useswhich include planningfor immigration.
TE Offices(Employmentand EconomicDevelopmentOffices).
Shows a forecastof shortage and surplusoccupationsin the 15 regions.
Annual
FranceTemporary Work Permitfor Salariés(Salaried Workers)
ShortageOccupations.
Shortage occupations areregistered in a governmentlist or negotiated throughbilateral agreements.Workers filling shortageOccupations may beexempted from LMT.
Ministriesof Justiceand theInterior.
Co-ordination betweendifferent ministriesand trade unions ornegotiated through bilateralagreements. The methodrelies on indicators of laboursupply and demand.Includes data fromthe French EmploymentAgency (Pôle Emploi),taking into accountthreshold and regionalcriteria.
Currently30occupationsforthird-countrynationalsand severalwhich arespecificto bilateralarrangements.
GermanyTemporarily RestrictedResidence Permitfor the purposeof employment,EU Blue Card
Positive list.EU Blue Cardshortageoccupations.
To provide exemptionsfrom the Labour markettest.
Ministryof Labour.
Criteria such as: averagevacancy duration at least40% above the averageof all occupations; anincrease in average vacancyduration of at least 10 daysover the preceding referenceperiod; and ratio of fewerthan 3 unemployed workersto vacanciesthan 3:1 seeking a jobin that occupationper vacancy at a nationallevel.Criteria should also takeinto considerationqualitative factors.
ISCOclassificationsystem(for the BlueCard: 21, 221,25).
The Positivelist has18 categories.The EU BlueCard shortageoccupationcategories arefixed.There are 58.
Every6 mont
Table 3.A1.3. Shortage lists: Characteristics (cont.)
Country (visa category) Name Role Agency Process/criteria ClassificationNumberof occupations
Revisiofrequen
INTERNATIONAL MIGRATION OUTLOOK 2014 © OECD 2014228

3. MANAGING LABOUR MIGRATION: SMART POLICIES TO SUPPORT ECONOMIC GROWTH
d everyyeararter).
al.
SSLL ared
lySLuarter.
dly.
ncy
GreeceResidence Permitfor Employment
Volumesof Admission.
The Volumes of Admissionsystem works like ananticipated shortage listof occupations (by regionand speciality)for the following 2 years.
JointMinisterialDecision(JMD).
From 2014 the JMDestablishes the numberof Volumes of Admissionoccupations and criteriathrough consultationinvolving the social partnersand actors with goodknowledge of the locallabour market.Labour force needs arealso determined on thebasis of the interests ofnational economy;the available (legal) labourforce supply; andthe unemployment ratesper economic sector.
Revisesecond(last qu
IrelandGreen Card EmploymentPermit
High SkillsOccupationsList.IneligiblesList.
The High Skills OccupationsList is exemptedfrom labour market test.Work permits cannot beissued for occupationsin “Ineligible Categoriesof Employmentfor Employment Permits”.
Remuneration betweenEUR 30 000 and 59 999for any job on the HighSkills Occupations List.The list is identified in theNational Skills Bulletinreleased by Forfas (NationalBoard for Jobs, Enterpriseand Innovation) andfrom data in the VacancyOverview Annual Report.
Broadoccupationgroupswith severaljob titlesunder each.
Broadoccupationalgroups (7).
Biannu
New ZealandSkilled MigrantCategory (SMC)Work to ResidenceTemporary workEssential Skills
Long TermSkillsShortage ListLTSSL,ImmediateSkill ShortageList (ISSL),CanterburySkill ShortageList (CSSL).
Applicants in occupationsin shortage includedin LTSSL will be grantedbonus points for SMC orobtain work-to-residencevisa. For ISSL and CSSLthe applicants are exemptedfrom the LMT.In the 2012 review a sunsetclause was added for a fewoccupations.
ImmigrationNew Zealand.
Call for proposalsand occupationnominations fromthe industry. The Ministrythen assesses and selectsthe occupations to bereviewed and producesa Preliminary IndicatorEvidence Report (PIER).There is a final call forsubmissions of occupationsselected for review followedby wider sectorconsultations onoccupations.
AustraliaNew ZealandStandardClassificationofOccupations(ANZSCO),levels 1-3at the 6-digitlevel.
LTSSL 102,ISSL 94,CSSL 37.
The LTand ISSrevieweannualand CSevery q
PortugalResidence visa/Temporary Stay permit
Exclusion List(not shortagelist) butseldom used.
SpainWork Permit
Catalogue ofHard-to-fillPositionsfor theGeneralRegime.
Exempts employersfrom a labour market test.
ServicioPúblicode EmpleoEstatal.
PES authorities use regionalunemployment and jobvacancy data and consultthe Tripartite LabourCommissionon Immigration, whichincludes social partners,to draw up a list of potentialshortage occupationsat the regional level.
Regionallists varyin number.In Q3/2014,for example,20occupationsfor Asturiasand Madrid,2 in Navarra,and nonein manyothers.
Revisequarter
Table 3.A1.3. Shortage lists: Characteristics (cont.)
Country (visa category) Name Role Agency Process/criteria ClassificationNumberof occupations
Revisiofrequen
INTERNATIONAL MIGRATION OUTLOOK 2014 © OECD 2014 229

3. MANAGING LABOUR MIGRATION: SMART POLICIES TO SUPPORT ECONOMIC GROWTH
review
nthsl-scaleeveryars.
ended.
ncy
United KingdomTier 2 Skilled worker
Skill ShortageOccupationList (SOL).
Exemption for Tier 2 visasfrom Resident LabourMarket Test, given priorityin the annual limit,exempted from earningsthreshold at settlement.
MigrationAdvisoryCommittee(MAC).
3-stage process basedon wage, vacancyand employment data,and on stakeholderconsultation.
StandardOccupationalClassification(SOC) 2010.
30 on the SOL,and 2 forthe ScottishList.
Partialeverysix moand fulreviewtwo ye
United StatesEmployment BasedImmigrants visa EB-2,EB-3
Schedule AOccupations.
The DOL pre-certifiescertain shortageoccupations which includephysical therapistsand professional nurses(Group I) andcertain categories of peopleof exceptional abilityin the sciences or artsand persons of exceptionalability in the performing arts(Group II).This list provides exemptionfrom the standardrecruitment process or LMT.
Departmentof Labor.
Last amin 2005
Table 3.A1.3. Shortage lists: Characteristics (cont.)
Country (visa category) Name Role Agency Process/criteria ClassificationNumberof occupations
Revisiofrequen
INTERNATIONAL MIGRATION OUTLOOK 2014 © OECD 2014230

3. MANAGING LABOUR MIGRATION: SMART POLICIES TO SUPPORT ECONOMIC GROWTH
familyation
Table 3.A1.4. International students – associated rules and procedures
Hours per week permitted for workJob is linked
to course of studyY/N
Automaticauthorisationof work rights
Y/N
Monitoring of studentby education provider
Y/N
Mandatory reportingto authorities
by education providerY/N
Right tore-unific
Y/N
Australia 40 hours per fortnight (general)– unlimited for post-graduate
and above
N Y Y Y Y
Austria 10 initially, 20 after first year N N Y
Belgium 20 Y N Y Y
Canada 20 N Y (for on-campus,from 2014
for off-campus)
Y Y Y
Chile 0 N
Czech Republic 30 days in a year Y N Y
Denmark 15 (full time in summer) N Y Y
Estonia Not defined – “as long as workingdoes not affect studies”
N Y Y
Finland 25 (full time in summer) N Y Y N Y
France 18.5 N Y Y N Y
Germany 18.5 (120 days per annum) N Y Y
Greece 20 Y Y Y
Hungary 24 Y Y
Ireland 20 N Y N
Israel 0 - - Y Y
Italy 20, annual limit of 1 040 hours - Y Y N Y
Japan 28 N Y Y Y
Korea 20 N Y Y Y
Luxembourg 10 (open to non post-grad/doctoralstudents after 2 semesters)
Y Y
Mexico 20 Y N Y Y
Netherlands 10 (full time in summer) N N Y
New Zealand 20 (higher courses) N Y Y N (except TrustedPartner Universities
from 2014)
Y
Norway 20 (full-time over holidays) N (authorisedwhen employmentwould not interfere
with study progress)
N N Y
Poland Full time during holidays Y during holiday,require authorisationduring year, subject
to LMT
Portugal Y N Y N Y
Slovak Republic 10 Y (up to 10 hoursweekly)
Slovenia Y N Y
Spain Y N N Y N Y
Sweden Y N Y Y N Y
Switzerland 15 N N Y – University mustattest that work will
not affect study
N Y
Turkey 24 (after first year) N N (requires workpermit)
N
United Kingdom 20 N Y Y Y Y
United States 20 (full time during vacation) N Y (exceptfor off-campus)
Y Y (SEVIS) Y
INTERNATIONAL MIGRATION OUTLOOK 2014 © OECD 2014 231


International Migration Outlook 2014
© OECD 2014
Chapter 4
Country notes: Recent changesin migration movements and policies
The statistical data for Israel are supplied by and under the responsibility of the relevant Israeliauthorities. The use of such data by the OECD is without prejudice to the status of the Golan Heights,East Jerusalem and Israeli settlements in the West Bank under the terms of international law.
233

4. COUNTRY NOTES: RECENT CHANGES IN MIGRATION MOVEMENTS AND POLICIES
AustraliaPermanent migration under Australia’s Migrationand Humanitarian Programmes rose by 7.7%in 2012-13 with 214 000 visas issued. There were190 000 places under the Migration Programme,20 000 under the Humanitarian Programme and anadditional 4 000 places, as recommended by theExpert Panel on Asylum Seekers, under the FamilyStream. The Skill Stream accounted for abouttwo-thirds of the Migration Programme visas issued,with the remainder issued through the Family Streamexcept for a small number (0.4%) granted under theSpecial Eligibility category.
India again led the Migration Programme, with40 100 individuals (21.1% of the total), a 38.0% increaseover the previous year. China (27 300) and theUnited Kingdom (21 700) followed. In addition, 41 200New Zealand citizens entered Australia as permanentsettlers under the Trans-Tasman Travel Arrangement.
Demand for Temporary Work (Ski l led)(subclass 457) visas increased with grants up by 1.0%to 126 400 in 2012-13, although several top countries(South Africa, the United States and the UnitedKingdom) saw fewer recipients. India replaced theUnited Kingdom as the top origin country. Changes tothe programme in July 2013 strengthened skillsassessments, increased English language require-ments and, for the majority of occupations, requiredsponsors to demonstrate that there was a genuineskilled vacancy. The compliance and enforcementframework was also enhanced.
The Working Holiday Maker Programmeincreased by 15.8% in 2012-13 to 258 250 visas granted.Australia’s 28th reciprocal working holiday arran-gement commenced April 2013 with Uruguay. Anagreement was signed with Greece in May 2014.
International Student visa numbers have grownover the last two years, reaching 259 300 in 2012-13, a2.5% increase on the previous year, but still 18.9%below the record in 2008-09. Numbers continued torise in 2013-14. Two changes to the Student visaprogramme were implemented in March andApril 2013. The first was to allow recent higher educa-tion graduates the opportunity to work for up to fouryears in Australia, under the Temporary Graduate(subclass 485) visa. The second was to allow indivi-dual circumstances to be taken into account indeciding whether to withdraw visas from studentswho have breached their visa conditions.
An estimated 62 700 people whose temporaryvisas had expired or been cancelled were livingillegally in Australia in June 2013, a 3.0% increase onthe previous year.
A total of 123 400 people were granted Australiancitizenship in 2012-13. This was an increase of 46.6%from 2011-12 and the highest number since 2006-07.
There was a notable increase in the Humanitar-ian Programme in 2012-13. The number of visasgranted under the offshore resettlement componentof the programme rose by 86.6% on the previous yearto 12 500. Iraq and Afghanistan were the top coun-tries. A further 7 500 visa grants were made under theonshore protection component for those who enteredAustralia either as illegal maritime arrivals (led bynationals of Afghanistan and Iran) or by air on a validvisa then claimed asylum (principally, from Pakistanand Iran). The number of illegal maritime arrivalsreached record highs in 2012-13 – climbing to over20 000 annually – before falling sharply in late 2013.
The visa application process, particularly forthose applying for temporary visas, was simplifiedduring 2013. The number of Temporary Work visaswas reduced from 17 to 8, and the number of Visitorvisas from 11 to 4. A new Temporary Work (Short StayActivity) (subclass 400) visa was introduced to allowshort-term highly specialised non-ongoing work to becarried out in Australia. In 2014, streamlined visa pro-cessing arrangements were extended to studentsenrolled in Bachelor (or higher) degree courses at lowimmigration risk non-university providers. It isintended that this will be extended in 2015 to includeadvanced diploma level courses as well.
A new Seasonal Worker Programme, beginning inJuly 2012, replaced the Pacific Seasonal Worker PilotScheme, with 3 000 visa issues in the first year. Theprogramme builds on the pilot’s economic develop-ment objectives for the Pacific and Timor-Leste, whileassisting Australian employers who cannot sourcelocal labour in selected industries. The number of visaplaces is capped at 12 000 over four years (2012-16),with most visas issued to those working in the horti-culture industry.
In December 2012, the Government announceda pilot community sponsorship programme of500 places under the Humanitarian Programme. Thisaims to provide a more supportive settlement envi-ronment for new humanitarian entrants, enabling asmoother transition from resettlement, through toeducation, work experience and employment.
For further information
www.immi.gov.au.
INTERNATIONAL MIGRATION OUTLOOK 2014 © OECD 2014234

4. COUNTRY NOTES: RECENT CHANGES IN MIGRATION MOVEMENTS AND POLICIES
Recent trends in migrants’ flows and stocksAUSTRALIA
Migration flows (foreigners)2000 2005 2011 2012
Average Level (’000)National definition 2002-06 2007-11 2012
Per 1 000 inhabitantsInflows 5.6 8.1 9.4 10.7 7.3 9.6 242.4Outflows 0.5 1.4 1.4 .. .. 1.4 ..Migration inflows (foreigners) by type Thousands % distribution
Inflows of top 10 nationalitiesas a % of total inflows of foreigners
Permit based statistics (standardised) 2011 2012 2011 2012Work 56.2 59.7 25.6 24.4Family (incl. accompanying family) 112.3 124.6 51.1 50.9Humanitarian 14.0 13.8 6.4 5.6Free movements 34.6 44.3 15.7 18.1Others 2.5 2.7 1.1 1.1Total 219.5 245.1 100.0 100.0
Temporary migration 2005 2011 2012Average2007-11
ThousandsInternational students 116.7 126.2 125.1 175.6Trainees 7.0 3.5 3.8 4.9Working holiday makers 104.4 185.5 214.6 167.5Seasonal workers .. 0.4 1.6 0.1Intra-company transfers .. 8.2 10.1 6.4Other temporary workers 71.6 106.2 141.0 116.3
Inflows of asylum seekers 2000 2005 2011 2012Average Level
2002-06 2007-11 2012Per 1 000 inhabitants 0.7 0.2 0.5 0.7 0.2 0.3 15 786
Components of population growth 2000 2005 2011 2012Average Level (’000)
2002-06 2007-11 2012Per 1 000 inhabitants
Total 12.3 14.3 13.6 17.6 13.0 15.1 400Natural increase 6.3 6.5 6.7 7.1 6.1 6.9 162Net migration 5.8 6.7 8.2 10.5 6.4 10.7 238
Stocks of immigrants 2000 2005 2011 2012Average Level (’000)
2002-06 2007-11 2012Percentage of the total population
Foreign-born population 23.2 24.4 27.0 27.3 24.1 26.3 6 209Foreign population .. .. .. .. .. .. ..
Naturalisations 2000 2005 2011 2012Average Level
2002-06 2007-11 2012Percentage of the foreign population .. .. .. .. .. .. 83 698
Labour market outcomes 2000 2005 2011 2012Average
2002-06 2007-11Employment/population ratio
Native-born men .. 79.9 78.9 78.4 79.2 79.7Foreign-born men .. 74.6 79.3 78.5 73.7 78.1Native-born women .. 67.0 68.8 68.8 66.3 68.9Foreign-born women .. 58.0 61.9 61.4 56.5 60.7
Unemployment rateNative-born men .. 4.9 5.2 5.4 5.5 4.8Foreign-born men .. 5.2 4.6 4.9 5.7 5.0Native-born women .. 5.2 5.2 5.2 5.5 4.9Foreign-born women .. 5.5 6.0 6.0 6.0 6.0
Macroeconomic indicators 2000 2005 2011 2012Average Level
2002-06 2007-11 2012Annual growth in %
Real GDP 1.8 3.0 3.6 2.6 3.4 2.7GDP/capita (level in US dollars) 0.6 1.5 2.1 1.0 2.1 0.9 43 060Employment (level in thousands) 0.9 3.4 1.7 1.2 2.3 2.1 11 347
Percentage of the labour forceUnemployment 6.3 5.0 5.1 5.2 5.5 4.9
Notes and sources are at the end of the chapter.1 2 http://dx.doi.org/10.1787/888933158010
0 5 10 15 200
Australia
20122002-11 annual average
New ZealandIndia
United KingdomChina
PhilippinesSouth Africa
Sri LankaMalaysia
KoreaIreland
INTERNATIONAL MIGRATION OUTLOOK 2014 © OECD 2014 235

4. COUNTRY NOTES: RECENT CHANGES IN MIGRATION MOVEMENTS AND POLICIES
AustriaIn 2012, the total inflow of foreign nationals toAustria increased to 125 600 persons, which repre-sented a 13% increase compared to the previous year.The outflows increased as well, albeit at a moremodest rate of 2.2% (or 74 400 persons). The net immi-gration of foreign nationals in 2012 reached51 200 persons, slightly more than in 2011. Theincreased net inflow of migrants was likely a conse-quence of the free mobility within the EEA combinedwith the relatively favourable economic situation inAustria. GDP growth of 2.7% achieved in 2011 sloweddown to 0.9% in 2012 in the wake of the economicrecession in the euro area; however, the economicgrowth remained well above the euro area average(-0.6%) mainly due to export growth and investmentsin public infrastructure and housing. ExcludingAustrians, more than a half (63%) of the immigrationflows to Austria came from the EU/EEA countries.Inflows from Southern Europe and the EU8 gainedimportance as did inflows from more distant origins,in particular Iran, the Russian Federation andAfghanistan.
In 2013, these trends continued, with higherinflows and lower outflows. Net migration of forei-gners rose to 60 700. Immigration flows from EU/EEAcountries accounted for 64% of all inflows. Immigra-tion from the EU8 and Southern European countriescontinued to rise, albeit to a lesser degree thanin 2012. Inflows from Croatia more than doubled andinflows from Bosnia and Herzegovina increased byover 20%. Where flows from Afghanistan declined,inflows from Syria almost doubled.
Family migration accounted for the bulk ofAustrian permanent immigration from outside theEU. A large share of third country nationals enteredoutside the quota system (i.e. as family members ofAustrians or EEA-citizens). The total inflow of perma-nent immigrants from third countries in 2013was 17 900 persons. Among these about one-fifth(3 900 permits) entered under a quota (mainly asfamily members of third country national settled inAustria), while 78% entered outside the quota. Themain grounds for immigration of third-countrynationals to Austria are family reunification toAustrians or EEA-citizens, work (on the basis of theRed-White-Red cards introduced in 2011), or humani-tarian grounds.
In addition to permanent (settlement) permits,the Federal Ministry of Interior issues temporaryresidence permits for the purpose of study, temporary
work and business activities, including servicesmobility (GATS mode 4) or on humanitarian grounds.In the course of 2013, 8 600 such temporary residencepermits were issued for the first time (about the samenumber as in the previous year), and 16 500 permitswere extended (4% more than in 2012).
In July 2011, the quota system for skilled third-country nationals was phased out and replaced by apoints-based system, under which Red-White-Red(RWR) cards are issued for work in the first year ofsettlement and “RWR Plus Card” are granted for familymembers and for work beyond the first year. Simulta-neously the EU Blue Card was introduced (for work inthe first two years of settlement). This reorientation ofmigration policy produced a change in the composi-tion of the status of migrants from third countries.The number of permanent residence permitsincreased, and the number of residence permits forrelatives declined in favour of the holders of RWR PlusCards. The introduction of RWR and EU Blue Cards hasseen the number of incoming skilled migrants double,to almost 1 300 in 2013. This, however, is less than wasexpected, since studies accompanying the introduc-tion of the RWR Card estimated an increase in theannual inflow of skilled labour of up to 5 000 personsby 2015 and 8 000 by 2030. To increase inflows, alegislative amendment enabling employers to file theapplication on behalf of applicants in Austria cameinto effect as of April 2013.
The number of asylum seekers has been risingyear on year since 2008 (with the exception of 2010).The total inflow of asylum seekers in 2012 reached17 400 persons, which was 2 300 persons (or 21%)more than in the year 2011. The top three countriesof origin among asylum seekers in Austria wereAfghanistan, the Russian Federation and Pakistan.
In 2013 the Austrian Council of Ministersinitiated a reform of the naturalisation legislation.The proposed amendments reduce the waiting periodfor naturalisation from ten to six years for foreignerswho can prove a high degree of integration in an eco-nomic, social or cultural respect.
For further information
www.bmi.gv.atwww.bmask.gv.atwww.migration.gv.at/enwww.statistik.at/web_en/statistics/population/index.html.
INTERNATIONAL MIGRATION OUTLOOK 2014 © OECD 2014236

4. COUNTRY NOTES: RECENT CHANGES IN MIGRATION MOVEMENTS AND POLICIES
Recent trends in migrants’ flows and stocksAUSTRIA
Migration flows (foreigners)2000 2005 2011 2012
Average Level (’000)National definition 2002-06 2007-11 2012
Per 1 000 inhabitantsInflows 8.2 11.9 13.1 14.9 11.4 11.6 125.6Outflows 5.5 6.1 8.7 8.8 6.1 7.8 74.4Migration inflows (foreigners) by type Thousands % distribution
Inflows of top 10 nationalitiesas a % of total inflows of foreigners
Permit based statistics (standardised) 2011 2012 2011 2012Work 1.0 1.2 1.7 1.8Family (incl. accompanying family) 12.5 10.6 21.3 15.8Humanitarian 6.4 4.1 11.0 6.1Free movements 38.2 50.9 65.5 75.9Others 0.2 0.2 0.4 0.4Total 58.4 67.1 100.0 100.0
Temporary migration 2005 2011 2012Average2007-11
ThousandsInternational students 3.2 4.6 4.6 3.4Trainees 0.4 .. .. ..Working holiday makers .. .. .. ..Seasonal workers 11.4 8.2 .. 10.8Intra-company transfers 0.2 0.2 .. 0.1Other temporary workers 6.3 2.9 .. 2.7
Inflows of asylum seekers 2000 2005 2011 2012Average Level
2002-06 2007-11 2012Per 1 000 inhabitants 2.3 2.7 1.7 2.1 3.2 1.6 17 413
Components of population growth 2000 2005 2011 2012Average Level (’000)
2002-06 2007-11 2012Per 1 000 inhabitants
Total 2.5 6.4 4.6 5.2 5.4 3.8 44Natural increase 0.2 0.4 0.2 -0.1 0.3 0.2 0Net migration 2.2 5.4 4.2 5.2 4.7 3.7 44
Stocks of immigrants 2000 2005 2011 2012Average Level (’000)
2002-06 2007-11 2012Percentage of the total population
Foreign-born population 10.5 14.5 16.0 16.2 14.3 15.5 1 365Foreign population 8.8 9.7 11.3 11.9 9.5 10.6 1 004
Naturalisations 2000 2005 2011 2012Average Level
2002-06 2007-11 2012Percentage of the foreign population 3.5 4.5 0.7 0.7 4.7 1.0 7 043
Labour market outcomes 2000 2005 2011 2012Average
2002-06 2007-11Employment/population ratio
Native-born men 76.2 76.2 78.3 78.4 75.6 78.5Foreign-born men 76.1 71.1 75.0 75.2 72.5 74.2Native-born women 59.8 63.5 68.2 69.2 62.5 67.7Foreign-born women 58.4 54.2 59.2 59.3 56.3 57.9
Unemployment rateNative-born men 4.3 3.9 3.3 3.5 4.1 3.4Foreign-born men 8.7 10.8 8.0 8.7 10.3 8.6Native-born women 4.2 4.6 3.5 3.7 4.3 3.7Foreign-born women 7.2 10.5 8.3 7.7 9.0 8.3
Macroeconomic indicators 2000 2005 2011 2012Average Level
2002-06 2007-11 2012Annual growth in %
Real GDP 3.7 2.4 2.8 0.9 2.2 1.2GDP/capita (level in US dollars) 3.4 1.7 2.5 0.4 1.7 0.9 43 273Employment (level in thousands) 0.5 2.2 1.2 0.9 1.0 1.1 4 183
Percentage of the labour forceUnemployment 3.5 5.2 4.2 4.4 4.7 4.3
Notes and sources are at the end of the chapter.1 2 http://dx.doi.org/10.1787/888933158025
0 5 10 15 200
Austria
20122002-11 annual average
GermanyRomaniaHungary
PolandSerbia
Slovak RepublicBosnia and Herzegovina
TurkeyAfghanistan
Bulgaria
INTERNATIONAL MIGRATION OUTLOOK 2014 © OECD 2014 237

4. COUNTRY NOTES: RECENT CHANGES IN MIGRATION MOVEMENTS AND POLICIES
BelgiumThe number of foreigners in Belgium has beenincreasing since the year 2002. In 2012, 123 000 personsimmigrated to Belgium – about 9 000 persons fewerthan in 2011. Among them 89% (110 000) were foreignnationals. Two-thirds of immigrants in 2012 wereEU nationals, principally from France (13 300) andRomania (11 200) . The decl ine in migrationbetween 2011 and 2012 was due to lower flows fromnon-EU countries. The number of emigrants increasedin 2012 to 84 100 persons – by 3 500 persons more thanin 2011. Among emigrants, 60 000 (71%) were foreignnationals.
As of the end of 2013, 1.2 million foreign nation-als lived in Belgium, up 3.9% in two years. The Belgianpopulation grew more slowly (0.7% in 2012-13). Thenet migration balance of foreigners was positivein 2012, but 18% lower than the previous years(50 100 persons), while that of national populationwas negative (a net outflow of 11 100 persons).The foreign-born population in 2012 reached1 689 500 persons, i.e. 15.2% of the total population(up from 14.9% in 2011).
Most foreign residents in Belgium in 2012 wereEU nationals (805 108 persons, or 67% of total foreignpopulation). The principal nationalities of foreignresidents were Italian (157 400 persons), French(153 400 persons) and Dutch (144 000 persons). Thelargest increase was in the number of Romaniannationals, which rose 20% in 2012 to reach 50 900.
Work permits were, in 2012, issued to third-country nationals and to nationals of Romania andBulgaria. In 2012, more than 15 200 first permits foremployment were issued, close to the 2011 figure,although about 40% fewer than in 2008. Nationals ofRomania and Bulgaria received more than half of firstwork permits issued in 2012 (6 300 and 2 100, respec-tively). Other major countries of origin amongst thefirst permit recipients were India (1 700) and Morocco(840). Foreigners whose primary reason for stay inBelgium is not employment-related may receivetype C permits, which grant work authorisation.27 500 C-permits (first and renewals) were issuedin 2012. Furthermore, 8 600 work permits (first andrenewals) were issued in 2012 to highly skilledworkers. More than half of the permits for highlyskilled workers were issued to Indians (2 800 persons),Japanese (1 100 persons), and nationals of theUnited States (900 persons).
Data from the National Institute for the SocialSecurity of the Self-employed indicate indicate that22 200 foreigners (and 71 000 Belgian nationals)
started independent employment in Belgium in 2012.These included 6 400 Romanians, 2 800 Bulgariansand 1 900 Poles.
The labour force participation rate in 2012 washigher for foreigners (72.1%) than for Belgiannationals (70.1%). While women had lower activityrates than men in both groups, the gender gap wasmuch more pronounced for the foreigners than forBelg ian nationals (24 percentage points and10 percentage points, respectively). The unemploy-ment rate was much higher for foreigners (16.3%) thanfor Belgian nationals (9.9%). Women constitutedalmost 43% of the unemployed foreigners and49.1% of the unemployed nationals.
Belg ium granted nat ional i ty in 2012 to38 600 persons (compared with 29 800 personsin 2011). The majority of naturalised citizens in 2012originated from Morocco (7 900 persons), followed byItaly (3 200 persons) and Turkey (2 500 persons). Newamendments to naturalisation legislation that cameinto force in January 2013 involved a tightening of theeligibility conditions.
First issuances of family migration permits totalled31 000 in 2012. These numbers have fallen 28% fromthe 2009 level, with most of the steady decline due tofewer cases of family reunification by Belgian nationals.After four years of increases, the Office for Foreignersregistered 21 500 asylum requests submitted in 2012(covering approximately 27 400 persons), 16% fewerthan in the previous year. In 2013, the number fell again,to 15 840 applications. A new asylum law adopted inSeptember 2013 changed the asylum applicationprocedure to shorten its duration, increase the qualityof assessment and prevent multiple requests inunfounded cases.
The EU Directive on sanctions against employers(2009/52/EC) came into force in Belgium on March 2013.Belgium decided to apply transitional labour marketrestrictions until 2015 on nationals of Croatia followingits accession to the EU.
Finally, under institutional reforms, economicmigration policy was decentralised from the federal toregional level, from 1 July 2014.
For further informationwww.emploi.belgique.bewww.ibz.behttps://dofi.ibz.be/www.statbel.fgov.bewww.cgra.bewww.fedasil.be.
INTERNATIONAL MIGRATION OUTLOOK 2014 © OECD 2014238

4. COUNTRY NOTES: RECENT CHANGES IN MIGRATION MOVEMENTS AND POLICIES
Recent trends in migrants’ flows and stocksBELGIUM
Migration flows (foreigners)2000 2005 2011 2012
Average Level (’000)National definition 2002-06 2007-11 2012
Per 1 000 inhabitantsInflows 5.6 7.4 10.7 9.9 7.1 9.9 110.0Outflows 3.5 3.7 5.1 5.4 3.5 4.4 59.9Migration inflows (foreigners) by type Thousands % distribution
Inflows of top 10 nationalitiesas a % of total inflows of foreigners
Permit based statistics (standardised) 2011 2012 2011 2012Work 9.0 9.1 14.5 15.4Family (incl. accompanying family) 23.0 18.3 37.2 31.0Humanitarian 2.9 3.0 4.6 5.2Free movements 27.0 28.5 43.6 48.4Others .. .. .. ..Total 61.8 58.9 100.0 100.0
Temporary migration 2005 2011 2012Average2007-11
ThousandsInternational students .. .. .. ..Trainees .. 0.2 0.2 0.3Working holiday makers .. .. .. ..Seasonal workers 2.7 6.3 10.1 10.8Intra-company transfers .. .. .. ..Other temporary workers 2.8 6.3 6.1 8.2
Inflows of asylum seekers 2000 2005 2011 2012Average Level
2002-06 2007-11 2012Per 1 000 inhabitants 4.2 1.5 2.4 1.7 1.5 1.6 18 525
Components of population growth 2000 2005 2011 2012Average Level (’000)
2002-06 2007-11 2012Per 1 000 inhabitants
Total 2.4 6.3 10.2 8.5 4.8 8.2 94Natural increase 1.1 1.6 2.3 2.1 1.1 2.1 23Net migration 1.3 4.7 7.9 6.5 3.6 6.0 72
Stocks of immigrants 2000 2005 2011 2012Average Level (’000)
2002-06 2007-11 2012Percentage of the total population
Foreign-born population 10.3 12.1 14.9 15.2 11.8 14.0 1 690Foreign population 8.4 8.6 10.6 10.7 8.5 9.8 1 195
Naturalisations 2000 2005 2011 2012Average Level
2002-06 2007-11 2012Percentage of the foreign population 6.9 3.6 2.7 3.3 4.1 3.2 38 612
Labour market outcomes 2000 2005 2011 2012Average
2002-06 2007-11Employment/population ratio
Native-born men 70.8 69.3 68.2 68.2 69.0 68.7Foreign-born men 62.2 61.2 61.3 60.0 59.8 61.9Native-born women 53.8 56.0 59.1 59.4 54.7 58.3Foreign-born women 37.3 39.7 44.4 44.5 39.1 43.8
Unemployment rateNative-born men 4.2 6.5 5.7 5.8 5.9 5.9Foreign-born men 14.7 15.7 15.5 17.6 16.2 15.8Native-born women 7.4 8.4 6.0 5.9 7.5 6.8Foreign-born women 17.5 18.9 14.6 15.9 17.6 16.0
Macroeconomic indicators 2000 2005 2011 2012Average Level
2002-06 2007-11 2012Annual growth in %
Real GDP 3.7 1.8 1.8 -0.1 2.0 1.0GDP/capita (level in US dollars) 3.4 1.2 0.9 -0.8 1.5 0.2 40 031Employment (level in thousands) 2.0 1.4 1.4 0.2 0.7 1.1 4 636
Percentage of the labour forceUnemployment 7.0 8.4 7.2 7.6 8.1 7.6
Notes and sources are at the end of the chapter.1 2 http://dx.doi.org/10.1787/888933158031
0 5 10 15
Belgium
20122002-11 annual average
FranceRomania
NetherlandsPoland
SpainMorocco
ItalyBulgariaPortugalGermany
INTERNATIONAL MIGRATION OUTLOOK 2014 © OECD 2014 239

4. COUNTRY NOTES: RECENT CHANGES IN MIGRATION MOVEMENTS AND POLICIES
BulgariaBulgaria remained in recession through 2012 andinto 2013. Economic contraction and persistent highunemployment remain an incentive for emigration,albeit at a lower level than in the past. Official exter-nal migration figures (which only include personswho have declared address changes from or to a for-eign address) captured about 8 200 immigrantsin 2012 and 10 500 immigrants in 2013, with netmigration of -650 in 2012 and +650 in 2013. Actual fig-ures are much higher. However, return migration fromabroad also remains low, even if Bulgaria’s emigrantpopulation is concentrated in Spain and Greece,where the employment situation remains bleak, andin the United Kingdom. On 1 January 2014 the transi-tional restrictions on Bulgarian migrants in the EUexpired; there is no evidence that this has led to sub-stantially larger outflows to those countries whichhad previously imposed labour market restrictions.
Although the foreign population in Bulgariacomprises only 0.6% of the population, the inflow ofimmigrants tripled in 2012 and doubled in 2013, toreach about 13 000 in 2013. Most immigrants werefrom the Russian Federation, Ukraine and Turkey. Theincrease in these flows was reflected in a rise in labourmigration, which was dominated by highly skilledworkers, engineers and technical staff. In the IT sectorin particular, the EU “Blue Card”, introduced in 2011,was used for this category.
More than 10 000 foreigners were naturalised inBulgaria in 2012, mostly on the grounds of Bulgarianorigin. This was fewer than the record number in 2011(18 500).
The number of foreign students, which has beenrising steadily, continued to increase. From 10 300 inacademic year 2010/11, the number increased to11 100 in 2011/12 and 11 400 in 2012/13.
Asylum has historically been a limited pheno-menon in Bulgaria. For example, as recently as 2011,
there were only 900 applicants. This has changedsignificantly with the crisis in Syria and the arrival ofan unprecedented inflow along the border withTurkey. In 2013, 11 000 individuals arrived in the spaceof just a few months. Asylum applications totalled7 100 in 2013, and 2 900 in the first five monthsof 2014. Over 2013-14, of those applications whichwere decided, 37% were granted refugee status and56% humanitarian status.
Bulgarian institutions and the public were caughtunprepared (especially as information about immi-gration and refugee policy had not been developedover the preceding decade) and the new arrivals meta relatively unwelcoming environment. Receptionpolicies were not in place, nor did the system havethe capacity to deal with a large number of asylumapplications. Integration measures are being defined.Measures which have been undertaken includebuilding reception centres for up to 4 000 people andemergency housing for up to 5 000. Among theintegration measures, Bulgaria held the first job fairfor Syrian refugees.
In the policy domain, efforts to develop a morerestrictive policy in light of the large number of bordercrossers is balanced with the need to relax entryrequirements for businesses and tourists in order tofavour economic recovery.
The bilateral agreement for construction workersin Israel, concluded in January 2012, continues to beimplemented.
For further information
www.nsi.bg/enwww.aref.government.bgwww.government.bg/cgi%20-bin/e-cms/vi%20s%20/vis.pl?s=001&p=0136&g.
INTERNATIONAL MIGRATION OUTLOOK 2014 © OECD 2014240

4. COUNTRY NOTES: RECENT CHANGES IN MIGRATION MOVEMENTS AND POLICIES
Recent trends in migrants’ flows and stocksBULGARIA
Migration flows (foreigners)2000 2005 2011 2012
Average Level (’000)National definition 2002-06 2007-11 2012
Per 1 000 inhabitantsInflows 0.5 2.0 3.0 .. 1.9 .. ..Outflows .. .. .. .. .. .. ..Migration inflows (foreigners) by type Thousands % distributionPermit based statistics (standardised) 2011 2012 2011 2012Work .. .. .. ..Family (incl. accompanying family) .. .. .. ..Humanitarian .. .. .. ..Free movements .. .. .. ..Others .. .. .. ..Total .. .. .. ..
Temporary migration 2005 2011 2012Average2007-11
ThousandsInternational students 2.1 .. .. 3.1Trainees .. .. .. ..Working holiday makers .. .. .. ..Seasonal workers .. .. .. ..Intra-company transfers .. .. .. ..Other temporary workers 0.6 .. .. 0.9
Inflows of asylum seekers 2000 2005 2011 2012Average Level
2002-06 2007-11 2012Per 1 000 inhabitants 0.2 0.1 0.1 0.2 0.2 0.1 1 229
Components of population growth 2000 2005 2011 2012Average Level (’000)
2002-06 2007-11 2012Per 1 000 inhabitants
Total -5.1 -5.5 -7.8 -5.7 -10.9 -5.6 -42Natural increase -5.1 -5.5 -4.6 -5.1 -5.6 -4.5 -37Net migration 0.0 0.0 -3.2 -0.7 -5.3 -1.1 -5
Stocks of immigrants 2000 2005 2011 2012Average Level (’000)
2002-06 2007-11 2012Percentage of the total population
Foreign-born population .. .. .. .. .. .. ..Foreign population .. .. .. .. .. .. ..
Naturalisations 2000 2005 2011 2012Average Level
2002-06 2007-11 2012Percentage of the foreign population .. .. .. .. .. .. ..
Labour market outcomes 2000 2005 2011 2012Average
2002-06 2007-11Employment/population ratio
Native-born men 56.1 61.7 61.3 61.3 58.4 65.2Foreign-born men .. .. .. .. .. ..Native-born women 47.2 47.4 55.7 56.6 51.1 57.5Foreign-born women .. .. .. .. .. ..
Unemployment rateNative-born men 16.8 12.3 12.5 13.7 13.1 8.5Foreign-born men .. .. .. .. .. ..Native-born women 15.9 15.0 10.1 10.8 12.4 7.9Foreign-born women .. .. .. .. .. ..
Macroeconomic indicators 2000 2005 2011 2012Average Level
2002-06 2007-11 2012Annual growth in %
Real GDP 5.7 6.4 1.8 .. 6.0 1.9GDP/capita (level in US dollars) .. .. .. .. .. .. 15 828Employment (level in thousands) .. 2.0 -3.4 .. 2.9 -1.0 ..
Percentage of the labour forceUnemployment 16.4 10.1 11.2 .. 12.6 8.1
Notes and sources are at the end of the chapter.1 2 http://dx.doi.org/10.1787/888933158042
INTERNATIONAL MIGRATION OUTLOOK 2014 © OECD 2014 241

4. COUNTRY NOTES: RECENT CHANGES IN MIGRATION MOVEMENTS AND POLICIES
CanadaCanada admitted 257 900 new permanent residentsin 2012, equivalent to about 0.7% of the residentpopulation and close to the average since 2006.
Canada sets annual targets for the total admis-sion of permanent residents and by single categories;its overall planned admission range for 2012 was240 000-265 000, consistent with the previous year.In 2012, admissions under each class were within theplanned range and the share of different classes wassimilar to that of previous years. 62.4% of 2012 admis-sions were economic immigrants (including spouse/partner and dependants), 25.2% were in the familyreunification category, and 12.4% were protectedpersons and other immigrants.
Within classes, there are notable shifts. Theshare of family class immigrants increased by 15%from 2011 to 2012 (from 56 400 admissions to 65 000)as a result of accelerated processing of applications,following a temporary pause on the intake of newsponsorship applications for parents and grand-parents. The number of all other categories increasedslightly except for refugees where there were 17%fewer admissions in 2012 (23 000 refugees). WhileCanada’s planning range for government-assistedrefugees was 7 500 in 2012, it admitted 5 400 due inpart to the crisis in Syria and to difficulty reachingother refugee populations for security reasons.
China (12.8%), the Philippines (12.7%), and India(11.2%) continue to be the leading origin countries forpermanent residents to Canada. The Philippines(16.9%) was the leading origin for economic migrants,China (17.5%) for family migrants and Haiti (7.6%) forrefugees.
Immigrants continue to be well qualified: in 2012,42% (68 000) of permanent residents between 25 and64 years of age had completed tertiary education.
Canada has seen significant growth in temporarymigration, which is more demand-driven thanpermanent resident admissions. In 2012, 318 300 newtemporary foreign workers and international studentswere admitted, a 10.2% increase from 2011, withincreases in both temporary foreign workers (213 600)and international students (81 100, as well as 23 700students at secondary or lower level). 26 500 SeasonalAgricultural Workers came to Canada to work in 2012,with Mexico and Jamaica accounting for 67% and 24%respectively of total admissions.
The number of naturalisations in 2012 (113 200)was lower than in 2011 (181 300), due to greater scrutinywhen verifying applicants’ eligibility for citizenship andto anti-fraud measures. Naturalisations increased againin 2013 (128 900) due to faster processing of applicationsand additional programme funding.
Canada passed comprehensive legislative changesto the Citizenship Act in June 2014, with the aim ofincreasing programme efficiency, strengtheningprogramme integrity, as well as reinforcing the value ofCanadian citizenship.
Canada will be launching a new applicationmanagement system in January 2015. Express Entry isdesigned to ensure a steady supply of skilled workersready to begin employment in Canada and helpsupplement the Canadian workforce where there areskills shortages. To support strong admissions in 2014and 2015, Canada began accepting applications undernew caps for the Federal Skilled Worker Programme,the Federal Skilled Trades Program, and the CanadianExperience Class in the spring of 2014.
The Start-up Visa Programme, launched in 2013,welcomed the first successful applicants in 2014. Theprogramme brings together Canadian venture capitalfunds, angel investors and business incubators withentrepreneurs from abroad. The Federal Investor andEntrepreneur programmes were terminated inJune 2014.
New International Student Programme regula-tions came into effect in 2014, requiring internationalstudents to be enrolled at a designated learning insti-tution, in addition to actively pursuing a course orprogramme of study.
As part of the Action Plan for Faster FamilyReunification, the government undertook a review ofthe Parent and Grandparent Programme with a viewto reducing application backlogs and lengthy waittimes, and making the Programme more fiscallysustainable over the long term. Since the launch of theAction Plan, the backlog and wait times have beenreduced, and new sponsorship criteria (in effectfrom 2014) ensure that families have the financialmeans to support those they sponsor.
A comprehensive overhaul of the TemporaryForeign Worker Programme was announced inJune 2014. This includes using wage levels instead ofnational occupational classification as the maincriteria, a new comprehensive and rigorous LabourMarket Impact Assessment (LMIA) process, and capson low-wage temporary foreign workers. LMIAexemptions have been consolidated in an Inter-national Mobility Program. Both programmeswill have stronger employer enforcement andtougher penalties made possible through either newcompliance fees or higher user fees.
For further information
www.cic.gc.ca.
INTERNATIONAL MIGRATION OUTLOOK 2014 © OECD 2014242

4. COUNTRY NOTES: RECENT CHANGES IN MIGRATION MOVEMENTS AND POLICIES
Recent trends in migrants’ flows and stocksCANADA
Migration flows (foreigners)2000 2005 2011 2012
Average Level (’000)National definition 2002-06 2007-11 2012
Per 1 000 inhabitantsInflows 7.4 8.1 7.2 7.4 7.5 7.5 257.9Outflows .. .. .. .. .. .. ..Migration inflows (foreigners) by type Thousands % distribution
Inflows of top 10 nationalitiesas a % of total inflows of foreigners
Permit based statistics (standardised) 2011 2012 2011 2012Work 64.4 68.3 25.9 26.5Family (incl. accompanying family) 148.2 157.6 59.6 61.1Humanitarian 36.1 32.0 14.5 12.4Free movements .. .. .. ..Others 0.1 0.1 0.0 0.0Total 248.7 257.9 100.0 100.0
Temporary migration 2005 2011 2012Average2007-11
ThousandsInternational students 56.7 77.2 81.1 69.0Trainees .. .. .. ..Working holiday makers 28.0 54.9 59.1 44.8Seasonal workers 20.3 24.5 25.4 24.5Intra-company transfers 6.8 13.5 13.6 11.4Other temporary workers 62.4 86.9 103.3 91.6
Inflows of asylum seekers 2000 2005 2011 2012Average Level
2002-06 2007-11 2012Per 1 000 inhabitants 1.1 0.6 0.7 0.6 0.9 0.9 20 223
Components of population growth 2000 2005 2011 2012Average Level (’000)
2002-06 2007-11 2012Per 1 000 inhabitants
Total 9.7 9.9 11.9 .. 9.8 11.5 ..Natural increase 3.6 3.5 3.8 .. 3.5 4.0 ..Net migration 6.5 7.0 7.1 .. 6.9 7.5 ..
Stocks of immigrants 2000 2005 2011 2012Average Level (’000)
2002-06 2007-11 2012Percentage of the total population
Foreign-born population 17.4 18.7 19.6 19.8 18.4 19.6 6 914Foreign population .. .. .. .. .. .. ..
Naturalisations 2000 2005 2011 2012Average Level
2002-06 2007-11 2012Percentage of the foreign population .. .. .. .. .. .. 113 150
Labour market outcomes 2000 2005 2011 2012Average
2002-06 2007-11Employment/population ratio
Native-born men 77.4 .. 75.0 75.0 .. 75.0Foreign-born men 77.0 .. 75.1 76.1 .. 75.3Native-born women 66.0 .. 70.6 70.6 .. 70.8Foreign-born women 59.6 .. 63.0 64.5 .. 63.4
Unemployment rateNative-born men 5.7 .. 7.8 7.6 .. 8.1Foreign-born men 6.1 .. 8.4 8.3 .. 9.0Native-born women 6.2 .. 6.4 6.4 .. 6.2Foreign-born women 8.7 .. 9.5 8.6 .. 9.2
Macroeconomic indicators 2000 2005 2011 2012Average Level
2002-06 2007-11 2012Annual growth in %
Real GDP 8.1 3.2 2.5 1.7 2.7 1.3GDP/capita (level in US dollars) 7.1 2.2 1.5 0.6 1.7 0.1 41 773Employment (level in thousands) 2.5 1.3 1.5 1.2 1.9 1.1 17 509
Percentage of the labour forceUnemployment 6.8 6.7 7.5 7.3 7.1 7.2
Notes and sources are at the end of the chapter.1 2 http://dx.doi.org/10.1787/888933158051
0 5 10 15
Canada
20122002-11 annual average
ChinaPhilippines
IndiaPakistan
United StatesFrance
IranUnited Kingdom
HaitiKorea
INTERNATIONAL MIGRATION OUTLOOK 2014 © OECD 2014 243

4. COUNTRY NOTES: RECENT CHANGES IN MIGRATION MOVEMENTS AND POLICIES
ChileMigration inflows to Chile started to increasetowards the end of the 1990s and continued to grow,in particular during the last decade. The total numberof issued residence permits doubled between 2002and 2012. More than 127 000 permits were grantedin 2012 (including 100 100 temporary and 27 300 per-manent residence permits), 33% more than during theprevious year. Permits further increased to 158 000 in2013 (132 100 temporary and 26 000 permanent).Migration inflows in 2012 corresponded to about0.6% of the resident population.
According to estimates by the Department ofForeign Affairs and Immigration of the Ministry ofInterior, the stock of foreign residents permanentlyl iv ing in Chi le in 2012 reached more than415 000 people (representing nearly 2.5% of the totalpopulation), and further increased to 441 500 inlate 2013. More than two thirds (74%) of the foreignresidents came from Latin America, mainly from Peru(38%), Argentina (15%), Bolivia (8%), Ecuador (5%) andColombia (5%).
About 70% of temporary permits in 2013 went tonationals of just three countries: Peru (39 300) Bolivia(26 900) and Colombia (26 600). Countries of originwhich have seen recent sharp increases include Spain(from 2 400 temporary permits in 2012 to 4 900in 2013), Haiti and the Dominican Republic. Mostnew arrivals from these countries hold temporaryresidence permits.
The number of visas granted has been also steadilyincreasing over the decade. In 2012, 105 000 visas wereissued, which was three times more than in 2003.Among visa recipients in 2012, the top three countriesof origin were Peru (38 600 persons), Colombia(17 800 persons), and Bolivia (13 600 persons).
While migration in the 1990s was characterisedby a high share of women and working-age immi-grants, the gender gap has recently shrunk, and theimmigration flows in 2011 and 2012 were balanced interms of gender. In 2012, only 3% of temporaryresidence permits were granted for purposes of study,while 45% residence permits were granted to tempo-rary visa holders, and 53% permits were issued to theholders of work contract visas.
In October 2012, Chile held its first local electionswith voluntary suffrage and automatic registration, inwhich nearly 125 000 foreigners were entitled to vote.In July 2012 the first anti-discrimination law waspublished in Chile.
During 2013, the Chilean government imple-mented the Citizen Survey on Discrimination, whichwas aimed at awareness-raising and obtaining infor-mation on local practices of discrimination. InDecember 2013, twenty public and civil institutionsthat constitute the Intersectoral Working Partyagainst Human Trafficking adopted an intersectoralagreement on the implementation of National PlanAgainst Human Trafficking “Chile Says No to HumanTrafficking”.
In the policy domain, several years of discussionled to the presentation by the executive of an Immi-gration Bill to the National Congress in June 2013.Following elections in March 2014 and a change ingovernment, revisions are planned to the previousBill. The government programme has established amigration policy based on the implementation ofinternational instruments ratified by Chile on therights of migrants; the development of an activegovernment role in actions relating to humanitarianresettlement; promotion of regular residence; protec-tion of victims of trafficking and the generation ofthematic initiatives that link migration and develop-ment; and seeking to improve the conditions ofmigrant workers in Chile.
The government is examining changes to currentlegislation to support integration of immigrants, toincrease the rights-based approach to migrationpolicy and to take into account regional integrationprocesses involving Chile. Interagency co-ordinationand capacity are expected to be addressed, as is thestrengthening of regional and municipal authoritieswhere immigrants are concentrated.
For further information
www.extranjeria.gov.clwww.minrel.gov.clwww.interior.gov.cl.
INTERNATIONAL MIGRATION OUTLOOK 2014 © OECD 2014244

4. COUNTRY NOTES: RECENT CHANGES IN MIGRATION MOVEMENTS AND POLICIES
Recent trends in migrants’ flows and stocksCHILE
Migration flows (foreigners)2000 2005 2011 2012
Average Level (’000)National definition 2002-06 2007-11 2012
Per 1 000 inhabitantsInflows 1.2 2.3 4.4 5.7 2.2 4.1 100.1Outflows .. .. .. .. .. .. ..Migration inflows (foreigners) by type Thousands % distribution
Inflows of top 10 nationalitiesas a % of total inflows of foreigners
Permit based statistics (standardised) 2011 2012 2011 2012Work .. .. .. ..Family (incl. accompanying family) .. .. .. ..Humanitarian .. .. .. ..Free movements .. .. .. ..Others .. .. .. ..Total .. .. .. ..
Temporary migration 2005 2011 2012Average2007-11
ThousandsInternational students .. .. .. ..Trainees .. .. .. ..Working holiday makers .. .. .. ..Seasonal workers .. .. .. ..Intra-company transfers .. .. .. ..Other temporary workers .. .. .. ..
Inflows of asylum seekers 2000 2005 2011 2012Average Level
2002-06 2007-11 2012Per 1 000 inhabitants 0.0 0.0 0.0 0.0 0.0 0.0 168
Components of population growth 2000 2005 2011 2012Average Level (’000)
2002-06 2007-11 2012Per 1 000 inhabitants
Total 12.2 10.4 9.0 8.8 10.7 9.6 154Natural increase 11.6 9.7 8.7 8.7 10.0 9.3 151Net migration 0.4 0.4 0.2 0.2 0.4 0.3 4
Stocks of immigrants 2000 2005 2011 2012Average Level (’000)
2002-06 2007-11 2012Percentage of the total population
Foreign-born population .. 1.5 .. .. 1.4 .. ..Foreign population .. .. .. .. .. .. ..
Naturalisations 2000 2005 2011 2012Average Level
2002-06 2007-11 2012Percentage of the foreign population .. 1.5 .. .. 1.4 .. 1 225
Labour market outcomes 2000 2005 2011 2012Average
2002-06 2007-11Employment/population ratio
Native-born men .. .. 70.7 .. .. 69.7Foreign-born men .. .. 79.3 .. .. 76.5Native-born women .. .. 44.1 .. .. 42.5Foreign-born women .. .. 59.7 .. .. 58.6
Unemployment rateNative-born men .. .. 6.7 .. .. 8.0Foreign-born men .. .. 3.9 .. .. 5.5Native-born women .. .. 10.0 .. .. 11.4Foreign-born women .. .. 7.7 .. .. 8.3
Macroeconomic indicators 2000 2005 2011 2012Average Level
2002-06 2007-11 2012Annual growth in %
Real GDP 6.8 6.2 5.8 5.4 5.1 3.8GDP/capita (level in US dollars) 5.4 5.0 4.9 4.4 3.9 2.8 21 120Employment (level in thousands) .. 3.8 5.0 .. 2.8 3.6 ..
Percentage of the labour forceUnemployment 9.7 9.2 7.1 6.4 9.3 8.0
Notes and sources are at the end of the chapter.1 2 http://dx.doi.org/10.1787/888933158065
0 20 4010 30 50 600
Chile
20122002-11 annual average
PeruColombia
BoliviaArgentina
Dominican RepublicEcuador
United StatesSpainChinaHaiti
INTERNATIONAL MIGRATION OUTLOOK 2014 © OECD 2014 245

4. COUNTRY NOTES: RECENT CHANGES IN MIGRATION MOVEMENTS AND POLICIES
Czech RepublicAfter three years of steady decline, migration intothe Czech Republic picked up in 2012, as the total num-ber of immigrants reached more than 30 000 persons,an annual increase of about 34%. Emigrants numberedclose to 20 000 persons, approximately at the samelevel as in 2011. The resulting net migration of10 000 persons was about 40% lower than in 2011. Thedifference in net migration between 2012 and 2011 canbe partially attributed to change in the monitoring sys-tem: migration statistics were transferred in mid-2013from the population register to a specific informationsystem on foreigners. The main nationalities amongimmigrants were Ukrainian, Slovak and Russian.Nationals of Viet Nam, Germany and the United Statesalso represented a sizeable group and growingnumbers among immigrants. Net migration accountedfor almost all (96%) of the population increase in theCzech Republic in 2012. Figures for 2013 indicate thatimmigration remained at the same level, while emigra-tion increased to about 30 000, yielding negative netmigration. There was negative net migration ofUkrainians (about -7 000) and of Czechs (-2 000).
The stock of foreigners with residence permits inthe Czech Republic increased modestly (by less than1 percentage point), to reach 438 000 persons or4.2% of the total population in 2012 and continued inthis trend in 2013 with 441 000 persons. The totalstock of foreign population thus reached the pre-crisislevel in 2012 and since then has been slowly increas-ing. Nationals of EU member countries representedmore than one-third of the foreign population in 2013(174 000 persons) with its share consistently increas-ing since 2010. A growing share of foreigners hold per-manent residence permits, significantly among non-EU member countries (with annual increase morethan 12% in 2013). Three nationalities – Ukraine, theSlovak Republic and Viet Nam – accounted for almost60% of all foreign residents in the Czech Republicin 2013 with nationals from Ukraine annuallydecreasing, Slovak nationals annually increasing andnationals of Viet Nam at a stable level.
About 700 persons applied for asylum with theCzech authorities in 2013. Although the rate of declinein the number of applications slowed considerably inrecent years, the year of 2013 recorded the lowestnumber of applications for international protection inthe history of the Czech Republic. The main origincountry for asylum seekers in the Czech Republic
continues to be Ukraine, followed by Syria, theRussian Federation and Viet Nam. In 2013 about100 persons received refugee status and about250 persons received complementary protectionalmost doubling since the previous year. Applicantscame mainly from Ukraine, Syr ia and theRussian Federation, while the successful applicantswere mainly from Syria, Belarus, and Myanmar.
In 2012 the Ministry of Labour and Social Affairsadopted new rules aimed at reducing low-skilledlabour immigration: limits were imposed on theissuance of work permits to non-EU member countrynationals (mainly for job vacancies with qualificationrequirements below full secondary education). Theserules were lifted in 2013. Due to the change in theregistration system of the Ministry of Labour andSocial Affairs, figures on foreign employmentsince 2012 are based on estimates; however it is likelythat the post-crisis trend of a substantial share offoreign workers switching into self-employment hasbeen decreasing since 2012. The annual average ofself-employed was about 6% lower in 2013 than a yearearlier. The increasing share of long-term visa appli-cants under the study category continued in 2013,when students represented almost 50% of long-termvisa applicants and 40% of those applying for long-term residence permit.
A simplified procedure for the processing ofwork and residence permits was introduced in theCzech Republic in 2009 in the framework of thenational Green Card system. The Green Card systemended in 2014 with the transposition of the EU “SinglePermit” Directive (2011/98/EC). The single permit, an“Employee Card”, has been issued from late June 2014.Along with the Employee Card another single permit,an EU Blue Card for highly skilled non-EU foreignershas been in introduced in January 2012. In the courseof 2013, more than 160 persons received Blue Cards,about half of them from the Russian Federation andUkraine.
Changes in the naturalisation law took effectin 2014, allowing dual citizenship.
For further information
www.mvcr.czwww.czso.cz/http://portal.mpsv.cz/sz/zahr_zam.
INTERNATIONAL MIGRATION OUTLOOK 2014 © OECD 2014246

4. COUNTRY NOTES: RECENT CHANGES IN MIGRATION MOVEMENTS AND POLICIES
Recent trends in migrants’ flows and stocksCZECH REPUBLIC
Migration flows (foreigners)2000 2005 2011 2012
Average Level (’000)National definition 2002-06 2007-11 2012
Per 1 000 inhabitantsInflows 0.4 5.7 2.2 2.9 5.4 5.3 30.3Outflows 0.0 2.1 0.5 1.9 3.0 1.0 20.0Migration inflows (foreigners) by type Thousands % distribution
Inflows of top 10 nationalitiesas a % of total inflows of foreigners
Permit based statistics (standardised) 2011 2012 2011 2012Work .. .. .. ..Family (incl. accompanying family) .. .. .. ..Humanitarian .. .. .. ..Free movements .. .. .. ..Others .. .. .. ..Total 22.6 30.3 .. ..
Temporary migration 2005 2011 2012Average2007-11
ThousandsInternational students 4.4 .. .. 5.8Trainees .. .. .. ..Working holiday makers .. .. .. ..Seasonal workers .. .. .. ..Intra-company transfers .. .. .. ..Other temporary workers .. .. .. ..
Inflows of asylum seekers 2000 2005 2011 2012Average Level
2002-06 2007-11 2012Per 1 000 inhabitants 0.9 0.4 0.1 0.1 0.6 0.1 753
Components of population growth 2000 2005 2011 2012Average Level (’000)
2002-06 2007-11 2012Per 1 000 inhabitants
Total -1.1 3.0 2.5 1.8 -0.3 5.4 19Natural increase -1.8 -0.6 1.0 0.2 -1.3 0.9 2Net migration 0.6 3.5 1.5 1.6 1.0 4.5 17
Stocks of immigrants 2000 2005 2011 2012Average Level (’000)
2002-06 2007-11 2012Percentage of the total population
Foreign-born population 4.2 5.1 6.4 .. 5.0 6.3 ..Foreign population 2.0 2.7 4.1 4.1 2.6 4.1 436
Naturalisations 2000 2005 2011 2012Average Level
2002-06 2007-11 2012Percentage of the foreign population 3.6 1.0 0.5 0.5 1.4 0.4 2 036
Labour market outcomes 2000 2005 2011 2012Average
2002-06 2007-11Employment/population ratio
Native-born men 73.1 73.3 73.7 74.5 73.3 74.3Foreign-born men .. 71.0 79.6 79.5 67.7 77.6Native-born women 56.8 56.4 57.2 58.3 56.7 57.0Foreign-born women .. 51.3 53.9 54.6 50.9 56.0
Unemployment rateNative-born men 7.4 6.4 5.8 6.0 6.2 5.2Foreign-born men .. 9.7 7.1 7.3 10.3 6.7Native-born women 10.6 9.7 7.9 8.2 9.2 7.3Foreign-born women .. 15.8 10.0 11.2 14.4 10.3
Macroeconomic indicators 2000 2005 2011 2012Average Level
2002-06 2007-11 2012Annual growth in %
Real GDP 4.2 6.8 1.8 -1.0 4.9 1.7GDP/capita (level in US dollars) 4.3 6.5 2.0 -1.1 4.8 1.3 26 985Employment (level in thousands) -0.6 1.6 -0.2 0.4 0.6 0.2 4 891
Percentage of the labour forceUnemployment 8.8 7.9 6.7 7.0 7.7 6.1
Notes and sources are at the end of the chapter.1 2 http://dx.doi.org/10.1787/888933158077
0 10 20 30 400
Czech Republic
20122002-11 annual average
UkraineSlovak Republic
Russian FederationViet NamGermany
United StatesBulgariaRomania
KazakhstanPoland
INTERNATIONAL MIGRATION OUTLOOK 2014 © OECD 2014 247

4. COUNTRY NOTES: RECENT CHANGES IN MIGRATION MOVEMENTS AND POLICIES
DenmarkIn January 2014, immigrants and their descendantsin Denmark numbered 626 100, up 25 000 from oneyear earlier, comprising 11.1% of the overall popula-tion. Persons of Turkish origin constituted the largestgroup, 9.8% of immigrants and their descendants,followed by Poles (5.8%), Germans and Iraqis (5.1% and4.9% respectively). At the top of the list of groups withthe highest population growth during 2012 and 2013are those of Romanian origin (13% increase in 2012and 12% in 2013), then those of Polish origin(10% annually) and of Syrian origin (5% in 2012 and8% in 2013).
During 2013 Denmark received 59 300 immigrantsand dependants while 30 300 left, resulting in a 26.6%increase in net inflow, to 29 000 compared with the pre-vious year. The inflow of persons with Danish originwas 19 000, slightly more than in 2012; outflow was18 000, slightly higher than in 2012, resulting in theirnet immigration rising to 900. Persons of Polish orRomanian background were the groups experiencingthe highest net migration to Denmark in 2013, whilein 2012 it had been Romanian, Polish and Lithuanian.
The number of residence permits granted hadbeen steadily falling, from 70 300 in 2008 to 56 000in 2012, mainly because fewer study and work permitswere granted. In 2013 the number of residencepermits increased to 64 600 permits. 50% of residencepermits went to EU/EEA citizens in 2013. 18% ofpermits were for study purposes, 18% for work, 8% forfamily reunion and 6% for asylum. Within all thesecategories there was an increase in the number ofpermits from 2012 to 2013.
In both 2011 and 2012 the number of familyreunification permits to spouses/partners was lowerthan in previous years: in 2011, 2 200 permits weregranted, and in 2012 the number was 2 400. In 2013the number of family reunification permits tospouses/partners, however, returned to its pre-2011levels, with about 3 700 permits granted. Familyreunification permits granted to spouses/partners ofDanish or Nordic nationals constitute by far thelargest proportion.
The number of asylum and related permitsincreased from 1 100 in 2006 to 3 900 in 2013. About athird of these permits were given to persons of Syriannationality.
In May 2013, new legislation was introducedoffering new opportunities for asylum seekers to takeup employment and residence outside of the refugeecentres after six months if certain conditions are met.These rules have resulted in a strengthening of therange of activities and educational courses offered toasylum seekers at different stages of the asylumprocedure.
New guidelines for naturalisation were intro-duced in May 2013. Applicants will now have to passthe Danish Level 2 Examination, or its equivalent andmust also take and pass a new citizenship test, whichincludes aspects of everyday life and the active poli-tical life faced by citizens in a modern society; the testwill be held twice a year from June 2014.
In May 2013 the Parliament adopted an amend-ment to the Integration Act comprising of two ele-ments. The overall goal of the amendment was toenhance the integration efforts towards newcomers.From July 2013 municipalities are obliged to – as soonas possible and within 3 months after the migrant’sarrival in the municipality – offer an integration planfor newly arrived refugees and family re-unifiedpersons and a medical screening for newly arrivedrefugees and their family members. The object of theintegration plan is to ensure better interdisciplinaryco-ordination of all integration efforts concerningmigrants and their families.
The Government presented an amendment to theAliens Act in January 2014. Its purpose is to ensure thata residence permit issued on the basis of marriage isnot revoked if the spouse residing in Denmark dies.The foreigner must, however, have shown a will to beintegrated into Danish society. According to the currentrules a foreigner who has lived in Denmark only for ashort period of time will often not be considered tohave sufficient ties with Danish society, that the resi-dence permit will not be revoked if the spouse dies. Theamendment entered into force in February 2014.
For further informationwww.ast.dkwww.sm.dkwww.justitsministeriet.dk/www.newtodenmark.dkwww.workindenmark.dk.
INTERNATIONAL MIGRATION OUTLOOK 2014 © OECD 2014248

4. COUNTRY NOTES: RECENT CHANGES IN MIGRATION MOVEMENTS AND POLICIES
Recent trends in migrants’ flows and stocksDENMARK
Migration flows (foreigners)2000 2005 2011 2012
Average Level (’000)National definition 2002-06 2007-11 2012
Per 1 000 inhabitantsInflows 4.3 3.7 6.2 5.0 3.8 6.1 35.5Outflows 2.6 3.0 4.8 4.1 3.0 4.4 29.1Migration inflows (foreigners) by type Thousands % distribution
Inflows of top 10 nationalitiesas a % of total inflows of foreigners
Permit based statistics (standardised) 2011 2012 2011 2012Work 6.4 5.9 15.6 13.5Family (incl. accompanying family) 5.8 6.1 13.9 14.0Humanitarian 2.2 2.6 5.4 5.9Free movements 23.5 25.3 56.9 57.7Others 3.3 3.9 8.1 9.0Total 41.3 43.8 100.0 100.0
Temporary migration 2005 2011 2012Average2007-11
ThousandsInternational students 6.9 5.8 6.2 6.2Trainees 1.9 1.5 1.4 2.3Working holiday makers .. .. .. ..Seasonal workers .. .. .. ..Intra-company transfers .. .. .. ..Other temporary workers 2.6 3.4 3.3 3.7
Inflows of asylum seekers 2000 2005 2011 2012Average Level
2002-06 2007-11 2012Per 1 000 inhabitants 2.4 0.4 0.7 1.1 0.7 0.6 6 186
Components of population growth 2000 2005 2011 2012Average Level (’000)
2002-06 2007-11 2012Per 1 000 inhabitants
Total 3.6 3.0 5.1 4.0 2.9 5.8 22Natural increase 1.7 1.7 1.2 1.0 1.4 1.5 6Net migration 1.7 1.2 4.1 3.0 1.4 4.3 16
Stocks of immigrants 2000 2005 2011 2012Average Level (’000)
2002-06 2007-11 2012Percentage of the total population
Foreign-born population 5.8 6.5 7.9 8.2 6.4 7.5 456Foreign population 4.8 5.0 6.4 6.7 5.0 6.0 375
Naturalisations 2000 2005 2011 2012Average Level
2002-06 2007-11 2012Percentage of the foreign population 7.3 3.8 1.1 0.0 4.2 1.4 ..
Labour market outcomes 2000 2005 2011 2012Average
2002-06 2007-11Employment/population ratio
Native-born men 81.5 80.3 77.1 76.3 80.9 79.3Foreign-born men 65.8 72.1 66.1 66.1 68.4 69.8Native-born women 73.2 72.9 72.3 72.0 73.2 73.8Foreign-born women 53.9 55.6 58.1 56.8 55.0 59.8
Unemployment rateNative-born men 3.7 4.3 7.2 7.1 4.1 5.4Foreign-born men 11.1 8.3 13.8 13.4 11.0 11.3Native-born women 4.9 5.1 6.5 6.6 4.8 4.9Foreign-born women 6.6 9.9 15.1 15.9 9.8 11.0
Macroeconomic indicators 2000 2005 2011 2012Average Level
2002-06 2007-11 2012Annual growth in %
Real GDP 3.5 2.4 1.1 -0.4 1.8 -0.5GDP/capita (level in US dollars) 3.2 2.1 0.7 -0.7 1.5 -1.0 41 945Employment (level in thousands) -1.2 0.5 -0.1 -0.5 0.5 -0.7 2 689
Percentage of the labour forceUnemployment 4.3 4.8 7.6 7.5 4.8 5.7
Notes and sources are at the end of the chapter.1 2 http://dx.doi.org/10.1787/888933158082
0 2 4 6 8 100
Denmark
20122002-11 annual average
PolandRomaniaGermanyLithuania
PhilippinesNorway
BulgariaUkraineSweden
United Kingdom
INTERNATIONAL MIGRATION OUTLOOK 2014 © OECD 2014 249

4. COUNTRY NOTES: RECENT CHANGES IN MIGRATION MOVEMENTS AND POLICIES
EstoniaAccording to the Population Registry, the popula-tion of Estonia continued a longstanding declinein 2013, reaching 1.35 million by 1 January 2014, down0.3% in a yearly comparison. Registered foreignresidents represented about 15.7% of the total regis-tered population. 85.3% of foreign residents wereeither citizens of the Russian Federation (6.9% of thetotal) or had undetermined citizenship (6.5% of thetotal). Despite a 2.2% total decline in these two groupsduring 2013, the share of foreign residents in the totalpopulation remained stable, as the number of EUcitizens increased by 14.5%. EU citizens numbered20 600 by the end of 2013, with 3 400 EU citizens newlyresident in Estonia. The main nationalities of EUcitizens were Finnish (5 700) comprising 27% of all EUcitizens, followed by Latvian (3 300) and Lithuanian(2 000).
Police and Border Guard Board data indicate afalling number of applications and issuances for resi-dence permits. On 1 January 2014, there were197 400 valid residence permits (174 800 long termresident residence permits and 22 600 temporary resi-dence permits) compared with 201 400 a year earlier.The decline in Russian citizens and people with unde-termined citizenship explains the 2% drop. EU citizensare not subject to a permit regime, but have threemonths to register their place of residence in theEstonian population register, which grants them theright of residence in the country for five years. In thefirst ten months of 2013, 3 100 EU citizens registeredas temporary residents and 400 citizens of the EU reg-istrated their right of permanent residence.
Family migration was the main reason for grant-ing temporary permits to non-EU citizens over the lasttwo years (1 285 permits issued in 2013), followed byemployment (860). 680 permits were issued forstudies, a 24% increase on 2012.
In 2013, 1 300 people naturalised, compared with1 340 in 2012. 84% previously had undeterminedcitizenship. The Estonian government aims tocontinue reducing the number of people with unde-termined citizenship and its efforts to integrate non-citizens. Special attention will be given to the facilita-tion of naturalisation among children with unde-termined citizenship. A new draft Strategy ofIntegration and Social Cohesion in Estonia “LõimuvEesti 2020” was submitted for public consultationin 2014.
The number of asylum seekers has been risingsince 2011, although Estonia has few asylum seekersrelative to other EU countries. In 2013, 100 asylum
applications were made, compared with 80 in 2012.In 2013 many of the applicants for asylum were filedafter they had been apprehended while illegally cross-ing the Estonian-Russian border intending to reachother EU member states. In 2012 more than half of theapplicants were from Georgia while in 2013 Viet Namwas the main origin.
From October 2013, changes to the Act on Grant-ing International Protection to Aliens came into forcewhich allow the possibility of detaining asylumseekers during the application procedure, subject tocourt approval and in specific cases.
In September 2013, amendments to the AliensAct were implemented to simplify residence inEstonia for highly skilled specialists, scientists andstudents. The changes allow family members toaccompany them at entry. Short-term employmentfor specialists, scientists and teachers may be regis-tered within one day under an accelerated procedure.Top specialists are those who have acquired appro-priate professional training in any field, with acontract with an Estonian-registered employer forprofessional work at twice the Estonian annualaverage gross monthly salary.
Students may now work while studying, with nolimitation, although to keep their residence permitthey must continue studying full time. A six-monthextension is possible after graduation to seekwork. For international students with an EstonianBachelors, Masters or Doctoral degree, no salarythreshold or labour market test applies to applicationsfor a residence permit for employment.
Other changes to the Aliens Act in 2013 make itpossible for a foreigner to arrive in Estonia with a visaand start the residence permit application processwhile already working or studying in the country.
Under an amendment to the Aliens Act, foreignnationals granted a residence permit or whoseresidence permit has been extended enter a welcomeprogramme, to be established by a regulation of theMinister of the Interior. The objective of the welcomeprogramme is to support the integration of new arriv-als by acquainting them with the functioning of thestate and society, organisation of daily life, working,studying and family life, and to promote acquiringbasic Estonian language skills. The programme will beimplemented in 2015.
For further information
www.politsei.ee/en/.
INTERNATIONAL MIGRATION OUTLOOK 2014 © OECD 2014250

4. COUNTRY NOTES: RECENT CHANGES IN MIGRATION MOVEMENTS AND POLICIES
Recent trends in migrants’ flows and stocksESTONIA
Migration flows (foreigners)2000 2005 2011 2012
Average Level (’000)National definition 2002-06 2007-11 2012
Per 1 000 inhabitantsInflows .. 0.7 1.3 0.8 .. 1.3 1.1Outflows .. 0.5 0.5 0.3 .. 0.4 0.4Migration inflows (foreigners) by type Thousands % distribution
Inflows of top 10 nationalitiesas a % of total inflows of foreigners
Permit based statistics (standardised) 2011 2012 2011 2012Work .. .. .. ..Family (incl. accompanying family) .. .. .. ..Humanitarian .. .. .. ..Free movements .. .. .. ..Others .. .. .. ..Total .. .. .. ..
Temporary migration 2005 2011 2012Average2007-11
ThousandsInternational students .. .. .. ..Trainees .. .. .. ..Working holiday makers .. .. .. ..Seasonal workers .. .. .. ..Intra-company transfers .. .. .. ..Other temporary workers .. .. .. ..
Inflows of asylum seekers 2000 2005 2011 2012Average Level
2002-06 2007-11 2012Per 1 000 inhabitants 0.0 0.0 0.1 0.1 0.0 0.0 77
Components of population growth 2000 2005 2011 2012Average Level (’000)
2002-06 2007-11 2012Per 1 000 inhabitants
Total -3.7 -2.1 0.0 -0.4 -3.3 -0.7 -1Natural increase -3.9 -2.2 0.0 -0.4 -3.4 -0.7 -1Net migration 0.2 0.1 0.0 0.0 0.1 0.1 0
Stocks of immigrants 2000 2005 2011 2012Average Level (’000)
2002-06 2007-11 2012Percentage of the total population
Foreign-born population 18.1 16.9 15.8 .. 17.3 16.2 ..Foreign population 20.8 18.9 16.4 16.3 19.1 16.6 217
Naturalisations 2000 2005 2011 2012Average Level
2002-06 2007-11 2012Percentage of the foreign population .. 2.7 0.7 0.6 2.0 1.0 1 339
Labour market outcomes 2000 2005 2011 2012Average
2002-06 2007-11Employment/population ratio
Native-born men 62.0 65.7 67.3 69.5 66.4 67.3Foreign-born men 70.2 72.9 69.6 70.7 71.7 71.6Native-born women 56.9 61.3 63.4 64.7 60.1 63.4Foreign-born women 57.4 65.2 58.8 63.6 62.9 65.1
Unemployment rateNative-born men 15.3 8.9 13.1 10.8 9.4 12.2Foreign-born men 13.4 9.3 15.6 14.9 11.4 13.5Native-born women 11.8 6.3 11.2 9.2 7.6 8.9Foreign-born women 11.1 11.7 18.1 11.4 11.4 12.6
Macroeconomic indicators 2000 2005 2011 2012Average Level
2002-06 2007-11 2012Annual growth in %
Real GDP 10.0 8.9 9.6 3.9 7.9 0.3GDP/capita (level in US dollars) 10.5 9.1 9.5 4.0 8.3 0.3 23 783Employment (level in thousands) -1.2 2.2 6.8 2.5 2.3 -1.0 625
Percentage of the labour forceUnemployment 13.6 7.9 12.4 10.1 8.8 10.7
Notes and sources are at the end of the chapter.1 2 http://dx.doi.org/10.1787/888933158095
0 5 10 15 20 25
Estonia
20092004-08 annual average
Russian FederationFinlandUkraine
GermanyLatviaChina
SwedenUnited States
ItalyFrance
INTERNATIONAL MIGRATION OUTLOOK 2014 © OECD 2014 251
4. COUNTRY NOTES: RECENT CHANGES IN MIGRATION MOVEMENTS AND POLICIES
FinlandThe number of foreigners living in Finland inSeptember 2013 increased by 6.8% over the previousyear to 205 250, about 3.5% of the population. Thelargest groups were, as in preceeding years, Estonians(43 400), Russians (30 700) and Swedes (8 500). An esti-mated 130 000 foreigners work in Finland, about80 000 permanently. The top foreign nationalitiesworking permanently in Finland are from Estonia,the Russian Federation, Sweden, China, Thailandand Germany. Temporary workers, estimated at50 000, are mainly from Estonia and other EU coun-tries close to Finland. It appears that cross bordercommuting has been increasing.
The number migrating to Finland in 2012 was thelargest since Finland became independent in 1917:31 300 immigrants, 1 800 more than in 2011. Foreignnationals accounted for 23 300, 14% more than theyear before. The main immigrating groups were fromEstonia (6 040) and the Russian Federation (3 050),followed by China (750), Thailand (590) and Iraq (580).Net immigration contributed twice as much to popu-lation increase in 2012 as births, and net migration offoreigners corresponded to 0.4% of the population, arecord level. Statistics for 2013 indicate a further2% rise in migration, to 31 900.
Residence permit applications from individualsoutside EU/EEA-countries fell by 10% from 2011to 2012, to 21 260. Applications in 2013 were at asimilar level. The most common grounds continues tobe family ties, representing 42% of all applicantsin 2012 and constituting most of the increase. Studyaccounted for 28% and employment for 27%. In 2012there were 6 020 applications of foreign students fromoutside the EU/EEA, an increase of 4% on the previousyear. Russians (1 260) and Chinese (850) were the maingroups. Migration from within the EU increased toabout 10 300 thousand in 2012, from 7 100 in 2010.
The number seeking asylum in Finland in 2012(3 130) was similar to the previous year (3 090). In 2013an increase in the early part of the year tapered offand the final figures were 3 230. The largest origincountry by far in 2012 was Iraq (840 applicationsin 2012, 820 in 2013). Refugee status or some otherresidence permit was accorded to 42% of all processedapplicants in 2012.
The Government decided to increase the Syrianrefugee quota for 2014 by 300 persons, to 500. Thisbrings the total standard quota agreed with UNHCR,normally 750, to 1 050 for 2014.
The number of persons found to be illegallypresent in the country grew by approximately 10%during 2012 to 3 620; preliminary statistics for the firstfew months of 2013 indicate that the number contin-ued to increase.
As a result of an amendment to the FinnishNationality Act in 2011, the number of applications forcitizenship increased by 39% in 2012 (7 870 applica-tions). Growth continued in 2013 with 8 640 totalapplications. The number of successful applicationsfrom foreign citizens permanently resident in Finlanddoubled in 2012 to 9 090, the highest figure sinceFinland’s independence.
The new Future of Migration 2020 Strategy wasadopted by the Government in June 2013. As part ofthis, the first overall Review of Integration was publishedin October 2013. The report examines, among otherthings, immigrants’ access to the labour market, par-ticipation in society, housing conditions, income levelsand school dropout rates. The longer an immigrant hasbeen in Finland, the closer his or her living conditionsare to those of the native population. Differencesamong immigrant groups are nevertheless great.
Legislative amendments concerning biometricfeatures in residence permits entered into force on1 January 2012. Fingerprints taken for residencepermit cards will be stored in a national database andthe residence permit card contains a chip in which afacial image and two fingerprints of the cardholderare stored, to create a reliable link between theresidence permit and its holder. At the same time, thelegislative amendments to implement the EU BlueCard Directive relating to highly skilled labour cameinto force. The annual salary threshold for the BlueCard was set at EUR 57 700.
The EU Single Permit Directive was implementedthrough changes in national law and came into force in1 January 2014. The government proposal for amend-ment of the Aliens Act and certain associated acts tocomply with the Schengen Borders Code, the ReturnDirective and the EU Decision on travel documents wasaccepted and the changes came into force in 1.1.2014.
For further information
www.migri.fiwww.intermin.fiwww.stat.fi.
INTERNATIONAL MIGRATION OUTLOOK 2014 © OECD 2014252

4. COUNTRY NOTES: RECENT CHANGES IN MIGRATION MOVEMENTS AND POLICIES
Recent trends in migrants’ flows and stocksFINLAND
Migration flows (foreigners)2000 2005 2011 2012
Average Level (’000)National definition 2002-06 2007-11 2012
Per 1 000 inhabitantsInflows 1.8 2.4 3.8 4.3 2.2 3.5 23.3Outflows 0.8 0.5 0.6 0.8 0.6 0.7 4.2Migration inflows (foreigners) by type Thousands % distribution
Inflows of top 10 nationalitiesas a % of total inflows of foreigners
Permit based statistics (standardised) 2011 2012 2011 2012Work 1.2 1.1 5.6 4.8Family (incl. accompanying family) 7.8 7.1 38.4 30.5Humanitarian 2.2 4.2 11.0 18.0Free movements 8.4 10.3 41.3 44.1Others 0.8 0.6 3.7 2.6Total 20.4 23.3 100.0 100.0
Temporary migration 2005 2011 2012Average2007-11
ThousandsInternational students .. 5.5 5.5 4.6Trainees .. .. .. ..Working holiday makers .. .. .. ..Seasonal workers 12.2 12.0 14.0 12.5Intra-company transfers .. .. .. ..Other temporary workers 6.5 9.0 8.0 10.2
Inflows of asylum seekers 2000 2005 2011 2012Average Level
2002-06 2007-11 2012Per 1 000 inhabitants 0.6 0.7 0.6 0.5 0.6 0.7 2 922
Components of population growth 2000 2005 2011 2012Average Level (’000)
2002-06 2007-11 2012Per 1 000 inhabitants
Total 1.9 3.6 5.0 4.4 3.1 4.6 25Natural increase 1.5 1.9 1.9 1.3 1.7 1.9 7Net migration 0.4 1.7 3.0 3.1 1.4 2.7 17
Stocks of immigrants 2000 2005 2011 2012Average Level (’000)
2002-06 2007-11 2012Percentage of the total population
Foreign-born population 2.6 3.4 4.9 5.3 3.2 4.4 285Foreign population 1.8 2.2 3.4 3.6 2.1 2.9 196
Naturalisations 2000 2005 2011 2012Average Level
2002-06 2007-11 2012Percentage of the foreign population 3.4 5.2 2.7 5.0 4.4 3.1 9 087
Labour market outcomes 2000 2005 2011 2012Average
2002-06 2007-11Employment/population ratio
Native-born men 71.2 71.2 70.9 70.4 71.0 70.9Foreign-born men 49.9 62.0 65.7 69.9 65.1 68.6Native-born women 65.3 67.9 67.9 68.6 67.7 68.2Foreign-born women 39.0 50.3 58.6 55.9 52.0 59.3
Unemployment rateNative-born men 10.3 9.3 8.3 8.2 9.8 7.7Foreign-born men 36.6 22.4 14.7 14.7 19.6 14.5Native-born women 12.0 9.4 6.9 6.7 9.6 7.0Foreign-born women 21.3 22.7 13.3 17.1 21.4 14.8
Macroeconomic indicators 2000 2005 2011 2012Average Level
2002-06 2007-11 2012Annual growth in %
Real GDP 5.3 2.9 2.8 -1.0 3.1 0.7GDP/capita (level in US dollars) 5.1 2.6 2.3 -1.5 2.8 0.2 38 389Employment (level in thousands) 2.1 1.5 1.1 0.4 0.6 0.3 2 483
Percentage of the labour forceUnemployment 9.8 8.4 7.8 7.7 8.6 7.6
Notes and sources are at the end of the chapter.1 2 http://dx.doi.org/10.1787/888933158106
0 10 205 15 25 300
Finland
20122002-11 annual average
EstoniaRussian Federation
ChinaSweden
AfghanistanThailand
IraqIndia
PolandSomalia
INTERNATIONAL MIGRATION OUTLOOK 2014 © OECD 2014 253

4. COUNTRY NOTES: RECENT CHANGES IN MIGRATION MOVEMENTS AND POLICIES
FranceAfter two years of decline, permanent immigrationto France from outside the EEA and Switzerlandincreased in 2012 to 163 000 persons (an annualincrease of 6% and the highest level since 2006). Theincrease was mainly due to a 7% increase in admis-sions for family reunification. Most third-countrynationals admitted to France for permanent residencein 2012 came from Africa (61%), mainly from Algeria(25 000 persons), Morocco (20 200 persons) andTunisia (12 000 persons). Asia was the second mostimportant region of origin (21%) led by China(7 200 persons) and Turkey (6 100 persons).
Temporary economic immigration to France,which had risen steadily since 2006, dropped in 2012to 3 100 persons (13% lower than in 2011). The inflowof seasonal workers has been stable since 2010, andreached 6 400 persons in 2012.
The number of foreign students admitted forresidence in France dropped in 2012 by 10% to58 900 persons, although figures for 2013 suggest aslight (6%) increase. The main countries of origin of newforeign students in 2012 were China (10 100 persons),Morocco (6 000 persons), United States (3 800 persons),Algeria (3 700 persons), and Brazil (2 700 persons). Thenumber of status changes of foreign students, stablesince 2009, increased by 14% in 2012, and reachedalmost 17 000 cases.
In 2012, 41 000 adults applied for asylum,accompanied by 14 000 minors. The main countries oforigin for asylum seekers were the Democratic Republicof the Congo, the Russian Federation, Sri Lanka, Serbiaor Montenegro, and China. In 2012, residence wasgranted to 12 000 adult foreigners on the grounds ofinternational protection, including 2 000 persons receiv-ing subsidiary protection. Asylum inflows increased by9% in 2013, to 60 100 (minors included).
The number of expulsions from the French terri-tory increased in 2012 by about 9% and reached23 000 cases. Among these, 4 300 cases involvedvoluntary return assistance, almost twice as many asin 2010. A reduction in the financial contribution ledto a decline in the use of voluntary return assistancein 2013.
The number of naturalisations declined in 2012to 96 000 cases, 16% fewer than in 2011. Anticipatedacquisition of nationality by minors accounted for24 000 cases and acquisition by marriage reached22 000 cases. Acquisition of nationality by adminis-trative decision declined to 46 000 cases, likely due totightened eligibility conditions and in particularstricter requirements for language examinations.
A new circular adopted in November 2012 clari-fied the conditions of regularisation for foreigners in
an irregular situation. Temporary residence permitscan also be granted to minors who became adultsafter at least two years of presence in France, toparents of school-attending children after at leastthree years of presence, and to related foreigners in anirregular situation after at least five years of presence.Residence permits for employment can be granted tothose foreigners with five years presence in France,who worked for at least 30 months in the course of theprevious five years on the basis of a work contract or apromise of employment.
In cases of naturalisation on the grounds ofmarriage, applicants must now demonstrate know-ledge of the French language at B1 level. Adherence tothe principles and values of the French society is alsorequired. Successful applicants must sign a charter ofrights and obligations of the French citizen. Furtherchanges adopted in 2012 and 2013 included theintroduction of regional tests administered by civilcommittees for assimilation composed of employeesof the local administration and qualified civil societyrepresentatives.
Recent Parliamentary debates resulted in severalchanges in migration regulations. Immigration ofskilled workers and student mobility were discussedby the Senate in April 2013 and by the NationalAssembly in June 2013. A report on securing the stayof foreign nationals in France was prepared inMay 2013, followed by a parliamentary informationreport including 82 recommendations aimed atfacilitating the stay of elderly foreigners in France.Following these reports, the procedure for renewingresidence permit has been modified. New permits arenow valid from the date of issuance, rather than theexpiration date of the previous permit. Local autho-rities can renew permits for residents over 60 yearsold, or in the case of a second extension of the resi-dence card. Several measures have also been adoptedto simplify and facilitate the mobility of students.
In July 2014, the government proposed a law onimmigration which aims to improve integration, makeFrance more attractive to talents, and combating irre-gular migration. Different permits would be groupedunder a single “talent” category. An asylum law wasalso proposed.
For further information
www.immigration.interieur.gouv.frwww.ofii.fr/www.ofpra.gouv.fr.
INTERNATIONAL MIGRATION OUTLOOK 2014 © OECD 2014254

4. COUNTRY NOTES: RECENT CHANGES IN MIGRATION MOVEMENTS AND POLICIES
Recent trends in migrants’ flows and stocksFRANCE
Migration flows (foreigners)2000 2005 2011 2012
Average Level (’000)National definition 2002-06 2007-11 2012
Per 1 000 inhabitantsInflows 1.6 2.2 2.4 2.6 2.3 2.5 163.4Outflows .. .. .. .. .. .. ..Migration inflows (foreigners) by type Thousands % distribution
Inflows of top 10 nationalitiesas a % of total inflows of foreigners
Permit based statistics (standardised) 2011 2012 2011 2012Work 31.0 31.4 12.9 12.1Family (incl. accompanying family) 91.9 98.7 38.2 38.1Humanitarian 11.6 12.0 4.8 4.6Free movements 85.9 95.4 35.7 36.9Others 20.2 21.4 8.4 8.3Total 240.7 258.9 100.0 100.0
Temporary migration 2005 2011 2012Average2007-11
ThousandsInternational students 46.2 65.1 58.6 56.5Trainees 0.6 0.8 0.8 0.6Working holiday makers .. .. .. ..Seasonal workers 16.2 6.3 6.4 10.0Intra-company transfers 1.0 2.9 2.4 1.3Other temporary workers 6.5 6.2 .. 5.0
Inflows of asylum seekers 2000 2005 2011 2012Average Level
2002-06 2007-11 2012Per 1 000 inhabitants 0.7 0.8 0.8 0.9 0.8 0.7 55 068
Components of population growth 2000 2005 2011 2012Average Level (’000)
2002-06 2007-11 2012Per 1 000 inhabitants
Total 6.9 7.1 5.3 4.4 6.9 5.3 281Natural increase 4.1 4.0 4.0 3.6 4.0 4.1 231Net migration 1.2 1.6 1.3 0.6 1.7 1.2 50
Stocks of immigrants 2000 2005 2011 2012Average Level (’000)
2002-06 2007-11 2012Percentage of the total population
Foreign-born population 10.3 11.3 11.6 .. 11.1 11.6 ..Foreign population .. 5.8 6.2 6.4 .. 6.1 4 036
Naturalisations 2000 2005 2011 2012Average Level
2002-06 2007-11 2012Percentage of the foreign population 4.6 .. 3.0 2.5 .. 3.5 96 088
Labour market outcomes 2000 2005 2011 2012Average
2002-06 2007-11Employment/population ratio
Native-born men 68.4 69.4 68.4 68.3 69.5 68.9Foreign-born men 65.0 67.2 65.5 66.1 66.4 66.6Native-born women 54.9 59.7 61.3 61.4 58.8 61.2Foreign-born women 36.9 48.2 49.8 49.6 47.9 50.3
Unemployment rateNative-born men 8.4 7.5 8.3 8.8 7.4 7.7Foreign-born men 16.9 12.4 14.3 15.7 13.4 13.4Native-born women 12.1 9.0 8.9 9.6 9.3 8.5Foreign-born women 23.8 16.8 16.6 16.3 16.6 14.8
Macroeconomic indicators 2000 2005 2011 2012Average Level
2002-06 2007-11 2012Annual growth in %
Real GDP 3.7 1.8 2.0 0.0 1.7 0.6GDP/capita (level in US dollars) 3.0 1.1 1.5 -0.5 1.0 0.0 36 206Employment (level in thousands) 2.6 0.9 0.2 0.0 0.5 0.6 25 800
Percentage of the labour forceUnemployment 8.2 8.5 8.8 9.4 8.2 8.3
Notes and sources are at the end of the chapter.1 2 http://dx.doi.org/10.1787/888933158115
0 5 10 15 200
France
20122002-11 annual average
AlgeriaMorocco
TunisiaChina
TurkeySenegal
MaliCameroon
Russian FederationDem. Rep. of the Congo
INTERNATIONAL MIGRATION OUTLOOK 2014 © OECD 2014 255

4. COUNTRY NOTES: RECENT CHANGES IN MIGRATION MOVEMENTS AND POLICIES
GermanyIn 2013, net immigration to Germany reached about437 000 persons, which represented a significantincrease compared with previous years (in 2012, itwas 370 000). According to Federal Statistical Officeestimates, approximately 16.3 million persons – or20% of the population of Germany – had a migrantbackground in 2012.
The number of workers from EU28 countriesincreased by 135 000 persons between 2011 and 2012and by 132 000 from 2012 to 2013, representing muchof the total increase of 422 000 persons whichoccurred between 2006 and 2013. The number ofworkers from third countries rose more slowly – by37 000 in 2012 and 21 000 in 2013. At the same time,the number of socially insured and only marginallyemployed workers from the new EU member states(EU8) has been continuously rising since April 2011(prior to unrestricted free movement of workers).While in April 2011 there were 227 000 such workersregistered in Germany, by April 2014 their number hadincreased 110%, to 475 000. The vast majority of theseworkers were Polish nationals. In April 2014, 1.4% ofthe workforce comprised EU8 nationals.
The Federal Employment Agency approved atotal of 60 800 work authorisations for non-EU/EFTAnationals in 2012 and 57 100 in 2013. About half werefor skilled employment.
112 300 persons were naturalised in Germanyin 2012 (about 5 000 more than in 2011), which corres-ponds to a naturalisation rate of 1.5%. The singlelargest country of origin was Turkey (33 200 or 30%),followed by the former Soviet Union (12 000) andformer Yugoslavia (9 600). 18% originated from EUcountries, 23% from Asia and 9% from Africa.
Immigration has contributed to employmentgrowth in Germany, and labour market integration offoreign workers has improved. The number ofyounger foreign employees with tertiary educationalqualification increased substantially in 2011 and theemployment rate of foreign workers aged 20 to 64 witha vocational background increased between 2006and 2012 from 61.6% to 68.7%. Policy efforts now focuson increasing the employment rates of particulargroups (for example, the employment rate of menwith a migration background was 77% in 2012whereas the rate of women was only 60.4 %). Reducingdropout and upskilling the labour force of those witha migrant background is also an objective.
The expected decline in the population of work-ing age adults by 2030 means that policy discussion ofimmigration issues often focuses on securing a skilledworkforce and on migrants’ labour market integra-tion. The Federal Government’s Skilled LabourConcept aims primarily to increase and furtherqualify the national labour force, including persons
with a migration background already living inGermany. On the admission side, recent legal changeshave facilitated immigration by third country nation-als. A working group “Harnessing the foreign work-force potential and fostering a welcoming culture”was set up to develop measures in co-operation withrepresentatives of business, state administration andcivil society to attract qualified foreign workers toGermany and to help them integrate in the workplaceand society.
A new Employment Ordinance (Beschäftigungsver-ordnung) entered into force in July 2013. Among thenew provisions, employers may now recruit third-country nationals who have completed their voca-tional training abroad in certain occupation groupswith a lack of qualified personnel in Germany. Thenew ordinance incorporated previously separate regu-lations governing labour market access of foreigners,uniting the provisions guiding the employment of allthird-country nationals in Germany.
The labour market test by the Federal Employ-ment Agency has been completely waived for univer-sity graduates in many cases, and in some casesapproval from the Federal Employment Agency can bewaived, which accelerates processing times.
According to the Act on Improving the Rights ofPersons Entitled to International Protection and theRights of Foreign Workers, which entered into force inSeptember 2013, foreign family members are nowgranted unrestricted access to the labour market.
Access to the German labour market can gener-ally be granted to four groups of third-country nation-als: university graduates and skilled workers withcertain vocational qualifications who cover the labourmarket needs in occupations requiring a universitydegree or professional formal training; personsentitled to family reunification; persons staying inGermany on humanitarian grounds, on the groundsdefined by international law or political reasons;asylum seekers or persons with tolerated status. TheEmployment Ordinance also provides for a number ofhistorically developed special rules for certainnationals or certain groups of persons, such asacademics and executive managers.
For further information
www.bmas.bund.dewww.bmi.bund.dewww.bamf.dewww.integrationsbeauftragte.dewww.destatis.dewww.anerkennung-in-deutschland.dewww.make-it-in-germany.com.
INTERNATIONAL MIGRATION OUTLOOK 2014 © OECD 2014256

4. COUNTRY NOTES: RECENT CHANGES IN MIGRATION MOVEMENTS AND POLICIES
Recent trends in migrants’ flows and stocksGERMANY
Migration flows (foreigners)2000 2005 2011 2012
Average Level (’000)National definition 2002-06 2007-11 2012
Per 1 000 inhabitantsInflows 7.9 7.0 10.3 11.8 7.3 8.0 965.9Outflows 6.8 5.9 6.6 7.1 6.1 6.6 578.8Migration inflows (foreigners) by type Thousands % distribution
Inflows of top 10 nationalitiesas a % of total inflows of foreigners
Permit based statistics (standardised) 2011 2012 2011 2012Work 26.1 22.1 9.0 5.5Family (incl. accompanying family) 54.0 54.8 18.6 13.7Humanitarian 11.0 18.1 3.8 4.5Free movements 197.5 303.0 67.9 75.8Others 2.1 1.8 0.7 0.5Total 290.8 399.9 100.0 100.0
Temporary migration 2005 2011 2012Average2007-11
ThousandsInternational students 55.8 72.9 79.4 62.5Trainees 2.6 4.9 4.1 4.9Working holiday makers .. .. .. ..Seasonal workers 329.8 167.6 3.5 268.8Intra-company transfers 3.6 7.1 7.2 5.7Other temporary workers 63.6 33.5 24.3 34.3
Inflows of asylum seekers 2000 2005 2011 2012Average Level
2002-06 2007-11 2012Per 1 000 inhabitants 1.0 0.4 0.6 0.8 0.5 0.4 64 539
Components of population growth 2000 2005 2011 2012Average Level (’000)
2002-06 2007-11 2012Per 1 000 inhabitants
Total 1.2 -0.8 -0.6 1.1 0.4 -1.7 92Natural increase -0.9 -1.8 -2.2 -2.3 -1.5 -2.0 -190Net migration 2.0 1.0 1.6 3.4 1.9 0.3 282
Stocks of immigrants 2000 2005 2011 2012Average Level (’000)
2002-06 2007-11 2012Percentage of the total population
Foreign-born population 12.5 12.6 13.1 13.3 .. 12.9 10 918Foreign population 8.9 8.2 8.5 8.8 8.5 8.3 7 214
Naturalisations 2000 2005 2011 2012Average Level
2002-06 2007-11 2012Percentage of the foreign population 2.5 1.7 1.6 1.6 1.9 1.5 112 348
Labour market outcomes 2000 2005 2011 2012Average
2002-06 2007-11Employment/population ratio
Native-born men 73.8 72.2 76.6 77.6 72.2 76.0Foreign-born men 66.3 64.7 76.1 75.9 64.9 72.5Native-born women 59.6 61.5 69.3 69.6 61.2 67.3Foreign-born women 46.6 48.0 58.1 58.3 48.2 54.9
Unemployment rateNative-born men 6.9 10.2 5.9 5.0 9.4 6.8Foreign-born men 12.9 18.2 8.7 8.8 16.7 12.1Native-born women 8.0 10.0 5.2 4.7 9.1 6.6Foreign-born women 12.1 17.2 9.1 8.5 15.0 11.5
Macroeconomic indicators 2000 2005 2011 2012Average Level
2002-06 2007-11 2012Annual growth in %
Real GDP 3.1 0.7 3.3 0.7 1.0 1.3GDP/capita (level in US dollars) 2.9 0.7 3.3 0.5 1.0 1.5 41 098Employment (level in thousands) -5.6 0.8 2.3 1.0 0.2 1.3 39 978
Percentage of the labour forceUnemployment 8.0 11.3 6.0 5.5 10.1 7.4
Notes and sources are at the end of the chapter.1 2 http://dx.doi.org/10.1787/888933158123
0 5 10 15 200
Germany
20122002-11 annual average
PolandRomaniaBulgariaHungary
ItalyGreeceTurkeySerbiaSpainChina
INTERNATIONAL MIGRATION OUTLOOK 2014 © OECD 2014 257

4. COUNTRY NOTES: RECENT CHANGES IN MIGRATION MOVEMENTS AND POLICIES
GreeceGreece experienced its fourth year of deep eco-nomic recession in 2012. The situation of immigrantsis an issue of concern, notably the high unemploy-ment among immigrant workers. Unemployment forimmigrant men stood at 34.5% in 2012, more than14 percentage points higher than for native-born men.For migrant women, unemployment of 32.6% wasabout five points higher than for native-born women.Migration flows have fallen substantially from theirpre-crisis levels.
According to the 2011 Census, there were912 000 foreign residents in Greece. 713 000 werethird-country nationals and 199 000 EU nationals,accounting respectively for 6.6% and 1.8% of total pop-ulation. Foreign residents were primarily Albanians(480 000), Bulgarians (75 000), and Romanians (46 000).Interior Ministry data on residence permits captureonly a part of the foreign population: at the endof 2012 there were 440 000 residence permit holders inthe country. Permit data indicate that the stock oflegal immigrants has been declining, since there were600 000 resident permit holders three years earlier, atthe end of 2009. However, at the end of 2013, therewere 500 000 permit holders, an increase partially dueto faster processing of pending applications.
Greece is one of the main points of entry into theEU and is exposed to irregular migration and inflowsof asylum seekers from Asia and Africa. During theperiod 2009-13, most irregular migrants enteredthrough the Greek-Turkish land border across theEvros river in the north-eastern part of Greece, andacross the maritime corridor in the Aegean. The latterchannel grew in the second half of 2013. Overall, from99 000 irregular migrants apprehended at the borderin 2011, the number fell to 77 000 in 2012 and 43 000in 2013. The top five nationalities of those appre-hended were Albania, Syria, Afghanistan, Pakistan,and Bangladesh. While few Syrians apply for asylum,their recognition rate is very high.
The Greek authorities have been scaling up migra-tion control efforts. In 2012, the Greek Ministry ofPublic Order and Citizen Protection and the Inter-national Organisation for Migration (IOM) concluded anagreement for voluntary repatriation of 7 000 migrants,with the support of the European Return Fund.Since 2012, the Ministry has been conducting operation“Xenios Zeus” aimed at apprehending undocumentedmigrants, mainly targeting public spaces such as urbancentres and ports where immigrants gather. Of65 000 persons checked during the second half of 2012,more than 4 100 were detained.
Following the reform of naturalisation proce-dures in 2010, foreigners’ access to Greek citizenshipwas facilitated and, as a result, 13 500 foreigners werenaturalised in 2011, 14 600 in 2012 and 20 500 in 2013.
The poor economic situation and the challengingmigration situation have raised concern over socialtension, possible xenophobic violence and anti-immigrant sentiment.
At the policy level, the “Immigration and SocialIntegration Code” was approved by Parliament inApril 2014, regulating the entry, stay and socialintegration of third country nationals in Greece(EU nationals, refugees and asylum seekers are notcovered in the Code). The law codifies previous legis-lation and introduces new elements to rationalise theinstitutional framework and simplify regulations.
The Code establishes seven categories of resi-dence permits by purpose of stay: work or pro-fessional; temporary (a national visa providesauthorisation to stay); humanitarian or exceptional;study, research, training or voluntary work; victims oftrafficking; family reunification; and long duration.The Code compiles previous legislation transposingEU directives. It further consolidates the entry andresidence policy for foreign real estate owners andinvestors.
The Code also allows residence permit renewalfor settled third country nationals who have eitherlost their legal status or whose unemployment spellspreviously made them ineligible to renew their workpermits.
Second-generation migrants (legal residentseither born in Greece or who have completed sixgrades of Greek school before age 21) will now beeligible for a special five-year renewable permit. Ifthey fulfill the above conditions except for legalresidence, a transitional one-year permit may begranted.
Additional controls of undocumented stayinclude a prohibition for state employees (including inhospitals) to provide services to irregular migrants(except emergency situations and minors), andsanctions for those who employ or provide accommo-dation to irregular migrants.
In June 2014, a joint ministerial decision estab-lished categories of third country nationals who maybe granted a residence permit for humanitarianreasons, including failed asylum seekers who cannotbe returned to their home countries, due to objectivereasons certified by the competent Authority.
For further information
www.statistics.grwww.ypes.grwww.ypakp.grwww.mopocp.gov.grwww.astynomia.gr.
INTERNATIONAL MIGRATION OUTLOOK 2014 © OECD 2014258

4. COUNTRY NOTES: RECENT CHANGES IN MIGRATION MOVEMENTS AND POLICIES
Recent trends in migrants’ flows and stocksGREECE
Migration flows (foreigners)2000 2005 2011 2012
Average Level (’000)National definition 2002-06 2007-11 2012
Per 1 000 inhabitantsInflows .. 5.9 2.1 1.6 .. 3.4 17.7Outflows .. .. .. .. .. .. ..Migration inflows (foreigners) by type Thousands % distribution
Inflows of top 10 nationalitiesas a % of total inflows of foreigners
Permit based statistics (standardised) 2011 2012 2011 2012Work .. .. .. ..Family (incl. accompanying family) .. .. .. ..Humanitarian .. .. .. ..Free movements .. .. .. ..Others .. .. .. ..Total .. .. .. ..
Temporary migration 2005 2011 2012Average2007-11
ThousandsInternational students .. .. .. ..Trainees .. .. .. ..Working holiday makers .. .. .. ..Seasonal workers .. .. .. ..Intra-company transfers .. .. .. ..Other temporary workers .. .. .. ..
Inflows of asylum seekers 2000 2005 2011 2012Average Level
2002-06 2007-11 2012Per 1 000 inhabitants 0.3 0.8 0.8 0.9 0.7 1.4 9 577
Components of population growth 2000 2005 2011 2012Average Level (’000)
2002-06 2007-11 2012Per 1 000 inhabitants
Total 2.5 3.8 0.4 -1.8 3.5 3.3 -20Natural increase -0.2 0.2 0.5 -0.4 0.0 0.6 -5Net migration 2.7 3.6 -0.1 -1.3 3.5 2.7 -15
Stocks of immigrants 2000 2005 2011 2012Average Level (’000)
2002-06 2007-11 2012Percentage of the total population
Foreign-born population .. .. 6.7 6.6 .. .. 730Foreign population 2.8 5.0 6.8 6.9 4.6 6.7 768
Naturalisations 2000 2005 2011 2012Average Level
2002-06 2007-11 2012Percentage of the foreign population .. .. 2.4 2.9 .. .. 21 737
Labour market outcomes 2000 2005 2011 2012Average
2002-06 2007-11Employment/population ratio
Native-born men 71.3 73.5 65.5 60.9 73.1 71.3Foreign-born men 78.1 82.6 70.0 58.4 82.7 79.1Native-born women 41.6 45.7 44.9 41.9 45.0 47.5Foreign-born women 45.0 50.2 47.0 41.7 49.2 49.7
Unemployment rateNative-born men 7.5 6.2 14.4 20.1 6.2 8.1Foreign-born men 9.5 6.7 21.5 34.5 6.5 11.8Native-born women 17.0 15.4 21.4 27.8 14.8 15.0Foreign-born women 21.4 15.6 23.2 32.6 16.9 16.6
Macroeconomic indicators 2000 2005 2011 2012Average Level
2002-06 2007-11 2012Annual growth in %
Real GDP 4.5 2.3 -7.1 -7.0 4.3 -2.4GDP/capita (level in US dollars) 4.1 2.0 -6.9 -6.7 4.0 -2.4 25 475Employment (level in thousands) 1.4 1.3 -6.8 -8.0 1.7 -1.6 3 763
Percentage of the labour forceUnemployment 11.4 9.8 17.7 24.2 9.8 11.1
Notes and sources are at the end of the chapter.1 2 http://dx.doi.org/10.1787/888933158139
0 20 40 60 80
Greece
Albania
Russian Federation
Egypt
Ukraine
India
Georgia
Philippines
20112005-10 annual average
INTERNATIONAL MIGRATION OUTLOOK 2014 © OECD 2014 259
4. COUNTRY NOTES: RECENT CHANGES IN MIGRATION MOVEMENTS AND POLICIES
HungaryHungary has gradually become a destinationcountry for international migrants, as well as a transitcountry for migration flows, mainly in the East-to-Westmigration corridor, although flows remain stable andlimited. A substantial share of permanent immigrationto Hungary is due to the resettlement of ethnicHungarians from neighbouring countries, in particular,from Romania, Ukraine, the Slovak Republic andSerbia.
According to data of the Central Statistical Office,the foreign population in Hungary on 31 December 2012was 141 400 persons, comprising 1.4% of the total popu-lation. This is less than the pre-2011 Census estimate of2%. About 40% of the foreign population (more than58 000 persons) are citizens of neighbouring countries:Romania (25%), Ukraine (8%), Serbia (3%) and theSlovak Republic (5%). Other sizeable groups of foreignnationals in Hungary are Germans (12%) and Chinese(8%). More than 40% of the foreign population lives inthe capital Budapest.
As a result of the simplified naturalisation processintroduced in January 2011 for ethnic Hungarians,some 550 000 persons acquired Hungarian citizenship,although most have not moved to Hungary. Under thegeneral naturalisation procedure, 870 persons receivedHungarian citizenship in 2012 (45% from Asia,25% from non-EU Europe, 15% from the EU and 10%from Africa).
Issuance of new work permits and registrationsfor employment purposes has declined recently,although employment remains the main purpose ofstay of foreigners in Hungary. Both in years 2012and 2013 nearly 19 000 new foreign workers arrived toHungary. Among them around 11 000 third-countrynationals (mainly nationals of China, Viet Nam,Kosovo, Ukraine and Serbia) were employed on thebasis of work permits. In addition around 8 000 newworkers were employed on the basis of registrations(mainly from Romania, the Slovak Republic, Germanyand the United Kingdom). In recent years, the numberof agricultural seasonal workers decreased radically:to only 170 in 2012 and, in 2013, only 280 seasonalwork permits were issued.
The employment rate of immigrants is some-what higher than that of nationals. According toLabour Force Survey data, the employment rate of theforeign-born was 73.8% for men and 59.9% for women,respectively 11.5 and 8 percentage points higher thanfor the Hungarian-born. Labour emigration remainsan issue of concern. Hungarian emigration to EUcountries (mainly to Germany, Austria and theUnited Kingdom) has recently been growing. Labouremigration appears to be most significant amongyounger workers and among health professionals.
The EU Blue Card Directive, implemented inHungary in August 2011, has seen limited take-up: onlytwo Blue Cards were issued annually in 2012 and 2013.While the employment regime for foreigners did notsubstantially change, the transposition of the EU SinglePermit Directive resulted in a simplified process forissuance of a joint residence and work permit, as ofJanuary 2014.
In October 2013 the Hungarian Governmentapproved a new Migration Strategy for 2014-20. Thestrategy provides an overview and outlook of theHungarian migration situation and sets concrete goalsin the fields of visa policy, intra-EU migration andthird-country migration, illegal migration, inter-national protection and integration issues. TheMigration Strategy also calls for the developmentof an Integration Strategy. Many of the plannedmeasures are supposed to be implemented with thesupport of the Asylum, Migration and IntegrationFund of the European Union
In 2013 Hungary recorded a dramatic increase ofasylum seekers, who mostly arrived at the Southernborder. In 2013 18 900 persons applied for asylum inHungary compared with 2 200 in 2012. Most of them(72.6%) arrived from Kosovo, Pakistan, Afghanistan,Algeria and Syria.
In order to handle the increase in asylum seekers,several administrative changes were introducedincluding the transformation of the organisationalsystem. Capacity was expanded through developmentof reception facilities (e.g. in Vámosszabadi), newtemporary camps, and increases in the number ofsocial workers in reception centres.
A refugee integration system was introduced inJanuary 2014, which aims to better integrate refugeesand beneficiaries of subsidiary protection. Theintegration process is based on individual integrationcontracts that involve a tailor-made “integrationpackage” stipulating a set of rights, obligations andsupport measures (including language training,employment and housing support, etc.). Local muni-cipalities play an essential role in the integrationactivities and follow-up processes.
Hungary is one of the main transit countries ofillegal migration on land from the Western Balkanstowards the Schengen area. As many irregular migrantsare victims of human trafficking, Hungarian authoritieshave increased co-operation with several WesternBalkan and EU countries (primarily with Austria andSerbia) and agencies (FRONTEX, EUROPOL).
For further information
www.kormany.hu/hu/belugyminiszteriumwww.bmbah.hu.
INTERNATIONAL MIGRATION OUTLOOK 2014 © OECD 2014260

4. COUNTRY NOTES: RECENT CHANGES IN MIGRATION MOVEMENTS AND POLICIES
Recent trends in migrants’ flows and stocksHUNGARY
Migration flows (foreigners)2000 2005 2011 2012
Average Level (’000)National definition 2002-06 2007-11 2012
Per 1 000 inhabitantsInflows 2.0 2.5 2.3 2.1 2.2 2.6 20.3Outflows 0.2 0.3 0.3 1.0 0.3 0.5 9.9Migration inflows (foreigners) by type Thousands % distribution
Inflows of top 10 nationalitiesas a % of total inflows of foreigners
Permit based statistics (standardised) 2011 2012 2011 2012Work .. .. .. ..Family (incl. accompanying family) .. .. .. ..Humanitarian .. .. .. ..Free movements .. .. .. ..Others .. .. .. ..Total .. .. .. ..
Temporary migration 2005 2011 2012Average2007-11
ThousandsInternational students .. .. .. ..Trainees .. .. .. ..Working holiday makers .. .. .. ..Seasonal workers .. .. .. ..Intra-company transfers .. .. .. ..Other temporary workers .. .. .. ..
Inflows of asylum seekers 2000 2005 2011 2012Average Level
2002-06 2007-11 2012Per 1 000 inhabitants 0.8 0.2 0.2 0.2 0.3 0.3 2 157
Components of population growth 2000 2005 2011 2012Average Level (’000)
2002-06 2007-11 2012Per 1 000 inhabitants
Total -2.2 -2.2 -2.4 -2.6 -2.2 -2.1 -26Natural increase -3.7 -3.9 -4.1 -4.0 -3.7 -3.6 -40Net migration 1.7 1.7 1.8 1.4 1.5 1.6 14
Stocks of immigrants 2000 2005 2011 2012Average Level (’000)
2002-06 2007-11 2012Percentage of the total population
Foreign-born population 2.9 3.3 4.8 4.3 3.2 4.2 424Foreign population 1.1 1.5 1.4 1.4 1.4 1.8 141
Naturalisations 2000 2005 2011 2012Average Level
2002-06 2007-11 2012Percentage of the foreign population 4.9 6.9 9.8 12.8 4.2 5.9 18 379
Labour market outcomes 2000 2005 2011 2012Average
2002-06 2007-11Employment/population ratio
Native-born men 62.6 63.0 61.0 62.3 63.1 61.8Foreign-born men 69.4 72.3 71.1 73.8 72.8 72.2Native-born women 49.4 50.9 50.5 51.9 50.6 50.4Foreign-born women 49.8 54.3 54.7 59.9 51.4 58.3
Unemployment rateNative-born men 7.3 7.1 11.1 11.3 6.5 9.6Foreign-born men 3.5 3.0 8.9 9.9 2.9 6.9Native-born women 5.8 7.4 11.0 10.7 6.3 9.5Foreign-born women 4.8 6.4 10.1 8.0 6.8 7.9
Macroeconomic indicators 2000 2005 2011 2012Average Level
2002-06 2007-11 2012Annual growth in %
Real GDP 4.2 4.0 1.6 -1.7 4.2 -0.6GDP/capita (level in US dollars) 4.5 4.2 1.9 -1.2 4.4 -0.4 22 190Employment (level in thousands) 2.1 0.0 0.8 1.7 0.3 -0.6 3 877
Percentage of the labour forceUnemployment 6.4 7.2 10.9 11.0 6.5 9.5
Notes and sources are at the end of the chapter.1 2 http://dx.doi.org/10.1787/888933158149
0 10 20 30 400
Hungary
20122002-11 annual average
RomaniaGermany
ChinaUnited States
Slovak RepublicUkraine
SerbiaTurkey
Russian FederationAustria
INTERNATIONAL MIGRATION OUTLOOK 2014 © OECD 2014 261

4. COUNTRY NOTES: RECENT CHANGES IN MIGRATION MOVEMENTS AND POLICIES
IrelandOverall immigration registration permissionsremained largely stable in 2012 with 157 800 certifi-cates issued. The total number of foreign residents inIreland rose slightly to 554 500 in 2013, with the singlelargest group of non-nationals from the EU12.
Migration in Ireland continued to be affected bythe economic crisis, although with signs of a weakrecovery. In the first quarter of 2013, the unemploy-ment rate was 17.0% among non-Irish nationals and13.1% among Irish nationals. In 2012-13 net migrationremained similar to 2011 levels at -33 100. Inwardmigration increased slightly to almost 56 000 in thetwelve months to April 2013, after declining since2007-08. The share of immigrants from the EU12 fellsharply, from 40 to 21%. The share of returning Irishimmigrants was at its lowest level in decades (28%)in 2012-13.
Emigration increased in the 12 months toApril 2013 to over 89 000, mainly to the UnitedKingdom, Australia, the United States and Canada.Most were aged 15-44 but there was some increase inthe numbers of children aged less than 14 years,suggesting more family units emigrating. In 2012-13,emigration of Irish nationals increased sharply (toover 50 000) – over half of all emigration. Citizens ofthe EU12 accounted for about 16% of all outflows.
Personal Public Service Numbers (national insur-ance) issued to foreigners, over 227 000 in 2006, fell to73 300 in 2012 but increased to 85 600 in 2013. Theoverall number of employment permits fell byabout 20% year-on-year in 2012, to 4 000, of which1 100 renewals. There were steady but slow increasesin Green Cards, intra-corporate transfers and trainingpermits. A total of 4 800 persons changed statusduring 2012, mainly from an education status.In 2013, there were more new work permits issued(3 000) but fewer renewals (900).
A decision to end the transitional arrangementson access to the labour market for Romanian andBulgarian nationals was announced in July 2012, withapplication retrospectively from January 2012.Between 2011 and 2013, issue of PPSNs to Bulgariansincreased threefold to 900, those of Romanians twofoldto 7 700; in contrast those to Poles increased by 14%.
Some 132 400 visa applications were submittedto Irish authorities during 2012, mostly related toentry visas (88 300) and involving nationals ofIndia, the Russian Federation, China, Nigeria andSaudi Arabia. During 2012, 560 persons were granted“leave to remain” and 490 persons were granted LongTerm Residency during the year.
A total of 16 800 first permits were issued tonon-EEA national students for education reasons
during 2012, mainly to citizens of Brazil, theUnited States, China, Korea and Malaysia. TheEducation in Ireland campaign was rolled out in anumber of markets including the United States, Chinaand the Russian Federation.
There were 960 applications for asylum in Irelandin 2012, a decrease of a quarter on the 2011 figure.Trends for 2013 show similar figures. The refugeerecognition rate in 2012 was 6.6%. In addition, therewere 30 grants for subsidiary protection (out of500 applications) and a further 40 persons arrived forresettlement purposes.
Some 20 000 grants of citizenship were decidedin 2012, mainly nationals of Bangladesh, China, India,Moldova and Nigeria.
The Qualifications and Quality Assurance (Educationand Training) Act 2012 was enacted in 2012 and Qualityand Qualifications Ireland was subsequently estab-lished in November of the some year. It provides forthe establishment of a single merged accreditationbody instead of four as previously.
The Criminal Justice (Female Genital Mutilation)Act 2012 commenced on 20 September 2012 andprohibits female genital mutilation and relatedoffences (including an extraterritorial aspect). TheCriminal Law (Human Trafficking) (Amendment) Act 2013came into force in August 2013 and covers traffickingfor the purposes of forced begging as well as incorpo-rating the definition of forced labour in the Inter-national Labour Organisation Convention No. 29 onForced Labour (1930).
In April 2013, changes were introduced to facili-tate access by skilled workers to the labour marketincluding: broadening the Highly Skilled OccupationsList, reducing the labour market needs test from eightto two weeks; and allowing certain categories ofnon-EEA immigration permission holders to apply fora permit whilst already legally residing in Irelandshould they be offered employment in an occupationincluded in the Highly Skilled Occupations List.
Suspected marriages of convenience continued toattract much debate during 2012 with officials asked todraft amendments dealing with immigration-relatedmarriages of convenience and sham marriages in arepublished immigration Bill.
For further information
www.inis.gov.iewww.entemp.ie/labour/workpermitswww.ria.gov.ie.
INTERNATIONAL MIGRATION OUTLOOK 2014 © OECD 2014262

4. COUNTRY NOTES: RECENT CHANGES IN MIGRATION MOVEMENTS AND POLICIES
Recent trends in migrants’ flows and stocksIRELAND
Migration flows (foreigners)2000 2005 2011 2012
Average Level (’000)National definition 2002-06 2007-11 2012
Per 1 000 inhabitantsInflows 7.3 15.9 7.4 7.0 13.5 14.3 32.1Outflows .. .. 8.4 8.9 .. 9.0 40.6Migration inflows (foreigners) by type Thousands % distributionPermit based statistics (standardised) 2011 2012 2011 2012Work 2.6 2.6 7.7 8.0Family (incl. accompanying family) 16.5 9.6 48.9 29.9Humanitarian 0.1 0.1 0.4 0.3Free movements 14.5 19.8 43.0 61.7Others .. .. .. ..Total 33.7 32.1 100.0 100.0
Temporary migration 2005 2011 2012Average2007-11
ThousandsInternational students .. 4.7 .. ..Trainees .. .. .. ..Working holiday makers .. .. .. ..Seasonal workers .. .. .. ..Intra-company transfers .. .. .. ..Other temporary workers .. .. .. ..
Inflows of asylum seekers 2000 2005 2011 2012Average Level
2002-06 2007-11 2012Per 1 000 inhabitants 2.9 1.0 0.3 0.2 1.6 0.6 1 104
Components of population growth 2000 2005 2011 2012Average Level (’000)
2002-06 2007-11 2012Per 1 000 inhabitants
Total 14.5 23.2 2.9 2.6 18.7 12.6 12Natural increase 6.1 8.2 10.4 10.0 7.9 10.1 46Net migration 8.4 15.0 -7.5 -7.3 10.7 2.5 -34
Stocks of immigrants 2000 2005 2011 2012Average Level (’000)
2002-06 2007-11 2012Percentage of the total population
Foreign-born population 8.6 12.5 16.4 .. 11.7 16.6 ..Foreign population .. .. 11.7 12.0 .. 12.4 550
Naturalisations 2000 2005 2011 2012Average Level
2002-06 2007-11 2012Percentage of the foreign population .. .. .. 4.7 .. 1.2 25 039
Labour market outcomes 2000 2005 2011 2012Average
2002-06 2007-11Employment/population ratio
Native-born men 75.8 75.8 62.3 62.3 75.5 68.5Foreign-born men 75.2 78.9 63.9 64.2 77.2 71.6Native-born women 53.1 58.0 55.4 55.4 56.6 57.8Foreign-born women 54.9 57.7 54.1 53.9 56.6 57.8
Unemployment rateNative-born men 4.4 4.5 17.8 17.8 4.6 11.9Foreign-born men 5.5 5.9 19.8 19.4 6.1 14.1Native-born women 4.1 3.5 10.0 10.1 3.7 6.8Foreign-born women 6.1 6.0 14.3 14.8 5.8 10.5
Macroeconomic indicators 2000 2005 2011 2012Average Level
2002-06 2007-11 2012Annual growth in %
Real GDP 9.2 6.1 2.2 0.2 5.0 -0.5GDP/capita (level in US dollars) 7.8 3.7 1.8 -0.1 2.9 -1.9 42 941Employment (level in thousands) 4.9 4.7 -1.8 -0.6 3.2 -1.9 1 838
Percentage of the labour forceUnemployment 4.3 4.3 14.6 14.7 4.5 10.2
Notes and sources are at the end of the chapter.1 2 http://dx.doi.org/10.1787/888933158158
INTERNATIONAL MIGRATION OUTLOOK 2014 © OECD 2014 263

4. COUNTRY NOTES: RECENT CHANGES IN MIGRATION MOVEMENTS AND POLICIES
IsraelIsrael identifies two major categories of foreignerswho may legally reside in Israel: immigrants withJewish origin or ties, who may immigrate perma-nently to Israel under the Law of Return, as well asfamily members of nationals, and temporary foreignworkers who enter Israel legally for limited periodsunder a work permit.
In 2013, 16 900 people immigrated to Israel underthe Law of Return (excluding returning citizens andresidents), an increase of 2% over the previous year.The main countries from which immigrants arrivedwere the Russian Federation (24%), France (17%),United States (13%), Ukraine (11%) and Ethiopia (8%).There was a sharp increase (76%) in the number ofimmigrants from France. In 2014, statistics for thefirst trimester show continued increase in immi-gration from France and from Ukraine. In August 2013the Central Bureau of Statistics estimated thatbetween 546 000 and 578 000 Israeli citizens (bothIsraeli and foreign born) were living abroad.
Palestinian workers in Israel are admitted as daylabourers on a permit basis. Of 46 800 Palestinianseligible for a permit to work in Israel, 41 800 wereemployed in September 2013, mainly in construction(64.5%), agriculture (7.6%) and industry (5.2%). Afurther 7 500 hold a permit for seasonal work inagriculture.
The total population of foreign nationals in Israelin June 2013 was 202 000. Most were temporaryresidents, asylum seekers or overstayers.
The population of foreign nationals who enteredIsrael under a work permit stood at 86 700 at the endof 2013, up 1.6% on the year before. 15 400 had expiredpermits. In 2013, care workers accounted for 57% ofvalid permits, agriculture 31% and construction 8%.The main origin countries of those holding workpermits in 2013 were Thailand (30%), Philippines(19.7%), the former USSR (14%), India (10.5%) andSri Lanka (6.5%). In 2012, the number of Thai workerssignificantly decreased (down 60%), those from theformer Soviet Union rose by a third, Bulgariannumbers rose sharply thanks to implementation of abilateral agreement within the construction sector.Overall, in contrast to 2009-11, in 2012 more workersarrived from Europe and fewer from Asia.
The population of foreigners who entered thecountry legally on a tourist visa but remained illegallyafter their visa expired was estimated at 93 000 inDecember 2012, of which more than half were fromformer Soviet Union countries.
An additional group of entrants are illegal border-crossers. During 2012 entries decreased from anaverage of 1 500 a month to under 100, owing to arange of enforcement measures such as long-termdetention, stricter border control and the building ofa fence along the Egyptian border. About two-thirdsof illegal border crossers are Eritreans, and a quarterSudanese. Israel does not deport to these countries.Instead of lodging asylum claims, most receive aform of temporary protection status, and less than1% refugee status. Assisted repatriation involvedabout 2 600 individuals in 2013, and 53 000 were inIsrael at the end of 2013.
No major new legislation was introducedin 2012-13 but various agreements were reached. Anagreement with Moldova for the recruitment ofconstruction workers came into operation inAugust 2013. Amendments during 2012-13 to previouslegislation were introduced mainly related to prevent-ing illegal border crossing.
In the course of 2012-13 the government tooksteps to restrict the recruitment of foreign careworkers, resulting in a reversal of the trend of increas-ing the number of holders of permits to employ a for-eign worker and to admit more workers . Inconsequence, due to the growing shortage of foreigncare givers, the government appointed a public com-mittee to examine the procedure of bringing new for-eign care workers from abroad.
Employment of foreign workers in construction issubject to a ceiling. This ceiling has been set at 8 000since 2009 and was supposed to be lowered from 2014to favour Israeli employment in the sector. The Israeligovernment requires new recruits to come throughbilateral agreements. Only two countries have so farsigned such agreements, and training and selectionhave begun only gradually, so the number of labourmigrants legally employed in the construction sectorhas fallen to 5 700 in 2013. Despite growing employ-ment of Israelis and some subsidised training andemployment programmes for Israelis in the sector,rising home prices have placed pressure on the gov-ernment to raise the ceiling, and in June 2014 a policyreversal led to a planned increase in the ceiling to15 000 by mid-2019.
For further informationwww.piba.gov.ilwww.cbs.gov.ilwww.moia.gov.il.
The statistical data for Israel are supplied by and under the responsibility of the relevant Israeli authorities. The use ofsuch data by the OECD is without prejudice to the status of the Golan Heights, East Jerusalem and Israeli settlements inthe West Bank under the terms of international law.
INTERNATIONAL MIGRATION OUTLOOK 2014 © OECD 2014264

4. COUNTRY NOTES: RECENT CHANGES IN MIGRATION MOVEMENTS AND POLICIES
Recent trends in migrants’ flows and stocksISRAEL
Migration flows (foreigners)2000 2005 2011 2012
Average Level (’000)National definition 2002-06 2007-11 2012
Per 1 000 inhabitantsInflows 9.6 3.1 2.2 2.1 3.5 2.1 16.6Outflows .. .. .. .. .. .. ..Migration inflows (foreigners) by type Thousands % distribution
Inflows of top 10 nationalitiesas a % of total inflows of foreigners
Permit based statistics (standardised) 2011 2012 2011 2012Work .. .. .. ..Family (incl. accompanying family) .. .. .. ..Humanitarian .. .. .. ..Free movements .. .. .. ..Others .. .. .. ..Total .. .. .. ..
Temporary migration 2005 2011 2012Average2007-11
ThousandsInternational students .. .. .. ..Trainees .. .. .. ..Working holiday makers .. .. .. ..Seasonal workers .. .. .. ..Intra-company transfers .. .. .. ..Other temporary workers .. .. .. ..
Inflows of asylum seekers 2000 2005 2011 2012Average Level
2002-06 2007-11 2012Per 1 000 inhabitants 1.0 0.1 0.7 0.3 .. 0.6 1 999
Components of population growth 2000 2005 2011 2012Average Level (’000)
2002-06 2007-11 2012Per 1 000 inhabitants
Total 37.4 28.8 .. .. 29.2 .. ..Natural increase 27.7 26.4 .. .. 26.9 .. ..Net migration 9.8 2.4 .. .. 2.3 .. ..
Stocks of immigrants 2000 2005 2011 2012Average Level (’000)
2002-06 2007-11 2012Percentage of the total population
Foreign-born population 31.1 28.1 23.9 23.2 28.8 25.2 1 835Foreign population .. .. .. .. .. .. ..
Naturalisations 2000 2005 2011 2012Average Level
2002-06 2007-11 2012Percentage of the foreign population .. .. .. .. .. .. ..
Labour market outcomes 2000 2005 2011 2012Average
2002-06 2007-11Employment/population ratio
Native-born men 59.0 59.2 62.3 .. 58.4 61.7Foreign-born men 66.4 66.1 70.8 .. 65.8 69.2Native-born women 51.2 51.4 55.9 .. 50.7 54.8Foreign-born women 51.2 55.5 61.4 .. 53.9 59.7
Unemployment rateNative-born men 8.3 9.0 5.8 .. 9.7 6.7Foreign-born men 8.9 8.2 5.6 .. 8.7 6.4Native-born women 9.3 10.4 6.2 .. 11.0 7.5Foreign-born women 9.1 8.3 4.5 .. 9.4 5.7
Macroeconomic indicators 2000 2005 2011 2012Average Level
2002-06 2007-11 2012Annual growth in %
Real GDP 12.8 4.9 4.6 3.4 3.4 4.6GDP/capita (level in US dollars) 9.8 3.0 2.7 1.5 1.5 2.7 31 506Employment (level in thousands) 11.8 3.9 3.0 3.2 2.6 3.2 3 358
Percentage of the labour forceUnemployment 11.0 11.3 7.1 6.9 12.2 8.3
Notes and sources are at the end of the chapter.1 2 http://dx.doi.org/10.1787/888933158168
0 10 20 30 40 50
Israel
20122002-11 annual average
Former USSREthiopia
United StatesFrance
United KingdomCanada
ArgentinaBrazil
BelgiumItaly
INTERNATIONAL MIGRATION OUTLOOK 2014 © OECD 2014 265

4. COUNTRY NOTES: RECENT CHANGES IN MIGRATION MOVEMENTS AND POLICIES
ItalyImmigration flows to Italy have been declining sincethe onset of the economic crisis in 2008. In 2012the inflow of long-term residents amounted to321 300 persons, 10% less than in 2011. Despite therecent slowdown of immigration dynamics, the shareof foreign population in Italy continues to grow.
The foreign population at the end of 2012reached 4.39 million people, which represented 7.4%of the total registered population. The foreign popu-lation is concentrated in the Central and Northernregions of the country where 86% of foreign residentslive and where more than 10% of the resident popu-lation has non-Italian citizenship.
The largest group of foreign residents are fromRomania, while Moroccans and Albanians lead amongthird-country nationals. Recent trends, however,show an increasing share of migrants from South andEast Asia, who accounted for 26% of all residentpermits issued in 2012.
The share of foreign population in Italy continuesto grow also due to natural increase: almost 80 000foreign children were born in Italy in 2012, whichconstituted 15% of all registered births. In someregions the share approached 25%.
At the end of 2012 the number of valid residencepermits was 3.77 million, of which more than twomillion were long-term permits (under the relevant EUDirective). Entry to Italy for employment is mostlythrough a government quota, although some catego-ries are exempt. In both 2011 and 2012 the quota forlow-skilled foreign workers was limited to seasonalworkers and certain specific categories (those trainedabroad and those changing status). In 2012, 66 700 newresidence permits were issued to foreign workers.Because of the absence of a new entry quota, workpermits comprised only 27% of entrance visas in 2012,down from 61% only two years earlier. The duration ofnew work permits was also reduced (only 46% of newwork permits were issued for a period longer thanone year). Just over 2 000 work permits (3.1% of thetotal) were issued to highly-skilled foreign workers.
Family reunification was the main reason forimmigration to Italy in both 2011 and 2012. Thenumber of residence permits issued for family reuni-fication in 2012 largely spouses (46%) and children(36%) declined to 119 700, 15% fewer than in 2011.Most are brought to Italy by a non-EU citizen sponsor.
Visa numbers followed similar trends. In 2012 thenumber of visas issued for the purposes of employ-
ment decreased by 34% (from 90 000 to fewer than57 000), while visas issued for family reunification fellonly 2.5%. Rising tourist flows led total visa numbersto increase 9%, to 1.87 million.
Irregular immigration towards the Italian coast,which had fallen from 62 700 in 2011 to 13 300 in 2012,jumped to 42 925 during 2013. Most irregular immi-grants originate from Syria and Eritrea. In the firstsix months of 2014, around 63 900 arrived on thecoasts, further straining the reception system andpushing the government to seek co-operation withother countries to address the inflow.
Several immigration legislation reforms wereimplemented by the authorities with the aim ofincreasing the country´s competitiveness. For exam-ple, residence permits for the purposes of study ortraining will be granted for the entire duration of thecourse of study. Upon completion of their studies inItaly, foreign students may apply for residence permitfor the purposes of employment and convert theirpermits into work permits. Public administration jobswill be opened to certain categories of third-countrynationals. A reform of visa policy has been included inthe list of government priorities with the aim ofattracting skilled workers and investors.
In 2013 Italy introduced an option of grantingresidence permits to victims of domestic violence (aspreviously granted to victims of human trafficking).The residence permit can be issued for a one-yearperiod and is renewable if the conditions justifying itsissuance pertain. The permit can be converted into aresidence permit for the purposes of employment.
Other legislative changes concern simplificationof the rules for granting nationality upon reaching theage of 18 years. An important change of the citizen-ship law has been under discussion that plans tointroduce the principle of ius soli temperato (citizenshiprights acquired by birth on the Italian territory, withadjustments). A National Plan against racism, xeno-phobia and intolerance has been drafted in the courseof 2013 with the main priorities focused on the fieldsof employment, housing, education, security, mass-media and sports.
For further information
www.interno.itwww.istat.itwww.lavoro.gov.it/lavoro.
INTERNATIONAL MIGRATION OUTLOOK 2014 © OECD 2014266

4. COUNTRY NOTES: RECENT CHANGES IN MIGRATION MOVEMENTS AND POLICIES
Recent trends in migrants’ flows and stocksITALY
Migration flows (foreigners)2000 2005 2011 2012
Average Level (’000)National definition 2002-06 2007-11 2012
Per 1 000 inhabitantsInflows 3.4 4.8 5.9 5.4 5.2 7.3 321.3Outflows 0.2 0.3 0.5 0.6 0.2 0.5 38.2Migration inflows (foreigners) by type Thousands % distribution
Inflows of top 10 nationalitiesas a % of total inflows of foreigners
Permit based statistics (standardised) 2011 2012 2011 2012Work 104.1 57.0 32.8 22.1Family (incl. accompanying family) 87.0 86.0 27.4 33.3Humanitarian 7.2 6.0 2.3 2.3Free movements 114.2 104.4 36.0 40.4Others 4.8 4.9 1.5 1.9Total 317.3 258.4 100.0 100.0
Temporary migration 2005 2011 2012Average2007-11
ThousandsInternational students 31.7 39.9 40.2 36.7Trainees .. .. .. ..Working holiday makers 0.4 0.4 0.4 0.4Seasonal workers 84.2 15.2 9.7 36.8Intra-company transfers .. .. .. ..Other temporary workers .. .. .. ..
Inflows of asylum seekers 2000 2005 2011 2012Average Level
2002-06 2007-11 2012Per 1 000 inhabitants 0.3 0.2 0.6 0.3 0.2 0.4 17 352
Components of population growth 2000 2005 2011 2012Average Level (’000)
2002-06 2007-11 2012Per 1 000 inhabitants
Total 0.7 4.9 4.7 3.2 6.2 6.3 194Natural increase -0.2 -0.2 -0.3 -0.8 -0.3 -0.2 -47Net migration 0.9 5.2 5.1 4.0 6.5 6.4 241
Stocks of immigrants 2000 2005 2011 2012Average Level (’000)
2002-06 2007-11 2012Percentage of the total population
Foreign-born population .. .. 9.1 9.6 .. .. 5 696Foreign population 2.4 4.6 8.0 7.4 4.0 7.0 4 388
Naturalisations 2000 2005 2011 2012Average Level
2002-06 2007-11 2012Percentage of the foreign population 0.7 0.8 0.5 1.4 0.9 1.3 65 383
Labour market outcomes 2000 2005 2011 2012Average
2002-06 2007-11Employment/population ratio
Native-born men 67.4 69.2 66.5 65.8 69.3 68.0Foreign-born men 82.4 80.0 75.6 72.3 81.9 78.1Native-born women 39.3 45.1 46.1 46.7 44.1 46.1Foreign-born women 40.5 47.7 49.4 49.7 49.1 50.2
Unemployment rateNative-born men 8.4 6.2 7.4 9.7 6.5 6.4Foreign-born men 6.5 6.7 9.7 12.4 5.8 8.3Native-born women 14.9 9.7 9.0 11.3 10.6 8.5Foreign-born women 21.2 14.4 14.1 15.6 13.6 12.9
Macroeconomic indicators 2000 2005 2011 2012Average Level
2002-06 2007-11 2012Annual growth in %
Real GDP 3.7 0.9 0.4 -2.4 1.1 -0.6GDP/capita (level in US dollars) 3.6 0.2 0.1 -2.7 0.4 -1.1 33 469Employment (level in thousands) 3.7 0.7 0.3 -0.3 0.9 0.0 22 885
Percentage of the labour forceUnemployment 10.0 7.7 8.4 10.7 7.9 7.5
Notes and sources are at the end of the chapter.1 2 http://dx.doi.org/10.1787/888933158175
0 10 205 15 25 300
Italy
20122002-11 annual average
RomaniaChina
MoroccoAlbaniaUkraine
IndiaBangladeshPhilippines
MoldovaPakistan
INTERNATIONAL MIGRATION OUTLOOK 2014 © OECD 2014 267

4. COUNTRY NOTES: RECENT CHANGES IN MIGRATION MOVEMENTS AND POLICIES
JapanThe number of foreign residents in Japan at the endof 2012 was about 2 033 700, 1.6% of the total popula-tion. Of these, about 682 000 were foreign workers, ofwhom 124 000 worked in professional or technicalfields, 309 000 were permanent residents or ofJapanese descent, 108 000 were foreign studentsengaged in part-time jobs and 141 000 were technicalinterns.
Until 2012, foreign nationals staying more than90 days in Japan were required to register with themunicipal offices under the Alien Registration Act; thepopulation of foreign residents in Japan reflects thenumber of those registered under the Act. However,since the alien registration system was abolished withthe start of the new residency management system inJuly 2012, statistics now identify resident foreignnationals as “mid-to long-term residents” and “SpecialPermanent Residents”. The number of women hasconsistently exceeded that of men in recent years andthey now account for 55% of the total. Most are young:a quarter are in their 20s. About a third are Chinese anda quarter Koreans, whose numbers continue to fall.
About 63 500 foreign nationals entered Japanduring 2012 (excluding those with re-entry permits)for the purpose of work, an increase of 22.7% from theprevious year. They were accompanied by about20 700 dependents, an increase of 13.7% from theprevious year. In addition, about 68 000 peopleentered for training as technical interns.
In May 2013, there were 135 500 foreign studentsin Japan; this number has been slowly falling sinceits 2010 peak. The largest group was Chinese (60.4%),followed by those from Korea (11.3%), with most of theremainder from Asia. Foreign students can obtainpermission to change to a work status after gradua-tion at a regional immigration bureau. In 2012, about11 700 foreign graduates applied for a change of statusand about 11 000 of them were granted permission.About 23.5% of graduates in 2012 were able totransition to employment in Japan, while an addi-tional 12% stayed after graduation to seek work.
In 2012, about 2 500 people applied for asylum inJapan, an increase of about 680 from the previous year.18 applicants were recognised as refugees during theyear. In addition 112 applicants were allowed to stayin Japan on humanitarian grounds. The main coun-tries of origin of asylum seekers were Turkey, Myan-mar, Nepal, Pakistan and Sri Lanka.
10 600 foreigners naturalised in 2012, about halfof them Koreans and a third Chinese.
The number of foreign nationals who overstayedtheir legal period of stay was about 62 000 as of1 January 2013, down 7.5% from the previous year andcontinuing a 20-year fall resulting from a range ofmeasures taken by the immigration authorities,including stricter entry control and targeting illegalemployment.
A new residency management system, includingthe issue of a residence card, was introduced in 2012.The Minister of Justice collects and holds informa-tion on residence conditions of mid- to long-termresidents through: i) applications, e.g. the applicationfor landing, for extension of the period of stay, forchanges of status of residence; ii) notification ofthe place of residence to the Minister of Justice bymunicipalities; iii) notification of changes by mid- tolong-term residents to the Minister of Justice; andiv) provision of information about mid-to long-termresidents to the Minister of Justice from organisationsto which they belong such as a school at which theystudy.
A points-based system to provide preferentialtreatment – including expanded accompanying familypermission and the permission to bring domestic staff,as well as faster access to permanent residence – wasintroduced in May 2012. In total, about 430 individualswere recognised as highly-skilled professionals in theeleven months after the start of the system, more thanhalf from China, although most were already in Japan.In December 2013, the system was reviewed andrequirements for qualification were made lessstringent.
In 2014, several new measures in the migrationfield were proposed as part of the Prime Minister’sgrowth strategy. These included the utilisation ofhighly-skilled foreign professionals, the creation ofspecial zones in which Japanese may hire domesticworkers from abroad and the revision of TechnicalInternship Programs. In addition, until 2020, technicalinterns in the construction sector who have finishedtheir three-year stay may continue to work inconstruction for up to three additional years underthe “Designated Activities” status of residence.
For further information
www.immi-moj.go.jpwww.mhlw.go.jpwww8.cao.go.jp/teiju-portal/eng/index.html.
INTERNATIONAL MIGRATION OUTLOOK 2014 © OECD 2014268

4. COUNTRY NOTES: RECENT CHANGES IN MIGRATION MOVEMENTS AND POLICIES
Recent trends in migrants’ flows and stocksJAPAN
Migration flows (foreigners)2000 2005 2011 2012
Average Level (’000)National definition 2002-06 2007-11 2012
Per 1 000 inhabitantsInflows 2.7 2.9 2.1 2.4 2.8 2.4 303.9Outflows 1.7 2.3 1.8 1.7 2.0 1.9 219.4Migration inflows (foreigners) by type Thousands % distribution
Inflows of top 10 nationalitiesas a % of total inflows of foreigners
Permit based statistics (standardised) 2011 2012 2011 2012Work 22.4 27.2 38.0 40.8Family (incl. accompanying family) 22.0 24.4 37.2 36.5Humanitarian 0.3 0.1 0.5 0.2Free movements .. .. .. ..Others 14.4 15.1 24.4 22.5Total 59.1 66.8 100.0 100.0
Temporary migration 2005 2011 2012Average2007-11
ThousandsInternational students 41.5 49.9 57.6 57.1Trainees 83.3 82.3 85.9 88.9Working holiday makers 4.7 8.5 9.5 7.0Seasonal workers .. .. .. ..Intra-company transfers 4.2 5.3 6.1 6.2Other temporary workers 110.2 35.2 44.5 42.1
Inflows of asylum seekers 2000 2005 2011 2012Average Level
2002-06 2007-11 2012Per 1 000 inhabitants 0.0 0.0 0.0 0.0 0.0 0.0 2 545
Components of population growth 2000 2005 2011 2012Average Level (’000)
2002-06 2007-11 2012Per 1 000 inhabitants
Total .. 0.4 -2.2 .. 0.6 .. -70Natural increase .. 0.0 -1.6 .. 0.4 .. ..Net migration .. 0.0 -0.6 .. 0.0 .. ..
Stocks of immigrants 2000 2005 2011 2012Average Level (’000)
2002-06 2007-11 2012Percentage of the total population
Foreign-born population .. .. .. .. .. .. ..Foreign population 1.3 1.6 1.6 1.6 1.5 1.7 2 034
Naturalisations 2000 2005 2011 2012Average Level
2002-06 2007-11 2012Percentage of the foreign population 1.0 0.8 0.5 0.5 0.8 0.6 10 622
Labour market outcomes 2000 2005 2011 2012Average
2002-06 2007-11Employment/population ratio
Native-born men .. .. .. .. .. ..Foreign-born men .. .. .. .. .. ..Native-born women .. .. .. .. .. ..Foreign-born women .. .. .. .. .. ..
Unemployment rateNative-born men .. .. .. .. .. ..Foreign-born men .. .. .. .. .. ..Native-born women .. .. .. .. .. ..Foreign-born women .. .. .. .. .. ..
Macroeconomic indicators 2000 2005 2011 2012Average Level
2002-06 2007-11 2012Annual growth in %
Real GDP 3.9 1.3 -0.5 1.4 1.5 0.0GDP/capita (level in US dollars) 3.7 1.3 -0.3 1.7 1.4 0.0 35 317Employment (level in thousands) -0.2 0.4 -0.1 -0.3 -0.1 -0.3 62 699
Percentage of the labour forceUnemployment 4.7 4.4 4.6 4.3 4.8 4.5
Notes and sources are at the end of the chapter.1 2 http://dx.doi.org/10.1787/888933158180
0 10 20 30 400
Japan
20122002-11 annual average
ChinaKorea
United StatesViet Nam
PhilippinesThailand
IndonesiaChinese Taipei
BrazilIndia
INTERNATIONAL MIGRATION OUTLOOK 2014 © OECD 2014 269

4. COUNTRY NOTES: RECENT CHANGES IN MIGRATION MOVEMENTS AND POLICIES
KoreaThe stock of foreign population resident in Korea formore than 90 days was 1.12 million in December 2012,equivalent to 2.2% of the total population. Thenumber was little changed from the previous year but25% higher than 2008. In 2013, the number rose to1.22 million. Short-term stayers numbered 325 000in 2012 and 357 000 in 2013. The stock of labourmigrants fell by 65 400 during 2012 to 529 700, mainlydue to fewer working visit (H-2) holders whosenumbers fell by 64 600 as they transitioned to otherstatus.
Since 2005, Korea has been a country with positivenet migration, as negative net migration of Koreans isusually more than compensated by positive net migra-tion of foreigners. Net migration peaked in 2011 atalmost 91 000, but fell in 2012, when there was only asmall difference between immigration (643 000) andemigration (636 000). The fall in net migration was dueto the exit of a large cohort of temporary workerswhose permits expired, combined with a slight declinein inflows. In 2013, total net migration was again posi-tive standing at by 93 600. In 2012, 300 000 foreignersentered and 290 000 foreigners exited; in 2013, thesefigures were 369 000 and 269 respectively. Labourmigrants accounted for 59% of the foreign inflow,family members 15% and students 14%.
Unskilled workers are admitted through bilateralagreements with 15 origin countries under theEmployment Permit programme. Entries are subject toan annual quota, set at 57 000 in 2012, 62 000 in 2013and 53 000 in 2014. Since 2012 the quota contains areserve for certain workers to return after their maxi-mum 58-month spell of employment (11 000 in 2012,10 000 in 2013, and 5 600 in 2014). The stock ofthese workers was almost unchanged during 2012 ataround 230 000; almost three-quarters of themworked in manufacturing. There were some changesin the distribution by origin country compared withDecember 2011: there were fewer Vietnamese (still thelargest group), Filipinos and Thais, and more Cambo-dians in December 2013.
The number of Overseas Korean resident (F-4)visa holders rose by 52 800 in 2012 and 46 400 in 2013,to 236 000. Once granted principally to more skilledand higher-educated ethnic Koreans, it was recentlyopened for lower-skilled ethnic Koreans on workingvisit (H-2) visas. H-2 visa holders may switch if theymeet certain criteria, such as an age limit, employ-ment in rural areas or passing a test.
There were 84 700 foreign students in 2012,although the number in a degree programme
decreased over the year to 64 000, while languagecourse student numbers were stable. Chinesestudents accounted for 68.2% of the total.
The steady increase in the stock of marriage-based migrants over recent years continued in 2012,reaching 216 900, an increase of 5.9% over theprevious year. Just under a third of these hadnaturalised by 2012. Two nationalities dominated:Chinese (42.5%) and Vietnamese (26.5%). The numberof new marriage migrants fell from 17 000 in 2012to 15 900 in 2013.
During 2012, 1 100 applications for asylum werefiled. Of 840 cases determined during the year,7.2% were given asylum and a further 3.7% allowed tostay on humanitarian grounds.
Based on exit data, there were 200 500 unautho-rised residents (overstayers) in 2012, higher thanlevels in the preceding years. The rise in overstayers isrelated to the large number of labour migrants whosepermits expired in 2012.
The main policy change was the implementationin July 2012 of the Diligent Migrant Workers Re-entryProgramme. It permits unskilled migrant workers tore-enter to work for the same employer for a maxi-mum of a further 58 months, with a six monthinterim departure period upon meeting three require-ments: no move between employers; employment in aspecified industry or in a small manufacturing firm;and having at least a one year contract after re-entry.In addition, those re-entering are exempted from theKorean language test.
More scrutiny is given to international arrangedmarriages. Since 2010, Korean men must participatein an international marriage guidance programme,after passing medical and criminal checks. SinceApril 2014, approval is granted only following anassessment of their ability to communicate. Sponsorsmust meet an income threshold and demonstrateadequate housing. Only one spouse may be sponsoredevery five years, and marriage migrants cannotsponsor another foreigner until at least three yearsafter naturalisation.
For further information
www.eps.go.krhttp://immigration.go.krwww.kostat.go.krhttp://kosis.kr/eng/.
INTERNATIONAL MIGRATION OUTLOOK 2014 © OECD 2014270

4. COUNTRY NOTES: RECENT CHANGES IN MIGRATION MOVEMENTS AND POLICIES
Recent trends in migrants’ flows and stocksKOREA
Migration flows (foreigners)2000 2005 2011 2012
Average Level (’000)National definition 2002-06 2007-11 2012
Per 1 000 inhabitantsInflows 3.7 5.3 6.2 6.0 4.4 5.8 300.2Outflows 1.9 5.5 4.4 5.8 3.6 4.2 290.0Migration inflows (foreigners) by type Thousands % distribution
Inflows of top 10 nationalitiesas a % of total inflows of foreigners
Permit based statistics (standardised) 2011 2012 2011 2012Work 1.5 1.4 2.6 2.5Family (incl. accompanying family) 34.4 34.6 60.4 62.3Humanitarian 0.0 0.1 0.1 0.1Free movements .. .. .. ..Others 21.0 19.5 36.9 35.0Total 56.9 55.6 100.0 100.0
Temporary migration 2005 2011 2012Average2007-11
ThousandsInternational students 9.0 15.6 15.4 15.7Trainees 4.4 13.3 12.2 12.9Working holiday makers 0.3 0.8 1.0 0.4Seasonal workers .. .. .. ..Intra-company transfers 8.4 .. .. 8.7Other temporary workers 135.0 128.0 122.8 149.9
Inflows of asylum seekers 2000 2005 2011 2012Average Level
2002-06 2007-11 2012Per 1 000 inhabitants 0.0 0.0 0.0 0.0 0.0 0.0 1 143
Components of population growth 2000 2005 2011 2012Average Level (’000)
2002-06 2007-11 2012Per 1 000 inhabitants
Total .. .. .. .. .. .. 224Natural increase .. .. .. .. .. .. 217Net migration .. .. .. .. .. .. 7
Stocks of immigrants 2000 2005 2011 2012Average Level (’000)
2002-06 2007-11 2012Percentage of the total population
Foreign-born population .. .. .. .. .. .. ..Foreign population 0.4 1.1 2.0 1.9 1.0 1.9 933
Naturalisations 2000 2005 2011 2012Average Level
2002-06 2007-11 2012Percentage of the foreign population .. 3.5 1.8 1.3 1.9 1.9 12 528
Labour market outcomes 2000 2005 2011 2012Average
2002-06 2007-11Employment/population ratio
Native-born men .. .. .. .. .. ..Foreign-born men .. .. .. .. .. ..Native-born women .. .. .. .. .. ..Foreign-born women .. .. .. .. .. ..
Unemployment rateNative-born men .. .. .. .. .. ..Foreign-born men .. .. .. .. .. ..Native-born women .. .. .. .. .. ..Foreign-born women .. .. .. .. .. ..
Macroeconomic indicators 2000 2005 2011 2012Average Level
2002-06 2007-11 2012Annual growth in %
Real GDP 8.8 4.0 3.7 2.0 4.7 3.5GDP/capita (level in US dollars) 7.9 3.7 2.9 1.6 4.3 3.0 29 396Employment (level in thousands) 4.3 1.3 1.7 1.8 1.4 0.9 24 679
Percentage of the labour forceUnemployment 4.4 3.7 3.4 3.2 3.6 3.4
Notes and sources are at the end of the chapter.1 2 http://dx.doi.org/10.1787/888933158195
0 10 20 30 40 50
Korea
20122002-11 annual average
ChinaUnited States
Viet NamThailand
UzbekistanPhilippinesCambodiaIndonesia
NepalCanada
INTERNATIONAL MIGRATION OUTLOOK 2014 © OECD 2014 271

4. COUNTRY NOTES: RECENT CHANGES IN MIGRATION MOVEMENTS AND POLICIES
LatviaIn 2012, official statistics for outflows from Latviatotalled 25 200 while inflows were 12 300. In 2013,outflows fell to 22 600 and inflows fell to 8 300. In bothyears official net migration was thus negative,at -11 900. The total resident population at the endof 2013 was 2 million. Since 2000, more than 60% ofpopulation decline has been due to net emigration,which was negative throughout the period.
At the beginning of 2013, non-citizens of Latvia,mainly longstanding residents who migrated fromother parts of the Soviet Union prior to Latvia regain-ing independence in 1991, comprised 14.1% (297 900)of the population. The number has been decreasingand is less than half the figure in 2000. Of theremaining foreign population of 48 700 and holdingpermanent residence permits, 81% were citizens ofthe Russian Federation.
While the number of persons holding permanentpermits has gradually increased over the last decade,the number holding temporary permits declined from14 700 in 2009 to 13 600 in 2010, before rebounding to16 000 in 2012 and to 23 900 in 2013. Of these 8 500were from EU/EEA countries. Citizens of the RussianFederation held 35% of temporary permits, 7.6% werefrom Ukraine and 6.3% from Germany.
The number of initial temporary permits issuedduring 2013 amounted to 7 400 including 5 000 prin-cipal applicants and 2 400 dependants. The majorityof these permits were issued to citizens of the RussianFederation. There were 1 400 employment-relatedpermits, including 1 100 principal applicants and300 dependants. Of 3 000 investor residence permits,1 400 were principal applicants and 1 600 dependants.A further 1 300 permits went to students and 600 forfamily reunion including marriages.
The number of asylum claims, which hadincreased sharply in 2011 to 340, declined in 2012 to190. During 2012, 30 asylum seekers were given eitherrefugee or humanitarian status.
Acquisition of Latvian citizenship, running atnearly 20 000 annually in 2004-06, has since declined,with 2 200 cases in 2012 and 1 700 in 2013, amongthese more than 90% were non-citizens of Latvia,rather than foreign nationals.
In light of the demographic impact of emigration,which is expected to be felt especially as the economy
returns to growth, the Latvian government hasdeveloped a strategy to try to meet labour needs withLatvians returning from abroad. The strategy also aimsto benefit from business networks with Latvians abroad,even if they do not return. An amendment to theCitizenship Law, coming into force in October 2013,allows dual citizenship as a way of maintaining ties withLatvia’s diaspora. Citizens of EU, EEA and NATO memberstates, New Zealand, Australia and Brazil will be able toapply for Latvian citizenship and still maintain theircurrent citizenship.
In line with an EU Directive, in 2013 the Latvianparliament also approved changes to the rulesrelating to the unemployed and job seekers whichwill allow third-country nationals with temporaryresidence permits to obtain the status of an unem-ployed person or a person seeking employment.
While putting an emphasis on return migrationand co-operation with the Latvian diaspora, thegovernment, together with non-governmental institu-tions, is introducing measures to facilitate the access offoreigners, such as spouses of return migrants, to thelabour market and promote wider integration intosociety. A Return Migration Support Plan, drafted by theMinistry of Economics and adopted in July 2013, and adevelopment planning document on co-operation withthe diaspora, initiated in late 2013 by the Ministry ofForeign affairs, envisages support mechanisms forteaching the Latvian language and linking foreignprofessionals to Latvian networks of professionals toenable better integration into society.
In 2014 the Ministry of Culture will carry outresearch to evaluate the integration system for third-country nationals in Latvia, the main aim being tolower the barriers to labour market entry.
In June 2013, the Latvian and Russian govern-ments signed an agreement to allow easier bordercrossing between the two states, especially for thoseliving in border regions.
For more information
www.pmlp.lvwww.csb.gov.lvwww.emn.lv.
INTERNATIONAL MIGRATION OUTLOOK 2014 © OECD 2014272

4. COUNTRY NOTES: RECENT CHANGES IN MIGRATION MOVEMENTS AND POLICIES
Recent trends in migrants’ flows and stocksLATVIA
Migration flows (foreigners)2000 2005 2011 2012
Average Level (’000)National definition 2002-06 2007-11 2012
Per 1 000 inhabitantsInflows 0.7 0.8 1.3 .. .. 1.4 ..Outflows .. .. .. .. .. .. ..Migration inflows (foreigners) by type Thousands % distribution
Inflows of top 10 nationalitiesas a % of total inflows of foreigners
Permit based statistics (standardised) 2011 2012 2011 2012Work .. .. .. ..Family (incl. accompanying family) .. .. .. ..Humanitarian .. .. .. ..Free movements .. .. .. ..Others .. .. .. ..Total .. .. .. ..
Temporary migration 2005 2011 2012Average2007-11
ThousandsInternational students .. .. .. ..Trainees .. .. .. ..Working holiday makers .. .. .. ..Seasonal workers .. .. .. ..Intra-company transfers .. .. .. ..Other temporary workers .. .. .. ..
Inflows of asylum seekers 2000 2005 2011 2012Average Level
2002-06 2007-11 2012Per 1 000 inhabitants .. .. 0.2 0.1 .. .. 189
Components of population growth 2000 2005 2011 2012Average Level (’000)
2002-06 2007-11 2012Per 1 000 inhabitants
Total -7.4 -5.1 -16.0 -10.3 -6.0 -5.7 -21Natural increase -5.0 -4.9 -4.7 -4.5 -5.2 -4.1 -9Net migration -2.3 -0.2 -11.2 -5.8 -0.8 -1.6 -12
Stocks of immigrants 2000 2005 2011 2012Average Level (’000)
2002-06 2007-11 2012Percentage of the total population
Foreign-born population 18.7 .. 13.4 .. .. .. ..Foreign population 24.5 .. 12.6 .. .. .. ..
Naturalisations 2000 2005 2011 2012Average Level
2002-06 2007-11 2012Percentage of the foreign population .. .. .. .. .. .. ..
Labour market outcomes 2000 2005 2011 2012Average
2002-06 2007-11Employment/population ratio
Native-born men 61.1 65.7 61.0 64.5 66.4 64.8Foreign-born men 60.6 76.6 65.1 63.6 71.3 68.8Native-born women 58.6 59.4 60.4 62.0 58.9 62.0Foreign-born women 52.5 59.7 59.0 59.6 59.5 62.9
Unemployment rateNative-born men 18.5 8.2 18.9 16.1 10.2 15.2Foreign-born men 17.8 10.8 19.4 19.4 10.5 16.2Native-born women 13.5 8.1 13.8 13.7 9.4 11.2Foreign-born women 21.4 16.6 16.0 18.1 11.1 12.6
Macroeconomic indicators 2000 2005 2011 2012Average Level
2002-06 2007-11 2012Annual growth in %
Real GDP 5.7 10.1 5.5 .. 9.0 -1.4GDP/capita (level in US dollars) .. .. .. .. .. .. 21 381Employment (level in thousands) -2.8 1.6 -8.4 .. 2.5 -4.4 ..
Percentage of the labour forceUnemployment 13.7 9.6 16.2 .. 10.4 13.7
Notes and sources are at the end of the chapter.1 2 http://dx.doi.org/10.1787/888933158208
0 10 20 30 400
Latvia
20102001-09 annual average
Russian FederationGermanyLithuania
UkraineSwedenFrance
United KingdomEstoniaPoland
Spain
INTERNATIONAL MIGRATION OUTLOOK 2014 © OECD 2014 273

4. COUNTRY NOTES: RECENT CHANGES IN MIGRATION MOVEMENTS AND POLICIES
LithuaniaThe Lithuanian census records that on 1 March 2011the population was 3.04 million, a decrease of 12.6%from the previous census in 2001. Around three-quarters of the decrease was accounted for by netemigration. Continuing emigration contributed to afurther decline in the population, to an estimated2.97 million in 2012 and 2.94 million in 2013. Forei-gners, who numbered 33 300 in 2012 and 35 500in 2013, comprised approximately 1.2% of the totalpopulation. Over half of all foreigners were fromnon-EEA countries and held permanent residencepermits in Lithuania; foreign labour migrantscomprised only 0.3% of the workforce, and weremainly employed as transport drivers.
Immigration increased from 16 800 in 2011 to19 800 in 2012 and 22 000 in 2013. The increase ismostly due to the rising numbers of returningLithuanian citizens the rise may also reflect betterregistration of their re-entry. In 2013, returningLithuanian citizens constituted 86% of the totalinflow, the majority coming from European countries.About 80% of foreign immigrants were from non-EEAcountries. The largest group was Russian nationals(510, or 19% of all foreign immigrants in 2012 and 770,or 25% in 2013), followed by Belarussians andUkrainians, whose share in the inflow of foreignersrose from 13% each in 2012 to 16% and 14% respec-tively in 2013. Around 55% of immigrants were male.
Emigration has been falling, from 53 900 in 2011to 41 100 in 2012 and 38 800 in 2013. This is well belowthe peak of 83 500 in 2010. In consequence, netemigration fell from 38 300 in 2011 to 21 300 in 2012and 16 800 in 2013, the lowest figure since 2002.However, these numbers indicate only documented/declared emigration (compared with both declaredand non-declared emigration until 2010), so actualemigration might be still higher. Overall, mostemigrants (79% in 2012 and 84% in 2013) went to EUcountries. Among destination countries, the UnitedKingdom remains the leader (almost half of the total)followed by Ireland (9%), although the latter hasbecome less prominent in recent years. Migration toScandinavian countries, particularly Norway, hasbeen increasing, as these countries were less affectedby the economic crisis and have better labour marketsand social security systems. In contrast, the propor-tion of outflows to the Russian Federation, Belarusand Ukraine has significantly decreased, from 16.5%in 2008 to 7% in 2013. The opening of the labourmarkets of Germany and Austria in 2012 appears tohave had no major impact on the direction of
emigration from Lithuania. Most emigrants are young:in 2013, 53% were aged 20-34.
Remittances to Lithuania, after a 16% dropin 2012, rebounded by 32% in 2013 and their magni-tude relative to GDP increased from 3.6% in 2012to 4.5% in 2013, comparable to 2011 levels.
In 2012 and 2013, only 180 people were natu-ralised annually, continuing the fall in most years ofthe last decade. In 2013, almost one third had beenstateless before naturalisation and half wereoriginally Russian, Belarussian or Ukrainian.
In 2012, 630 asylum applications were lodged inLithuania, almost 19% more than in 2011, particularlyfrom Georgia which accounted for half of all applica-tions. Figures for 2013 show a decline to 400 applicants,about a third of which were from Georgians. About20% of decisions made in 2012 granted either refugeeor humanitarian status; this figure was about one-thirdin 2013.
The number of illegal migrants detected hasrisen in recent years, to 2 100 in 2012 and 1 900in 2013, with 70% being from the Russian Federation,Belarus, Kyrgyzstan and Georgia.
Following Parliamentary elections, a new govern-ment was formed in 2012. As regards migration, thenew Government Program focuses on migrationmanagement, external border control policy (preven-tion and control of irregular migration and combatingtrafficking in human beings), development of theCommon European Asylum System, addressingthe problem of emigration of the Lithuanian popula-tion and return of emigrant workers. In March 2013,the government established a working groupto develop migration policy guidelines (approvedin January 2014), with the priority being to reduceemigration by Lithuanian citizens.
In October 2013, an amendment to the Law onthe Legal Status of Aliens designates a new commis-sion which will be responsible for the integration offoreigners. This is the first such institution inLithuania. An amendment to the Law on Citizenshipin May 2013 established more favourable naturalisa-tion conditions for stateless persons who were born inLithuania.
For further information
www.migracija.ltwww.stat.gov.lt/en.
INTERNATIONAL MIGRATION OUTLOOK 2014 © OECD 2014274

4. COUNTRY NOTES: RECENT CHANGES IN MIGRATION MOVEMENTS AND POLICIES
Recent trends in migrants’ flows and stocksLITHUANIA
Migration flows (foreigners)2000 2005 2011 2012
Average Level (’000)National definition 2002-06 2007-11 2012
Per 1 000 inhabitantsInflows .. 0.6 0.5 0.8 0.8 0.6 2.5Outflows .. 0.7 0.7 0.8 .. 1.0 2.6Migration inflows (foreigners) by type Thousands % distribution
Inflows of top 10 nationalitiesas a % of total inflows of foreigners
Permit based statistics (standardised) 2011 2012 2011 2012Work .. .. .. ..Family (incl. accompanying family) .. .. .. ..Humanitarian .. .. .. ..Free movements .. .. .. ..Others .. .. .. ..Total .. .. .. ..
Temporary migration 2005 2011 2012Average2007-11
ThousandsInternational students .. .. .. ..Trainees .. .. .. ..Working holiday makers .. .. .. ..Seasonal workers .. .. .. ..Intra-company transfers .. .. .. ..Other temporary workers .. .. .. ..
Inflows of asylum seekers 2000 2005 2011 2012Average Level
2002-06 2007-11 2012Per 1 000 inhabitants 0.1 0.0 0.1 0.2 0.1 0.1 526
Components of population growth 2000 2005 2011 2012Average Level (’000)
2002-06 2007-11 2012Per 1 000 inhabitants
Total -7.2 -6.5 -25.7 -14.8 -4.9 -9.5 -45Natural increase -1.4 -3.9 -2.0 -2.2 -3.2 -2.8 -7Net migration -5.8 -2.6 -23.7 -12.6 -1.7 -6.7 -38
Stocks of immigrants 2000 2005 2011 2012Average Level (’000)
2002-06 2007-11 2012Percentage of the total population
Foreign-born population 7.0 .. 6.4 .. .. 6.5 ..Foreign population 1.0 1.0 0.7 0.8 .. 1.1 25
Naturalisations 2000 2005 2011 2012Average Level
2002-06 2007-11 2012Percentage of the foreign population .. .. .. .. .. 0.8 183
Labour market outcomes 2000 2005 2011 2012Average
2002-06 2007-11Employment/population ratio
Native-born men 75.6 73.8 59.9 62.1 65.2 61.9Foreign-born men 68.5 74.5 66.8 67.5 72.6 70.0Native-born women 33.1 33.3 60.3 61.8 59.1 60.6Foreign-born women 39.4 40.7 58.1 62.6 59.8 62.5
Unemployment rateNative-born men 6.0 6.5 18.3 15.5 10.2 13.5Foreign-born men 11.6 9.3 17.0 14.6 11.9 13.1Native-born women 6.3 8.7 12.8 11.7 10.0 9.5Foreign-born women 10.6 11.7 20.8 15.4 16.3 13.0
Macroeconomic indicators 2000 2005 2011 2012Average Level
2002-06 2007-11 2012Annual growth in %
Real GDP 3.6 7.8 5.9 .. 8.0 1.0GDP/capita (level in US dollars) .. .. .. .. .. .. 23 876Employment (level in thousands) -4.2 2.9 -6.5 .. 2.0 -3.4 ..
Percentage of the labour forceUnemployment 16.4 8.0 15.3 .. 10.1 11.2
Notes and sources are at the end of the chapter.1 2 http://dx.doi.org/10.1787/888933158211
0 5 10 15 20 25
Lithuania
20122002-11 annual average
Russian FederationUkraineBelarusPolandLatvia
GermanySpain
ItalyUnited Kingdom
France
INTERNATIONAL MIGRATION OUTLOOK 2014 © OECD 2014 275

4. COUNTRY NOTES: RECENT CHANGES IN MIGRATION MOVEMENTS AND POLICIES
LuxembourgThe population of Luxembourg at the end of 2012comprised 537 000 inhabitants, a 2.3% increasecompared with the previous year. The increase by12 200 persons was due to a positive migration bal-ance of 10 000 persons, and a positive natural increaseof 2 150 persons. The share of foreigners among totalresident population reached 44.5% in 2012, a slightincrease from 43% in 2011. The number of foreigncitizens was larger than that of the foreign-born.
The largest group is Portuguese nationals whoseshare in the total population reached 16.4%, and in theforeign population 36.9%. Other top countries of originof foreign residents in Luxembourg included France,Italy, Belgium, and Germany.
4 680 persons were naturalised in 2012, amongwhom 66% were residents and 34% non-residents.More than 80% of the latter lived in Luxembourg and12% lived in France. The number of naturalisationsincreased due to 1 750 cases of recuperation of nation-ality, among them 1 420 residents.
Unemployment increased in 2012 and by end ofyear reached 6.2% (compared to 5.1% a year earlier).Among 355 900 salaried employees in Luxembourg,40% were females and 44% were border commuters.The number of commuters continued to increase evenduring the period of economic crisis, and in 2012reached 156 900 workers (78 400 persons residing inFrance, and the remainder split between Belgium andGermany.
The inflow of foreign residents in 2012 consistedof 11 130 registrations of EU nationals (led byPortuguese, French and Belgian), and of 1 270 third-country national family members of EU nationals(mainly from Brazil, Cap Verde, Montenegro and theUnited States). 4 390 new permits were granted in 2012to third-country nationals, and 5 310 renewals.
The fight against illegal work and social dumpinghas been scaled up by the Ministry of Labour. Theimportance of labour market situation to the nationalauthorities was reflected also in the creation of thenational Agency for Employment Development (Agencepour le développement de l’emploi) in January 2012. Inorder to reduce illegal employment of foreigners, a“social badge” requirement was introduced forconstruction sites, with a pilot phase in 2013 andbroader adoption expected in 2014.
In June 2013 the Government decided to condi-tion the labour market access for Croatian nationals,who became EU citizens on 1 July 2014 (100 hadreceived first permits in 2012). Salaried work inLuxembourg is subject to authorisation during thefirst year.
The number of applicants for internationalprotection in 2012 reached 2 050 persons, majority
from Serbia, Albania, Montenegro, Bosnia andHerzegovina, Kosovo and the Former YugoslavRepublic of Macedonia (FYROM). In 2013, the numberdeclined to about 1 000.
At the beginning of 2013, the Governmentlaunched a regularisation campaign with the aim toregularise illegal workers who worked for at leastnine consecutive months in the course of the previoustwelve months. The applicants have to prove theexistence of work contract for indeterminate periodfor 40 hours per week, and salary at the level of socialminimum.
Other legislative and regulatory changesincluded the approval of the Readmission Agreementbetween the Benelux States and Kosovo and therelated Implementation Protocol in May 2012; andthe definition in June 2012 of eligibility conditionsfor granting social assistance to applicants forinternational protection. Three EU Directives weretransposed into the national law in June 2013.(Directives 2011/95/EU, 2011/51/EU and 2011/98/EU.)Although Luxembourg already issued a singleresidence permit, the implementation of the SinglePermit directive mandates a four-month processingtime for residence permits (if no response is received,the application is considered denied). First permitsare valid for a year and the field and sector of initialemployment, although employer mobility is allowed.After the first year, renewals are for three years andworkers are granted full labour market mobility.These were previously subject to restriction up tothree years. Family members may also receive a singlepermit for employment.
New instruments and measures developed in thecourse of 2012 in the field of integration of foreignersin Luxembourg included development of nationalaction plan for integration and fight against discrimi-nation, development of integration contracts, andproject activities aimed at the integration of thirdcountry nationals supported by the European Integra-tion Fund. Local initiatives focused on facilitating theco-operation among communities, ministries andassociations in the field of foreigners’ integration,supporting the activities aimed at fighting againstdiscrimination, and promoting diversity (for example,by launching a diversity charter [Charte de la DiversitéLëtzebuerg]).
For further information
www.mae.luwww.statistiques.public.luwww.olai.public.luwww.men.public.lu.
INTERNATIONAL MIGRATION OUTLOOK 2014 © OECD 2014276

4. COUNTRY NOTES: RECENT CHANGES IN MIGRATION MOVEMENTS AND POLICIES
Recent trends in migrants’ flows and stocksLUXEMBOURG
Migration flows (foreigners)2000 2005 2011 2012
Average Level (’000)National definition 2002-06 2007-11 2012
Per 1 000 inhabitantsInflows 24.7 29.6 36.9 36.6 27.6 32.9 19.4Outflows 16.1 15.4 14.4 16.2 16.3 15.7 8.6Migration inflows (foreigners) by type Thousands % distribution
Inflows of top 10 nationalitiesas a % of total inflows of foreigners
Permit based statistics (standardised) 2011 2012 2011 2012Work .. .. .. ..Family (incl. accompanying family) .. .. .. ..Humanitarian .. .. .. ..Free movements .. .. .. ..Others .. .. .. ..Total .. .. .. ..
Temporary migration 2005 2011 2012Average2007-11
ThousandsInternational students .. .. .. ..Trainees .. .. .. ..Working holiday makers .. .. .. ..Seasonal workers .. .. .. ..Intra-company transfers .. .. .. ..Other temporary workers .. .. .. ..
Inflows of asylum seekers 2000 2005 2011 2012Average Level
2002-06 2007-11 2012Per 1 000 inhabitants 1.4 1.7 4.0 3.8 2.4 1.7 2 003
Components of population growth 2000 2005 2011 2012Average Level (’000)
2002-06 2007-11 2012Per 1 000 inhabitants
Total 12.8 17.0 24.7 23.0 14.0 19.4 12Natural increase 4.3 3.9 3.5 4.0 3.6 3.8 2Net migration 8.2 13.1 21.2 18.9 10.4 15.6 10
Stocks of immigrants 2000 2005 2011 2012Average Level (’000)
2002-06 2007-11 2012Percentage of the total population
Foreign-born population 33.2 36.2 41.5 42.6 35.1 39.9 226Foreign population 37.7 41.1 44.3 45.0 40.2 43.7 239
Naturalisations 2000 2005 2011 2012Average Level
2002-06 2007-11 2012Percentage of the foreign population 0.4 0.5 1.5 2.0 0.5 1.3 4 680
Labour market outcomes 2000 2005 2011 2012Average
2002-06 2007-11Employment/population ratio
Native-born men 73.4 68.9 65.9 66.4 69.5 67.8Foreign-born men 78.0 80.2 78.2 78.8 79.8 78.1Native-born women 46.8 50.6 53.0 54.9 49.3 52.4Foreign-born women 55.3 58.3 61.1 63.6 57.5 61.5
Unemployment rateNative-born men 1.5 3.0 3.0 3.5 2.5 2.7Foreign-born men 2.4 4.1 5.0 5.4 4.0 5.4Native-born women 3.0 4.6 4.1 3.8 4.2 4.3Foreign-born women 3.3 7.4 8.8 7.5 7.3 7.3
Macroeconomic indicators 2000 2005 2011 2012Average Level
2002-06 2007-11 2012Annual growth in %
Real GDP 8.5 5.3 1.9 -0.2 4.1 1.1GDP/capita (level in US dollars) 6.9 3.6 -0.4 -2.4 2.7 -0.8 87 658Employment (level in thousands) 3.4 1.0 2.7 2.4 1.2 2.2 230
Percentage of the labour forceUnemployment 2.4 4.1 5.7 6.1 3.6 5.1
Notes and sources are at the end of the chapter.1 2 http://dx.doi.org/10.1787/888933158221
0 10 205 15 25 300
Luxembourg
20122002-11 annual average
PortugalFrance
BelgiumItaly
GermanySerbiaSpain
United KingdomUnited States
Romania
INTERNATIONAL MIGRATION OUTLOOK 2014 © OECD 2014 277

4. COUNTRY NOTES: RECENT CHANGES IN MIGRATION MOVEMENTS AND POLICIES
MexicoPermanent inflows of foreigners to Mexico in 2012decreased to 19 500, down from 21 400 in 2011. Mostmigrants came from the United States (21%), Cuba(10%), Colombia (8%), Venezuela (7%) and Spain (5%).
Among permanent migrants, labour migrantsaccounted for 34%, more than in 2011 (30%). On theother hand, the number of inflows of family migrantswent down to 7 700 in 2011, a decrease of 13%compared to 2010. Temporary migration flows weremore substantial, with 40 600 new immigrantsin 2012, a decline from 41 000 in 2011. The number ofinternational students in 2011 increased 4.5% in 2011and reached 4 800 individuals.
An estimation based on administrative data fromthe immigration authorities provides figures forregular residents on Temporary Residents (FM3 – non-immigrant status), Permanent Residents (FM2– immigrant status) or foreign immigrants withpermanent status (Inmigrado). In 2012, there wereapproximately 301 000 foreigners residing in Mexicowith migration documents, 14.6% more than in 2009,although fewer than in 2011 (306 500).
Despite those inflows, Mexico is still one of theOECD countries with the lowest share of immigrantsin the population. In 2010, there were 961 000 foreign-born residents in Mexico, around 0.9% of the popula-tion (compared with the OECD average of 13.5%).
The number of foreigners naturalising in Mexicostood at approximately 3 600 in 2012, an increase from2 600 the previous year. About one-third were eitherColombians or Cubans. Mexico is mostly a countryof emigration, transit and return migration. ManyMexicans have emigrated to the United States in thepast 25 years. In 2012, around 11.9 million Mexican-born were estimated to be living in the United States.Annual outflows, though, have been decliningsince 2006, due to the recession and increased bordercontrols. Estimates of outflows and inflows comefrom the National Occupation and EmploymentSurvey. In 2011, estimates of outflows were equivalentto 2.8 per thousand inhabitants, and 2.6 per thousandin 2012. Estimates of inflows of Mexicans from abroad– largely those returning from the United States –were at 1.8 in 2011 and 1.6 in 2012.
The number of repatriating Mexicans at theUnited States border declined between 2010, when itwas approximately 469 000, to 2012, when it totalled369 000. It fell further to 333 000 in 2013.
Unauthorised transit migration to the UnitedStates was estimated between at 112 000 in 2010 and95 000 in 2011, but increased in 2012 to about 150 000.Most is from Central America. These figures are stillbelow the mid-2000s peaks, due to economic reasons
and increased vulnerability due to violence byorganised crime during transit.
Remittance flows to Mexico remained are esti-mated to have declined in 2013. The Mexican Bankestimates that remittances flows were USD 21.9 billionin 2013, down from USD 22.4 billion in 2012.
Many Guatemalan border workers work mainlyin the agriculture and services sectors in Mexico,particularly in border regions, while retaining theirresidency in Guatemala. In 2012, the National Insti-tute of Migration documented 23 200 Guatemalanborder workers in Mexico, down from 30 000 theprevious year. A much larger number worked withoutauthorisation, although most of these held RegionalVisitor authorisations. There were 67 600 suchauthorisations issued in 2012, down from 74 100in 2011.
The regulations to implement the Migration Lawapproved in 2011 came into force in November 2012.Important provisions of the Regulations include thegovernance of the National Migration Institute (INM);requirements and procedures for international mobil-ity and assistance of foreigners in Mexican territory;the criteria, requirements, and procedures for visaissuance; protection of vulnerable groups; andassisted return of foreigners.
In 2013 the planning and consultation began for aSpecial Migration Programme (Programa Especial deMigración – PEM). Co-ordinated by the new MigratoryPolicy Unit, the PEM is the first instrument forplanning and budgetary programming of migratorypolicy in Mexico. The 2014-18 PEM was published inApril 2014. For the first time, it sets national prioritieson migration, with five objectives, 26 strategies,195 lines of action and 11 indicators. It articulates thedifferent government levels programmes andactivities, covering origin, transit, destination andreturn.
In November 2012, Mexico eliminated visarequirements for nationals of Colombia and Peru whoenter Mexico as visitors or tourists. This measure wasundertaken in the context of the efforts of the PacificAlliance (Alianza del Pacífico – members of which areChile, Colombia, Mexico and Peru), to move towardsfreer circulation in the Alliance. From 2013, visarequirements have been lifted for Brazilians withordinary passports.
For further information
www3.inegi.org.mx/Sistemas/temasV2/Default.aspx?s=est&c=17484.
INTERNATIONAL MIGRATION OUTLOOK 2014 © OECD 2014278

4. COUNTRY NOTES: RECENT CHANGES IN MIGRATION MOVEMENTS AND POLICIES
Recent trends in migrants’ flows and stocksMEXICO
Migration flows (foreigners)2000 2005 2011 2012
Average Level (’000)National definition 2002-06 2007-11 2012
Per 1 000 inhabitantsInflows 0.1 0.1 0.2 0.2 0.1 0.2 19.5Outflows .. .. .. .. .. .. ..Migration inflows (foreigners) by type Thousands % distribution
Inflows of top 10 nationalitiesas a % of total inflows of foreigners
Permit based statistics (standardised) 2011 2012 2011 2012Work 10.3 8.3 47.3 39.5Family (incl. accompanying family) 7.7 7.4 35.7 35.3Humanitarian 0.3 0.4 1.2 1.9Free movements .. .. .. ..Others 3.4 4.9 15.8 23.4Total 21.7 21.0 100.0 100.0
Temporary migration 2005 2011 2012Average2007-11
ThousandsInternational students 5.1 4.8 5.1 5.5Trainees .. .. .. ..Working holiday makers .. .. .. ..Seasonal workers 45.5 27.6 23.3 27.6Intra-company transfers .. .. .. ..Other temporary workers 41.3 41.1 39.4 38.0
Inflows of asylum seekers 2000 2005 2011 2012Average Level
2002-06 2007-11 2012Per 1 000 inhabitants 0.0 0.0 0.0 0.0 0.0 0.0 811
Components of population growth 2000 2005 2011 2012Average Level (’000)
2002-06 2007-11 2012Per 1 000 inhabitants
Total 12.2 11.8 12.1 11.6 12.0 12.7 1 361Natural increase 18.3 16.3 13.8 13.5 16.6 14.6 1 583Net migration -6.1 -4.5 -1.8 -1.9 -4.6 -1.9 -222
Stocks of immigrants 2000 2005 2011 2012Average Level (’000)
2002-06 2007-11 2012Percentage of the total population
Foreign-born population 0.5 0.5 0.8 0.8 .. 0.7 974Foreign population .. .. 0.3 0.3 .. .. 296
Naturalisations 2000 2005 2011 2012Average Level
2002-06 2007-11 2012Percentage of the foreign population .. .. .. 1.2 .. .. 3 590
Labour market outcomes 2000 2005 2011 2012Average
2002-06 2007-11Employment/population ratio
Native-born men .. 80.7 78.0 78.6 .. 78.9Foreign-born men .. 70.9 67.1 63.8 .. 68.8Native-born women .. 41.8 43.7 44.8 .. 43.6Foreign-born women .. 38.5 38.2 42.3 .. 33.7
Unemployment rateNative-born men .. 3.5 5.4 5.1 .. 4.9Foreign-born men .. 3.3 5.2 8.0 .. 5.5Native-born women .. 4.0 5.3 5.1 .. 5.0Foreign-born women .. 2.8 8.2 6.4 .. 7.7
Macroeconomic indicators 2000 2005 2011 2012Average Level
2002-06 2007-11 2012Annual growth in %
Real GDP 9.0 3.1 3.8 3.9 2.9 1.8GDP/capita (level in US dollars) 4.3 1.9 2.6 2.7 1.7 0.5 16 645Employment (level in thousands) 7.5 0.6 2.2 3.3 2.0 1.3 48 707
Percentage of the labour forceUnemployment 2.6 3.5 5.2 4.9 3.3 4.7
Notes and sources are at the end of the chapter.1 2 http://dx.doi.org/10.1787/888933158230
0 5 10 15 20 25
Mexico
20122007-11 annual average
United StatesCuba
ColombiaVenezuela
SpainArgentina
CanadaChina
GuatemalaItaly
INTERNATIONAL MIGRATION OUTLOOK 2014 © OECD 2014 279

4. COUNTRY NOTES: RECENT CHANGES IN MIGRATION MOVEMENTS AND POLICIES
NetherlandsOn 1 January 2013, there were 3.54 million residentsin the Netherlands with at least one foreign-bornparent (“non-native background”). By 1 January 2014,this number had risen to 3.59 million or 21.4% of theDutch population. The main non-native backgroundswere Turkey (396 000 on 1 January 2014), Morocco(375 000) Indonesia (372 000), Germany (369 000), andSurinam (348 000). Since 1996 the number of those withnon-native background has increased by 44%, whilethe rest of the population increased by 1.8%. Most ofthe increase was due to growing flows from Centraland Eastern European and from non-Western– particularly Asian – countries. Most residents withnon-native background are Dutch nationals.
158 400 immigrants entered the Netherlandsin 2012, the first decline in four years. The number roseto 164 800 in 2013. 27% of the entries in 2012 wereDutch nationals. Outflows (after correction forunreported emigration) increased from 133 200 in 2011to 144 500 in 2012 and 145 700 in 2013. Overall netmigration decreased from 29 800 in 2011 to 13 900in 2012 but rose again to 19 100 in 2013. Inflows fromthe new EU countries fell in 2012 but were stablein 2013. The main origin countries of new immigrantsare Poland (18 600 in 2012 and 20 400 according to pro-visional 2013 figures) and Germany (over 8 000 annu-ally).The largest single immigrant groups from non-Western countries came from China (more than5 000 annually), India and Turkey (both with fewerthan 4 000 annually).
First residence permits issued for employmentnumbered 10 900 in 2012 and 12 700 in 2013 (accord-ing to provisional figures). Highly skilled accountedfor 51% of the permits in 2012 and 56% in 2013. Thiswas due to India (1 900 highly skilled migrants in 2012against 2 700 in 2013). The other main origins werethe United States, China, Japan and the RussianFederation. Among those granted a permit for otherremunerated activities (excluding researchers), theChinese comprised 32% in 2012, but only 13% in 2013.Issuance of temporary work permits has been declin-ing in recent years, to 10 600 in 2012 and 5 600 inJanuary-August 2013. In 2012, one in three was forlow-qualified work. The number of permits grantedfor study – 10 700 in both 2011 and 2012 – increasedin 2013 to 12 900.
Provisional national figures for asylum claimsshow a rise from 13 200 in 2012 to 17 200 in 2013.In 2012, about two in five claims were approved. The
largest groups of asylum seekers in 2013 werenationals of Somalia, Syria and Iraq.
The 26 000 beneficiaries of a five-year permitunder the 2007 regularisation scheme became eligiblefor Dutch citizenship after five years, and many tookthe opportunity. For those who did not, the Dutchauthorities sent application forms to remind them torenew.
The number of persons obtaining Dutch citizen-ship, 31 000 in 2012, fell to 26 000 in 2013.
A new coalition government formed at the endof 2012 had implications for immigration, integrationand asylum migration policies in the Netherlands.The Coalition agreement takes a restrictive approachto migration policy and emphasises integration,taking into account society’s absorption capacity.New migration policy rules introduced in June 2013simplify the application procedure for a permit andgive greater responsibility to sponsors: while they areoffered fast-track processing, they are accountable forsponsored migrants.
New regulations in force from February 2013allow unaccompanied minor asylum seekers whohave stayed for five years or longer in the Netherlands– and their families – to apply for a residence permit.The grounds under which some asylum seekers areeligible for a temporary residence permit have alsobeen changed. Fees for family reunification, study andscientific research have been lowered.
Following an amendment to the Civic IntegrationAct, immigrants with a residence permit must arrangeand pay for their own civic integration coursesfrom 2013.
Since October 2013, a residence permit maybe granted to individuals who invest at leastEUR 1.25 million in the Netherlands, if added value forthe Dutch economy is generated.
After piloting shorter procedures for highlyskilled migrants who come to the Netherlands for upto three months, a permanent scheme has been inplace since January 2014. It demands the sameminimum salary levels as the scheme for highlyskilled migrants who stay longer than three months.
For further information
www.ind.nlwww.cbs.nl.
INTERNATIONAL MIGRATION OUTLOOK 2014 © OECD 2014280

4. COUNTRY NOTES: RECENT CHANGES IN MIGRATION MOVEMENTS AND POLICIES
Recent trends in migrants’ flows and stocksNETHERLANDS
Migration flows (foreigners)2000 2005 2011 2012
Average Level (’000)National definition 2002-06 2007-11 2012
Per 1 000 inhabitantsInflows 5.7 3.9 7.1 6.9 4.4 6.2 115.7Outflows 1.3 2.9 4.2 4.8 2.8 3.5 80.8Migration inflows (foreigners) by type Thousands % distribution
Inflows of top 10 nationalitiesas a % of total inflows of foreigners
Permit based statistics (standardised) 2011 2012 2011 2012Work 11.0 8.5 10.4 8.8Family (incl. accompanying family) 22.4 19.5 21.2 20.2Humanitarian 10.7 5.3 10.1 5.4Free movements 61.5 63.5 58.3 65.6Others .. .. .. ..Total 105.6 96.8 100.0 100.0
Temporary migration 2005 2011 2012Average2007-11
ThousandsInternational students 10.9 11.7 11.3 10.5Trainees 9.9 3.4 .. 9.6Working holiday makers .. .. .. ..Seasonal workers .. .. .. ..Intra-company transfers .. .. .. ..Other temporary workers 46.1 12.2 10.5 21.0
Inflows of asylum seekers 2000 2005 2011 2012Average Level
2002-06 2007-11 2012Per 1 000 inhabitants 2.8 0.8 0.7 0.6 0.8 0.7 9 664
Components of population growth 2000 2005 2011 2012Average Level (’000)
2002-06 2007-11 2012Per 1 000 inhabitants
Total 7.7 1.8 4.9 4.5 4.3 3.9 75Natural increase 4.2 3.2 2.9 2.7 3.6 3.0 44Net migration 3.6 -1.4 2.0 1.8 0.7 0.9 30
Stocks of immigrants 2000 2005 2011 2012Average Level (’000)
2002-06 2007-11 2012Percentage of the total population
Foreign-born population 10.1 10.6 11.4 11.5 10.6 11.1 1 928Foreign population 4.2 4.2 4.7 4.8 4.3 4.5 796
Naturalisations 2000 2005 2011 2012Average Level
2002-06 2007-11 2012Percentage of the foreign population 7.7 4.1 3.8 3.9 4.5 3.9 30 955
Labour market outcomes 2000 2005 2011 2012Average
2002-06 2007-11Employment/population ratio
Native-born men 83.9 81.4 81.1 80.9 82.6 82.4Foreign-born men 69.9 69.5 70.7 71.5 69.5 72.2Native-born women 65.6 68.6 71.9 72.5 68.4 71.9Foreign-born women 48.8 52.4 58.0 58.2 51.5 56.9
Unemployment rateNative-born men 1.8 3.7 3.7 4.6 3.1 3.2Foreign-born men 5.4 10.8 10.3 10.8 9.1 8.2Native-born women 3.0 4.5 3.7 4.5 3.8 3.5Foreign-born women 7.6 10.0 8.7 10.4 9.2 7.9
Macroeconomic indicators 2000 2005 2011 2012Average Level
2002-06 2007-11 2012Annual growth in %
Real GDP 3.9 2.0 0.9 -1.2 1.6 0.9GDP/capita (level in US dollars) 3.2 1.8 0.5 -1.6 1.2 0.5 42 495Employment (level in thousands) 2.2 0.4 0.6 -0.2 0.2 0.6 8 545
Percentage of the labour forceUnemployment 2.9 5.1 4.3 5.2 4.2 3.8
Notes and sources are at the end of the chapter.1 2 http://dx.doi.org/10.1787/888933158249
0 5 10 15 200
Netherlands
20122002-11 annual average
PolandGermany
ChinaBulgaria
United KingdomSpainIndia
Unites StatesItaly
Greece
INTERNATIONAL MIGRATION OUTLOOK 2014 © OECD 2014 281

4. COUNTRY NOTES: RECENT CHANGES IN MIGRATION MOVEMENTS AND POLICIES
New ZealandIn 2012/13, there were 88 200 permanent and long-term arrivals and 80 300 permanent and long-termdepartures, resulting in a net migration gain of7 900 people. This follows a net migration loss of 3 200the year before. The gain resulted from a lower annualnet migration loss to Australia, accompanied by anupward trend in net migration gain with the rest ofthe world. Departures to Australia are expected tocontinue slowing as economic and labour marketconditions in New Zealand improve.
Although there was a net migration gain, thenumber of people approved for residence in 2012/13was down 4% from 40 400 approved in 2011/12.The main reason for this decrease was a 23% fall inapprovals in the Capped Family stream as a result ofchanges to the Parent category and closing of theAdult Child and Sibling categories in May 2012. TheSkilled/Business stream decreased by 2%, though thedrop was more modest than the previous two years.
For the first time in a decade China was the pri-mary origin country for permanent residents with15% of all approvals in 2012/13, an increase of 7% overthe year. The United Kingdom and India both contrib-uted 13% to all residence approvals, a decrease of 14%and 2% respectively from the previous year. Other toporigin countries were the Philippines (8%) and Samoa,Fiji and South Africa (5% each).
In 2013, the number of people approved to workin New Zealand under the Essential Skills Policy roseby 2% from the previous year, to 22 400. This policyfacilitates the entry of temporary workers to fillshortages where suitable New Zealand citizens orresidents are not available for the work offered. Thiswas the first annual increase since the start of theglobal economic slowdown and reflects the growth inlabour demand in the rebuilding of Canterbury.
Admissions for seasonal work, which are subjectto a labour market test, increased 6% in 2012/13 fromthe previous year, to 9 600. Of the non-labour-markettested work visa categories, the number of temporaryworkers approved under the Working HolidaySchemes increased 13% and increased 5% underthe Study to Work Policy. The latter policy allowsapplicants to obtain a work visa for 12 months or24 months if they have completed a course or qualifi-cation in New Zealand that would qualify for pointsunder the Skilled Migrant Category. The growth in thenumbers approved under the Study to Work Policyreflects the increase in international students from
India, a group that typically has a high rate of transi-tion to paid work after study.
The total number of international studentsapproved to study in New Zealand (64 200 students)again decreased by 7% in 2012/13. Likely factors thatcontributed to this decline were an unfavourableexchange rate, increased international competition forexport education and the February 2011 Christchurchearthquake. The number of Chinese held steady whilethose from India and South Korea declined. Newinternational students were approved to study inNew Zealand in 2012/13 numbered 31 500, down 9%from 2011/12, with China the largest source country.
In 2012/13, 300 people sought asylum inNew Zealand, compared with 700 a decade earlier.Sri Lanka is currently the largest source country ofasylum seekers (12%), followed by Iran (11%) and Fiji(8%). A further 800 people were granted residencethrough the refugee quota programme.
The Immigration Amendment Act (2013) intro-duces a definition of a mass arrival, set as an arrival ofa group of more than 30 people, and a provision toenable those who arrive as part of a mass arrival to bedetained, if necessary, under a group warrant, for upto six months. It also establishes provisions that willhelp ensure the efficient processing of all asylumclaims and subsequent appeals, not just thosearriving as part of a mass arrival. Other changes toimmigration instructions are intended to discouragepeople from attempting to reach New Zealand via amass arrival.
Other major policy developments over 2012/13relate to victims of workplace exploitation, exploita-tion of foreign fishing crew engaged by New Zealandemployers or foreign chartered fishing vessels,and new labour market testing requirements inCanterbury. In late 2013, part-time work rights weregranted to English language students and unlimitedwork rights to international PhD and Mastersby research students. Two new Working HolidaySchemes were established, with Hungary andViet Nam.
For further information
www.immigration.govt.nz/www.dol.govt.nz/research/www.newzealandnow.govt.nz/investing-in-nz.
INTERNATIONAL MIGRATION OUTLOOK 2014 © OECD 2014282

4. COUNTRY NOTES: RECENT CHANGES IN MIGRATION MOVEMENTS AND POLICIES
Recent trends in migrants’ flows and stocksNEW ZEALAND
Migration flows (foreigners)2000 2005 2011 2012
Average Level (’000)National definition 2002-06 2007-11 2012
Per 1 000 inhabitantsInflows 9.7 13.1 9.3 8.8 11.4 10.3 39.1Outflows 4.1 5.5 6.0 5.5 4.9 5.6 24.4Migration inflows (foreigners) by type Thousands % distribution
Inflows of top 10 nationalitiesas a % of total inflows of foreigners
Permit based statistics (standardised) 2011 2012 2011 2012Work 10.2 10.1 22.9 23.6Family (incl. accompanying family) 27.9 26.0 62.6 60.9Humanitarian 2.7 3.0 6.2 7.1Free movements 3.7 3.6 8.3 8.4Others .. .. .. ..Total 44.5 42.7 100.0 100.0
Temporary migration 2005 2011 2012Average2007-11
ThousandsInternational students 70.0 68.9 64.2 71.8Trainees 1.8 1.3 1.1 1.3Working holiday makers 29.0 45.1 50.8 41.4Seasonal workers 2.9 7.8 8.2 8.1Intra-company transfers .. .. .. ..Other temporary workers 44.2 26.8 29.0 39.9
Inflows of asylum seekers 2000 2005 2011 2012Average Level
2002-06 2007-11 2012Per 1 000 inhabitants 0.4 0.1 0.1 0.1 0.2 0.1 324
Components of population growth 2000 2005 2011 2012Average Level (’000)
2002-06 2007-11 2012Per 1 000 inhabitants
Total 5.6 11.4 6.6 6.8 12.9 9.8 31Natural increase 7.7 7.5 7.0 7.0 3.6 7.9 31Net migration -2.9 1.7 -0.5 -0.2 9.3 1.8 -1
Stocks of immigrants 2000 2005 2011 2012Average Level (’000)
2002-06 2007-11 2012Percentage of the total population
Foreign-born population 17.2 20.3 23.6 24.1 19.7 22.7 1 066Foreign population .. .. .. .. .. .. ..
Naturalisations 2000 2005 2011 2012Average Level
2002-06 2007-11 2012Percentage of the foreign population .. .. .. .. .. .. 27 230
Labour market outcomes 2000 2005 2011 2012Average
2002-06 2007-11Employment/population ratio
Native-born men 79.4 82.9 78.7 77.8 82.1 80.7Foreign-born men 71.6 76.4 76.8 76.8 75.2 77.5Native-born women 64.9 70.0 68.5 67.9 68.7 70.1Foreign-born women 55.8 59.7 63.8 64.6 58.9 61.8
Unemployment rateNative-born men 6.2 3.4 6.4 6.7 3.9 5.0Foreign-born men 7.1 4.1 7.0 7.1 4.7 5.6Native-born women 5.9 4.0 7.0 7.4 4.5 5.2Foreign-born women 6.7 4.8 6.9 8.1 5.4 6.2
Macroeconomic indicators 2000 2005 2011 2012Average Level
2002-06 2007-11 2012Annual growth in %
Real GDP 2.7 3.2 2.3 2.5 3.6 1.4GDP/capita (level in US dollars) 2.1 2.1 1.5 1.9 2.0 0.4 32 117Employment (level in thousands) 1.9 3.0 1.6 0.5 3.0 0.8 2 226
Percentage of the labour forceUnemployment 6.1 3.8 6.5 6.9 4.3 5.4
Notes and sources are at the end of the chapter.1 2 http://dx.doi.org/10.1787/888933158255
0 5 10 15 20 25
New Zealand
20122002-11 annual average
United KingdomIndia
ChinaPhilippines
FijiSamoa
South AfricaKorea
United StatesTonga
INTERNATIONAL MIGRATION OUTLOOK 2014 © OECD 2014 283

4. COUNTRY NOTES: RECENT CHANGES IN MIGRATION MOVEMENTS AND POLICIES
NorwayBetween 2011 and 2012 the total inflow of persons toNorway decreased slightly to 78 600, although this stillrepresented an immigration rate of almost 16 immi-grants per 1 000 inhabitants. Of these, 89% wereforeigners, and 45% were women. Most were from EUcountries, although their share fell from 64% to 58%.Poland remained the largest origin country (11 500 newimmigrants), followed by Lithuania (6 600) and Sweden(5 700). There was a significant increase in immigrationfrom Somalia (3 600) and Eritrea (2 400). In 2012,21 300 foreigners emigrated, 1 300 fewer than in 2011.The largest registered emigration flows in 2012 were toSweden (6 700), Denmark (2 800) and Poland (1 400). Netimmigration of foreigners rose slightly, to 48 700. Thetotal inflow of migrants in 2013 was 3.5% belowthe 2012 level, at 75 800, largely because of a drop in thenumber of incoming EU nationals. Net migration, too,was about 15% below the 2011-12 levels.
Work remained the major reason (45% of thetotal) for non-Nordic immigration in 2012. Although4 percentage points lower than in 2011, labour migra-tion exceeded 25 000 and was at one of its highest his-torical levels. Close to 90% of labour migrants camefrom Europe, mostly from the Eastern and CentralEuropean EU states, including half from Poland. Two-thirds of Europeans, compared to only 12% of non-European nationals, were labour migrants. Family-related immigration represented 32% of non-Nordicimmigration. The major groups of family immigrantswere from Poland, Lithuania, Somalia, Thailand andthe Philippines. Preliminary figures suggest similarlevels of family immigration in 2013. The share ofimmigration for education, training and culturalexchange was 10% in 2012, slightly lower than in 2011.Among these were 11 600 new international studentsin 2012, an increase of 600 from 2011, the major origincountries being Germany, France, Spain, China, theUnited States, the Russian Federation and Italy.
In 2012, almost 9 800 applications for asylumwere filed, 8% higher than the previous year. Thenumber of applications increased by a further 22%in 2013, reaching 11 980. The major countries of originwere Eritrea, Somalia, Syria, Afghanistan and Sudan.The proportion granted refugee status was 54%in 2012 while it was 61% in 2013.
In 2012, 12 400 persons were naturalised, 1 900fewer than the year before. The largest group offoreigners granted Norwegian citizenship originatedfrom Iraq, followed by former Somalis and Afghans.The number naturalised in 2013 was slightly higher,at 13 200, and the largest groups originated fromSomalia, Iraq and Afghanistan.
At the end of 2013, 633 100 immigrants and126 100 persons born to immigrant parents wereresidents in Norway, representing 15% of the popula-tion. Poland was the main foreign country of birth(84 000 persons). The largest number of Norwegian-born with immigrant parents had parents fromPakistan (15 600). About 42% of immigrants had livedin Norway for fewer than five years.
Although there were no major changes in immi-gration policy in 2012-13, new rules were imple-mented to prevent abuse of au pairs by the familieswhich employ them. A representation system wasintegrated into the new Law of Guardianship to ensureunaccompanied minor asylum seekers have legalrepresentation at various stages of the asylumprocess. Finally, new provisions in the ImmigrationAct broadened the scope for coercive measuresagainst foreigners with undocumented identity, thoseat risk of flight and those with a criminal record.
Several new integration policy measures wereintroduced in 2013, following a White Paper. A newAction Plan promotes better use of the skills of immi-grants in the labour market. It features 19 measures inthe fields of recognition, recruitment and entrepre-neurship which are designed to improve the recogni-tion of education and training from abroad; stimulatepublic and private employers to recruit more immi-grants; and provide targeted information and counsel-ling to immigrants about establishing their owncompany.
A multicultural competence strategy for theperiod 2013-17 has been introduced for all levels ofemployees in the education system. The aim is tobetter document the Norwegian skills of participantsand improve the graduation rate.
A new Anti-Discrimination Act grants employeesaccess to information regarding wages for specificcolleagues when there is suspicion of wage discrimi-nation. The prohibitions and obligations from priorlegislation are included in the new act.
Finally, as part of the “Action Plan against forcedmarriage, female genital mutilation and severerestrictions on young people’s freedom”, 22 measureswere introduced in 2013 focusing on preventiveefforts and effective public assistance.
For further information
www.udi.nowww.ssb.no.
INTERNATIONAL MIGRATION OUTLOOK 2014 © OECD 2014284

4. COUNTRY NOTES: RECENT CHANGES IN MIGRATION MOVEMENTS AND POLICIES
Recent trends in migrants’ flows and stocksNORWAY
Migration flows (foreigners)2000 2005 2011 2012
Average Level (’000)National definition 2002-06 2007-11 2012
Per 1 000 inhabitantsInflows 6.2 6.8 14.3 13.9 6.7 12.6 70.0Outflows 3.3 2.7 4.6 4.2 2.9 3.8 21.3Migration inflows (foreigners) by type Thousands % distribution
Inflows of top 10 nationalitiesas a % of total inflows of foreigners
Permit based statistics (standardised) 2011 2012 2011 2012Work 3.5 4.1 5.7 6.8Family (incl. accompanying family) 12.9 12.4 21.0 20.8Humanitarian 5.4 5.7 8.8 9.6Free movements 39.8 37.6 64.6 62.8Others .. .. .. ..Total 61.6 59.9 100.0 100.0
Temporary migration 2005 2011 2012Average2007-11
ThousandsInternational students 4.3 7.8 8.2 6.5Trainees 0.3 0.3 0.2 0.3Working holiday makers 0.1 0.1 .. 0.1Seasonal workers 1.8 2.5 3.5 2.4Intra-company transfers 0.2 0.3 .. 0.4Other temporary workers 2.1 1.7 1.8 1.8
Inflows of asylum seekers 2000 2005 2011 2012Average Level
2002-06 2007-11 2012Per 1 000 inhabitants 2.4 1.2 1.8 1.9 2.3 2.4 9 785
Components of population growth 2000 2005 2011 2012Average Level (’000)
2002-06 2007-11 2012Per 1 000 inhabitants
Total 5.6 7.4 13.3 .. 6.8 12.6 32Natural increase 3.3 3.5 3.8 .. 3.2 3.9 18Net migration 2.0 3.9 9.5 .. 3.6 8.7 47
Stocks of immigrants 2000 2005 2011 2012Average Level (’000)
2002-06 2007-11 2012Percentage of the total population
Foreign-born population 6.8 8.2 12.4 13.2 7.9 10.9 664Foreign population 4.1 4.8 8.2 8.9 4.7 6.9 449
Naturalisations 2000 2005 2011 2012Average Level
2002-06 2007-11 2012Percentage of the foreign population 5.3 5.9 4.0 3.0 4.6 3.8 12 384
Labour market outcomes 2000 2005 2011 2012Average
2002-06 2007-11Employment/population ratio
Native-born men 82.3 78.8 77.7 77.7 79.2 79.0Foreign-born men 74.6 67.0 70.8 77.8 71.2 73.0Native-born women 74.6 72.9 74.0 74.6 73.6 74.7Foreign-born women 63.5 59.8 66.6 68.0 61.7 67.0
Unemployment rateNative-born men 3.4 4.0 2.7 3.2 3.8 2.8Foreign-born men 6.8 12.5 9.4 7.0 10.0 8.4Native-born women 3.2 3.9 2.6 2.3 3.7 2.4Foreign-born women 5.3 8.5 6.7 5.5 7.7 5.8
Macroeconomic indicators 2000 2005 2011 2012Average Level
2002-06 2007-11 2012Annual growth in %
Real GDP 3.3 2.6 1.3 2.9 2.3 0.6GDP/capita (level in US dollars) 2.6 1.9 0.0 1.5 1.6 -0.6 64 834Employment (level in thousands) -0.2 0.7 1.4 2.0 0.8 1.5 2 586
Percentage of the labour forceUnemployment 3.3 4.4 3.2 3.1 3.9 3.0
Notes and sources are at the end of the chapter.1 2 http://dx.doi.org/10.1787/888933158261
0 5 10 15 200
Norway
20122002-11 annual average
PolandLithuania
SwedenSomalia
PhilippinesEritrea
RomaniaDenmarkGermany
Latvia
INTERNATIONAL MIGRATION OUTLOOK 2014 © OECD 2014 285

4. COUNTRY NOTES: RECENT CHANGES IN MIGRATION MOVEMENTS AND POLICIES
PolandThe inflow of permanent immigrants to Polandreached 14 600 persons in 2012, slightly lower than inthe previous year (15 500 persons). About 82% of themigrants arrived from the European Union. The pri-mary countries of origin of permanent immigrantsincluded United Kingdom, Germany and theUnited States. The inflow of temporary residentsin 2011 was about 66 000 persons; among them 27%were EU nationals.
In 2012 Polish GDP growth slowed to 2.0% fromthe 4.5% recorded in 2011, while the unemploymentrate rose slightly to 10.3% in 2013. The CentralStatistical Office estimated that the number of Polishcitizens staying abroad for more than three monthsrose to 2.13 million in 2012 (compared to 2.06 millionin 2011), with 637 000 in the United Kingdom and500 000 in Germany. According to the Polish LabourForce Survey, the number of Polish temporarymigrants staying abroad for more than three monthsas of mid-2013 reached almost 300 000 people (amongthem 60% were men and 90% went abroad for thepurposes of employment).
More than 48 000 residence permits wereissued by the Polish authorities in 2012 (13% morethan in 2011), including 16% for registrations of EUnationals. 8% were permanent residence permits, andmore than 70% were temporary residence permits.Permit issuance fell slightly in 2013, to about 45 000,with a similar composition. The main nationalities ofrecipients in 2013 were Ukraine, China, Viet Nam,Belarus, and the Russian Federation. In 2013, over8 500 EU citizens registered as residents, withGermany the main nationality.
In 2012 more than 3 800 foreigners obtainedPolish citizenship through naturalisation. Persons ofPolish descent can apply for a residence visa and theso-called Polish Card (in 2011 more than 20 000 cardswere granted under this repatriation scheme).
The number of asylum applications in Poland roseby 56% from 2011 to 2012, to 10 700 persons, predomi-nantly Russians. 2013 saw a further 41% increase (to15 200 applicants). Over 2012-13, about 290 personswere granted refugee status, 270 persons receivedsubsidiary protection and 700 persons were grantedauthorisation to stay for humanitarian reasons.
In 2012 and 2013 more than 39 000 work permitswere granted annually to foreign workers in Poland, onlyslightly fewer than the 41 000 permits issued in 2011.The main sectors of employment in 2013 were trade(18%), construction and household services (13% each).In 2012-13, the main origin of workers was Ukraine(52%), followed by China (8%), and Viet Nam (6%).
In addition, 243 000 “declarations of employerintention to entrust work to foreigners” were registeredin 2012, and 236 000 in 2013. This simplified regime,applicable to nationals of Belarus, Moldova, Georgia,Ukraine and the Russian Federation, allows employ-ment for six out of twelve consecutive months withoutwork permits, and then to obtain a work permitwithout a labour market test after three months. Morethan 90% of workers were from Ukraine and about halfwere employed in agriculture. In 2014 preferentialtreatment was extended to Armenian nationals.
During 2013 an Inter-Ministerial Committee onMigration worked on an action plan following the 2012strategic policy document “Migration Policy of Poland:state of play and further actions”. In April 2013, a draftpolitical document “Polish Integration Policy towardsForeigners – Assumptions and Guidelines” was submit-ted for public consultation by the Ministry of Labourand Social Policy.
Parliamentary debate on a civil initiative bill“Return Home”, supporting repatriation of Polishnationals, continued in 2013 amid governmentconcern over its potential cost as well as conflict withthe constitutional right of equal treatment for allcitizens. The Council of Ministers invited municipa-lities to actively attract repatriates and support theirintegration into Polish society.
A new Act on Foreigners was approved by theParliament and came into force in May 2014. The Actintroduces a number of changes that relax the condi-tions of stay of foreigners in Poland, such as extendingthe duration of the temporary residence permit fromtwo to three years, extending the duration of studentresidence permits, allowing graduates of Polish highschools to stay for up to one year to seek work inPoland, granting a one-month job search period toforeign workers upon a job loss, etc.
Further legislative changes adopted in 2012included a regularisation, the third to be held inPoland, under which two-year residence permits wereissued to more than 4 500 foreigners mainly fromUkraine, Viet Nam and Armenia. A bilateral agree-ment was concluded with Ukraine on harmonisationof social security systems.
For further information
www.udsc.gov.plwww.stat.gov.plwww.mpips.gov.pl.
INTERNATIONAL MIGRATION OUTLOOK 2014 © OECD 2014286

4. COUNTRY NOTES: RECENT CHANGES IN MIGRATION MOVEMENTS AND POLICIES
Recent trends in migrants’ flows and stocksPOLAND
Migration flows (foreigners)2000 2005 2011 2012
Average Level (’000)National definition 2002-06 2007-11 2012
Per 1 000 inhabitantsInflows 0.4 1.0 1.1 1.2 0.9 1.1 47.1Outflows .. .. .. .. .. .. ..Migration inflows (foreigners) by type Thousands % distribution
Inflows of top 10 nationalitiesas a % of total inflows of foreigners
Permit based statistics (standardised) 2011 2012 2011 2012Work .. .. .. ..Family (incl. accompanying family) .. .. .. ..Humanitarian .. .. .. ..Free movements .. .. .. ..Others .. .. .. ..Total .. .. .. ..
Temporary migration 2005 2011 2012Average2007-11
ThousandsInternational students .. .. .. ..Trainees .. .. .. ..Working holiday makers .. .. .. ..Seasonal workers .. .. .. ..Intra-company transfers .. .. .. ..Other temporary workers .. .. .. ..
Inflows of asylum seekers 2000 2005 2011 2012Average Level
2002-06 2007-11 2012Per 1 000 inhabitants 0.1 0.2 0.1 0.2 0.2 0.2 9 167
Components of population growth 2000 2005 2011 2012Average Level (’000)
2002-06 2007-11 2012Per 1 000 inhabitants
Total -0.2 -0.4 0.9 0.2 -0.5 0.2 9Natural increase 0.3 -0.1 0.9 0.3 -0.1 0.6 13Net migration -0.5 -0.3 -0.1 -0.1 -0.4 -0.4 - 4
Stocks of immigrants 2000 2005 2011 2012Average Level (’000)
2002-06 2007-11 2012Percentage of the total population
Foreign-born population .. .. 1.8 .. .. .. ..Foreign population .. .. 0.1 .. .. .. ..
Naturalisations 2000 2005 2011 2012Average Level
2002-06 2007-11 2012Percentage of the foreign population .. .. 4.4 6.8 .. .. 3 792
Labour market outcomes 2000 2005 2011 2012Average
2002-06 2007-11Employment/population ratio
Native-born men 61.2 59.0 66.0 66.3 58.1 65.5Foreign-born men .. 35.9 62.9 71.1 38.1 53.9Native-born women 49.3 47.0 52.7 53.1 46.9 52.2Foreign-born women .. 24.0 48.1 51.7 23.5 37.6
Unemployment rateNative-born men 14.8 16.9 9.1 9.6 17.5 8.4Foreign-born men .. 10.2 9.7 3.5 9.3 8.9Native-born women 18.6 19.4 10.5 11.0 19.2 9.6Foreign-born women .. 15.3 14.5 11.7 17.5 10.8
Macroeconomic indicators 2000 2005 2011 2012Average Level
2002-06 2007-11 2012Annual growth in %
Real GDP 4.3 3.6 4.5 1.9 4.1 4.4GDP/capita (level in US dollars) 4.3 3.7 4.5 1.9 4.2 4.2 22 334Employment (level in thousands) -4.5 2.3 0.6 0.2 0.6 1.9 15 591
Percentage of the labour forceUnemployment 16.1 17.8 9.6 10.1 18.1 8.8
Notes and sources are at the end of the chapter.1 2 http://dx.doi.org/10.1787/888933158276
0 10 205 15 25 300
Poland
20122002-11 annual average
UkraineViet Nam
ChinaBelarus
GermanyRussian Federation
ArmeniaTurkey
IndiaUnited States
INTERNATIONAL MIGRATION OUTLOOK 2014 © OECD 2014 287

4. COUNTRY NOTES: RECENT CHANGES IN MIGRATION MOVEMENTS AND POLICIES
PortugalThe total stock of foreigners in Portugal has beendeclining steadily since 2009 due to both the effects ofthe economic recession and the naturalisation of theforeign population. In 2012, it fell to 417 000, and fellfurther in 2013, to 401 000. Almost one in four wereBrazilians.
The increased outflow of long term migrants thatbegan with the recession has continued, with appro-ximately 52 000 in 2012, up from 44 000 in 2011. Withthe inclusion of short-term emigrants, there was anestimated total outflow of 121 500 people in 2012, 96%of them Portuguese and only 4% foreigners. The scaleof these outflows approach those of the intense Portu-guese emigration cycle to Europe of the late 1960s andearly 1970s. About 40% of emigrants in 2011-12 wereaged 15-29 and over 70% were male. EU countries andSwitzerland are still the dominant destinations, butnon-European destinations, especially Angola, haveemerged as important destinations for Portugueseemigrants.
For the first time in five years, 2012 saw thenumber of long-term entry visas grow, to 15 800.There was a small rise in the number of work visasissued but the main reason was the increased numberof study visas (to 8 700). Education accounted for55% of long term visas in 2012, up from 50% the yearbefore. Brazil was the dominant country with slightlymore than a third of total visas, mainly owing to adoubling of the number coming to study in 2012(5 300) compared with 2011. Nonetheless, theBrazilian population of Portugal is declining, and fellto 13 500 in 2013. Visas to Angolans also doubledin 2012, again mainly for study. Portuguese universi-ties are actively driving this increase in internationalstudents, through closer and more numerous institu-tional contacts, the development of joint degreesand the signature and implementation of bilateralagreements.
Outside the Portuguese speaking groups offoreigners, Indians and particularly Chinese receivedthe highest number of long-term visas, mainly forwork and family reasons. Among migrants from Asiancountries in 2012 work motives exceeded familyreasons (41 against 39%). Family reunion appears asthe key reason for the relatively limited number ofLong Term Visas to non-EU Eastern Europeans,suggesting that the period of labour immigration fromthose countries has ended.
From 2011 to 2012, the number of new ResidencePermits issued in Portugal (these include persons withprevious stay permits and long term visas or other sit-uations of permanence as well as foreigners born inPortugal) continued to fall, as they have beensince 2009, from 45 400 to 38 500. The decline was par-ticularly strong among Eastern Europeans, includingthose from non-EU countries such as Ukraine andMoldova. On the other hand, the number of Chinesehas been increasing, reaching 1 900 in 2013. Theimportance of family reunion, which traditionallyinvolved more women, and more work opportunitiesin activities associated with a higher presence ofwomen, has led to an increasing feminisation ofthe foreign inflow, to reach 52% in 2012. In 2013,33 200 permits were issued, a further 13.7% decline.
In 2013, 30 100 foreigners applied for Portuguesenationality, slightly more than the 29 700 applicantsin 2012. Most applications receive a positive outcome.Less than one in five applications was on the groundsof marriage or common law partnership with aPortuguese national. The largest groups of applicantswere Brazilian (21%), Cape Verdian (16%) andUkrainian (13%).
The number of asylum claims in 2012 increasedbut only to 300, mainly from Africa. The recognitionrate for humanitarian status was 24%. In 2013,500 asylum applications were received, of which39% were filed by Syrian nationals.
A new Immigration Law in 2012 introduced apolicy of “Coercive Removal” of foreigners andincluded measures to increase border security andextend the possibilities of discretionary action by theForeigners and Borders Office (SEF). The SEF wasgranted wider latitude to prevent foreigners fromentering the country and also to prolong the durationof a re-entry ban in Portugal as a result of a removal ifthey suspect a serious threat to the public order,public security or national security.
For further information
www.imigrante.ptwww.sef.ptwww.acidi.gov.pt.
INTERNATIONAL MIGRATION OUTLOOK 2014 © OECD 2014288

4. COUNTRY NOTES: RECENT CHANGES IN MIGRATION MOVEMENTS AND POLICIES
Recent trends in migrants’ flows and stocksPORTUGAL
Migration flows (foreigners)2000 2005 2011 2012
Average Level (’000)National definition 2002-06 2007-11 2012
Per 1 000 inhabitantsInflows 1.5 2.7 4.3 3.7 3.6 5.0 38.5Outflows 0.0 0.0 .. .. 0.0 .. ..Migration inflows (foreigners) by type Thousands % distribution
Inflows of top 10 nationalitiesas a % of total inflows of foreigners
Permit based statistics (standardised) 2011 2012 2011 2012Work 7.3 5.9 19.7 19.3Family (incl. accompanying family) 14.3 11.5 38.8 37.5Humanitarian 0.1 0.1 0.2 0.2Free movements 12.1 9.6 32.7 31.3Others 3.2 3.6 8.6 11.8Total 36.9 30.7 100.0 100.0
Temporary migration 2005 2011 2012Average2007-11
ThousandsInternational students 4.1 6.5 8.4 5.3Trainees .. .. .. ..Working holiday makers .. .. .. ..Seasonal workers .. .. .. ..Intra-company transfers .. .. .. ..Other temporary workers 7.7 .. .. 3.9
Inflows of asylum seekers 2000 2005 2011 2012Average Level
2002-06 2007-11 2012Per 1 000 inhabitants 0.0 0.0 0.0 0.0 0.0 0.0 299
Components of population growth 2000 2005 2011 2012Average Level (’000)
2002-06 2007-11 2012Per 1 000 inhabitants
Total 6.0 3.8 -0.1 -2.9 6.0 1.3 -30Natural increase 1.4 0.2 -0.4 -0.6 0.6 -0.1 -6Net migration 4.6 3.6 0.4 -2.3 5.5 1.4 -24
Stocks of immigrants 2000 2005 2011 2012Average Level (’000)
2002-06 2007-11 2012Percentage of the total population
Foreign-born population 5.1 7.1 8.3 .. 7.1 7.8 ..Foreign population 2.0 4.0 4.1 4.0 4.1 4.2 417
Naturalisations 2000 2005 2011 2012Average Level
2002-06 2007-11 2012Percentage of the foreign population 0.4 0.2 .. .. 0.4 4.4 ..
Labour market outcomes 2000 2005 2011 2012Average
2002-06 2007-11Employment/population ratio
Native-born men 76.2 73.1 67.9 64.6 74.5 71.0Foreign-born men 75.5 78.1 70.7 68.5 78.3 75.9Native-born women 60.2 61.2 59.7 58.1 61.3 61.0Foreign-born women 65.1 67.3 66.8 64.7 66.6 66.4
Unemployment rateNative-born men 3.1 7.0 12.7 16.2 5.8 9.1Foreign-born men 6.0 8.3 18.0 20.0 7.9 11.9Native-born women 4.9 9.1 13.3 16.0 7.7 11.0Foreign-born women 6.9 10.4 15.9 18.8 10.0 14.0
Macroeconomic indicators 2000 2005 2011 2012Average Level
2002-06 2007-11 2012Annual growth in %
Real GDP 3.9 0.8 -1.3 -3.2 0.7 0.0GDP/capita (level in US dollars) 3.4 0.3 -1.1 -2.8 0.2 0.0 25 294Employment (level in thousands) 3.0 0.0 -2.8 -4.2 0.2 -1.3 4 634
Percentage of the labour forceUnemployment 4.0 7.6 12.7 15.6 6.6 9.7
Notes and sources are at the end of the chapter.1 2 http://dx.doi.org/10.1787/888933158286
0 10 20 30 400
Portugal
20122002-11 annual average
BrazilCape Verde
RomaniaGuinea-Bissau
UkraineChinaSpain
AngolaUnited Kingdom
Sao Tome and Principe
INTERNATIONAL MIGRATION OUTLOOK 2014 © OECD 2014 289

4. COUNTRY NOTES: RECENT CHANGES IN MIGRATION MOVEMENTS AND POLICIES
RomaniaWhile Romania is both an origin and destinationcountry for international migration, it remainsprimarily the former, with high net emigration.According to 2011 Census data provided by theNational Statistical Institute, the number ofRomanians residing abroad for more than 12 monthswas 727 000 persons while an additional 386 000stayed abroad for less than one year. Thus, the 2011Census data indicate a total stock of more than1.1 million Romanian nationals abroad. However,the 2011 Census data is likely to underestimateemigration, as other estimates of the stock ofRomanian emigration range as high as 3 millionpersons. Migration of Romanian nationals has been asource of concern for the national authorities, as thecountry loses young and skilled people. According tothe 2011 Census data, the persons who left Romaniafor at least one year originated mainly from urbanareas and 71% were aged between 20 and 44 years old.Most emigrants are from the Western counties(e.g. Sibiu, Timi and Bra ov). According to Censusdata, the main countries of residence for Romaniannationals abroad were Italy (511 000), Spain (242 000),Germany (62 000), United Kingdom (59 000) andFrance (45 000). Destination country figures are higherfor Romanian emigration: Italy recorded more thanone million Romanian residents, and Spain 918 000, atthe end of 2012.
According to the General Inspectorate for Immi-gration, in 2012, the number of legal foreign residentsin Romania reached 102 800 persons, more than halfof whom (55 800 persons) were third-countrynationals, mainly from Moldova (13 300 persons),Turkey (8 900 persons), and China (6 900 persons).EEA nationals numbered 46 900, led by Italians(10 700 persons), Germans (7 400 persons), and French(5 700 persons). The regional distribution of immi-grants in Romania is uneven. While the capital regionBucharest attracts the largest number of immigrants,immigrants from Moldova are concentrated in theEastern counties (such as Ia i, Boto ani and Gala i).
Labour migration to Romania is still relativelymodest, both under the general work permit schemeand the EU Blue Card for highly-skilled workers.In 2012 the General Inspectorate for Immigrationissued 2 800 work authorisations to foreign citizens.Most of them were issued to permanent workers(1 800 persons), followed by posted workers (700),athletes (200) and highly skilled workers (110). Morethan 400 work contracts were registered in Romaniain 2012 on the basis of bilateral agreements. An
additional 360 persons obtained work contracts fordomestic work (housekeeping and care for the elderly)and 50 for work in hotels and restaurants. At the sametime, 720 Romanians obtained a job in other EUcountries with the assistance of EURES employmentnetwork in Romania (of these, Spain and Germanyreceived 270 workers each, Denmark 110, and Finland50). Labour emigration from Romania is, however,much more extensive than these figures suggest. Inparticular since, the EU accession facilitated freemovement of the Romanian nationals within the EU,Romanians are among the top nationalities of foreignresidents and foreign workers in many EU memberstates.
In 2012, the number of asylum applicants inRomania reached almost 3 000 persons, with 44% morecompared to 2011. Most of the asylum seekers in 2012came from Algeria (700), Pakistan (420) and Morocco(400). Figures from UNHCR are slightly different, butshow a similar increase from 1 500 in 2011 to 2 500in 2012, and a decline to 1 500 in 2013. Syria was themain country of origin for asylum seekers to Romania,in 2013.
Recent developments in the field of migrationlegislation in Romania have been driven by the needto harmonise and co-ordinate the national law withthe EU legal framework, in particular in the field ofresidential and work regimes for EU/EEA nationals,third-country nationals, and asylum seekers. Roma-nian authorities have prioritised the following fieldsof migration policy: controlled immigration policy,prevention and fighting against irregular immigration,asylum policy, and social integration of foreigners.
Since the accession of Romania to the EU, irregu-lar migration has become one of the main challengeson the national migration agenda. The number ofmigrants transiting through the Romanian territoryhas recently been on the rise. Furthermore, Romaniaas the edge of the EU and Eastern Schengen bordersacquired new responsibilities in terms of manage-ment of irregular migration and human trafficking.Legislative work is thus underway with the aim ofintroducing legal, institutional, administrative andtechnical measures for the implementation of theSchengen regulations.
For further informationwww.insse.rowww.mai.gov.rowww.ori.mai.gov.ro.
INTERNATIONAL MIGRATION OUTLOOK 2014 © OECD 2014290

4. COUNTRY NOTES: RECENT CHANGES IN MIGRATION MOVEMENTS AND POLICIES
Recent trends in migrants’ flows and stocksROMANIA
Migration flows (foreigners)2000 2005 2011 2012
Average Level (’000)National definition 2002-06 2007-11 2012
Per 1 000 inhabitantsInflows 0.5 0.2 0.7 .. 0.2 0.5 ..Outflows .. .. .. .. .. .. ..Migration inflows (foreigners) by type Thousands % distribution
Inflows of top 10 nationalitiesas a % of total inflows of foreigners
Permit based statistics (standardised) 2011 2012 2011 2012Work .. .. .. ..Family (incl. accompanying family) .. .. .. ..Humanitarian .. .. .. ..Free movements .. .. .. ..Others .. .. .. ..Total .. .. .. ..
Temporary migration 2005 2011 2012Average2007-11
ThousandsInternational students .. .. .. ..Trainees .. .. .. ..Working holiday makers .. .. .. ..Seasonal workers .. .. .. ..Intra-company transfers .. .. .. ..Other temporary workers .. .. .. ..
Inflows of asylum seekers 2000 2005 2011 2012Average Level
2002-06 2007-11 2012Per 1 000 inhabitants 0.1 0.0 0.1 0.1 0.0 0.1 2 511
Components of population growth 2000 2005 2011 2012Average Level (’000)
2002-06 2007-11 2012Per 1 000 inhabitants
Total -1.1 -2.2 -2.3 -2.7 -7.4 -1.8 -58Natural increase -0.9 -1.9 -2.2 -2.6 -2.2 -1.8 -55Net migration -0.2 -0.3 0.0 -0.1 -5.3 -0.1 -3
Stocks of immigrants 2000 2005 2011 2012Average Level (’000)
2002-06 2007-11 2012Percentage of the total population
Foreign-born population .. .. .. .. .. .. ..Foreign population .. .. 0.3 .. .. 0.3 ..
Naturalisations 2000 2005 2011 2012Average Level
2002-06 2007-11 2012Percentage of the foreign population .. .. .. .. .. .. ..
Labour market outcomes 2000 2005 2011 2012Average
2002-06 2007-11Employment/population ratio
Native-born men 69.5 93.7 64.9 66.5 64.3 65.3Foreign-born men .. 76.2 74.2 74.3 73.9 79.5Native-born women 59.0 51.5 52.0 52.6 52.7 52.2Foreign-born women .. 33.7 38.1 52.5 34.7 47.7
Unemployment rateNative-born men 8.2 8.1 8.2 7.8 8.6 7.8Foreign-born men .. 4.0 4.5 6.1 5.2 4.8Native-born women 7.2 6.8 7.1 6.7 7.0 6.2Foreign-born women .. .. .. 14.2 14.6 4.4
Macroeconomic indicators 2000 2005 2011 2012Average Level
2002-06 2007-11 2012Annual growth in %
Real GDP 2.4 4.2 2.2 .. 6.2 1.6GDP/capita (level in US dollars) .. .. .. .. .. .. 17 708Employment (level in thousands) 0.0 0.1 -1.1 .. -2.5 -0.3 ..
Percentage of the labour forceUnemployment 6.8 7.2 7.4 .. 7.4 6.8
Notes and sources are at the end of the chapter.1 2 http://dx.doi.org/10.1787/888933158295
0 10 20 30 400
Romania
20102005-09 annual average
MoldovaItaly
GermanyUnited States
TurkeyChina
HungaryCanadaFrance
Syria
INTERNATIONAL MIGRATION OUTLOOK 2014 © OECD 2014 291

4. COUNTRY NOTES: RECENT CHANGES IN MIGRATION MOVEMENTS AND POLICIES
Russian FederationMigration inflows to the Russian Federationcontinued to rise in 2012-13. Permanent immigrationto the Russian Federation in 2012 reached almost418 000 people, 17% more than in 2011. In 2013, thenumber rose further to 482 000. Emigration rose from33 500 in 2011 to 123 000 in 2012 and 182 000 in 2013.This partially reflects a change in Rosstat methodo-logy: since 2011, temporary migrants whose residencelasts for more than nine months are included inimmigration statistics and considered as emigrantswhen their registration period expires. Net migrationto the Russian Federation was thus about 295 000 inboth 2012 and 2013. Immigration has been dominatedby migrants from CIS countries: Uzbekistan (21%in 2012, up from 18% in 2011), followed by Ukraine(12%), Kazakhstan (11%), Armenia (10%), Tajikistan(9%) and Kyrgyzstan (8%).
In 2012 and 2013 the Russian authorities issuedabout 350 000 temporary and permanent residencepermits annually, one-fourth more than in 2011. Thetop five countries of origin accounted for two-thirds ofall permits: Ukraine and Uzbekistan (about 15%),Armenia (14%), Kazakhstan (about 12%), and Tajikistan(11%). The stock of residence permit holders increased26% in 2012, to 653 000, and a further 13% in 2013,to 740 000. Almost 96 000 persons were naturalisedin 2012, and 136 000 in 2013.
Migration to the Russian Federation is largelytemporary. 2.1 million temporary migrant workersentered in 2011, 2.7 million in 2012 and 2.9 millionin 2013. Of these, 1.4 million received regular workpermits in each year and the remainder were issuedpatents (licences for work in private households,issued to nationals of countries with visa-free entry).
Outside the quota system for visa-free countrynationals, work permits are issued for selected profes-sions and highly-skilled specialists. 129 000 wereissued for professions in 2013, up from 44 000 in 2012.26 000 were issued for highly-skilled specialists, upfrom 12 000 in 2012.
In 2012-13, CIS citizens with visa-free entry to theRussian Federation represented about 85% of workpermit holders and more than 90% of all foreignworkers (including patent holders). Nationals ofUzbekistan accounted for more than two in five,followed by Tajikistan, Ukraine and Kyrgyzstan. Theleading nationalities for non-CIS countries amongwork permits were China (over 90 000), North Korea(over 30 000), and Turkey (which increased from 26 000in 2012 to 34 000 in 2013).
The stock of foreign students at Russian univer-sities has been recently growing, and increased by 7%
during the 2012/13 academic year, to 172 000. Threequarters were citizens of CIS countries, mainlyKazakhstan (34 000), Belarus (26 000), Turkmenistan(12 000), Uzbekistan and Azerbaijan (11 000 each).Despite slightly fewer new students, China remains themain non-CIS country of origin of foreign students.
In 2012, the Russian Federation further restrictedits simple naturalisation procedures under inter-national agreements with Kazakhstan, Kyrgyzstanand Belarus, which imposed only a three-monthresidence requirement and the intention to becomeresident in the Russian Federation. Most naturalisedRussians under the scheme had been temporarylabour migrants. The state programme of Assistancein the Voluntary Return of Compatriots Living Abroadgrew significantly. The stock of participants and theirfamily members increased from 58 000 in 2011to 147 000 in 2013. This repatriation programme isnow the main source for naturalisation.
Recent legislation strengthened measures againstillegal immigration. A three-year entry ban was intro-duced for overstaying foreigners and, in 2013, sanc-tions for fictitiously providing residence addresses forforeigners were introduced. The stay for visa-freecountry nationals who do not have a work permit, pat-ent or other document of legal stay was reducedin 2013 to 90 days every 180 days. A December 2013 lawstipulates introduction (from 2015) of a compulsorytest of Russian language and Russian history for bothresidence permit applicants and temporary workpermit applicants. New preferences in citizenshipacquisition were introduced in April 2014 for nativeRussian language speakers.
From August 2014, Russian nationals are requiredto notify the Russian Federal Migration Service if theyobtain a residence permit or naturalise in anothercountry, unless they are taking up permanentresidence abroad. Failure to report will incur financialand criminal penalties.
A draft law under discussion in 2013 wouldreplace quota-based work permits with the patentsystem, simplifying hiring by employers and legalentities.
For further information
www.fms.gov.ruwww.fms.gov.ru/government_serviceswww.mid.ruwww.gks.ru.
INTERNATIONAL MIGRATION OUTLOOK 2014 © OECD 2014292

4. COUNTRY NOTES: RECENT CHANGES IN MIGRATION MOVEMENTS AND POLICIES
Recent trends in migrants’ flows and stocksRUSSIAN FEDERATION
Migration flows (foreigners)2000 2005 2011 2012
Average Level (’000)National definition 2002-06 2007-11 2012
Per 1 000 inhabitantsInflows 2.5 1.2 2.5 2.9 1.1 2.0 417.7Outflows 1.0 0.5 0.3 0.9 0.6 0.3 122.8Migration inflows (foreigners) by type Thousands % distribution
Inflows of top 10 nationalitiesas a % of total inflows of foreigners
Permit based statistics (standardised) 2011 2012 2011 2012Work 273.0 .. 66.2 ..Family (incl. accompanying family) 93.9 .. 22.7 ..Humanitarian 1.8 .. 0.4 ..Free movements .. .. .. ..Others 44.0 .. 10.7 ..Total 412.6 0.0 100.0 ..
Temporary migration 2005 2011 2012Average2007-11
ThousandsInternational students .. 35.1 .. 35.4Trainees .. .. .. ..Working holiday makers .. .. .. ..Seasonal workers .. .. .. ..Intra-company transfers .. .. .. ..Other temporary workers .. 2 014.0 .. 1 265.2
Inflows of asylum seekers 2000 2005 2011 2012Average Level
2002-06 2007-11 2012Per 1 000 inhabitants 0.0 0.0 0.0 0.0 0.0 0.0 1 243
Components of population growth 2000 2005 2011 2012Average Level (’000)
2002-06 2007-11 2012Per 1 000 inhabitants
Total -4.0 -5.0 .. .. -4.8 .. ..Natural increase -6.5 -5.9 .. .. -5.7 .. ..Net migration 1.6 0.8 .. .. 0.6 .. ..
Stocks of immigrants 2000 2005 2011 2012Average Level (’000)
2002-06 2007-11 2012Percentage of the total population
Foreign-born population .. .. .. .. .. .. ..Foreign population .. .. .. 0.4 .. .. 621
Naturalisations 2000 2005 2011 2012Average Level
2002-06 2007-11 2012Percentage of the foreign population .. .. 19.6 .. .. .. 95 737
Labour market outcomes 2000 2005 2011 2012Average
2002-06 2007-11Employment/population ratio
Native-born men .. .. .. .. .. ..Foreign-born men .. .. .. .. .. ..Native-born women .. .. .. .. .. ..Foreign-born women .. .. .. .. .. ..
Unemployment rateNative-born men .. .. .. .. .. ..Foreign-born men .. .. .. .. .. ..Native-born women .. .. .. .. .. ..Foreign-born women .. .. .. .. .. ..
Macroeconomic indicators 2000 2005 2011 2012Average Level
2002-06 2007-11 2012Annual growth in %
Real GDP 10.0 6.4 4.3 3.4 6.7 2.9GDP/capita (level in US dollars) 10.8 6.8 4.2 .. 7.2 3.0 23 504Employment (level in thousands) .. 1.3 1.3 0.9 1.1 0.6 71 341
Percentage of the labour forceUnemployment 10.5 7.2 6.6 5.7 7.7 7.0
Notes and sources are at the end of the chapter.1 2 http://dx.doi.org/10.1787/888933158304
0 5 10 15 20 25
Russian Federation
20122002-11 annual average
UzbekistanUkraine
KazakhstanTajikistanArmenia
KyrgystanMoldova
AzerbaijanBelarus
China
INTERNATIONAL MIGRATION OUTLOOK 2014 © OECD 2014 293

4. COUNTRY NOTES: RECENT CHANGES IN MIGRATION MOVEMENTS AND POLICIES
Slovak RepublicThe inflow of migrants to the Slovak Republic havedeclined in the aftermath of the economic crisis (theinflow of foreigners halved between 2008 and 2011),while outflows were stable or slightly increasing.In 2012 the inflow of foreigners reported by theStatistical Office grew for the first time since the onsetof the crisis and reached more than 5 400 persons(compared to about 4 800 persons in 2011), while theoutflow was close to 2 000 persons, up slightlyfrom 2011.
The stock of foreign residents has graduallyincreased to almost 68 000 persons at the end of 2012.About two thirds of foreign residents in the SlovakRepublic are nationals of EU/EEA countries and morethan 80% of foreign residents are of European origin.More than 25 000 foreign residents were third-countrynationals, the top five nationalities being Ukrainian,Serbian, Russian, Vietnamese and Chinese.
The Slovak Republic’s GDP, which contracted by5% in 2009 and rebounded to grow 4% in 2010, has sinceseen decelerating growth, of 3.0% in 2011 and 1.8%in 2012. Unemployment (at 14%) and stagnant employ-ment engender little incentive for labour migration.The total stock of foreign workers at the end of 2012was 14 300, of which 5 200 persons were third-countrynationals. According to Slovak Labour Force Surveydata, the number of Slovaks working abroad declinedin the course of the crisis to the low of 116 000 personsin 2011, and increased subsequently to 121 000 personsin 2012. The most popular destinations for Slovakworkers abroad in 2013 were the Czech Republic(45 000 persons), Austria (29 000 persons) and Germany(10 000 persons).
The Slovak Republic recorded 730 asylumapplications in 2012 and 440 in 2013, although UNHCRfigures are somewhat lower (550 and 280).
Several statistical changes were made. In 2012,the registration of foreign births was changed so thatchildren born abroad to mothers with permanentresidence in the Slovak Republic are now excludedfrom the statistics unless they register as permanentresidents. Further, the definition of migration to andfrom abroad was extended to include any change ofthe country of permanent residence, disregarding thecitizenship of migrants. The methodology of recodingthe numbers of new residence permits was alsochanged according to Directive 862/2007/EC, toinclude permits renewed more than three monthsafter the expiration of the previous permit.
Following the adoption of the first national migra-tion policy document in 2011 and the adoption of a new
Act on Residence of Aliens that came into effect as of1 January 2012, further amendments of legislationwere induced by the transposition of the EU “Qualifica-tions” Directive (2011/95/EC) and EU “Single Permit”Directive (2011/98/EC) into national legislation, thesechanges came into effect as of January 2014. The mainchanges include introduction of a more effective pro-cess for granting a single permit for work and residencepurposes to third-country nationals. Applications forsuch permits will be filed with the Police Offices (whichwill be obliged to also accept incomplete applications).The granting of single permit is subject to the confir-mation by the local labour office (PES). The labour mar-ket test for regular work permits has been made morerestrictive, with the mandatory advertising time withthe PES increased from 15 to 30 calendar days. The PESis now allowed to propose candidates whose qualifica-tions do not exactly match the job requirements.Employers must also submit the position for a labourmarket test 45 days prior to permit renewal.
Intracompany transferees and secondees arenow subject to additional requirements, includinglegalisation and translation of foreign academicdegrees. A pre-approval process has been imposed,requiring employers to appear at local labour offices.A four-year limit is now imposed on intracompanytransfers and secondees.
Third-country nationals who legally stay in theSlovak Republic for purposes other than employmentand who are entitled to work will receive a residencepermit marked “entitled to work”. The single procedurewill be applied also for granting the Blue Cards accord-ing to the EC Blue Card Directive. In principle, the olddual permit system (residence permit and work permit)will be maintained in the Slovak Republic only forseasonal workers and posted workers.
Further legislative and regulatory changes areaimed at achieving a more systematic approach to theintegration of foreigners through improving proce-dures related to management of migration andintegration of immigrants, guaranteeing rightsand freedoms of the EU nationals and their familymembers, and the third-country nationals duringtheir entry and residence in the Slovak Republic, andharmonising the regulations in the fields of residencepermits and border protection.
For further information
www.minv.skwww.employment.gov.sk.
INTERNATIONAL MIGRATION OUTLOOK 2014 © OECD 2014294

4. COUNTRY NOTES: RECENT CHANGES IN MIGRATION MOVEMENTS AND POLICIES
Recent trends in migrants’ flows and stocksSLOVAK REPUBLIC
Migration flows (foreigners)2000 2005 2011 2012
Average Level (’000)National definition 2002-06 2007-11 2012
Per 1 000 inhabitantsInflows 0.9 1.4 1.5 0.5 1.3 2.5 2.9Outflows .. 0.2 0.4 0.4 .. 0.5 2.0Migration inflows (foreigners) by type Thousands % distribution
Inflows of top 10 nationalitiesas a % of total inflows of foreigners
Permit based statistics (standardised) 2011 2012 2011 2012Work .. .. .. ..Family (incl. accompanying family) .. .. .. ..Humanitarian .. .. .. ..Free movements .. .. .. ..Others .. .. .. ..Total .. .. .. ..
Temporary migration 2005 2011 2012Average2007-11
ThousandsInternational students .. .. .. ..Trainees .. .. .. ..Working holiday makers .. .. .. ..Seasonal workers .. .. .. ..Intra-company transfers .. .. .. ..Other temporary workers .. .. .. ..
Inflows of asylum seekers 2000 2005 2011 2012Average Level
2002-06 2007-11 2012Per 1 000 inhabitants 0.3 0.7 0.1 0.1 1.4 0.2 732
Components of population growth 2000 2005 2011 2012Average Level (’000)
2002-06 2007-11 2012Per 1 000 inhabitants
Total -3.7 0.8 1.9 2.2 0.4 1.7 12Natural increase 0.5 0.2 1.3 1.7 0.0 0.8 9Net migration -4.1 0.6 0.6 0.5 0.4 0.9 3
Stocks of immigrants 2000 2005 2011 2012Average Level (’000)
2002-06 2007-11 2012Percentage of the total population
Foreign-born population .. 4.6 .. 2.9 4.0 .. 158Foreign population 0.5 0.5 1.3 1.3 0.5 1.1 73
Naturalisations 2000 2005 2011 2012Average Level
2002-06 2007-11 2012Percentage of the foreign population .. 6.3 0.4 0.4 .. 1.2 255
Labour market outcomes 2000 2005 2011 2012Average
2002-06 2007-11Employment/population ratio
Native-born men 61.6 64.6 66.1 66.7 64.0 67.4Foreign-born men .. 67.1 73.0 68.4 66.5 73.9Native-born women 51.1 51.0 52.6 52.7 51.5 53.1Foreign-born women .. 37.7 46.7 59.7 43.1 51.4
Unemployment rateNative-born men 19.5 15.5 13.7 13.6 16.2 11.6Foreign-born men .. 17.4 11.4 14.1 17.5 8.8Native-born women 18.6 17.2 13.6 14.6 17.5 13.0Foreign-born women .. 28.6 20.9 9.1 25.7 12.7
Macroeconomic indicators 2000 2005 2011 2012Average Level
2002-06 2007-11 2012Annual growth in %
Real GDP 1.4 6.7 3.0 1.8 5.9 3.7GDP/capita (level in US dollars) 1.3 6.6 3.6 1.6 5.8 3.7 25 339Employment (level in thousands) -1.4 2.1 -0.1 0.6 1.6 0.1 2 329
Percentage of the labour forceUnemployment 18.8 16.2 13.6 13.9 16.7 12.1
Notes and sources are at the end of the chapter.1 2 http://dx.doi.org/10.1787/888933158316
0 5 10 15 20 25
Slovak Republic
20122003-11 annual average
HungaryCzech Republic
RomaniaBulgaria
ItalyGermany
PolandUkraine
ChinaAustria
INTERNATIONAL MIGRATION OUTLOOK 2014 © OECD 2014 295

4. COUNTRY NOTES: RECENT CHANGES IN MIGRATION MOVEMENTS AND POLICIES
SloveniaMigration flows in Slovenia have been recently onthe rise. In 2012, 12 300 foreigners immigrated to thecountry, which was 6.7% more than in the previousyear, but fell to 11 700 in 2013. Most foreign immi-grants in 2012 were nationals of countries of theformer Yugoslavia (74%), followed by EU nationals(17%). In 2013, about 25% were EU nationals; theincrease was related to Croatia’s entry in the EU inmid-2013.
Total emigration in 2012 reached 14 400 people,19.6% higher than during 2011. Emigration levels at14 100 were similar in 2013. While Slovenia has netpositive migration of foreigners, it has a net negativemigration of Slovenian citizens, with net emigrationof the latter at 5 500 in 2012 and 4 400 in 2013.
Almost 22 000 new residence permits wereissued to third country nationals in 2012, including10 500 permanent residence permits and 11 700 tem-porary ones. Following the transposition of the EUBlue Card Directive into the national legislationin 2011, only 11 applications for the EU Blue Card havebeen filed.
Overall, the number of temporary residenceauthorisations issued in 2012 reached 48 300 (includingboth new and renewed permits, as well as registrationsof EEA nationals). This fell slightly in 2013, to 44 800.New first-time temporary permits numbered 11 500in 2011 and 2012, but fell to 9 100 in 2013. The shareissued for reasons of employment or work fell from57% in 2011 to 38% in 2013, while those for othermotives increased.
At the end of 2012 there were 106 600 foreignersregistered in Slovenia on the basis of residencepermits or residence registration certificates, about5% more than in 2011. By the end of 2013, the numberhad increased to 110 300. While less than 10% of theforeign population in Slovenia were EEA nationalsin 2012, this share rose to 20% in 2013 with the entryof Croatia into the EU. The top five countries of originamong foreign population were neighbouring Balkancountries: Bosnia and Herzegovina (46 900), Kosovo(12 700), Croatia (10 800), the Former YugoslavRepublic of Macedonia (10 500) and Serbia (9 900).In 2013, most valid temporary permits were for thepurposes of employment (about 47%), followed byfamily reunification permits (29%). The share ofpermanent residence permits among all permitsincreased between 2009 and 2013 from 39% to 55%.
The number of asylum applications fell from 400in 2011 to 350 in 2012 and 300 in 2013. In 2013, theleading origin countries were Syria (23%) and Kosovo(13%). About 10% of applicants were recognised as
refugees, and others (6% in 2012 and 5% in 2013) weregranted subsidiary protection. At the end of 2012there were 170 persons with international protectionstatus in Slovenia. During the first three years, thesepersons are entitled to a tailor-made personal integra-tion plan, in which 80 persons participated in 2012.
In 2012 there were 1 400 illegal border crossingsdetected, 56% more than the previous year. In 2013the number of illegal border crossings was about 900,or 36% fewer than in 2012.
Integration programmes for third-countrynationals, introduced in 2008, include Slovenian lan-guage courses, courses in history, culture and consti-tution, intercultural dialogue, facilitation of societalintegration of special target groups, and awarenessraising projects aimed at employers. In 2012 morethan 1 500 immigrants took language courses. A newfeature of integration programmes introduced in 2012targets specific immigrant groups (e.g. courses forparents of children enrolled in elementary schoolswith predominantly immigrant population, pro-grammes for societal integration of women, orminors). Other programmes targeted Slovenianemployers to inform them about integration pro-grammes for third-country nationals.
In March 2013, Slovenia concluded a bilateralagreement with Bosnia and Herzegovina regarding theemployment of Bosnia and Herzegovina nationals inSlovenia. The two countries will co-operate, withBosnia and Herzegovina reserving the possibility tosuspend placement of workers whose departuremight have negative effects on the labour market.Further administrative initiatives in 2012 included thecreation of a new Directorate of Internal Administra-tive Affairs, Migration and Naturalization within theMinistry of Interior. The Directorate is composed of aMigration Office and a Naturalization Office.
In 2014, Slovenia amended its aliens act to trans-pose the EU Single Permit directive. From 2015, anumber of changes will come into effect to simplifypermit procedures. In addition to the creation of“one-stop shops” and a single procedure for permitissuance, in-country status changes will be facilitated.The time limit for permit processing has been reducedfrom 90 to 60 days.
For further information
www.mddsz.gov.si/enwww.mnz.gov.si/enwww.stat.si/engwww.infotujci.si/.
INTERNATIONAL MIGRATION OUTLOOK 2014 © OECD 2014296

4. COUNTRY NOTES: RECENT CHANGES IN MIGRATION MOVEMENTS AND POLICIES
Recent trends in migrants’ flows and stocksSLOVENIA
Migration flows (foreigners)2000 2005 2011 2012
Average Level (’000)National definition 2002-06 2007-11 2012
Per 1 000 inhabitantsInflows .. .. 8.8 8.4 .. 12.6 17.3Outflows 1.0 3.3 1.0 0.8 3.2 4.7 1.7Migration inflows (foreigners) by type Thousands % distribution
Inflows of top 10 nationalitiesas a % of total inflows of foreigners
Permit based statistics (standardised) 2011 2012 2011 2012Work .. .. .. ..Family (incl. accompanying family) .. .. .. ..Humanitarian .. .. .. ..Free movements .. .. .. ..Others .. .. .. ..Total .. .. .. ..
Temporary migration 2005 2011 2012Average2007-11
ThousandsInternational students .. .. .. ..Trainees .. .. .. ..Working holiday makers .. .. .. ..Seasonal workers .. .. .. ..Intra-company transfers .. .. .. ..Other temporary workers .. .. .. ..
Inflows of asylum seekers 2000 2005 2011 2012Average Level
2002-06 2007-11 2012Per 1 000 inhabitants 4.6 0.8 0.2 0.1 0.5 0.1 305
Components of population growth 2000 2005 2011 2012Average Level (’000)
2002-06 2007-11 2012Per 1 000 inhabitants
Total 1.2 2.9 1.6 2.6 1.3 6.2 5Natural increase -0.2 -0.3 1.8 1.6 -0.6 1.2 3Net migration 1.4 3.2 -0.3 1.0 1.9 4.9 2
Stocks of immigrants 2000 2005 2011 2012Average Level (’000)
2002-06 2007-11 2012Percentage of the total population
Foreign-born population .. .. 11.2 14.6 .. .. 300Foreign population .. .. 4.9 5.0 .. .. 103
Naturalisations 2000 2005 2011 2012Average Level
2002-06 2007-11 2012Percentage of the foreign population #N/A .. 1.9 0.8 .. .. 768
Labour market outcomes 2000 2005 2011 2012Average
2002-06 2007-11Employment/population ratio
Native-born men 66.7 70.2 67.6 67.0 69.4 70.7Foreign-born men 66.7 72.7 68.4 71.4 69.8 71.4Native-born women 58.2 61.3 61.6 61.0 60.2 63.1Foreign-born women 61.3 61.6 54.3 55.2 62.1 59.6
Unemployment rateNative-born men 6.6 6.2 8.2 8.6 5.7 5.9Foreign-born men 10.0 6.2 9.7 8.3 6.5 7.2Native-born women 7.1 7.1 7.8 9.1 6.8 6.2Foreign-born women 7.9 7.8 14.0 14.5 8.7 9.0
Macroeconomic indicators 2000 2005 2011 2012Average Level
2002-06 2007-11 2012Annual growth in %
Real GDP 4.3 4.0 0.7 -2.5 4.2 0.9GDP/capita (level in US dollars) 4.0 3.8 0.5 -2.7 4.0 0.4 27 921Employment (level in thousands) 2.0 0.6 -3.1 -1.3 1.0 -0.5 924
Percentage of the labour forceUnemployment 6.7 6.5 8.2 8.8 6.3 6.1
Notes and sources are at the end of the chapter.1 2 http://dx.doi.org/10.1787/888933158322
0 10 20 30 400
Slovenia
20122007-11 annual average
Bosnia and HerzegovinaBulgariaCroatiaSerbia
FYROMItaly
PolandSlovak Republic
Russian FederationSpain
INTERNATIONAL MIGRATION OUTLOOK 2014 © OECD 2014 297

4. COUNTRY NOTES: RECENT CHANGES IN MIGRATION MOVEMENTS AND POLICIES
SpainThe inflow of foreigners to Spain stood at336 100 persons in 2012, a substantial declinecompared to the previous year (416 300 persons). Atthe same time, the outflow of foreigners increasedfrom 317 700 in 2011 to 320 700 in 2012. The netmigration flow of foreigners in 2012 remained positiveat 15 500 persons, but was at its lowest level in at leasta decade.
This decline is partly due to labour migrationmanagement. Hiring non-resident foreign nationalshas been restricted and priority given to foreignnationals already residing in the country. The use ofinstruments for recruiting non-resident foreignnationals (Shortage Occupation Lists and collectivemanagement of hiring in the country of origin) hasbeen reduced. First-time labour permits to non-EUnationals arriving from abroad have continued todecline since 2007, to 19 700 in 2010, 7 600 in 2011 and6 000 in 2012. The main nationalities in 2012 werePeru (12%), Philippines and Colombia (9%), China (8%)and the United States (7%). A further 3 800 workerscame for seasonal employment. In addition,41 500 non-EU nationals, led by nationals of Peru andMorocco, received exceptional residence authori-sation issued under exceptional circumstances.
The number of foreigners with registration certifi-cates or valid residence cards as of 31 December 2012reached 5.5 million. Third-country nationals accountedfor about half the foreign population. The number ofSpaniards emigrating abroad increased in 2012,although most emigrants were foreign-born whoacquired Spanish nationality and were returning totheir countries of origin. From 2009 to 2012, the stockof native-born Spaniards residing abroad increasedby 40 000.
While EU nationals represented half of foreignresidents in 2012, they are a larger share of inflow.From mid-2012 to mid-2013, EU nationals comprisedalmost 62% of the annual increase of foreign popu-lation. In 2012, Spain had the second largest numberof resident EU citizens (after Germany). However, only23% of permanent residents were EU nationals.
Irregular immigration to Spain has subsided inrecent years, mainly due to the policy aimed atcombating irregular immigration and co-operatingwith countries of origin and transit. In the CanaryIslands there were 200 irregular entries in 2013(compared with 31 600 in the peak year of 2006). Seaarrivals elsewhere have stabilised or declined (3 600in 2012 and 3 000 in 2013). However, illegal land-border crossings from Morocco to Ceuta and Melillaincreased, from 2 800 in 2012 to 4 200 in 2013.
Given the relatively high unemployment rate offoreign workers in Spain, integration policy is seen as
a means for achieving social cohesion. Foreignersbenefit greatly from active employment policies andspecial efforts are aimed at preventing irregularity.
Poor labour market conditions led the govern-ment to extend special transitional measures forRomanian citizens and to apply transitional measuresfor Croatian nationals following accession.
The economic crisis seems not to have caused anegative social perception of immigration. According tothe 2013 Centre for Sociological Research BarometerSurvey, only 2.9% of Spaniards consider immigration aproblem and fewer still (0.4%) a fundamental problem.Similarly, the Second Global Report on Findings on Socialand Intercultural Coexistence in High Diversity Regionscompiled by the Community Projects section of “LaCaixa” concluded that the economic and employmentcrisis did not seem to have a negative impact on theperception of cultural diversity.
Official concern that unemployment and the crisiscould increase racism and xenophobia prompted theGovernment, in 2012 and 2013, to implement a numberof awareness-raising and training actions. Theseincluded training the staff of law enforcement agencieson racism issues. Further, anti-racism training wasimplemented in 2013 in the fields of education andjustice, the latter involving prosecutors, judges andcourt clerks.
In 2012 and 2013, a project on “Diversity Manage-ment in Small and Medium-Sized Enterprises” waslaunched to study ways of handling diversity amongmigrants and ethnic minorities and to raise aware-ness of the benefits of correct cultural diversitymanagement in small and medium-sized businesses,and to promote a positive image of the integration ofmigrants and ethnic minorities.
An evaluation study has been conducted toassess the immigration policy. One of the findingssupported the need to adopt a special system ofstreamlining procedures for investors, entrepreneurs,highly qualified staff and those involved in intra-company movements seeking to enter and stay inSpain. This specific model combines the perspectivesof support to business internationalisation and thepromotion of economic growth based on thetraditional goals of migration policy: security andemployment.
For further information
http://extranjeros.empleo.gob.es/es/index.htmlwww.empleo.gob.es/es/estadisticas/index.htmwww.ine.es/inebmenu/mnu_migrac.htm.
INTERNATIONAL MIGRATION OUTLOOK 2014 © OECD 2014298

4. COUNTRY NOTES: RECENT CHANGES IN MIGRATION MOVEMENTS AND POLICIES
Recent trends in migrants’ flows and stocksSPAIN
Migration flows (foreigners)2000 2005 2011 2012
Average Level (’000)National definition 2002-06 2007-11 2012
Per 1 000 inhabitantsInflows 8.2 15.7 9.0 7.3 14.0 12.9 336.1Outflows .. 1.1 6.9 6.9 1.0 6.0 320.7Migration inflows (foreigners) by type Thousands % distribution
Inflows of top 10 nationalitiesas a % of total inflows of foreigners
Permit based statistics (standardised) 2011 2012 2011 2012Work 75.9 47.5 26.1 22.6Family (incl. accompanying family) 58.8 39.8 20.2 19.0Humanitarian 1.0 0.5 0.3 0.2Free movements 148.9 116.0 51.2 55.3Others 6.5 5.9 2.2 2.8Total 291.0 209.8 100.0 100.0
Temporary migration 2005 2011 2012Average2007-11
ThousandsInternational students 29.9 51.8 42.9 45.0Trainees .. .. .. ..Working holiday makers .. .. .. ..Seasonal workers 7.0 2.2 2.2 13.6Intra-company transfers 1.2 0.8 0.9 1.0Other temporary workers 33.8 14.6 6.7 27.8
Inflows of asylum seekers 2000 2005 2011 2012Average Level
2002-06 2007-11 2012Per 1 000 inhabitants 0.2 0.1 0.1 0.1 0.1 0.1 2 579
Components of population growth 2000 2005 2011 2012Average Level (’000)
2002-06 2007-11 2012Per 1 000 inhabitants
Total 10.6 16.6 3.6 0.9 15.6 10.7 43Natural increase 0.9 1.8 2.3 1.8 1.5 2.5 85Net migration 9.7 14.8 1.3 -0.9 14.1 8.1 -41
Stocks of immigrants 2000 2005 2011 2012Average Level (’000)
2002-06 2007-11 2012Percentage of the total population
Foreign-born population 4.9 11.1 14.6 14.3 10.0 14.2 6 618Foreign population 3.4 9.5 12.4 12.0 8.4 12.3 5 520
Naturalisations 2000 2005 2011 2012Average Level
2002-06 2007-11 2012Percentage of the foreign population 1.3 1.1 2.0 2.0 1.0 1.7 115 557
Labour market outcomes 2000 2005 2011 2012Average
2002-06 2007-11Employment/population ratio
Native-born men 70.9 74.8 64.0 61.3 73.7 69.3Foreign-born men 74.4 79.2 59.8 53.9 79.7 66.1Native-born women 41.1 50.2 52.0 50.9 47.9 52.7Foreign-born women 46.7 59.4 50.8 47.7 56.4 55.2
Unemployment rateNative-born men 9.5 6.8 19.3 22.6 7.3 13.2Foreign-born men 12.3 9.4 30.9 36.2 10.2 23.9Native-born women 20.5 12.0 20.4 23.3 13.9 15.9Foreign-born women 17.8 13.9 30.0 34.7 16.1 22.8
Macroeconomic indicators 2000 2005 2011 2012Average Level
2002-06 2007-11 2012Annual growth in %
Real GDP 5.0 3.6 0.1 -1.6 3.3 0.1GDP/capita (level in US dollars) 4.2 1.9 -0.1 -1.7 1.7 -0.8 31 919Employment (level in thousands) 5.6 4.8 -1.9 -4.5 4.0 -1.7 17 282
Percentage of the labour forceUnemployment 10.8 9.2 21.6 25.0 10.0 15.9
Notes and sources are at the end of the chapter.1 2 http://dx.doi.org/10.1787/888933158333
0 5 10 15 20
Spain
20122002-11 annual average
MoroccoRomania
United KingdomChina
ItalyColombiaPakistan
Dominican RepublicGermany
Russian Federation
INTERNATIONAL MIGRATION OUTLOOK 2014 © OECD 2014 299

4. COUNTRY NOTES: RECENT CHANGES IN MIGRATION MOVEMENTS AND POLICIES
SwedenIn December 2013, the Swedish population reached9 million of which 1.5 million (15.9%) were foreign-born and about 468 000 Swedish-born with two for-eign-born parents. Together these groups accountedfor 21% of the total population. During 2013, theSwedish population increased by about 89 000 overthe previous year. 68% of the national populationincrease was attributable to the inflow of foreign-bornin 2013, compared with 63% in 2012.
Immigration to Sweden has been high in recentyears. In 2013, immigration figures reached a newpeak of 116 600 persons, up from 111 100 in 2012. Thiswas an increase by 5% percentage points compared tothe previous year. Humanitarian immigrants fromSyria and Somalia accounted for about 20% of thetotal inflow. In 2013 emigration figures dropped bynearly 1 000 to appriximately 51 700 resulting in netmigration by over 65 000.
The number of resident permits issued rose from103 000 in 2011 to 111 100 in 2012 and 116 600 in 2013.The number of refugees and persons otherwise inneed of protection, 16 700 in 2012, rose to 29 000in 2013. The number of those with right of residenceunder EU/EEA agreements fell from 24 600 in 2012 to20 700. Other changes were less dramatic. Permits ongrounds of family ties fell from 40 900 to 39 800, whilethose for labour market reasons dropped from 19 900to 19 300. The leading occupations for which workpermits were issued were low qualified jobs withinagriculture, forestry and fisheries, cleaning andcatering; the second largest groups were profes-sionals, such as computing specialists and engineers.The most common countries of origin were Thailand,India, China, Syria and Iran.
As a result of the deteriorating conflict in Syriain 2013, the Swedish Migration Board decided inSeptember 2013 that residence permits granted on thebasis of the general situation of violence in Syriashould be permanent. The Migration Board, however,continues to assess each asylum application on anindividual basis, for example, to establish whetherthere are reasons to grant refugee status.
In 2013, the Swedish Migration Board receivedabout 54 300 asylum applications, a 24% rise on theyear before (43 900, which was in turn a rise of 48% onthe 2011 figure). The main origins were Syria, Stateless,Eritrea, Somalia and Afghanistan. About a third of deci-sions during the year were grants of asylum. The num-ber of unaccompanied children has been growing.Unaccompanied minors comprised 3 600 claims in2012 and 3 900 in 2013, the most common countries oforigin being Afghanistan, Somalia, Syria and Eritrea.
In 2013 there were about 50 200 naturalisations.This was slightly fewer than in 2012 (51 200). Themain prior nationality was Iraqi (29% in 2013).
The Swedish government is currently imple-menting policy changes proposed by a ParliamentaryCommittee on Circular Migration and Development.The Swedish Consumer Agency has been tasked withbuilding a remittance price comparison website toimprove safety and transparency and lower remit-tance cost. Legislative changes in force from July 2014aim to facilitate circular migration between Swedenand third countries – and strengthen the positivedevelopmental effects of migration.
Other legislative changes in force from August 2014add control measures to curb abuse of the labour immi-gration system and to prevent exploitation of migrantworkers from non-EU/EEA countries.
For the budget year 2014, the government hastaken a number of initiatives to promote integration.These include a regulation that obliges new arrivalswith an introduction plan to accept an appropriate joboffer, changes to the rules regarding introductionallowances which reduce the lead time prior tocommencing the introduction plan, and assistance infinding accommodation.
From January 2013, a review of foreign creden-tials has been brought under the University andHigher Education Council, which now is responsiblefor the assessment of foreign upper secondary schoolleaving certificates, and for certain qualifications inhigher and tertiary education not covered elsewhere.In 2013, the agency received close to 14 000 applica-tions, of which close to 10 000 were resolved. Applica-tions for recognition in regulated professions are sentto other competent bodies, such as the National Boardof Health and Welfare.
The government is carrying out a broad set ofmeasures to improve school results in 2013-16.Initiatives include, extended teaching time for newlyarrived pupils in primary schools, skills enhancementof teachers and principals, surveys of knowledgeamong new arrival pupils, improved quality oflanguage tuition and information on free choice ofschool in different languages.
For further information
www.migrationsverket.sewww.scb.se.
INTERNATIONAL MIGRATION OUTLOOK 2014 © OECD 2014300

4. COUNTRY NOTES: RECENT CHANGES IN MIGRATION MOVEMENTS AND POLICIES
Recent trends in migrants’ flows and stocksSWEDEN
Migration flows (foreigners)2000 2005 2011 2012
Average Level (’000)National definition 2002-06 2007-11 2012
Per 1 000 inhabitantsInflows 4.8 5.6 8.0 8.7 6.0 8.6 82.6Outflows 1.4 1.7 2.5 2.8 1.8 2.2 26.6Migration inflows (foreigners) by type Thousands % distribution
Inflows of top 10 nationalitiesas a % of total inflows of foreigners
Permit based statistics (standardised) 2011 2012 2011 2012Work 4.8 4.4 6.6 5.3Family (incl. accompanying family) 27.1 33.6 37.7 41.1Humanitarian 12.7 17.4 17.6 21.2Free movements 27.3 26.4 38.0 32.3Others .. .. .. ..Total 71.8 81.7 100.0 100.0
Temporary migration 2005 2011 2012Average2007-11
ThousandsInternational students 10.8 10.3 13.0 14.1Trainees 0.6 0.4 0.5 0.6Working holiday makers .. .. .. ..Seasonal workers 0.5 3.8 5.7 4.3Intra-company transfers .. .. .. ..Other temporary workers 4.8 17.2 19.1 12.9
Inflows of asylum seekers 2000 2005 2011 2012Average Level
2002-06 2007-11 2012Per 1 000 inhabitants 1.8 1.9 3.1 4.6 2.9 3.1 43 876
Components of population growth 2000 2005 2011 2012Average Level (’000)
2002-06 2007-11 2012Per 1 000 inhabitants
Total 2.5 4.0 7.1 7.7 4.5 8.0 73Natural increase -0.3 1.0 2.3 2.2 0.9 2.2 21Net migration 2.8 3.0 4.8 5.4 3.6 5.8 52
Stocks of immigrants 2000 2005 2011 2012Average Level (’000)
2002-06 2007-11 2012Percentage of the total population
Foreign-born population 11.3 12.5 15.1 15.5 12.3 14.3 1 473Foreign population 5.3 5.1 6.9 7.0 5.2 6.4 667
Naturalisations 2000 2005 2011 2012Average Level
2002-06 2007-11 2012Percentage of the foreign population 8.8 7.8 5.8 7.7 7.6 5.4 50 179
Labour market outcomes 2000 2005 2011 2012Average
2002-06 2007-11Employment/population ratio
Native-born men 74.3 76.2 77.5 77.4 76.5 77.0Foreign-born men 59.6 63.7 67.5 67.5 64.5 67.8Native-born women 71.8 72.6 74.4 75.0 73.5 73.8Foreign-born women 54.7 58.4 57.8 58.4 58.9 57.8
Unemployment rateNative-born men 5.1 7.0 6.3 6.7 5.8 6.3Foreign-born men 13.5 15.1 16.6 16.9 13.4 14.6Native-born women 4.3 6.9 6.2 6.3 5.4 6.2Foreign-born women 11.2 13.7 15.9 15.1 11.6 14.6
Macroeconomic indicators 2000 2005 2011 2012Average Level
2002-06 2007-11 2012Annual growth in %
Real GDP 4.5 3.2 2.9 0.9 3.3 1.4GDP/capita (level in US dollars) 4.3 2.7 2.2 0.2 2.9 0.6 42 022Employment (level in thousands) 2.2 0.4 2.3 0.6 0.4 0.9 4 655
Percentage of the labour forceUnemployment 6.7 7.7 7.8 8.0 7.0 7.4
Notes and sources are at the end of the chapter.1 2 http://dx.doi.org/10.1787/888933158341
0 4 82 6 10 12
Sweden
20122002-11 annual average
SyriaAfghanistan
SomaliaPoland
IraqDenmark
ChinaThailand
FinlandEritrea
INTERNATIONAL MIGRATION OUTLOOK 2014 © OECD 2014 301

4. COUNTRY NOTES: RECENT CHANGES IN MIGRATION MOVEMENTS AND POLICIES
SwitzerlandIn 2012, 143 800 immigrants entered Switzerlandwith the intention of long-term stay in the country(close to the 2011 level). More than 72% of the inflowcomprised EU/EEA citizens, whose share increased by2 percentage points compared with 2011. The topcountries of origin among immigrants in 2012 wereGermany and Portugal, whose nationals comprised19% and 13% respectively of the inflow. The share ofPortuguese nationals increased from the previousyear. Immigration by Italian nationals has also beenon the rise since 2007. Among EU/EEA nationals, themain reason for immigration was employment(63.5%), while for third-country nationals it wasmainly for family reunification purposes (52.4%).In 2013, total inflows increased by 8%, to 155 400.
In 2012, 65 900 foreigners de-registered theirresidence in Switzerland (1 800 more than in 2011),among them 71.3% were EU/EEA nationals, and 45%were in the age group between 20 and 34 years.In 2013, more than 70 000 foreigners de-registered.
At the end of 2012, the foreign population inSwitzerland reached 1 825 100 persons, a 3% increasein one year. Foreigners comprised 22.8%. An increaseof 3.4% was seen in 2013, bringing the foreign popula-tion to 1 886 600. The most frequent nationalitiesamong foreign population in 2013 were Italian (16%),German (15.5%), Portuguese (13.5%) and French (5.8%).
EU/EEA nationals represented more than 90% offoreign workers admitted to Switzerland in 2012(66 700 persons). German nationals dominated theforeign workers inflow in 2012, while during the firsthalf of 2013 a substantial increase was observed in theshare of foreign workers from Southern Europe(Portugal, Italy, Spain and Greece).
In 2012, there was a sharp increase in the numberof applicants for asylum in Switzerland: 28 600 newapplications were submitted, the highest levelsince 1999 and 27% more than in 2011, when22 600 applications were filed. In 2013, the numberdeclined to 21 500. The main countries of origin of asy-lum seekers in 2013 were Eritrea, Syria, Nigeria andTunisia. The total number of recognised refugeesin 2012 was 2 500, an approval rate of 12% – lower thanthe 21% approval rate in 2011. The recognition rate wasabove 15% in 2013. In additional recognised cases, pro-visory admission was granted to other asylum seekers.
The number of naturalisations in Switzerlandin 2012 reached 33 500, continuing a decline thatstarted in 2006, although the number increased to34 300 in 2013. The main groups among thosenaturalised in 2013 were nationals of Italy, Germany,Kosovo and Serbia.
The number of residence permits granted to EU8nationals rose sharply following the extension of freecirculation to this group on 1 May 2011. Restrictionson the labour market access of Romanian andBulgarian nationals will be applied until 2016. Thesafeguard clause applied to workers who are nationalsof other EU countries expired in Spring 2014.
In the field of support to integration of foreigners,a consolidation of co-operation among the Confedera-tion, cantons, towns and local communities continuedduring 2012 and 2013. Since 2014, the cantons providesupport to the integration of foreigners in eight keyareas that have been agreed at the Confederation level.Strategic objectives for integration efforts reflecting thelocal conditions have already been determined in thecourse of 2012. Mandatory features, based on the prin-ciple of “support and challenge” (encourager et exiger),will be reinforced and some of its elements incorpo-rated into legislation.
Legislative efforts regarding naturalisation law arefocused on ensuring coherence among legal regula-tions of the stay of foreigners and their integrationobligations, including language requirements, and onthe simplification and harmonisation of relatedprocedures. The Federal Parliament adopted the newlaw on nationality in June 2014. The required residenceperiod was lowered from 12 to 10 years.
A referendum carried out in June 2013 confirmedthe amendments that introduced into the asylum lawmeasures aimed against asylum seekers who under-mine public order and security. The new ordinanceintroduced a trial stage that should allow for theevaluation of new modalities in the domain ofasylum. One of the outcomes of the reform should beto accelerate asylum procedures.
On 9 February 2014, a popular initiative “AgainstMass Immigration” was voted in a public referendum.The initiative calls for introducing annual caps onimmigration. The Federal Council has taken steps toaddress the requirements of the initiative andpresented a plan in June 2014. In July 2014, Switzer-land presented the EU with a request to revise theAgreement on the free movement of persons. Untilnew legislation is in place, all current agreementsremain.
For further information
www.bfm.admin.ch/bfm/en/home.htmlwww.bfs.admin.ch/bfs/portal/en/index/themen/01/07.html.
INTERNATIONAL MIGRATION OUTLOOK 2014 © OECD 2014302

4. COUNTRY NOTES: RECENT CHANGES IN MIGRATION MOVEMENTS AND POLICIES
Recent trends in migrants’ flows and stocksSWITZERLAND
Migration flows (foreigners)2000 2005 2011 2012
Average Level (’000)National definition 2002-06 2007-11 2012
Per 1 000 inhabitantsInflows 12.2 12.7 18.0 18.1 13.2 18.3 143.8Outflows 7.8 6.7 8.1 8.3 6.7 7.6 65.9Migration inflows (foreigners) by type Thousands % distribution
Inflows of top 10 nationalitiesas a % of total inflows of foreigners
Permit based statistics (standardised) 2011 2012 2011 2012Work 2.3 2.2 1.9 1.7Family (incl. accompanying family) 17.8 20.7 14.3 16.5Humanitarian 5.8 4.2 4.6 3.4Free movements 96.5 96.7 77.6 77.0Others 1.9 1.8 1.5 1.5Total 124.3 125.6 100.0 100.0
Temporary migration 2005 2011 2012Average2007-11
ThousandsInternational students 8.6 11.7 11.3 11.3Trainees 0.3 0.0 0.0 0.1Working holiday makers .. .. .. ..Seasonal workers .. .. .. ..Intra-company transfers .. .. .. ..Other temporary workers 101.6 92.6 90.1 93.2
Inflows of asylum seekers 2000 2005 2011 2012Average Level
2002-06 2007-11 2012Per 1 000 inhabitants 2.5 1.4 2.5 3.3 2.2 2.0 25 948
Components of population growth 2000 2005 2011 2012Average Level (’000)
2002-06 2007-11 2012Per 1 000 inhabitants
Total 5.5 5.9 10.0 10.7 7.0 10.6 85Natural increase 2.2 1.6 2.3 2.4 1.5 2.0 19Net migration 3.3 4.3 7.7 8.3 5.4 8.6 66
Stocks of immigrants 2000 2005 2011 2012Average Level (’000)
2002-06 2007-11 2012Percentage of the total population
Foreign-born population 21.9 23.8 27.3 27.9 23.5 26.2 2 218Foreign population 19.3 20.3 22.4 22.9 20.2 21.7 1 825
Naturalisations 2000 2005 2011 2012Average Level
2002-06 2007-11 2012Percentage of the foreign population 2.1 2.6 2.1 1.9 2.6 2.5 34 121
Labour market outcomes 2000 2005 2011 2012Average
2002-06 2007-11Employment/population ratio
Native-born men .. .. 85.7 85.6 .. 85.5Foreign-born men .. .. 84.4 84.1 .. 83.6Native-born women .. .. 75.9 76.0 .. 75.5Foreign-born women .. .. 67.3 68.3 .. 67.0
Unemployment rateNative-born men .. .. 2.8 3.1 .. 3.0Foreign-born men .. .. 6.2 6.4 .. 6.6Native-born women .. .. 3.4 3.2 .. 3.5Foreign-born women .. .. 7.3 7.9 .. 8.1
Macroeconomic indicators 2000 2005 2011 2012Average Level
2002-06 2007-11 2012Annual growth in %
Real GDP 7.0 2.7 1.8 1.0 1.8 1.8GDP/capita (level in US dollars) 6.4 2.0 0.7 0.3 1.1 0.9 52 586Employment (level in thousands) 0.9 0.7 2.2 1.2 0.6 1.5 4 513
Percentage of the labour forceUnemployment 2.6 4.3 4.0 4.1 3.9 3.9
Notes and sources are at the end of the chapter.1 2 http://dx.doi.org/10.1787/888933158352
0 5 10 15 20 25
Switzerland
20122002-11 annual average
GermanyPortugal
ItalyFranceSpain
United KingdomUnited States
PolandAustria
India
INTERNATIONAL MIGRATION OUTLOOK 2014 © OECD 2014 303

4. COUNTRY NOTES: RECENT CHANGES IN MIGRATION MOVEMENTS AND POLICIES
TurkeyTurkey has recently been attracting increasingnumbers of foreigners. During the past threeyears, the foreign population increased by approxi-mately 90 000 people: while in 2010 there were177 000 residence permit holders, in 2011 theirnumber increased to 217 000 persons and by 2012 itreached 267 300 persons. Most residence permitswere granted for the purposes of family reunification,a smaller share of permits was granted on the groundsof work or study. However, work-related permits havebeen increasing. In 2012 the Turkish authorities issued32 250 work permits (an increase of 48% compared tothe previous year), and 32 850 residence permits weregranted to non-nationals as first or renewed permitsfor the purposes or work (nearly 30% more comparedwith 2011). In 2013, the number of work permits issuedrose 42%, to 45 850.
Data on labour migration in Turkey are moni-tored and disseminated by the Ministry for Labourand Social Security. Between 2011 and 2012, thenumber of contract workers sent abroad by theTurkish Employment Agency (TEA) increased from53 800 to 67 000 persons, before falling to 55 400in 2013. Most Turkish contract workers were in theMiddle East (the largest contingent in Iraq), followedby the Commonwealth of Independent States (primar-ily the Russian Federation).
Apprehensions of irregular migrants have beenrising since 2010. The number of apprehended irregu-lar migrants increased from 32 700 persons in 2010 to42 800 persons in 2011, and further to 47 500 personsin 2012. Almost 60% of apprehended irregular migrantsin 2012 (28 300 persons) were persons who overstayedtheir permitted period of residence. The top five coun-tries of origin among these irregular migrants were theneighbouring countries: Georgia (4 300 persons),the Russian Federation (1 200 persons), Ukraine(850 persons), Romania (530 persons) and Moldova(340 persons).
The number of asylum applicants has increased,from 9 200 persons in 2010 to 16 000 persons in 2011and to 16 700 persons in 2012. The significant increasein 2011 was mainly due to the increasing number ofapplicants from Iraq, whose number more thandoubled between 2010 and 2011. The increase in theinflow of asylum seekers in 2012 was due to nationa-lities other than Iranians and Iraqis. According toUNHCR figures, Turkey has become one of the top tenreceiving countries of asylum seekers in the world.Turkey has also become a transit country for most of
the asylum seekers en route to Europe. In additionto individually arriving asylum seekers, Turkeyalso faced the mass movement of Syrians: morethan 500 000 in the period between early 2011 andmid-2013.
Remittances represent a falling share of TurkishGDP. While in 2000-01 remittances constituted around1.5% of GDP, by 2012 this fell to merely 0.1%. Most of thedecline occurred between 2008 and 2010, when remit-tances halved to USD 830 million. The recovery – innominal terms – in 2010 and 2011 (USD 1.05 billion andUSD 975 million, respectively) was absorbed by the par-allel growth of GDP.
International migration and asylum policies areinfluenced by the European Union membership-negotiation process. 2012 saw significant legislativedevelopments in the field of migration management.The new framework Act on Foreigners and Inter-national Protection – under discussion – since 2010was adopted by the Turkish Parliament in early 2013.According to the new Act, a General Directorate ofMigration Management was established under theMinistry of Interior. Work permit requisites have beenchanged, and new permit categories will be estab-lished for investors. Negotiations on a ReadmissionAgreement between the European Union and Turkeyon readmission of own nationals, third-countrynationals and stateless persons are ongoing.
In the course of 2013 Turkey continued moder-nising its visa procedures by implementing on-lineprocessing, developing biometric security measures,and modernising border crossing points. Turkey hasbeen negotiating conclusion of a working arrangementwith FRONTEX. The points of negotiation include theissues of integrated border management and thetransfer of border security control from Turkish LandForces to a civilian command. Contrary to the expecta-tions of EC authorities, Turkey continued to liberaliseits visa policies towards certain African and Asiancountries. From April 2014, certain nationalities, previ-ously eligible for visas upon arrival, must apply for anelectronic visa prior to travel to Turkey.
For further information
www.iskur.gov.trwww.turkstat.gov.trwww.nvi.gov.trwww.mfa.gov.trwww.csgb.gov.tr.
INTERNATIONAL MIGRATION OUTLOOK 2014 © OECD 2014304

4. COUNTRY NOTES: RECENT CHANGES IN MIGRATION MOVEMENTS AND POLICIES
Recent trends in migrants’ flows and stocksTURKEY
Migration flows (foreigners)2000 2005 2011 2012
Average Level (’000)National definition 2002-06 2007-11 2012
Per 1 000 inhabitantsInflows .. .. .. .. .. .. ..Outflows .. .. .. .. .. .. ..Migration inflows (foreigners) by type Thousands % distribution
Inflows of top 10 nationalitiesas a % of total inflows of foreigners
Permit based statistics (standardised) 2011 2012 2011 2012Work .. .. .. ..Family (incl. accompanying family) .. .. .. ..Humanitarian .. .. .. ..Free movements .. .. .. ..Others .. .. .. ..Total .. .. .. ..
Temporary migration 2005 2011 2012Average2007-11
ThousandsInternational students .. .. .. ..Trainees .. .. .. ..Working holiday makers .. .. .. ..Seasonal workers .. .. .. ..Intra-company transfers .. .. .. ..Other temporary workers .. .. .. ..
Inflows of asylum seekers 2000 2005 2011 2012Average Level
2002-06 2007-11 2012Per 1 000 inhabitants 0.1 0.1 0.2 0.4 0.1 0.1 26 470
Components of population growth 2000 2005 2011 2012Average Level (’000)
2002-06 2007-11 2012Per 1 000 inhabitants
Total 13.8 12.2 13.5 12.0 .. .. 90Natural increase 13.8 12.2 11.7 12.0 12.5 11.4 91Net migration 0.0 0.0 1.8 0.0 .. .. -2
Stocks of immigrants 2000 2005 2011 2012Average Level (’000)
2002-06 2007-11 2012Percentage of the total population
Foreign-born population 2.0 .. .. .. .. .. ..Foreign population 0.4 .. .. .. .. .. ..
Naturalisations 2000 2005 2011 2012Average Level
2002-06 2007-11 2012Percentage of the foreign population .. .. .. .. .. .. ..
Labour market outcomes 2000 2005 2011 2012Average
2002-06 2007-11Employment/population ratio
Native-born men .. .. .. 69.2 .. 62.4Foreign-born men .. .. .. 64.0 .. 53.5Native-born women .. .. .. 28.7 .. 22.7Foreign-born women .. .. .. 32.7 .. 22.7
Unemployment rateNative-born men .. .. .. 7.8 .. 10.8Foreign-born men .. .. .. 11.0 .. 11.8Native-born women .. .. .. 9.5 .. 11.3Foreign-born women .. .. .. 12.6 .. 13.4
Macroeconomic indicators 2000 2005 2011 2012Average Level
2002-06 2007-11 2012Annual growth in %
Real GDP 6.8 8.4 8.8 2.1 7.2 3.7GDP/capita (level in US dollars) 5.3 7.1 7.4 0.8 5.9 2.4 17 967Employment (level in thousands) -2.1 2.2 6.6 2.9 0.9 3.3 25 321
Percentage of the labour forceUnemployment 6.9 10.4 9.6 9.0 10.5 11.2
Notes and sources are at the end of the chapter.1 2 http://dx.doi.org/10.1787/888933158368
0 2 4 6 8 10
2010
Turkey
AzerbaijanAfghanistan
Russian FederationGermany
United StatesIran
KazakhstanTurkmenistan
IraqUnited Kingdom
INTERNATIONAL MIGRATION OUTLOOK 2014 © OECD 2014 305

4. COUNTRY NOTES: RECENT CHANGES IN MIGRATION MOVEMENTS AND POLICIES
United KingdomThe number of foreign nationals living in the UnitedKingdom in 2013 rose to 4.9 million, an increase of3.2% on the year before. Foreign citizens accounted for7.9% of the total population of the United Kingdom.Citizens of the ten new Eastern European membercountries rose to 1.27 million and comprised 25.8% ofall foreigners. Poles were the largest foreign group,reaching 679 000 in 2013, 13.7% of all foreign citizens.The April 2013 Labour Force Survey indicated 7.86 mil-lion foreign-born residents of the United Kingdom,comprising 12.6% of the total population of the UnitedKingdom.
In 2013, 212 000 more people entered than leftthe United Kingdom for at least a year, a 20% increaseon 2012, but a reduction of one third since the peak inJune 2005. Overall, the estimated number of peoplearriving to live in the United Kingdom for at least ayear was 526 000, 28 000 more than in 2012. The out-flow of 314 000 was 7 000 fewer than the year before. Anet outflow of 57 000 British citizens was more thancompensated for by a net inflow of 269 000 non-British. The year-on-year increase in net migrationwas driven by the sharp rise in flows from the EU.
Under Tier 1 (“high value workers”), 99 900 workvisas and extensions of stay were granted in 2012,including dependants, although this fell by 41%in 2013 as Tier 1 was largely phased out. The majoritywere granted extensions of stay to remain in theUnited Kingdom. The largest decline was in the post-study visa category. In 2012, the number of Tier 2 visasand extensions of stay granted (main applicants) roseby 22% to 68 700, the highest total since the points-based system (PBS) was introduced. Data for 2013show a further annual 21% rise in Tier 2. Aroundthree-quarters of Tier 2 visas issued outside theUnited Kingdom in 2012 and the first half of 2013were for intra-company transfers, which are notsubject to the visa cap. Most of those issued inside theUnited Kingdom were for extensions for generalmigrants.
In 2012, there were 199 000 admissions at the bor-der of the United Kingdom for study, accompaniedby 12 000 dependants. Students entering under Tier 4numbered 179 000. In addition, there were 299 000 stu-dent visitors coming for periods of under a year. Studentvisa numbers granted (including dependants) increasedby 4% in 2013 to 218 800.
The number of family route visas granted hasbeen falling in recent years, to 40 900 in 2012 and33 700 in 2013.
The number of people granted permission to staypermanently fell 22.2% from 2011 to 129 700 (a five-year low) in 2012, before rising 18% in 2013, to 152 900.The 2013 increase was driven by increases in family-related and asylum-related grants. Provisional datafor 2012 suggest that the total number of spouses anddependants was 83 800, a 17.4% reduction on 2011 andthe lowest figure since 2002.
There were 194 200 grants of citizenship in 2012,a 9% increase on 2011. This rose by a further 7% to208 100 in 2013.
Applications for asylum rose 10% in 2012 to 21 800,although the annual number of applications remainslow relative to the 2002 peak. Of decisions made in 2012,a third were granted asylum, humanitarian protection,discretionary leave or another type of grant at either ini-tial decision or appeal. Asylum applications rose by afurther 8% in 2013, to 23 500.
The April 2013 LFS indicates 2.66 million foreignnationals working in the United Kingdom, comprising9% of the total workforce, a record figure. More than athird were highly skilled, and almost four in tenworked in London. The unemployment rate forforeigners stood at 9.2%, compared with 7.6% for UKnationals.
Government policy is still to reduce net immigra-tion to “the tens of thousands” by 2015, althoughprogress in 2013 stalled. The major legislative devel-opment in 2013 was a new Immigration Bill. It isdesigned to make it easier to identify and deportillegal immigrants and make it more difficult for themto live in the United Kingdom. Also in 2013, morestringent rules relating to family migration wereintroduced; all applicants for settlement are nowrequired to demonstrate knowledge of the languageand life in the United Kingdom by passing the “Life inthe UK” test and by presenting a speaking and listen-ing qualification at intermediate level or above.
For further information
www.gov.uk.
INTERNATIONAL MIGRATION OUTLOOK 2014 © OECD 2014306

4. COUNTRY NOTES: RECENT CHANGES IN MIGRATION MOVEMENTS AND POLICIES
Recent trends in migrants’ flows and stocksUNITED KINGDOM
Migration flows (foreigners)2000 2005 2011 2012
Average Level (’000)National definition 2002-06 2007-11 2012
Per 1 000 inhabitantsInflows 4.4 6.8 7.2 6.0 6.4 7.4 383.0Outflows 2.3 2.6 3.0 2.6 2.5 3.2 165.0Migration inflows (foreigners) by type Thousands % distribution
Inflows of top 10 nationalitiesas a % of total inflows of foreigners
Permit based statistics (standardised) 2011 2012 2011 2012Work 114.0 111.1 35.3 38.8Family (incl. accompanying family) 82.6 71.5 25.6 25.0Humanitarian 13.0 11.4 4.0 4.0Free movements 72.7 73.1 22.5 25.5Others 40.3 18.9 12.5 6.6Total 322.6 286.1 100.0 100.0
Temporary migration 2005 2011 2012Average2007-11
ThousandsInternational students 124.0 226.0 175.0 196.2Trainees .. .. .. ..Working holiday makers 56.6 20.7 19.6 28.3Seasonal workers 15.7 16.3 .. 18.4Intra-company transfers .. 21.0 22.8 17.3Other temporary workers 202.6 82.3 .. 112.9
Inflows of asylum seekers 2000 2005 2011 2012Average Level
2002-06 2007-11 2012Per 1 000 inhabitants 1.4 0.5 0.4 0.4 0.9 0.5 27 978
Components of population growth 2000 2005 2011 2012Average Level (’000)
2002-06 2007-11 2012Per 1 000 inhabitants
Total 3.6 6.2 7.8 7.6 4.7 6.8 474Natural increase 1.2 2.3 3.9 4.1 1.6 3.4 256Net migration 2.4 3.8 3.9 3.5 3.1 3.4 219
Stocks of immigrants 2000 2005 2011 2012Average Level (’000)
2002-06 2007-11 2012Percentage of the total population
Foreign-born population 7.9 9.4 11.7 11.9 9.0 11.2 7 588Foreign population 4.0 5.1 7.6 7.5 4.9 7.1 4 788
Naturalisations 2000 2005 2011 2012Average Level
2002-06 2007-11 2012Percentage of the foreign population 3.7 5.7 3.9 4.1 4.9 4.0 194 209
Labour market outcomes 2000 2005 2011 2012Average
2002-06 2007-11Employment/population ratio
Native-born men 78.0 77.6 73.9 74.4 77.6 75.2Foreign-born men 70.7 72.4 75.2 77.0 73.2 76.4Native-born women 65.5 66.8 65.4 66.5 66.5 66.0Foreign-born women 52.9 55.9 58.7 56.7 55.4 57.9
Unemployment rateNative-born men 5.9 4.8 8.8 8.6 5.2 7.7Foreign-born men 9.7 7.5 9.3 8.1 7.8 7.9Native-born women 4.7 3.8 7.1 7.0 4.1 5.9Foreign-born women 7.9 7.2 9.7 10.3 7.2 8.4
Macroeconomic indicators 2000 2005 2011 2012Average Level
2002-06 2007-11 2012Annual growth in %
Real GDP 5.9 3.2 1.1 0.3 3.1 0.1GDP/capita (level in US dollars) 5.5 2.6 0.4 -1.2 2.6 -0.6 34 773Employment (level in thousands) 1.2 1.0 0.5 1.2 0.9 0.1 29 519
Percentage of the labour forceUnemployment 5.5 4.9 8.1 7.9 5.1 6.9
Notes and sources are at the end of the chapter.1 2 http://dx.doi.org/10.1787/888933158375
0 5 10 15
United Kingdom
20122002-11 annual average
ChinaIndia
PolandPakistan
SpainAustralia
FranceItaly
LithuaniaNigeria
INTERNATIONAL MIGRATION OUTLOOK 2014 © OECD 2014 307

4. COUNTRY NOTES: RECENT CHANGES IN MIGRATION MOVEMENTS AND POLICIES
United StatesUnited States total immigrant admissions for lawfulpermanent residents (LPRs) in Fiscal Year (FY) 2012decreased by 2.9% from the previous year to 1 031 000.(All figures are for US fiscal years, October through Sep-tember.) Of these, the number of LPRs who were newarrivals in 2012, 484 100, accounted for 46.9%. This isthe highest share since 2003, when new arrivalsaccounted for 50.8% of the total. The foreign-born pop-ulation residing in the United States in 2012 was 40.8million, 13% of the total population. The main coun-tries of birth were Mexico (28%), China (6%), India (5%)and the Philippines (5%). Together, these four countrieshave accounted for approximately one-third of allimmigrant admissions every year over the past decade.The share of Asians among total immigrant admis-sions has increased over the past decade, from 34% to42%, while the share of North American immigrantadmissions fell from 36% to 32%.
In 2012, family-sponsored immigration accountedfor 680 800 immigrants, or about 66% of all legal immi-gration to the United States, while 144 000 immigrants(14%) were employment-based, a 3.3% increase on theprevious year. While employment-based LPR visas arecapped at 140 000 annually, admissions may be highersince unused numbers from the previous year can berecovered, and admission may not correspond to thefiscal year of issuance.
The diversity visa programme allocates50 000 immigrant visas annually by lottery, excludingcountries with a large share of immigration to theUnited States. It accounted for 3.9% of total LPR inflowin 2012. The per-country limit of diversity visasin 2012 was 3 500.
The refugee ceiling was set at 76 000 for 2012.In 2012, 58 200 refugees were physically admittedduring the fiscal year and 105 500 refugees, admittedat least one year previously, changed their status tothat of permanent immigrant. The leading countriesof origin for refugee admissions in 2012 were Bhutan,Burma, and Iraq, with the number of Iraqi refugeeswhich peaked at 18 800 in 2009, dropping to 9 400in 2011, then increasing to 12 200 in 2012. In 2012,29 500 individuals were granted asylum status,and 45 000 asylees who had been in that status formore than one year were granted lawful permanentresidence.
In 2012, the United States issued approximately8.9 million non-immigrant (i.e. temporary) visas(excluding Border Crossing Cards), 18.9% more thanthe previous fiscal year. Mexican nationals were themain recipients (1.69 million), followed China(1.3 million), Brazil (1 million), India (582 100), andColombia (337 300). Chinese and Brazilians receivedalmost three times as many temporary visas as
in 2007. In 2012, 486 900 academic student visas weregranted, 9% more than in 2011. The number ofsummer work-travel participants has been falling inrecent years, to 79 800 in 2012, while the number oftemporary agricultural workers rose by about10 000 from the previous two years, to 65 300.
The number of naturalisations, which peaked at1 046 500 in 2008, dropped to 743 700 in 2009, anddropped further to below 700 000 during 2010and 2011, but climbed to 757 400 in 2012. Mexico wasthe leading nationality (13.5% of all naturalisations).
In January 2011, there were approximately11.5 million unauthorised residents in the foreign-born population who had entered the United Statesbetween 1980 and 2010. Of these, only 14% wereestimated to have arrived since 2005, suggestingdecreasing inflows. Mexicans represent about 59% ofthe estimated 2011 unauthorised population.
In the policy domain, a comprehensive immigra-tion reform bill (S. 744) passed the Senate in 2013, butdid not advance to become law. The bill containedprovisions to increase and improve border securityand domestic immigration enforcement, a legalisa-tion programme for qualifying illegal immigrants, anew temporary worker programme, and reforms tofamily- and employment-based immigration. Severalareas addressed by the bill were also addressed inseparate bills introduced in the House of Representa-tives, although none of those bills have yet been votedon by the full House.
In November 2013, the US Department ofHomeland Security announced a policy to allow unlaw-fully present spouses, children, and parents of militarypersonnel and veterans to lawfully remain in theUnited States .This parole policy complements the“Deferred Action for Childhood Arrivals” (DACA) policy,announced by DHS in June 2012, whereby people whoentered the United States illegally as children and meetseveral key guidelines may request consideration of“deferred action” – discretionary determination todefer removal action – for a renewable two-year period.DACA allows work authorisation.
Following a 2013 US Supreme Court decision,US Citizenship and Immigration Services (USCIS)treats same-sex marriages as legally valid for immi-gration purposes, if contracted in a jurisdiction wherelegal.
For further information
www.dhs.gov/immigration-statisticswww.foreignlaborcert.doleta.gov/www.dol.gov/compliance/laws/comp-ina.htm.
INTERNATIONAL MIGRATION OUTLOOK 2014 © OECD 2014308

4. COUNTRY NOTES: RECENT CHANGES IN MIGRATION MOVEMENTS AND POLICIES
Recent trends in migrants’ flows and stocksUNITED STATES
Migration flows (foreigners)2000 2005 2011 2012
Average Level (’000)National definition 2002-06 2007-11 2012
Per 1 000 inhabitantsInflows 3.0 3.8 3.4 3.3 3.5 3.5 1 031.6Outflows .. .. .. .. .. .. ..Migration inflows (foreigners) by type Thousands % distribution
Inflows of top 10 nationalitiesas a % of total inflows of foreigners
Permit based statistics (standardised) 2011 2012 2011 2012Work 65.3 65.9 6.1 6.4Family (incl. accompanying family) 762.2 758.9 71.8 73.6Humanitarian 168.5 150.6 15.9 14.6Free movements .. .. .. ..Others 65.5 55.6 6.2 5.4Total 1 061.4 1 031.0 100.0 100.0
Temporary migration 2005 2011 2012Average2007-11
ThousandsInternational students 237.9 447.4 486.9 360.6Trainees 1.8 2.1 2.9 2.5Working holiday makers 88.6 97.6 79.8 126.5Seasonal workers 31.9 55.4 65.3 57.3Intra-company transfers 65.5 70.7 62.4 75.8Other temporary workers 266.1 235.0 246.9 245.7
Inflows of asylum seekers 2000 2005 2011 2012Average Level
2002-06 2007-11 2012Per 1 000 inhabitants 0.1 0.1 0.2 0.2 0.2 0.1 66 101
Components of population growth 2000 2005 2011 2012Average Level (’000)
2002-06 2007-11 2012Per 1 000 inhabitants
Total 10.5 9.2 7.2 .. 9.2 8.3 ..Natural increase 5.7 5.7 5.0 .. 5.8 5.6 1 441Net migration 4.6 3.2 2.2 .. 3.2 2.4 885
Stocks of immigrants 2000 2005 2011 2012Average Level (’000)
2002-06 2007-11 2012Percentage of the total population
Foreign-born population 10.7 12.1 13.0 13.0 11.9 12.7 40 738Foreign population 6.3 7.2 6.8 6.8 7.2 7.0 21 359
Naturalisations 2000 2005 2011 2012Average Level
2002-06 2007-11 2012Percentage of the foreign population 4.1 2.9 3.2 3.6 2.7 3.5 757 434
Labour market outcomes 2000 2005 2011 2012Average
2002-06 2007-11Employment/population ratio
Native-born men 78.5 74.9 68.4 69.3 75.0 70.8Foreign-born men 82.4 82.7 78.1 78.5 81.6 79.7Native-born women 68.1 65.8 61.9 62.0 65.9 63.7Foreign-born women 58.5 57.7 56.7 56.9 57.5 57.9
Unemployment rateNative-born men 4.1 5.5 9.8 8.6 5.8 8.6Foreign-born men 3.8 4.3 8.9 7.5 5.0 7.7Native-born women 4.2 5.2 8.5 7.9 5.4 7.1Foreign-born women 5.0 5.6 9.5 9.0 6.1 7.8
Macroeconomic indicators 2000 2005 2011 2012Average Level
2002-06 2007-11 2012Annual growth in %
Real GDP 7.9 3.4 1.8 2.8 2.9 0.6GDP/capita (level in US dollars) 6.7 2.4 1.1 2.0 1.9 -0.3 51 689Employment (level in thousands) 2.5 1.8 0.6 1.8 1.1 -0.6 142 466
Percentage of the labour forceUnemployment 4.0 5.1 8.9 8.1 5.4 7.6
Notes and sources are at the end of the chapter.1 2 http://dx.doi.org/10.1787/888933158381
0 5 10 15 200
United States
20122002-11 annual average
MexicoChinaIndia
PhilippinesDominican Republic
CubaViet Nam
HaitiColombia
Korea
INTERNATIONAL MIGRATION OUTLOOK 2014 © OECD 2014 309

4. COUNTRY NOTES: RECENT CHANGES IN MIGRATION MOVEMENTS AND POLICIES
SOURCES AND NOTES OF THE COUNTRY TABLES OF CHAPTER 4
Migration flows of foreigners
OECD countries and the Russian Federation: sources and notes are available in the
Statistical annex (Metadata related to Tables A.1, A.2 and B.1).
Bulgaria: Number of new permanent and long-term residence permits granted (Source:
Ministry of the Interior); Lithuania: Arrivals and departures of residents (Source:
Department of Statistics of the Government of the Republic of Lithuania); Romania:
Permanent residence changes (Source: Romanian Statistical Yearbook).
Long-term migration inflows of foreigners by type (standardised inflows)
The statistics are based largely on residence and work permit data and have been
standardised, to the extent possible (cf. www.oecd.org/migration/imo).
Temporary migration
Based on residence or work permit data. Data on temporary workers generally do not
cover workers who benefit from a free circulation agreement.
Inflows of asylum seekers
United Nations High Commission for Refugees (www.unhcr.org/statistics).
Components of population growth
Belgium, the Czech Republic, Estonia, Germany, Greece, Ireland, Italy, the Netherlands,
Poland, Portugal, the Slovak Republic, Slovenia, Spain, Switzerland, the United Kingdom,
Bulgaria, Latvia, Lithuania and Romania: Eurostat. Other OECD countries and the
Russian Federation: Population and Vital Statistics, OECD, 2011.
Total population
Foreign-born population
National sources and Secretariat estimates (cf. www.oecd.org/els/migration/foreignborn
for more information on methods of estimation). Sources and notes of national sources are
provided in the Statistical annex (see Metadata related to Tables A.4 and B.4).
Foreign population
National sources: Exact sources and notes for the OECD countries are given in the
Statistical annex (Metadata related to Tables A.5. and B.5).
Lithuania: Residents’ Register Service (Ministry of the Interior); Romania: Ministry of
the Interior.
INTERNATIONAL MIGRATION OUTLOOK 2014 © OECD 2014310

4. COUNTRY NOTES: RECENT CHANGES IN MIGRATION MOVEMENTS AND POLICIES
Naturalisations
National sources: Exact sources and notes for the OECD countries are given in the
Statistical annex (Metadata related to Tables A.6. and B.6). Bulgaria and Lithuania: Ministry
of the Interior.
Labour market outcomes
European countries and Turkey: Labour Force Surveys (Eurostat); Australia, Canada,
Israel, Mexico, New Zealand: Labour Force Surveys (annual averages); Chile: Encuesta de
Caracterización Socioeconómica Nacional (CASEN); The United States: Current Population
Survey.
Macroeconomic and labour market indicators
GDP growth and GDP per capita: Growth
Annual National Accounts – Comparative tables at the price levels and PPPs of 2005 (OECD).
GDP and GDP per capita: Level
Annual National Accounts – Comparative tables at current price levels and PPPs (OECD).
Employment and unemployment
OECD Employment Outlook 2013, OECD, 2013.
INTERNATIONAL MIGRATION OUTLOOK 2014 © OECD 2014 311


International Migration Outlook 2014
© OECD 2014
Statistical annex
Inflows and outflows of foreign population . . . . . . . . . . . . . . . . . . . . . . . . . . . . . . . . . . . . 316
A.1. Inflows of foreign population into OECD countries
and the Russian Federation . . . . . . . . . . . . . . . . . . . . . . . . . . . . . . . . . . . . . . . . . . . 318
B.1. Inflows of foreign population by nationality . . . . . . . . . . . . . . . . . . . . . . . . . . . . . 319
A.2. Outflows of foreign population from selected OECD countries . . . . . . . . . . . . . 336
Metadata related to Tables A.1, A.2 and B.1. Inflows and outflows
of foreign population . . . . . . . . . . . . . . . . . . . . . . . . . . . . . . . . . . . . . . . . . . . . . . . . . . . . . . . . 337
Inflows of asylum seekers . . . . . . . . . . . . . . . . . . . . . . . . . . . . . . . . . . . . . . . . . . . . . . . . . . . 341
A.3. Inflows of asylum seekers into OECD countries and the Russian Federation. . 342
B.3. Inflows of asylum seekers by nationality . . . . . . . . . . . . . . . . . . . . . . . . . . . . . . . . 343
Metadata related to Tables A.3 and B.3. Inflows of asylum seekers . . . . . . . . . . . . . . . . . 360
Stocks of foreign and foreign-born populations . . . . . . . . . . . . . . . . . . . . . . . . . . . . . . . . 361
A.4. Stocks of foreign-born population in OECD countries
and the Russian Federation . . . . . . . . . . . . . . . . . . . . . . . . . . . . . . . . . . . . . . . . . . . 362
B.4. Stock of foreign-born population by country of birth. . . . . . . . . . . . . . . . . . . . . . 364
Metadata related to Tables A.4 and B.4. Stocks of foreign-born population. . . . . . . . . . . 380
A.5. Stocks of foreign population by nationality in OECD countries
and the Russian Federation . . . . . . . . . . . . . . . . . . . . . . . . . . . . . . . . . . . . . . . . . . . 382
B.5. Stock of foreign population by nationality. . . . . . . . . . . . . . . . . . . . . . . . . . . . . . . 384
Metadata related to Tables A.5. and B.5. Stocks of foreign population . . . . . . . . . . . . . . . 398
Acquisitions of nationality. . . . . . . . . . . . . . . . . . . . . . . . . . . . . . . . . . . . . . . . . . . . . . . . . . . 400
A.6. Acquisitions of nationality in OECD countries and the Russian Federation . . . 401
B.6. Acquisition of nationality by country of former nationality . . . . . . . . . . . . . . . . 403
Metadata related to Tables A.6. and B.6. Acquisition of nationality . . . . . . . . . . . . . . . . . 420
313

STATISTICAL ANNEX
IntroductionMost of the data published in this annex have been provided by national
correspondents of the continuous reporting system on migration appointed by the OECD
Secretariat with the approval of the authorities of member countries. Consequently, these
data are not necessarily based on common definitions. Countries under review in this
annex are OECD countries for which data are available, as well as the Russian Federation.
The continuous reporting system on migration has no authority to impose changes in data
collection procedures. It is an observatory which, by its very nature, has to use existing
statistics. However, it does play an active role in suggesting what it considers to be
essential improvements in data collection and makes every effort to present consistent
and well-documented statistics.
The purpose of this annex is to describe the “immigrant” population (generally the
foreign-born population). The information gathered concerns the flows and stocks of the
total immigrant population as well as the acquisition of nationality. These data have not
been standardised and are therefore not fully comparable across countries. In particular,
the criteria for registering persons in population registers and the conditions for granting
residence permits, for example, vary across countries, which means that measurements
may differ greatly even if the same type of source is being used.
In addition to the problem of the comparability of statistics, there is the difficulty of
the very partial coverage of unauthorised migrants. Part of this population may be counted
in censuses. Regularisation programmes, when they exist, make it possible to identify and
enumerate a far from negligible fraction of unauthorised immigrants after the fact. In
terms of measurement, this makes it possible to better measure the volume of the
foreign-born population at a given time, even if it is not always possible to determine the
year these immigrants entered the country.
Each series in the annex is preceded by an explanatory note concerning the data
presented. A summary table then follows (Series A, giving the total for each destination
country), and finally the tables by nationality or country of birth, as the case may be
(Series B). At the end of each series, a table provides the sources and notes for the data
presented in the tables for each country.
General comments● The tables provide annual series covering the period 2002-12 (or 2003-13).
● The Series A tables are presented in alphabetical order by the name of the country. In the
other tables, nationalities or countries of birth are ranked by decreasing order of
frequency for the last year available.
INTERNATIONAL MIGRATION OUTLOOK 2014 © OECD 2014314

STATISTICAL ANNEX
● In the tables by country of origin (Series B) only the 15 main countries are shown. “Other
countries” is a residual calculated as the difference between the total foreign or foreign-born
population and the sum for all countries indicated in the table. For some countries, data are
not available for all years and this is reflected in the residual entry of “Other countries”. This
must be borne in mind when interpreting changes in this category.
● There is no table by nationality for the series on outflows of the foreign population
(Series A.2). These statistics, as well as data by gender are available online (www.oecd.org/
migration/imo).
● The rounding of data cells may cause totals to differ slightly from the sum of the
component cells.
● The symbol “..” used in the tables means that the data are not available.
● Note on Israel: The statistical data for Israel are supplied by and under the responsibility
of the relevant Israeli authorities. The use of such data by the OECD is without prejudice
to the status of the Golan Heights, East Jerusalem and Israeli settlements in the
West Bank under the terms of international law.
● Note on Cyprus by Turkey: The information in this document with reference to “Cyprus”
relates to the southern part of the Island. There is no single authority representing both
Turkish and Greek Cypriot people on the Island. Turkey recognises the Turkish Republic of
Northern Cyprus (TRNC). Until a lasting and equitable solution is found within the context
of the United Nations, Turkey shall preserve its position concerning the “Cyprus issue”.
● Note on Cyprus by all the European Union Member States of the OECD and the
European Union: The Republic of Cyprus is recognised by all members of the
United Nations with the exception of Turkey. The information in this document relates
to the area under the effective control of the Government of the Republic of Cyprus.
INTERNATIONAL MIGRATION OUTLOOK 2014 © OECD 2014 315

STATISTICAL ANNEX
Inflows and outflows of foreign population
OECD countries seldom have tools specifically designed to measure the inflows andoutflows of the foreign population, and national estimates are generally based either onpopulation registers or residence permit data. This note describes more systematicallywhat is measured by each of the sources used.
Flows derived from population registers
Population registers can usually produce inflow and outflow data for both nationals andforeigners. To register, foreigners may have to indicate possession of an appropriateresidence and/or work permit valid for at least as long as the minimum registration period.Emigrants are usually identified by a stated intention to leave the country, although theperiod of (intended) absence is not always specified.
In population registers, departures tend to be less well recorded than arrivals. Indeed,the emigrant who plans to return to the host country in the future may be reluctant toinform about his departure to avoid losing rights related to the presence on the register.Registration criteria vary considerably across countries; in particular the minimumduration of stay for individuals to be registered ranges from three months to one year,which poses major problems of international comparisons. For example, in somecountries, register data cover many temporary migrants, in some cases including asylumseekers when they live in private households (as opposed to reception centres or hostelsfor immigrants) and international students.
Flows derived from residence and/or work permits
Statistics on permits are generally based on the number of permits issued during a givenperiod and depend on the types of permits used. The so-called “settlement countries”(Australia, Canada, New Zealand and the United States) consider as immigrants personswho have been granted the right of permanent residence, and this right is often grantedupon arrival. Statistics on temporary immigrants are also published in this annex for thesecountries. In the case of France, the permits covered are those valid for at least one year(excluding students). Data for Portugal include temporary migrants.
Another characteristic of permit data is that flows of nationals are not recorded. Someflows of foreigners may also not be recorded, either because the type of permit they hold isnot included in the statistics or because they are not required to have a permit (freedom ofmovement agreements). In addition, permit data do not necessarily reflect physical flows oractual lengths of stay since: i) permits may be issued overseas but individuals may decidenot to use them, or delay their arrival; and ii) permits may be issued to persons who have infact been resident in the country for some time, the permit indicating a change of status.
INTERNATIONAL MIGRATION OUTLOOK 2014 © OECD 2014316

STATISTICAL ANNEX
Flows estimated from specific surveys
Ireland provides estimates based on the results of Quarterly National Household Surveysand other sources such as permit data and asylum applications. These estimates arerevised periodically on the basis of census data. Data for the United Kingdom are based ona survey of passengers entering or exiting the country by plane, train or boat (InternationalPassenger Survey). One of the aims of this survey is to estimate the number andcharacteristics of migrants. The survey is based on a random sample of approximately oneout of every 500 passengers. The figures were revised significantly following the latestcensus in each of these two countries, which seems to indicate that these estimates do notconstitute an “ideal” source either. Australia and New Zealand also conduct passengersurveys which enable them to establish the length of stay on the basis of migrants’ statedintentions when they enter or exit the country.
INTERNATIONAL MIGRATION OUTLOOK 2014 © OECD 2014 317

STATISTICAL ANNEX
n
2012
242.4
..
125.6
110.0
257.9
315.9
100.1
30.3
35.5
1.1
23.3
163.4
965.9
17.7
20.3
2.8
32.1
16.6
321.3
303.9
300.2
19.4
19.5
115.7
39.1
70.0
47.1
38.5
417.7
2.9
17.3
336.1
82.6
143.8
..
418.0
031.6
675.9
158390
Table A.1. Inflows of foreign population into OECD countries and the Russian FederatioThousands
2002 2003 2004 2005 2006 2007 2008 2009 2010 2011
Australia
Permanent 120.2 124.6 147.7 163.1 177.5 191.1 205.3 224.2 208.2 210.7
Temporary 240.5 244.7 261.6 289.4 321.6 368.5 420.0 474.8 467.0 504.7
Austria 86.1 93.3 104.2 98.0 82.9 91.5 94.4 91.7 96.9 109.9
Belgium 70.2 68.8 72.4 77.4 83.4 93.4 106.0 102.7 113.6 117.9
Canada
Permanent 229.0 221.3 235.8 262.2 251.6 236.8 247.2 252.2 280.7 248.8
Temporary 246.6 227.2 227.1 228.5 248.6 278.0 311.5 291.5 282.0 293.2
Chile 29.9 29.8 32.1 38.1 48.5 79.4 68.4 57.1 63.9 76.3
Czech Republic 43.6 57.4 50.8 58.6 66.1 102.5 77.8 40.0 30.5 22.6
Denmark 21.5 18.4 18.7 20.1 24.0 31.4 37.0 32.0 33.4 34.6
Estonia .. .. 0.8 1.0 1.5 2.0 1.9 2.2 1.2 1.7
Finland 10.0 9.4 11.5 12.7 13.9 17.5 19.9 18.1 18.2 20.4
France 124.2 136.4 141.6 135.9 159.4 145.9 153.3 159.6 157.8 154.8
Germany 658.3 601.8 602.2 579.3 558.5 574.8 573.8 606.3 683.5 841.7
Greece .. .. .. 65.3 63.2 46.3 42.9 46.5 33.4 23.2
Hungary 18.0 19.4 22.2 25.6 23.6 22.6 35.5 25.6 23.9 22.5
Iceland 1.9 1.4 2.5 4.7 7.1 9.3 7.5 3.4 3.0 2.8
Ireland 39.9 42.4 41.8 66.1 88.9 120.4 89.7 50.7 23.9 33.7
Israel 33.6 23.3 20.9 21.2 19.3 18.1 13.7 14.6 16.6 16.9
Italy 161.9 424.9 394.8 282.8 254.6 515.2 496.5 406.7 424.5 354.3
Japan 343.8 373.9 372.0 372.3 325.6 336.6 344.5 297.1 287.1 266.9
Korea 158.9 168.9 178.5 253.7 303.0 300.4 302.2 232.8 293.1 307.2
Luxembourg 11.0 12.6 12.2 13.8 13.7 15.8 16.8 14.6 15.8 19.1
Mexico 5.8 6.9 8.5 9.2 6.9 7.2 15.9 23.9 26.2 22.0
Netherlands 86.6 73.6 65.1 63.4 67.7 80.3 103.4 104.4 110.2 118.5
New Zealand 48.8 43.4 36.2 54.1 49.8 46.9 46.9 43.6 44.3 40.8
Norway 30.8 26.8 27.9 31.4 37.4 53.5 58.8 56.7 65.1 70.8
Poland 30.2 30.3 36.9 38.5 34.2 40.6 41.8 41.3 41.1 41.3
Portugal 72.0 31.8 34.1 28.1 22.5 32.6 72.8 61.4 50.7 45.4
Russian Federation 184.6 129.1 119.2 177.2 186.4 287.0 281.6 279.9 191.7 356.5
Slovak Republic 4.8 4.6 7.9 7.7 11.3 14.8 16.5 14.4 12.7 8.2
Slovenia .. .. .. .. .. 30.5 43.8 24.1 11.2 18.0
Spain 443.1 429.5 645.8 682.7 803.0 920.5 692.2 469.3 431.3 416.3
Sweden 47.3 47.1 46.7 50.6 78.9 82.6 82.0 82.4 79.0 75.9
Switzerland 101.9 94.0 96.3 94.4 102.7 139.7 157.3 132.4 134.2 142.5
Turkey .. .. .. .. .. .. .. .. 29.9 ..
United Kingdom 418.0 411.0 500.0 469.0 513.0 500.0 505.0 471.0 498.0 488.0
United States
Permanent 1 059.4 703.5 957.9 1 122.4 1 266.3 1 052.4 1 107.1 1 130.8 1 042.6 1 062.0 1
Temporary 1 282.6 1 233.4 1 299.3 1 323.5 1 457.9 1 606.9 1 617.6 1 419.2 1 517.9 1 616.8 1
Notes: For details on definitions and sources, refer to the metadata at the end of Table A.2.Information on data for Israel: http://dx.doi.org/10.1787/888932315602.
1 2 http://dx.doi.org/10.1787/888933
INTERNATIONAL MIGRATION OUTLOOK 2014 © OECD 2014318

STATISTICAL ANNEX
f which:omen12 (%)
49
46
47
56
55
50
47
53
55
41
64
43
45
25
54
50
158453
f which:omen12 (%)
46
52
49
41
44
55
42
41
20
50
56
40
46
45
36
45
158453
Table B.1. Inflows of foreign population by nationalityThousands
AUSTRALIA (PERMANENT)
2002 2003 2004 2005 2006 2007 2008 2009 2010 2011 2012OW
20
New Zealand 21.6 16.4 18.7 22.4 23.8 28.3 34.5 33.0 24.4 34.6 44.3
India 7.6 8.2 11.3 12.8 15.2 19.8 22.7 25.3 23.5 21.9 27.9
United Kingdom 14.6 18.6 25.7 26.2 30.9 30.7 31.7 33.3 26.7 21.5 27.0
China 9.1 9.4 12.5 15.2 17.3 21.1 20.7 22.9 25.0 29.0 25.6
Philippines 3.4 3.6 4.4 4.8 5.4 6.1 7.1 8.9 10.3 10.7 12.8
South Africa 7.2 5.9 7.1 5.7 4.8 5.4 6.9 11.3 11.1 8.1 8.0
Sri Lanka 2.4 2.3 2.1 3.0 3.3 3.8 4.8 5.3 5.8 4.9 6.1
Malaysia 2.6 3.9 5.1 4.7 4.8 4.8 5.1 5.4 4.9 5.0 5.4
Korea 2.0 2.3 2.8 3.5 4.0 4.2 5.0 5.2 4.3 4.3 5.0
Ireland 1.0 1.2 1.6 1.6 1.8 1.9 2.0 2.7 3.0 3.4 5.0
Viet Nam 2.5 3.0 2.5 2.5 2.9 3.4 3.0 3.3 3.9 4.8 4.8
Iran 0.6 0.8 0.8 1.0 0.9 1.0 1.2 2.2 2.1 3.3 4.6
Pakistan 1.1 1.0 1.4 1.7 1.6 1.8 1.9 2.1 2.0 2.1 4.3
Afghanistan 0.7 1.0 1.3 3.5 3.5 2.6 2.0 2.0 3.2 3.4 3.6
United States 2.6 2.5 3.0 3.0 2.9 2.8 3.0 3.1 3.2 3.0 3.3
Other countries 41.2 44.6 47.4 51.5 54.5 53.5 53.6 58.2 54.8 50.9 54.6
Total 120.2 124.6 147.7 163.1 177.5 191.1 205.3 224.2 208.2 210.7 242.4
Note: For details on definitions and sources, please refer to the metadata at the end of the tables.1 2 http://dx.doi.org/10.1787/888933
Table B.1. Inflows of foreign population by nationalityThousandsAUSTRIA
2002 2003 2004 2005 2006 2007 2008 2009 2010 2011 2012OW
20
Germany 9.2 10.9 13.2 14.7 15.9 18.0 19.2 17.6 18.0 17.4 17.8
Romania 4.8 5.7 5.5 5.1 4.5 9.3 9.2 9.3 11.3 12.9 13.4
Hungary 2.6 2.8 3.2 3.4 3.6 4.5 5.2 5.8 6.4 9.3 13.1
Poland 3.0 3.4 7.0 6.8 5.7 5.3 4.4 3.8 4.0 6.4 7.1
Serbia 9.9 10.5 11.6 11.7 7.4 6.4 6.1 4.6 7.2 6.1 6.8
Slovak Republic 2.5 2.6 3.5 3.6 3.5 3.6 4.9 4.0 4.0 5.3 6.0
Bosnia and Herzegovina 4.9 5.4 5.4 4.6 3.2 3.0 2.9 2.4 2.5 3.9 4.1
Turkey 11.3 10.4 8.2 7.7 4.9 5.2 5.0 4.7 4.3 3.8 4.1
Afghanistan 1.1 0.7 0.7 0.7 0.5 0.5 1.0 1.4 1.3 2.9 3.8
Bulgaria 1.5 1.7 1.7 1.4 1.2 2.2 2.5 2.6 3.1 3.2 3.6
Russian Federation 1.8 4.0 6.8 4.0 2.5 2.2 2.9 2.4 2.2 2.6 3.4
Italy 1.4 1.5 1.4 1.4 1.5 1.7 1.8 2.0 2.2 2.3 3.1
Iran 1.0 1.2 1.0 1.0 2.2 2.0 1.7 1.9 1.6 1.3 2.4
Croatia 3.8 3.4 3.3 2.8 2.5 2.3 2.0 1.9 1.9 1.9 2.0
Slovenia 0.5 0.4 0.6 0.5 0.6 0.7 0.7 0.8 0.8 1.3 1.9
Other countries 36.9 39.2 42.7 40.2 30.7 24.7 24.9 26.5 26.1 29.2 33.2
Total 86.1 93.3 104.2 98.0 82.9 91.5 94.4 91.7 96.9 109.9 125.6
Note: For details on definitions and sources, please refer to the metadata at the end of the tables.1 2 http://dx.doi.org/10.1787/888933
INTERNATIONAL MIGRATION OUTLOOK 2014 © OECD 2014 319

STATISTICAL ANNEX
f which:omen12 (%)
51
41
48
46
50
51
44
45
45
53
54
41
48
45
48
49
158453
f which:omen12 (%)
53
54
49
51
49
45
50
43
55
53
48
47
51
54
49
51
158453
Table B.1. Inflows of foreign population by nationalityThousandsBELGIUM
2002 2003 2004 2005 2006 2007 2008 2009 2010 2011 2012OW
20
France 8.1 8.2 9.5 10.4 11.6 12.3 14.1 12.3 13.5 13.8 13.3
Romania 1.0 1.0 1.4 2.3 3.1 5.5 6.8 6.1 8.0 10.9 11.2
Netherlands 8.4 8.5 8.8 10.1 11.5 11.4 11.7 8.8 9.3 9.5 9.1
Poland 2.4 2.1 3.5 4.8 6.7 9.4 9.0 9.9 8.9 9.3 8.6
Spain 1.5 1.5 1.6 1.8 1.8 1.9 2.8 3.6 4.6 5.3 6.0
Morocco 8.5 8.4 8.0 7.1 7.5 7.8 8.2 9.1 9.8 8.5 5.7
Italy 2.3 2.3 2.3 2.5 2.6 2.7 3.7 3.6 4.3 4.7 5.2
Bulgaria 0.5 0.5 0.7 0.9 0.8 2.6 3.9 3.3 4.2 4.3 4.5
Portugal 1.6 1.8 1.9 1.9 2.0 2.3 3.2 2.9 2.7 3.1 4.2
Germany 3.0 2.9 3.3 3.3 3.3 3.4 3.8 3.4 3.3 3.1 2.9
United States 2.7 2.5 2.6 2.4 2.6 2.5 2.6 2.7 2.7 2.6 2.5
India 1.0 1.1 1.2 1.3 1.5 1.6 2.1 1.8 2.3 2.3 2.2
Turkey 3.9 3.8 3.2 3.4 3.0 3.2 3.2 3.1 3.2 2.9 2.1
United Kingdom 2.5 2.5 2.4 2.2 2.0 2.0 2.4 1.9 2.2 2.1 2.0
Greece 0.6 0.6 0.6 0.7 0.6 0.5 0.8 0.7 0.8 1.1 1.5
Other countries 22.3 20.9 21.4 22.3 22.9 24.3 27.9 29.7 33.7 34.5 28.9
Total 70.2 68.8 72.4 77.4 83.4 93.4 106.0 102.7 113.6 117.9 110.0
Note: For details on definitions and sources, please refer to the metadata at the end of the tables.1 2 http://dx.doi.org/10.1787/888933
Table B.1. Inflows of foreign population by nationalityThousands
CANADA (PERMANENT)
2002 2003 2004 2005 2006 2007 2008 2009 2010 2011 2012OW
20
China 33.3 36.3 36.4 42.3 33.1 27.0 29.3 29.0 30.2 28.7 33.0
Philippines 11.0 12.0 13.3 17.5 17.7 19.1 23.7 27.3 36.6 35.0 32.7
India 28.8 24.6 25.6 33.1 30.8 26.1 24.5 26.1 30.3 25.0 28.9
Pakistan 14.2 12.4 12.8 13.6 12.3 9.5 8.1 6.2 5.0 6.1 9.9
United States 5.3 6.0 7.5 9.3 10.9 10.5 11.2 9.7 9.2 8.8 9.4
France 4.0 4.2 5.1 5.5 5.0 5.6 6.4 7.4 6.9 5.9 8.1
Iran 7.9 5.7 6.1 5.5 7.1 6.7 6.0 6.1 6.8 6.8 6.5
United Kingdom 4.7 5.2 6.1 5.9 6.5 8.1 9.2 9.6 9.5 6.6 6.4
Haiti 2.2 1.9 1.7 1.7 1.7 1.6 2.5 2.1 4.6 6.2 5.6
Korea 7.3 7.1 5.3 5.8 6.2 5.9 7.2 5.9 5.5 4.6 5.3
Egypt 1.6 1.9 2.1 2.1 1.7 2.0 2.3 2.5 4.3 3.4 4.8
United Arab Emirates 4.4 3.3 4.4 4.1 4.1 3.4 4.7 4.6 6.8 5.2 4.3
Mexico 1.9 1.7 2.2 2.9 2.8 3.2 2.8 3.1 3.9 3.6 4.0
Colombia 3.2 4.3 4.4 6.0 5.8 4.8 5.0 4.2 4.8 4.3 3.7
Morocco 4.1 3.2 3.5 2.7 3.1 3.8 3.9 5.2 5.9 4.2 3.6
Other countries 95.0 91.6 99.5 104.3 102.9 99.6 100.2 103.2 110.4 94.4 91.5
Total 229.0 221.3 235.8 262.2 251.6 236.8 247.2 252.2 280.7 248.8 257.9
Note: For details on definitions and sources, please refer to the metadata at the end of the tables.1 2 http://dx.doi.org/10.1787/888933
INTERNATIONAL MIGRATION OUTLOOK 2014 © OECD 2014320

STATISTICAL ANNEX
f which:omen12 (%)
51
55
51
39
70
50
39
35
34
31
52
52
44
58
45
50
158453
f which:omen12 (%)
43
47
59
47
14
49
36
28
57
41
50
48
54
49
58
44
158453
Table B.1. Inflows of foreign population by nationalityThousands
CHILE
2002 2003 2004 2005 2006 2007 2008 2009 2010 2011 2012OW
20
Peru 12.8 12.9 15.6 20.0 28.6 53.2 39.0 27.6 27.7 30.7 38.6
Colombia 1.1 1.0 1.1 1.7 2.4 3.3 4.4 5.3 7.2 12.5 17.8
Bolivia 0.9 1.3 1.4 1.6 1.9 6.0 4.5 3.6 5.8 7.2 13.6
Argentina 4.9 4.9 4.3 4.1 3.5 3.0 3.7 3.9 3.8 3.8 4.9
Dominican Republic 0.0 0.1 0.1 0.1 0.2 0.3 0.0 0.6 1.0 1.8 4.4
Ecuador 2.6 2.0 1.8 1.9 2.2 3.1 3.1 2.7 2.5 2.9 3.6
United States 1.6 1.6 1.3 1.5 1.5 1.5 2.1 2.2 2.9 3.0 3.5
Spain 0.5 0.5 0.5 0.5 0.6 0.6 0.7 0.8 0.9 1.2 2.5
China 0.6 0.5 0.6 0.7 0.7 0.9 1.3 1.3 1.3 1.6 1.9
Haiti 0.0 0.0 0.0 0.0 0.1 0.1 0.1 0.3 0.7 0.9 1.8
Brazil 0.7 0.7 0.8 0.8 1.1 1.2 1.2 1.1 1.3 1.4 1.7
Venezuela 0.2 0.4 0.4 0.4 0.4 0.6 0.6 0.7 0.7 1.1 1.2
Mexico 0.3 0.3 0.3 0.4 0.5 0.5 0.7 0.7 0.7 0.8 1.0
Paraguay 0.2 0.2 0.2 0.3 0.4 0.6 0.7 0.7 0.7 0.8 0.9
France 0.3 0.3 0.3 0.4 0.4 0.4 0.5 0.5 0.6 0.6 0.8
Other countries 3.2 3.1 3.3 3.7 4.0 4.0 5.7 5.3 6.0 6.0 1.8
Total 29.9 29.8 32.1 38.1 48.5 79.4 68.4 57.1 63.9 76.3 100.1
Note: For details on definitions and sources, please refer to the metadata at the end of the tables.1 2 http://dx.doi.org/10.1787/888933
Table B.1. Inflows of foreign population by nationalityThousands
CZECH REPUBLIC
2002 2003 2004 2005 2006 2007 2008 2009 2010 2011 2012OW
20
Ukraine 10.7 15.5 16.3 23.9 30.2 39.6 18.7 8.1 3.5 2.0 5.9
Slovak Republic 13.0 23.7 15.0 10.1 6.8 13.9 7.6 5.6 5.1 4.4 4.8
Russian Federation 2.4 1.8 2.0 3.3 4.7 6.7 5.8 4.1 3.7 2.1 3.2
Viet Nam 5.7 3.6 4.5 4.9 6.4 12.3 13.4 2.3 1.4 0.7 1.6
Germany 0.8 0.8 1.3 1.4 0.8 1.9 4.3 2.0 2.0 1.3 1.3
United States 0.7 0.9 0.7 1.4 1.8 1.7 2.2 2.5 1.7 1.3 1.1
Bulgaria 0.7 0.6 0.7 0.8 0.8 1.1 1.0 0.6 0.6 0.5 0.7
Romania 0.3 0.4 0.3 0.4 0.4 0.9 0.6 0.5 0.4 0.4 0.7
Kazakhstan 0.2 0.2 0.2 0.4 0.5 1.0 0.7 0.8 0.7 0.5 0.6
Poland 1.7 1.6 1.8 1.3 0.9 2.3 1.2 0.9 0.7 0.6 0.6
Japan .. 0.4 0.3 0.5 0.5 0.6 0.6 0.4 0.3 0.2 0.4
Korea .. 0.7 0.4 0.1 0.2 0.5 0.7 0.3 0.4 0.4 0.4
China .. 0.5 0.5 0.8 1.4 1.0 0.9 0.6 0.5 0.3 0.4
Moldova 0.8 1.2 1.0 1.7 2.4 3.4 3.3 1.3 0.4 0.2 0.4
Belarus 0.6 0.6 0.6 0.7 0.8 1.1 0.6 0.4 0.3 0.2 0.4
Other countries 5.9 5.0 5.4 6.8 7.6 14.4 16.0 9.7 9.0 7.4 7.8
Total 43.6 57.4 50.8 58.6 66.1 102.5 77.8 40.0 30.5 22.6 30.3
Note: For details on definitions and sources, please refer to the metadata at the end of the tables.1 2 http://dx.doi.org/10.1787/888933
INTERNATIONAL MIGRATION OUTLOOK 2014 © OECD 2014 321

STATISTICAL ANNEX
f which:omen11 (%)
40
39
53
46
94
63
38
39
54
37
41
50
48
58
49
49
158453
f which:omen12 (%)
54
..
..
..
..
..
..
..
..
..
45
158453
Table B.1. Inflows of foreign population by nationalityThousandsDENMARK
2002 2003 2004 2005 2006 2007 2008 2009 2010 2011 2012OW
20
Poland 0.4 0.4 0.7 1.3 2.5 4.3 6.5 3.4 2.9 3.2 3.3
Romania 0.2 0.2 0.2 0.3 0.3 0.8 1.4 1.5 2.0 2.7 3.2
Germany 0.8 0.8 1.0 1.3 1.9 3.0 3.0 2.2 1.9 1.9 1.8
Lithuania 0.4 0.3 0.5 0.6 0.8 0.7 1.1 1.3 1.5 1.6 1.5
Philippines 0.2 0.2 0.4 0.5 0.8 1.3 1.7 1.8 1.8 1.7 1.4
Norway 1.3 1.3 1.2 1.2 1.4 1.4 1.4 1.3 1.4 1.5 1.4
Bulgaria 0.1 0.1 0.1 0.1 0.1 0.3 0.7 0.9 0.9 1.0 1.2
Ukraine 0.4 0.5 0.6 0.9 1.3 1.8 1.8 1.4 1.2 1.2 1.2
Sweden 0.7 0.8 0.8 0.9 1.2 1.3 1.3 1.1 1.1 1.1 1.1
United Kingdom 0.7 0.7 0.7 0.7 0.9 0.9 1.0 0.9 1.0 1.1 1.0
India 0.2 0.3 0.4 0.5 0.5 0.9 1.0 0.8 0.9 1.1 0.9
United States 0.5 0.5 0.6 0.6 0.7 0.8 0.9 0.7 0.9 0.9 0.9
Spain 0.2 0.2 0.3 0.4 0.4 0.5 0.5 0.5 0.7 0.8 0.9
China 1.0 1.4 1.2 1.0 0.8 1.0 1.3 1.0 0.8 0.8 0.8
Latvia 0.2 0.2 0.2 0.2 0.3 0.4 0.4 0.7 0.9 0.8 0.7
Other countries 14.1 10.4 9.7 9.5 10.3 12.3 13.1 12.6 13.5 13.4 14.2
Total 21.5 18.4 18.7 20.1 24.0 31.4 37.0 32.0 33.4 34.6 35.5
Note: For details on definitions and sources, please refer to the metadata at the end of the tables.1 2 http://dx.doi.org/10.1787/888933
Table B.1. Inflows of foreign population by nationalityThousandsESTONIA
2002 2003 2004 2005 2006 2007 2008 2009 2010 2011 2012OW
20
Russian Federation .. .. 0.2 0.2 0.3 0.4 0.4 0.5 0.4 0.9 0.5
Finland .. .. .. .. .. .. .. 0.3 .. .. ..
Ukraine .. .. .. .. .. .. .. 0.2 .. .. ..
Germany .. .. .. .. .. .. .. 0.1 .. .. ..
Latvia .. .. .. .. .. .. .. 0.1 .. .. ..
China .. .. .. .. .. .. .. 0.1 .. .. ..
Sweden .. .. .. .. .. .. .. 0.1 .. .. ..
United States .. .. .. .. .. .. .. 0.1 .. .. ..
Italy .. .. .. .. .. .. .. 0.1 .. .. ..
France .. .. .. .. .. .. .. 0.1 .. .. ..
Other countries .. .. 0.5 0.7 1.1 1.5 1.5 0.6 0.8 0.8 0.6
Total .. .. 0.8 1.0 1.5 2.0 1.9 2.2 1.2 1.7 1.1
Note: For details on definitions and sources, please refer to the metadata at the end of the tables.1 2 http://dx.doi.org/10.1787/888933
INTERNATIONAL MIGRATION OUTLOOK 2014 © OECD 2014322

STATISTICAL ANNEX
f which:omen12 (%)
50
58
57
41
49
85
35
42
38
53
38
26
22
54
41
48
158453
f which:omen12 (%)
49
54
38
56
45
41
25
57
68
51
55
56
56
52
49
50
158453
Table B.1. Inflows of foreign population by nationalityThousandsFINLAND
2002 2003 2004 2005 2006 2007 2008 2009 2010 2011 2012OW
20
Estonia 1.2 1.1 1.7 1.9 2.5 2.9 3.0 3.2 3.9 4.7 6.0
Russian Federation 2.0 1.7 1.9 2.1 2.1 2.5 3.0 2.3 2.3 2.8 3.1
China 0.4 0.4 0.4 0.6 0.5 0.7 1.0 0.8 0.6 0.8 0.7
Sweden 0.6 0.7 0.7 0.7 0.7 0.7 0.9 0.8 0.7 0.7 0.6
Afghanistan 0.4 0.2 0.3 0.3 0.3 0.2 0.2 0.2 0.3 0.4 0.6
Thailand 0.3 0.4 0.4 0.4 0.4 0.6 0.6 0.6 0.6 0.6 0.6
Iraq 0.3 0.1 0.3 0.1 0.1 0.4 0.5 0.9 1.1 0.7 0.6
India 0.2 0.2 0.3 0.4 0.5 0.5 0.6 0.6 0.5 0.6 0.6
Poland 0.1 0.1 0.1 0.1 0.2 0.4 0.6 0.3 0.3 0.3 0.5
Somalia 0.3 0.2 0.2 0.4 0.3 0.6 0.6 0.8 1.0 0.7 0.4
Turkey 0.3 0.3 0.2 0.3 0.4 0.3 0.4 0.4 0.3 0.3 0.4
Nepal 0.0 0.0 0.0 0.1 0.1 0.2 0.2 0.2 0.3 0.3 0.4
United Kingdom 0.3 0.3 0.3 0.3 0.3 0.4 0.3 0.3 0.3 0.3 0.4
Viet Nam 0.1 0.0 0.1 0.2 0.2 0.3 0.3 0.3 0.3 0.4 0.4
Iran 0.2 0.3 0.2 0.2 0.2 0.2 0.2 0.2 0.2 0.3 0.3
Other countries 3.3 3.5 4.3 4.7 5.0 6.6 7.4 6.0 5.7 6.6 7.7
Total 10.0 9.4 11.5 12.7 13.9 17.5 19.9 18.1 18.2 20.4 23.3
Note: For details on definitions and sources, please refer to the metadata at the end of the tables.1 2 http://dx.doi.org/10.1787/888933
Table B.1. Inflows of foreign population by nationalityThousands
FRANCE
2002 2003 2004 2005 2006 2007 2008 2009 2010 2011 2012OW
20
Algeria 23.4 28.5 27.9 24.8 31.1 26.8 25.7 24.5 22.8 22.6 25.1
Morocco 21.8 22.6 22.2 20.0 23.0 22.1 22.6 21.6 20.7 19.4 20.2
Tunisia 7.8 9.4 8.9 8.0 9.3 8.8 9.1 10.1 11.2 10.8 12.0
China 1.9 2.4 2.9 2.8 6.0 5.0 5.7 6.1 6.6 6.4 7.2
Turkey 8.5 8.6 9.1 8.9 9.3 7.9 7.9 7.3 6.2 5.9 6.1
Senegal 2.5 2.6 2.5 2.5 3.3 3.3 3.6 4.3 4.5 4.6 4.7
Mali 2.0 2.6 2.6 2.5 3.3 3.0 5.0 6.4 5.6 5.7 4.4
Cameroon 2.9 3.4 4.1 4.3 4.5 4.1 4.1 4.2 3.9 3.9 4.1
Russian Federation 1.9 2.4 2.9 3.0 3.2 2.9 3.3 3.7 3.8 4.1 4.1
Democratic Republic of the Congo 1.8 1.7 1.8 2.4 4.0 3.6 3.7 3.6 3.6 3.7 4.0
Côte d’Ivoire 2.8 3.4 4.0 3.8 4.0 3.7 3.6 3.7 3.6 3.5 3.6
United States 2.4 2.3 2.6 2.4 2.9 2.7 3.0 3.7 3.2 3.4 3.4
Haiti 2.1 2.7 3.1 3.2 3.2 2.5 2.4 2.8 5.0 3.6 3.3
Comoros 1.0 1.1 1.0 1.1 2.8 2.8 3.3 3.6 3.1 2.8 3.3
Serbia 1.6 1.7 2.0 2.0 2.3 2.1 2.3 2.5 2.3 2.7 3.0
Other countries 40.0 40.8 43.9 44.4 47.3 44.5 48.0 51.5 51.7 51.6 54.9
Total 124.2 136.4 141.6 135.9 159.4 145.9 153.3 159.6 157.8 154.8 163.4
Note: For details on definitions and sources, please refer to the metadata at the end of the tables.1 2 http://dx.doi.org/10.1787/888933
INTERNATIONAL MIGRATION OUTLOOK 2014 © OECD 2014 323

STATISTICAL ANNEX
f which:omen12 (%)
35
37
35
30
38
42
38
42
45
51
46
63
31
49
38
39
158453
f which:omen11 (%)
..
..
..
..
..
..
..
..
158453
Table B.1. Inflows of foreign population by nationalityThousandsGERMANY
2002 2003 2004 2005 2006 2007 2008 2009 2010 2011 2012OW
20
Poland 81.6 88.2 125.0 147.7 151.7 140.0 119.9 112.0 115.6 164.7 177.8
Romania 24.0 23.8 23.5 23.3 23.4 42.9 48.2 57.3 75.5 97.5 120.5
Bulgaria 13.2 13.4 11.6 9.1 7.5 20.5 24.1 29.2 39.8 52.4 60.2
Hungary 16.5 14.3 17.4 18.6 18.6 22.2 25.2 25.3 29.3 41.1 54.5
Italy 25.0 21.6 19.6 18.3 17.7 18.2 20.1 22.2 23.9 28.1 36.9
Greece 15.0 12.1 10.2 9.0 8.2 8.0 8.3 8.6 12.3 23.0 32.7
Turkey 58.1 49.8 42.6 36.0 29.6 26.7 26.7 27.2 27.6 28.6 26.2
Serbia 26.4 22.8 21.7 17.5 10.9 2.2 7.0 9.1 19.1 18.4 24.1
Spain 8.5 7.7 7.6 7.1 8.2 8.6 7.8 9.0 10.7 16.2 23.3
China 18.5 16.1 13.1 12.0 12.9 13.6 14.3 15.4 16.2 18.3 19.7
United States 15.5 14.7 15.3 15.2 16.3 17.5 17.5 17.7 18.3 20.1 19.6
Russian Federation 36.5 31.8 28.5 23.1 16.4 15.0 15.1 15.7 16.1 17.5 18.8
India 9.4 9.2 9.1 8.4 8.9 9.4 11.4 12.0 13.2 15.4 18.1
France 12.7 12.3 12.5 12.3 13.6 13.8 13.0 12.9 13.3 13.8 14.5
Slovak Republic 11.6 10.6 11.6 11.8 11.3 9.4 8.7 8.5 8.6 12.2 13.9
Other countries 286.0 253.5 232.8 209.9 203.1 207.0 206.7 224.4 244.2 274.3 305.3
Total 658.3 601.8 602.2 579.3 558.5 574.8 573.8 606.3 683.5 841.7 965.9
Note: For details on definitions and sources, please refer to the metadata at the end of the tables.1 2 http://dx.doi.org/10.1787/888933
Table B.1. Inflows of foreign population by nationalityThousands
GREECE
2002 2003 2004 2005 2006 2007 2008 2009 2010 2011 2012OW
20
Albania .. .. .. 39.1 40.2 34.3 32.1 34.6 23.7 14.3 ..
Russian Federation .. .. .. 2.7 1.5 1.0 1.0 1.2 1.2 1.4 ..
Egypt .. .. .. 3.1 3.9 2.0 1.4 1.4 1.1 0.9 ..
Ukraine .. .. .. 3.1 1.7 0.8 0.7 0.8 0.9 0.9 ..
India .. .. .. 0.8 1.5 0.5 0.6 0.7 0.6 0.8 ..
Georgia .. .. .. 3.0 2.2 1.0 0.8 1.0 0.9 0.7 ..
Philippines .. .. .. 1.3 1.5 1.1 0.8 1.1 0.5 0.3 ..
Other countries .. .. .. 12.3 10.6 5.6 5.4 5.7 4.5 3.9 ..
Total .. .. .. 65.3 63.2 46.3 42.9 46.5 33.4 23.2 17.7
Note: For details on definitions and sources, please refer to the metadata at the end of the tables.1 2 http://dx.doi.org/10.1787/888933
INTERNATIONAL MIGRATION OUTLOOK 2014 © OECD 2014324

STATISTICAL ANNEX
f which:omen12 (%)
42
42
47
45
57
45
28
40
54
32
29
40
43
50
43
43
158453
f which:omen12 (%)
45
39
48
74
43
55
42
41
50
41
57
75
61
44
43
49
158453
Table B.1. Inflows of foreign population by nationalityThousandsHUNGARY
2002 2003 2004 2005 2006 2007 2008 2009 2010 2011 2012OW
20
Romania 10.3 9.6 12.1 8.9 7.9 6.7 10.0 7.1 6.6 5.8 4.2
Germany 0.3 0.4 0.1 3.9 0.7 0.7 3.2 2.7 2.4 2.4 2.1
China 0.1 0.7 0.8 0.5 1.4 1.9 1.5 1.3 1.1 0.9 1.1
United States 0.4 0.5 0.4 0.4 0.6 0.4 1.2 1.3 1.1 1.0 1.0
Slovak Republic 0.5 0.4 0.1 1.6 0.6 0.7 1.3 1.2 1.2 1.1 1.0
Ukraine 2.1 2.6 3.6 2.1 3.7 2.9 4.1 1.9 1.6 1.3 0.9
Serbia 0.4 0.7 1.6 1.1 2.4 4.4 4.1 1.2 1.0 0.9 0.7
Turkey 0.1 0.1 0.2 0.1 0.3 0.3 0.7 0.5 0.5 0.6 0.6
Russian Federation 0.3 0.3 0.3 0.2 0.4 0.3 0.4 0.5 0.4 0.4 0.5
Austria 0.1 0.1 0.0 0.8 0.4 0.3 0.7 0.7 0.6 0.5 0.5
Italy 0.1 0.1 0.0 0.3 0.2 0.1 0.3 0.3 0.3 0.3 0.4
Iran .. .. .. 0.2 0.4 0.2 0.5 0.5 0.4 0.4 0.4
Japan 0.2 0.2 0.2 0.3 0.4 0.3 0.5 0.3 0.3 0.3 0.3
Korea .. .. .. 0.1 0.4 0.3 0.3 0.3 0.4 0.4 0.3
United Kingdom 0.3 0.4 0.1 0.7 0.1 0.1 0.4 0.3 0.3 0.4 0.3
Other countries 2.7 3.2 2.7 4.4 3.6 2.9 6.4 5.6 5.6 5.7 6.1
Total 18.0 19.4 22.2 25.6 23.6 22.6 35.5 25.6 23.9 22.5 20.3
Note: For details on definitions and sources, please refer to the metadata at the end of the tables.1 2 http://dx.doi.org/10.1787/888933
Table B.1. Inflows of foreign population by nationalityThousandsICELAND
2002 2003 2004 2005 2006 2007 2008 2009 2010 2011 2012OW
20
Poland 0.3 0.1 0.2 1.5 3.3 5.6 3.9 1.2 0.8 0.8 0.9
United States 0.1 0.1 0.1 0.1 0.2 0.1 0.1 0.1 0.1 0.1 0.2
Lithuania 0.1 0.0 0.1 0.2 0.4 0.6 0.4 0.2 0.3 0.2 0.1
Germany 0.1 0.1 0.1 0.3 0.3 0.3 0.3 0.2 0.2 0.2 0.1
United Kingdom 0.1 0.0 0.1 0.1 0.1 0.1 0.1 0.1 0.1 0.1 0.1
Sweden 0.1 0.1 0.1 0.1 0.1 0.2 0.1 0.1 0.1 0.1 0.1
Denmark 0.1 0.1 0.2 0.2 0.2 0.2 0.1 0.1 0.1 0.1 0.1
Spain 0.0 0.0 0.0 0.0 0.0 0.0 0.1 0.1 0.1 0.1 0.1
Latvia 0.0 0.0 0.0 0.1 0.2 0.2 0.3 0.2 0.1 0.1 0.1
Romania 0.0 0.0 0.0 0.0 0.0 0.1 0.1 0.0 0.0 0.0 0.1
Canada 0.0 0.0 0.0 0.0 0.1 0.1 0.1 0.0 0.0 0.0 0.1
Philippines 0.1 0.1 0.1 0.2 0.1 0.1 0.1 0.1 0.1 0.1 0.1
China 0.0 0.1 0.1 0.4 0.2 0.1 0.1 0.1 0.1 0.1 0.0
Norway 0.1 0.1 0.0 0.1 0.1 0.1 0.0 0.0 0.0 0.0 0.0
France 0.0 0.0 0.0 0.0 0.0 0.1 0.1 0.1 0.1 0.1 0.0
Other countries 0.7 0.6 1.3 1.3 1.7 1.5 1.6 0.8 0.8 0.8 0.8
Total 1.9 1.4 2.5 4.7 7.1 9.3 7.5 3.4 3.0 2.8 2.8
Note: For details on definitions and sources, please refer to the metadata at the end of the tables.1 2 http://dx.doi.org/10.1787/888933
INTERNATIONAL MIGRATION OUTLOOK 2014 © OECD 2014 325

STATISTICAL ANNEX
f which:omen12 (%)
55
50
52
53
52
45
56
53
48
45
54
58
52
55
46
53
158453
f which:omen12 (%)
61
51
46
56
74
34
22
56
63
33
23
44
40
62
56
52
158453
Table B.1. Inflows of foreign population by nationalityThousands
ISRAEL
2002 2003 2004 2005 2006 2007 2008 2009 2010 2011 2012OW
20
Former USSR 18.5 12.4 10.1 9.4 7.5 6.5 5.6 6.8 7.0 7.2 7.2
Ethiopia 2.7 3.0 3.7 3.6 3.6 3.6 1.6 0.2 1.7 2.7 2.4
United States 1.5 1.7 1.9 2.0 2.2 2.1 2.0 2.5 2.5 2.4 2.3
France 2.0 1.8 2.0 2.5 2.4 2.3 1.6 1.6 1.8 1.6 1.7
United Kingdom 0.3 0.3 0.4 0.4 0.6 0.6 0.5 0.7 0.6 0.5 0.6
Canada 0.1 0.2 0.2 0.3 0.2 0.2 0.3 0.3 0.3 0.2 0.2
Argentina 5.9 1.4 0.5 0.4 0.3 0.3 0.2 0.3 0.3 0.2 0.2
Brazil 0.2 0.2 0.2 0.3 0.2 0.3 0.2 0.2 0.2 0.2 0.2
Belgium 0.1 0.1 0.1 0.1 0.1 0.1 0.1 0.1 0.2 0.2 0.1
Italy 0.0 0.0 0.0 0.0 0.0 0.1 0.1 0.1 0.1 0.1 0.1
South Africa 0.2 0.1 0.1 0.1 0.1 0.1 0.3 0.3 0.2 0.2 0.1
Hungary 0.1 0.0 0.1 0.1 0.1 0.0 0.1 0.1 0.1 0.1 0.1
Germany 0.1 0.1 0.1 0.1 0.1 0.1 0.1 0.1 0.1 0.1 0.1
Australia 0.0 0.1 0.1 0.1 0.1 0.1 0.1 0.1 0.1 0.1 0.1
Switzerland 0.1 0.1 0.1 0.1 0.1 0.1 0.1 0.1 0.1 0.1 0.1
Other countries 1.8 1.8 1.3 1.7 1.7 1.7 1.1 1.1 1.2 1.1 1.0
Total 33.6 23.3 20.9 21.2 19.3 18.1 13.7 14.6 16.6 16.9 16.6
Note: For details on definitions and sources, please refer to the metadata at the end of the tables.Information on data for Israel: http://dx.doi.org/10.1787/888932315602.
1 2 http://dx.doi.org/10.1787/888933
Table B.1. Inflows of foreign population by nationalityThousands
ITALY
2002 2003 2004 2005 2006 2007 2008 2009 2010 2011 2012OW
20
Romania 16.5 78.4 66.1 45.3 39.7 271.4 174.6 105.6 92.1 90.1 81.7
China 10.0 14.2 19.3 14.7 13.6 9.7 12.8 16.8 22.9 20.1 20.5
Morocco 15.3 40.8 34.8 26.1 21.8 23.5 37.3 33.1 30.0 23.9 19.6
Albania 24.5 49.3 38.8 28.4 23.1 23.3 35.7 27.5 22.6 16.6 14.1
Ukraine 3.6 44.2 35.0 15.7 14.8 15.5 24.0 22.6 30.4 17.9 11.5
India 4.8 8.5 9.0 7.2 6.3 7.1 12.5 12.8 15.2 13.3 11.2
Bangladesh 3.7 6.7 8.4 5.8 5.6 5.2 9.3 8.9 9.7 10.3 10.1
Philippines 3.9 6.9 8.1 5.5 4.4 4.0 7.8 10.0 10.7 10.4 9.9
Moldova 2.2 16.3 11.9 9.3 7.8 13.0 22.0 16.8 26.6 15.0 8.8
Pakistan 3.4 5.3 7.5 6.5 4.1 3.5 5.7 7.9 10.8 7.5 8.8
Egypt 2.9 6.4 11.6 5.6 5.0 3.7 5.3 8.0 9.3 9.6 8.6
Sri Lanka 3.0 4.2 5.2 3.9 3.7 3.8 6.6 6.3 7.1 6.8 7.1
Nigeria 1.9 4.2 3.8 2.7 2.6 2.5 3.7 4.0 4.8 4.5 6.7
Brazil 2.8 5.5 5.2 8.8 10.2 11.9 12.6 9.7 8.6 7.1 5.7
Peru 3.0 9.2 10.0 5.4 4.9 4.5 7.2 10.4 12.2 8.7 5.6
Other countries 60.5 124.8 120.1 92.0 87.0 112.7 119.4 106.4 111.4 92.7 91.4
Total 161.9 424.9 394.8 282.8 254.6 515.2 496.5 406.7 424.5 354.3 321.3
Note: For details on definitions and sources, please refer to the metadata at the end of the tables.1 2 http://dx.doi.org/10.1787/888933
INTERNATIONAL MIGRATION OUTLOOK 2014 © OECD 2014326

STATISTICAL ANNEX
f which:omen12 (%)
..
..
..
..
..
..
..
..
..
..
..
..
..
..
..
..
158453
f which:omen12 (%)
50
52
58
42
29
57
25
11
12
54
70
40
4
2
40
45
158453
Table B.1. Inflows of foreign population by nationalityThousands
JAPAN
2002 2003 2004 2005 2006 2007 2008 2009 2010 2011 2012OW
20
China 88.6 92.2 90.3 105.8 112.5 125.3 134.2 121.2 107.9 100.4 107.0
Korea 22.9 21.9 22.8 22.7 24.7 28.1 30.0 27.0 27.9 23.4 25.7
United States 21.5 21.5 21.3 22.1 22.2 22.8 24.0 23.5 22.7 19.3 21.0
Viet Nam 5.3 6.6 6.5 7.7 8.5 9.9 12.5 10.9 11.9 13.9 19.5
Philippines 87.2 93.4 96.2 63.5 28.3 25.3 21.0 15.8 13.3 13.6 15.4
Thailand 5.9 6.6 7.1 9.0 8.7 9.0 10.5 9.9 10.9 13.6 15.4
Indonesia 9.7 11.1 10.7 12.9 11.4 10.1 10.1 7.5 8.3 8.4 9.3
Chinese Taipei .. .. .. .. 4.5 4.9 5.5 5.4 6.6 5.6 6.6
Brazil 22.7 33.4 32.2 33.9 27.0 22.9 14.4 3.0 4.7 4.5 5.8
India .. .. .. .. 4.9 5.8 5.7 4.6 4.9 4.7 5.6
United Kingdom 6.6 6.6 6.3 6.3 6.6 5.8 6.0 5.3 5.8 5.2 5.5
Nepal .. .. .. .. 1.6 2.2 3.6 3.6 2.9 3.5 4.8
Germany .. .. .. .. 4.7 4.9 4.8 4.5 4.3 3.7 4.1
France .. .. .. .. 3.8 4.2 4.5 3.9 4.0 2.9 4.0
Russian Federation 6.6 7.7 7.1 6.2 5.0 4.2 4.5 4.5 3.5 2.8 3.8
Other countries 66.9 73.1 71.4 82.2 51.3 51.3 53.1 46.4 47.7 41.6 50.4
Total 343.8 373.9 372.0 372.3 325.6 336.6 344.5 297.1 287.1 266.9 303.9
Note: For details on definitions and sources, please refer to the metadata at the end of the tables.1 2 http://dx.doi.org/10.1787/888933
Table B.1. Inflows of foreign population by nationalityThousands
KOREA
2002 2003 2004 2005 2006 2007 2008 2009 2010 2011 2012OW
20
China 55.7 52.4 67.4 115.8 161.2 177.0 161.7 117.6 155.3 149.2 127.3
United States 19.1 17.8 18.1 18.0 17.8 18.9 23.4 27.1 28.3 28.1 28.9
Viet Nam 3.0 6.7 7.8 18.0 20.0 21.2 24.0 16.4 22.9 27.9 24.7
Thailand 6.8 7.1 9.8 13.7 15.8 10.5 8.6 5.8 6.9 10.3 13.8
Uzbekistan 3.9 7.0 3.6 3.2 4.8 4.9 9.4 4.7 8.6 8.2 11.4
Philippines 7.4 10.0 10.1 16.5 17.9 12.2 9.1 8.9 9.1 9.6 9.9
Cambodia 0.1 0.8 0.9 0.8 2.2 1.9 3.4 2.6 3.7 6.4 9.5
Indonesia 9.9 9.3 5.2 10.2 6.9 5.2 9.7 3.3 5.3 8.1 8.3
Nepal 1.0 1.9 1.5 0.6 1.1 0.8 2.4 2.6 2.7 4.3 6.9
Canada 5.1 5.1 5.4 5.5 5.6 6.0 6.4 6.5 6.5 6.0 6.0
Japan 8.7 7.7 7.0 6.8 5.5 5.0 4.7 4.4 4.7 5.5 5.8
Mongolia 2.0 4.6 5.1 8.3 9.6 8.6 8.1 5.3 5.4 4.3 5.7
Sri Lanka 0.8 2.4 1.9 5.0 4.1 2.5 4.8 1.7 4.2 5.9 4.7
Myanmar 0.2 0.8 0.8 0.6 1.8 0.5 0.5 1.7 0.6 2.6 4.1
Russian Federation 8.1 9.3 5.5 4.2 3.7 3.4 2.6 2.9 2.6 2.6 2.7
Other countries 27.1 26.1 28.5 26.3 25.1 21.7 23.4 21.3 26.2 28.4 30.6
Total 158.9 168.9 178.5 253.7 303.0 300.4 302.2 232.8 293.1 307.2 300.2
Note: For details on definitions and sources, please refer to the metadata at the end of the tables.1 2 http://dx.doi.org/10.1787/888933
INTERNATIONAL MIGRATION OUTLOOK 2014 © OECD 2014 327

STATISTICAL ANNEX
f which:omen12 (%)
43
43
40
36
46
49
50
46
46
61
54
47
46
44
59
46
158453
f which:omen12 (%)
44
51
59
51
32
44
44
41
50
28
60
40
46
32
55
46
158453
Table B.1. Inflows of foreign population by nationalityThousands
LUXEMBOURG
2002 2003 2004 2005 2006 2007 2008 2009 2010 2011 2012OW
20
Portugal 2.8 3.9 3.5 3.8 3.8 4.4 4.5 3.8 3.8 5.0 5.2
France 1.9 1.9 2.0 2.2 2.5 2.8 3.2 2.7 2.9 3.2 3.5
Belgium 1.3 1.1 1.0 1.0 0.9 0.9 1.0 1.0 1.2 1.2 1.3
Italy 0.5 0.5 0.5 0.6 0.6 0.6 0.8 0.7 0.8 1.0 1.1
Germany 0.6 0.7 0.8 0.8 0.9 1.0 1.1 1.0 1.0 1.1 1.0
Serbia 0.0 0.0 0.1 0.3 0.2 0.4 0.3 0.1 0.3 0.9 0.5
Spain 0.2 0.2 0.2 0.2 0.2 0.2 0.2 0.2 0.3 0.5 0.5
United Kingdom 0.4 0.3 0.3 0.4 0.4 0.4 0.5 0.4 0.4 0.4 0.4
United States 0.1 0.3 0.2 0.3 0.3 0.3 0.3 0.3 0.3 0.3 0.4
Romania 0.0 0.0 0.1 0.1 0.1 0.3 0.3 0.2 0.3 0.5 0.4
Poland 0.1 0.1 0.2 0.3 0.3 0.4 0.5 0.4 0.4 0.4 0.4
Greece 0.0 0.1 0.1 0.1 0.1 0.1 0.1 0.1 0.1 0.2 0.3
Bosnia and Herzegovina 0.1 0.1 0.1 0.1 0.0 0.1 0.1 0.0 0.1 0.1 0.2
Netherlands 0.2 0.2 0.2 0.2 0.3 0.2 0.3 0.2 0.2 0.2 0.2
China 0.1 0.1 0.1 0.1 0.1 0.1 0.1 0.1 0.1 0.2 0.2
Other countries 2.7 3.2 3.0 3.3 2.9 3.5 3.4 3.2 3.6 4.0 3.7
Total 11.0 12.6 12.2 13.8 13.7 15.8 16.8 14.6 15.8 19.1 19.4
Note: For details on definitions and sources, please refer to the metadata at the end of the tables.1 2 http://dx.doi.org/10.1787/888933
Table B.1. Inflows of foreign population by nationalityThousands
MEXICO
2002 2003 2004 2005 2006 2007 2008 2009 2010 2011 2012OW
20
United States .. .. .. .. .. 1.4 2.2 2.9 4.0 4.3 4.2
Cuba .. .. .. .. .. 0.3 1.0 1.7 1.8 1.7 1.9
Colombia .. .. .. .. .. 0.3 1.1 1.9 2.3 1.8 1.5
Venezuela .. .. .. .. .. 0.3 0.7 1.3 1.7 1.3 1.3
Spain .. .. .. .. .. 0.3 0.6 0.9 1.0 0.8 1.1
Argentina .. .. .. .. .. 0.5 0.9 1.4 1.4 1.0 0.9
Canada .. .. .. .. .. 0.2 0.4 0.6 0.7 0.8 0.9
China .. .. .. .. .. 0.6 1.3 2.0 1.7 1.1 0.9
Guatemala .. .. .. .. .. 0.1 1.0 2.1 1.8 1.3 0.5
Italy .. .. .. .. .. 0.2 0.3 0.5 0.6 0.5 0.5
Honduras .. .. .. .. .. 0.0 0.8 1.4 1.5 1.0 0.5
Korea .. .. .. .. .. 0.3 0.4 0.4 0.5 0.4 0.4
Peru .. .. .. .. .. 0.2 0.4 0.7 0.8 0.6 0.4
France .. .. .. .. .. 0.2 0.4 0.5 0.6 0.5 0.4
El Salvador .. .. .. .. .. 0.1 0.5 0.8 0.7 0.7 0.4
Other countries .. .. .. .. .. 2.2 4.1 4.9 4.9 4.2 3.8
Total 5.8 6.9 8.5 9.2 6.9 7.2 15.9 23.9 26.2 22.0 19.5
Note: For details on definitions and sources, please refer to the metadata at the end of the tables.1 2 http://dx.doi.org/10.1787/888933
INTERNATIONAL MIGRATION OUTLOOK 2014 © OECD 2014328

STATISTICAL ANNEX
f which:omen12 (%)
48
56
53
49
40
50
40
53
39
42
45
48
50
51
56
50
158453
f which:omen12 (%)
49
42
55
55
52
46
48
53
55
43
53
61
75
49
51
51
158453
Table B.1. Inflows of foreign population by nationalityThousands
NETHERLANDS
2002 2003 2004 2005 2006 2007 2008 2009 2010 2011 2012OW
20
Poland 1.6 1.5 4.5 5.7 6.8 9.2 13.3 12.7 14.5 18.6 18.3
Germany 5.1 4.8 5.3 5.9 7.2 7.5 9.0 8.7 9.8 9.6 8.7
China 3.4 3.8 3.0 3.0 2.9 3.4 4.2 4.3 4.5 5.5 5.2
Bulgaria 0.4 0.5 0.4 0.4 0.5 4.9 5.2 4.3 4.3 5.4 5.0
United Kingdom 4.8 4.1 3.6 3.2 3.6 4.0 4.7 4.4 4.4 4.4 4.7
Spain 1.4 1.3 1.3 1.3 1.4 1.5 2.3 2.6 3.1 3.7 4.6
India 0.6 0.6 0.6 1.2 2.0 2.5 3.5 3.1 3.2 3.8 4.0
United States 3.0 2.5 2.3 2.5 3.1 3.2 3.4 3.1 3.3 3.7 3.7
Italy 1.4 1.3 1.2 1.4 1.6 1.9 2.6 2.6 2.8 3.1 3.6
Greece 0.9 0.7 0.7 0.8 1.0 1.0 1.4 1.4 1.8 2.7 3.3
Turkey 5.4 6.2 4.1 3.1 2.8 2.4 3.3 3.5 3.7 3.4 3.2
Hungary 0.4 0.4 0.6 0.6 0.6 1.0 1.7 2.2 2.4 2.6 3.1
France 2.0 1.9 1.8 1.8 2.0 2.2 3.0 2.9 2.9 2.9 3.0
Belgium 1.8 1.7 1.5 1.4 1.7 1.8 2.1 2.0 2.1 2.3 2.6
Romania 0.6 0.7 0.6 0.5 0.7 2.3 2.4 2.2 2.6 2.7 2.5
Other countries 53.6 41.6 33.7 30.5 30.0 31.4 41.2 44.5 44.8 44.1 40.1
Total 86.6 73.6 65.1 63.4 67.7 80.3 103.4 104.4 110.2 118.5 115.7
Note: For details on definitions and sources, please refer to the metadata at the end of the tables.1 2 http://dx.doi.org/10.1787/888933
Table B.1. Inflows of foreign population by nationalityThousands
NEW ZEALAND
2002 2003 2004 2005 2006 2007 2008 2009 2010 2011 2012OW
20
United Kingdom 6.5 8.0 8.7 17.1 13.0 11.3 9.5 7.8 7.5 6.3 5.6
India 8.3 4.8 3.1 3.5 3.7 3.9 3.2 3.2 4.0 4.7 5.3
China 8.4 6.2 4.0 5.6 6.8 5.6 7.4 5.8 5.6 5.5 4.8
Philippines 1.6 0.9 0.8 1.1 1.7 3.7 3.6 3.4 3.9 3.1 3.3
Fiji 2.4 2.5 2.3 2.6 2.7 2.8 3.2 3.3 3.0 3.1 2.3
Samoa 1.2 2.2 1.6 2.6 2.1 1.9 2.2 2.0 1.6 2.0 2.2
South Africa 3.4 2.4 2.4 4.5 3.6 4.0 4.7 5.2 4.6 2.8 2.1
Korea 2.5 1.7 1.5 2.1 2.1 1.0 0.8 0.9 1.1 1.4 1.3
United States 1.0 1.1 1.0 2.1 1.6 1.3 1.2 1.2 1.1 1.2 1.3
Tonga 0.7 2.4 1.2 1.1 1.2 0.9 0.9 0.8 0.8 0.9 0.7
Malaysia 1.2 1.0 0.5 0.6 0.7 0.6 0.7 0.6 0.7 0.7 0.6
Germany 0.3 0.4 0.4 0.8 0.7 0.8 0.7 0.7 0.7 0.6 0.5
Japan 0.4 0.5 0.4 0.8 0.6 0.5 0.4 0.5 0.5 0.5 0.5
Ireland 0.2 0.2 0.3 0.5 0.4 0.4 0.3 0.3 0.5 0.4 0.5
Sri Lanka 0.7 0.3 0.2 0.3 0.3 0.4 0.6 0.6 0.8 0.5 0.5
Other countries 10.0 8.8 7.6 8.8 8.5 7.7 7.6 7.5 8.0 7.3 7.7
Total 48.8 43.4 36.2 54.1 49.8 46.9 46.9 43.6 44.3 40.8 39.1
Note: For details on definitions and sources, please refer to the metadata at the end of the tables.1 2 http://dx.doi.org/10.1787/888933
INTERNATIONAL MIGRATION OUTLOOK 2014 © OECD 2014 329

STATISTICAL ANNEX
f which:omen12 (%)
31
39
46
46
80
50
41
41
46
39
36
44
32
41
84
45
158453
f which:omen12 (%)
..
..
..
..
..
..
..
..
..
..
..
..
..
..
..
..
158453
Table B.1. Inflows of foreign population by nationalityThousandsNORWAY
2002 2003 2004 2005 2006 2007 2008 2009 2010 2011 2012OW
20
Poland 0.7 0.6 1.6 3.3 7.4 14.2 14.4 10.5 11.3 12.9 11.5
Lithuania 0.3 0.3 0.5 0.8 1.3 2.4 2.9 3.2 6.6 7.7 6.6
Sweden 2.9 2.7 2.4 2.7 3.4 4.4 5.7 6.0 7.6 8.2 5.7
Somalia 2.2 1.7 1.2 1.1 1.2 1.6 1.2 1.3 1.6 1.7 3.6
Philippines 0.6 0.6 0.6 0.8 1.1 1.6 1.8 1.7 2.1 2.6 2.5
Eritrea 0.1 0.1 0.1 0.3 0.3 0.4 0.8 1.7 2.0 2.0 2.4
Romania 0.2 0.2 0.2 0.2 0.2 0.6 1.1 1.1 1.3 1.4 2.0
Denmark 2.1 1.7 1.6 1.5 1.5 1.5 1.3 1.3 1.4 1.6 1.8
Germany 1.2 1.2 1.4 1.7 2.3 3.8 4.3 2.8 2.7 2.3 1.8
Latvia 0.2 0.1 0.1 0.2 0.3 0.5 0.6 1.1 2.3 2.1 1.7
India 0.3 0.3 0.3 0.4 0.6 1.0 1.1 0.8 0.8 1.2 1.5
Iceland 0.6 0.4 0.3 0.3 0.3 0.3 0.3 1.6 1.7 1.7 1.5
United Kingdom 0.8 0.6 0.9 0.8 1.0 1.1 1.2 1.3 1.5 1.5 1.4
Spain 0.2 0.1 0.2 0.2 0.3 0.3 0.4 0.5 0.8 1.0 1.4
Thailand 0.9 0.9 1.1 1.1 1.1 1.2 1.3 1.3 1.2 1.2 1.3
Other countries 17.6 15.4 15.4 15.9 15.3 18.7 20.3 20.6 20.3 21.6 23.5
Total 30.8 26.8 27.9 31.4 37.4 53.5 58.8 56.7 65.1 70.8 70.0
Note: For details on definitions and sources, please refer to the metadata at the end of the tables.1 2 http://dx.doi.org/10.1787/888933
Table B.1. Inflows of foreign population by nationalityThousands
POLAND
2002 2003 2004 2005 2006 2007 2008 2009 2010 2011 2012OW
20
Ukraine 6.9 8.4 10.2 9.8 9.6 9.4 10.3 10.1 10.3 10.1 11.8
Viet Nam 1.2 1.3 2.2 1.9 1.7 1.8 2.8 3.0 2.4 2.1 4.0
China 0.5 0.4 0.5 0.6 0.4 0.7 1.2 2.0 2.3 2.8 2.9
Belarus 2.7 2.5 2.4 2.4 2.3 2.6 3.1 3.2 2.9 2.5 2.6
Germany 1.6 1.5 2.2 6.1 4.6 6.7 2.9 1.7 1.8 1.9 2.3
Russian Federation 2.0 2.1 2.1 1.9 1.8 1.6 1.8 1.6 1.6 1.6 1.9
Armenia 0.7 1.0 2.0 1.5 1.3 1.4 1.6 1.6 1.4 1.2 1.6
Turkey 0.6 0.6 0.5 0.6 0.7 0.7 0.9 1.0 1.1 1.2 1.3
India 0.5 0.6 0.7 0.7 0.7 0.7 1.0 1.1 1.2 1.1 1.2
United States 1.2 1.0 1.0 0.8 0.9 0.9 1.0 1.0 1.0 1.0 1.1
Korea 0.3 0.3 0.3 0.4 0.5 0.9 1.1 1.0 1.1 1.0 1.0
Italy 0.5 0.5 0.7 0.7 0.3 0.7 0.5 0.6 0.5 0.6 0.7
Spain 0.2 0.2 0.2 0.3 0.1 0.3 0.2 0.3 0.4 0.4 0.6
France 1.5 1.0 1.5 1.1 0.5 0.8 0.6 0.6 0.5 0.6 0.6
United Kingdom 1.2 0.9 1.0 0.9 0.4 0.8 1.5 0.5 0.5 0.5 0.5
Other countries 8.8 8.0 9.4 8.9 8.2 10.6 11.2 12.1 12.1 12.6 13.0
Total 30.2 30.3 36.9 38.5 34.2 40.6 41.8 41.3 41.1 41.3 47.1
Note: For details on definitions and sources, please refer to the metadata at the end of the tables.1 2 http://dx.doi.org/10.1787/888933
INTERNATIONAL MIGRATION OUTLOOK 2014 © OECD 2014330

STATISTICAL ANNEX
f which:omen12 (%)
58
53
46
45
59
51
49
55
47
55
45
48
48
50
46
52
158453
f which:omen12 (%)
27
45
52
23
44
44
45
36
25
34
47
46
48
..
38
37
158453
Table B.1. Inflows of foreign population by nationalityThousandsPORTUGAL
2002 2003 2004 2005 2006 2007 2008 2009 2010 2011 2012OW
20
Brazil 14.7 6.7 14.4 9.5 6.1 5.0 32.8 23.1 16.2 12.9 11.7
Cape Verde 5.9 3.4 3.1 3.5 3.3 4.1 5.3 4.6 4.2 4.6 3.4
Romania 3.2 0.9 0.8 0.8 0.6 0.2 5.3 8.1 6.0 4.6 3.0
Guinea-Bissau 2.6 1.3 1.0 1.1 1.3 1.6 2.5 1.5 1.6 1.7 1.6
Ukraine 17.5 4.1 1.9 1.6 1.5 2.0 3.6 2.4 2.1 1.8 1.5
China 1.0 0.6 0.8 0.3 0.5 1.0 2.0 1.9 1.7 1.5 1.4
Spain 0.9 0.7 0.6 0.6 0.3 1.4 1.3 1.5 1.7 1.5 1.4
Angola 4.7 2.1 1.1 1.2 0.4 0.4 2.0 1.5 1.3 1.4 1.3
United Kingdom 1.0 0.9 1.2 1.0 0.8 3.9 2.7 2.2 1.8 1.7 1.2
Sao Tome and Principe 1.6 0.8 0.9 0.7 0.6 0.8 1.1 1.1 1.3 1.3 1.0
India 0.8 0.3 0.2 0.3 0.5 0.5 0.9 1.0 0.9 1.1 0.9
Italy 0.4 0.4 0.4 0.3 0.1 1.0 1.0 1.0 1.0 0.8 0.7
Bulgaria 1.3 0.6 0.3 0.3 0.3 0.1 0.9 1.5 1.4 1.0 0.7
Germany 0.7 0.6 0.6 0.5 0.3 1.6 1.1 1.1 1.0 0.8 0.6
France 0.6 0.5 0.5 0.4 0.2 0.8 0.7 0.7 0.7 0.7 0.5
Other countries 15.0 7.8 6.4 6.1 5.5 8.2 9.8 8.3 8.1 8.0 7.5
Total 72.0 31.8 34.1 28.1 22.5 32.6 72.8 61.4 50.7 45.4 38.5
Note: For details on definitions and sources, please refer to the metadata at the end of the tables.1 2 http://dx.doi.org/10.1787/888933
Table B.1. Inflows of foreign population by nationalityThousands
RUSSIAN FEDERATION
2002 2003 2004 2005 2006 2007 2008 2009 2010 2011 2012OW
20
Uzbekistan 25.0 21.5 14.9 30.4 37.1 52.8 43.5 42.5 24.1 64.5 87.9
Ukraine 36.8 23.4 17.7 30.8 32.7 51.5 49.1 45.9 27.5 43.6 49.4
Kazakhstan 55.7 29.6 40.2 51.9 38.6 40.3 40.0 38.8 27.9 36.5 45.5
Tajikistan 6.0 5.3 3.3 4.7 6.5 17.3 20.7 27.0 18.2 35.1 41.7
Armenia 6.8 5.1 3.1 7.6 12.9 30.8 35.2 35.8 19.9 32.7 37.0
Kyrgyzstan 13.1 6.9 9.5 15.6 15.7 24.7 24.0 23.3 20.9 41.6 34.6
Moldova 7.6 6.4 4.8 6.6 8.6 14.1 15.5 16.4 11.8 19.6 23.6
Azerbaijan 5.6 4.3 2.6 4.6 8.9 21.0 23.3 22.9 14.5 22.3 22.3
Belarus 6.8 5.3 5.7 6.8 5.6 6.0 5.9 5.5 4.9 10.2 16.6
China 0.4 0.3 0.2 0.4 0.5 1.7 1.2 0.8 1.4 7.1 8.5
Georgia 7.1 5.5 4.9 5.5 6.8 10.6 8.8 7.5 5.2 7.3 7.7
Turkmenistan 4.5 6.3 3.7 4.1 4.1 4.8 4.0 3.3 2.3 4.5 5.4
Germany 2.0 2.7 3.1 3.0 2.9 3.2 3.1 2.6 2.6 4.5 4.2
Democratic People’s Republic of Korea .. .. 0.0 0.0 0.0 0.1 0.1 0.1 0.1 1.9 4.2
Viet Nam .. .. 0.0 0.1 0.2 0.9 0.7 1.0 0.9 3.3 3.7
Other countries 7.2 6.4 5.4 5.1 5.2 7.2 6.6 6.5 9.5 21.8 25.4
Total 184.6 129.1 119.2 177.2 186.4 287.0 281.6 279.9 191.7 356.5 417.7
Note: For details on definitions and sources, please refer to the metadata at the end of the tables.1 2 http://dx.doi.org/10.1787/888933
INTERNATIONAL MIGRATION OUTLOOK 2014 © OECD 2014 331

STATISTICAL ANNEX
f which:omen12 (%)
24
47
32
10
23
27
54
64
39
27
32
44
31
67
22
33
158453
f which:omen12 (%)
34
17
18
29
50
40
38
52
44
47
31
50
58
63
29
33
158453
Table B.1. Inflows of foreign population by nationalityThousands
SLOVAK REPUBLIC
2002 2003 2004 2005 2006 2007 2008 2009 2010 2011 2012OW
20
Hungary .. 0.1 0.3 0.4 0.5 0.8 1.1 1.1 1.1 1.0 0.7
Czech Republic .. 0.6 1.6 1.1 1.3 1.2 1.4 1.6 1.2 0.9 0.5
Romania .. 0.0 0.1 0.1 0.4 3.0 2.3 0.8 0.9 0.6 0.3
Bulgaria .. 0.1 0.1 0.1 0.1 0.8 0.5 0.2 0.2 0.3 0.2
Italy .. 0.1 0.2 0.2 0.3 0.3 0.2 0.3 0.3 0.2 0.2
Germany .. 0.3 0.6 0.9 0.9 0.9 1.1 0.6 0.5 0.3 0.1
Poland .. 0.1 0.9 0.5 1.1 0.7 0.6 0.7 0.5 0.3 0.1
Ukraine .. 0.7 0.7 0.6 1.0 1.2 1.8 1.6 1.3 0.7 0.1
China .. 0.2 0.2 0.2 0.6 0.5 0.5 0.6 0.6 0.4 0.1
Austria .. 0.1 0.4 0.4 0.4 0.3 0.3 0.3 0.2 0.2 0.1
United Kingdom .. 0.2 0.3 0.2 0.3 0.3 0.3 0.3 0.2 0.2 0.1
Spain .. 0.1 0.1 0.1 0.1 0.1 0.1 0.1 0.1 0.1 0.1
Viet Nam .. 0.3 0.2 0.2 0.5 0.6 1.3 0.9 0.5 0.3 0.1
Norway .. 0.0 0.1 0.1 0.0 0.1 0.1 0.1 0.1 0.1 0.1
France .. 0.1 0.3 0.3 0.3 0.3 0.2 0.2 0.2 0.2 0.1
Other countries .. 1.6 2.1 2.3 3.5 3.9 4.8 4.9 4.6 2.7 0.4
Total 4.8 4.6 7.9 7.7 11.3 14.8 16.5 14.4 12.7 8.2 2.9
Note: For details on definitions and sources, please refer to the metadata at the end of the tables.1 2 http://dx.doi.org/10.1787/888933
Table B.1. Inflows of foreign population by nationalityThousandsSLOVENIA
2002 2003 2004 2005 2006 2007 2008 2009 2010 2011 2012OW
20
Bosnia and Herzegovina .. .. .. .. .. 13.8 17.9 5.3 3.7 4.5 4.4
Bulgaria .. .. .. .. .. 1.4 2.3 1.3 0.0 2.3 2.4
Croatia .. .. .. .. .. 2.2 2.3 2.0 1.8 1.9 2.2
Serbia .. .. .. .. .. 6.3 7.6 2.6 1.6 1.9 1.7
Former Yugoslav Republic of Macedonia .. .. .. .. .. 2.7 5.0 2.2 1.0 1.2 0.8
Italy .. .. .. .. .. 0.2 0.0 0.2 0.0 0.4 0.5
Poland .. .. .. .. .. 0.2 0.2 0.2 0.0 0.2 0.4
Slovak Republic .. .. .. .. .. 0.6 0.5 0.3 0.0 0.6 0.4
Russian Federation .. .. .. .. .. 0.1 0.2 0.1 0.1 0.3 0.3
Spain .. .. .. .. .. 0.0 0.1 0.1 0.0 0.2 0.3
Romania .. .. .. .. .. 0.3 0.4 0.2 0.0 0.3 0.3
Germany .. .. .. .. .. 0.2 0.2 0.2 0.0 0.2 0.3
Hungary .. .. .. .. .. 0.1 0.2 0.0 0.0 0.2 0.2
Czech Republic .. .. .. .. .. 0.1 0.1 0.2 0.0 0.2 0.2
Ukraine .. .. .. .. .. 0.5 0.5 0.0 0.3 0.4 0.2
Other countries .. .. .. .. .. 1.7 6.2 9.1 2.6 3.2 2.7
Total .. .. .. .. .. 30.5 43.8 24.1 11.2 18.0 17.3
Note: For details on definitions and sources, please refer to the metadata at the end of the tables.1 2 http://dx.doi.org/10.1787/888933
INTERNATIONAL MIGRATION OUTLOOK 2014 © OECD 2014332

STATISTICAL ANNEX
f which:omen12 (%)
41
53
47
52
43
54
20
55
52
61
47
51
60
47
57
49
158453
f which:omen12 (%)
41
39
49
47
50
44
55
79
56
53
53
52
49
40
38
48
158453
Table B.1. Inflows of foreign population by nationalityThousands
SPAIN
2002 2003 2004 2005 2006 2007 2008 2009 2010 2011 2012OW
20
Morocco 40.2 41.2 73.4 82.5 78.5 85.0 93.6 61.8 47.9 43.2 35.0
Romania 48.3 55.0 103.6 108.3 131.5 197.6 71.5 52.4 62.6 60.9 34.6
United Kingdom 25.3 31.8 48.4 44.7 42.5 38.2 25.0 19.2 17.3 16.6 17.3
China 5.7 7.5 20.3 18.4 16.9 20.4 27.2 18.6 17.4 16.7 14.2
Italy 10.4 10.0 15.0 16.5 18.6 21.2 18.0 13.6 12.9 13.1 13.2
Colombia 34.2 11.1 21.5 24.9 35.6 41.7 42.2 25.6 18.1 16.1 12.4
Pakistan 1.8 1.7 9.4 12.4 8.2 10.6 13.4 10.6 21.7 16.9 12.0
Dominican Republic 5.5 6.6 10.3 12.2 14.7 18.1 17.8 10.8 8.3 11.7 11.3
Germany 11.2 10.8 14.0 15.2 16.9 17.8 12.6 10.4 9.3 9.1 8.8
Russian Federation 4.6 4.6 7.4 7.8 8.0 7.3 7.2 6.6 7.4 8.3 8.1
France 5.5 5.9 9.9 11.1 12.7 13.0 10.1 8.9 8.6 8.6 8.1
Bulgaria 15.9 13.7 21.0 18.4 21.7 31.3 13.1 9.7 10.4 11.9 8.0
Brazil 4.7 7.4 16.5 24.6 32.6 36.1 27.3 14.4 11.9 9.8 7.8
Ecuador 89.0 72.8 17.2 15.2 21.4 30.2 37.8 18.2 11.0 8.8 7.6
Peru 8.0 13.5 17.7 19.9 21.7 27.4 31.1 16.3 10.0 9.3 7.0
Other countries 133.0 135.9 240.3 250.5 321.4 324.6 244.4 172.2 156.4 155.3 130.8
Total 443.1 429.5 645.8 682.7 803.0 920.5 692.2 469.3 431.3 416.3 336.1
Note: For details on definitions and sources, please refer to the metadata at the end of the tables.1 2 http://dx.doi.org/10.1787/888933
Table B.1. Inflows of foreign population by nationalityThousandsSWEDEN
2002 2003 2004 2005 2006 2007 2008 2009 2010 2011 2012OW
20
Syria 0.5 0.5 0.5 0.5 0.9 0.5 0.5 0.7 1.0 1.5 4.7
Afghanistan 1.0 1.0 1.0 0.7 1.7 0.8 1.0 1.6 1.9 3.4 4.7
Somalia 0.9 1.3 1.1 1.3 3.0 3.8 4.1 6.9 6.8 3.1 4.5
Poland 1.1 1.0 2.5 3.4 6.3 7.5 7.0 5.2 4.4 4.4 4.4
Iraq 7.4 5.4 2.8 2.9 10.9 15.2 12.1 8.5 4.5 4.5 3.6
Denmark 3.2 3.6 3.8 4.0 5.1 5.1 4.1 3.8 3.4 3.2 2.6
China 1.2 1.4 1.5 1.7 2.0 2.4 2.7 3.1 3.2 2.6 2.5
Thailand 1.2 2.0 2.1 2.1 2.3 2.5 3.1 3.0 2.8 2.5 2.3
Finland 3.3 3.2 2.8 2.9 2.6 2.6 2.4 2.4 2.3 2.3 2.3
Eritrea 0.2 0.2 0.3 0.6 0.8 0.8 1.2 1.4 1.6 2.1 2.2
Germany 1.7 1.8 1.8 2.0 2.9 3.6 3.4 2.8 2.2 2.2 2.2
Iran 1.4 1.0 1.5 1.1 2.0 1.4 1.8 2.4 2.8 2.2 2.1
Norway 3.5 3.2 2.6 2.4 2.5 2.4 2.3 1.9 2.1 2.0 2.0
India 0.6 0.8 0.8 1.1 1.0 1.1 1.5 1.8 2.2 1.7 2.0
Turkey 0.8 1.2 1.1 1.1 1.6 1.5 1.5 2.0 2.2 2.0 1.8
Other countries 19.6 19.6 20.6 22.8 33.3 31.4 33.4 34.9 35.5 36.1 38.6
Total 47.3 47.1 46.7 50.6 78.9 82.6 82.0 82.4 79.0 75.9 82.6
Note: For details on definitions and sources, please refer to the metadata at the end of the tables.1 2 http://dx.doi.org/10.1787/888933
INTERNATIONAL MIGRATION OUTLOOK 2014 © OECD 2014 333

STATISTICAL ANNEX
f which:omen12 (%)
42
41
36
43
42
42
51
45
38
41
48
61
69
65
68
46
158453
f which:omen12 (%)
..
..
..
..
..
..
..
..
..
..
..
..
..
..
..
..
158453
Table B.1. Inflows of foreign population by nationalityThousands
SWITZERLAND
2002 2003 2004 2005 2006 2007 2008 2009 2010 2011 2012OW
20
Germany 15.5 14.9 18.1 20.4 24.8 41.1 46.4 33.9 30.7 30.5 27.1
Portugal 9.3 12.3 13.6 12.2 12.5 15.5 17.8 13.7 12.8 15.4 18.6
Italy 6.1 5.6 5.7 5.4 5.5 8.4 9.9 8.5 10.1 10.8 13.6
France 6.8 6.6 6.7 6.9 7.6 11.5 13.7 10.9 11.5 11.5 11.4
Spain 1.9 1.7 1.7 1.5 1.6 2.1 2.4 2.5 3.3 4.6 6.5
United Kingdom 3.1 2.8 2.9 3.0 3.4 5.1 5.6 4.8 5.5 5.4 4.4
United States 2.9 2.5 2.7 2.9 3.2 .. .. .. 4.0 4.2 3.5
Poland 0.7 0.6 0.7 0.8 1.3 2.1 2.4 2.1 2.0 3.4 3.3
Austria 2.6 2.0 2.3 1.9 2.0 2.8 3.2 2.8 2.6 2.9 3.1
India .. .. .. .. .. .. .. .. 2.4 2.4 2.6
Hungary 0.6 0.4 0.4 0.3 0.5 0.7 1.1 1.1 1.2 2.1 2.5
China .. .. .. .. .. .. .. .. 1.9 2.1 2.4
Romania 0.6 0.6 0.6 0.6 0.6 0.7 0.8 1.0 1.4 1.7 2.3
Russian Federation .. .. .. .. .. .. .. .. 1.9 2.0 2.1
Brazil .. .. .. .. .. .. .. .. 2.5 2.2 1.9
Other countries 51.8 43.9 41.0 38.4 39.8 49.8 54.0 51.2 40.4 41.3 38.5
Total 101.9 94.0 96.3 94.4 102.7 139.7 157.3 132.4 134.2 142.5 143.8
Note: For details on definitions and sources, please refer to the metadata at the end of the tables.1 2 http://dx.doi.org/10.1787/888933
Table B.1. Inflows of foreign population by nationalityThousands
TURKEY
2002 2003 2004 2005 2006 2007 2008 2009 2010 2011 2012OW
20
Azerbaijan .. .. .. .. .. .. .. .. 2.5 .. ..
Afghanistan .. .. .. .. .. .. .. .. 2.2 .. ..
Russian Federation .. .. .. .. .. .. .. .. 1.8 .. ..
Germany .. .. .. .. .. .. .. .. 1.6 .. ..
United States .. .. .. .. .. .. .. .. 1.5 .. ..
Iran .. .. .. .. .. .. .. .. 1.5 .. ..
Kazakhstan .. .. .. .. .. .. .. .. 1.4 .. ..
Turkmenistan .. .. .. .. .. .. .. .. 1.2 .. ..
Iraq .. .. .. .. .. .. .. .. 1.2 .. ..
United Kingdom .. .. .. .. .. .. .. .. 1.1 .. ..
Bulgaria .. .. .. .. .. .. .. .. 1.1 .. ..
Kyrgyzstan .. .. .. .. .. .. .. .. 1.0 .. ..
Ukraine .. .. .. .. .. .. .. .. 0.9 .. ..
Syria .. .. .. .. .. .. .. .. 0.9 .. ..
China .. .. .. .. .. .. .. .. 0.8 .. ..
Other countries .. .. .. .. .. .. .. .. 9.1 .. ..
Total .. .. .. .. .. .. .. .. 29.9 .. ..
Note: For details on definitions and sources, please refer to the metadata at the end of the tables.1 2 http://dx.doi.org/10.1787/888933
INTERNATIONAL MIGRATION OUTLOOK 2014 © OECD 2014334

STATISTICAL ANNEX
f which:omen12 (%)
..
..
..
..
..
..
..
..
..
..
..
..
..
..
..
51
158453
f which:omen12 (%)
56
56
51
61
55
52
61
56
61
56
56
46
47
54
53
55
158453
Table B.1. Inflows of foreign population by nationalityThousands
UNITED KINGDOM
2002 2003 2004 2005 2006 2007 2008 2009 2010 2011 2012OW
20
China 29 31 32 22 23 21 18 22 28 45 41
India 21 30 51 47 57 55 48 64 68 61 36
Poland .. .. 16 49 60 88 55 32 34 33 30
Pakistan 7 10 21 16 31 27 17 17 30 43 19
Spain .. .. .. .. .. .. .. 11 5 8 17
Australia 20 21 27 20 26 18 14 12 18 13 16
France 9 21 10 .. .. .. .. 14 11 17 14
Italy .. .. .. .. .. .. 14 8 9 10 10
Lithuania .. .. .. .. .. .. .. .. 13 17 9
Nigeria 2 5 9 9 9 9 11 12 10 8 9
Germany .. .. .. .. 13 15 18 11 7 13 8
Portugal .. .. 5 .. .. .. .. .. 4 5 7
Canada 5 6 .. .. 6 .. 7 .. 6 9 7
Malaysia 4 5 6 .. .. 8 11 7 9 4 6
Romania .. .. .. .. .. .. .. 10 7 8 6
Other countries 192 198 257 242 227 214 243 210 200 159 148
Total 289 327 434 405 452 455 456 430 459 453 383
Note: For details on definitions and sources, please refer to the metadata at the end of the tables.1 2 http://dx.doi.org/10.1787/888933
Table B.1. Inflows of foreign population by nationalityThousands
UNITED STATES (PERMANENT)
2002 2003 2004 2005 2006 2007 2008 2009 2010 2011 2012OW
20
Mexico 218.8 115.6 175.4 161.4 173.8 148.6 190.0 164.9 139.1 143.4 146.4
China 61.1 40.6 55.5 70.0 87.3 76.7 80.3 64.2 70.9 87.0 81.8
India 70.8 50.2 70.2 84.7 61.4 65.4 63.4 57.3 69.2 69.0 66.4
Philippines 51.0 45.3 57.8 60.7 74.6 72.6 54.0 60.0 58.2 57.0 57.3
Dominican Republic 22.5 26.2 30.5 27.5 38.1 28.0 31.9 49.4 53.9 46.1 41.6
Cuba 28.2 9.3 20.5 36.3 45.6 29.1 49.5 39.0 33.6 36.5 32.8
Viet Nam 33.6 22.1 31.5 32.8 30.7 28.7 31.5 29.2 30.6 34.2 28.3
Haiti 20.2 12.3 14.2 14.5 22.2 30.4 26.0 24.3 22.6 22.1 22.8
Colombia 18.8 14.7 18.8 25.6 43.2 33.2 30.2 27.8 22.4 22.6 20.9
Korea 20.7 12.4 19.8 26.6 24.4 22.4 26.7 25.9 22.2 22.8 20.8
Jamaica 14.8 13.3 14.4 18.3 25.0 19.4 18.5 21.8 19.8 19.7 20.7
Iraq 5.2 2.5 3.5 4.1 4.3 3.8 4.8 12.1 19.9 21.1 20.4
Myanmar 1.4 1.2 1.4 2.1 4.6 3.1 3.4 13.6 12.9 16.5 17.4
El Salvador 31.1 28.2 29.8 21.4 31.8 21.1 19.7 19.9 18.8 18.7 16.3
Pakistan 13.7 9.4 12.1 14.9 17.4 13.5 19.7 21.6 18.3 15.5 14.7
Other countries 447.5 300.4 402.5 521.5 582.0 456.5 457.7 499.8 430.3 429.7 422.9
Total 1 059.4 703.5 957.9 1 122.4 1 266.3 1 052.4 1 107.1 1 130.8 1 042.6 1 062.0 1 031.6
Note: For details on definitions and sources, please refer to the metadata at the end of the tables.1 2 http://dx.doi.org/10.1787/888933
INTERNATIONAL MIGRATION OUTLOOK 2014 © OECD 2014 335

STATISTICAL ANNEX
2012
29.8
74.4
59.9
20.0
29.1
0.4
4.2
578.8
9.9
2.2
40.6
38.2
219.4
290.0
8.6
80.8
24.4
21.3
..
2.0
1.7
320.7
26.6
65.9
165.0
158400
Table A.2. Outflows of foreign population from selected OECD countriesThousands
2002 2003 2004 2005 2006 2007 2008 2009 2010 2011
Australia .. .. 28.7 27.6 29.0 29.7 30.9 27.6 29.3.7 31.2
Austria 44.5 48.9 50.0 49.8 55.0 56.6 60.2 67.2 68.4 72.8
Belgium 31.0 33.9 37.7 38.5 39.4 38.5 44.9 49.1 50.8 56.6
Czech Republic 31.1 33.2 33.8 21.8 31.4 18.4 3.8 9.4 14.9 5.7
Denmark 14.9 15.8 15.8 16.3 17.3 19.0 23.3 26.6 27.1 26.6
Estonia .. .. 0.6 0.6 0.6 0.4 0.5 0.7 0.6 0.6
Finland 2.8 2.3 4.2 2.6 2.7 3.1 4.5 4.0 3.1 3.3
Germany 505.6 499.1 547.0 483.6 483.8 475.8 563.1 578.8 529.6 538.8
Hungary 2.4 2.6 3.5 3.3 4.0 4.1 4.2 5.6 6.0 2.7
Iceland 1.1 0.9 1.5 0.9 1.5 4.0 5.9 5.8 3.4 2.8
Ireland .. .. .. .. 20.7 33.4 36.1 52.8 40.3 38.6
Italy 10.0 12.9 14.0 16.0 17.0 20.3 27.0 32.3 32.8 32.4
Japan 248.4 259.4 278.5 292.0 218.8 214.9 234.2 262.0 242.6 230.9
Korea 114.0 152.3 148.8 266.7 183.0 163.6 215.7 236.4 196.1 217.7
Luxembourg 8.3 6.9 7.5 7.2 7.7 8.6 8.0 7.3 7.7 7.5
Netherlands 39.6 43.9 46.1 47.2 52.5 47.9 49.8 57.5 64.0 70.2
New Zealand 15.6 18.9 22.2 22.8 20.5 21.4 23.0 23.6 26.3 26.4
Norway 12.3 14.3 13.9 12.6 12.5 13.3 15.2 18.4 22.5 22.9
Portugal 0.1 0.2 0.1 0.2 0.1 .. .. .. .. ..
Slovak Republic .. 3.6 5.0 1.1 1.5 2.0 3.3 3.3 2.9 1.9
Slovenia 4.6 4.0 6.0 6.5 11.0 11.8 7.3 15.1 12.0 2.1
Spain 6.9 10.0 41.9 48.7 120.3 199.0 232.0 288.3 336.7 317.7
Sweden 14.1 15.1 16.0 15.8 20.0 20.4 19.2 18.3 22.1 23.7
Switzerland 49.7 46.3 47.9 49.7 53.0 56.2 54.1 55.2 65.5 64.0
United Kingdom 141.3 144.1 126.2 154.1 173.4 158.0 243.0 211.0 185.0 190.0
Note: For details on definitions and sources, refer to the metadata at the end of the tables.1 2 http://dx.doi.org/10.1787/888933
INTERNATIONAL MIGRATION OUTLOOK 2014 © OECD 2014336

STATISTICAL ANNEX
Border
e
nada.
eers
Interior.
tionistrytical
Metadata related to Tables A.1, A.2 and B.1. Inflows and outflows of foreign population
Types of migrant recorded in the data Other comments Source
Australia Permanent migrants:Includes offshore migration (Settler Arrivals)and onshore migration (people granted permanentresidence while in Australia on a temporary visa).Permanent migrants include holdersof a permanent visa, a temporary (provisional) visawhere there is a clear intention to settle, citizensof New Zealand indicating an intention to settleand persons otherwise eligible to settle.Temporary migrants:Entries of temporary migrants, excluding students.Includes short and long-term temporary entrants,e.g. top managers, executives, specialists andtechnical workers, diplomats and other personnelof foreign governments, temporary business entry,working holiday makers and entertainers.Outflows:Net Overseas Migration (NOM) – departures:The net loss of people counted in the populationby people leaving Australia for 12 months or morein a 16-month period.
Data refer to the fiscal year (July to June of the yearindicated).
Department of Immigration andProtection.
Austria Foreigners holding a residence permitand who have actually stayed for at least 3 months.
Until 2001, data are from local population registers.Starting in 2002, they are from the centralpopulation register. The data for 2002-07were revised to match with the resultsof the register-based census of 2006.
Population Registers,Statistics Austria.
Belgium Foreigners holding a residence permit and intentingto stay in the country for at least 3 months.Outflows include administrative corrections.
Asylum seekers were formerly groupedunder a single category. From 1 January 2008 on,they are classified like other migrants. This mayexplain some of the increase for certainnationalities between 2007 and 2008.
Population Register, Directoratfor Statistics and EconomicInformation (DGSIE).
Canada Permanent migrants:Inflows of persons who have acquired permanentresident status (including onshore).
Temporary migrants:Inflows (first entries) of people who are lawfullyin Canada on a temporary basis under the authorityof a temporary resident permit. Temporaryresidents include foreign workers (includingseasonal workers), foreign students, refugeeclaimants, people allowed to remain temporarilyin Canada on humanitarian grounds and otherindividuals entering Canada on a temporary basiswho are not under a work or student permitand who are not seeking protection.
Table B.1 presents only the inflow of personswho have acquired permanent resident status.Country of origin refers to country of lastpermanent residence. Due to privacyconsiderations, the figures have been subjectedto random rounding. Under this method, all figuresin the table are randomly rounded either upor down to multiples of 5.
Citizenship and Immigration Ca
Chile Temporary residence permits granted. Register of permits of residencgranted, Department of Foreignand Migration, Ministry of the
Czech Republic Foreigners holding a permanent or a long-termresidence permit or who were granted asylumin the given year.
In 2000, data include only holders of a permanentresidence permit. From 2001 on, data also includerefugees and long-term residence permit holders.
Register of Foreigners, PopulaInformation System of the Minof the Interior and Czech StatisOffice.
Denmark Foreigners who live legally in Denmark,are registred in the Central population register,and have been living in the country for at leastone year. From 2006 on, Statistics Denmark startedusing a new calculation on the underlyingdemographic data. The data from 2006 on aretherefore not comparable with previous years.Outflows include administrative corrections.
Excludes asylum seekers and all thosewith temporary residence permits.
Central Population Register,Statistics Denmark.
INTERNATIONAL MIGRATION OUTLOOK 2014 © OECD 2014 337

STATISTICAL ANNEX
),
onality,
reau
.
nt.)
Estonia Foreigners expecting to stay in the countryfor a period of at least 12 months.
Population Register and Policeand Border Guard Board (PBGStatistics Estonia.
Finland Foreign nationals with a valid residence permitfor longer than one year. Nordic citizens who aremoving for less than 6 months are not included.
Includes foreign persons of Finnish origin.Excludes asylum seekers and personswith temporary residence permits.
Central Population Register,Statistics Finland.
France The “permanent” entries consist of the firststatistical registration as a permanent migrantof people coming from abroad, plus the registrationof the permanent migrants who changedtheir status from a temporary one.
Excludes citizens from the European EconomicArea.
Ministry of the Interior.
Germany Foreigners holding a residence permitand intending to stay at least one weekin the country.
Includes asylum seekers living in privatehouseholds. Excludes inflows of ethnic Germans.In 2008, local authorities started to purge registersof inactive records. As a result, higher emigrationfigures were reported from this year.
Central Population Register,Federal Statistical Office.
Greece Initial issuance of residence permit. Does not refer to physical inflows but to flowsinto legal status.
Ministry of Interior Affairs.
Hungary Immigrant: Foreign citizens who entered Hungaryin the given year and obtained a residence permit.
Emigrant: Foreign citizens having a residenceor a settlement document and who left Hungaryin the given year without the intention to return,or whose permission’s validity has expiredand did not apply for a new one or whosepermission was invalidated by authority dueto withdrawal. Data from 2012 are estimated.
Office of Immigration and NatiCentral Statistical Office.
Iceland Foreigners expecting to stay in the countryfor a period of at least 12 months.
Register of Migration Data,Statistics Iceland.
Ireland Figures are derived from the quarterlyNational Household Survey (QNHS) series.All figures are based on year ending April.
Inflows: The estimates relate to those personsresident in the country at the time of the survey andwho were living abroad one year before (Table A.1).
Outflows: Persons resident in the country at a pointin the previous twelve month period who are nowliving abroad (Table A.2).Data for years 2007-10 have been revised in linewith revisions to the Population and Migrationestimates published September 2012.
Central Statistics Office.
Israel Data refer to permanent immigrants by last countryof residence.
The statistical data for Israel are suppliedby and under the responsibility of the relevantIsraeli authorities. The use of such databy the OECD is without prejudice to the statusof the Golan Heights, East Jerusalem and Israelisettlements in the West Bank under the termsof international law.
Population register, Central Buof Statistics.
Italy Foreigners holding a residence, work or studentpermit.
Excludes seasonal workers. Population Register, ISTAT.
Japan Foreigners who got permission for enteringthe country, excluding temporary visitorsand re-entries.
Ministry of Justice,Immigration Bureau.
Korea Data refer to long-term inflows/outflows(more than 90 days).
Ministry of Justice.
Luxembourg Foreigners holding a residence permitand intending to stay in the country for at least3 months.
Central Population Register,Central Office of Statisticsand Economic Studies (Statec)
Metadata related to Tables A.1, A.2 and B.1. Inflows and outflows of foreign population (co
Types of migrant recorded in the data Other comments Source
INTERNATIONAL MIGRATION OUTLOOK 2014 © OECD 2014338
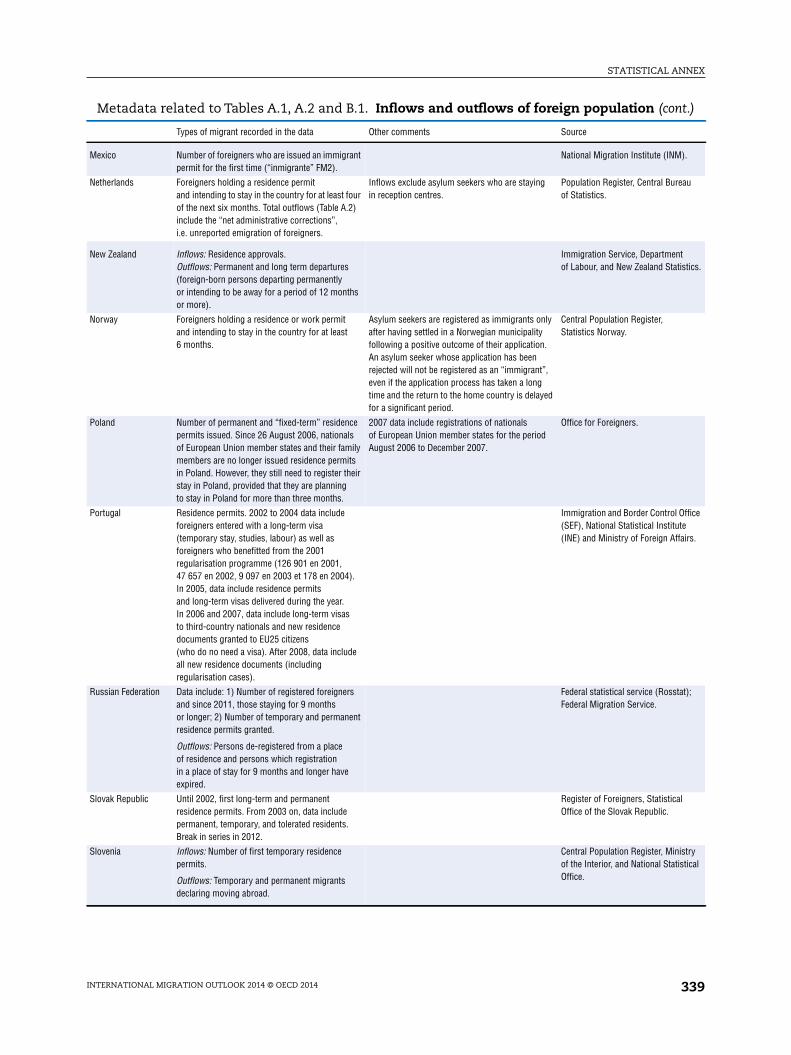
STATISTICAL ANNEX
M).
reau
ntatistics.
l Officetuteffairs.
stat);
cal
inistrytistical
nt.)
Mexico Number of foreigners who are issued an immigrantpermit for the first time (“inmigrante” FM2).
National Migration Institute (IN
Netherlands Foreigners holding a residence permitand intending to stay in the country for at least fourof the next six months. Total outflows (Table A.2)include the “net administrative corrections”,i.e. unreported emigration of foreigners.
Inflows exclude asylum seekers who are stayingin reception centres.
Population Register, Central Buof Statistics.
New Zealand Inflows: Residence approvals.Outflows: Permanent and long term departures(foreign-born persons departing permanentlyor intending to be away for a period of 12 monthsor more).
Immigration Service, Departmeof Labour, and New Zealand St
Norway Foreigners holding a residence or work permitand intending to stay in the country for at least6 months.
Asylum seekers are registered as immigrants onlyafter having settled in a Norwegian municipalityfollowing a positive outcome of their application.An asylum seeker whose application has beenrejected will not be registered as an “immigrant”,even if the application process has taken a longtime and the return to the home country is delayedfor a significant period.
Central Population Register,Statistics Norway.
Poland Number of permanent and “fixed-term” residencepermits issued. Since 26 August 2006, nationalsof European Union member states and their familymembers are no longer issued residence permitsin Poland. However, they still need to register theirstay in Poland, provided that they are planningto stay in Poland for more than three months.
2007 data include registrations of nationalsof European Union member states for the periodAugust 2006 to December 2007.
Office for Foreigners.
Portugal Residence permits. 2002 to 2004 data includeforeigners entered with a long-term visa(temporary stay, studies, labour) as well asforeigners who benefitted from the 2001regularisation programme (126 901 en 2001,47 657 en 2002, 9 097 en 2003 et 178 en 2004).In 2005, data include residence permitsand long-term visas delivered during the year.In 2006 and 2007, data include long-term visasto third-country nationals and new residencedocuments granted to EU25 citizens(who do no need a visa). After 2008, data includeall new residence documents (includingregularisation cases).
Immigration and Border Contro(SEF), National Statistical Insti(INE) and Ministry of Foreign A
Russian Federation Data include: 1) Number of registered foreignersand since 2011, those staying for 9 monthsor longer; 2) Number of temporary and permanentresidence permits granted.
Outflows: Persons de-registered from a placeof residence and persons which registrationin a place of stay for 9 months and longer haveexpired.
Federal statistical service (RosFederal Migration Service.
Slovak Republic Until 2002, first long-term and permanentresidence permits. From 2003 on, data includepermanent, temporary, and tolerated residents.Break in series in 2012.
Register of Foreigners, StatistiOffice of the Slovak Republic.
Slovenia Inflows: Number of first temporary residencepermits.
Outflows: Temporary and permanent migrantsdeclaring moving abroad.
Central Population Register, Mof the Interior, and National StaOffice.
Metadata related to Tables A.1, A.2 and B.1. Inflows and outflows of foreign population (co
Types of migrant recorded in the data Other comments Source
INTERNATIONAL MIGRATION OUTLOOK 2014 © OECD 2014 339

STATISTICAL ANNEX
s),E).
,
,
ecurity,tate.
nt.)
Spain Data include information regarding registrationsand cancellations due to changes of residenceregistered in the Municipal Registersfor all foreigners, by nationality, independentlyof their legal status.
From 2004 on, the Residential Variation Statistics(RVS) also include registrations by omissionand cancellations for undue registration of foreignnationals. Cancellations by expiration are includedfrom 2006 on.
RVS derived from MunicipalPopulation Registers(Padron municipal de habitanteNational Statistical Institute (IN
Sweden Foreigners holding a residence permitand intending to stay in the country for at leastone year.
Excludes asylum seekers and temporary workers. Population Register,Statistics Sweden.
Switzerland Foreigners holding a permanent or an annualresidence permit.Holders of an L-Permit(short duration) are also included if their stayin the country is longer than 12 months.
Register of Foreigners,Federal Office of Migration.
Turkey Residence permits issued for the first timeto foreigners intending to stay 12 months or morein the country.
General Directorate of SecurityMinistry of the Interior.
United Kingdom Inflows: Non-British citizens admittedto the United Kingdom. Data in Table A.1 areadjusted to include short term migrants (includingasylum seekers) who actually stayed longer thanone year. Data by nationality in Table B.1 on inflowsare not adjusted. Statistics whose coefficientof variation exceeds 30% are not shown separatelybut grouped under “Other countries”.
Outflows: Non-British citizens leaving the territoryof the United Kingdom.
International Passenger SurveyOffice for National Statistics.
United States Permanent migrants:Issues of permanent residence permits.
Temporary migrants:Data refer to non-immigrant visas issued,excluding visitors and transit passengers(B and C visas) and crewmembers (D visas).Includes family members.
Includes persons already presentin the United States who changed status.Data cover the fiscal year (October to Septemberof the year indicated).
US Department of Homeland Sand Bureau of Consular AffairsUnited States Department of S
Data for Serbia include persons from Serbia, Montenegro and Serbia and Montenegro.
Metadata related to Tables A.1, A.2 and B.1. Inflows and outflows of foreign population (co
Types of migrant recorded in the data Other comments Source
INTERNATIONAL MIGRATION OUTLOOK 2014 © OECD 2014340

STATISTICAL ANNEX
Inflows of asylum seekers
The statistics on asylum seekers published in this annex are based on data provided bythe United Nations High Commission for Refugees. Since 1950, the UNHCR, which has amission of conducting and co-ordinating international initiatives on behalf of refugees,has regularly produced complete statistics on refugees and asylum seekers inOECD countries and other countries of the world (www.unhcr.org/pages/49c3646c4d6.html).
These statistics are most often derived from administrative sources, but there aredifferences depending on the nature of the data provided. In some countries, asylum seekersare enumerated when the application is accepted. Consequently, they are shown in thestatistics at that time rather than at the date when they arrived in the country. Acceptanceof the application means that the administrative authorities will review the applicants’claims and grant them certain rights during this review procedure. In other countries, thedata do not include the applicants’ family members, who are admitted under differentprovisions (France), while other countries count the entire family (Switzerland).
The figures presented in the summary table (Table A.3) generally concern initialapplications (primary processing stage) and sometimes differ significantly from the totalspresented in Tables B.3, which give data by country of origin. This is because the datareceived by the UNHCR by country of origin combine both initial applications and appeals,and it is sometimes difficult to separate these two categories retrospectively. The referencefor total asylum applications remains the figures shown in summary Table A.3.
INTERNATIONAL MIGRATION OUTLOOK 2014 © OECD 2014 341

STATISTICAL ANNEX
2013
11 741
17 503
12 500
10 356
249
503
7 557
97
3 023
60 234
09 580
8 224
18 565
172
946
..
25 720
3 260
1 574
989
1 296
14 399
291
11 467
13 758
507
1 962
281
243
4 513
54 259
19 440
44 807
29 395
68 243
55 692
158410
Table A.3. Inflows of asylum seekers into OECD countries and the Russian Federation
2002 2003 2004 2005 2006 2007 2008 2009 2010 2011 2012
Australia 5 863 4 295 3 201 3 204 3 515 3 980 4 771 6 206 8 246 11 505 15 786
Austria 39 354 32 359 24 634 22 461 13 349 11 921 12 841 15 821 11 012 14 416 17 413
Belgium 18 805 16 940 15 357 15 957 11 587 11 115 12 252 17 186 21 755 26 003 18 525
Canada 39 498 31 937 25 750 20 786 22 873 28 342 34 800 33 970 22 543 24 985 20 223
Chile 43 87 203 380 573 756 872 .. 260 305 168
Czech Republic 8 484 11 396 5 459 4 160 3 016 1 878 1 711 1 355 979 756 753
Denmark 6 068 4 593 3 235 2 260 1 918 1 852 2 360 3 819 4 965 3 811 6 186
Estonia 9 14 14 11 7 14 14 36 30 67 77
Finland 3 443 3 221 3 861 3 574 2 331 1 434 4 016 5 910 4 018 3 086 2 922
France 58 971 59 768 58 545 49 733 30 748 29 387 35 404 42 118 48 074 52 147 55 068
Germany 71 127 50 563 35 607 28 914 21 029 19 164 22 085 27 649 41 332 45 741 64 539 1
Greece 5 664 8 178 4 469 9 050 12 267 25 113 19 884 15 928 10 273 9 311 9 577
Hungary 6 412 2 401 1 600 1 609 2 117 3 425 3 118 4 672 2 104 1 693 2 157
Iceland 117 80 76 88 39 42 77 35 51 76 113
Ireland 11 634 7 900 4 769 4 324 4 314 3 988 3 866 2 689 1 939 1 419 1 104
Israel 355 .. 922 909 1 348 5 382 7 738 809 1 448 5 745 1 999
Italy 16 015 13 455 9 722 9 548 10 348 14 053 30 324 17 603 10 052 34 117 17 352
Japan 250 336 426 384 954 816 1 599 1 388 1 203 1 867 2 545
Korea 37 86 145 412 278 717 364 324 425 1 011 1 143
Luxembourg 1 043 1 549 1 577 802 523 426 463 477 744 2 076 2 003
Mexico 257 275 404 687 480 374 317 680 1 039 753 811
Netherlands 18 667 13 402 9 782 12 347 14 465 7 102 13 399 14 905 13 333 11 590 9 664
New Zealand 997 841 580 348 276 245 254 336 340 305 324
Norway 17 480 15 959 7 945 5 402 5 320 6 528 14 431 17 226 10 064 9 053 9 785
Poland 5 170 6 909 8 079 6 860 4 430 7 205 7 203 10 587 6 534 5 086 9 167
Portugal 245 88 113 114 128 224 161 139 160 275 299
Russian Federation 876 737 910 960 1 170 3 369 5 418 5 701 2 181 1 265 1 243
Slovak Republic 9 743 10 358 11 395 3 549 2 871 2 643 910 822 541 491 732
Slovenia 702 1 100 1 173 1 596 518 425 238 183 246 373 305
Spain 6 309 5 918 5 535 5 254 5 297 7 662 4 517 3 007 2 744 3 414 2 579
Sweden 33 016 31 348 23 161 17 530 24 322 36 370 24 353 24 194 31 823 29 648 43 876
Switzerland 26 125 20 806 14 248 10 061 10 537 10 387 16 606 16 005 13 521 19 439 25 948
Turkey 3 795 3 952 3 908 3 921 4 553 7 646 12 981 7 834 9 226 16 021 26 470
United Kingdom 103 080 60 050 40 625 30 840 28 320 28 300 31 315 30 675 22 644 25 898 27 978
United States 58 439 43 338 44 972 39 240 41 101 40 449 39 362 38 080 42 971 60 587 66 101
OECD 577 217 463 502 371 492 316 315 285 752 319 365 364 606 362 668 346 639 423 070 463 692 5
Notes: For details on definitions and sources, refer to the metadata at the end of the Tables B.3.Information on data for Israel: http://dx.doi.org/10.1787/888932315602.
1 2 http://dx.doi.org/10.1787/888933
INTERNATIONAL MIGRATION OUTLOOK 2014 © OECD 2014342

STATISTICAL ANNEX
2013
1 568
1 163
1 104
967
849
806
413
382
370
362
361
349
318
298
209
2 222
11 741
158468
2013
2 841
2 589
1 991
1 146
1 037
949
691
595
516
468
433
339
302
300
278
3 028
17 503
158468
Table B.3. Inflows of asylum seekers by nationalityAUSTRALIA
2003 2004 2005 2006 2007 2008 2009 2010 2011 2012
China 800 822 966 1 033 1 207 1 232 1 192 1 187 1 189 1 138
India 604 242 173 316 349 373 213 409 769 943
Pakistan 63 61 103 90 145 220 260 428 817 1 512
Iran 75 71 101 77 84 161 312 458 2 152 1 839
Egypt 61 72 65 48 41 96 134 123 415 385
Sri Lanka 166 125 317 324 445 422 555 589 370 2 345
Fiji 165 84 52 34 70 81 262 375 277 236
Bangladesh 124 130 61 57 66 131 69 97 127 159
Afghanistan 54 116 32 21 20 52 940 1 265 1 720 3 079
Iraq 142 66 80 188 216 199 298 373 490 760
Stateless 14 9 13 10 13 11 66 263 525 544
Lebanon 90 57 56 65 75 91 115 200 158 327
Libya 4 1 1 0 0 1 7 12 200 174
Nepal 57 40 73 36 48 33 45 161 271 188
Malaysia 184 210 170 109 145 238 231 249 182 171
Other countries 1 692 1 095 941 1 107 1 056 1 430 1 507 2 057 1 843 1 986
Total 4 295 3 201 3 204 3 515 3 980 4 771 6 206 8 246 11 505 15 786
Note: For details on definitions and sources, please refer to the metadata at the end of the tables.1 2 http://dx.doi.org/10.1787/888933
Table B.3. Inflows of asylum seekers by nationalityAUSTRIA
2003 2004 2005 2006 2007 2008 2009 2010 2011 2012
Russian Federation 6 709 6 172 4 355 2 441 2 676 3 435 3 559 2 322 2 314 3 091
Afghanistan 2 357 757 923 699 761 1 382 2 237 1 582 3 609 4 005
Syria 153 131 77 88 166 140 279 194 422 915
Serbia (and Kosovo) 2 526 2 835 4 403 2 515 1 760 1 702 2 033 972 541 606
Pakistan 508 575 498 110 103 106 183 276 949 1 823
Algeria 221 234 185 138 109 173 248 304 447 575
Nigeria 1 849 1 828 880 421 394 535 837 573 414 400
Iran 979 343 306 274 248 250 340 387 457 761
Morocco 32 29 32 77 55 140 90 137 313 354
Iraq 1 446 232 221 380 472 490 399 336 484 491
Somalia 191 45 89 183 467 411 344 190 610 481
India 2 822 1 839 1 530 479 385 355 427 433 476 401
Turkey 2 854 1 114 1 064 668 659 417 554 369 414 273
Armenia 1 098 414 516 350 405 360 440 278 224 346
Bangladesh 887 330 548 140 70 52 95 116 87 212
Other countries 7 727 7 756 6 834 4 386 3 191 2 893 3 756 2 543 2 655 2 679
Total 32 359 24 634 22 461 13 349 11 921 12 841 15 821 11 012 14 416 17 413
Note: For details on definitions and sources, please refer to the metadata at the end of the tables.1 2 http://dx.doi.org/10.1787/888933
INTERNATIONAL MIGRATION OUTLOOK 2014 © OECD 2014 343

STATISTICAL ANNEX
2013
1 166
1 023
944
892
791
747
472
368
360
295
292
256
236
229
210
4 219
12 500
158468
2013
893
643
585
517
455
368
334
279
260
252
228
223
216
212
204
4 687
10 356
158468
Table B.3. Inflows of asylum seekers by nationalityBELGIUM
2003 2004 2005 2006 2007 2008 2009 2010 2011 2012
Democratic Republic of the Congo 1 778 1 471 1 272 843 716 579 670 813 1 080 1 392
Guinea 354 565 643 413 526 661 1 052 1 455 2 046 1 370
Syria 210 182 228 167 199 281 347 374 494 798
Afghanistan 329 287 253 365 696 879 1 659 1 124 2 774 2 349
Russian Federation 1 680 1 361 1 438 1 582 1 436 1 620 1 605 1 886 1 747 1 191
Serbia (and Kosovo) 1 280 1 294 1 203 778 1 219 1 050 2 053 4 545 3 067 995
Albania 340 255 167 125 193 172 256 208 1 152 607
China 286 208 304 155 135 189 329 176 292 344
Cameroon 625 506 530 335 279 367 302 289 451 457
Iraq 282 388 903 695 825 1 070 1 386 1 637 2 005 636
Senegal 15 17 15 6 21 50 113 231 314 454
Pakistan 341 308 222 160 150 150 233 325 924 711
Armenia 316 477 706 381 339 461 1 099 1 266 556 304
Georgia 302 211 256 232 156 222 327 336 347 387
Iran 1 153 512 497 631 411 614 732 261 366 348
Other countries 7 649 7 315 7 320 4 719 3 814 3 887 5 023 6 829 8 388 6 182
Total 16 940 15 357 15 957 11 587 11 115 12 252 17 186 21 755 26 003 18 525
Note: For details on definitions and sources, please refer to the metadata at the end of the tables.1 2 http://dx.doi.org/10.1787/888933
Table B.3. Inflows of asylum seekers by nationalityCANADA
2003 2004 2005 2006 2007 2008 2009 2010 2011 2012
China 1 848 1 982 1 821 1 645 1 456 1 711 1 592 1 650 1 922 1 783
Pakistan 4 257 1 006 746 652 361 403 437 526 882 853
Colombia 2 131 3 664 1 487 1 361 2 632 3 132 2 299 1 384 904 692
Syria 139 88 61 40 67 70 84 126 181 350
Nigeria 637 589 591 685 759 766 760 846 696 707
Afghanistan 151 152 264 268 308 488 445 399 373 348
Haiti 195 175 378 759 3 741 4 936 1 597 1 062 523 417
Democratic Republic of the Congo 435 394 330 417 356 425 298 288 347 337
Somalia 348 408 285 206 231 505 508 425 416 410
Egypt 231 182 82 53 47 47 43 108 155 171
Sri Lanka 1 270 1 141 934 907 808 1 008 824 1 200 635 428
India 1 125 1 083 844 764 554 561 502 532 632 684
Iran 329 352 357 246 207 267 310 327 318 277
Iraq 118 92 112 179 264 282 198 130 143 142
Eritrea 107 155 148 151 164 212 200 138 171 209
Other countries 18 616 14 287 12 346 14 535 15 910 19 987 23 873 13 402 16 687 12 415
Total 31 937 25 750 20 786 22 868 27 865 34 800 33 970 22 543 24 985 20 223
Note: For details on definitions and sources, please refer to the metadata at the end of the tables.1 2 http://dx.doi.org/10.1787/888933
INTERNATIONAL MIGRATION OUTLOOK 2014 © OECD 2014344

STATISTICAL ANNEX
2013
224
5
3
3
3
2
1
1
1
1
1
1
1
1
1
0
249
158468
2013
72
68
42
37
36
29
17
16
16
13
12
11
11
11
10
102
503
158468
Table B.3. Inflows of asylum seekers by nationalityCHILE
2003 2004 2005 2006 2007 2008 2009 2010 2011 2012
Colombia 56 182 347 540 713 816 .. 220 267 138
Syria 0 0 0 0 0 0 .. 0 0 5
Afghanistan 12 1 0 0 0 0 .. 0 0 0
West Bank and Gaza Strip 0 0 0 0 0 0 .. 0 0 0
Russian Federation 3 0 0 0 1 0 .. 0 2 0
Cuba 1 7 1 0 4 2 .. 14 9 5
Albania 0 0 0 0 0 0 .. 0 0 0
Bolivia 0 1 0 0 2 0 .. 3 4 4
Brazil 0 0 0 0 1 0 .. 0 0 0
Democratic Republic of the Congo 0 0 9 3 3 3 .. 2 2 5
Mexico 0 0 0 0 0 0 .. 0 0 3
Peru 3 2 6 6 3 8 .. 5 1 0
El Salvador 0 0 0 0 0 0 .. 0 3 0
Togo 0 0 0 0 0 0 .. 0 0 0
Ukraine 0 0 0 0 0 0 .. 1 0 0
Other countries 12 10 17 24 29 43 .. 15 17 8
Total 87 203 380 573 756 872 .. 260 305 168
Note: For details on definitions and sources, please refer to the metadata at the end of the tables.1 2 http://dx.doi.org/10.1787/888933
Table B.3. Inflows of asylum seekers by nationalityCZECH REPUBLIC
2003 2004 2005 2006 2007 2008 2009 2010 2011 2012
Ukraine 2 044 1 600 1 020 571 293 323 220 141 152 174
Syria 6 4 22 20 31 36 54 17 23 68
Russian Federation 4 853 1 498 278 171 99 85 66 62 47 40
Viet Nam 566 385 217 124 100 109 65 49 46 54
Cuba 7 0 0 20 94 19 12 18 20 15
Armenia 49 75 56 51 37 33 23 19 11 22
Kazakhstan 47 44 34 236 30 80 192 57 18 23
Serbia (and Kosovo) 20 3 4 0 49 31 32 9 5 13
Stateless 57 46 73 100 65 32 67 52 26 24
Belarus 281 226 244 174 130 81 60 67 71 54
Georgia 319 201 54 43 45 39 33 9 17 9
Iraq 102 38 47 80 49 30 12 7 9 5
Nigeria 37 50 83 96 69 39 43 0 18 12
Turkey 11 31 33 66 213 253 69 68 32 12
Moldova 192 94 69 29 31 17 22 13 8 10
Other countries 2 805 1 164 1 926 1 235 543 504 385 391 253 218
Total 11 396 5 459 4 160 3 016 1 878 1 711 1 355 979 756 753
Note: For details on definitions and sources, please refer to the metadata at the end of the tables.1 2 http://dx.doi.org/10.1787/888933
INTERNATIONAL MIGRATION OUTLOOK 2014 © OECD 2014 345

STATISTICAL ANNEX
2013
1 710
982
965
547
426
425
375
167
142
113
109
108
98
85
75
1 230
7 557
158468
2013
26
17
14
9
8
3
3
3
3
2
2
1
1
1
1
3
97
158468
Table B.3. Inflows of asylum seekers by nationalityDENMARK
2003 2004 2005 2006 2007 2008 2009 2010 2011 2012
Syria 56 56 46 55 71 105 380 821 428 907
Russian Federation 269 163 119 61 114 183 335 340 304 521
Somalia 370 154 80 57 35 58 177 110 107 914
Serbia (and Kosovo) 750 784 375 267 90 118 271 402 325 689
Afghanistan 664 285 173 122 138 418 1 049 1 476 903 576
Stateless 35 20 107 7 6 13 91 5 54 57
Iran 158 140 123 89 106 196 334 597 461 548
Morocco 18 17 14 14 7 19 31 29 45 108
Nigeria 61 89 55 52 22 29 53 24 52 115
Iraq 442 217 264 507 695 543 305 237 115 133
Algeria 62 50 45 15 16 38 46 46 103 134
Armenia 23 29 19 17 4 12 17 32 36 60
Eritrea 5 18 8 5 6 15 37 26 20 57
Tunisia 7 11 4 2 5 11 9 9 56 69
Pakistan 36 81 40 31 17 14 49 26 57 67
Other countries 1 637 1 121 788 617 520 588 635 785 745 1 231
Total 4 593 3 235 2 260 1 918 1 852 2 360 3 819 4 965 3 811 6 186
Note: For details on definitions and sources, please refer to the metadata at the end of the tables.1 2 http://dx.doi.org/10.1787/888933
Table B.3. Inflows of asylum seekers by nationalityESTONIA
2003 2004 2005 2006 2007 2008 2009 2010 2011 2012
Viet Nam 0 0 0 0 0 0 0 0 0 4
Syria 0 0 0 0 0 0 5 0 0 4
Russian Federation 4 0 4 4 3 3 5 7 4 8
Georgia 4 1 0 0 0 2 6 0 6 35
Pakistan 0 0 0 0 0 0 0 1 0 3
Albania 0 0 0 0 0 0 0 0 0 1
Belgium 0 0 0 0 0 0 0 0 0 0
Iran 0 0 0 0 0 0 0 0 0 0
Sudan 0 0 0 0 0 0 0 1 0 0
Cuba 0 0 0 0 0 0 0 0 0 0
Serbia (and Kosovo) 0 0 0 0 0 0 0 0 0 0
Afghanistan 0 0 0 0 0 0 9 7 8 3
Australia 0 0 0 0 0 0 0 0 0 0
Croatia 0 0 0 0 0 0 0 0 0 0
Nigeria 0 0 0 1 0 1 1 3 0 0
Other countries 6 13 7 2 11 8 10 11 49 19
Total 14 14 11 7 14 14 36 30 67 77
Note: For details on definitions and sources, please refer to the metadata at the end of the tables.1 2 http://dx.doi.org/10.1787/888933
INTERNATIONAL MIGRATION OUTLOOK 2014 © OECD 2014346

STATISTICAL ANNEX
2013
764
219
202
196
172
148
147
119
81
70
64
55
53
51
39
643
3 023
158468
2013
5 867
5 263
5 016
4 676
3 069
2 456
2 445
2 325
2 293
1 735
1 722
1 682
1 663
1 479
1 473
17 070
60 234
158468
Table B.3. Inflows of asylum seekers by nationalityFINLAND
2003 2004 2005 2006 2007 2008 2009 2010 2011 2012
Iraq 150 123 289 225 307 1 253 1 183 575 588 784
Russian Federation 292 217 233 176 171 208 599 436 294 199
Nigeria 77 92 73 64 41 76 130 84 105 93
Somalia 91 253 321 92 81 1 176 1 169 571 365 173
Afghanistan 51 166 237 97 70 249 445 265 292 188
Syria 39 15 11 17 8 24 36 41 109 180
Iran 47 99 79 91 78 143 159 142 125 121
Serbia (and Kosovo) 645 837 457 286 142 170 335 327 160 167
Algeria 38 31 33 25 25 27 48 47 55 54
Morocco 8 3 9 0 4 12 29 15 28 37
Gambia 3 1 12 17 5 8 45 33 21 29
Turkey 185 140 97 41 74 65 140 117 74 56
Ghana 15 3 11 6 9 27 52 78 34 34
Albania 58 61 33 21 13 16 9 12 11 18
Belarus 46 58 57 97 47 68 94 66 83 32
Other countries 1 476 1 762 1 622 1 076 359 494 1 437 1 209 742 757
Total 3 221 3 861 3 574 2 331 1 434 4 016 5 910 4 018 3 086 2 922
Note: For details on definitions and sources, please refer to the metadata at the end of the tables.1 2 http://dx.doi.org/10.1787/888933
Table B.3. Inflows of asylum seekers by nationalityFRANCE
2003 2004 2005 2006 2007 2008 2009 2010 2011 2012
Serbia (and Kosovo) 2 704 3 812 3 997 3 047 3 068 3 140 5 245 5 771 3 470 3 957
Democratic Republic of the Congo 5 093 3 848 3 022 2 283 2 154 2 543 2 800 3 426 3 845 5 321
Albania 571 595 471 306 198 334 536 479 477 2 647
Russian Federation 3 347 3 331 3 080 2 313 3 265 3 595 3 392 4 334 4 062 5 369
Bangladesh 956 959 860 607 960 1 249 1 441 3 145 3 572 1 093
Georgia 1 726 1 563 788 282 176 379 471 1 355 1 645 2 552
Guinea 808 1 020 1 147 859 981 1 270 1 671 2 034 2 033 1 884
Sri Lanka 2 129 2 246 2 071 2 145 2 159 2 322 3 129 2 864 3 222 3 122
China 5 330 4 196 2 590 1 214 1 286 821 1 602 1 937 2 187 2 228
Pakistan 756 1 046 572 393 343 325 634 893 1 433 1 941
Armenia 1 106 1 292 1 642 1 684 1 929 2 075 3 112 1 775 3 639 2 187
Turkey 7 192 4 741 3 867 2 758 2 234 2 198 2 047 1 415 1 737 2 054
Mali 1 241 859 568 153 607 2 670 705 712 739 938
Algeria 2 794 4 209 2 018 1 127 967 978 1 118 1 171 1 132 1 162
Haiti 1 488 3 133 5 060 1 844 677 930 1 458 2 008 2 016 1 602
Other countries 22 527 21 695 17 980 9 733 8 383 10 575 12 757 14 755 16 938 17 011
Total 59 768 58 545 49 733 30 748 29 387 35 404 42 118 48 074 52 147 55 068
Note: For details on definitions and sources, please refer to the metadata at the end of the tables.1 2 http://dx.doi.org/10.1787/888933
INTERNATIONAL MIGRATION OUTLOOK 2014 © OECD 2014 347

STATISTICAL ANNEX
2013
14 887
14 853
11 851
7 735
6 208
4 424
4 101
3 958
3 786
3 616
3 323
2 336
2 133
1 923
1 521
22 925
09 580
158468
2013
1 359
1 223
730
584
534
482
308
257
187
174
158
154
148
144
122
1 660
8 224
158468
Table B.3. Inflows of asylum seekers by nationalityGERMANY
2003 2004 2005 2006 2007 2008 2009 2010 2011 2012
Russian Federation 3 383 2 757 1 719 1 040 772 792 936 1 199 1 689 3 202
Serbia (and Kosovo) 4 909 3 855 5 522 3 182 1 996 1 608 1 981 6 592 5 974 10 383
Syria 1 192 768 933 609 634 775 819 1 490 2 634 6 201
Afghanistan 1 473 918 711 531 338 657 3 375 5 905 7 767 7 498
Former Yugoslav Republic of Macedonia 320 198 193 132 89 82 109 2 466 1 131 4 546
Iran 2 049 1 369 929 611 631 815 1 170 2 475 3 352 4 348
Pakistan 1 122 1 062 551 464 301 320 481 840 2 539 3 412
Iraq 3 850 1 293 1 983 2 117 4 327 6 836 6 538 5 555 5 831 5 352
Somalia 257 240 163 146 121 165 346 2 235 984 1 243
Eritrea 556 456 367 281 335 262 346 642 632 650
Bosnia and Herzegovina 600 412 325 209 109 131 171 301 305 2 025
Georgia 1 139 802 493 240 181 232 560 664 471 1 298
Egypt 56 56 56 66 48 60 84 118 177 254
Nigeria 1 051 1 130 608 481 503 561 791 716 759 892
Turkey 6 301 4 148 2 958 1 949 1 437 1 408 1 429 1 340 1 578 1 457
Other countries 22 305 16 143 11 403 8 971 7 342 7 381 8 513 8 794 9 918 11 778
Total 50 563 35 607 28 914 21 029 19 164 22 085 27 649 41 332 45 741 64 539 1
Note: For details on definitions and sources, please refer to the metadata at the end of the tables.1 2 http://dx.doi.org/10.1787/888933
Table B.3. Inflows of asylum seekers by nationalityGREECE
2003 2004 2005 2006 2007 2008 2009 2010 2011 2012
Pakistan 681 247 1 154 2 378 9 144 6 914 3 716 2 748 2 309 2 339
Afghanistan 561 382 458 1 087 1 556 2 287 1 510 524 637 584
Bangladesh 233 208 550 3 750 2 965 1 778 1 809 987 615 1 007
Albania 12 23 21 20 51 202 517 693 276 384
Georgia 48 323 1 897 428 1 559 2 241 2 170 1 162 1 121 893
Syria 19 44 57 143 1 311 808 965 167 352 275
Egypt 22 83 104 27 75 95 145 104 306 249
Nigeria 444 325 406 391 390 746 780 393 362 267
Iran 608 228 203 528 354 312 303 125 247 211
China 140 52 251 97 36 55 391 549 406 195
Eritrea 27 10 17 28 26 47 47 59 37 138
Democratic Republic of the Congo 40 27 13 15 1 12 11 16 12 20
Iraq 2 831 936 971 1 415 5 474 1 760 886 342 257 315
Algeria 5 27 48 17 19 18 44 79 79 105
Somalia 389 119 110 150 174 149 140 141 68 60
Other countries 2 118 1 435 2 790 1 793 1 978 2 460 2 494 2 184 2 227 2 535
Total 8 178 4 469 9 050 12 267 25 113 19 884 15 928 10 273 9 311 9 577
Note: For details on definitions and sources, please refer to the metadata at the end of the tables.1 2 http://dx.doi.org/10.1787/888933
INTERNATIONAL MIGRATION OUTLOOK 2014 © OECD 2014348

STATISTICAL ANNEX
2013
6 181
3 052
2 279
1 105
934
678
494
441
304
264
255
255
231
185
156
1 751
18 565
158468
2013
42
40
9
7
6
6
6
5
5
4
4
3
3
3
3
26
172
158468
Table B.3. Inflows of asylum seekers by nationalityHUNGARY
2003 2004 2005 2006 2007 2008 2009 2010 2011 2012
Serbia (and Kosovo) 112 180 243 384 723 1 593 2 320 446 238 246
Pakistan 53 54 40 18 15 246 41 41 121 327
Afghanistan 469 38 22 13 35 116 1 194 702 649 880
Algeria 79 57 19 22 48 19 11 35 56 59
Syria 11 10 18 32 48 16 19 23 91 145
Bangladesh 31 29 90 15 10 35 26 4 3 15
Morocco 1 2 2 4 5 4 5 14 30 47
Nigeria 74 73 89 109 86 56 66 37 22 27
Mali 1 0 0 0 0 0 0 0 0 0
Ghana 2 2 4 2 4 3 5 0 2 1
Côte d’Ivoire 5 1 2 8 3 1 21 6 4 4
Senegal 22 1 1 1 8 2 0 2 1 3
Tunisia 4 4 5 1 0 5 5 10 30 21
Somalia 113 18 7 42 99 185 75 51 61 69
Guinea 1 0 1 5 7 1 4 5 4 3
Other countries 1 423 1 131 1 066 1 461 2 334 836 880 728 381 310
Total 2 401 1 600 1 609 2 117 3 425 3 118 4 672 2 104 1 693 2 157
Note: For details on definitions and sources, please refer to the metadata at the end of the tables.1 2 http://dx.doi.org/10.1787/888933
Table B.3. Inflows of asylum seekers by nationalityICELAND
2003 2004 2005 2006 2007 2008 2009 2010 2011 2012
Croatia 1 0 1 1 0 0 0 2 0 6
Albania 11 5 2 0 5 5 3 0 2 11
Russian Federation 3 3 9 6 5 3 0 0 7 3
Syria 0 0 0 0 5 1 3 2 1 3
Algeria 0 2 3 1 1 0 1 0 6 6
Iraq 3 6 0 1 1 4 2 5 5 3
Nigeria 1 7 2 1 1 5 2 2 7 17
Afghanistan 3 2 6 2 1 5 2 7 3 9
Eritrea 1 0 1 0 0 2 2 1 2 2
Iran 1 2 4 2 1 3 7 6 3 11
Somalia 0 0 0 0 0 2 2 5 2 1
Azerbaijan 2 0 0 0 0 3 0 0 0 0
West Bank and Gaza Strip 0 3 0 0 0 1 0 0 2 2
Georgia 1 0 3 2 0 4 0 1 4 8
Honduras 0 0 0 0 0 0 0 0 0 0
Other countries 53 46 57 23 22 39 11 20 32 31
Total 80 76 88 39 42 77 35 51 76 113
Note: For details on definitions and sources, please refer to the metadata at the end of the tables.1 2 http://dx.doi.org/10.1787/888933
INTERNATIONAL MIGRATION OUTLOOK 2014 © OECD 2014 349

STATISTICAL ANNEX
2013
129
91
72
70
55
51
48
38
32
31
28
27
22
19
16
217
946
158468
2013
..
..
..
..
..
..
..
..
..
..
..
..
..
..
..
..
..
158468
Table B.3. Inflows of asylum seekers by nationalityIRELAND
2003 2004 2005 2006 2007 2008 2009 2010 2011 2012
Nigeria 3 110 1 776 1 278 1 038 1 028 1 009 569 387 205 181
Pakistan 62 55 68 167 185 237 257 200 197 123
Democratic Republic of the Congo 256 140 138 109 149 173 102 71 76 62
Zimbabwe 88 69 51 77 87 114 91 48 69 50
Malawi 9 3 6 8 14 22 14 15 26 24
Algeria 68 66 32 49 47 65 71 32 53 39
Albania 142 99 58 35 71 51 47 13 35 46
Syria 15 18 22 25 9 17 3 2 11 16
Afghanistan 24 106 142 88 78 79 68 69 74 50
Bangladesh 6 7 20 5 24 47 30 51 22 32
South Africa 114 45 33 38 39 75 54 53 47 35
Iraq 129 38 55 215 285 203 76 29 21 12
China 168 152 96 139 259 180 194 228 156 36
Cameroon 125 62 57 78 44 67 50 56 24 16
Mauritius 0 1 2 0 19 19 15 19 12 18
Other countries 3 584 2 132 2 266 2 243 1 650 1 508 1 048 666 391 364
Total 7 900 4 769 4 324 4 314 3 988 3 866 2 689 1 939 1 419 1 104
Note: For details on definitions and sources, please refer to the metadata at the end of the tables.1 2 http://dx.doi.org/10.1787/888933
Table B.3. Inflows of asylum seekers by nationalityISRAEL
2003 2004 2005 2006 2007 2008 2009 2010 2011 2012
Côte d’Ivoire .. 74 43 91 751 507 20 289 173 438
South Sudan .. .. .. .. .. .. .. .. .. 285
Eritrea .. 31 4 20 1 766 3 067 0 2 75 261
Nigeria .. 100 160 448 567 418 198 168 209 194
Ethiopia .. 316 56 13 45 495 16 148 94 138
Ghana .. 34 25 74 192 233 113 189 148 108
Guinea .. 7 181 151 23 24 10 35 4 70
Sudan .. 14 102 164 1 402 2 142 0 4 37 37
Colombia .. 28 23 31 67 92 40 75 36 23
Nepal .. 6 0 8 7 3 6 0 2 14
Togo .. 21 10 8 22 13 0 15 2 7
China .. 0 0 3 11 11 0 0 1 6
Chad .. 0 0 1 5 19 1 17 7 4
Myanmar .. 25 12 14 20 8 0 0 11 3
Guinea-Bissau .. 1 1 6 3 0 3 0 1 2
Other countries .. 265 292 316 501 706 402 506 4 945 409
Total .. 922 909 1 348 5 382 7 738 809 1 448 5 745 1 999
Note: For details on definitions and sources, please refer to the metadata at the end of the tables.Information on data for Israel: http://dx.doi.org/10.1787/888932315602.
1 2 http://dx.doi.org/10.1787/888933
INTERNATIONAL MIGRATION OUTLOOK 2014 © OECD 2014350

STATISTICAL ANNEX
2013
3 175
3 170
2 761
2 088
2 049
1 714
1 701
988
905
634
552
502
487
478
460
4 056
25 720
158468
2013
658
544
380
345
241
190
165
114
99
68
0
0
0
0
0
456
3 260
158468
Table B.3. Inflows of asylum seekers by nationalityITALY
2003 2004 2005 2006 2007 2008 2009 2010 2011 2012
Pakistan 787 267 411 203 176 1 143 1 362 929 2 058 2 601
Nigeria 722 930 536 830 1 336 5 673 3 991 1 385 6 208 1 613
Somalia 1 743 186 117 99 757 4 864 1 604 84 1 205 807
Eritrea 1 230 831 1 313 2 151 2 260 2 934 890 181 498 734
Afghanistan 70 84 76 177 663 1 732 711 873 1 289 1 495
Mali 0 1 0 97 268 419 215 67 2 582 785
Gambia 0 37 25 49 142 413 307 80 282 321
Senegal 0 26 13 16 67 131 156 162 775 939
Egypt 0 6 7 21 53 76 42 41 249 445
Syria 0 7 3 15 27 55 120 48 288 354
Iraq 493 166 118 87 189 758 417 380 309 403
Tunisia 0 7 53 48 14 278 222 139 4 558 893
Turkey 466 323 168 175 394 501 541 854 612 478
Ghana 505 62 407 530 673 1 815 991 278 3 128 846
Bangladesh 297 342 407 283 315 1 684 1 338 222 1 595 566
Other countries 7 142 6 447 5 894 5 567 6 719 7 848 4 696 4 329 8 481 4 072
Total 13 455 9 722 9 548 10 348 14 053 30 324 17 603 10 052 34 117 17 352
Note: For details on definitions and sources, please refer to the metadata at the end of the tables.1 2 http://dx.doi.org/10.1787/888933
Table B.3. Inflows of asylum seekers by nationalityJAPAN
2003 2004 2005 2006 2007 2008 2009 2010 2011 2012
Turkey 77 131 40 149 76 156 94 126 234 422
Nepal 1 3 5 11 4 20 29 109 251 320
Myanmar 111 138 212 626 500 979 568 342 491 368
Sri Lanka 4 9 7 27 43 90 234 171 224 255
Pakistan 12 12 10 12 27 37 92 83 169 298
Bangladesh 6 33 29 15 14 33 51 33 98 169
India 12 7 0 2 2 17 59 91 51 125
Ghana 1 1 0 0 1 4 3 13 15 104
Cameroon 8 11 1 5 12 29 11 20 48 58
Nigeria 2 2 2 10 6 10 17 33 51 112
Afghanistan 3 0 2 3 12 4 5 1 4 4
Algeria 0 0 0 0 0 0 0 0 0 0
Angola 0 0 0 0 0 0 0 7 2 3
Egypt 0 0 0 0 0 0 0 1 2 6
Armenia 0 0 0 0 0 0 0 1 0 0
Other countries 99 79 76 94 119 220 225 172 227 301
Total 336 426 384 954 816 1 599 1 388 1 203 1 867 2 545
Note: For details on definitions and sources, please refer to the metadata at the end of the tables.1 2 http://dx.doi.org/10.1787/888933
INTERNATIONAL MIGRATION OUTLOOK 2014 © OECD 2014 351

STATISTICAL ANNEX
2013
295
275
206
97
90
77
74
68
46
45
42
34
28
27
26
144
1 574
158468
2013
189
140
89
70
53
52
37
33
27
25
24
24
22
17
16
171
989
158468
Table B.3. Inflows of asylum seekers by nationalityKOREA
2003 2004 2005 2006 2007 2008 2009 2010 2011 2012
Syria 0 0 0 0 0 0 0 0 2 146
Pakistan 9 0 1 5 4 47 95 129 434 244
Nigeria 0 0 26 16 100 27 16 19 39 102
Egypt 0 1 2 4 3 1 3 0 4 6
Nepal 1 2 8 78 275 12 2 5 14 43
Cameroon 0 0 4 2 2 5 10 11 6 30
South Africa 0 0 1 0 9 3 4 1 4 17
Ethiopia 13 1 7 21 4 6 1 6 6 15
China 10 64 145 28 29 30 19 7 8 3
Bangladesh 6 1 9 8 23 30 41 41 38 32
Liberia 4 8 11 6 15 15 1 4 20 28
Yemen 0 1 0 0 0 0 0 0 2 1
Uganda 1 9 46 20 50 21 15 12 78 56
Afghanistan 1 1 1 0 1 0 8 15 60 4
Sri Lanka 0 0 8 27 67 71 26 4 100 308
Other countries 41 57 143 63 135 96 83 171 196 108
Total 86 145 412 278 717 364 324 425 1 011 1 143
Note: For details on definitions and sources, please refer to the metadata at the end of the tables.1 2 http://dx.doi.org/10.1787/888933
Table B.3. Inflows of asylum seekers by nationalityLUXEMBOURG
2003 2004 2005 2006 2007 2008 2009 2010 2011 2012
Serbia (and Kosovo) 541 361 219 193 225 219 149 302 1 064 575
Bosnia and Herzegovina 59 35 36 17 24 31 35 11 38 278
Montenegro 0 0 0 14 15 14 6 0 100 288
Albania 66 48 33 20 16 14 26 18 24 300
Nigeria 1 3 45 14 7 5 6 5 9 24
Tunisia 2 1 2 3 1 0 2 3 42 46
Algeria 81 69 39 8 11 4 11 43 30 32
Former Yugoslav Republic of Macedonia 23 13 0 3 5 7 6 13 452 158
Iraq 14 9 8 16 14 29 37 95 41 31
Morocco 4 2 0 4 1 1 3 4 4 8
Belarus 55 40 16 5 8 6 15 15 9 18
Syria 1 1 0 0 0 0 1 19 10 14
Iran 31 59 41 31 16 18 24 23 22 28
Afghanistan 2 6 3 8 3 4 13 15 22 11
Georgia 44 7 6 1 1 1 2 7 16 7
Other countries 626 923 354 186 79 110 141 171 193 185
Total 1 550 1 577 802 523 426 463 477 744 2 076 2 003
Note: For details on definitions and sources, please refer to the metadata at the end of the tables.1 2 http://dx.doi.org/10.1787/888933
INTERNATIONAL MIGRATION OUTLOOK 2014 © OECD 2014352

STATISTICAL ANNEX
2013
529
308
101
87
46
40
39
20
14
13
11
9
7
6
5
61
1 296
158468
2013
3 078
2 673
1 094
978
728
673
316
263
216
209
185
177
164
158
150
3 337
14 399
158468
Table B.3. Inflows of asylum seekers by nationalityMEXICO
2003 2004 2005 2006 2007 2008 2009 2010 2011 2012
Honduras 37 67 51 39 31 55 184 135 168 272
El Salvador 5 46 31 31 45 51 119 159 181 200
Cuba 14 26 80 65 27 7 42 42 48 77
India 1 10 27 5 2 3 37 271 36 8
Guatemala 62 23 29 20 15 18 39 59 69 54
Colombia 38 40 40 52 57 41 62 82 43 41
Nigeria 6 0 2 1 13 1 8 23 27 21
Nicaragua 3 11 14 4 7 9 29 15 6 11
Haiti 8 11 20 17 41 61 65 39 38 25
Ghana 0 0 0 2 1 3 3 9 14 7
Syria 2 0 0 1 0 0 0 0 0 2
Bangladesh 5 8 3 4 29 0 1 5 7 3
United States 3 1 1 1 2 1 4 10 4 0
Cameroon 0 1 6 8 3 2 2 2 4 5
Dominican Republic 2 3 0 0 1 1 1 16 4 5
Other countries 89 157 383 230 100 64 84 172 104 80
Total 275 404 687 480 374 317 680 1 039 753 811
Note: For details on definitions and sources, please refer to the metadata at the end of the tables.1 2 http://dx.doi.org/10.1787/888933
Table B.3. Inflows of asylum seekers by nationalityNETHERLANDS
2003 2004 2005 2006 2007 2008 2009 2010 2011 2012
Somalia 451 792 1 315 1 462 1 874 3 842 5 889 3 372 1 415 877
Syria 234 180 278 293 36 48 101 125 168 454
Iraq 3 473 1 043 1 620 2 766 2 004 5 027 1 991 1 383 1 435 1 391
Eritrea 123 148 204 175 153 236 475 392 458 424
Iran 555 450 557 921 187 322 502 785 929 834
Afghanistan 492 688 902 932 143 395 1 281 1 364 1 885 1 022
Serbia (and Kosovo) 393 395 336 607 24 32 76 106 120 170
Russian Federation 245 206 285 254 81 95 151 207 451 743
Stateless 235 183 147 232 70 77 115 83 65 40
Georgia 116 73 213 156 66 64 412 587 189 226
Armenia 203 247 197 280 97 208 349 611 471 200
Egypt 23 24 30 14 11 28 49 40 64 176
Uganda 22 33 19 40 29 28 60 80 91 111
Guinea 199 116 105 116 102 154 235 230 209 186
Pakistan 84 66 82 117 22 46 42 60 94 150
Other countries 6 554 5 138 6 057 6 100 2 203 2 797 3 177 3 908 3 546 2 660
Total 13 402 9 782 12 347 14 465 7 102 13 399 14 905 13 333 11 590 9 664
Note: For details on definitions and sources, please refer to the metadata at the end of the tables.1 2 http://dx.doi.org/10.1787/888933
INTERNATIONAL MIGRATION OUTLOOK 2014 © OECD 2014 353

STATISTICAL ANNEX
2013
41
37
22
21
18
15
12
10
9
8
7
7
6
6
6
66
291
158468
2013
3 215
1 617
841
684
586
532
481
324
303
282
250
179
166
141
124
1 742
11 467
158468
Table B.3. Inflows of asylum seekers by nationalityNEW ZEALAND
2003 2004 2005 2006 2007 2008 2009 2010 2011 2012
Sri Lanka 23 29 6 30 25 26 30 28 19 25
Fiji 19 2 12 10 10 7 45 66 29 21
Iran 135 88 47 29 27 28 24 43 29 38
China 56 49 19 30 26 24 20 22 20 33
Pakistan 7 9 8 11 8 3 18 8 22 24
Iraq 39 12 22 35 30 33 25 11 11 6
Turkey 1 1 2 4 3 1 2 4 4 9
Syria 7 16 11 1 1 2 8 3 2 13
South Africa 10 8 3 2 2 3 9 20 14 0
Indonesia 6 0 1 0 0 1 1 3 1 2
Afghanistan 4 0 1 0 3 2 2 5 11 10
Egypt 2 2 6 0 2 4 5 6 22 4
Bahrain 0 0 0 1 0 0 0 1 22 0
Bangladesh 29 22 23 16 18 9 7 6 8 8
Czech Republic 10 29 28 12 4 10 23 14 5 12
Other countries 493 313 159 95 86 101 117 100 86 119
Total 841 580 348 276 245 254 336 340 305 324
Note: For details on definitions and sources, please refer to the metadata at the end of the tables.1 2 http://dx.doi.org/10.1787/888933
Table B.3. Inflows of asylum seekers by nationalityNORWAY
2003 2004 2005 2006 2007 2008 2009 2010 2011 2012
Eritrea 201 110 177 316 789 1 799 2 667 1 711 1 256 1 183
Somalia 1 623 958 667 632 187 1 293 1 901 1 397 2 216 2 181
Syria 97 71 79 49 49 115 278 119 198 327
Afghanistan 2 050 1 059 466 224 234 1 363 3 871 979 979 986
Sudan 67 33 45 36 37 118 251 181 209 472
Stateless 379 298 209 237 515 940 1 280 448 262 263
Nigeria 241 205 94 54 108 436 582 354 240 355
Russian Federation 1 923 937 545 548 863 1 078 867 628 365 371
Serbia (and Kosovo) 2 216 859 468 369 585 675 406 444 240 246
Ethiopia 293 148 100 143 241 354 706 505 293 185
Iran 621 394 279 218 222 720 574 429 355 441
Albania 247 112 79 43 31 53 29 24 43 169
Iraq 971 412 671 1 002 1 227 3 137 1 214 460 357 221
Pakistan 95 48 33 26 43 38 139 99 92 147
Bangladesh 30 30 24 20 12 8 20 17 75 225
Other countries 4 905 2 271 1 466 1 403 1 385 2 304 2 441 2 269 1 873 2 013
Total 15 959 7 945 5 402 5 320 6 528 14 431 17 226 10 064 9 053 9 785
Note: For details on definitions and sources, please refer to the metadata at the end of the tables.1 2 http://dx.doi.org/10.1787/888933
INTERNATIONAL MIGRATION OUTLOOK 2014 © OECD 2014354

STATISTICAL ANNEX
2013
11 786
1 024
248
150
76
59
43
33
33
32
28
25
25
24
24
148
13 758
158468
2013
146
83
37
36
26
26
15
15
15
14
7
7
7
5
5
63
507
158468
Table B.3. Inflows of asylum seekers by nationalityPOLAND
2003 2004 2005 2006 2007 2008 2009 2010 2011 2012
Russian Federation 5 581 7 182 6 244 4 018 6 668 6 647 5 726 4 795 3 034 4 929
Georgia 30 47 47 31 12 54 4 213 1 082 1 427 2 956
Syria 4 7 7 0 4 8 7 8 11 107
Armenia 104 18 27 15 22 33 147 107 168 380
Kazakhstan 6 30 24 18 5 17 5 11 17 120
Kyrgyzstan 10 19 16 13 7 5 13 37 41 30
Afghanistan 251 57 6 11 9 4 14 25 35 88
Egypt 4 2 1 2 2 6 4 11 5 102
Viet Nam 25 16 23 27 40 57 67 47 26 50
Ukraine 85 72 84 43 26 25 36 45 43 58
Iraq 75 6 15 16 22 66 21 27 25 25
Somalia 15 19 4 1 9 1 2 5 9 7
Stateless 12 11 15 6 12 11 19 21 14 35
Belarus 58 53 82 55 62 33 37 46 64 61
Pakistan 151 211 69 46 25 15 19 27 8 34
Other countries 510 329 196 128 280 221 257 240 159 185
Total 6 921 8 079 6 860 4 430 7 205 7 203 10 587 6 534 5 086 9 167
Note: For details on definitions and sources, please refer to the metadata at the end of the tables.1 2 http://dx.doi.org/10.1787/888933
Table B.3. Inflows of asylum seekers by nationalityPORTUGAL
2003 2004 2005 2006 2007 2008 2009 2010 2011 2012
Syria 0 0 0 0 0 0 0 0 0 22
Guinea 1 0 1 6 14 8 18 43 46 65
Nigeria 2 1 1 6 2 8 9 7 22 27
Senegal 1 2 2 1 1 7 1 2 5 7
Mali 0 0 0 0 0 0 0 0 0 2
Pakistan 1 5 0 1 2 0 1 4 11 8
Guinea-Bissau 1 5 6 5 1 4 5 10 11 17
Côte d’Ivoire 0 0 0 6 2 1 0 1 18 11
Morocco 1 0 1 0 1 2 0 0 5 4
Democratic Republic of the Congo 3 2 7 16 11 20 5 9 13 17
Gambia 1 0 1 0 0 0 2 2 2 1
Russian Federation 3 13 7 6 6 0 2 5 9 6
Somalia 0 0 1 0 16 3 0 2 26 9
Bangladesh 0 0 0 2 0 0 0 0 2 2
Colombia 5 8 27 6 86 26 15 16 13 10
Other countries 69 77 60 73 82 82 81 59 92 91
Total 88 113 114 128 224 161 139 160 275 299
Note: For details on definitions and sources, please refer to the metadata at the end of the tables.1 2 http://dx.doi.org/10.1787/888933
INTERNATIONAL MIGRATION OUTLOOK 2014 © OECD 2014 355

STATISTICAL ANNEX
2013
1 073
382
137
73
54
27
20
16
14
14
13
12
10
8
6
103
1 962
158468
2013
84
42
25
21
16
13
8
8
6
6
5
5
5
3
3
31
281
158468
Table B.3. Inflows of asylum seekers by nationalityRUSSIAN FEDERATION
2003 2004 2005 2006 2007 2008 2009 2010 2011 2012
Syria 0 0 1 0 0 18 6 3 31 197
Afghanistan 500 638 674 827 2 211 2 047 1 577 884 540 493
Georgia 46 24 27 138 586 2 684 3 580 641 314 238
Egypt 0 0 0 0 0 0 0 31 3 13
Uzbekistan 38 72 102 37 63 90 136 96 70 69
Democratic People’s Republic of Korea 0 0 1 7 11 26 59 21 67 32
Sudan 0 0 3 4 18 10 13 3 2 6
Kyrgyzstan 3 0 12 0 5 3 7 246 39 29
Democratic Republic of the Congo 4 10 7 2 34 23 11 15 14 14
Tajikistan 12 23 3 7 43 48 29 20 19 17
Ukraine 4 6 4 10 20 19 10 17 11 11
Lebanon 0 0 0 0 0 7 1 2 5 1
Pakistan 0 0 1 0 13 8 14 2 7 6
Iraq 13 18 20 13 36 61 37 6 12 11
Azerbaijan 21 9 5 21 31 48 4 16 8 2
Other countries 96 110 100 104 298 326 217 178 123 104
Total 737 910 960 1 170 3 369 5 418 5 701 2 181 1 265 1 243
Note: For details on definitions and sources, please refer to the metadata at the end of the tables.1 2 http://dx.doi.org/10.1787/888933
Table B.3. Inflows of asylum seekers by nationalitySLOVAK REPUBLIC
2003 2004 2005 2006 2007 2008 2009 2010 2011 2012
Afghanistan 627 393 109 41 67 72 51 76 75 90
Somalia 114 12 16 3 9 0 13 23 78 223
Eritrea 0 0 0 0 0 0 0 0 0 29
Armenia 758 144 17 14 28 22 21 12 10 26
Georgia 582 989 258 209 134 119 98 63 62 61
Syria 72 47 24 6 38 7 10 4 10 4
Pakistan 307 799 196 182 648 109 168 34 15 16
Sudan 12 8 2 1 2 0 0 0 0 1
Iraq 475 116 35 206 131 42 13 9 8 4
Russian Federation 2 653 2 413 1 037 463 307 100 72 66 38 14
China 1 080 1 271 280 164 96 44 39 31 13 17
Mongolia 5 2 0 2 1 0 1 0 1 1
Ukraine 73 64 45 32 36 32 13 20 8 7
Iran 182 53 9 5 2 5 10 12 13 3
Libya 0 0 0 1 1 0 1 0 1 1
Other countries 3 418 5 080 1 521 1 542 1 143 358 312 191 159 235
Total 10 358 11 391 3 549 2 871 2 643 910 822 541 491 732
Note: For details on definitions and sources, please refer to the metadata at the end of the tables.1 2 http://dx.doi.org/10.1787/888933
INTERNATIONAL MIGRATION OUTLOOK 2014 © OECD 2014356

STATISTICAL ANNEX
2013
56
37
19
14
14
13
11
9
7
6
6
5
5
4
4
33
243
158468
2013
1 482
725
351
182
136
130
102
90
88
77
72
66
62
61
58
831
4 513
158468
Table B.3. Inflows of asylum seekers by nationalitySLOVENIA
2003 2004 2005 2006 2007 2008 2009 2010 2011 2012
Syria 1 0 2 0 0 0 0 4 11 33
Serbia (and Kosovo) 181 413 640 243 234 69 39 33 42 31
Pakistan 28 16 28 6 11 4 6 0 29 8
Afghanistan 2 5 6 2 12 10 11 31 69 64
Algeria 65 19 3 0 0 2 2 6 11 26
Russian Federation 15 15 11 7 9 3 5 8 4 6
Turkey 192 188 231 62 38 72 12 32 51 26
Morocco 0 0 0 0 0 0 1 4 9 9
Cuba 16 5 1 1 0 4 0 1 0 7
Iran 88 7 4 3 2 11 9 11 11 4
Somalia 1 1 0 0 0 0 0 8 20 20
Bosnia and Herzegovina 48 123 303 44 22 13 41 27 9 7
Nigeria 2 1 2 1 4 7 9 11 5 7
Albania 15 199 146 32 21 7 6 0 3 0
West Bank and Gaza Strip 17 7 5 11 4 0 1 10 7 6
Other countries 429 279 452 106 68 36 41 60 92 51
Total 1 100 1 278 1 834 518 425 238 183 246 373 305
Note: For details on definitions and sources, please refer to the metadata at the end of the tables.1 2 http://dx.doi.org/10.1787/888933
Table B.3. Inflows of asylum seekers by nationalitySPAIN
2003 2004 2005 2006 2007 2008 2009 2010 2011 2012
Mali 63 253 273 25 7 11 29 14 41 101
Syria 7 39 35 15 31 97 30 19 97 255
Algeria 682 991 406 230 247 152 181 176 122 202
Nigeria 1 688 1 029 726 632 680 808 458 238 259 204
Somalia 128 13 24 10 154 195 104 39 59 98
West Bank and Gaza Strip 0 0 0 0 70 56 59 106 131 78
Pakistan 20 25 7 23 23 52 57 63 78 88
Guinea 171 228 173 23 91 98 130 166 150 73
Cameroon 178 72 99 83 57 71 111 156 129 121
Democratic Republic of the Congo 274 203 170 102 141 105 114 87 70 78
Côte d’Ivoire 241 110 162 236 335 500 304 119 550 106
Afghanistan 12 14 10 7 15 50 42 41 30 46
Colombia 577 760 1 655 2 239 2 497 752 255 123 104 60
Iran 21 34 23 20 27 64 45 63 62 59
Cuba 125 79 78 59 83 119 84 406 440 64
Other countries 1 731 1 685 1 413 1 593 3 204 1 387 1 004 928 1 092 946
Total 5 918 5 535 5 254 5 297 7 662 4 517 3 007 2 744 3 414 2 579
Note: For details on definitions and sources, please refer to the metadata at the end of the tables.1 2 http://dx.doi.org/10.1787/888933
INTERNATIONAL MIGRATION OUTLOOK 2014 © OECD 2014 357

STATISTICAL ANNEX
2013
16 317
6 921
4 844
3 901
3 011
2 878
1 476
1 172
1 156
1 036
648
625
601
517
487
8 669
54 259
158468
2013
2 490
1 852
1 574
1 565
974
863
826
714
671
565
552
455
441
373
370
5 155
19 440
158468
Table B.3. Inflows of asylum seekers by nationalitySWEDEN
2003 2004 2005 2006 2007 2008 2009 2010 2011 2012
Syria 666 411 392 433 440 551 587 421 640 7 814
Stateless 1 787 1 578 806 815 1 312 1 051 912 1 033 1 109 2 289
Eritrea 641 395 425 608 878 857 1 000 1 443 1 647 2 356
Somalia 3 069 905 422 1 066 3 349 3 361 5 874 5 553 3 981 5 644
Afghanistan 811 903 435 594 609 784 1 694 2 393 4 122 4 755
Serbia (and Kosovo) 5 305 4 022 2 944 1 976 2 500 1 989 1 806 7 910 3 915 3 639
Iraq 2 700 1 456 2 330 8 951 18 559 6 083 2 297 1 977 1 633 1 322
Iran 787 660 582 494 485 799 1 144 1 182 1 120 1 529
Albania 297 221 169 95 118 118 114 61 263 1 490
Russian Federation 1 361 1 288 1 057 755 788 933 1 058 988 933 941
Morocco 52 44 38 52 75 62 78 100 154 381
Georgia 537 403 183 134 143 211 359 291 280 748
Nigeria 452 429 154 104 136 176 321 321 340 501
Bosnia and Herzegovina 1 397 785 387 234 217 150 129 123 981 1 549
Mongolia 342 346 326 461 519 791 753 727 773 463
Other countries 11 144 9 315 6 880 7 545 6 242 6 437 6 068 7 300 7 757 8 455
Total 31 348 23 161 17 530 24 317 36 370 24 353 24 194 31 823 29 648 43 876
Note: For details on definitions and sources, please refer to the metadata at the end of the tables.1 2 http://dx.doi.org/10.1787/888933
Table B.3. Inflows of asylum seekers by nationalitySWITZERLAND
2003 2004 2005 2006 2007 2008 2009 2010 2011 2012
Eritrea 235 180 159 1 201 1 662 2 849 1 724 1 708 3 225 4 295
Syria 175 127 116 161 290 388 400 387 688 1 146
Nigeria 480 418 219 209 310 988 1 786 1 597 1 303 2 353
Tunisia 154 121 102 80 90 74 204 291 2 324 1 993
Morocco 32 33 30 39 30 37 36 113 429 860
Afghanistan 218 207 238 233 307 405 751 632 1 006 1 349
Serbia (and Kosovo) 2 921 1 777 1 506 1 225 953 1 301 1 269 1 358 1 539 2 084
Algeria 836 480 186 161 132 236 300 313 464 681
China 228 70 87 475 251 272 365 333 688 801
Georgia 756 731 397 287 199 481 638 531 281 614
Somalia 471 592 485 273 395 2 014 753 302 558 762
Sri Lanka 340 251 233 328 618 1 262 1 415 892 433 443
Gambia 14 15 11 16 21 204 178 192 295 533
Turkey 1 652 1 154 723 693 621 519 559 462 508 515
Russian Federation 534 505 375 426 195 208 452 315 217 298
Other countries 11 760 7 587 5 194 4 730 4 313 5 368 5 175 4 095 5 481 7 221
Total 20 806 14 248 10 061 10 537 10 387 16 606 16 005 13 521 19 439 25 948
Note: For details on definitions and sources, please refer to the metadata at the end of the tables.1 2 http://dx.doi.org/10.1787/888933
INTERNATIONAL MIGRATION OUTLOOK 2014 © OECD 2014358

STATISTICAL ANNEX
2013
25 280
8 726
5 897
1 276
686
528
218
205
192
181
148
141
114
108
103
1 004
44 807
158468
2013
4 525
2 956
2 259
2 036
1 593
1 436
1 409
1 402
1 242
1 096
992
831
519
494
451
6 154
29 395
158468
Table B.3. Inflows of asylum seekers by nationalityTURKEY
2003 2004 2005 2006 2007 2008 2009 2010 2011 2012
Iraq 342 964 1 047 722 3 470 6 904 3 763 3 656 7 912 6 942
Afghanistan 77 341 364 261 705 2 642 1 009 1 248 2 486 14 146
Iran 3 092 2 029 1 716 2 297 1 685 2 116 1 981 2 881 3 411 3 589
Somalia 183 308 473 680 1 125 647 295 448 744 776
West Bank and Gaza Strip 6 23 29 51 157 74 72 64 157 236
Pakistan 0 6 2 3 12 9 36 42 29 24
Uganda 0 0 0 1 0 1 0 1 48 13
Sudan 64 28 76 113 76 156 92 48 43 38
Yemen 2 1 0 1 0 0 2 0 72 58
Uzbekistan 24 28 24 24 42 35 38 101 147 76
Bangladesh 1 2 0 0 2 3 21 14 5 16
Cameroon 0 0 0 1 5 18 19 20 57 31
Democratic Republic of the Congo 7 10 12 28 76 71 41 66 76 77
Syria 7 16 10 7 21 20 46 37 188 24
Turkmenistan 0 4 8 6 2 3 3 8 14 44
Other countries 147 148 153 358 268 282 416 592 632 380
Total 3 952 3 908 3 914 4 553 7 646 12 981 7 834 9 226 16 021 26 470
Note: For details on definitions and sources, please refer to the metadata at the end of the tables.1 2 http://dx.doi.org/10.1787/888933
Table B.3. Inflows of asylum seekers by nationalityUNITED KINGDOM
2003 2004 2005 2006 2007 2008 2009 2010 2011 2012
Pakistan 3 145 3 030 2 290 1 850 1 765 2 075 2 100 2 151 4 005 4 867
Iran 3 495 3 990 3 505 2 685 2 510 2 595 2 145 2 224 3 051 3 162
Sri Lanka 810 400 480 620 1 250 1 865 1 445 1 635 2 142 2 143
Syria 155 410 390 185 190 180 185 160 508 1 289
Albania 685 345 200 185 190 175 235 219 439 1 017
Afghanistan 2 590 1 605 1 775 2 660 2 815 3 725 3 540 1 843 1 529 1 242
Eritrea 1 070 1 265 1 900 2 735 1 905 2 335 1 410 772 827 768
Nigeria 1 110 1 210 1 230 990 905 1 070 910 1 149 1 105 1 498
Bangladesh 820 550 465 495 590 510 495 501 671 1 169
India 2 410 1 485 1 000 715 600 775 715 610 615 1 195
China 3 495 2 410 1 775 2 030 2 185 1 615 1 585 1 375 1 024 981
Sudan 1 050 1 445 990 750 400 290 255 643 793 740
Somalia 7 195 3 295 2 105 2 175 1 960 1 575 1 105 679 660 678
Libya 220 185 185 130 55 75 100 123 1 204 412
Viet Nam 1 175 790 400 95 185 235 470 467 347 416
Other countries 30 615 18 205 12 125 10 035 10 375 12 195 13 945 8 093 6 978 6 401
Total 60 040 40 620 30 815 28 335 27 880 31 290 30 640 22 644 25 898 27 978
Note: For details on definitions and sources, please refer to the metadata at the end of the tables.1 2 http://dx.doi.org/10.1787/888933
INTERNATIONAL MIGRATION OUTLOOK 2014 © OECD 2014 359

STATISTICAL ANNEX
2013
12 295
10 077
5 692
4 865
3 165
2 860
1 879
1 848
1 633
1 583
1 507
1 493
1 017
965
954
16 410
68 243
158468
t.ude
ations,
Unit,
Table B.3. Inflows of asylum seekers by nationalityUNITED STATES
2003 2004 2005 2006 2007 2008 2009 2010 2011 2012
China 8 287 5 627 7 623 9 362 8 781 9 825 10 725 12 510 15 649 15 884
Mexico 4 231 1 763 1 581 1 673 2 551 2 713 2 295 3 879 8 304 11 067
El Salvador 1 347 1 423 1 755 2 393 3 455 2 789 2 366 2 685 4 324 4 587
Guatemala 2 882 1 569 1 411 1 515 2 388 1 853 1 740 2 171 3 671 4 152
Honduras 600 603 781 986 1 096 893 850 1 030 1 559 2 115
Egypt 575 398 329 406 367 412 399 479 1 136 2 285
Haiti 5 655 5 107 5 299 5 135 3 079 2 078 1 649 1 223 1 377 1 612
Ecuador 111 80 56 85 89 168 174 404 807 1 394
India 1 672 866 620 602 576 734 751 755 2 477 1 998
Syria 152 99 59 71 52 75 41 58 263 704
Nepal 330 321 415 494 532 680 1 068 1 054 1 321 1 666
Ethiopia 1 029 1 118 807 1 168 1 124 1 168 1 249 1 193 1 066 796
Iran 764 443 337 400 290 334 344 504 595 767
Iraq 542 268 360 511 748 809 543 413 486 592
Russian Federation 904 783 669 638 615 677 806 828 888 872
Other countries 33 790 24 504 17 138 15 662 14 706 14 154 13 080 13 785 16 664 15 610
Total 62 871 44 972 39 240 41 101 40 449 39 362 38 080 42 971 60 587 66 101
Note: For details on definitions and sources, please refer to the metadata at the end of the tables.1 2 http://dx.doi.org/10.1787/888933
Metadata related to Tables A.3 and B.3. Inflows of asylum seekers
Totals in Table A.3 might differ from the tables by nationality (Tables B.3) because the former totals get revised retroactively while the origin breakdown does noData for Table A.3 generally refer to first instance/new applications only and exclude repeat/review/appeal applications while data by origin (Tables B.3) may inclsome repeat/review/appeal applications.
Comments on countries of asylum:France: From 2003 on, data include unaccompanied minors.United Kingdom: Prior to 2003, data by nationality refer to the number of cases, and not persons. All figures are rounded to the nearest multiple of 5.United States: Data for 2004-10 are a combination of the United States Citizenship and Immigration Service (USCIS – number of cases) affirmative asylum applicand of the Executive Office for Immigration Review (EOIR – number of persons) defensive asylum applications, if the person is under threat of removal.
Comments on countries of origin:Serbia (and Kosovo): Data may include asylum-seekers from Serbia, Montenegro, Serbia and Montenegro, and/or Former Yugoslavia.
Sources for all countries: Governments, compiled by the United Nations High Commissioner for Refugees, Population Datawww.unhcr.org/statistics.
INTERNATIONAL MIGRATION OUTLOOK 2014 © OECD 2014360

STATISTICAL ANNEX
Stocks of foreign and foreign-born populations
Who is an immigrant?
There are major differences in how immigrants are defined across OECD countries.Some countries have traditionally focused on producing data on foreign residents(European countries, Japan and Korea) whilst others refer to the foreign-born (settlementcountries, i.e. Australia, Canada, New Zealand and the United States). This difference infocus relates in part to the nature and history of immigration systems and legislation oncitizenship and naturalisation.
The foreign-born population can be viewed as representing first-generation migrants, andmay consist of both foreign and national citizens. The size and composition of theforeign-born population is influenced by the history of migration flows and mortality amongstthe foreign-born. For example, where inflows have been declining over time, the stock of theforeign-born will tend to age and represent an increasingly established community.
The concept of foreign population may include persons born abroad who retained thenationality of their country of origin but also second and third generations born in the hostcountry. The characteristics of the population of foreign nationals depend on a number offactors: the history of migration flows, natural increase in the foreign population andnaturalisations. Both the nature of legislation on citizenship and the incentives tonaturalise play a role in determining the extent to which native-born persons may or maynot be foreign nationals.
Sources for and problems in measuring the immigrant population
Four types of sources are used: population registers, residence permits, labour forcesurveys and censuses. In countries which have a population register and in those whichuse residence permit data, stocks and flows of immigrants are most often calculated usingthe same source. There are exceptions, however, with some countries using census orlabour force survey data to estimate the stock of the immigrant population. In studyingstocks and flows, the same problems are encountered whether population register orpermit data are used (in particular, the risk of underestimation when minors are registeredon the permit of one of the parents or if the migrants are not required to have permitsbecause of a free movement agreement). To this must be added the difficulty of purging thefiles regularly to remove the records of persons who have left the country.
Census data enable comprehensive, albeit infrequent analysis of the stock of immigrants(censuses are generally conducted every five to ten years). In addition, many labour forcesurveys now include questions about nationality and place of birth, thus providing asource of annual stock data. The OECD produces estimates of stocks for some countries.
Some care has to be taken with detailed breakdowns of the immigrant population fromsurvey data since sample sizes can be small. Both census and survey data mayunderestimate the number of immigrants, because they can be missed in the census orbecause they do not live in private households (labour force surveys may not cover thoseliving in collective dwelling such as reception centres and hostels for immigrants). Boththese sources may cover a portion of the unauthorised population, which is by definitionexcluded from population registers and residence permit systems.
INTERNATIONAL MIGRATION OUTLOOK 2014 © OECD 2014 361

STATISTICAL ANNEX
2012
6 208.7
27.3
1 364.8
16.2
1 689.5
15.2
6 920.2
19.8
415.5
2.4
744.1
7.1
456.4
8.2
198.4
14.9
285.5
5.3
7 538.0
11.9
0 918.0
13.3
729.9
6.6
424.2
4.3
35.4
11.0
749.2
16.3
1 834.5
23.2
5 695.9
9.4
226.2
42.6
973.7
0.8
1 927.7
11.5
1 066.3
24.1
663.9
13.2
..
..
..
..
..
..
158.2
2.9
Table A.4. Stocks of foreign-born population in OECD countriesand the Russian Federation
Thousands and percentages
2001 2002 2003 2004 2005 2006 2007 2008 2009 2010 2011
Australia 4 482.1 4 584.9 4 694.3 4 796.6 4 927.1 5 090.1 5 281.4 5 516.9 5 760.3 5 901.2 6 029.1
% of total population 23.3 23.5 23.8 24.1 24.4 24.9 25.4 26.0 26.6 26.8 27.0
Austria 1 112.1 1 137.4 1 141.2 1 154.8 1 195.2 1 215.7 1 235.7 1 260.3 1 275.5 1 294.7 1 323.1
% of total population 13.8 14.1 14.1 14.1 14.5 14.7 14.9 15.1 15.2 15.4 15.7
Belgium 1 112.2 1 151.8 1 185.5 1 220.1 1 268.9 1 319.3 1 380.3 1 443.9 1 503.8 1 628.8 1 643.6
% of total population 10.8 11.1 11.4 11.7 12.1 12.5 13.0 13.5 13.9 14.9 14.9
Canada 5 448.5 5 600.7 5 735.9 5 872.3 6 026.9 6 187.0 6 304.7 6 422.5 6 540.2 6 658.0 6 775.8
% of total population 17.6 17.9 18.1 18.4 18.7 19.0 19.2 19.4 19.6 19.5 19.6
Chile .. 184.5 223.0 235.5 247.4 258.8 290.9 317.1 352.3 369.4 388.2
% of total population .. 1.2 1.4 1.5 1.5 1.6 1.8 1.9 2.1 2.2 2.3
Czech Republic 448.5 471.9 482.2 499.0 523.4 566.3 636.1 679.6 672.0 661.2 745.2
% of total population 4.4 4.6 4.7 4.9 5.1 5.5 6.2 6.5 6.4 6.3 7.1
Denmark 321.8 331.5 337.8 343.4 350.4 360.9 378.7 401.8 414.4 428.9 441.5
% of total population 6.0 6.2 6.3 6.4 6.5 6.6 6.9 7.3 7.5 7.7 7.9
Estonia 245.3 242.5 239.3 235.5 228.6 226.5 224.3 221.9 217.9 212.7 210.8
% of total population 17.9 17.7 17.6 17.4 16.9 16.8 16.7 16.6 16.3 15.9 15.8
Finland 145.1 152.1 158.9 166.4 176.6 187.9 202.5 218.6 233.2 248.1 266.1
% of total population 2.8 2.9 3.0 3.2 3.4 3.6 3.8 4.1 4.4 4.6 4.9
France 6 260.6 6 421.2 6 587.6 6 748.9 6 910.1 7 017.2 7 129.3 7 202.1 7 287.8 7 358.2 7 462.0
% of total population 10.5 10.7 10.9 11.1 11.3 11.4 11.5 11.6 11.6 11.7 11.8
Germany .. .. .. .. 10 399.0 10 431.0 10 529.0 10 623.0 10 601.0 10 591.0 10 689.0 1
% of total population .. .. .. .. 12.6 12.7 12.8 12.9 12.9 13.0 13.1
Greece 1 122.9 .. .. .. .. .. .. .. .. 828.4 750.7
% of total population 10.3 .. .. .. .. .. .. .. .. 7.4 6.7
Hungary 300.1 302.8 307.8 319.0 331.5 344.6 381.8 394.2 407.3 451.4 473.3
% of total population 2.9 3.0 3.0 3.2 3.3 3.4 3.8 3.9 4.1 4.5 4.7
Iceland 18.3 19.1 19.5 20.7 24.7 30.4 35.9 37.6 35.1 34.7 34.7
% of total population 6.4 6.6 6.8 7.1 8.3 10.0 11.5 11.8 11.0 10.9 10.9
Ireland 356.0 390.0 426.5 461.8 520.8 601.7 693.9 750.9 766.3 754.2 752.5
% of total population 9.2 9.9 10.7 11.4 12.6 14.2 15.7 16.7 17.2 16.9 16.4
Israel 1 978.0 1 983.0 1 975.0 1 961.0 1 948.0 1 930.0 1 916.0 1 899.0 1 878.0 1 869.0 1 850.0
% of total population 30.7 30.2 29.5 28.8 28.1 27.4 26.7 26.0 25.1 24.5 23.8
Italy .. .. .. .. .. .. .. 4 375.2 4 798.7 5 350.4 5 457.8
% of total population .. .. .. .. .. .. .. 7.4 8.0 8.9 9.0
Luxembourg 144.8 147.8 154.9 160.4 168.3 175.4 183.7 194.5 197.2 205.2 215.3
% of total population 32.8 33.1 34.4 35.3 36.5 37.4 38.6 40.2 40.0 40.9 41.5
Mexico .. .. .. .. 584.5 610.1 699.3 733.7 850.1 961.1 967.2
% of total population .. .. .. .. 0.5 0.6 0.6 0.7 0.8 0.8 0.8
Netherlands 1 674.6 1 714.2 1 731.8 1 736.1 1 734.7 1 732.4 1 751.0 1 793.7 1 832.5 1 868.7 1 906.3
% of total population 10.4 10.6 10.7 10.7 10.6 10.6 10.7 10.9 11.1 11.2 11.4
New Zealand 698.6 737.1 770.5 796.7 840.6 879.5 915.0 950.0 981.3 1 013.0 1 040.7
% of total population 18.0 18.7 19.1 19.5 20.3 21.0 21.6 22.3 22.7 23.2 23.6
Norway 315.1 333.9 347.3 361.1 380.4 405.1 445.4 488.8 526.8 569.1 616.3
% of total population 7.0 7.4 7.6 7.9 8.2 8.7 9.5 10.3 10.9 11.6 12.4
Poland 775.3 776.2 .. .. .. .. .. .. .. .. 674.9
% of total population 2.0 2.0 .. .. .. .. .. .. .. .. 1.8
Portugal 651.5 719.4 745.6 774.8 742.1 753.0 769.6 790.3 834.8 851.5 871.8
% of total population 6.3 6.9 7.1 7.4 7.1 7.2 7.3 7.5 7.9 8.1 8.3
Russian Federation .. 11 976.8 .. .. .. .. .. .. .. 11 194.7 ..
% of total population .. 8.2 .. .. .. .. .. .. .. 7.9 ..
Slovak Republic 119.1 .. .. 207.6 .. .. .. .. .. .. ..
% of total population 2.2 .. .. 3.9 .. .. .. .. .. .. ..
INTERNATIONAL MIGRATION OUTLOOK 2014 © OECD 2014362

STATISTICAL ANNEX
299.7
14.6
6 618.2
14.3
1 473.3
15.5
2 218.4
27.7
7 588.0
11.9
0 738.2
13.0
158425
2012
Slovenia .. 170.0 .. .. .. .. .. .. .. 228.6 230.1
% of total population .. 8.5 .. .. .. .. .. .. .. 11.2 11.2
Spain 2 594.1 3 302.4 3 693.8 4 391.5 4 837.6 5 250.0 6 044.5 6 466.3 6 604.2 6 677.8 6 737.9
% of total population 6.4 8.0 8.8 10.3 11.1 11.9 13.5 14.2 14.4 14.5 14.6
Sweden 1 028.0 1 053.5 1 078.1 1 100.3 1 125.8 1 175.2 1 227.8 1 281.6 1 338.0 1 384.9 1 427.3
% of total population 11.6 11.8 12.0 12.2 12.5 12.9 13.4 13.9 14.4 14.8 15.1
Switzerland 1 613.8 1 658.7 1 697.8 1 737.7 1 772.8 1 811.2 1 882.6 1 974.2 2 037.5 2 075.2 2 158.4
% of total population 22.3 22.8 23.1 23.5 23.8 24.2 24.9 25.8 26.3 26.6 27.3
United Kingdom 4 865.0 5 000.0 5 143.0 5 338.0 5 557.0 5 757.0 6 192.0 6 633.0 6 899.0 7 056.0 7 430.0
% of total population 8.2 8.4 8.6 8.9 9.4 9.6 10.3 11.0 11.3 11.5 11.7
United States 31 548.1 33 096.2 33 667.7 34 257.7 35 769.6 37 469.4 38 048.5 38 016.1 38 452.8 39 916.9 40 381.6 4
% of total population 11.1 11.5 11.6 11.7 12.1 12.6 12.6 12.5 12.5 12.9 13.0
Notes: For details on definitions and sources, refer to the metadata at the end of Tables B.4.Estimates are in italic.Information on data for Israel: http://dx.doi.org/10.1787/888932315602.
1 2 http://dx.doi.org/10.1787/888933
Table A.4. Stocks of foreign-born population in OECD countriesand the Russian Federation (cont.)
Thousands and percentages
2001 2002 2003 2004 2005 2006 2007 2008 2009 2010 2011
INTERNATIONAL MIGRATION OUTLOOK 2014 © OECD 2014 363

STATISTICAL ANNEX
f which:omen11 (%)
49
49
55
43
53
63
48
50
54
52
51
49
52
48
48
50
158471
f which:omen12 (%)
54
47
50
53
56
53
55
63
54
65
58
49
47
57
57
52
158471
Table B.4. Stock of foreign-born population by country of birthThousandsAUSTRALIA
2002 2003 2004 2005 2006 2007 2008 2009 2010 2011 2012OW
20
United Kingdom 1 120.0 1 118.5 1 120.8 1 125.7 1 141.0 1 154.8 1 169.2 1 180.2 1 182.5 1 180.2 1 211.4
New Zealand 407.4 414.9 419.9 430.0 445.1 467.8 497.4 521.9 538.3 564.9 576.7
China 174.2 192.2 210.6 233.8 259.2 285.1 319.4 350.8 377.0 391.1 402.3
India 114.5 126.4 140.6 157.9 180.1 215.6 263.3 321.2 343.2 343.1 354.2
Viet Nam 172.4 176.3 178.8 181.5 185.5 189.8 196.3 204.4 210.1 212.1 211.2
Philippines 116.3 121.3 126.6 132.6 140.0 148.5 159.4 170.5 178.6 183.0 204.4
Italy 236.5 234.2 231.9 229.7 227.3 223.6 219.2 215.5 211.5 209.8 200.0
South Africa 95.4 101.8 108.9 114.7 120.3 127.6 137.3 149.0 153.6 157.6 168.2
Malaysia 90.0 94.0 98.7 102.6 107.1 112.6 119.2 125.2 130.0 137.7 140.3
Germany 118.7 120.0 121.3 122.6 124.4 125.2 125.5 125.2 124.8 126.1 125.8
Greece 132.7 133.0 133.1 133.3 133.4 131.6 129.5 127.5 125.6 123.9 121.0
Sri Lanka 61.5 64.0 65.7 68.5 71.7 76.4 82.5 88.4 92.4 94.1 103.6
United States 61.1 63.6 65.8 68.8 72.9 76.7 78.2 79.4 82.2 86.7 96.3
Lebanon 81.2 83.0 84.0 85.3 86.5 87.9 88.8 89.1 89.3 89.5 90.8
Ireland 56.2 56.8 57.5 58.3 59.5 61.0 64.7 70.6 73.5 76.6 90.0
Other countries 1 542.8 1 588.3 1 625.1 1 672.2 1 725.0 1 781.7 1 846.4 1 919.3 1 968.7 2 029.1 2 112.9
Total 4 584.9 4 694.3 4 796.6 4 927.1 5 090.1 5 281.4 5 516.9 5 760.3 5 901.2 6 029.1 6 208.7
Note: For details on definitions and sources, please refer to the metadata at the end of the tables.1 2 http://dx.doi.org/10.1787/888933
Table B.4. Stock of foreign-born population by country of birthThousandsAUSTRIA
2002 2003 2004 2005 2006 2007 2008 2009 2010 2011 2012OW
20
Germany 142.7 148.1 155.5 163.0 169.8 178.7 186.2 191.2 196.9 201.4 205.9
Turkey 135.2 142.7 147.9 152.5 154.1 155.1 156.6 157.8 158.5 158.7 159.2
Bosnia and Herzegovina 122.7 125.8 128.8 131.2 132.1 149.4 149.9 149.6 149.7 150.5 151.7
Serbia 170.0 175.2 181.5 187.7 188.5 133.7 132.8 131.9 132.4 131.7 132.4
Romania 42.0 44.7 46.6 47.8 48.2 53.0 57.0 60.0 64.5 69.1 73.9
Poland 42.0 43.1 47.8 51.8 54.2 56.4 57.1 57.0 57.8 60.5 63.2
Hungary 31.2 31.6 32.5 33.2 33.9 34.7 36.2 37.6 39.3 42.6 48.1
Czech Republic 55.4 54.6 54.2 52.9 51.5 47.8 46.4 45.0 43.6 42.5 41.6
Croatia 34.0 34.5 35.0 35.2 35.1 40.3 40.0 39.7 39.3 39.1 39.0
Slovak Republic 13.9 14.9 16.8 18.3 19.3 22.5 24.5 25.3 26.0 27.7 30.0
Russian Federation 9.1 12.1 18.0 21.2 22.8 23.5 25.1 25.9 26.4 27.5 29.4
Italy 25.6 25.8 25.9 25.7 25.5 25.1 25.0 25.0 25.2 25.3 26.2
Former Yugoslav Republic of Macedonia 14.3 15.4 16.4 17.3 17.6 20.0 20.5 20.7 21.1 21.3 21.7
Slovenia 16.6 16.4 16.4 16.2 16.0 19.2 19.0 18.7 18.4 18.5 18.9
Bulgaria 8.5 9.3 9.9 10.2 10.3 11.5 12.7 13.5 14.6 15.7 17.0
Other countries 274.2 247.1 221.5 230.9 236.7 264.7 271.4 276.6 280.9 290.9 306.5
Total 1 137.4 1 141.2 1 154.8 1 195.2 1 215.7 1 235.7 1 260.3 1 275.5 1 294.7 1 323.1 1 364.8
Note: For details on definitions and sources, please refer to the metadata at the end of the tables.1 2 http://dx.doi.org/10.1787/888933
INTERNATIONAL MIGRATION OUTLOOK 2014 © OECD 2014364

STATISTICAL ANNEX
f which:omen12 (%)
48
55
50
49
48
55
54
57
48
61
54
50
49
43
50
51
158471
f which:omen11 (%)
50
55
52
58
56
49
53
53
49
53
55
51
50
58
49
52
158471
Table B.4. Stock of foreign-born population by country of birthThousandsBELGIUM
2002 2003 2004 2005 2006 2007 2008 2009 2010 2011 2012OW
20
Morocco 126.5 134.2 141.3 147.9 155.1 162.6 170.2 178.9 189.1 197.1 201.7
France 152.5 153.0 154.2 156.2 159.3 164.6 169.0 171.3 175.0 177.0 179.2
Netherlands 101.3 104.4 107.7 111.6 115.8 120.4 123.8 124.8 126.4 127.0 127.5
Italy 130.5 128.7 126.7 125.1 123.6 122.2 121.4 120.5 120.2 119.7 119.6
Turkey 78.6 78.6 81.0 83.8 86.4 89.0 91.4 93.6 97.0 97.4 97.8
Germany 80.1 83.3 83.5 83.6 83.6 83.8 84.2 84.1 84.2 83.8 83.1
Democratic Republic of the Congo 52.7 53.8 66.8 68.5 70.5 72.4 74.2 76.2 81.3 80.0 80.8
Poland 21.9 23.0 25.2 29.0 33.7 40.5 45.5 51.7 57.7 63.1 67.9
Romania 8.7 9.5 10.6 12.6 15.3 20.4 26.2 30.6 37.7 45.0 52.7
Russian Federation .. 14.6 17.6 25.1 29.8 30.8 34.5 39.0 51.1 46.7 47.7
Spain 36.6 36.2 35.7 35.5 35.4 35.5 36.1 37.0 38.8 40.5 42.9
Former Yugoslavia 23.6 25.8 27.9 30.3 .. .. .. .. .. 41.0 41.1
Portugal 21.7 22.3 22.8 23.3 24.0 25.0 26.5 27.5 28.3 29.5 31.6
Algeria 16.0 17.0 17.7 18.5 19.4 20.3 21.2 22.4 24.3 24.6 25.0
Bulgaria .. .. .. .. .. 8.2 11.7 14.4 18.7 21.0 23.9
Other countries 301.1 300.9 301.2 318.0 367.3 384.8 408.0 431.9 499.0 450.2 467.1
Total 1 151.8 1 185.5 1 220.1 1 268.9 1 319.3 1 380.3 1 443.9 1 503.8 1 628.8 1 643.6 1 689.5
Note: For details on definitions and sources, please refer to the metadata at the end of the tables.1 2 http://dx.doi.org/10.1787/888933
Table B.4. Stock of foreign-born population by country of birthThousandsCANADA
2002 2003 2004 2005 2006 2007 2008 2009 2010 2011 2012OW
20
India .. .. .. .. 443.7 .. .. .. .. 547.9 ..
China .. .. .. .. 466.9 .. .. .. .. 545.5 ..
United Kingdom .. .. .. .. 579.6 .. .. .. .. 537.0 ..
Philippines .. .. .. .. 303.2 .. .. .. .. 454.3 ..
United States .. .. .. .. 250.5 .. .. .. .. 263.5 ..
Italy .. .. .. .. 296.9 .. .. .. .. 256.8 ..
Hong Kong, China .. .. .. .. 215.4 .. .. .. .. 205.4 ..
Viet Nam .. .. .. .. 160.2 .. .. .. .. 165.1 ..
Pakistan .. .. .. .. 133.3 .. .. .. .. 156.9 ..
Germany .. .. .. .. 171.4 .. .. .. .. 152.3 ..
Poland .. .. .. .. 170.5 .. .. .. .. 152.3 ..
Portugal .. .. .. .. 150.4 .. .. .. .. 138.5 ..
Sri Lanka .. .. .. .. 105.7 .. .. .. .. 132.1 ..
Jamaica .. .. .. .. 123.4 .. .. .. .. 126.0 ..
Iran .. .. .. .. 92.1 .. .. .. .. 120.7 ..
Other countries .. .. .. .. 2 523.8 .. .. .. .. 2 821.2 ..
Total .. .. .. .. 6 187.0 .. .. .. .. 6 775.8 ..
Note: For details on definitions and sources, please refer to the metadata at the end of the tables.1 2 http://dx.doi.org/10.1787/888933
INTERNATIONAL MIGRATION OUTLOOK 2014 © OECD 2014 365

STATISTICAL ANNEX
f which:omen12 (%)
57
49
54
55
59
46
55
46
50
47
53
158471
f which:omen11 (%)
53
45
40
57
62
32
51
38
39
45
51
59
45
57
24
48
158471
Table B.4. Stock of foreign-born population by country of birthThousands
CHILE
2002 2003 2004 2005 2006 2007 2008 2009 2010 2011 2012OW
20
Peru 37.9 49.1 53.7 58.4 66.1 83.4 107.6 130.9 138.5 146.6 157.7
Argentina 48.2 50.0 51.9 53.8 57.7 59.7 59.2 60.6 61.9 63.2 64.9
Bolivia 10.9 12.4 13.0 13.5 14.7 20.2 22.2 24.1 25.1 26.7 30.5
Ecuador 9.4 9.9 10.9 11.8 13.3 14.7 17.5 19.1 20.0 20.9 21.9
Colombia 4.1 4.5 5.5 6.6 7.7 9.2 10.9 12.9 14.4 16.1 19.1
Spain 9.1 .. .. .. .. .. .. 11.0 11.3 11.6 12.1
Brazil 6.9 .. .. .. .. .. .. 9.6 10.1 10.5 11.2
United States 7.8 .. .. .. .. .. .. 9.7 10.0 10.4 10.9
Germany 5.5 .. .. .. .. .. .. 6.5 6.7 6.9 7.1
China 1.7 .. .. .. .. .. .. 4.6 5.2 5.9 6.6
Other countries 42.3 97.1 100.5 103.3 99.3 103.8 99.8 63.2 66.2 69.4 73.5
Total 184.5 223.0 235.5 247.4 258.8 290.9 317.1 352.3 369.4 388.2 415.5
Note: For details on definitions and sources, please refer to the metadata at the end of the tables.1 2 http://dx.doi.org/10.1787/888933
Table B.4. Stock of foreign-born population by country of birthThousands
CZECH REPUBLIC
2002 2003 2004 2005 2006 2007 2008 2009 2010 2011 2012OW
20
Slovak Republic .. .. .. .. .. .. .. .. .. 289.6 ..
Ukraine .. .. .. .. .. .. .. .. .. 138.0 ..
Viet Nam .. .. .. .. .. .. .. .. .. 52.4 ..
Russian Federation .. .. .. .. .. .. .. .. .. 35.7 ..
Poland .. .. .. .. .. .. .. .. .. 26.0 ..
Germany .. .. .. .. .. .. .. .. .. 16.7 ..
Romania .. .. .. .. .. .. .. .. .. 12.8 ..
Moldova .. .. .. .. .. .. .. .. .. 9.4 ..
Bulgaria .. .. .. .. .. .. .. .. .. 9.2 ..
United States .. .. .. .. .. .. .. .. .. 7.0 ..
Kazakhstan .. .. .. .. .. .. .. .. .. 6.7 ..
Mongolia .. .. .. .. .. .. .. .. .. 5.6 ..
China .. .. .. .. .. .. .. .. .. 4.9 ..
Hungary .. .. .. .. .. .. .. .. .. 4.8 ..
United Kingdom .. .. .. .. .. .. .. .. .. 4.8 ..
Other countries .. .. .. .. .. .. .. .. .. 121.7 ..
Total .. .. .. .. .. .. .. .. .. 745.2 ..
Note: For details on definitions and sources, please refer to the metadata at the end of the tables.1 2 http://dx.doi.org/10.1787/888933
INTERNATIONAL MIGRATION OUTLOOK 2014 © OECD 2014366

STATISTICAL ANNEX
f which:omen11 (%)
48
51
52
45
50
65
42
63
46
35
45
45
44
50
47
51
158471
f which:omen12 (%)
..
..
..
..
..
..
..
..
..
..
..
..
..
..
..
..
158471
Table B.4. Stock of foreign-born population by country of birthThousandsDENMARK
2002 2003 2004 2005 2006 2007 2008 2009 2010 2011 2012OW
20
Turkey 30.8 30.9 30.9 31.0 31.1 31.4 31.8 32.3 32.5 32.4 32.2
Poland 10.7 10.9 11.3 12.4 14.7 18.5 24.4 25.4 26.6 28.0 29.9
Germany 22.5 22.5 22.6 23.0 23.9 25.8 27.8 28.2 28.5 28.6 28.7
Iraq 19.7 20.7 20.8 20.7 20.7 21.2 21.3 21.3 21.3 21.2 21.2
Bosnia and Herzegovina 18.1 18.2 17.9 17.7 17.6 18.0 18.0 17.9 17.8 17.6 17.4
Norway 13.6 13.9 14.0 14.1 14.2 14.3 14.5 14.7 14.7 14.9 14.9
Iran 11.6 11.7 11.7 11.7 11.8 11.9 11.9 12.1 12.5 12.9 13.3
Sweden 12.3 12.2 12.3 12.5 12.7 12.9 13.2 13.2 13.2 13.1 13.1
Romania 2.1 2.2 2.3 2.5 2.6 3.3 4.6 5.9 7.7 10.1 12.9
United Kingdom 10.6 10.7 10.7 10.8 11.1 11.4 11.8 11.8 12.1 12.2 12.5
Pakistan 10.6 10.7 10.6 10.6 10.5 10.6 10.8 11.2 11.7 12.1 12.3
Lebanon 12.1 12.1 12.1 12.0 12.0 12.0 12.0 12.0 12.1 12.0 12.1
Afghanistan 8.4 9.0 9.4 9.5 9.6 9.6 9.7 10.0 10.6 11.1 11.6
Former Yugoslavia 12.4 12.3 11.9 11.7 11.5 11.5 11.2 12.6 12.3 12.0 10.2
Somalia 12.3 11.8 11.2 10.7 10.4 10.4 10.2 10.1 10.1 10.0 10.2
Other countries 123.6 128.2 133.7 139.6 146.6 155.9 168.4 175.6 185.4 193.3 204.0
Total 331.5 337.8 343.4 350.4 360.9 378.7 401.8 414.4 428.9 441.5 456.4
Note: For details on definitions and sources, please refer to the metadata at the end of the tables.1 2 http://dx.doi.org/10.1787/888933
Table B.4. Stock of foreign-born population by country of birthThousandsESTONIA
2002 2003 2004 2005 2006 2007 2008 2009 2010 2011 2012OW
20
Russian Federation .. .. .. .. .. .. .. .. .. 140.2 ..
Ukraine .. .. .. .. .. .. .. .. .. 21.2 ..
Belarus .. .. .. .. .. .. .. .. .. 11.6 ..
Latvia .. .. .. .. .. .. .. .. .. 3.9 ..
Kazakhstan .. .. .. .. .. .. .. .. .. 3.7 ..
Finland .. .. .. .. .. .. .. .. .. 2.2 ..
Lithuania .. .. .. .. .. .. .. .. .. 1.8 ..
Azerbaijan .. .. .. .. .. .. .. .. .. 1.5 ..
Georgia .. .. .. .. .. .. .. .. .. 1.4 ..
Germany .. .. .. .. .. .. .. .. .. 1.2 ..
Uzbekistan .. .. .. .. .. .. .. .. .. 1.1 ..
Moldova .. .. .. .. .. .. .. .. .. 0.8 ..
Armenia .. .. .. .. .. .. .. .. .. 0.6 ..
United States .. .. .. .. .. .. .. .. .. 0.6 ..
Poland .. .. .. .. .. .. .. .. .. 0.5 ..
Other countries .. .. .. .. .. .. .. .. .. 5.4 ..
Total .. .. .. .. .. .. .. .. .. 197.6 ..
Note: For details on definitions and sources, please refer to the metadata at the end of the tables.1 2 http://dx.doi.org/10.1787/888933
INTERNATIONAL MIGRATION OUTLOOK 2014 © OECD 2014 367

STATISTICAL ANNEX
f which:omen12 (%)
63
51
48
55
48
38
58
79
44
43
28
55
27
42
38
49
158471
f which:omen12 (%)
..
..
..
..
..
..
..
..
..
..
..
..
..
..
..
..
158471
Table B.4. Stock of foreign-born population by country of birthThousandsFINLAND
2002 2003 2004 2005 2006 2007 2008 2009 2010 2011 2012OW
20
Former USSR 36.3 37.3 38.5 40.2 41.9 43.8 45.8 47.3 48.7 50.5 52.3
Estonia 9.5 10.3 11.2 12.6 14.5 16.7 19.2 21.8 25.0 29.5 35.0
Sweden 28.6 28.9 29.2 29.5 29.8 30.2 30.6 31.0 31.2 31.4 31.6
Russian Federation 3.5 3.9 4.3 4.7 5.3 5.9 6.7 7.3 8.0 9.0 10.0
Somalia 4.6 4.7 4.8 5.1 5.3 5.8 6.4 7.1 8.1 8.8 9.1
Iraq 3.8 4.0 4.3 4.4 4.4 4.8 5.3 6.2 7.2 7.9 8.4
China 2.7 3.1 3.5 4.1 4.6 5.3 6.0 6.6 7.0 7.7 8.3
Thailand 2.4 2.8 3.1 3.6 4.1 4.8 5.4 6.1 6.7 7.4 8.1
Former Yugoslavia 4.6 4.7 4.9 5.0 5.2 5.5 5.8 6.1 6.3 6.4 6.5
Germany 3.9 4.1 4.3 4.6 4.9 5.3 5.6 5.8 5.9 6.1 6.2
Turkey 2.6 2.9 3.1 3.4 3.7 4.1 4.5 4.9 5.1 5.4 5.7
Viet Nam 3.0 3.0 3.1 3.3 3.4 3.7 4.0 4.3 4.5 4.8 5.2
United Kingdom 3.1 3.2 3.4 3.5 3.7 4.0 4.2 4.4 4.5 4.8 5.1
Iran 2.5 2.7 3.0 3.2 3.4 3.6 3.8 3.9 4.1 4.4 4.9
India 1.5 1.6 1.8 2.1 2.5 2.8 3.2 3.6 4.0 4.3 4.6
Other countries 39.5 41.7 44.0 47.4 51.1 56.4 62.2 66.9 71.8 77.8 84.5
Total 152.1 158.9 166.4 176.6 187.9 202.5 218.6 233.2 248.1 266.1 285.5
Note: For details on definitions and sources, please refer to the metadata at the end of the tables.1 2 http://dx.doi.org/10.1787/888933
Table B.4. Stock of foreign-born population by country of birthThousands
FRANCE
2002 2003 2004 2005 2006 2007 2008 2009 2010 2011 2012OW
20
Algeria .. .. .. 1 356.6 1 359.3 1 366.5 1 361.0 1 364.5 .. .. ..
Morocco .. .. .. 846.9 859.0 870.9 881.3 888.0 .. .. ..
Portugal .. .. .. 592.0 598.0 604.7 608.6 614.2 .. .. ..
Tunisia .. .. .. 365.8 368.5 370.6 370.7 374.7 .. .. ..
Italy .. .. .. 372.3 364.4 357.0 350.2 343.3 .. .. ..
Spain .. .. .. 307.0 300.0 295.9 290.3 286.2 .. .. ..
Turkey .. .. .. 237.4 243.4 246.8 251.1 255.8 .. .. ..
Germany .. .. .. 225.6 224.6 223.5 221.7 219.0 .. .. ..
United Kingdom .. .. .. 148.8 158.0 164.0 166.8 169.1 .. .. ..
Belgium .. .. .. 139.0 140.5 143.6 145.8 146.9 .. .. ..
Viet Nam .. .. .. 119.6 119.8 120.1 119.7 118.9 .. .. ..
Madagascar .. .. .. 108.5 110.7 112.5 114.5 115.8 .. .. ..
Senegal .. .. .. 103.3 106.1 108.3 112.1 114.0 .. .. ..
Poland .. .. .. 101.6 101.7 102.6 102.9 102.4 .. .. ..
China .. .. .. 75.4 80.3 85.3 90.2 95.4 .. .. ..
Other countries .. .. .. 1 810.3 1 882.9 1 957.0 2 015.2 2 079.6 .. .. ..
Total .. .. .. 6 910.1 7 017.2 7 129.3 7 202.1 7 287.8 7 358.2 7 462.0 7 538.0
Note: For details on definitions and sources, please refer to the metadata at the end of the tables.1 2 http://dx.doi.org/10.1787/888933
INTERNATIONAL MIGRATION OUTLOOK 2014 © OECD 2014368

STATISTICAL ANNEX
f which:omen12 (%)
495455525438455854524951475148
51
158471
f which:omen11 (%)
48606268565813278555442
295560
51
e is northernrve its
bers oftrol of
158471
Table B.4. Stock of foreign-born population by country of birthThousandsGERMANY
2002 2003 2004 2005 2006 2007 2008 2009 2010 2011 2012OW
20
Turkey .. .. .. 1 472 1 477 1 511 1 508 1 489 1 497 1 491 1 490Poland .. .. .. 719 723 532 508 1 103 1 112 1 137 1 198Russian Federation .. .. .. 1 005 875 513 445 992 977 1 004 991Kazakhstan .. .. .. .. 340 206 140 628 696 747 740Romania .. .. .. 317 318 209 168 386 372 392 438Italy .. .. .. 437 431 431 433 434 420 425 411Greece .. .. .. 233 229 240 232 227 231 227 236Ukraine .. .. .. .. 202 193 181 228 227 233 230Croatia .. .. .. 268 256 251 256 249 226 227 230Serbia .. .. .. .. .. 334 321 209 204 203 216Austria .. .. .. 191 191 194 198 199 197 188 200Bosnia and Herzegovina .. .. .. 237 225 217 207 176 154 155 166Netherlands .. .. .. 107 103 115 123 128 133 143 152Former USSR .. .. .. .. .. 77 56 286 218 142 141Hungary .. .. .. 87 80 94 85 104 102 113 120Other countries .. .. .. 5 326 4 981 5 412 5 762 3 763 3 825 3 862 3 959Total .. .. .. 10 399 10 431 10 529 10 623 10 601 10 591 10 689 10 918
Note: For details on definitions and sources, please refer to the metadata at the end of the tables.1 2 http://dx.doi.org/10.1787/888933
Table B.4. Stock of foreign-born population by country of birthThousands
GREECE
2002 2003 2004 2005 2006 2007 2008 2009 2010 2011 2012OW
20
Albania .. .. .. .. .. .. .. .. 384.6 346.2 357.1Georgia .. .. .. .. .. .. .. .. 62.6 53.0 54.2Russian Federation .. .. .. .. .. .. .. .. 55.7 44.4 37.8Bulgaria .. .. .. .. .. .. .. .. 45.7 43.9 35.0Romania .. .. .. .. .. .. .. .. 32.4 34.9 32.7Germany .. .. .. .. .. .. .. .. 29.3 25.1 21.2Pakistan .. .. .. .. .. .. .. .. 20.1 22.5 24.0Egypt .. .. .. .. .. .. .. .. 10.2 13.6 11.4Ukraine .. .. .. .. .. .. .. .. 13.3 13.5 11.5Cyprus1, 2 .. .. .. .. .. .. .. .. 10.2 12.8 10.3Armenia .. .. .. .. .. .. .. .. 9.1 10.6 9.6Bangladesh .. .. .. .. .. .. .. .. 14.2 10.5 7.5Syria .. .. .. .. .. .. .. .. 7.5 8.2 10.0Poland .. .. .. .. .. .. .. .. 10.8 7.3 9.4United Kingdom .. .. .. .. .. .. .. .. 5.2 7.0 8.8Other countries .. .. .. .. .. .. .. .. 117.5 97.3 89.5Total .. .. .. .. .. .. .. .. 828.4 750.7 729.9
Note: For details on definitions and sources, please refer to the metadata at the end of the tables.1. Note by Turkey: The information in this document with reference to “Cyprus” relates to the southern part of the Island. Ther
single authority representing both Turkish and Greek Cypriot people on the Island. Turkey recognises the Turkish Republic of NoCyprus (TRNC). Until a lasting and equitable solution is found within the context of the United Nations, Turkey shall preseposition concerning the “Cyprus issue”.
2. Note by all the European Union Member States of the OECD and the European Union: The Republic of Cyprus is recognised by all memthe United Nations with the exception of Turkey. The information in this document relates to the area under the effective conthe Government of the Republic of Cyprus.
1 2 http://dx.doi.org/10.1787/888933
INTERNATIONAL MIGRATION OUTLOOK 2014 © OECD 2014 369

STATISTICAL ANNEX
f which:omen12 (%)
52
58
48
48
62
64
46
47
45
47
66
42
36
46
51
51
158471
f which:omen12 (%)
48
51
46
52
61
66
50
40
74
54
53
55
65
37
47
52
158471
Table B.4. Stock of foreign-born population by country of birthThousandsHUNGARY
2002 2003 2004 2005 2006 2007 2008 2009 2010 2011 2012OW
20
Romania 146.5 148.5 152.7 155.4 170.4 196.1 202.2 198.2 201.9 183.1 190.9
Ukraine .. .. .. .. 4.9 4.9 4.6 6.5 13.4 25.5 28.8
Serbia .. .. .. .. 0.1 0.2 0.3 0.3 8.6 24.4 27.4
Germany 15.9 16.3 18.8 21.9 24.5 27.4 28.7 31.3 29.4 25.7 27.3
Slovak Republic .. .. .. .. 2.1 3.0 3.2 3.3 5.7 21.1 21.3
Former USSR 31.0 31.4 32.2 31.9 27.4 28.5 30.1 31.2 30.7 13.1 14.1
China 3.8 3.9 4.2 4.5 4.7 5.0 5.4 5.6 10.9 9.0 9.9
Former Yugoslavia 30.3 30.7 29.9 29.6 28.6 28.5 28.0 33.7 33.2 10.9 8.5
Austria 4.2 4.3 4.7 5.4 6.2 6.9 7.3 7.9 7.8 7.6 8.1
United States 2.4 2.7 3.0 3.4 4.0 4.3 4.6 5.0 6.9 7.0 7.2
Former Czechoslovakia 33.3 33.4 31.4 32.6 30.4 29.6 28.5 28.5 24.1 5.6 5.8
United Kingdom .. .. .. .. 3.2 3.8 4.3 4.8 4.7 4.9 5.6
Italy .. .. .. .. 2.6 3.0 3.3 3.6 3.5 3.4 3.9
France 1.5 1.6 2.2 2.7 3.1 3.6 3.9 4.1 3.6 3.5 3.7
Viet Nam 1.6 1.6 1.6 1.7 1.8 1.9 2.1 2.1 3.3 2.8 3.2
Other countries 32.4 33.5 38.3 42.4 30.4 35.0 37.7 41.1 55.3 55.2 58.5
Total 302.8 307.8 319.0 331.5 344.6 381.8 394.2 407.3 443.3 402.7 424.2
Note: For details on definitions and sources, please refer to the metadata at the end of the tables.1 2 http://dx.doi.org/10.1787/888933
Table B.4. Stock of foreign-born population by country of birthThousandsICELAND
2002 2003 2004 2005 2006 2007 2008 2009 2010 2011 2012OW
20
Poland 2.0 2.0 2.2 3.6 6.6 10.5 11.6 10.1 9.5 9.3 9.4
Denmark 2.5 2.5 2.6 2.7 2.8 2.9 3.0 2.9 2.9 3.0 3.1
United States 1.5 1.5 1.6 1.7 1.8 1.9 1.8 1.9 1.8 1.8 2.0
Sweden 1.7 1.7 1.7 1.8 1.8 1.9 1.9 1.8 1.8 1.9 1.9
Germany 1.3 1.2 1.2 1.5 1.6 1.8 1.8 1.7 1.7 1.6 1.5
Philippines 0.9 1.0 1.1 1.2 1.3 1.3 1.4 1.4 1.4 1.5 1.5
Lithuania 0.3 0.3 0.3 0.5 0.9 1.4 1.6 1.4 1.5 1.4 1.4
United Kingdom 0.8 0.8 0.8 0.9 0.9 1.0 1.1 1.1 1.1 1.2 1.2
Thailand 0.7 0.8 0.8 0.9 1.0 1.0 1.1 1.1 1.1 1.1 1.1
Norway 0.9 0.9 0.9 1.0 1.0 1.0 1.0 1.0 1.0 1.0 1.0
Latvia 0.1 0.1 0.1 0.2 0.3 0.5 0.6 0.6 0.7 0.7 0.7
Viet Nam 0.3 0.4 0.4 0.4 0.4 0.4 0.5 0.5 0.5 0.5 0.6
China 0.2 0.3 0.4 0.8 0.9 0.6 0.5 0.5 0.5 0.5 0.5
Portugal 0.1 0.1 0.3 0.4 0.7 0.9 0.8 0.6 0.5 0.4 0.5
France 0.3 0.3 0.3 0.3 0.3 0.4 0.4 0.4 0.5 0.5 0.4
Other countries 5.5 5.7 6.1 6.8 7.8 8.3 8.5 8.1 8.1 8.3 8.6
Total 19.1 19.5 20.7 24.7 30.4 35.9 37.6 35.1 34.7 34.7 35.4
Note: For details on definitions and sources, please refer to the metadata at the end of the tables.1 2 http://dx.doi.org/10.1787/888933
INTERNATIONAL MIGRATION OUTLOOK 2014 © OECD 2014370

STATISTICAL ANNEX
f which:omen11 (%)
51
48
52
54
56
54
49
46
58
55
52
47
50
50
35
50
158471
f which:omen11 (%)
55
53
56
51
50
53
51
56
55
52
54
56
53
53
57
54
158471
Table B.4. Stock of foreign-born population by country of birthThousandsIRELAND
2002 2003 2004 2005 2006 2007 2008 2009 2010 2011 2012OW
20
United Kingdom 242.2 .. .. .. 266.1 .. .. .. .. 281.1 ..
Poland 2.1 .. .. .. 62.5 .. .. .. .. 114.3 ..
Lithuania 2.1 .. .. .. 24.6 .. .. .. .. 34.6 ..
United States 21.0 .. .. .. 24.6 .. .. .. .. 26.9 ..
Latvia 2.2 .. .. .. 13.9 .. .. .. .. 19.8 ..
Nigeria 8.9 .. .. .. 16.3 .. .. .. .. 19.4 ..
Romania 5.8 .. .. .. 8.5 .. .. .. .. 17.8 ..
India 3.3 .. .. .. 9.2 .. .. .. .. 17.7 ..
Philippines 3.9 .. .. .. 9.4 .. .. .. .. 13.6 ..
Germany 8.5 .. .. .. 11.5 .. .. .. .. 12.7 ..
China 5.6 .. .. .. 11.0 .. .. .. .. 11.3 ..
Slovak Republic .. .. .. .. 8.1 .. .. .. .. 10.6 ..
France 6.7 .. .. .. 9.1 .. .. .. .. 9.9 ..
Brazil 1.2 .. .. .. 4.7 .. .. .. .. 9.2 ..
Pakistan 3.3 .. .. .. 5.8 .. .. .. .. 8.2 ..
Other countries 73.2 .. .. .. 116.3 .. .. .. .. 145.4 ..
Total 390.0 .. .. .. 601.7 .. .. .. .. 752.5 ..
Note: For details on definitions and sources, please refer to the metadata at the end of the tables.1 2 http://dx.doi.org/10.1787/888933
Table B.4. Stock of foreign-born population by country of birthThousands
ISRAEL
2002 2003 2004 2005 2006 2007 2008 2009 2010 2011 2012OW
20
Former USSR 951.6 946.9 941.0 935.1 929.1 921.7 913.8 877.5 875.5 867.0 ..
Morocco 161.9 159.7 157.5 155.4 153.2 150.7 148.5 154.7 152.0 149.6 ..
Romania 117.3 113.8 110.4 106.9 103.7 100.2 96.9 96.4 93.1 90.0 ..
United States .. .. .. .. .. .. .. .. 82.7 84.8 ..
Ethiopia 63.0 65.8 69.4 72.8 76.1 79.4 80.8 77.4 78.9 81.9 ..
Iraq 73.0 71.4 69.9 68.3 66.7 65.1 63.5 63.7 61.8 60.0 ..
Iran 50.5 49.9 49.4 48.8 48.2 47.6 46.8 49.8 48.9 48.1 ..
Poland 72.5 68.3 64.4 60.6 57.0 53.4 50.1 54.0 50.7 48.0 ..
France 30.1 31.4 33.2 35.4 37.6 39.6 40.9 41.4 42.9 43.5 ..
Argentina 38.6 39.5 38.9 38.2 37.7 37.2 36.7 37.6 37.5 37.6 ..
Tunisia .. .. .. .. .. .. .. .. 29.9 29.2 ..
Yemen 34.6 33.7 32.7 31.8 30.8 29.9 28.9 28.9 27.9 26.9 ..
Turkey 29.6 28.9 28.2 27.5 26.9 26.2 25.6 26.1 25.6 24.9 ..
United Kingdom 19.2 19.4 19.8 20.3 21.1 21.7 22.2 21.8 22.5 23.0 ..
Germany .. .. .. .. .. .. .. .. 21.4 20.7 ..
Other countries 341.1 346.3 346.2 346.8 341.9 343.3 344.3 348.8 217.7 214.8 ..
Total 1 983.0 1 975.0 1 961.0 1 948.0 1 930.0 1 916.0 1 899.0 1 878.0 1 869.0 1 850.0 1 834.5
Note: For details on definitions and sources, please refer to the metadata at the end of the tables.Information on data for Israel: http://dx.doi.org/10.1787/888932315602.
1 2 http://dx.doi.org/10.1787/888933
INTERNATIONAL MIGRATION OUTLOOK 2014 © OECD 2014 371

STATISTICAL ANNEX
f which:omen12 (%)
57
48
43
57
79
54
49
67
60
61
39
75
62
36
63
54
158471
f which:omen10 (%)
48
49
47
55
43
53
49
44
47
53
59
50
64
54
63
50
158471
Table B.4. Stock of foreign-born population by country of birthThousands
ITALY
2002 2003 2004 2005 2006 2007 2008 2009 2010 2011 2012OW
20
Romania .. .. .. .. .. .. 678.5 847.5 904.0 953.9 1 000.1
Albania .. .. .. .. .. .. 418.9 482.4 421.4 425.5 432.7
Morocco .. .. .. .. .. .. 277.0 355.9 392.1 402.3 409.6
Germany .. .. .. .. .. .. .. 209.2 225.9 218.2 220.0
Ukraine .. .. .. .. .. .. 138.8 149.9 191.9 201.8 210.0
Switzerland .. .. .. .. .. .. .. .. .. 195.9 191.5
China .. .. .. .. .. .. 89.7 92.5 164.5 175.0 191.3
Moldova .. .. .. .. .. .. 83.6 108.4 132.1 143.2 157.1
France .. .. .. .. .. .. .. .. 140.4 138.7 136.7
Philippines .. .. .. .. .. .. 121.0 120.0 118.2 122.8 135.4
India .. .. .. .. .. .. 107.0 115.9 110.7 113.8 126.8
Poland .. .. .. .. .. .. 100.3 122.5 122.5 121.3 122.7
Peru .. .. .. .. .. .. 98.5 94.0 102.0 107.1 113.0
Tunisia .. .. .. .. .. .. 85.2 83.2 108.3 109.4 110.7
Brazil .. .. .. .. .. .. .. 72.7 107.7 107.8 108.9
Other countries .. .. .. .. .. .. 2 177.0 1 944.5 2 108.7 1 921.2 2 029.3
Total .. .. .. .. .. .. 4 375.2 4 798.7 5 350.4 5 457.8 5 695.9
Note: For details on definitions and sources, please refer to the metadata at the end of the tables.1 2 http://dx.doi.org/10.1787/888933
Table B.4. Stock of foreign-born population by country of birthThousands
LUXEMBOURG
2002 2003 2004 2005 2006 2007 2008 2009 2010 2011 2012OW
20
Portugal .. .. .. .. .. .. .. .. 60.9 .. ..
France .. .. .. .. .. .. .. .. 28.1 .. ..
Belgium .. .. .. .. .. .. .. .. 16.8 .. ..
Germany .. .. .. .. .. .. .. .. 14.8 .. ..
Italy .. .. .. .. .. .. .. .. 13.2 .. ..
Cape Verde .. .. .. .. .. .. .. .. 4.6 .. ..
Serbia .. .. .. .. .. .. .. .. 4.6 .. ..
United Kingdom .. .. .. .. .. .. .. .. 4.2 .. ..
Netherlands .. .. .. .. .. .. .. .. 3.5 .. ..
Spain .. .. .. .. .. .. .. .. 2.9 .. ..
Poland .. .. .. .. .. .. .. .. 2.9 .. ..
Bosnia and Herzegovina .. .. .. .. .. .. .. .. 2.2 .. ..
Romania .. .. .. .. .. .. .. .. 1.9 .. ..
China .. .. .. .. .. .. .. .. 1.9 .. ..
Brazil .. .. .. .. .. .. .. .. 1.8 .. ..
Other countries .. .. .. .. .. .. .. .. 40.8 .. ..
Total .. .. .. .. .. .. .. .. 205.2 .. ..
Note: For details on definitions and sources, please refer to the metadata at the end of the tables.1 2 http://dx.doi.org/10.1787/888933
INTERNATIONAL MIGRATION OUTLOOK 2014 © OECD 2014372

STATISTICAL ANNEX
f which:omen12 (%)
..
..
..
..
..
..
..
..
..
..
..
..
..
..
..
50
158471
f which:omen12 (%)
48
55
48
56
58
55
52
55
63
56
45
43
46
46
51
52
158471
Table B.4. Stock of foreign-born population by country of birthThousands
MEXICO
2002 2003 2004 2005 2006 2007 2008 2009 2010 2011 2012OW
20
United States .. .. .. .. .. .. .. .. 738.1 .. ..
Guatemala .. .. .. .. .. .. .. .. 35.3 .. ..
Spain .. .. .. .. .. .. .. .. 18.9 .. ..
Colombia .. .. .. .. .. .. .. .. 13.9 .. ..
Argentina .. .. .. .. .. .. .. .. 13.7 .. ..
Cuba .. .. .. .. .. .. .. .. 12.1 .. ..
Honduras .. .. .. .. .. .. .. .. 11.0 .. ..
Venezuela .. .. .. .. .. .. .. .. 10.1 .. ..
El Salvador .. .. .. .. .. .. .. .. 8.1 .. ..
Canada .. .. .. .. .. .. .. .. 7.9 .. ..
France .. .. .. .. .. .. .. .. 7.2 .. ..
China .. .. .. .. .. .. .. .. 6.7 .. ..
Germany .. .. .. .. .. .. .. .. 6.2 .. ..
Peru .. .. .. .. .. .. .. .. 5.9 .. ..
Chile .. .. .. .. .. .. .. .. 5.3 .. ..
Other countries .. .. .. .. .. .. .. .. 60.8 .. ..
Total .. .. .. 584.5 610.1 699.3 733.7 850.1 961.1 967.2 973.7
Note: For details on definitions and sources, please refer to the metadata at the end of the tables.1 2 http://dx.doi.org/10.1787/888933
Table B.4. Stock of foreign-born population by country of birthThousands
NETHERLANDS
2002 2003 2004 2005 2006 2007 2008 2009 2010 2011 2012OW
20
Turkey 190.5 194.6 195.9 196.0 195.4 194.8 195.7 196.7 197.4 197.4 196.5
Suriname 189.0 189.7 190.1 189.2 187.8 187.0 186.7 186.8 186.2 185.5 184.1
Morocco 163.4 166.6 168.5 168.6 168.0 167.2 166.9 167.4 167.7 168.3 168.2
Indonesia 161.4 158.8 156.0 152.8 149.7 146.7 143.7 140.7 137.8 135.1 132.0
Germany 120.6 119.0 117.7 116.9 116.4 117.0 119.2 120.5 122.3 122.8 121.8
Poland 20.1 21.2 25.0 30.0 35.3 42.1 51.1 58.1 66.6 78.2 86.5
Former Yugoslavia 56.2 55.5 54.5 53.7 53.0 52.8 52.7 52.8 52.7 52.7 52.5
Belgium 46.8 47.1 47.1 47.1 47.4 47.9 48.6 49.2 50.0 50.9 51.9
Former USSR 30.8 32.8 34.5 35.3 36.0 37.4 39.4 41.9 45.6 49.2 51.8
China 28.7 31.5 33.5 34.8 35.5 37.1 40.0 42.5 44.7 47.5 49.7
United Kingdom 48.5 48.3 47.5 46.6 45.8 45.8 46.7 47.1 47.2 47.5 47.8
Iraq 35.8 36.0 35.9 35.3 34.8 35.7 38.7 40.9 41.0 40.8 40.6
Afghanistan 31.0 32.1 32.4 32.0 31.3 31.0 30.7 31.1 31.8 32.6 32.8
Iran 24.2 24.2 24.1 23.8 23.8 24.2 24.8 25.4 26.2 27.2 28.0
United States 22.5 22.6 22.6 22.8 23.0 23.3 24.0 24.3 24.9 25.7 26.3
Other countries 544.7 551.9 550.9 549.9 549.3 561.2 584.8 607.1 626.6 644.8 657.1
Total 1 714.2 1 731.8 1 736.1 1 734.7 1 732.4 1 751.0 1 793.7 1 832.5 1 868.7 1 906.3 1 927.7
Note: For details on definitions and sources, please refer to the metadata at the end of the tables.1 2 http://dx.doi.org/10.1787/888933
INTERNATIONAL MIGRATION OUTLOOK 2014 © OECD 2014 373

STATISTICAL ANNEX
f which:omen12 (%)
..
..
..
..
..
..
..
..
..
..
..
..
..
..
..
..
158471
f which:omen12 (%)
34
49
40
47
48
47
44
39
48
78
51
82
66
46
54
48
158471
Table B.4. Stock of foreign-born population by country of birthThousands
NEW ZEALAND
2002 2003 2004 2005 2006 2007 2008 2009 2010 2011 2012OW
20
United Kingdom .. .. .. .. 245.1 .. .. .. .. .. ..
China .. .. .. .. 78.1 .. .. .. .. .. ..
Australia .. .. .. .. 62.7 .. .. .. .. .. ..
Samoa .. .. .. .. 50.6 .. .. .. .. .. ..
India .. .. .. .. 43.3 .. .. .. .. .. ..
South Africa .. .. .. .. 41.7 .. .. .. .. .. ..
Fiji .. .. .. .. 37.7 .. .. .. .. .. ..
Korea .. .. .. .. 28.8 .. .. .. .. .. ..
Netherlands .. .. .. .. 22.1 .. .. .. .. .. ..
Tonga .. .. .. .. 20.5 .. .. .. .. .. ..
United States .. .. .. .. 18.3 .. .. .. .. .. ..
Philippines .. .. .. .. 15.3 .. .. .. .. .. ..
Cook Islands .. .. .. .. 14.7 .. .. .. .. .. ..
Malaysia .. .. .. .. 14.5 .. .. .. .. .. ..
Chinese Taipei .. .. .. .. 10.8 .. .. .. .. .. ..
Other countries .. .. .. .. 175.2 .. .. .. .. .. ..
Total .. .. .. .. 879.5 .. .. .. .. .. ..
Note: For details on definitions and sources, please refer to the metadata at the end of the tables.1 2 http://dx.doi.org/10.1787/888933
Table B.4. Stock of foreign-born population by country of birthThousandsNORWAY
2002 2003 2004 2005 2006 2007 2008 2009 2010 2011 2012OW
20
Poland 6.7 7.0 8.3 11.2 18.0 30.8 42.7 49.5 57.1 67.6 76.9
Sweden 33.0 33.1 33.1 33.9 35.0 36.8 39.4 41.8 44.6 47.0 47.8
Lithuania 0.8 0.9 1.3 1.9 3.0 5.0 7.3 9.9 15.6 22.7 28.6
Germany 12.9 13.5 14.1 15.2 16.7 19.7 23.0 24.9 26.2 27.3 27.8
Denmark 22.3 22.3 22.2 22.3 22.3 22.5 22.6 22.7 22.9 23.3 23.8
Somalia 10.7 12.1 12.8 13.5 14.5 16.0 16.9 18.0 19.4 20.7 23.7
Iraq 14.7 14.9 15.4 16.7 17.4 18.2 19.4 20.6 21.4 22.0 22.1
United Kingdom 14.3 14.3 14.6 14.7 15.1 15.6 16.2 16.9 17.5 18.1 18.6
Pakistan 14.6 14.9 15.2 15.6 15.9 16.2 16.7 17.2 17.6 18.0 18.6
Philippines 7.0 7.5 8.0 8.7 9.6 10.9 12.3 13.5 14.7 16.3 17.8
United States 14.6 14.6 14.5 14.6 14.8 15.2 15.7 16.0 16.3 16.6 17.0
Thailand 5.5 6.3 7.3 8.3 9.3 10.5 11.8 13.1 14.1 15.2 16.4
Russian Federation 6.0 7.5 8.9 10.1 10.9 12.2 13.1 13.8 14.6 15.3 16.2
Iran 10.7 11.3 11.6 11.8 12.0 12.3 12.6 13.1 13.6 14.4 15.1
Viet Nam 11.7 11.9 12.1 12.3 12.5 12.6 12.9 13.0 13.1 13.3 13.5
Other countries 148.5 155.2 161.6 169.6 178.2 190.9 206.2 223.0 240.5 258.7 279.9
Total 333.9 347.3 361.1 380.4 405.1 445.4 488.8 526.8 569.1 616.3 663.9
Note: For details on definitions and sources, please refer to the metadata at the end of the tables.1 2 http://dx.doi.org/10.1787/888933
INTERNATIONAL MIGRATION OUTLOOK 2014 © OECD 2014374

STATISTICAL ANNEX
f which:omen11 (%)
..
..
..
..
..
..
..
..
..
..
..
..
..
..
..
..
158471
f which:omen11 (%)
54
58
54
54
53
44
52
54
49
50
56
57
49
53
48
53
158471
Table B.4. Stock of foreign-born population by country of birthThousands
POLAND
2002 2003 2004 2005 2006 2007 2008 2009 2010 2011 2012OW
20
Ukraine 312.3 .. .. .. .. .. .. .. .. 225.2 ..
Germany 98.2 .. .. .. .. .. .. .. .. 83.9 ..
Belarus 105.2 .. .. .. .. .. .. .. .. 83.0 ..
Lithuania 79.8 .. .. .. .. .. .. .. .. 55.0 ..
Russian Federation .. .. .. .. .. .. .. .. .. 41.1 ..
United Kingdom 2.8 .. .. .. .. .. .. .. .. 38.1 ..
France 0.1 .. .. .. .. .. .. .. .. 28.7 ..
United States .. .. .. .. .. .. .. .. .. 15.2 ..
Italy .. .. .. .. .. .. .. .. .. 11.1 ..
Ireland 0.1 .. .. .. .. .. .. .. .. 8.4 ..
Belgium .. .. .. .. .. .. .. .. .. 5.8 ..
Spain .. .. .. .. .. .. .. .. .. 5.4 ..
Kazakhstan .. .. .. .. .. .. .. .. .. 5.0 ..
Czech Republic .. .. .. .. .. .. .. .. .. 5.0 ..
Austria .. .. .. .. .. .. .. .. .. 4.2 ..
Other countries 177.6 .. .. .. .. .. .. .. .. 60.0 ..
Total 776.2 .. .. .. .. .. .. .. .. 674.9 ..
Note: For details on definitions and sources, please refer to the metadata at the end of the tables.1 2 http://dx.doi.org/10.1787/888933
Table B.4. Stock of foreign-born population by country of birthThousandsPORTUGAL
2002 2003 2004 2005 2006 2007 2008 2009 2010 2011 2012OW
20
Angola .. .. .. .. .. .. .. .. .. 162.6 ..
Brazil .. .. .. .. .. .. .. .. .. 139.7 ..
France .. .. .. .. .. .. .. .. .. 94.5 ..
Mozambique .. .. .. .. .. .. .. .. .. 73.1 ..
Cape Verde .. .. .. .. .. .. .. .. .. 62.0 ..
Guinea-Bissau .. .. .. .. .. .. .. .. .. 29.6 ..
Germany .. .. .. .. .. .. .. .. .. 28.0 ..
Venezuela .. .. .. .. .. .. .. .. .. 25.2 ..
Romania .. .. .. .. .. .. .. .. .. 23.7 ..
United Kingdom .. .. .. .. .. .. .. .. .. 19.1 ..
Sao Tome and Principe .. .. .. .. .. .. .. .. .. 18.6 ..
Spain .. .. .. .. .. .. .. .. .. 16.5 ..
Switzerland .. .. .. .. .. .. .. .. .. 16.5 ..
South Africa .. .. .. .. .. .. .. .. .. 11.5 ..
China .. .. .. .. .. .. .. .. .. 10.9 ..
Other countries .. .. .. .. .. .. .. .. .. 140.5 ..
Total .. .. .. .. .. .. .. .. .. 871.8 ..
Note: For details on definitions and sources, please refer to the metadata at the end of the tables.1 2 http://dx.doi.org/10.1787/888933
INTERNATIONAL MIGRATION OUTLOOK 2014 © OECD 2014 375

STATISTICAL ANNEX
f which:omen12 (%)
54
54
47
44
57
51
44
41
46
47
52
50
53
53
53
51
158471
f which:omen12 (%)
55
56
61
46
46
64
43
49
49
54
65
35
38
40
40
53
158471
Table B.4. Stock of foreign-born population by country of birthThousands
RUSSIAN FEDERATION
2002 2003 2004 2005 2006 2007 2008 2009 2010 2011 2012OW
20
Ukraine 3 560.0 .. .. .. .. .. .. .. 2 942.0 .. ..
Kazakhstan 2 585.0 .. .. .. .. .. .. .. 2 481.9 .. ..
Uzbekistan 918.0 .. .. .. .. .. .. .. 1 111.7 .. ..
Azerbaijan 846.1 .. .. .. .. .. .. .. 743.9 .. ..
Belarus 935.8 .. .. .. .. .. .. .. 740.9 .. ..
Kyrgyzstan 463.5 .. .. .. .. .. .. .. 573.3 .. ..
Armenia 481.3 .. .. .. .. .. .. .. 511.2 .. ..
Tajikistan 383.1 .. .. .. .. .. .. .. 452.2 .. ..
Georgia 629.0 .. .. .. .. .. .. .. 436.4 .. ..
Moldova 277.5 .. .. .. .. .. .. .. 285.3 .. ..
Turkmenistan 175.3 .. .. .. .. .. .. .. 180.0 .. ..
Germany 150.2 .. .. .. .. .. .. .. 137.7 .. ..
Latvia 102.5 .. .. .. .. .. .. .. 86.7 .. ..
Lithuania 86.2 .. .. .. .. .. .. .. 68.9 .. ..
Estonia 67.4 .. .. .. .. .. .. .. 57.0 .. ..
Other countries 316.0 .. .. .. .. .. .. .. 385.8 .. ..
Total 11 976.8 .. .. .. .. .. .. .. 11 194.7 .. ..
Note: For details on definitions and sources, please refer to the metadata at the end of the tables.1 2 http://dx.doi.org/10.1787/888933
Table B.4. Stock of foreign-born population by country of birthThousands
SLOVAK REPUBLIC
2002 2003 2004 2005 2006 2007 2008 2009 2010 2011 2012OW
20
Czech Republic .. .. 107.7 .. .. .. .. .. .. .. 86.4
Hungary .. .. 22.5 .. .. .. .. .. .. .. 16.6
Ukraine .. .. 13.3 .. .. .. .. .. .. .. 9.8
Romania .. .. 4.4 .. .. .. .. .. .. .. 5.3
United Kingdom .. .. 1.8 .. .. .. .. .. .. .. 4.9
Poland .. .. 7.2 .. .. .. .. .. .. .. 4.6
Germany .. .. 4.7 .. .. .. .. .. .. .. 3.0
Austria .. .. 3.9 .. .. .. .. .. .. .. 2.6
United States .. .. 3.5 .. .. .. .. .. .. .. 2.3
France .. .. 3.4 .. .. .. .. .. .. .. 2.3
Russian Federation .. .. 5.8 .. .. .. .. .. .. .. 2.3
Italy .. .. 1.6 .. .. .. .. .. .. .. 1.9
Viet Nam .. .. 2.4 .. .. .. .. .. .. .. 1.6
Serbia .. .. .. .. .. .. .. .. .. .. 1.6
Bulgaria .. .. 1.7 .. .. .. .. .. .. .. 1.3
Other countries .. .. 23.8 .. .. .. .. .. .. .. 11.6
Total .. .. 207.6 .. .. .. .. .. .. .. 158.2
Note: For details on definitions and sources, please refer to the metadata at the end of the tables.1 2 http://dx.doi.org/10.1787/888933
INTERNATIONAL MIGRATION OUTLOOK 2014 © OECD 2014376

STATISTICAL ANNEX
f which:omen12 (%)
40
50
45
39
47
49
50
48
43
51
65
61
45
71
49
47
158471
f which:omen12 (%)
49
42
53
50
58
49
51
51
55
59
52
54
48
61
41
50
158471
Table B.4. Stock of foreign-born population by country of birthThousandsSLOVENIA
2002 2003 2004 2005 2006 2007 2008 2009 2010 2011 2012OW
20
Bosnia and Herzegovina .. .. .. .. .. .. .. .. 96.9 106.8 112.0
Croatia .. .. .. .. .. .. .. .. 49.2 56.6 63.3
Serbia .. .. .. .. .. .. .. .. 29.2 34.7 36.7
Former Yugoslav Republic of Macedonia .. .. .. .. .. .. .. .. 13.7 16.0 17.5
Italy .. .. .. .. .. .. .. .. .. 4.6 8.5
Austria .. .. .. .. .. .. .. .. .. 5.9 8.4
Argentina .. .. .. .. .. .. .. .. .. 0.4 4.6
Switzerland .. .. .. .. .. .. .. .. .. 2.0 3.7
France .. .. .. .. .. .. .. .. .. 1.8 3.6
Canada .. .. .. .. .. .. .. .. .. 0.5 2.4
Serbia and Montenegro .. .. .. .. .. .. .. .. .. 8.0 2.1
Russian Federation .. .. .. .. .. .. .. .. .. 1.3 1.9
United States .. .. .. .. .. .. .. .. .. 0.9 1.9
Ukraine .. .. .. .. .. .. .. .. .. 1.8 1.9
Australia .. .. .. .. .. .. .. .. .. 0.5 1.9
Other countries .. .. .. .. .. .. .. .. 39.7 30.0 29.3
Total 170.0 .. .. .. .. .. .. .. 228.6 271.8 299.7
Note: For details on definitions and sources, please refer to the metadata at the end of the tables.1 2 http://dx.doi.org/10.1787/888933
Table B.4. Stock of foreign-born population by country of birthThousands
SPAIN
2002 2003 2004 2005 2006 2007 2008 2009 2010 2011 2012OW
20
Romania 137.8 206.4 312.1 397.3 511.0 706.2 762.2 784.8 810.3 833.8 800.4
Morocco 438.2 474.5 557.2 606.0 621.3 683.1 737.8 760.2 769.1 779.5 773.8
Ecuador 387.6 470.1 487.2 456.6 434.7 458.4 479.1 484.6 480.6 471.6 455.0
United Kingdom 173.6 187.5 238.2 283.7 322.0 358.3 379.3 390.0 392.9 398.3 383.6
Colombia 259.4 264.5 288.2 287.0 291.7 330.4 358.8 371.1 374.0 375.5 369.6
Argentina 191.7 226.5 260.4 271.4 273.0 290.3 295.4 291.7 286.4 280.3 270.1
Germany 189.4 176.9 193.1 208.9 222.1 237.9 246.7 251.0 251.1 250.9 235.4
France 180.2 178.1 188.7 199.4 208.8 220.2 227.1 229.7 228.1 226.1 221.5
Peru 72.9 88.8 108.0 123.5 137.0 162.4 188.2 197.6 198.1 198.6 195.0
Bolivia 30.6 54.4 99.5 140.7 200.7 240.9 229.4 213.9 202.7 193.6 184.1
China 51.1 62.3 87.0 104.8 108.3 127.0 146.3 154.1 160.8 168.3 170.0
Venezuela 83.5 100.3 116.2 124.9 130.6 144.6 152.4 155.1 159.3 162.1 161.7
Bulgaria 53.4 70.4 93.0 100.8 120.2 150.7 160.0 163.6 165.7 168.1 159.9
Dominican Republic 59.1 65.8 78.0 87.1 96.7 114.7 129.7 136.8 141.2 149.4 155.0
Portugal 71.8 71.1 80.8 93.8 111.6 136.2 148.2 148.8 146.3 143.5 134.0
Other countries 922.1 996.4 1 203.9 1 351.9 1 460.5 1 683.1 1 825.7 1 871.2 1 911.2 1 960.3 1 948.9
Total 3 302.4 3 693.8 4 391.5 4 837.6 5 250.0 6 044.5 6 466.3 6 604.2 6 677.8 6 759.8 6 618.2
Note: For details on definitions and sources, please refer to the metadata at the end of the tables.1 2 http://dx.doi.org/10.1787/888933
INTERNATIONAL MIGRATION OUTLOOK 2014 © OECD 2014 377

STATISTICAL ANNEX
f which:omen12 (%)
60
46
57
50
48
51
53
45
47
49
56
78
50
47
60
51
158471
f which:omen12 (%)
51
44
45
52
47
50
49
61
48
52
47
51
71
47
58
51
158471
Table B.4. Stock of foreign-born population by country of birthThousandsSWEDEN
2002 2003 2004 2005 2006 2007 2008 2009 2010 2011 2012OW
20
Finland 191.5 189.3 186.6 183.7 180.9 178.2 175.1 172.2 169.5 166.7 163.9
Iraq 62.8 67.6 70.1 72.6 82.8 97.5 109.4 117.9 121.8 125.5 127.9
Poland 41.1 41.6 43.5 46.2 51.7 58.2 63.8 67.5 70.3 72.9 75.3
Former Yugoslavia 74.4 75.1 74.6 74.0 73.7 72.9 72.3 71.6 70.8 70.1 69.3
Iran 52.7 53.2 54.0 54.5 55.7 56.5 57.7 59.9 62.1 63.8 65.6
Bosnia and Herzegovina 52.9 53.9 54.5 54.8 55.5 55.7 56.0 56.1 56.2 56.3 56.6
Germany 39.4 40.2 40.8 41.6 43.0 45.0 46.9 47.8 48.2 48.4 48.7
Turkey 33.1 34.1 35.0 35.9 37.1 38.2 39.2 40.8 42.5 43.9 45.1
Denmark 39.9 40.9 41.7 42.6 44.4 45.9 46.2 46.0 45.5 45.0 44.2
Somalia 14.0 14.8 15.3 16.0 18.3 21.6 25.2 31.7 37.8 40.2 44.0
Norway 44.5 45.1 45.0 44.8 44.7 44.6 44.3 43.8 43.4 43.1 42.9
Thailand 12.4 14.3 16.3 18.3 20.5 22.9 25.9 28.7 31.4 33.6 35.6
Chile 27.3 27.5 27.7 27.8 28.0 28.0 28.1 28.3 28.4 28.4 28.4
Syria 15.2 15.7 16.2 16.8 17.8 18.2 18.8 19.6 20.8 22.4 27.5
China 9.8 10.9 11.9 13.3 14.5 16.0 18.3 21.2 24.0 25.7 26.8
Other countries 342.4 353.7 367.2 383.0 406.5 428.2 454.6 484.7 512.3 541.5 571.5
Total 1 053.5 1 078.1 1 100.3 1 125.8 1 175.2 1 227.8 1 281.6 1 338.0 1 384.9 1 427.3 1 473.3
Note: For details on definitions and sources, please refer to the metadata at the end of the tables.1 2 http://dx.doi.org/10.1787/888933
Table B.4. Stock of foreign-born population by country of birthThousands
SWITZERLAND
2002 2003 2004 2005 2006 2007 2008 2009 2010 2011 2012OW
20
Germany .. .. .. .. .. .. .. .. 318.9 330.0 337.4
Italy .. .. .. .. .. .. .. .. 233.1 241.0 244.7
Portugal .. .. .. .. .. .. .. .. 172.3 187.4 199.2
France .. .. .. .. .. .. .. .. 132.3 138.4 141.4
Turkey .. .. .. .. .. .. .. .. 76.0 76.9 77.4
Serbia .. .. .. .. .. .. .. .. 59.1 61.7 62.7
Spain .. .. .. .. .. .. .. .. 53.5 57.2 59.8
Austria .. .. .. .. .. .. .. .. 58.8 59.2 59.7
Former Yugoslav Republic of Macedonia .. .. .. .. .. .. .. .. 51.7 53.5 55.1
Bosnia and Herzegovina .. .. .. .. .. .. .. .. 51.1 52.4 53.2
United Kingdom .. .. .. .. .. .. .. .. 41.1 43.7 44.2
United States .. .. .. .. .. .. .. .. 33.7 34.9 35.4
Brazil .. .. .. .. .. .. .. .. 32.3 33.4 34.4
Sri Lanka .. .. .. .. .. .. .. .. 28.6 29.6 30.0
Poland .. .. .. .. .. .. .. .. 21.5 24.0 26.2
Other countries .. .. .. .. .. .. .. .. 711.2 734.9 757.7
Total .. .. .. .. .. .. .. .. 2 075.2 2 158.4 2 218.4
Note: For details on definitions and sources, please refer to the metadata at the end of the tables.1 2 http://dx.doi.org/10.1787/888933
INTERNATIONAL MIGRATION OUTLOOK 2014 © OECD 2014378

STATISTICAL ANNEX
f which:omen12 (%)
48
52
47
60
55
49
47
47
53
54
52
51
65
48
49
52
158471
f which:omen12 (%)
47
48
60
56
53
49
51
58
56
41
55
58
57
55
63
51
158471
Table B.4. Stock of foreign-born population by country of birthThousands
UNITED KINGDOM
2002 2003 2004 2005 2006 2007 2008 2009 2010 2011 2012OW
20
India .. .. .. .. 570 553 601 661 687 686 750
Poland .. .. .. .. 229 423 495 540 534 617 658
Pakistan .. .. .. .. 274 357 422 427 382 441 432
Ireland .. .. .. .. 417 410 420 401 401 429 429
Germany .. .. .. .. 269 253 273 296 301 292 303
South Africa .. .. .. .. 198 194 204 220 227 208 208
Bangladesh .. .. .. .. 221 202 193 199 193 219 191
Nigeria .. .. .. .. 117 147 137 166 167 203 162
Jamaica .. .. .. .. 135 173 142 130 134 123 151
France .. .. .. .. 111 134 129 144 122 132 146
Kenya .. .. .. .. 138 135 140 134 118 129 139
Italy .. .. .. .. 86 102 108 117 130 150 135
Philippines .. .. .. .. 95 107 101 134 110 140 134
Sri Lanka .. .. .. .. 102 114 96 105 118 131 127
Zimbabwe .. .. .. .. 111 106 101 126 111 137 125
Other countries .. .. .. .. 2 684 2 782 3 071 3 099 3 321 3 393 3 499
Total .. .. .. .. 5 757 6 192 6 633 6 899 7 056 7 430 7 588
Note: For details on definitions and sources, please refer to the metadata at the end of the tables.1 2 http://dx.doi.org/10.1787/888933
Table B.4. Stock of foreign-born population by country of birthThousands
UNITED STATES
2002 2003 2004 2005 2006 2007 2008 2009 2010 2011 2012OW
20
Mexico 9 889.0 10 078.7 10 256.9 10 993.9 11 535.0 11 739.6 11 451.3 11 478.2 11 746.5 11 691.6 11 489.4
India 1 238.0 1 297.9 1 372.3 1 410.7 1 505.4 1 514.0 1 626.9 1 665.1 1 796.5 1 855.7 1 974.3
Philippines 1 467.7 1 443.3 1 509.8 1 594.8 1 634.1 1 708.5 1 685.1 1 733.9 1 766.5 1 814.9 1 862.0
China 1 081.2 1 127.7 1 218.4 1 202.9 1 357.5 1 367.8 1 339.1 1 425.8 1 604.4 1 651.5 1 719.8
Viet Nam 1 024.1 1 066.0 1 052.0 1 072.9 1 116.2 1 102.2 1 154.7 1 149.4 1 243.8 1 253.9 1 264.2
El Salvador 856.2 872.6 931.9 988.0 1 042.2 1 108.3 1 078.3 1 157.2 1 207.1 1 245.5 1 254.5
Cuba 880.8 888.7 925.0 902.4 932.6 980.0 987.8 982.9 1 112.1 1 090.6 1 114.9
Korea 944.5 957.7 955.4 993.9 1 021.2 1 050.7 1 034.7 1 012.9 1 086.9 1 095.1 1 105.7
Dominican Republic 648.5 679.9 716.5 708.5 764.9 747.9 779.2 791.6 879.9 878.9 960.2
Guatemala 510.0 523.7 585.2 644.7 741.0 683.8 743.8 790.5 797.3 844.3 880.9
Canada 812.8 849.5 808.5 830.3 847.2 816.4 824.3 814.1 785.6 787.5 799.1
Colombia 561.9 529.6 499.3 554.8 589.1 603.7 603.3 617.7 648.3 655.1 705.0
Jamaica 580.4 600.8 590.1 579.2 643.1 587.6 631.7 645.0 650.8 694.6 668.8
Haiti 448.4 505.7 445.3 483.7 495.8 544.5 545.8 536.0 596.4 602.7 616.0
Germany 647.9 622.7 643.8 626.5 635.6 624.2 641.5 614.8 611.8 618.2 596.7
Other countries 11 504.5 11 623.1 11 747.4 12 182.3 12 608.6 12 869.4 12 888.5 13 037.8 13 383.0 13 601.4 13 726.9
Total 33 096.2 33 667.7 34 257.7 35 769.6 37 469.4 38 048.5 38 016.1 38 452.8 39 916.9 40 381.6 40 738.2
Note: For details on definitions and sources, please refer to the metadata at the end of the tables.1 2 http://dx.doi.org/10.1787/888933
INTERNATIONAL MIGRATION OUTLOOK 2014 © OECD 2014 379

STATISTICAL ANNEX
ics
ration,
ic
tudies
ionalI).
Metadata related to Tables A.4 and B.4. Stocks of foreign-born population
Comments Source
Australia ® Estimated resident population (ERP) based on Population Censuses. In betweenCensuses, the ERP is updated by data on births, deaths and net overseas migration.Reference date: 30 June.
Australian Bureau of Statistics (ABS).
Austria ® Stock of foreign-born residents recorded in the population register. Break in time seriesin 2002. Revised data for 2002-07 to be coherent with the results of register-based censusof 2006.Reference date: 31 December (since 2002).
Population Register, Statistics Austria.Prior to 2002: Labour Force Survey,Statistics Austria.
Belgium ® Stock of foreign-born recorded in the population register. Excludes asylum seekers. Population Register, Directorate for Statistand Economic Information (DGSIE).
Canada ® 2001, 2006 and 2011 censuses: Total immigrants (excluding non-permanent residents).Immigrants are persons who are, or have ever been, landed immigrants in Canada. A landedimmigrant is a person who has been granted the right to live in Canada permanentlyby immigration authorities. Some immigrants have resided in Canada for a number of yearsand have changed status, while others are recent arrivals.
PM for other years.
Statistics Canada.
Chile ® 2002 Census.® Register of residence permits granted for other years.
National Statistical Instituteand Department of the Foreigners and MigMinistry of the Interior.
Czech Republic ® 2001 Census.CM for other years.
Czech Statistical Office.
Denmark ® Immigrants according to the national definition, e.g. persons born abroad to parentsboth foreign citizens or born abroad. When no information is available on the parents’nationality/country of birth, persons born abroad are classified as immigrants.
Statistics Denmark.
Estonia ® Population Register (Table A.4); 2011 census (Table B.4). Ministry of the Interior.
Finland ® Population register. Includes foreign-born persons of Finnish origin. Statistics Finland.
France ® Annual Censuses. Including persons who were born French abroad. National Institute for Statistics and EconomStudies (INSEE).
Germany ® Microcensus. Federal Statistical Office.
Greece ® 2001 Census. Usual foreign-born resident population.® From 2010 on: Labour Force Surveys (4th quarter).
National Statistical Service.
Hungary ® Includes foreigners and ethnic Hungarians. From 2010 on, includes refugeesand third country nationals holding a residence permit. From 2011 on, includes personsunder subsidiary protection.Reference date: 31 December.
Office of Immigration and Nationality,Central Statistical Office.
Iceland ® Population national Register. Numbers from the Register are likely to be overestimated.Reference date: 1 January.
Statistics Iceland.
Ireland ® 2002 and 2006 Censuses. Persons usually resident and present in their usual residenceon census night.
PM for other years.
Central Statistics Office.
Israel Estimates are based on the results of the Population Censuses. Intercensal changesare estimated based on variations recorded in the Population Register. The data referto permanent immigrants, that is, to persons who entered the country to take up permanentresidence under the Law of Return or the Law of Entrance. Before 2006, the detail by countryof origin (Table B.4) includes Jews and Others and excludes Arabs whereas from 2006 on,it includes Jews only. For the whole period, the total foreign-born population (Table A.4)includes Jews and others and excludes Arabs.Data for Algeria include Tunisia until 2009.The statistical data for Israel are supplied by and under the responsibility of the relevantIsraeli authorities. The use of such data by the OECD is without prejudice to the statusof the Golan Heights, East Jerusalem and Israeli settlements in the West Bankunder the terms of international law.
Central Bureau of Statistics.
Italy National Institute of Statistics (ISTAT).
Luxembourg ® 2001 and 2010: 2001 and 2011 Censuses.CM for other years.
Central Office of Statistics and Economic S(Statec).
Mexico ® From 2005 on, estimation of the total number of foreign-born from the National Surveyof Occupation and Employment (ENOE).
National Migration Institute (INM) and NatInstitute of Statistics and Geography (INEG
Netherlands ® Reference date: 1 January of the following year. Population register,Central Bureau of Statistics (CBS).
New Zealand ® 2001 and 2006 Censuses.PM for other years.
Statistics New Zealand.
INTERNATIONAL MIGRATION OUTLOOK 2014 © OECD 2014380

STATISTICAL ANNEX
way.
f birth
Norway ® Reference date: 31 December. Central Population Register, Statistics Nor
Poland ® 2002 and 2011 Censuses.Excluding foreign temporary residents who, at the time of the census, had been stayingat a given address in Poland for less than 12 months. Country of birth in accordancewith political (administrative) boundaries at the time of the census.
Central Statistical Office.
Portugal ® 2001 and 2011 censuses.CM for other years.
National Statistical Institute (INE).
Russian Federation ® Censuses. Federal statistics service (Rosstat).
Slovak Republic ® 2001 Census. Population who had permanent resident status at the date of the Census.® 2004 Population Register.
Ministry of the Interior.
Slovenia ® Central Population Register. Ministry of the Interior.
Spain ® Population register.Reference date: 1 January (for a given year, data refer to the 1 January of the following year).
Municipal Registers,National Statistics Institute (INE).
Sweden ® Reference date: 31 December. Population Register, Statistics Sweden.
Switzerland ® 2000 Census.® 2010 Population Register of the Confederation.
CM for other years.
Federal Statistical Office.
United Kingdom ® 2001 Census.® From 2006 on: Labour Force Survey. Foreign-born residents.
PM for other years.Figures are rounded.
Office for National Statistics.
United States ® American Community Survey.ACS 2011 data from IPUMS-USA (http://usa.ipums.org/usa/).
Census Bureau.
Legend:® Observed figures.
Estimates (in italic) made by means of the component method (CM) or the parametric method (PM).For more details on the method of estimation, please refer to www.oecd.org/migration/foreignborn. No estimate is made by country o(Tables B.4).Data for Serbia may include persons born in Montenegro.
Metadata related to Tables A.4 and B.4. Stocks of foreign-born population (cont.)
Comments Source
INTERNATIONAL MIGRATION OUTLOOK 2014 © OECD 2014 381

STATISTICAL ANNEX
2012
1 004.3
11.9
1 195.1
10.7
..
..
435.9
4.1
374.7
6.7
216.5
16.3
195.5
3.6
4 036.0
6.4
7 213.7
8.8
768.1
6.9
141.4
1.4
21.4
6.7
550.4
12.0
4 387.7
7.3
2 033.7
1.6
933.0
1.9
238.8
45.0
296.5
0.3
796.2
4.8
448.8
8.9
..
..
417.0
4.0
621.0
0.4
72.9
1.3
103.3
5.0
5 520.1
12.0
Table A.5. Stocks of foreign population by nationality in OECD countriesand the Russian Federation
Thousands and percentages
2001 2002 2003 2004 2005 2006 2007 2008 2009 2010 2011
Austria 730.3 746.8 754.2 774.4 796.7 804.8 829.7 860.0 883.6 913.2 951.4
% of total population 9.1 9.2 9.3 9.5 9.7 9.7 10.0 10.3 10.6 10.9 11.3
Belgium 846.7 850.1 860.3 870.9 900.5 932.2 971.4 1 013.3 1 057.7 1 119.3 1 169.1
% of total population 8.2 8.2 8.3 8.4 8.6 8.8 9.1 9.5 9.8 10.2 10.6
Canada 1 568.6 .. .. .. .. 1 758.9 .. .. .. .. ..
% of total population 5.1 .. .. .. .. 5.4 .. .. .. .. ..
Czech Republic 210.8 231.6 240.4 254.3 278.3 321.5 392.3 437.6 432.5 424.3 434.2
% of total population 2.1 2.3 2.4 2.5 2.7 3.1 3.8 4.2 4.1 4.0 4.1
Denmark 266.7 265.4 271.2 267.6 270.1 278.1 298.5 320.2 329.9 346.0 358.9
% of total population 5.0 4.9 5.0 5.0 5.0 5.1 5.5 5.8 6.0 6.2 6.4
Estonia 273.8 269.5 266.5 262.6 255.1 243.8 232.2 223.6 219.2 218.7 218.3
% of total population 19.9 19.7 19.6 19.4 18.9 18.1 17.3 16.7 16.4 16.4 16.4
Finland 98.6 103.7 107.0 108.3 113.9 121.7 132.7 143.3 155.7 168.0 183.1
% of total population 1.9 2.0 2.1 2.1 2.2 2.3 2.5 2.7 2.9 3.1 3.4
France .. .. .. .. .. 3 541.8 3 696.9 3 731.2 3 821.5 3 769.0 3 892.6
% of total population .. .. .. .. .. 5.7 6.0 6.0 6.1 6.0 6.2
Germany 7 318.6 7 335.6 7 334.8 6 717.1 6 755.8 6 751.0 6 744.9 6 727.6 6 694.8 6 753.6 6 930.9
% of total population 8.9 8.9 8.9 8.1 8.2 8.2 8.2 8.2 8.2 8.3 8.5
Greece 355.8 436.8 472.8 533.4 553.1 570.6 643.1 733.6 839.7 810.0 757.4
% of total population 3.2 4.0 4.3 4.8 5.0 5.1 5.8 6.6 7.5 7.3 6.8
Hungary 116.4 115.9 130.1 142.2 154.4 166.0 174.7 184.4 197.8 209.2 143.4
% of total population 1.1 1.1 1.3 1.4 1.5 1.6 1.7 1.8 2.0 2.1 1.4
Iceland 9.9 10.2 10.2 10.6 13.8 18.6 23.4 24.4 21.7 21.1 21.0
% of total population 3.5 3.6 3.5 3.6 4.7 6.1 7.5 7.6 6.8 6.6 6.6
Ireland .. 219.3 .. .. .. 413.2 .. .. .. .. 537.0
% of total population .. 5.6 .. .. .. 9.7 .. .. .. .. 11.7
Italy 1 448.4 1 549.4 1 990.2 2 402.2 2 670.5 2 938.9 3 432.7 3 891.3 4 235.1 4 570.3 4 825.6
% of total population 2.5 2.7 3.5 4.2 4.6 5.0 5.8 6.6 7.1 7.6 8.0
Japan 1 778.5 1 851.8 1 915.0 1 973.7 2 011.6 2 083.2 2 151.4 2 215.9 2 184.7 2 132.9 2 078.5
% of total population 1.4 1.5 1.5 1.5 1.6 1.6 1.7 1.7 1.7 1.7 1.6
Korea 229.6 271.7 460.3 491.4 510.5 660.6 800.3 895.5 920.9 1 002.7 982.5
% of total population 0.5 0.6 1.0 1.0 1.1 1.4 1.6 1.8 1.9 2.0 2.0
Luxembourg 166.7 170.7 177.8 183.7 191.3 198.3 205.9 215.5 216.3 220.5 229.9
% of total population 37.8 38.3 39.4 40.1 41.1 41.9 42.9 44.1 43.5 43.5 44.3
Mexico .. .. .. .. .. .. .. .. 262.7 .. ..
% of total population .. .. .. .. .. .. .. .. 0.2 .. ..
Netherlands 690.4 700.0 702.2 699.4 691.4 681.9 688.4 719.5 735.2 760.4 786.1
% of total population 4.3 4.3 4.3 4.3 4.2 4.2 4.2 4.4 4.4 4.6 4.7
Norway 185.9 197.7 204.7 213.3 222.3 238.3 266.3 303.0 333.9 369.2 407.3
% of total population 4.1 4.4 4.5 4.6 4.8 5.1 5.7 6.4 6.9 7.6 8.2
Poland .. 49.2 .. .. .. 54.9 57.5 60.4 49.6 .. 55.4
% of total population .. 0.1 .. .. .. 0.1 0.2 0.2 0.1 .. 0.1
Portugal 350.5 413.3 434.3 449.2 415.9 420.2 435.7 440.6 454.2 445.3 436.8
% of total population 3.4 4.0 4.2 4.3 4.0 4.0 4.1 4.2 4.3 4.2 4.1
Russian Federation .. 1 025.4 .. .. .. .. .. .. .. 687.0 ..
% of total population .. 0.7 .. .. .. .. .. .. .. 0.5 ..
Slovak Republic 29.4 29.5 29.2 22.3 25.6 32.1 40.9 52.5 62.9 68.0 70.7
% of total population 0.5 0.5 0.5 0.4 0.5 0.6 0.8 1.0 1.2 1.3 1.3
Slovenia .. .. .. .. .. .. .. .. 99.6 95.4 101.5
% of total population .. .. .. .. .. .. .. .. 4.9 4.7 4.9
Spain 1 977.9 2 664.2 3 034.3 3 730.6 4 144.2 4 519.6 5 268.8 5 648.7 5 747.7 5 751.5 5 736.3
% of total population 4.9 6.4 7.2 8.7 9.5 10.3 11.7 12.4 12.5 12.5 12.4
INTERNATIONAL MIGRATION OUTLOOK 2014 © OECD 2014382

STATISTICAL ANNEX
667.2
7.0
1 825.1
22.8
4 788.0
7.5
1 359.1
6.8
158430
2012
Sweden 471.3 469.8 452.8 457.8 457.5 485.9 518.2 555.4 595.1 633.3 655.1
% of total population 5.3 5.3 5.1 5.1 5.1 5.4 5.7 6.0 6.4 6.8 6.9
Switzerland 1 419.1 1 447.3 1 471.0 1 495.0 1 511.9 1 523.6 1 571.0 1 638.9 1 680.2 1 720.4 1 772.3
% of total population 19.6 19.9 20.0 20.2 20.3 20.4 20.8 21.4 21.7 22.0 22.4
United Kingdom 2 587.0 2 584.0 2 742.0 2 857.0 3 035.0 3 392.0 3 824.0 4 186.0 4 348.0 4 524.0 4 785.0
% of total population 4.4 4.4 4.6 4.8 5.1 5.7 6.4 6.9 7.1 7.4 7.6
United States 18 533.7 20 490.6 20 634.1 21 115.7 21 159.7 21 863.7 22 359.4 21 835.7 21 100.8 21 317.3 21 057.0 2
% of total population 6.5 7.1 7.1 7.2 7.2 7.3 7.4 7.2 6.9 6.9 6.8
Note: For details on definitions and sources, refer to the metadata at the end of Tables B.5.1 2 http://dx.doi.org/10.1787/888933
Table A.5. Stocks of foreign population by nationality in OECD countriesand the Russian Federation (cont.)
Thousands and percentages
2001 2002 2003 2004 2005 2006 2007 2008 2009 2010 2011
INTERNATIONAL MIGRATION OUTLOOK 2014 © OECD 2014 383

STATISTICAL ANNEX
f which:omen12 (%)
50
48
48
46
47
56
49
53
56
63
47
42
56
28
63
50
158482
f which:omen12 (%)
45
52
47
50
53
49
46
51
48
49
44
49
52
49
57
49
158482
Table B.5. Stock of foreign population by nationalityThousandsAUSTRIA
2002 2003 2004 2005 2006 2007 2008 2009 2010 2011 2012OW
20
Germany 78.2 83.6 91.2 100.4 109.2 118.9 128.7 136.0 144.1 150.9 157.8
Turkey 127.2 123.0 116.5 113.1 108.2 108.8 110.0 111.3 112.5 112.9 113.7
Serbia .. .. .. .. .. 122.7 122.2 109.4 110.5 110.4 111.3
Bosnia and Herzegovina 96.1 94.2 90.9 88.3 86.2 92.6 91.8 90.5 89.6 89.6 89.9
Croatia 58.5 58.5 58.6 58.1 56.8 59.2 58.9 58.5 58.3 58.3 58.6
Romania 19.5 20.5 21.3 21.9 21.9 27.7 32.2 36.0 41.6 47.3 53.3
Poland 21.8 22.2 26.6 30.6 33.3 35.3 36.6 37.2 38.6 42.1 46.0
Hungary 13.7 14.2 15.1 16.3 17.4 19.2 21.3 23.3 25.6 29.8 37.0
Russian Federation 4.9 8.0 14.2 17.2 18.8 21.1 22.5 23.4 24.2 25.5 27.3
Slovak Republic 8.5 9.5 11.3 13.0 14.2 15.8 17.9 19.2 20.4 22.5 25.3
Former Yugoslav Republic of Macedonia 14.4 15.3 16.0 16.3 16.3 17.5 17.9 18.1 18.6 18.9 19.4
Italy 10.9 11.3 11.7 12.2 12.7 13.2 13.9 14.5 15.4 16.2 17.8
Bulgaria 5.3 5.9 6.3 6.5 6.4 7.6 8.9 9.8 11.2 12.5 14.1
Afghanistan 2.7 3.1 3.3 3.1 3.1 4.0 4.5 5.7 6.7 9.4 12.4
Czech Republic 6.6 6.9 7.4 7.7 8.0 8.6 8.9 9.1 9.3 9.6 10.2
Other countries 278.5 278.1 284.0 292.0 292.3 157.5 163.8 181.4 186.8 195.5 210.1
Total 746.8 754.2 774.4 796.7 804.8 829.7 860.0 883.6 913.2 951.4 1 004.3
Note: For details on definitions and sources, please refer to the metadata at the end of the tables.1 2 http://dx.doi.org/10.1787/888933
Table B.5. Stock of foreign population by nationalityThousandsBELGIUM
2002 2003 2004 2005 2006 2007 2008 2009 2010 2011 2012OW
20
Italy 187.0 183.0 179.0 175.5 171.9 169.0 167.0 165.1 162.8 159.7 157.4
France 113.0 114.9 117.3 120.6 125.1 130.6 136.6 140.2 145.3 150.0 153.4
Netherlands 96.6 100.7 105.0 110.5 117.0 123.5 130.2 133.5 137.8 141.2 144.0
Morocco 83.6 81.8 81.3 80.6 80.6 79.9 79.4 81.9 84.7 86.1 83.3
Poland 10.4 11.6 14.0 18.0 23.2 30.4 36.3 43.1 49.7 56.1 61.5
Spain 44.5 43.8 43.2 42.9 42.8 42.7 43.6 45.2 48.0 50.9 54.4
Romania 4.0 4.6 5.6 7.5 10.2 15.3 21.4 26.4 33.6 42.4 50.9
Germany 35.1 35.5 36.3 37.0 37.6 38.4 39.1 39.4 39.8 40.0 39.7
Portugal 26.0 26.8 27.4 28.0 28.7 29.8 31.7 33.1 34.5 36.1 38.8
Turkey 42.6 41.3 39.9 39.7 39.4 39.5 39.6 39.6 39.8 39.4 38.0
United Kingdom 26.2 26.2 26.0 25.7 25.1 25.1 25.5 25.0 25.0 24.8 24.5
Bulgaria 1.9 2.2 2.7 3.3 3.9 6.7 10.4 13.2 17.3 20.4 23.4
Democratic Republic of the Congo 13.6 13.8 13.2 13.5 14.2 15.0 16.8 18.1 19.6 20.6 20.1
Greece 17.3 17.1 16.6 16.3 15.7 15.2 14.9 14.8 14.8 15.0 15.5
Russian Federation 3.3 3.7 4.0 5.5 6.4 7.2 11.8 12.8 14.0 14.7 13.8
Other countries 144.9 153.2 159.5 175.9 190.3 203.3 208.9 226.3 252.6 271.7 276.3
Total 850.1 860.3 870.9 900.5 932.2 971.4 1 013.3 1 057.7 1 119.3 1 169.1 1 195.1
Note: For details on definitions and sources, please refer to the metadata at the end of the tables.1 2 http://dx.doi.org/10.1787/888933
INTERNATIONAL MIGRATION OUTLOOK 2014 © OECD 2014384

STATISTICAL ANNEX
f which:omen11 (%)
44
45
42
55
52
21
40
37
41
46
59
22
35
55
59
43
158482
f which:omen11 (%)
49
48
48
35
61
47
59
45
48
46
84
50
49
52
48
51
158482
Table B.5. Stock of foreign population by nationalityThousands
CZECH REPUBLIC
2002 2003 2004 2005 2006 2007 2008 2009 2010 2011 2012OW
20
Ukraine 59.1 62.3 78.3 87.8 102.6 126.7 131.9 131.9 124.3 118.9 112.5
Slovak Republic 61.1 64.9 47.4 49.4 58.4 67.9 76.0 73.4 71.8 81.3 85.8
Viet Nam 27.1 29.0 34.2 36.8 40.8 51.1 60.3 61.1 60.3 58.2 57.3
Russian Federation 12.8 12.6 14.7 16.3 18.6 23.3 27.1 30.3 31.8 32.4 33.0
Poland 16.0 15.8 16.3 17.8 18.9 20.6 21.7 19.3 18.2 19.1 19.2
Germany 5.2 5.2 5.8 7.2 10.1 15.7 17.5 13.8 13.9 15.8 17.1
Moldova 2.8 3.3 4.1 4.7 6.2 8.0 10.6 10.0 8.9 7.6 6.4
Bulgaria 4.2 4.0 4.4 4.6 4.6 5.0 5.9 6.4 6.9 7.4 8.2
United States 3.4 3.3 3.8 4.0 4.2 4.5 5.3 5.6 6.1 7.3 7.0
China 3.2 4.0 3.4 3.6 4.2 5.0 5.2 5.4 5.5 5.6 5.6
Mongolia .. .. .. .. .. 6.0 8.6 5.7 5.6 5.4 5.3
United Kingdom 1.8 1.7 1.8 2.2 3.5 3.8 4.5 4.4 4.4 4.9 5.2
Romania 2.3 2.3 2.6 2.7 2.9 3.2 3.6 4.1 4.4 4.8 5.7
Kazakhstan .. .. .. .. .. 3.0 3.4 3.9 4.2 4.5 4.8
Belarus 2.7 2.7 2.9 3.0 3.2 3.7 3.9 4.0 4.2 4.2 4.3
Other countries 29.9 29.4 34.7 38.3 43.3 44.9 52.1 53.1 53.9 56.8 58.6
Total 231.6 240.4 254.3 278.3 321.5 392.3 437.6 432.5 424.3 434.2 435.9
Note: For details on definitions and sources, please refer to the metadata at the end of the tables.1 2 http://dx.doi.org/10.1787/888933
Table B.5. Stock of foreign population by nationalityThousandsDENMARK
2002 2003 2004 2005 2006 2007 2008 2009 2010 2011 2012OW
20
Turkey 31.9 30.3 30.0 29.5 28.8 28.8 28.9 29.0 29.2 29.0 28.8
Poland 5.7 5.9 6.2 7.4 9.7 13.8 19.9 21.1 22.6 24.5 26.8
Germany 13.0 13.3 13.6 14.2 15.4 18.0 20.4 21.1 21.6 22.1 22.4
United Kingdom 12.7 12.8 12.8 12.9 13.2 13.7 14.2 14.3 14.7 15.0 15.4
Norway 13.4 13.8 13.9 13.9 14.2 14.4 14.8 15.0 15.1 15.3 15.3
Iraq 18.0 19.4 19.2 18.7 18.1 18.3 17.6 16.7 16.7 15.7 15.2
Sweden 10.7 10.8 10.9 11.2 11.6 12.1 12.7 12.8 12.9 13.1 13.4
Romania .. .. .. .. .. 2.4 3.7 5.1 6.9 9.5 12.4
Bosnia and Herzegovina 17.8 17.2 14.0 12.7 12.2 12.1 11.8 11.5 11.4 11.1 11.0
Afghanistan 8.2 9.1 9.3 9.4 9.4 9.5 9.4 9.1 9.5 9.6 9.8
Thailand 5.2 5.4 5.6 5.9 6.2 6.7 7.3 7.7 8.3 8.6 8.8
Lithuania .. .. .. .. .. 3.5 4.3 5.2 6.5 7.7 8.6
Pakistan 6.9 7.0 6.9 6.7 6.6 6.7 6.9 7.1 7.8 8.2 8.6
Iceland 6.6 7.1 7.4 7.7 8.0 8.3 8.5 8.9 9.0 8.6 8.4
Somalia 13.3 13.1 11.3 9.8 9.0 8.8 8.5 8.3 8.2 8.0 8.2
Other countries 91.2 95.4 96.8 100.9 107.0 116.3 127.5 133.1 143.3 152.1 161.9
Total 265.4 271.2 267.6 270.1 278.1 298.5 320.2 329.9 346.0 358.9 374.7
Note: For details on definitions and sources, please refer to the metadata at the end of the tables.1 2 http://dx.doi.org/10.1787/888933
INTERNATIONAL MIGRATION OUTLOOK 2014 © OECD 2014 385

STATISTICAL ANNEX
f which:omen12 (%)
51
57
42
48
54
87
35
31
38
40
43
20
53
45
42
47
158482
f which:omen12 (%)
..
..
..
..
..
..
..
..
..
..
..
..
..
..
..
50
158482
Table B.5. Stock of foreign population by nationalityThousandsFINLAND
2002 2003 2004 2005 2006 2007 2008 2009 2010 2011 2012OW
20
Estonia 12.4 13.4 14.0 15.5 17.6 20.0 22.6 25.5 29.1 34.0 39.8
Russian Federation 24.3 25.0 24.6 24.6 25.3 26.2 26.9 28.2 28.4 29.6 30.2
Sweden 8.0 8.1 8.2 8.2 8.3 8.3 8.4 8.5 8.5 8.5 8.4
Somalia 4.5 4.6 4.7 4.7 4.6 4.9 4.9 5.6 6.6 7.4 7.5
China 2.1 2.4 2.6 3.0 3.4 4.0 4.6 5.2 5.6 6.2 6.6
Thailand 1.8 2.1 2.3 2.6 3.0 3.5 3.9 4.5 5.0 5.5 6.0
Iraq 3.4 3.5 3.4 3.3 3.0 3.0 3.2 4.0 5.0 5.7 5.9
Turkey 2.1 2.3 2.4 2.6 2.9 3.2 3.4 3.8 4.0 4.2 4.3
India 1.0 1.2 1.3 1.6 2.0 2.3 2.7 3.2 3.5 3.8 4.0
Germany 2.5 2.6 2.6 2.8 3.0 3.3 3.5 3.6 3.7 3.8 3.9
Serbia and Montenegro 2.2 2.8 3.3 3.3 3.4 3.5 3.5 3.6 3.8 3.9 3.9
United Kingdom 2.5 2.7 2.7 2.8 2.9 3.1 3.2 3.3 3.5 3.7 3.9
Viet Nam 1.7 1.7 1.5 1.7 1.8 2.0 2.3 2.5 2.8 3.1 3.3
Afghanistan 1.1 1.3 1.6 1.8 2.0 2.2 2.2 2.3 2.5 2.8 3.0
Poland 0.8 0.8 0.8 0.9 1.1 1.4 1.9 2.1 2.2 2.5 2.9
Other countries 61.9 61.9 61.9 61.9 61.9 61.9 61.9 61.9 61.9 61.9 61.9
Total 103.7 107.0 108.3 113.9 121.7 132.7 143.3 155.7 168.0 183.1 195.5
Note: For details on definitions and sources, please refer to the metadata at the end of the tables.1 2 http://dx.doi.org/10.1787/888933
Table B.5. Stock of foreign population by nationalityThousands
FRANCE
2002 2003 2004 2005 2006 2007 2008 2009 2010 2011 2012OW
20
Portugal .. .. .. 490.6 491.0 492.5 493.9 497.6 .. .. ..
Algeria .. .. .. 481.0 475.3 471.3 469.0 466.4 .. .. ..
Morocco .. .. .. 460.4 452.0 444.8 440.7 435.2 .. .. ..
Turkey .. .. .. 223.6 223.4 220.1 220.7 221.2 .. .. ..
Italy .. .. .. 177.4 175.2 174.3 173.5 172.7 .. .. ..
United Kingdom .. .. .. 136.5 146.6 151.8 154.0 156.3 .. .. ..
Tunisia .. .. .. 145.9 144.2 143.9 144.0 147.1 .. .. ..
Spain .. .. .. 133.8 131.0 130.1 128.5 128.0 .. .. ..
Germany .. .. .. 92.4 93.4 93.9 95.0 93.3 .. .. ..
Belgium .. .. .. 81.3 84.4 87.7 90.9 92.9 .. .. ..
China .. .. .. 66.2 72.1 76.7 81.4 86.2 .. .. ..
Mali .. .. .. 56.7 59.5 59.7 62.2 63.3 .. .. ..
Haiti .. .. .. 40.4 62.0 62.2 56.6 58.0 .. .. ..
Senegal .. .. .. 49.5 50.5 50.2 51.5 51.7 .. .. ..
Congo .. .. .. 44.3 46.1 47.7 48.6 50.0 .. .. ..
Other countries .. .. .. 861.7 990.2 1 024.3 1 062.6 1 101.5 .. .. ..
Total .. .. .. 3 541.8 3 696.9 3 731.2 3 773.2 3 821.5 3 824.8 3 892.6 4 036.0
Note: For details on definitions and sources, please refer to the metadata at the end of the tables.1 2 http://dx.doi.org/10.1787/888933
INTERNATIONAL MIGRATION OUTLOOK 2014 © OECD 2014386

STATISTICAL ANNEX
f which:omen12 (%)
484841454951476248484563454947
49
158482
f which:omen12 (%)
496059107359244953
87307059..
53
50
e is northernrve its
bers oftrol of
158482
Table B.5. Stock of foreign population by nationalityThousandsGERMANY
2002 2003 2004 2005 2006 2007 2008 2009 2010 2011 2012OW
20
Turkey 1 912.2 1 877.7 1 764.3 1 764.0 1 738.8 1 713.6 1 688.4 1 658.1 1 629.5 1 607.2 1 575.7Poland 317.6 326.9 292.1 326.6 361.7 384.8 393.8 398.5 419.4 468.5 532.4Italy 609.8 601.3 548.2 540.8 534.7 528.3 523.2 517.5 517.5 520.2 529.4Greece 359.4 354.6 316.0 309.8 303.8 294.9 287.2 278.1 276.7 283.7 298.3Serbia .. .. 125.8 297.0 316.8 330.6 361.0 298.0 285.0 267.8 258.8Croatia 231.0 236.6 229.2 228.9 227.5 225.3 223.1 221.2 220.2 223.0 225.0Romania 88.7 89.1 73.4 73.0 73.4 84.6 94.3 105.0 126.5 159.2 205.0Russian Federation 155.6 173.5 178.6 185.9 187.5 187.8 188.3 189.3 191.3 195.3 202.1Austria 189.3 189.5 174.0 174.8 175.7 175.9 175.4 174.5 175.2 175.9 176.3Bosnia and Herzegovina 163.8 167.1 156.0 156.9 157.1 158.2 156.8 154.6 152.4 153.5 155.3Netherlands 115.2 118.7 114.1 118.6 123.5 128.2 133.0 134.9 136.3 137.7 139.3Ukraine 116.0 126.0 128.1 130.7 129.0 127.0 126.2 125.6 124.3 123.3 123.3Portugal 131.4 130.6 116.7 115.6 115.0 114.6 114.5 113.3 113.2 115.5 120.6Spain 127.5 126.0 108.3 107.8 106.8 106.3 105.5 104.0 105.4 110.2 120.2Bulgaria 42.4 44.3 39.2 39.2 39.1 46.8 54.0 61.9 74.9 93.9 118.8Other countries 2 775.7 2 773.1 2 353.2 2 186.2 2 160.8 2 138.1 2 102.9 2 160.4 2 205.7 2 296.1 2 433.2Total 7 335.6 7 334.8 6 717.1 6 755.8 6 751.0 6 744.9 6 727.6 6 694.8 6 753.6 6 930.9 7 213.7
Note: For details on definitions and sources, please refer to the metadata at the end of the tables.1 2 http://dx.doi.org/10.1787/888933
Table B.5. Stock of foreign population by nationalityThousands
GREECE
2002 2003 2004 2005 2006 2007 2008 2009 2010 2011 2012OW
20
Albania 262.1 294.7 325.6 341.0 347.4 384.6 413.9 501.7 485.0 449.7 471.5Romania 13.8 14.6 16.2 18.9 18.9 25.7 29.5 33.8 33.3 40.6 38.5Bulgaria 18.6 17.3 25.3 27.9 29.5 30.7 40.2 54.5 48.4 47.3 38.4Pakistan 4.8 6.2 4.2 5.5 6.7 13.9 18.0 23.0 21.2 24.1 24.5Georgia 12.0 9.5 14.1 16.9 15.1 23.8 33.6 33.9 32.8 28.0 23.5Russian Federation 22.0 17.8 16.8 17.6 18.9 21.6 16.7 19.5 14.1 12.0 15.1Syria 5.2 6.2 3.8 4.2 3.6 6.0 9.2 12.4 6.5 10.1 13.4Poland 14.1 15.9 17.0 16.1 16.6 21.4 18.9 11.2 10.2 7.5 11.3Cyprus1, 2 7.7 8.1 12.2 11.0 10.6 11.2 14.2 11.8 9.9 12.1 11.2
Ukraine 11.3 10.2 13.1 12.2 12.2 14.1 11.9 13.7 12.2 10.8 10.7Egypt 6.1 11.2 6.3 2.6 3.6 5.2 12.6 10.3 9.5 10.9 10.4Philippines 3.8 3.2 7.2 8.9 7.5 3.4 4.9 3.3 5.1 2.1 9.9United Kingdom 3.6 6.2 7.1 7.7 7.6 8.0 7.5 7.5 7.3 7.6 9.5Bangladesh 1.5 1.0 1.8 3.2 2.1 2.6 14.1 12.5 14.6 10.5 7.5Armenia 4.0 4.7 7.3 6.1 7.1 5.0 9.1 12.3 6.7 9.5 7.5Other countries 46.1 46.1 55.2 53.0 63.2 65.8 79.2 78.3 93.3 74.5 65.2Total 436.8 472.8 533.4 553.1 570.6 643.1 733.6 839.7 810.0 757.4 768.1
Note: For details on definitions and sources, please refer to the metadata at the end of the tables.1. Note by Turkey: The information in this document with reference to “Cyprus” relates to the southern part of the Island. Ther
single authority representing both Turkish and Greek Cypriot people on the Island. Turkey recognises the Turkish Republic of NoCyprus (TRNC). Until a lasting and equitable solution is found within the context of the United Nations, Turkey shall preseposition concerning the “Cyprus issue”.
2. Note by all the European Union Member States of the OECD and the European Union: The Republic of Cyprus is recognised by all memthe United Nations with the exception of Turkey. The information in this document relates to the area under the effective conthe Government of the Republic of Cyprus.
1 2 http://dx.doi.org/10.1787/888933
INTERNATIONAL MIGRATION OUTLOOK 2014 © OECD 2014 387

STATISTICAL ANNEX
f which:omen12 (%)
39
43
46
54
61
43
35
64
44
51
33
38
40
23
39
44
158482
f which:omen12 (%)
46
48
55
67
51
31
42
57
69
36
60
47
55
42
52
49
158482
Table B.5. Stock of foreign population by nationalityThousandsHUNGARY
2002 2003 2004 2005 2006 2007 2008 2009 2010 2011 2012OW
20
Romania 47.3 55.7 67.5 66.2 67.0 65.8 66.4 72.7 76.9 41.6 34.8
Germany 7.1 7.4 6.9 10.5 15.0 14.4 16.7 18.7 20.2 15.8 17.4
China 6.4 6.8 6.9 8.6 9.0 10.2 10.7 11.2 11.8 10.1 11.5
Ukraine 9.9 13.1 13.9 15.3 15.9 17.3 17.6 17.2 16.5 11.9 10.8
Slovak Republic 1.5 2.5 1.2 3.6 4.3 4.9 6.1 6.4 7.3 6.7 7.6
Serbia 7.9 8.3 13.6 8.4 8.5 13.7 13.7 11.5 10.7 8.2 4.9
Austria 0.8 0.8 0.5 1.5 2.2 2.6 3.0 3.7 3.9 3.3 3.7
Russian Federation 1.8 2.2 2.6 2.8 2.8 2.8 2.9 3.3 3.5 2.9 3.4
United States .. .. .. .. 1.9 2.3 2.4 3.1 3.3 3.1 3.1
Viet Nam 2.1 2.4 2.5 3.1 3.1 3.0 3.3 3.1 3.1 2.6 3.1
United Kingdom 0.9 1.0 0.4 1.5 1.9 2.1 2.4 2.4 2.5 2.1 2.4
Netherlands 0.4 0.4 0.2 0.7 1.1 1.2 1.4 1.7 1.9 1.9 2.2
France 0.7 0.8 0.3 1.3 1.5 1.5 2.2 1.9 2.1 1.9 2.1
Italy 0.5 0.6 0.4 0.8 1.0 1.2 1.5 1.6 1.8 1.6 2.0
Iran 0.4 0.5 0.5 0.6 0.9 1.0 1.0 1.5 1.7 1.7 1.8
Other countries 28.3 27.9 24.4 29.6 30.1 30.5 33.1 37.7 42.0 28.0 30.8
Total 115.9 130.1 142.2 154.4 166.0 174.7 184.4 197.8 209.2 143.4 141.4
Note: For details on definitions and sources, please refer to the metadata at the end of the tables.1 2 http://dx.doi.org/10.1787/888933
Table B.5. Stock of foreign population by nationalityThousandsICELAND
2002 2003 2004 2005 2006 2007 2008 2009 2010 2011 2012OW
20
Poland 1.8 1.9 1.9 3.2 6.0 9.9 11.0 9.6 9.1 9.0 9.4
Lithuania 0.4 0.4 0.4 0.6 1.0 1.5 1.7 1.5 1.6 1.6 1.6
Denmark 0.9 0.9 0.9 0.9 0.9 1.0 1.0 0.9 0.9 0.9 0.9
Germany 0.6 0.6 0.5 0.8 0.9 1.1 1.1 1.0 1.0 0.9 0.8
Latvia 0.1 0.1 0.1 0.2 0.3 0.5 0.6 0.6 0.6 0.7 0.7
United Kingdom 0.4 0.4 0.3 0.4 0.4 0.4 0.5 0.5 0.6 0.6 0.6
United States 0.6 0.5 0.5 0.6 0.6 0.6 0.5 0.5 0.5 0.5 0.6
Philippines 0.6 0.6 0.6 0.8 0.8 0.7 0.7 0.6 0.6 0.6 0.6
Thailand 0.5 0.5 0.5 0.5 0.5 0.5 0.6 0.5 0.5 0.5 0.5
Portugal 0.1 0.1 0.4 0.4 0.7 0.9 0.8 0.6 0.5 0.5 0.5
Sweden 0.3 0.3 0.3 0.3 0.3 0.4 0.4 0.3 0.3 0.3 0.3
France 0.2 0.1 0.1 0.1 0.2 0.2 0.3 0.3 0.3 0.3 0.3
China 0.2 0.2 0.2 0.6 0.8 0.4 0.2 0.2 0.2 0.2 0.2
Spain 0.1 0.1 0.1 0.1 0.1 0.1 0.2 0.2 0.2 0.2 0.2
Viet Nam 0.2 0.2 0.2 0.3 0.2 0.3 0.2 0.2 0.2 0.2 0.2
Other countries 3.3 3.4 3.4 3.9 4.6 4.9 4.7 4.0 3.9 3.9 4.0
Total 10.2 10.2 10.6 13.8 18.6 23.4 24.4 21.7 21.1 21.0 21.4
Note: For details on definitions and sources, please refer to the metadata at the end of the tables.1 2 http://dx.doi.org/10.1787/888933
INTERNATIONAL MIGRATION OUTLOOK 2014 © OECD 2014388

STATISTICAL ANNEX
f which:omen11 (%)
48
50
52
56
54
49
46
56
56
57
50
48
51
49
48
50
158482
f which:omen12 (%)
57
48
45
50
80
58
67
40
60
72
38
31
32
59
45
53
158482
Table B.5. Stock of foreign population by nationalityThousandsIRELAND
2002 2003 2004 2005 2006 2007 2008 2009 2010 2011 2012OW
20
Poland 2.1 .. .. .. 62.7 .. .. .. .. 121.7 ..
United Kingdom 101.3 .. .. .. 110.6 115.5 117.9 117.1 115.9 110.0 113.0
Lithuania 2.1 .. .. .. 24.4 .. .. .. .. 36.4 ..
Latvia 1.8 .. .. .. 13.2 .. .. .. .. 20.4 ..
Nigeria 8.7 .. .. .. 16.0 .. .. .. .. 17.3 ..
Romania 4.9 .. .. .. 7.6 .. .. .. .. 17.1 ..
India 2.5 .. .. .. 8.3 .. .. .. .. 16.9 ..
Philippines 3.7 .. .. .. 9.3 .. .. .. .. 12.6 ..
Germany 7.0 .. .. .. 10.1 .. .. .. .. 11.1 ..
United States 11.1 .. .. .. 12.3 .. .. .. .. 10.8 ..
China 5.8 .. .. .. 11.0 .. .. .. .. 10.7 ..
Slovak Republic .. .. .. .. 8.0 .. .. .. .. 10.7 ..
France 6.2 .. .. .. 8.9 .. .. .. .. 9.6 ..
Brazil 1.1 .. .. .. 4.3 .. .. .. .. 8.6 ..
Hungary .. .. .. .. .. .. .. .. .. 8.0 ..
Other countries 61.1 .. .. .. 106.5 .. .. .. .. 115.1 ..
Total 219.3 .. .. .. 413.2 519.6 575.6 575.4 560.1 537.0 550.4
Note: For details on definitions and sources, please refer to the metadata at the end of the tables.1 2 http://dx.doi.org/10.1787/888933
Table B.5. Stock of foreign population by nationalityThousands
ITALY
2002 2003 2004 2005 2006 2007 2008 2009 2010 2011 2012OW
20
Romania 95.0 177.8 248.8 297.6 342.2 625.3 796.5 887.8 968.6 1 072.3 951.1
Albania 216.6 270.4 316.7 348.8 375.9 401.9 441.4 466.7 482.6 495.7 437.5
Morocco 215.4 253.4 294.9 319.5 343.2 365.9 403.6 431.5 452.4 470.4 412.7
China 69.6 86.7 111.7 127.8 144.9 156.5 170.3 188.4 209.9 228.3 213.6
Ukraine 12.7 58.0 93.4 107.1 120.1 132.7 154.0 174.1 200.7 214.4 192.3
Philippines 64.9 72.4 82.6 89.7 101.3 105.7 113.7 123.6 134.2 142.9 139.8
Moldova 7.0 24.6 38.0 47.6 55.8 68.6 89.4 105.6 130.9 144.5 130.8
India 35.5 44.8 54.3 61.8 69.5 77.4 91.9 105.9 121.0 133.1 123.7
Peru 34.2 43.0 53.4 59.3 66.5 70.8 77.6 87.7 98.6 105.7 97.6
Poland 30.0 40.3 50.8 60.8 72.5 90.2 99.4 105.6 109.0 111.1 95.9
Tunisia 59.5 68.6 78.2 83.6 88.9 93.6 100.1 103.7 106.3 109.4 93.2
Egypt 33.7 40.6 52.9 58.9 65.7 69.6 74.6 82.1 90.4 98.1 91.9
Bangladesh 20.6 27.4 35.8 41.6 49.6 55.2 65.5 74.0 82.5 91.6 88.5
Ecuador 15.3 33.5 53.2 62.0 68.9 73.2 80.1 85.9 91.6 95.2 84.4
Sri Lanka 34.2 39.2 45.6 50.5 56.7 61.1 68.7 75.3 81.1 85.8 83.7
Other countries 605.1 709.5 791.8 853.9 917.2 984.9 1 064.5 1 137.2 1 210.4 1 226.9 1 150.9
Total 1 549.4 1 990.2 2 402.2 2 670.5 2 938.9 3 432.7 3 891.3 4 235.1 4 570.3 4 825.6 4 387.7
Note: For details on definitions and sources, please refer to the metadata at the end of the tables.1 2 http://dx.doi.org/10.1787/888933
INTERNATIONAL MIGRATION OUTLOOK 2014 © OECD 2014 389

STATISTICAL ANNEX
f which:omen11 (%)
58
54
78
46
46
47
34
75
36
33
..
30
27
21
29
55
158482
f which:omen12 (%)
51
48
54
9
24
39
33
70
30
47
3
44
12
4
4
44
158482
Table B.5. Stock of foreign population by nationalityThousands
JAPAN
2002 2003 2004 2005 2006 2007 2008 2009 2010 2011 2012OW
20
China 424.3 462.4 487.6 519.6 560.7 606.9 655.4 680.5 687.2 674.9 652.6
Korea 625.4 613.8 607.4 598.7 598.2 593.5 589.2 578.5 566.0 545.4 530.0
Philippines 169.4 185.2 199.4 187.3 193.5 202.6 210.6 211.7 210.2 209.4 203.0
Brazil 268.3 274.7 286.6 302.1 313.0 317.0 312.6 267.5 230.6 210.0 190.6
Viet Nam 21.1 23.9 26.0 28.9 32.5 36.9 41.1 41.0 41.8 44.7 52.4
Peru 51.8 53.6 55.8 57.7 58.7 59.7 59.7 57.5 54.6 52.8 49.2
United States 48.0 47.8 48.8 49.4 51.3 51.9 52.7 52.1 50.7 49.8 48.4
Thailand 33.7 34.8 36.3 37.7 39.6 41.4 42.6 42.7 41.3 42.8 40.1
Indonesia 21.7 22.9 23.9 25.1 24.9 25.6 27.3 25.5 24.9 24.7 25.5
Nepal .. .. .. .. 7.8 9.4 12.3 15.3 17.5 20.4 24.1
Chinese Taipei .. .. .. .. .. .. .. .. .. .. 22.8
India 13.3 14.2 15.5 17.0 18.9 20.6 22.3 22.9 22.5 21.5 21.7
United Kingdom 18.5 18.2 18.1 17.5 17.8 17.3 17.0 16.6 16.0 15.5 14.7
Pakistan 8.2 8.4 8.6 8.8 9.1 9.3 9.9 10.3 10.3 10.8 10.6
Canada 11.9 12.0 12.1 12.0 11.9 11.5 11.0 10.7 10.0 9.5 9.0
Other countries 136.2 143.0 147.7 149.8 145.2 148.0 152.2 152.0 149.4 146.3 139.1
Total 1 851.8 1 915.0 1 973.7 2 011.6 2 083.2 2 151.4 2 215.9 2 184.7 2 132.9 2 078.5 2 033.7
Note: For details on definitions and sources, please refer to the metadata at the end of the tables.1 2 http://dx.doi.org/10.1787/888933
Table B.5. Stock of foreign population by nationalityThousands
KOREA
2002 2003 2004 2005 2006 2007 2008 2009 2010 2011 2012OW
20
China 84.5 185.5 208.8 217.0 311.8 421.5 487.1 489.1 505.4 536.7 474.8
Viet Nam 16.9 23.3 26.1 35.5 52.2 67.2 79.8 86.2 98.2 110.6 114.2
Philippines 17.3 27.6 27.9 30.7 40.3 42.9 39.4 38.4 39.5 38.4 33.2
Indonesia 17.1 28.3 26.1 22.6 23.7 23.7 27.4 25.9 27.4 29.6 29.8
Uzbekistan 4.1 10.7 11.5 10.8 11.6 10.9 15.0 15.9 20.8 24.4 28.0
United States 37.6 40.0 39.0 41.8 46.0 51.1 56.2 63.1 57.6 26.5 23.4
Cambodia 0.0 0.7 1.3 2.0 3.3 4.6 7.0 8.8 11.7 16.8 23.4
Japan 15.4 16.2 16.6 17.5 18.0 18.4 18.6 18.6 19.4 21.1 22.6
Thailand 4.8 20.0 21.9 21.4 30.2 31.7 30.1 28.7 27.6 26.0 21.4
Chinese Taipei 22.7 22.6 22.3 22.2 22.1 22.1 27.0 21.7 21.5 21.4 21.2
Sri Lanka 2.7 4.9 5.5 8.5 11.1 12.1 14.3 14.4 17.4 20.5 21.0
Mongolia 1.4 9.2 11.0 13.7 19.2 20.5 21.2 21.0 21.8 21.3 19.8
Nepal 2.3 4.2 5.3 4.9 5.0 4.6 5.9 7.4 9.2 12.6 17.8
Bangladesh 9.0 13.6 13.1 9.1 8.6 7.8 7.7 7.3 9.3 10.6 10.8
Myanmar 1.1 1.8 3.6 2.3 3.4 3.2 2.9 3.6 3.8 5.6 8.3
Other countries 34.7 51.7 51.5 50.8 54.2 57.8 56.0 70.8 112.1 60.6 63.3
Total 271.7 460.3 491.4 510.5 660.6 800.3 895.5 920.9 1 002.7 982.5 933.0
Note: For details on definitions and sources, please refer to the metadata at the end of the tables.1 2 http://dx.doi.org/10.1787/888933
INTERNATIONAL MIGRATION OUTLOOK 2014 © OECD 2014390

STATISTICAL ANNEX
f which:omen12 (%)
..
..
..
..
..
..
..
..
..
..
..
..
..
..
..
..
158482
f which:omen12 (%)
42
43
56
39
48
49
53
45
55
47
44
58
17
47
34
46
158482
Table B.5. Stock of foreign population by nationalityThousands
LUXEMBOURG
2002 2003 2004 2005 2006 2007 2008 2009 2010 2011 2012OW
20
Portugal 59.8 61.4 64.9 67.8 70.8 73.7 76.6 80.0 79.8 82.4 85.3
France 20.9 21.6 22.2 23.1 24.1 25.2 26.6 28.5 29.7 31.5 33.1
Italy 19.1 19.0 19.0 19.0 19.1 19.1 19.1 19.4 18.2 18.1 18.1
Belgium 15.4 15.9 16.2 16.3 16.5 16.5 16.5 16.7 16.8 16.9 17.2
Germany 10.1 10.2 10.5 10.8 10.9 11.3 11.6 12.0 12.1 12.0 12.3
Serbia .. .. .. .. .. .. .. .. .. 6.0 6.5
United Kingdom 4.5 4.7 4.7 4.7 4.8 4.9 5.0 5.3 5.5 5.5 5.6
Spain 2.8 2.9 2.9 3.0 3.1 3.2 3.2 3.3 3.3 3.7 4.0
Netherlands 3.6 3.6 3.6 3.7 3.7 3.8 3.8 3.9 3.9 3.9 3.9
Poland .. 0.7 0.8 1.0 1.3 1.6 1.8 2.2 2.5 2.7 3.0
Cape Verde .. .. .. .. .. .. .. .. .. 2.5 2.5
Bosnia and Herzegovina .. .. .. .. .. .. .. .. .. 2.3 2.2
Romania .. 0.4 0.4 0.4 0.5 0.6 0.9 1.1 1.3 1.6 1.9
Denmark 2.0 2.0 2.0 2.0 2.2 2.2 2.2 2.2 2.2 2.0 1.9
Greece 1.2 1.2 1.2 1.2 1.3 1.4 1.4 1.5 1.5 1.5 1.7
Other countries 31.2 34.3 35.3 38.4 39.9 42.5 46.9 40.2 44.0 37.5 39.6
Total 170.7 177.8 183.7 191.3 198.3 205.9 215.5 216.3 220.5 229.9 238.8
Note: For details on definitions and sources, please refer to the metadata at the end of the tables.1 2 http://dx.doi.org/10.1787/888933
Table B.5. Stock of foreign population by nationalityThousands
MEXICO
2002 2003 2004 2005 2006 2007 2008 2009 2010 2011 2012OW
20
United States .. .. .. .. .. .. .. 60.0 64.9 68.5 63.4
Spain .. .. .. .. .. .. .. 18.6 18.8 19.6 20.7
Colombia .. .. .. .. .. .. .. 14.6 15.5 16.9 16.7
China .. .. .. .. .. .. .. 10.2 12.5 15.2 15.6
Argentina .. .. .. .. .. .. .. 15.2 15.6 15.8 15.3
Cuba .. .. .. .. .. .. .. 10.3 11.8 14.0 14.5
Venezuela .. .. .. .. .. .. .. 10.1 11.8 12.8 12.9
Canada .. .. .. .. .. .. .. 10.9 12.7 13.6 12.9
Guatemala .. .. .. .. .. .. .. 8.4 9.8 10.9 9.7
France .. .. .. .. .. .. .. 9.4 9.1 9.1 9.0
Germany .. .. .. .. .. .. .. 8.9 8.8 9.0 8.8
Honduras .. .. .. .. .. .. .. 4.9 6.3 7.6 6.9
Korea .. .. .. .. .. .. .. 6.0 6.4 6.8 6.8
Peru .. .. .. .. .. .. .. 6.6 6.4 6.9 6.8
Italy .. .. .. .. .. .. .. 5.7 6.1 6.4 6.6
Other countries .. .. .. .. .. .. .. 63.0 64.7 70.9 69.7
Total .. .. .. .. .. .. .. 262.7 281.1 303.9 296.5
Note: For details on definitions and sources, please refer to the metadata at the end of the tables.1 2 http://dx.doi.org/10.1787/888933
INTERNATIONAL MIGRATION OUTLOOK 2014 © OECD 2014 391

STATISTICAL ANNEX
f which:omen12 (%)
49
52
55
49
41
54
52
37
51
52
51
45
51
41
40
51
158482
f which:omen12 (%)
33
48
40
45
46
35
47
65
86
81
49
51
42
41
46
46
158482
Table B.5. Stock of foreign population by nationalityThousands
NETHERLANDS
2002 2003 2004 2005 2006 2007 2008 2009 2010 2011 2012OW
20
Turkey 100.3 101.8 100.6 98.9 96.8 93.7 92.7 90.8 88.0 84.8 81.9
Poland 6.9 7.4 11.0 15.2 19.6 26.2 35.5 43.1 52.5 65.1 74.6
Germany 56.1 56.5 57.1 58.5 60.2 62.4 65.9 68.4 71.4 72.8 72.6
Morocco 97.8 94.4 91.6 86.2 80.5 74.9 70.8 66.6 61.9 56.6 51.0
United Kingdom 44.1 43.7 42.5 41.5 40.3 40.2 41.1 41.4 41.4 41.4 41.7
Belgium .. .. .. .. .. .. 26.6 26.9 27.2 27.6 28.2
China 11.2 13.3 14.7 15.0 15.3 16.2 18.1 19.8 21.4 23.9 25.9
Italy 18.7 18.5 18.4 18.5 18.6 19.0 20.3 21.1 21.9 22.6 23.6
Spain 17.5 17.4 17.1 16.9 16.5 16.5 17.3 18.1 19.2 20.3 21.9
France 14.5 14.5 14.5 14.7 14.7 15.1 16.4 17.2 17.8 18.1 18.3
Bulgaria 1.4 1.7 1.9 2.1 2.2 6.4 10.2 12.3 14.1 16.8 17.6
Portugal 11.3 11.8 12.0 12.1 12.2 12.9 14.2 15.4 15.7 16.4 17.3
United States 15.4 15.1 14.8 14.6 14.6 14.5 14.9 14.6 14.8 15.3 15.6
Greece 6.2 6.3 6.4 6.5 6.6 6.9 7.4 7.8 8.6 10.1 11.8
India 3.4 3.6 3.7 4.3 5.4 6.4 8.0 8.7 9.6 10.8 11.7
Other countries 295.2 296.1 293.0 286.3 278.3 277.0 260.1 263.0 275.0 283.4 282.5
Total 700.0 702.2 699.4 691.4 681.9 688.4 719.5 735.2 760.4 786.1 796.2
Note: For details on definitions and sources, please refer to the metadata at the end of the tables.1 2 http://dx.doi.org/10.1787/888933
Table B.5. Stock of foreign population by nationalityThousandsNORWAY
2002 2003 2004 2005 2006 2007 2008 2009 2010 2011 2012OW
20
Poland 2.6 2.7 3.9 6.8 13.6 26.8 39.2 46.7 55.2 66.6 77.1
Sweden 25.2 25.4 25.8 26.6 27.9 29.9 32.8 35.8 39.2 42.0 43.1
Lithuania 0.8 0.9 1.3 1.9 3.0 5.1 7.6 10.4 16.4 24.1 30.7
Germany 8.2 8.8 9.6 10.6 12.2 15.3 18.9 20.8 22.4 23.7 24.4
Denmark 20.0 20.0 20.1 20.2 20.3 20.5 20.6 20.7 20.9 21.4 21.9
United Kingdom 11.2 11.0 11.2 11.2 11.6 12.0 12.6 13.3 14.0 14.7 15.5
Somalia 8.4 9.9 10.5 10.6 10.8 10.6 10.9 10.8 11.1 10.8 13.0
Russian Federation 4.8 6.2 7.4 8.2 8.8 9.7 10.4 10.6 10.8 10.9 11.2
Thailand 3.6 4.2 5.0 5.7 6.4 6.9 7.9 8.6 9.3 10.0 10.8
Philippines 2.4 2.6 2.9 3.3 3.9 4.8 6.1 6.8 7.8 8.9 10.1
Eritrea 0.3 0.4 0.5 0.8 1.0 1.4 2.1 3.8 5.7 7.6 10.0
United States 8.0 7.7 7.6 7.6 7.7 7.9 8.3 8.5 8.6 8.8 9.2
Iraq 13.0 13.4 13.7 13.1 12.1 10.7 11.0 10.9 10.6 10.3 9.1
Latvia 0.5 0.5 0.6 0.6 0.9 1.2 1.7 2.8 4.9 6.9 8.5
Iceland 4.2 4.1 3.9 3.8 3.8 3.8 4.0 5.3 6.4 7.6 8.2
Other countries 84.4 86.8 89.4 91.2 94.4 99.6 109.0 118.2 126.0 133.1 146.0
Total 197.7 204.7 213.3 222.3 238.3 266.3 303.0 333.9 369.2 407.3 448.8
Note: For details on definitions and sources, please refer to the metadata at the end of the tables.1 2 http://dx.doi.org/10.1787/888933
INTERNATIONAL MIGRATION OUTLOOK 2014 © OECD 2014392

STATISTICAL ANNEX
f which:omen11 (%)
..
..
..
..
..
..
..
..
..
..
..
..
..
..
..
..
158482
f which:omen12 (%)
58
47
53
44
53
44
48
48
49
54
47
49
46
29
40
50
158482
Table B.5. Stock of foreign population by nationalityThousands
POLAND
2002 2003 2004 2005 2006 2007 2008 2009 2010 2011 2012OW
20
Ukraine 9.9 .. .. .. 5.2 6.1 7.2 10.2 .. 13.4 ..
Germany 3.7 .. .. .. 11.4 11.8 12.2 4.4 .. 5.2 ..
Russian Federation 4.3 .. .. .. 3.3 3.4 3.5 4.2 .. 4.2 ..
Belarus 2.9 .. .. .. 1.5 1.8 2.2 3.2 .. 3.8 ..
Viet Nam 2.1 .. .. .. 1.9 2.0 2.2 2.9 .. 2.6 ..
Armenia 1.6 .. .. .. 0.8 0.8 0.9 1.4 .. 1.8 ..
Sweden 0.5 .. .. .. 2.6 2.8 2.8 1.3 .. .. ..
Bulgaria 1.1 .. .. .. 1.0 1.0 1.1 1.1 .. .. ..
United States 1.3 .. .. .. 1.0 1.0 1.1 1.1 .. .. ..
Former USSR .. .. .. 1.3 1.3 1.2 1.0 .. .. ..
Austria 0.3 .. .. .. 2.6 2.7 2.8 1.0 .. .. ..
Greece 0.5 .. .. .. 1.2 1.2 1.2 0.9 .. .. ..
United Kingdom 1.0 .. .. .. 0.6 0.6 0.6 0.8 .. .. ..
France 1.0 .. .. .. 0.6 0.6 0.6 0.7 .. .. ..
Czech Republic 0.8 .. .. .. 0.6 0.6 0.7 0.7 .. .. ..
Other countries 18.2 .. .. .. 19.4 19.6 20.1 14.8 .. 24.4 ..
Total 49.2 .. .. .. 54.9 57.5 60.4 49.6 .. 55.4 ..
Note: For details on definitions and sources, please refer to the metadata at the end of the tables.1 2 http://dx.doi.org/10.1787/888933
Table B.5. Stock of foreign population by nationalityThousandsPORTUGAL
2002 2003 2004 2005 2006 2007 2008 2009 2010 2011 2012OW
20
Brazil 60.0 64.3 66.7 63.7 68.0 66.4 107.0 116.2 119.4 111.4 105.6
Ukraine 62.0 64.8 65.8 43.8 41.5 39.5 52.5 52.3 49.5 48.0 44.1
Cape Verde 60.4 62.5 64.3 67.5 65.5 63.9 51.4 48.8 44.0 43.9 42.9
Romania 10.9 11.6 12.0 10.6 11.4 19.2 27.4 32.5 36.8 39.3 35.2
Angola 32.2 34.1 35.1 34.2 33.7 32.7 27.6 26.6 23.5 21.6 20.3
Guinea-Bissau 23.4 24.7 25.3 24.7 23.8 23.7 24.4 22.9 19.8 18.5 17.8
China 8.3 8.7 9.2 9.3 10.2 10.4 13.3 14.4 15.7 16.8 17.4
United Kingdom 15.9 16.8 18.0 19.0 19.8 23.6 15.4 16.4 17.2 17.7 16.6
Moldova 12.2 12.8 13.7 14.0 14.4 14.1 21.1 20.8 15.6 13.6 11.5
Sao Tome and Principe 9.2 9.8 10.5 11.5 10.8 10.6 11.7 11.5 10.5 10.5 10.4
Spain 14.6 15.3 15.9 16.4 16.6 18.0 7.2 8.1 8.9 9.3 9.4
Germany 11.9 12.5 13.1 13.6 13.9 15.5 8.2 8.6 9.0 9.1 8.6
Bulgaria 3.3 3.6 3.6 3.1 3.3 5.0 6.5 7.2 8.2 8.6 7.4
India 4.9 5.1 5.2 3.7 3.8 4.1 5.5 5.8 5.3 5.4 5.7
Italy 3.8 4.2 4.6 4.8 6.0 6.0 3.9 4.5 5.1 5.3 5.2
Other countries 80.5 83.5 86.2 76.3 77.5 83.0 57.5 57.7 56.8 57.8 58.9
Total 413.3 434.3 449.2 415.9 420.2 435.7 440.6 454.2 445.3 436.8 417.0
Note: For details on definitions and sources, please refer to the metadata at the end of the tables.1 2 http://dx.doi.org/10.1787/888933
INTERNATIONAL MIGRATION OUTLOOK 2014 © OECD 2014 393

STATISTICAL ANNEX
f which:omen12 (%)
..
..
..
..
..
..
..
..
..
..
..
..
..
..
..
..
158482
f which:omen12 (%)
47
36
53
32
27
68
25
18
26
30
65
31
47
51
43
40
158482
Table B.5. Stock of foreign population by nationalityThousands
RUSSIAN FEDERATION
2002 2003 2004 2005 2006 2007 2008 2009 2010 2011 2012OW
20
Ukraine 230.6 .. .. .. .. .. .. .. 93.4 .. 110.2
Uzbekistan 70.9 .. .. .. .. .. .. .. 131.1 .. 103.1
Armenia 136.8 .. .. .. .. .. .. .. 59.4 .. 90.0
Tajikistan 64.2 .. .. .. .. .. .. .. 87.1 .. 75.7
Azerbaijan 154.9 .. .. .. .. .. .. .. 67.9 .. 62.8
Kazakhstan 69.5 .. .. .. .. .. .. .. 28.1 .. 42.2
Moldova 51.0 .. .. .. .. .. .. .. 33.9 .. 36.3
Georgia 52.9 .. .. .. .. .. .. .. 12.1 .. 15.6
Kyrgyzstan 28.8 .. .. .. .. .. .. .. 44.6 .. 14.0
Viet Nam 22.5 .. .. .. .. .. .. .. 11.1 .. 10.2
Belarus 40.3 .. .. .. .. .. .. .. 27.7 .. 9.8
China 30.6 .. .. .. .. .. .. .. 28.4 .. 8.5
Lithuania 4.6 .. .. .. .. .. .. .. 2.6 .. 4.6
Turkmenistan 6.4 .. .. .. .. .. .. .. 5.6 .. 4.1
Turkey 5.0 .. .. .. .. .. .. .. 5.4 .. 3.8
Other countries 56.4 .. .. .. .. .. .. .. 48.8 .. 30.1
Total 1 025.4 .. .. .. .. .. .. .. 687.0 .. 621.0
Note: For details on definitions and sources, please refer to the metadata at the end of the tables.1 2 http://dx.doi.org/10.1787/888933
Table B.5. Stock of foreign population by nationalityThousands
SLOVAK REPUBLIC
2002 2003 2004 2005 2006 2007 2008 2009 2010 2011 2012OW
20
Czech Republic 5.4 4.9 3.6 4.4 5.1 6.0 6.9 8.3 9.0 14.6 14.7
Hungary .. .. .. 1.8 2.1 2.7 3.6 4.6 5.3 9.3 9.9
Poland 2.4 2.4 2.5 2.8 3.6 4.0 4.4 5.4 5.6 6.9 7.0
Romania .. .. .. 0.4 0.7 3.0 5.0 5.4 5.8 5.7 6.0
Germany .. .. .. 1.6 2.3 2.9 3.8 4.0 4.1 4.3 4.4
Ukraine 4.7 4.9 4.0 3.7 3.9 3.7 4.7 5.9 6.3 3.9 3.9
Austria .. .. .. 0.9 1.2 1.5 1.7 2.1 2.2 2.3 2.3
Italy .. .. .. 0.5 0.7 1.0 1.1 1.5 1.7 2.1 2.2
Bulgaria .. .. .. 0.6 0.5 1.0 1.4 1.5 1.7 1.8 2.0
United Kingdom .. .. .. 0.5 0.7 1.0 1.2 1.4 1.5 1.8 1.9
Russian Federation .. .. .. 1.2 1.3 1.4 1.5 2.0 2.2 1.8 1.8
France .. .. .. 0.6 0.9 1.1 1.3 1.6 1.7 1.6 1.6
Viet Nam .. .. .. 0.8 1.1 1.4 2.5 2.3 2.3 1.5 1.5
China .. .. .. 0.5 0.9 1.2 1.5 1.7 1.9 0.8 0.9
United States .. .. .. 0.6 0.7 0.8 0.8 1.0 1.0 0.9 0.9
Other countries 17.0 17.0 12.1 4.6 6.3 8.3 11.1 14.1 15.7 11.5 11.8
Total 29.5 29.2 22.3 25.6 32.1 40.9 52.5 62.9 68.0 70.7 72.9
Note: For details on definitions and sources, please refer to the metadata at the end of the tables.1 2 http://dx.doi.org/10.1787/888933
INTERNATIONAL MIGRATION OUTLOOK 2014 © OECD 2014394

STATISTICAL ANNEX
f which:omen12 (%)
25
30
41
30
71
37
67
61
45
45
46
52
37
38
51
29
158482
f which:omen12 (%)
49
42
49
49
56
42
50
48
59
48
39
50
53
51
57
48
158482
Table B.5. Stock of foreign population by nationalityThousandsSLOVENIA
2002 2003 2004 2005 2006 2007 2008 2009 2010 2011 2012OW
20
Bosnia and Herzegovina .. .. .. .. .. .. .. 42.5 41.7 42.7 45.0
Croatia .. .. .. .. .. .. .. 10.2 10.3 10.8 11.6
Former Yugoslav Republic of Macedonia .. .. .. .. .. .. .. 10.1 9.5 10.0 10.2
Serbia .. .. .. .. .. .. .. 9.6 7.1 9.4 10.0
Ukraine .. .. .. .. .. .. .. 1.3 1.4 1.5 1.5
Italy .. .. .. .. .. .. .. 0.9 1.1 1.2 1.5
Bulgaria .. .. .. .. .. .. .. 1.6 2.3 3.1 1.1
Russian Federation .. .. .. .. .. .. .. 0.6 0.7 0.9 1.1
China .. .. .. .. .. .. .. 1.0 1.0 1.0 1.0
Germany .. .. .. .. .. .. .. 0.8 0.9 0.9 1.0
Slovak Republic .. .. .. .. .. .. .. 0.7 0.9 0.8 0.7
United Kingdom .. .. .. .. .. .. .. 0.4 0.5 0.5 0.5
Austria .. .. .. .. .. .. .. 0.4 0.5 .. 0.5
Romania .. .. .. .. .. .. .. 0.4 0.3 0.5 0.5
Poland .. .. .. .. .. .. .. 0.3 0.3 0.3 0.5
Other countries .. .. .. .. .. .. .. 18.7 17.0 17.9 16.6
Total .. .. .. .. .. .. .. 99.6 95.4 101.5 103.3
Note: For details on definitions and sources, please refer to the metadata at the end of the tables.1 2 http://dx.doi.org/10.1787/888933
Table B.5. Stock of foreign population by nationalityThousands
SPAIN
2002 2003 2004 2005 2006 2007 2008 2009 2010 2011 2012OW
20
Romania 137.3 208.0 317.4 407.2 527.0 731.8 798.9 831.2 865.7 897.2 868.6
Morocco 379.0 420.6 511.3 563.0 582.9 652.7 718.1 754.1 774.0 788.6 787.0
United Kingdom 161.5 174.8 227.2 274.7 315.0 353.0 375.7 387.7 391.2 397.9 383.1
Ecuador 390.3 475.7 497.8 461.3 427.1 427.7 421.4 399.6 360.7 308.2 262.2
Colombia 244.7 248.9 271.2 265.1 261.5 284.6 296.7 292.6 273.2 246.3 221.4
Italy 65.4 77.1 95.4 115.8 135.1 157.8 175.3 184.3 188.0 191.9 192.1
Germany 130.2 117.3 133.6 150.5 164.4 181.2 191.0 195.8 196.0 196.9 181.3
China 51.2 62.5 87.7 104.7 106.7 125.9 147.5 158.2 167.1 177.0 180.6
Bolivia 28.4 52.3 97.9 139.8 200.5 242.5 230.7 213.2 199.1 186.0 172.4
Bulgaria 52.8 69.9 93.0 101.6 122.1 154.0 164.7 169.6 172.9 176.4 168.6
Portugal 56.7 55.8 66.2 80.6 100.6 127.2 140.9 142.5 140.8 138.7 128.8
France 69.9 66.9 77.8 90.0 100.4 112.6 120.5 123.9 122.5 121.6 117.5
Peru 55.9 68.6 85.0 95.9 103.7 121.9 139.2 140.2 132.6 122.6 109.7
Argentina 109.4 130.9 153.0 150.3 141.2 147.4 142.3 132.2 120.7 109.3 97.5
Dominican Republic 44.3 48.0 57.1 61.1 65.1 77.8 88.1 91.2 91.1 92.8 92.6
Other countries 687.0 757.2 958.9 1 082.6 1 166.4 1 370.7 1 497.8 1 531.4 1 555.8 1 584.8 1 556.6
Total 2 664.2 3 034.3 3 730.6 4 144.2 4 519.6 5 268.8 5 648.7 5 747.7 5 751.5 5 736.3 5 520.1
Note: For details on definitions and sources, please refer to the metadata at the end of the tables.1 2 http://dx.doi.org/10.1787/888933
INTERNATIONAL MIGRATION OUTLOOK 2014 © OECD 2014 395

STATISTICAL ANNEX
f which:omen12 (%)
58
49
48
43
49
51
49
80
30
37
53
47
38
47
53
48
158482
f which:omen12 (%)
42
44
45
46
48
45
47
48
43
46
48
50
49
45
72
47
158482
Table B.5. Stock of foreign population by nationalityThousandsSWEDEN
2002 2003 2004 2005 2006 2007 2008 2009 2010 2011 2012OW
20
Finland 96.3 93.5 90.3 87.1 83.5 80.4 77.1 74.1 70.6 67.9 65.3
Poland 13.9 13.4 14.7 17.2 22.4 28.9 34.7 38.6 40.9 42.7 44.6
Iraq 40.1 41.5 39.8 31.9 30.3 40.0 48.6 55.1 56.6 55.8 43.2
Denmark 28.1 29.7 31.2 32.9 35.8 38.4 39.7 40.3 40.5 40.5 40.2
Somalia 8.7 8.8 9.0 9.6 11.6 14.7 18.3 24.7 30.8 33.0 36.1
Norway 34.7 35.5 35.6 35.4 35.5 35.6 35.5 35.2 34.9 34.8 34.8
Germany 18.1 19.1 19.9 21.0 22.5 24.7 26.6 27.5 27.6 27.8 28.0
Thailand 6.8 8.3 9.8 11.2 12.5 13.9 15.5 17.1 18.3 19.0 19.1
United Kingdom 14.2 14.4 14.6 14.7 15.1 15.7 16.5 17.3 17.4 18.1 18.4
Afghanistan 5.3 6.1 6.8 6.9 7.7 7.9 8.2 8.6 9.8 12.7 16.7
China 5.2 5.7 6.2 6.7 6.9 7.7 9.4 11.8 14.1 15.5 16.3
Iran 12.9 12.5 12.4 11.5 10.5 10.2 10.6 11.8 13.5 14.3 14.5
Turkey 12.6 12.4 12.3 11.7 10.2 10.0 10.2 10.8 11.9 12.4 12.5
Romania 2.3 2.3 2.4 2.4 2.3 4.4 6.5 7.7 8.8 10.2 11.2
Eritrea 1.0 1.1 1.3 1.8 2.2 2.9 3.9 5.0 6.4 8.4 10.0
Other countries 169.5 148.5 151.7 155.6 177.0 182.8 194.0 209.4 231.2 242.0 256.3
Total 469.8 452.8 457.8 457.5 485.9 518.2 555.4 595.1 633.3 655.1 667.2
Note: For details on definitions and sources, please refer to the metadata at the end of the tables.1 2 http://dx.doi.org/10.1787/888933
Table B.5. Stock of foreign population by nationalityThousands
SWITZERLAND
2002 2003 2004 2005 2006 2007 2008 2009 2010 2011 2012OW
20
Italy 308.3 303.8 300.2 296.4 291.7 289.6 290.0 289.1 289.1 290.5 294.4
Germany 125.0 133.6 144.9 157.6 172.6 201.9 233.4 250.5 264.2 276.8 285.4
Portugal 141.1 149.8 159.7 167.3 173.5 182.3 196.2 205.3 213.2 224.2 238.4
France 63.2 65.0 67.0 69.0 71.5 77.4 85.6 90.6 95.1 99.5 103.9
Serbia 198.1 199.8 199.2 196.2 190.8 187.4 180.3 149.9 115.0 104.8 96.8
Spain 78.9 76.8 74.3 71.4 68.2 65.1 64.4 64.1 64.2 66.0 69.8
Turkey 78.8 77.7 76.6 75.4 73.9 72.6 71.7 71.0 70.6 70.2 69.6
Former Yugoslav Republic of Macedonia 59.8 60.5 60.8 60.7 60.1 60.0 59.7 59.8 60.2 60.8 61.6
United Kingdom 22.8 23.4 24.1 24.9 26.0 28.7 31.9 34.1 36.4 38.6 39.4
Austria 31.1 31.6 32.5 32.8 32.9 34.0 35.5 36.5 37.2 38.2 39.0
Bosnia and Herzegovina 46.0 45.4 44.8 43.2 41.3 39.3 37.5 35.8 34.6 33.5 32.9
Croatia 43.4 42.7 41.8 40.6 39.1 37.8 36.1 34.9 33.8 32.8 31.8
Sri Lanka .. .. .. .. .. .. .. .. .. 24.6 23.9
Netherlands 15.0 15.2 15.4 15.8 16.1 17.0 18.1 18.5 19.1 19.4 19.6
Brazil .. .. .. .. .. .. .. .. .. 18.1 18.6
Other countries 236.0 245.7 253.8 260.7 265.9 277.9 298.7 340.1 387.9 374.4 400.0
Total 1 447.3 1 471.0 1 495.0 1 511.9 1 523.6 1 571.0 1 638.9 1 680.2 1 720.4 1 772.3 1 825.1
Note: For details on definitions and sources, please refer to the metadata at the end of the tables.1 2 http://dx.doi.org/10.1787/888933
INTERNATIONAL MIGRATION OUTLOOK 2014 © OECD 2014396

STATISTICAL ANNEX
f which:omen12 (%)
51
46
57
44
58
52
51
50
48
50
46
52
49
51
57
52
158482
Table B.5. Stock of foreign population by nationalityThousands
UNITED KINGDOM
2002 2003 2004 2005 2006 2007 2008 2009 2010 2011 2012OW
20
Poland 24.0 34.0 48.0 110.0 209.0 406.0 498.0 549.0 550.0 658.0 713.0
India 145.0 154.0 171.0 190.0 258.0 258.0 294.0 293.0 354.0 332.0 359.8
Ireland 403.0 367.0 368.0 369.0 335.0 341.0 359.0 344.0 344.0 386.0 356.0
Pakistan 97.0 83.0 86.0 95.0 78.0 133.0 178.0 177.0 137.0 166.0 162.8
Germany 68.0 70.0 96.0 100.0 91.0 88.0 91.0 121.0 129.0 132.0 137.0
France 92.0 102.0 95.0 100.0 110.0 122.0 123.0 148.0 116.0 114.0 132.0
Lithuania .. .. .. .. 47.0 54.0 73.0 67.0 99.0 129.0 126.0
Italy 98.0 91.0 121.0 88.0 76.0 95.0 96.0 107.0 117.0 153.0 125.0
Romania .. .. .. .. 12.0 19.0 32.0 52.0 72.0 79.0 117.0
Portugal 85.0 88.0 83.0 85.0 81.0 87.0 95.0 96.0 104.0 123.0 106.0
Nigeria 42.0 33.0 43.0 62.0 61.0 89.0 81.0 106.0 106.0 114.0 101.5
China .. .. .. .. 73.0 89.0 109.0 76.0 107.0 106.0 86.6
Spain 44.0 51.0 40.0 61.0 45.0 58.0 66.0 52.0 61.0 55.0 82.0
Latvia .. .. .. .. 14.0 13.0 29.0 19.0 44.0 62.0 81.0
Philippines 32.0 54.0 52.0 51.0 71.0 76.0 64.0 93.0 58.0 86.0 78.1
Other countries 1 454.0 1 615.0 1 654.0 1 724.0 1 831.0 1 896.0 1 998.0 2 048.0 2 126.0 2 090.0 2 024.2
Total 2 584.0 2 742.0 2 857.0 3 035.0 3 392.0 3 824.0 4 186.0 4 348.0 4 524.0 4 785.0 4 788.0
Note: For details on definitions and sources, please refer to the metadata at the end of the tables.1 2 http://dx.doi.org/10.1787/888933
INTERNATIONAL MIGRATION OUTLOOK 2014 © OECD 2014 397

STATISTICAL ANNEX
ics
mark.
and.
ervice.
stics
Metadata related to Tables A.5. and B.5. Stocks of foreign population
Comments Source
Austria Stock of foreign citizens recorded in the population register.Reference date: 31 December.Prior to 2002: annual average.
Population Register, Statistics Austria.Prior to 2002: Labour Force Survey,Statistics Austria.
Belgium Stock of foreign citizens recorded in the population register. From 2008 on, asylum seekersare included. This results in some artificial increase for some nationalities between 2007and 2008.Reference date: 31 December.
Population Register, Directorate for Statistand Economic Information.
Canada 2001 and 2006 Censuses. Statistics Canada.
Czech Republic Holders of a permanent residence permit (mainly for family reasons), a long-term visa(over 90 days), a long-term residence permit (over 6 months, renewable) or a temporaryresidence permit (EU citizens).Reference date: 31 December.
Ministry of the Interior.
Denmark Stock of foreign citizens recorded in the population register. Excludes asylum seekersand all persons with temporary residence permits.Reference date: 31 December.
Central Population Register, Statistics Den
Estonia Police and Border Guard Board.
Finland Stock of foreign citizens recorded in the population register. Includes foreign personsof Finnish origin.Reference date: 31 December.
Central Population Register, Statistics Finl
France Foreigners with permanent residence in France. Including trainees, students and illegalmigrants who accept to be interviewed. Excluding seasonal and cross-border workers.
Censuses, National Institute for Statisticsand Economic Studies (INSEE).
Germany Stock of foreign citizens recorded in the population register. Includes asylum seekers livingin private households. Excludes foreign-born persons of German origin (Aussiedler).Decrease in 2004 is due to cross checking of residence register and central registerof foreigners.Reference date: 31 December.
Central Population Register, Federal Officeof Statistics.
Greece Includes some undocumented foreigners.Reference date: 4th quarter.
Labour Force Survey, National Statistical S
Hungary Foreigners having a residence or a settlement document. From 2010 on, it includesrefugees. From 2011 on, it included persons under subsidiary protection. Data for 2011are adjusted on the basis of the census results.Reference date: 31 December.
Office of Immigration and Nationality,Central Statistical Office.
Iceland Data are from the National Register of Persons. It is to be expected that figuresare overestimates.Reference date: 31 December.
Statistics Iceland.
Ireland Census data 2002, 2006 and 2011. Estimates for other years. Central Statistics Office (CSO).
Italy Until 2003, data refer to holders of residence permits.Children under 18 who are registered on their parents’ permit are not counted. Data includeforeigners who were regularised following the 1998, 2002 and 2009 programmes.Since 2004, data refer to resident foreigners (those who are registered with municipalregistry offices).Reference date: 31 December.
Ministry of the Interiorand National Statistical Institute (ISTAT).
Japan Long-term foreign residents (status stated in the Immigration Control and RefugeeRecognition Act).Reference date: 31 December.
Ministry of Justice, Immigration Bureau.
Korea Foreigners staying in Korea more than 90 days and registered in population registers.Data have been revised since 2002 in order to include foreign nationals with Koreanancestors (called overseas Koreans) who enter with F-4 visa and are also registeredin population registers. The large increase in 2003 is mainly due to a regularisationprogramme introduced in that year.
Ministry of Justice.
Luxembourg Stock of foreign citizens recorded in population register. Does not include visitors(less than three months) and cross-border workers.Reference date: 31 December.2010 figures are extracted from the February 2011 census.
Population Register, Central Office of Statiand Economic Studies (Statec).
Mexico Number of foreigners who hold a valid permit for permanent residence (immigrants, FM2)or temporary residence (non immigrants, FM3).
National Migration Institute (INM).
Netherlands Stock of foreign citizens recorded in the population register. Figures include administrativecorrections and asylum seekers (except those staying in reception centres).Reference date: 1 January of the following year.
Population Register, Central Bureauof Statistics (CBS).
INTERNATIONAL MIGRATION OUTLOOK 2014 © OECD 2014398

STATISTICAL ANNEX
way.
ster,
lirs.
rior.
igration.
.
Norway Stock of foreign citizens recorded in the population register. It excludes visitors(less than six months) and cross-border workers.Reference date: 31 December.
Central Population Register, Statistics Nor
Poland 2002 census data cover permanent residents, excluding those who had been staying abroadfor more than 12 months. Foreign temporary residents who had been staying in Polandfor less than 12 months.From 2006 on, data are from the Central Population Register.
2002 Census and Central Population RegiCentral Statistical Office.
Portugal Holders of a valid residence permit. Data for 2001-04 include stay permits deliveredfollowing the 2001 regularisation programme. Data for 2005-07 include holders of a validresidence permit, of a valid stay permit (foreigners who renewed their stay permits)and holders of a long-term visa (both issued and renewed each year). Work visas issuedafter 2004 include the foreigners who benefited from the regularisation scheme andalso from the bilateral agreement concerning Brazilian workers. From 2009 on, withthe supression of the stay permits, figures include holders of a valid residence permitand of a long-term visa granted or renewed during the year.
Ministry of the Interior, National StatisticaInstitute (INE) and Ministry of Foreign Affa
Russian Federation 2002 and 2010 Censuses. Since 2012, holders of a temporary or permanent residencepermit.
Federal statistics service (Rosstat);Federal Migration Service.
Slovak Republic Holders of a permanent or long term residence permit. Register of Foreigners, Ministry of the Inte
Slovenia Number of valid residence permits, regardless of the administrative status of the foreignnational.Reference date: 31 December.
Central Population Register,Ministry of the Interior.
Spain Population register. Data include all registered foreign citizens independentlyof their administrative status.Reference date: 1 January (for a given year, data refer to the 1 January of the following year).
Municipal Registers,National Statistics Institute (INE).
Sweden Stock of foreign citizens recorded in the population register.Reference date: 31 December.
Population Register, Statistics Sweden.
Switzerland Stock of all those with residence or settlement permits (Permits B and C respectively).Holders of an L-Permit (short duration) are also included if their stay in the country is longerthan 12 months. Does not include seasonal or cross-border workers.Reference date: 31 December.
Register of Foreigners, Federal Office of M
United Kingdom Foreign residents. Those with unknown nationality from the New Commonwealthare not included (around 10 000 to 15 000 persons). There is a break in the series in 2004as a result of a new weighting procedure.Reference date: 31 December.
Labour Force Survey, Home Office.
United States Foreigners born abroad. Current Population Survey, Census Bureau
Data for Serbia may include persons from Montenegro.
Metadata related to Tables A.5. and B.5. Stocks of foreign population (cont.)
Comments Source
INTERNATIONAL MIGRATION OUTLOOK 2014 © OECD 2014 399

STATISTICAL ANNEX
Acquisitions of nationality
Nationality law can have a significant impact on the measurement of the national andforeign populations. In France and Belgium, for example, where foreigners can fairly easilyacquire the nationality of the country, increases in the foreign population throughimmigration and births can eventually contribute to a significant rise in the population ofnationals. On the other hand, in countries where naturalisation is more difficult, increasesin immigration and births among foreigners manifest themselves almost exclusively asgrowth in the foreign population. In addition, changes in rules regarding naturalisation canhave significant impact. For example, during the 1980s, a number of OECD countries madenaturalisation easier and this resulted in noticeable falls in the foreign population (andrises in the population of nationals).
However, host-country legislation is not the only factor affecting naturalisation. Forexample, where naturalisation involves forfeiting citizenship of the country of origin, theremay be incentives to remain a foreign citizen. Where the difference between remaining aforeign citizen and becoming a national is marginal, naturalisation may largely beinfluenced by the time and effort required to make the application, and the symbolic andpolitical value individuals attach to being citizens of one country or another.
Data on naturalisations are usually readily available from administrative sources. Thestatistics generally cover all means of acquiring the nationality of a country. These includestandard naturalisation procedures subject to criteria such as age or residency, etc. as wellas situations where nationality is acquired through a declaration or by option (followingmarriage, adoption or other situations related to residency or descent), recovery of formernationality and other special means of acquiring the nationality of the country.
INTERNATIONAL MIGRATION OUTLOOK 2014 © OECD 2014400

STATISTICAL ANNEX
2012
83 698
..
7 043
0.7
38 612
3.3
13 150
..
1 225
..
2 036
0.5
3 267
0.9
1 339
0.6
9 087
5.0
96 088
2.5
12 348
1.6
21 737
2.9
18 379
12.8
413
2.0
25 039
4.7
65 383
1.4
10 622
0.5
12 528
1.3
4 680
2.0
3 590
1.2
30 955
3.9
27 230
..
12 384
3.0
3 792
6.8
..
..
95 737
..
Table A.6. Acquisitions of nationality in OECD countries and the Russian FederationNumbers and percentages
2002 2003 2004 2005 2006 2007 2008 2009 2010 2011
Australia 86 858 81 001 88 470 94 164 104 333 137 493 119 811 86 654 119 383 95 235
% of foreign population .. .. .. .. .. .. .. .. .. ..
Austria 36 011 44 694 41 645 34 876 25 746 14 010 10 258 7 978 6 135 6 690
% of foreign population 4.9 6.0 5.5 4.5 3.2 1.7 1.2 0.9 0.7 0.7
Belgium 46 417 33 709 34 754 31 512 31 860 36 063 37 710 32 767 34 635 29 786
% of foreign population 5.5 4.0 4.0 3.6 3.5 3.9 3.9 3.2 3.3 2.7
Canada 141 591 155 117 193 620 198 724 260 803 199 871 176 575 156 349 143 678 181 338 1
% of foreign population 9.0 .. .. .. .. 11.4 .. .. .. ..
Chile 245 329 376 519 498 698 619 812 741 874
% of foreign population .. .. .. .. .. .. .. .. .. ..
Czech Republic 4 532 3 410 5 020 2 626 2 346 1 877 1 837 1 621 1 495 1 936
% of foreign population 2.1 1.5 2.1 1.0 0.8 0.6 0.5 0.4 0.3 0.5
Denmark 17 300 6 583 14 976 10 197 7 961 3 648 5 772 6 537 3 006 3 911
% of foreign population 6.5 2.5 5.5 3.8 2.9 1.3 1.9 2.0 0.9 1.1
Estonia 4 091 3 706 6 523 7 072 4 753 4 228 2 124 1 670 1 184 1 518
% of foreign population 1.5 1.4 2.4 2.7 1.9 1.7 0.9 0.7 0.5 0.7
Finland 3 049 4 526 6 880 5 683 4 433 4 824 6 682 3 413 4 334 4 558
% of foreign population 3.1 4.4 6.4 5.2 3.9 4.0 5.0 2.4 2.8 2.7
France 128 092 144 640 168 826 154 827 147 868 131 738 137 452 135 842 143 275 114 584
% of foreign population .. .. .. .. 4.2 3.6 3.7 3.6 3.7 3.0
Germany 154 547 140 731 127 153 117 241 124 566 113 030 94 470 96 122 101 570 106 897 1
% of foreign population 2.1 1.9 1.7 1.7 1.8 1.7 1.4 1.4 1.5 1.6
Greece .. .. .. .. .. 10 806 16 922 17 019 10 749 19 222
% of foreign population .. .. .. .. .. 1.9 2.6 2.3 2.0 2.4
Hungary 3 369 5 261 5 432 9 870 6 172 8 442 8 104 5 802 6 086 20 554
% of foreign population 2.9 4.5 4.2 6.9 4.0 5.1 4.6 3.1 3.1 9.8
Iceland 356 463 671 726 844 647 914 728 450 370
% of foreign population 3.6 4.5 6.6 6.8 6.1 3.5 3.9 3.0 2.1 1.7
Ireland 2 817 3 993 3 784 4 079 5 763 6 656 4 350 4 594 6 387 ..
% of foreign population .. 1.8 .. .. .. 1.6 .. .. .. ..
Italy 10 682 13 406 19 140 28 659 35 266 45 485 53 696 59 369 65 938 56 153
% of foreign population 0.7 0.9 1.0 1.2 1.3 1.5 1.6 1.5 1.6 1.2
Japan 14 339 17 633 16 336 15 251 14 108 14 680 13 218 14 785 13 072 10 359
% of foreign population 0.8 1.0 0.9 0.8 0.7 0.7 0.6 0.7 0.6 0.5
Korea 3 883 7 734 9 262 16 974 8 125 10 319 15 258 26 756 17 323 18 355
% of foreign population 1.7 2.8 2.0 3.5 1.6 1.6 1.9 3.0 1.9 1.8
Luxembourg 754 785 841 954 1 128 1 236 1 215 4 022 4 311 3 405
% of foreign population 0.5 0.5 0.5 0.5 0.6 0.6 0.6 1.9 2.0 1.5
Mexico 4 737 4 317 6 429 5 610 4 175 5 470 4 471 3 489 2 150 2 633
% of foreign population .. .. .. .. .. .. .. .. 0.8 0.9
Netherlands 45 321 28 799 26 173 28 488 29 089 30 653 28 229 29 754 26 275 28 598
% of foreign population 6.6 4.1 3.7 4.1 4.2 4.5 4.1 4.1 3.6 3.8
New Zealand 19 569 18 366 22 227 24 462 29 248 29 916 23 623 18 005 15 173 19 287
% of foreign population .. .. .. .. .. .. .. .. .. ..
Norway 9 041 7 867 8 154 12 655 11 955 14 877 10 312 11 442 11 903 14 637
% of foreign population 4.9 4.0 4.0 5.9 5.4 6.2 3.9 3.8 3.6 4.0
Poland 1 186 1 634 1 937 2 866 989 1 528 1 054 2 503 2 926 2 325
% of foreign population .. 3.3 .. .. .. 2.8 1.8 4.1 5.9 4.4
Portugal 1 369 1 747 1 346 939 3 627 6 020 22 408 24 182 21 750 23 238
% of foreign population 0.4 0.4 0.3 0.2 0.9 1.4 5.1 5.5 4.8 5.2
Russian Federation 272 463 31 528 330 419 504 518 366 488 367 699 361 363 394 137 111 298 134 980
% of foreign population .. 3.1 .. .. .. .. .. .. .. 19.6
INTERNATIONAL MIGRATION OUTLOOK 2014 © OECD 2014 401

STATISTICAL ANNEX
255
0.4
768
0.8
15 557
2.0
50 179
7.7
34 121
1.9
..
..
94 209
4.1
57 434
3.6
158445
t.)
2012
Slovak Republic .. 3 492 4 016 1 393 1 125 1 478 680 262 239 272
% of foreign population .. 11.8 13.8 6.3 4.4 4.6 1.7 0.5 0.4 0.4
Slovenia .. .. .. .. .. 823 1 448 1 690 1 807 1 798
% of foreign population .. .. .. .. .. .. .. .. 1.8 1.9
Spain 21 810 26 556 38 335 42 829 62 339 71 810 84 170 79 597 123 721 114 599 1
% of foreign population 1.1 1.0 1.3 1.1 1.5 1.6 1.6 1.4 2.2 2.0
Sweden 36 978 32 351 26 130 35 531 46 995 32 473 29 330 28 562 32 457 36 634
% of foreign population 7.8 6.9 5.8 7.8 10.3 6.7 5.7 5.1 5.5 5.8
Switzerland 36 515 35 424 35 685 38 437 46 711 43 889 44 365 43 440 39 314 36 757
% of foreign population 2.6 2.4 2.4 2.6 3.1 2.9 2.8 2.7 2.3 2.1
Turkey 23 725 21 086 8 238 6 901 5 072 .. .. .. .. ..
% of foreign population .. .. .. .. .. .. .. .. .. ..
United Kingdom 120 121 130 535 148 273 161 699 154 018 164 637 129 377 203 789 195 046 177 785 1
% of foreign population 4.6 5.1 5.4 5.7 5.1 4.9 3.4 4.9 4.5 3.9
United States 573 708 462 435 537 151 604 280 702 589 660 477 1046 539 743 715 619 913 694 193 7
% of foreign population 3.1 2.3 2.6 2.9 3.3 3.0 4.7 3.4 2.9 3.3
Note: For details on definitions and sources, refer to the metadata at the end of Tables B.6.1 2 http://dx.doi.org/10.1787/888933
Table A.6. Acquisitions of nationality in OECD countries and the Russian Federation (conNumbers and percentages
2002 2003 2004 2005 2006 2007 2008 2009 2010 2011
INTERNATIONAL MIGRATION OUTLOOK 2014 © OECD 2014402

STATISTICAL ANNEX
f which:omen12 (%)
48
45
57
56
49
50
67
47
56
53
52
49
44
51
75
51
158493
f which:omen12 (%)
43
58
60
60
56
69
37
57
47
45
49
56
62
76
77
54
158493
Table B.6. Acquisition of nationality by country of former nationalityAUSTRALIA
2002 2003 2004 2005 2006 2007 2008 2009 2010 2011 2012OW
20
United Kingdom 16 607 15 303 17 569 20 510 22 637 26 922 27 032 18 206 22 284 19 101 16 401
India 2 549 3 116 3 748 5 167 7 638 13 026 9 119 9 124 17 788 12 948 10 076
China 4 795 5 885 5 966 6 507 7 406 11 173 8 407 6 700 11 109 8 898 6 876
Philippines 2 884 2 994 3 163 3 738 3 825 5 187 3 841 3 453 4 505 4 051 5 592
South Africa 3 892 4 112 4 996 5 181 5 111 6 760 5 538 4 162 5 218 4 389 4 206
New Zealand 17 530 14 494 13 237 9 549 7 745 7 531 6 835 3 761 4 165 4 304 3 458
Viet Nam 2 124 1 719 2 268 2 108 2 146 2 634 2 177 1 522 2 000 1 688 1 929
Sri Lanka 1 384 1 354 1 651 1 741 2 002 3 613 2 937 2 203 3 412 2 520 1 671
Korea 821 656 957 1 146 1 770 2 491 2 395 1 211 2 409 2 321 1 570
Malaysia 1 530 1 647 1 876 1 863 2 046 2 974 2 742 1 778 2 216 2 207 1 487
United States 1 335 1 243 1 457 1 603 1 880 2 168 2 016 1 420 1 736 1 680 1 356
Bangladesh 331 298 392 586 797 1 202 1 072 1 756 2 940 1 178 1 183
Ireland 867 761 924 1 094 1 236 1 442 1 423 881 1 280 1 302 1 145
Zimbabwe 158 327 569 625 919 1 279 983 811 1 281 1 090 1 143
Thailand 500 551 725 912 1 069 1 482 1 253 874 1 762 1 343 1 125
Other countries 29 551 26 541 28 972 31 834 36 106 47 609 42 041 28 792 35 278 26 215 24 480
Total 86 858 81 001 88 470 94 164 104 333 137 493 119 811 86 654 119 383 95 235 83 698
Note: For details on definitions and sources, please refer to the metadata at the end of the tables.1 2 http://dx.doi.org/10.1787/888933
Table B.6. Acquisition of nationality by country of former nationalityAUSTRIA
2002 2003 2004 2005 2006 2007 2008 2009 2010 2011 2012OW
20
Turkey 12 623 13 665 13 004 9 545 7 542 2 076 1 664 1 242 937 1 178 1 198
Bosnia and Herzegovina 5 913 8 268 8 657 7 026 4 596 3 329 2 207 1 457 1 278 1 174 1 131
Serbia 4 806 9 836 7 245 6 681 4 825 4 254 2 595 2 003 1 268 1 092 723
Croatia 2 537 2 588 2 212 2 276 2 494 1 349 824 440 456 363 401
Russian Federation 161 83 194 235 228 128 127 135 137 296 316
Romania 1 774 2 096 1 373 1 128 981 455 382 246 114 223 275
Afghanistan 69 135 322 454 261 43 106 108 113 157 179
India 656 525 562 421 159 137 122 90 84 82 171
Iran 328 272 411 432 253 88 99 103 111 138 168
Former Yugoslav Republic of Macedonia 574 786 803 991 716 414 377 281 150 182 163
Egypt 599 615 616 506 382 100 121 124 94 97 152
Germany 85 106 135 135 122 113 67 174 132 117 110
China 715 591 545 323 182 57 67 76 58 97 110
Ukraine 104 146 230 182 145 81 70 80 75 106 99
Slovak Republic 318 196 174 171 124 56 46 50 66 64 77
Other countries 4 749 4 786 5 162 4 370 2 736 1 330 1 384 1 369 1 062 1 324 1 770
Total 36 011 44 694 41 645 34 876 25 746 14 010 10 258 7 978 6 135 6 690 7 043
Note: For details on definitions and sources, please refer to the metadata at the end of the tables.1 2 http://dx.doi.org/10.1787/888933
INTERNATIONAL MIGRATION OUTLOOK 2014 © OECD 2014 403

STATISTICAL ANNEX
f which:omen12 (%)
55
48
50
56
58
48
57
52
46
56
48
66
54
47
37
53
158493
f which:omen12 (%)
50
58
58
50
47
54
51
52
52
52
55
57
51
52
49
53
158493
Table B.6. Acquisition of nationality by country of former nationalityBELGIUM
2002 2003 2004 2005 2006 2007 2008 2009 2010 2011 2012OW
20
Morocco 15 832 10 565 8 704 7 977 7 753 8 722 8 427 6 919 7 380 7 035 7 879
Italy 2 341 2 646 2 271 2 086 2 360 2 017 1 762 1 700 2 833 3 697 3 203
Turkey 7 805 5 186 4 467 3 602 3 204 3 039 3 182 2 763 2 760 2 359 2 517
Democratic Republic of the Congo 2 809 1 785 2 566 1 917 1 567 1 793 1 795 1 555 1 603 1 158 1 936
Russian Federation 301 153 244 297 487 1 533 2 599 1 647 1 641 1 032 1 439
Netherlands 646 522 665 672 692 668 683 608 641 495 961
Cameroon .. 214 266 242 250 317 463 401 490 600 924
France 856 698 780 772 820 836 838 792 717 638 903
Algeria 926 826 826 739 658 687 744 739 739 584 863
Romania 294 277 314 332 429 554 480 362 395 356 777
Guinea .. 79 173 162 144 229 278 233 291 228 757
Poland 630 460 465 470 550 586 619 640 523 394 729
Rwanda 1 012 557 571 700 635 924 723 416 442 298 558
Iran .. 144 131 135 137 252 352 304 450 377 519
Togo .. 87 191 138 165 187 238 244 255 285 496
Other countries 12 965 9 510 12 120 11 271 12 009 13 719 14 527 13 444 13 475 10 250 14 151
Total 46 417 33 709 34 754 31 512 31 860 36 063 37 710 32 767 34 635 29 786 38 612
Note: For details on definitions and sources, please refer to the metadata at the end of the tables.1 2 http://dx.doi.org/10.1787/888933
Table B.6. Acquisition of nationality by country of former nationalityCANADA
2002 2003 2004 2005 2006 2007 2008 2009 2010 2011 2012OW
20
India 12 623 13 934 21 826 22 066 33 973 25 793 20 834 17 400 18 969 22 226 13 470
Philippines 7 622 8 225 9 022 11 036 15 570 12 197 11 668 11 068 11 608 16 154 10 553
China 16 321 20 021 25 138 25 775 34 477 24 348 21 027 16 013 13 425 15 567 10 412
Pakistan 7 292 6 494 10 676 12 429 17 123 11 624 9 434 7 841 8 062 9 934 5 631
United Kingdom 2 698 4 366 7 452 6 979 6 627 5 242 4 714 4 353 4 501 6 041 4 333
United States 2 812 3 859 5 288 5 057 5 118 4 267 4 133 3 735 3 714 5 089 3 834
Iran 5 712 5 135 4 616 4 984 8 087 5 335 4 988 3 829 3 585 4 941 3 528
Korea 3 464 4 350 5 909 5 426 7 558 5 861 5 251 3 838 3 166 4 093 3 071
Colombia 724 953 1 510 2 085 3 136 3 784 4 671 4 289 3 812 4 077 2 540
Sri Lanka 3 500 3 261 5 151 4 579 5 650 4 703 3 691 3 187 2 918 3 347 2 008
Romania 2 672 3 105 3 294 4 470 5 885 4 682 4 376 4 416 3 092 3 730 1 828
Russian Federation 3 379 3 438 3 796 4 076 4 619 3 673 3 323 2 712 2 371 2 973 1 702
Algeria 1 557 1 687 1 500 2 146 3 331 2 552 2 150 3 160 2 453 3 322 1 586
Jamaica 2 206 2 932 4 515 3 966 4 856 3 382 2 435 1 859 1 854 2 335 1 557
Bangladesh 1 553 1 527 2 053 2 860 3 415 2 023 1 873 2 140 2 284 2 890 1 484
Other countries 67 456 71 830 81 874 80 790 101 378 80 405 72 007 66 509 57 864 74 619 45 613
Total 141 591 155 117 193 620 198 724 260 803 199 871 176 575 156 349 143 678 181 338 113 150
Note: For details on definitions and sources, please refer to the metadata at the end of the tables.1 2 http://dx.doi.org/10.1787/888933
INTERNATIONAL MIGRATION OUTLOOK 2014 © OECD 2014404

STATISTICAL ANNEX
f which:omen12 (%)
60
54
48
55
63
36
62
66
67
35
47
33
57
50
44
54
158493
f which:omen12 (%)
..
..
..
..
..
..
..
..
..
..
..
..
..
..
..
..
158493
Table B.6. Acquisition of nationality by country of former nationalityCHILE
2002 2003 2004 2005 2006 2007 2008 2009 2010 2011 2012OW
20
Peru 30 52 84 123 117 196 174 170 156 214 305
Ecuador 4 2 12 20 21 43 62 72 89 97 173
Cuba 17 25 55 88 92 109 115 107 119 137 159
Colombia 2 14 13 16 19 44 26 61 54 75 149
Bolivia 76 96 59 99 93 95 69 114 93 119 115
Argentina 8 11 13 15 7 11 10 20 16 23 33
Chinese Taipei 15 20 16 45 46 44 35 60 39 15 29
China 28 30 40 18 25 24 16 46 29 24 29
Venezuela 1 4 1 2 3 9 8 14 17 22 21
Pakistan 1 2 2 9 7 10 4 17 15 16 17
Dominican Republic .. 2 2 1 1 1 5 .. 6 4 17
India 3 16 11 10 7 13 16 11 9 16 15
Russian Federation 1 .. 1 2 1 3 5 13 3 8 14
Spain 2 9 2 4 5 10 5 10 9 5 14
Brazil .. .. .. 2 .. .. 2 .. 6 5 9
Other countries 57 46 65 65 54 86 67 97 81 94 126
Total 245 329 376 519 498 698 619 812 741 874 1 225
Note: For details on definitions and sources, please refer to the metadata at the end of the tables.1 2 http://dx.doi.org/10.1787/888933
Table B.6. Acquisition of nationality by country of former nationalityCZECH REPUBLIC
2002 2003 2004 2005 2006 2007 2008 2009 2010 2011 2012OW
20
Ukraine 251 419 446 239 425 424 398 520 396 501 518
Slovak Republic 2 109 989 1 741 1 259 786 625 521 431 377 378 331
Poland 304 170 298 167 86 50 53 58 63 198 180
Russian Federation 65 7 86 134 107 102 84 58 50 68 173
Former Czechoslovakia 1 273 1 154 1 784 190 205 225 229 173 171 144 140
Viet Nam 29 46 47 62 43 40 42 44 52 86 80
Armenia 8 18 23 32 61 28 19 16 11 47 74
Romania 109 116 101 143 131 36 83 35 36 76 70
Belarus 13 14 21 35 27 39 27 20 15 38 49
Kazakhstan 43 156 89 43 129 18 121 21 17 48 30
Bosnia and Herzegovina 20 47 62 63 37 19 11 9 9 16 27
Moldova 4 4 1 11 9 33 21 23 15 32 25
Algeria 3 6 5 9 9 12 4 .. 10 17 22
Bulgaria 95 54 62 48 48 14 11 12 21 28 19
Syria 13 11 10 5 4 5 12 6 4 8 19
Other countries 193 199 244 186 239 207 201 195 248 251 279
Total 4 532 3 410 5 020 2 626 2 346 1 877 1 837 1 621 1 495 1 936 2 036
Note: For details on definitions and sources, please refer to the metadata at the end of the tables.1 2 http://dx.doi.org/10.1787/888933
INTERNATIONAL MIGRATION OUTLOOK 2014 © OECD 2014 405

STATISTICAL ANNEX
f which:omen11 (%)
49
43
50
55
58
61
51
64
44
61
35
42
64
50
51
51
158493
f which:omen12 (%)
66
63
80
0
50
0
100
100
0
0
100
100
55
158493
Table B.6. Acquisition of nationality by country of former nationalityDENMARK
2002 2003 2004 2005 2006 2007 2008 2009 2010 2011 2012OW
20
Iraq 1 161 153 1 015 961 1 113 515 1 166 1 201 368 838 ..
Afghanistan 301 40 367 282 260 178 359 790 354 576 ..
Somalia 2 263 324 2 022 1 709 923 317 527 264 142 233 ..
Turkey 2 418 2 158 732 878 1 125 527 581 511 239 227 ..
Iran 519 120 505 317 203 89 207 155 63 113 ..
Bosnia and Herzegovina .. .. .. .. 519 224 270 265 131 110 ..
China 289 203 339 382 281 162 181 199 103 103 ..
Norway .. .. .. .. 134 93 73 76 51 76 ..
Pakistan 573 94 332 305 172 93 191 214 21 73 ..
Sweden .. .. .. .. 66 48 39 52 58 64 ..
Ethiopia .. .. .. .. 58 32 71 116 98 62 ..
Former Yugoslavia 784 239 835 324 594 165 196 228 83 62 ..
Sri Lanka 594 119 678 332 148 73 127 74 20 58 ..
Viet Nam 508 280 318 232 213 129 78 144 86 58 ..
Thailand 172 62 180 114 95 61 79 96 64 57 ..
Other countries 7 718 2 791 7 653 4 361 2 057 942 1 627 2 152 1 125 1 201 ..
Total 17 300 6 583 14 976 10 197 7 961 3 648 5 772 6 537 3 006 3 911 ..
Note: For details on definitions and sources, please refer to the metadata at the end of the tables.1 2 http://dx.doi.org/10.1787/888933
Table B.6. Acquisition of nationality by country of former nationalityESTONIA
2002 2003 2004 2005 2006 2007 2008 2009 2010 2011 2012OW
20
Russian Federation .. .. .. .. .. .. .. .. .. 156 173
Ukraine .. .. .. .. .. .. .. .. .. 10 24
Belarus .. .. .. .. .. .. .. .. .. 1 5
India .. .. .. .. .. .. .. .. .. .. 5
Georgia .. .. .. .. .. .. .. .. .. 1 2
Finland .. .. .. .. .. .. .. .. .. .. 1
Armenia .. .. .. .. .. .. .. .. .. .. 1
Uzbekistan .. .. .. .. .. .. .. .. .. .. 1
United Kingdom .. .. .. .. .. .. .. .. .. .. 1
Kazakhstan .. .. .. .. .. .. .. .. .. 3 1
Lithuania .. .. .. .. .. .. .. .. .. 2 1
Latvia .. .. .. .. .. .. .. .. .. 1 1
Other countries 4 091 3 706 6 523 7 072 4 753 4 228 2 124 1 670 1 184 1 344 1 123
Total 4 091 3 706 6 523 7 072 4 753 4 228 2 124 1 670 1 184 1 518 1 339
Note: For details on definitions and sources, please refer to the metadata at the end of the tables.1 2 http://dx.doi.org/10.1787/888933
INTERNATIONAL MIGRATION OUTLOOK 2014 © OECD 2014406

STATISTICAL ANNEX
f which:omen12 (%)
65
54
60
49
44
50
54
35
46
51
58
57
74
44
39
55
158493
f which:omen12 (%)
48
47
43
46
49
50
72
63
56
70
49
50
55
64
55
51
158493
Table B.6. Acquisition of nationality by country of former nationalityFINLAND
2002 2003 2004 2005 2006 2007 2008 2009 2010 2011 2012OW
20
Russian Federation 418 1 682 2 313 2 094 1 399 1 665 2 211 1 026 1 925 1 652 2 477
Somalia 204 209 165 414 445 464 595 290 131 96 609
Estonia 319 468 690 291 176 182 262 166 243 302 521
Afghanistan 23 3 14 48 101 102 279 186 108 100 510
Iraq 217 165 447 346 405 443 379 207 78 106 457
Iran 68 124 225 233 213 218 329 180 137 145 451
Serbia 41 32 338 346 248 240 371 173 122 133 374
Turkey 112 141 171 128 110 102 195 94 132 166 278
Sudan 9 2 2 4 2 4 11 49 17 24 229
Sweden 61 94 149 198 178 163 274 126 104 196 190
Viet Nam 205 133 209 82 64 79 78 42 54 82 150
Ukraine 28 66 130 65 46 45 62 53 92 95 148
China 136 126 95 60 57 68 84 53 85 88 124
India 37 23 53 32 8 26 28 27 73 76 117
Bangladesh 26 23 43 34 26 42 40 19 32 53 114
Other countries 1 145 1 235 1 836 1 308 955 981 1 484 722 1 001 1 244 2 338
Total 3 049 4 526 6 880 5 683 4 433 4 824 6 682 3 413 4 334 4 558 9 087
Note: For details on definitions and sources, please refer to the metadata at the end of the tables.1 2 http://dx.doi.org/10.1787/888933
Table B.6. Acquisition of nationality by country of former nationalityFRANCE
2002 2003 2004 2005 2006 2007 2008 2009 2010 2011 2012OW
20
Morocco 33 967 36 875 .. 37 848 .. .. 28 699 26 097 27 637 20 965 16 720
Algeria 15 711 20 245 .. 25 435 .. .. 20 256 20 659 20 941 15 039 12 436
Tunisia 9 956 11 412 .. 12 012 .. .. 9 471 9 268 8 520 6 288 4 978
Turkey 10 468 10 492 .. 13 618 .. .. 10 202 9 171 8 448 6 333 4 804
Portugal 8 844 9 576 .. 8 888 .. .. 7 778 6 415 4 903 3 805 3 257
Senegal 1 858 2 185 .. 2 345 .. .. 3 038 3 364 3 508 2 825 2 437
Russian Federation 831 951 .. 1 132 .. .. 3 530 4 157 4 503 3 382 2 194
Cameroon 1 770 2 196 .. 2 081 .. .. 2 014 2 411 2 824 2 356 1 841
Côte d’Ivoire 1 495 1 869 .. 1 987 .. .. 2 197 2 565 3 003 2 161 1 663
Madagascar 1 352 1 628 .. 1 440 .. .. 1 360 1 498 1 691 1 570 1 635
Mali 774 947 .. 1 365 .. .. 2 237 2 704 2 698 2 054 1 626
Haiti 2 082 2 734 .. 2 744 .. .. 2 922 2 981 2 771 1 627 1 301
Democratic Republic of the Congo 1 572 2 012 .. 2 631 .. .. 2 402 2 294 2 293 1 698 1 258
Romania 808 954 .. 978 .. .. 787 822 99 1 195 1 226
China 850 1 229 .. 1 054 .. .. 1 122 1 407 1 220 1 198 1 178
Other countries 35 754 39 334 168 826 39 269 147 868 131 738 39 437 40 029 48 216 42 088 37 534
Total 128 092 144 640 168 826 154 827 147 868 131 738 137 452 135 842 143 275 114 584 96 088
Note: For details on definitions and sources, please refer to the metadata at the end of the tables.1 2 http://dx.doi.org/10.1787/888933
INTERNATIONAL MIGRATION OUTLOOK 2014 © OECD 2014 407

STATISTICAL ANNEX
f which:omen12 (%)
42
71
47
61
44
51
61
41
51
49
52
72
48
63
54
50
158493
f which:omen09 (%)
49
55
45
23
53
51
50
54
45
36
41
34
67
18
38
49
e is northernrve its
bers oftrol of
158493
Table B.6. Acquisition of nationality by country of former nationalityGERMANY
2002 2003 2004 2005 2006 2007 2008 2009 2010 2011 2012OW
20
Turkey 64 631 56 244 44 465 32 661 33 388 28 861 24 449 24 647 26 192 28 103 33 246
Poland 2 646 2 990 7 499 6 896 6 907 5 479 4 245 3 841 3 789 4 281 4 496
Greece 1 105 1 114 1 507 1 346 1 657 2 691 1 779 1 362 1 450 2 290 4 167
Ukraine 3 656 3 889 3 844 3 363 4 536 4 454 1 953 2 345 3 118 4 264 3 691
Iraq 1 721 2 999 3 564 4 136 3 693 4 102 4 229 5 136 5 228 4 790 3 510
Viet Nam 1 482 1 423 1 371 1 278 1 382 1 078 1 048 1 513 1 738 2 428 3 299
Russian Federation 3 734 2 764 4 381 5 055 4 679 4 069 2 439 2 477 2 753 2 965 3 167
Morocco 3 800 4 118 3 820 3 684 3 546 3 489 3 130 3 042 2 806 3 011 2 852
Serbia .. 400 3 539 8 824 12 601 10 458 6 484 4 309 3 405 2 978 2 746
Afghanistan 4 750 4 948 4 077 3 133 3 063 2 831 2 512 3 549 3 520 2 711 2 717
Iran 13 026 9 440 6 362 4 482 3 662 3 121 2 734 3 184 3 046 2 728 2 463
Romania 1 974 1 394 1 309 1 789 1 379 3 502 2 137 2 357 2 523 2 399 2 343
Italy 847 1 180 1 656 1 629 1 558 1 265 1 392 1 273 1 305 1 707 2 202
Kazakhstan 2 027 3 010 1 443 2 975 3 207 2 180 1 602 1 439 1 601 1 923 1 938
Bosnia and Herzegovina 2 357 1 770 2 103 1 907 1 862 1 797 1 878 1 733 1 945 1 703 1 865
Other countries 46 791 43 048 36 213 34 083 37 446 33 653 32 459 33 915 37 151 38 616 37 646
Total 154 547 140 731 127 153 117 241 124 566 113 030 94 470 96 122 101 570 106 897 112 348
Note: For details on definitions and sources, please refer to the metadata at the end of the tables.1 2 http://dx.doi.org/10.1787/888933
Table B.6. Acquisition of nationality by country of former nationalityGREECE
2002 2003 2004 2005 2006 2007 2008 2009 2010 2011 2012OW
20
Albania .. .. .. .. .. 5 688 9 996 14 271 .. .. ..
Georgia .. .. .. .. .. 489 1 285 550 .. .. ..
Russian Federation .. .. .. .. .. 475 834 410 .. .. ..
Turkey .. .. .. .. .. 223 212 175 .. .. ..
Australia .. .. .. .. .. 105 164 138 .. .. ..
Armenia .. .. .. .. .. 80 165 137 .. .. ..
Ukraine .. .. .. .. .. 68 167 129 .. .. ..
United States .. .. .. .. .. 105 175 127 .. .. ..
Germany .. .. .. .. .. 39 85 105 .. .. ..
Cyprus1, 2 .. .. .. .. .. 109 68 87 .. .. ..
Romania .. .. .. .. .. 83 79 63 .. .. ..
Bulgaria .. .. .. .. .. 105 89 62 .. .. ..
Canada .. .. .. .. .. 44 49 49 .. .. ..
Egypt .. .. .. .. .. 62 50 45 .. .. ..
Israel .. .. .. .. .. 82 81 40 .. .. ..
Other countries .. .. .. .. 3 049 3 423 631 .. .. ..
Total .. .. .. .. .. 10 806 16 922 17 019 .. 19 222 21 737
Note: For details on definitions and sources, please refer to the metadata at the end of the tables.1. Note by Turkey: The information in this document with reference to “Cyprus” relates to the southern part of the Island. Ther
single authority representing both Turkish and Greek Cypriot people on the Island. Turkey recognises the Turkish Republic of NoCyprus (TRNC). Until a lasting and equitable solution is found within the context of the United Nations, Turkey shall preseposition concerning the “Cyprus issue”.
2. Note by all the European Union Member States of the OECD and the European Union: The Republic of Cyprus is recognised by all memthe United Nations with the exception of Turkey. The information in this document relates to the area under the effective conthe Government of the Republic of Cyprus.
1 2 http://dx.doi.org/10.1787/888933
INTERNATIONAL MIGRATION OUTLOOK 2014 © OECD 2014408

STATISTICAL ANNEX
f which:omen12 (%)
50
65
47
68
69
45
38
52
78
36
21
38
36
10
78
52
158493
f which:omen12 (%)
69
50
48
77
50
76
38
58
58
91
33
38
57
100
100
60
158493
Table B.6. Acquisition of nationality by country of former nationalityHUNGARY
2002 2003 2004 2005 2006 2007 2008 2009 2010 2011 2012OW
20
Romania 2 238 3 415 3 605 6 890 4 303 6 052 5 535 3 805 3 939 15 658 14 392
Ukraine .. .. .. 828 541 834 857 558 646 2 189 1 765
Serbia .. .. .. 949 357 757 758 672 721 1 678 1 330
Slovak Republic .. .. .. 161 206 116 106 97 97 414 307
Russian Federation .. .. .. 162 111 7 156 119 111 168 151
Germany .. .. .. 25 22 28 33 35 25 55 67
Croatia .. .. .. 50 148 26 34 25 26 61 50
Viet Nam .. .. .. 53 40 53 95 39 75 38 29
Poland .. .. .. 26 10 10 14 13 9 27 18
Austria .. .. .. 6 6 3 8 7 4 20 14
Iran .. .. .. 10 7 11 6 18 14 7 14
United States .. .. .. 3 4 12 11 9 2 17 13
Syria .. .. .. 13 13 22 17 11 10 7 11
Israel .. .. .. 1 8 3 7 5 4 9 10
Mongolia .. .. .. 11 14 10 4 14 16 18 9
Other countries 1 131 1 846 1 827 682 382 498 463 375 387 188 199
Total 3 369 5 261 5 432 9 870 6 172 8 442 8 104 5 802 6 086 20 554 18 379
Note: For details on definitions and sources, please refer to the metadata at the end of the tables.1 2 http://dx.doi.org/10.1787/888933
Table B.6. Acquisition of nationality by country of former nationalityICELAND
2002 2003 2004 2005 2006 2007 2008 2009 2010 2011 2012OW
20
Philippines 45 64 59 45 105 69 126 106 67 35 49
Poland 48 67 133 184 222 162 164 153 50 35 30
Serbia .. .. 73 70 78 33 109 76 27 34 27
Thailand 50 51 48 50 54 45 62 40 28 27 26
Bosnia and Herzegovina 3 1 1 17 7 24 14 16 9 6 22
Russian Federation 5 11 33 23 24 17 38 17 21 12 21
Ukraine 2 4 18 6 9 13 18 18 15 10 21
United States 22 34 33 31 34 33 20 15 19 11 12
Romania 3 4 2 10 12 4 12 12 4 2 12
Sweden 6 5 7 16 11 9 1 5 3 6 11
Morocco 5 3 7 7 4 9 22 3 8 5 9
Viet Nam 9 8 19 23 41 16 52 51 39 14 8
Belarus .. 3 6 2 3 4 1 .. 2 1 7
Cuba 2 3 .. 4 2 .. 2 1 .. 5 7
Lithuania 3 1 9 7 5 23 23 9 11 8 6
Other countries 153 204 223 231 233 186 250 206 147 159 145
Total 356 463 671 726 844 647 914 728 450 370 413
Note: For details on definitions and sources, please refer to the metadata at the end of the tables.1 2 http://dx.doi.org/10.1787/888933
INTERNATIONAL MIGRATION OUTLOOK 2014 © OECD 2014 409

STATISTICAL ANNEX
f which:omen12 (%)
58
61
66
45
53
57
54
53
53
60
51
43
50
60
56
56
158493
f which:omen12 (%)
46
50
72
43
31
69
87
35
30
75
80
30
45
87
40
54
158493
Table B.6. Acquisition of nationality by country of former nationalityIRELAND
2002 2003 2004 2005 2006 2007 2008 2009 2010 2011 2012OW
20
Nigeria .. .. .. 155 189 142 319 454 1 012 1 204 5 689
Philippines .. .. .. 43 70 37 84 410 630 1 755 3 830
India .. .. .. 144 126 119 166 339 443 944 2 617
Pakistan .. .. .. 213 239 189 196 201 306 428 1 288
Ukraine .. .. .. 31 25 34 97 153 202 432 815
China .. .. .. 57 85 45 102 131 258 403 798
South Africa .. .. .. 257 363 219 205 318 343 418 708
Moldova .. .. .. 21 22 11 67 72 115 278 636
Bangladesh .. .. .. 8 20 25 41 146 238 700 566
Russian Federation .. .. .. 81 109 86 160 246 253 288 464
Romania .. .. .. 92 81 46 74 117 143 135 457
Sudan .. .. .. 40 39 40 80 123 170 280 419
Poland .. .. .. 20 37 7 10 13 29 25 359
Ghana .. .. .. 11 12 7 19 24 29 53 296
United States .. .. .. 890 1 518 1 841 875 156 112 148 263
Other countries 2 817 3 993 3 784 2 016 2 828 3 808 1 855 1 691 2 104 3 258 5 834
Total 2 817 3 993 3 784 4 079 5 763 6 656 4 350 4 594 6 387 10 749 25 039
Note: For details on definitions and sources, please refer to the metadata at the end of the tables.1 2 http://dx.doi.org/10.1787/888933
Table B.6. Acquisition of nationality by country of former nationalityITALY
2002 2003 2004 2005 2006 2007 2008 2009 2010 2011 2012OW
20
Morocco 624 1 132 1 046 .. 3 295 3 850 9 156 9 096 11 350 10 732 14 728
Albania 703 830 882 .. 2 330 2 605 4 546 9 523 9 129 8 101 9 493
Romania 968 977 847 .. 2 775 3 509 2 857 2 735 4 707 3 921 3 272
Tunisia 175 271 258 .. 371 920 1 666 2 066 2 003 2 067 2 555
India .. .. .. .. .. 188 672 894 1 261 1 051 2 366
Peru 305 383 253 .. .. 883 1 064 1 947 2 235 1 726 1 589
Ukraine 167 224 209 .. .. 1 389 1 601 1 131 1 820 1 199 1 580
Pakistan .. .. .. .. .. 91 219 349 535 601 1 522
Bangladesh .. .. .. .. .. 68 405 839 822 972 1 460
Brazil 604 726 579 .. 1 751 1 928 1 930 1 579 2 099 1 960 1 442
Russian Federation 439 463 436 .. 1 181 1 279 1 772 1 403 1 881 888 1 351
Egypt 195 264 283 .. 217 704 1 228 1 394 1 431 2 352 1 342
Ghana .. .. .. .. 213 301 1 121 1 061 790 801 1 288
Moldova .. .. .. .. .. 754 707 580 1 060 846 1 222
Former Yugoslav Republic of Macedonia .. .. .. .. .. 204 697 954 923 1 141 1 219
Other countries 6 502 8 136 14 347 28 659 23 133 26 812 24 055 23 818 23 892 17 795 18 954
Total 10 682 13 406 19 140 28 659 35 266 45 485 53 696 59 369 65 938 56 153 65 383
Note: For details on definitions and sources, please refer to the metadata at the end of the tables.1 2 http://dx.doi.org/10.1787/888933
INTERNATIONAL MIGRATION OUTLOOK 2014 © OECD 2014410

STATISTICAL ANNEX
f which:omen12 (%)
..
..
..
158493
f which:omen12 (%)
..
..
..
..
..
..
..
..
158493
f which:omen12 (%)
46
50
52
53
60
46
34
47
45
59
64
51
58
86
40
50
158493
Table B.6. Acquisition of nationality by country of former nationalityJAPAN
2002 2003 2004 2005 2006 2007 2008 2009 2010 2011 2012OW
20
Korea 9 188 11 778 11 031 9 689 8 531 8 546 7 412 7 637 6 668 5 656 5 581
China 4 442 4 722 4 122 4 427 4 347 4 740 4 322 5 392 4 816 3 259 3 598
Other countries 709 1 133 1 183 1 135 1 230 1 394 1 484 1 756 1 588 1 444 1 443
Total 14 339 17 633 16 336 15 251 14 108 14 680 13 218 14 785 13 072 10 359 10 622
Note: For details on definitions and sources, please refer to the metadata at the end of the tables.1 2 http://dx.doi.org/10.1787/888933
Table B.6. Acquisition of nationality by country of former nationalityKOREA
2002 2003 2004 2005 2006 2007 2008 2009 2010 2011 2012OW
20
China 3 344 6 146 7 443 14 881 7 156 8 878 12 545 20 700 12 324 11 599 6 283
Viet Nam 30 81 147 362 243 461 1 147 3 795 3 080 3 269 3 011
Philippines 112 928 1 074 786 317 335 579 832 461 517 339
Mongolia 10 43 36 109 32 82 134 184 197 175 110
Uzbekistan 6 21 34 79 38 60 80 118 89 102 75
Thailand 12 41 53 69 39 57 73 111 69 67 72
Pakistan 13 63 58 66 18 34 27 44 68 37 17
Other countries 356 411 417 622 282 412 673 972 1 035 2 589 2 621
Total 3 883 7 734 9 262 16 974 8 125 10 319 15 258 26 756 17 323 18 355 12 528
Note: For details on definitions and sources, please refer to the metadata at the end of the tables.1 2 http://dx.doi.org/10.1787/888933
Table B.6. Acquisition of nationality by country of former nationalityLUXEMBOURG
2002 2003 2004 2005 2006 2007 2008 2009 2010 2011 2012OW
20
Belgium 87 73 83 101 87 97 77 224 258 450 1 581
Portugal 147 158 188 252 338 352 293 1 242 1 351 1 085 1 155
France 65 57 44 51 74 75 76 277 342 314 462
Italy 119 120 111 97 161 138 109 362 665 425 411
Germany 47 50 62 79 74 95 76 322 333 208 201
Serbia .. .. .. 2 55 67 115 425 412 229 194
Bosnia and Herzegovina 6 8 22 29 46 72 76 270 202 114 74
United Kingdom 1 2 3 1 8 5 .. 62 53 44 56
Netherlands 11 17 6 7 20 10 20 31 50 38 54
United States .. .. 2 2 .. 2 3 47 44 32 42
Cape Verde 48 50 41 33 45 46 49 77 40 60 41
Spain 6 11 8 9 7 17 10 48 58 35 38
Ukraine .. 2 3 4 5 5 11 25 22 23 35
Switzerland .. .. 1 .. .. .. .. 30 29 20 30
Poland 6 9 10 10 3 4 4 30 27 27 25
Other countries 211 228 257 277 205 251 296 550 425 301 281
Total 754 785 841 954 1 128 1 236 1 215 4 022 4 311 3 405 4 680
Note: For details on definitions and sources, please refer to the metadata at the end of the tables.1 2 http://dx.doi.org/10.1787/888933
INTERNATIONAL MIGRATION OUTLOOK 2014 © OECD 2014 411

STATISTICAL ANNEX
f which:omen12 (%)
61
50
64
44
55
46
43
66
40
62
51
55
56
46
34
53
158493
f which:omen12 (%)
55
51
64
88
60
56
55
80
48
59
79
76
57
74
52
57
158493
Table B.6. Acquisition of nationality by country of former nationalityMEXICO
2002 2003 2004 2005 2006 2007 2008 2009 2010 2011 2012OW
20
Colombia 434 .. 901 813 689 892 690 390 305 486 634
Cuba 549 .. 661 666 429 660 459 307 240 408 579
Venezuela 39 .. 107 197 185 316 309 159 126 162 279
Argentina 142 .. 328 372 400 450 400 265 170 178 271
Guatemala 1 650 .. 1 624 247 114 185 141 209 95 117 196
Peru 226 .. 320 191 215 292 213 166 107 138 182
Spain 140 .. 218 301 239 286 251 227 121 152 180
Honduras 77 .. 118 156 59 123 98 131 55 92 143
United States 94 .. 215 286 334 287 246 266 117 79 108
El Salvador 208 .. 243 235 137 159 118 163 81 82 99
China 211 .. 310 324 188 211 241 154 145 58 76
Dominican Republic 13 .. 38 43 47 69 48 50 29 22 75
Ecuador 41 .. 64 67 52 83 63 41 41 46 63
Chile 29 .. 77 86 58 90 69 72 38 40 56
Italy 57 .. 93 99 89 94 108 76 39 45 53
Other countries 827 4 317 1 112 1 527 940 1 273 1 017 813 441 528 596
Total 4 737 4 317 6 429 5 610 4 175 5 470 4 471 3 489 2 150 2 633 3 590
Note: For details on definitions and sources, please refer to the metadata at the end of the tables.1 2 http://dx.doi.org/10.1787/888933
Table B.6. Acquisition of nationality by country of former nationalityNETHERLANDS
2002 2003 2004 2005 2006 2007 2008 2009 2010 2011 2012OW
20
Morocco 12 033 7 126 5 873 7 086 6 896 6 409 5 034 5 508 5 797 6 824 6 238
Turkey 5 391 3 726 4 026 3 493 3 407 4 073 3 147 4 167 4 984 5 029 4 292
Suriname 1 957 1 242 1 421 2 031 1 636 1 285 1 006 1 142 967 934 875
Thailand 289 171 161 160 171 195 220 383 413 571 602
Afghanistan 1 118 982 801 550 562 662 584 596 402 371 567
Ghana 357 157 74 199 296 314 283 411 367 519 540
Iraq 2 367 832 489 333 331 501 866 674 288 289 525
Brazil 249 137 131 159 189 173 201 307 272 307 408
India 250 138 117 187 214 214 153 263 193 292 406
Pakistan 241 132 83 204 199 199 174 251 208 279 388
Philippines 263 159 129 198 209 226 209 308 263 330 381
Indonesia 380 291 203 293 248 302 262 306 298 357 370
Iran 336 180 122 184 225 221 273 279 217 281 361
Poland 530 318 212 347 238 268 237 271 202 296 360
Egypt 437 190 97 238 245 304 255 337 259 309 325
Other countries 19 123 13 018 12 234 12 826 14 023 15 307 15 325 14 551 11 145 11 610 14 317
Total 45 321 28 799 26 173 28 488 29 089 30 653 28 229 29 754 26 275 28 598 30 955
Note: For details on definitions and sources, please refer to the metadata at the end of the tables.1 2 http://dx.doi.org/10.1787/888933
INTERNATIONAL MIGRATION OUTLOOK 2014 © OECD 2014412

STATISTICAL ANNEX
f which:omen12 (%)
48
48
51
48
54
54
57
52
53
49
56
49
69
57
50
51
158493
f which:omen12 (%)
50
51
49
61
54
76
50
51
76
53
49
52
52
61
65
53
158493
Table B.6. Acquisition of nationality by country of former nationalityNEW ZEALAND
2002 2003 2004 2005 2006 2007 2008 2009 2010 2011 2012OW
20
United Kingdom 2 196 2 286 2 388 2 450 2 933 3 607 3 505 2 974 2 617 4 450 5 636
Samoa 1 316 1 193 1 069 1 161 1 375 1 447 1 433 1 549 1 908 2 034 2 957
South Africa 1 972 1 996 2 411 2 433 2 805 3 119 2 413 1 808 1 339 2 105 2 784
India 1 356 1 257 2 136 2 926 4 346 5 211 3 431 2 246 1 567 1 649 2 271
Philippines 657 557 704 846 1 135 1 170 718 696 848 663 2 218
Fiji 1 147 1 053 1 456 1 551 1 693 1 729 1 938 1 536 1 307 1 212 2 081
China 1 901 2 041 2 856 3 339 3 901 3 084 1 919 1 131 676 846 1 159
Zimbabwe 129 110 415 585 817 902 653 368 265 632 703
United States 360 357 360 289 372 418 392 331 327 437 573
Korea 695 645 1 098 1 528 1 644 1 454 887 585 457 444 559
Malaysia 243 290 345 284 334 453 423 449 456 403 485
Tonga 271 207 199 169 193 260 279 315 378 337 460
Thailand 249 233 279 290 253 210 166 165 131 222 255
Netherlands 74 88 117 104 140 149 143 139 126 143 222
Myanmar 37 37 101 101 48 43 28 12 15 161 220
Other countries 6 966 6 016 6 293 6 406 7 259 6 660 5 295 3 701 2 756 3 549 4 647
Total 19 569 18 366 22 227 24 462 29 248 29 916 23 623 18 005 15 173 19 287 27 230
Note: For details on definitions and sources, please refer to the metadata at the end of the tables.1 2 http://dx.doi.org/10.1787/888933
Table B.6. Acquisition of nationality by country of former nationalityNORWAY
2002 2003 2004 2005 2006 2007 2008 2009 2010 2011 2012OW
20
Iraq 497 403 619 2 141 2 142 2 577 1 072 1 267 1 338 947 1 642
Somalia 546 392 526 1 250 1 281 2 196 1 315 1 737 1 528 2 131 1 571
Afghanistan 17 21 23 75 194 674 877 857 1 054 1 281 1 013
Russian Federation 308 280 365 548 458 436 515 622 673 644 629
Pakistan 829 497 568 694 590 544 773 469 430 526 478
Philippines 299 265 249 322 246 421 233 445 322 421 341
Myanmar 6 5 .. 7 .. 5 4 33 103 260 325
Iran 324 228 508 832 535 740 495 785 554 539 297
Thailand 257 193 234 299 263 427 247 483 267 380 265
Ethiopia 63 55 83 116 140 313 341 216 225 341 236
Congo .. 3 5 15 9 38 46 .. 142 189 222
Sweden 216 211 221 276 376 241 211 184 248 300 213
Eritrea 26 12 20 50 60 88 67 63 248 254 199
Liberia 3 2 .. 1 2 6 7 40 176 407 192
China 135 84 82 109 123 175 92 157 182 221 175
Other countries 5 515 5 216 4 651 5 920 5 536 5 996 4 017 4 084 4 413 5 796 4 586
Total 9 041 7 867 8 154 12 655 11 955 14 877 10 312 11 442 11 903 14 637 12 384
Note: For details on definitions and sources, please refer to the metadata at the end of the tables.1 2 http://dx.doi.org/10.1787/888933
INTERNATIONAL MIGRATION OUTLOOK 2014 © OECD 2014 413

STATISTICAL ANNEX
f which:omen12 (%)
67
63
69
47
39
40
1
48
11
1
40
3
5
52
66
50
158493
f which:omen12 (%)
..
..
..
..
..
..
..
..
..
..
..
..
..
..
..
..
158493
Table B.6. Acquisition of nationality by country of former nationalityPOLAND
2002 2003 2004 2005 2006 2007 2008 2009 2010 2011 2012OW
20
Ukraine 214 431 538 759 417 662 369 877 992 800 1 196
Belarus 54 108 129 316 101 126 152 357 418 320 456
Russian Federation 22 52 145 257 129 114 64 162 215 200 244
Germany 49 60 62 156 1 39 37 47 92 106 171
Armenia 13 8 6 18 27 30 16 79 101 103 163
Viet Nam 17 11 11 36 29 47 12 64 97 104 150
Egypt 5 1 2 18 6 13 .. 37 38 4 76
United States 9 32 41 59 8 23 27 47 50 53 75
Turkey 1 5 11 19 36 11 1 35 33 12 72
Nigeria 12 8 11 16 7 17 2 35 45 4 68
Canada 22 46 36 73 7 17 24 35 40 45 65
Tunisia 3 .. 5 17 4 6 4 19 35 3 61
India 3 7 9 23 11 19 3 35 24 12 55
Sweden 30 107 81 90 8 26 48 34 61 52 46
Kazakhstan 53 68 38 62 10 10 18 41 38 42 44
Other countries 679 690 812 947 188 368 277 599 647 465 850
Total 1 186 1 634 1 937 2 866 989 1 528 1 054 2 503 2 926 2 325 3 792
Note: For details on definitions and sources, please refer to the metadata at the end of the tables.1 2 http://dx.doi.org/10.1787/888933
Table B.6. Acquisition of nationality by country of former nationalityPORTUGAL
2002 2003 2004 2005 2006 2007 2008 2009 2010 2011 2012OW
20
Brazil 345 345 307 162 491 415 4 080 3 993 4 007 5 352 ..
Cape Verde 271 370 274 132 1 047 2 189 6 013 5 368 3 982 3 502 ..
Ukraine .. .. 2 2 12 .. 484 978 1 358 2 336 ..
Moldova .. .. 2 3 6 .. 2 230 2 896 2 675 2 324 ..
Angola 82 144 63 38 336 738 2 075 2 113 1 953 1 870 ..
Guinea-Bissau 73 38 95 36 873 1 602 2 754 2 442 1 847 1 815 ..
Sao Tome and Principe 34 58 22 7 134 448 1 391 1 289 1 097 1 156 ..
India 9 11 3 6 25 32 417 1 055 919 860 ..
Russian Federation .. .. 9 6 21 31 259 535 580 590 ..
Pakistan .. .. 2 4 21 32 74 200 388 476 ..
Romania .. .. 4 5 20 .. 209 258 303 469 ..
Guinea .. .. .. .. .. .. 450 717 475 313 ..
Mozambique 27 56 17 4 57 155 262 253 208 204 ..
Bangladesh .. .. .. .. .. 31 316 404 340 193 ..
Morocco .. .. .. .. .. .. 203 203 188 175 ..
Other countries 528 725 546 534 584 347 1 191 1 478 1 430 1 603 ..
Total 1 369 1 747 1 346 939 3 627 6 020 22 408 24 182 21 750 23 238 ..
Note: For details on definitions and sources, please refer to the metadata at the end of the tables.1 2 http://dx.doi.org/10.1787/888933
INTERNATIONAL MIGRATION OUTLOOK 2014 © OECD 2014414

STATISTICAL ANNEX
f which:omen12 (%)
..
..
..
..
..
..
..
..
..
..
..
..
..
..
..
..
158493
f which:omen12 (%)
65
46
50
56
64
63
0
50
100
33
33
67
100
0
0
51
158493
Table B.6. Acquisition of nationality by country of former nationalityRUSSIAN FEDERATION
2002 2003 2004 2005 2006 2007 2008 2009 2010 2011 2012OW
20
Kazakhstan 101 756 8 678 106 613 123 286 68 087 64 831 58 736 50 628 27 130 29 986 14 585
Uzbekistan 29 665 2 266 29 676 73 315 67 021 53 109 43 982 49 784 4 788 7 906 13 409
Armenia 14 573 1 722 23 139 39 330 34 860 39 328 45 253 54 828 6 261 7 847 13 176
Ukraine 53 396 7 623 50 593 94 133 66 502 55 424 58 500 62 025 5 715 7 783 12 803
Tajikistan 7 944 869 10 749 16 148 12 198 16 444 21 891 39 214 4 393 6 152 9 773
Kyrgyzstan 17 324 1 717 27 449 38 422 33 166 61 239 51 210 48 720 37 348 52 362 8 415
Azerbaijan 13 663 2 010 24 555 35 720 22 045 24 885 29 643 34 627 5 265 5 635 6 440
Moldova 6 740 366 7 283 13 727 12 809 13 876 15 782 20 429 1 992 2 802 5 252
Georgia 12 297 1 459 20 695 25 225 14 008 12 156 11 110 9 876 2 513 2 405 3 082
Belarus 6 399 563 10 179 12 943 7 919 6 572 7 099 6 062 3 888 3 993 1 547
Turkmenistan 3 551 398 5 358 7 713 5 577 4 737 4 444 4 026 482 544 753
Turkey 102 27 50 44 51 60 105 129 144 146 201
Latvia 1 184 196 954 1 062 756 516 466 469 135 169 178
Lithuania 609 56 488 722 496 460 539 430 149 151 173
Israel 50 17 27 61 37 46 64 85 124 129 146
Other countries 3 210 3 561 12 611 22 667 20 956 14 016 12 539 12 805 10 971 6 970 5 804
Total 272 463 31 528 330 419 504 518 366 488 367 699 361 363 394 137 111 298 134 980 95 737
Note: For details on definitions and sources, please refer to the metadata at the end of the tables.1 2 http://dx.doi.org/10.1787/888933
Table B.6. Acquisition of nationality by country of former nationalitySLOVAK REPUBLIC
2002 2003 2004 2005 2006 2007 2008 2009 2010 2011 2012OW
20
Ukraine .. 251 549 450 377 704 203 35 44 61 60
Serbia .. 443 506 185 42 112 53 46 57 53 56
Czech Republic .. 597 775 167 121 158 93 39 45 45 36
Romania .. 450 442 220 147 100 31 10 10 18 25
Viet Nam .. 405 619 40 40 62 37 7 15 5 11
Hungary .. 5 9 7 9 6 15 3 12 9 8
United States .. 97 136 64 113 110 93 9 7 6 6
Poland .. 43 26 14 20 18 7 1 5 4 4
Belarus .. 5 14 5 5 8 9 1 .. 4 4
Turkey .. 26 14 2 2 .. 1 .. 1 1 3
China .. 484 200 6 5 4 6 3 2 7 3
Russian Federation .. 65 96 37 35 42 31 4 8 8 3
Bulgaria .. 66 42 24 35 19 7 1 3 3 3
Tunisia .. 5 5 2 1 4 .. 1 .. 2 2
Germany .. 19 30 10 13 16 16 8 3 3 2
Other countries .. 531 553 160 160 115 78 94 27 43 29
Total .. 3 492 4 016 1 393 1 125 1 478 680 262 239 272 255
Note: For details on definitions and sources, please refer to the metadata at the end of the tables.1 2 http://dx.doi.org/10.1787/888933
INTERNATIONAL MIGRATION OUTLOOK 2014 © OECD 2014 415

STATISTICAL ANNEX
f which:omen12 (%)
42
49
52
47
48
54
36
86
50
43
50
17
50
60
75
47
158493
f which:omen12 (%)
59
62
41
54
66
63
53
59
59
70
48
51
74
62
62
56
158493
Table B.6. Acquisition of nationality by country of former nationalitySLOVENIA
2002 2003 2004 2005 2006 2007 2008 2009 2010 2011 2012OW
20
Bosnia and Herzegovina .. .. .. .. .. 368 445 467 556 622 305
Serbia .. .. .. .. .. 159 452 396 289 211 100
Italy .. .. .. .. .. 72 116 179 206 205 97
Former Yugoslav Republic of Macedonia .. .. .. .. .. 45 .. 140 194 177 59
Croatia .. .. .. .. .. 56 203 181 115 162 52
Argentina .. .. .. .. .. 15 21 59 77 56 24
United States .. .. .. .. .. .. 11 14 19 19 14
Ukraine .. .. .. .. .. .. 6 13 23 31 14
Australia .. .. .. .. .. 6 24 13 13 23 12
Germany .. .. .. .. .. 8 12 3 10 12 7
Russian Federation .. .. .. .. .. 5 7 19 6 17 6
Moldova .. .. .. .. .. .. 1 2 4 10 6
Venezuela .. .. .. .. .. .. 1 2 1 7 6
Brazil .. .. .. .. .. 3 4 5 25 36 5
France .. .. .. .. .. .. .. .. 6 4 4
Other countries .. .. .. .. .. -17 26 94 232 210 44
Total .. .. .. .. .. 823 1 448 1 690 1 807 1 798 768
Note: For details on definitions and sources, please refer to the metadata at the end of the tables.1 2 http://dx.doi.org/10.1787/888933
Table B.6. Acquisition of nationality by country of former nationalitySPAIN
2002 2003 2004 2005 2006 2007 2008 2009 2010 2011 2012OW
20
Ecuador 1 173 1 951 6 370 10 031 19 477 21 371 25 536 25 769 43 091 32 026 23 763
Colombia 1 267 1 801 4 194 7 334 12 720 13 852 15 409 16 527 23 995 19 803 19 396
Morocco 3 111 6 831 8 036 5 555 5 690 7 864 8 615 6 683 10 703 14 427 16 163
Peru 3 117 2 933 3 958 3 645 4 713 6 490 8 206 6 368 8 291 9 255 12 008
Bolivia 104 129 218 289 648 709 1 103 1 813 4 778 5 333 7 424
Dominican Republic 2 876 2 648 2 834 2 322 2 805 2 800 3 496 2 766 3 801 4 985 6 028
Argentina 997 1 009 1 746 2 293 3 536 4 810 5 188 4 629 6 395 5 482 5 217
Cuba 2 088 1 602 1 889 2 506 2 703 2 466 2 870 2 696 3 546 3 088 2 921
Venezuela 439 529 703 752 908 1 324 1 581 1 744 2 730 2 596 2 823
Brazil 477 500 683 695 782 779 1 049 943 1 738 1 854 2 540
Uruguay 219 235 327 408 624 839 1 201 1 451 2 219 1 978 1 819
Chile 353 350 484 620 844 838 1 141 1 090 1 688 1 556 1 589
Paraguay 46 23 42 60 87 78 179 298 766 864 1 297
Philippines 831 670 800 680 762 872 782 431 507 612 978
Mexico 352 344 451 437 567 593 763 584 932 856 862
Other countries 4 360 5 001 5 600 5 202 5 473 6 125 7 051 5 805 8 541 9 884 10 729
Total 21 810 26 556 38 335 42 829 62 339 71 810 84 170 79 597 123 721 114 599 115 557
Note: For details on definitions and sources, please refer to the metadata at the end of the tables.1 2 http://dx.doi.org/10.1787/888933
INTERNATIONAL MIGRATION OUTLOOK 2014 © OECD 2014416

STATISTICAL ANNEX
f which:omen12 (%)
42
66
81
59
52
57
46
50
64
51
50
50
49
53
47
51
158493
f which:omen12 (%)
..
..
..
..
..
..
..
..
..
..
..
..
..
..
..
..
158493
Table B.6. Acquisition of nationality by country of former nationalitySWEDEN
2002 2003 2004 2005 2006 2007 2008 2009 2010 2011 2012OW
20
Iraq 4 160 4 678 5 298 11 544 12 895 5 950 4 224 3 180 4 367 6 191 16 621
Finland 1 561 2 816 2 703 2 588 2 975 2 757 2 535 2 432 2 971 2 230 2 247
Thailand 606 443 500 585 876 1 007 1 261 1 314 1 429 1 547 1 908
Poland 2 604 1 325 990 793 1 000 762 686 824 1 487 1 791 1 649
Somalia 1 789 1 121 840 688 931 655 787 885 1 076 1 091 1 552
Iran 1 737 1 350 1 296 1 889 2 796 1 459 1 113 1 110 967 1 028 1 418
Turkey 2 127 1 375 1 269 1 702 2 921 1 456 1 125 1 200 1 049 1 343 1 325
Serbia .. .. .. .. .. 27 61 132 367 842 1 225
Russian Federation 626 642 535 886 1 510 919 759 865 769 948 957
Bosnia and Herzegovina 4 064 3 090 1 469 1 788 2 627 2 081 1 764 1 146 919 1 123 946
Afghanistan 285 278 361 623 1 062 777 812 1 180 848 636 853
Eritrea 195 139 121 199 297 202 253 356 327 398 743
Syria 1 063 1 218 1 117 1 208 1 314 596 512 500 428 690 679
Germany 243 209 244 294 457 386 606 700 923 778 661
Denmark 316 310 335 329 431 388 404 409 485 393 477
Other countries 15 602 13 357 9 052 10 415 14 903 13 051 12 428 12 329 14 045 15 605 16 918
Total 36 978 32 351 26 130 35 531 46 995 32 473 29 330 28 562 32 457 36 634 50 179
Note: For details on definitions and sources, please refer to the metadata at the end of the tables.1 2 http://dx.doi.org/10.1787/888933
Table B.6. Acquisition of nationality by country of former nationalitySWITZERLAND
2002 2003 2004 2005 2006 2007 2008 2009 2010 2011 2012OW
20
Italy 6 633 5 085 4 196 4 032 4 502 4 629 4 921 4 804 4 111 4 109 4 045
Serbia 5 803 6 332 7 854 9 503 11 721 10 441 10 252 8 453 6 859 4 359 3 463
Germany 817 670 639 773 1 144 1 361 3 022 4 035 3 617 3 544 3 401
Portugal 920 1 165 1 199 1 505 2 383 2 201 1 761 2 336 2 217 2 298 2 110
Turkey 4 128 4 216 3 565 3 467 3 457 3 044 2 866 2 593 2 091 1 886 1 662
France 1 367 1 215 1 181 1 021 1 260 1 218 1 110 1 314 1 084 1 325 1 229
Former Yugoslav Republic of Macedonia 1 639 1 802 1 981 2 171 2 596 2 210 2 287 1 831 1 586 1 337 1 223
Croatia 1 638 1 565 1 616 1 681 1 837 1 660 2 046 1 599 1 483 1 273 1 201
Bosnia and Herzegovina 1 865 2 268 2 371 2 790 3 149 3 008 2 855 2 408 1 924 1 628 1 163
Spain 691 800 823 975 1 283 1 246 1 096 1 245 1 120 1 091 1 055
United Kingdom 350 306 289 287 323 353 319 365 298 351 396
Austria 227 194 150 167 174 166 193 205 189 205 267
Belgium 118 .. .. .. .. .. 153 173 209 156 218
Netherlands 90 155 254 178 210 234 189 229 227 228 200
Poland 200 160 177 163 185 195 152 158 148 169 172
Other countries 10 029 9 491 9 390 9 724 12 487 11 923 11 143 11 692 12 151 12 798 12 316
Total 36 515 35 424 35 685 38 437 46 711 43 889 44 365 43 440 39 314 36 757 34 121
Note: For details on definitions and sources, please refer to the metadata at the end of the tables.1 2 http://dx.doi.org/10.1787/888933
INTERNATIONAL MIGRATION OUTLOOK 2014 © OECD 2014 417

STATISTICAL ANNEX
f which:omen12 (%)
..
..
..
..
..
..
..
..
..
..
..
..
..
..
..
..
158493
f which:omen12 (%)
..
..
..
..
..
..
..
..
..
..
..
..
..
..
..
50
158493
Table B.6. Acquisition of nationality by country of former nationalityTURKEY
2002 2003 2004 2005 2006 2007 2008 2009 2010 2011 2012OW
20
Bulgaria 13 178 12 423 3 528 3 299 1 769 .. .. .. .. .. ..
Azerbaijan 2 667 1 908 1 541 780 563 .. .. .. .. .. ..
Russian Federation 1 264 1 033 700 346 287 .. .. .. .. .. ..
Afghanistan 27 56 233 312 245 .. .. .. .. .. ..
Kazakhstan 379 450 398 272 195 .. .. .. .. .. ..
Syria 212 201 135 124 175 .. .. .. .. .. ..
Iraq 136 103 153 146 143 .. .. .. .. .. ..
Iran 121 112 178 156 137 .. .. .. .. .. ..
Greece 48 37 119 104 107 .. .. .. .. .. ..
United Kingdom 19 12 26 61 93 .. .. .. .. .. ..
Kyrgyzstan 147 146 140 129 88 .. .. .. .. .. ..
Uzbekistan 175 150 109 76 87 .. .. .. .. .. ..
Ukraine 618 598 87 58 85 .. .. .. .. .. ..
Former Yugoslav Republic of Macedonia 85 84 72 82 80 .. .. .. .. .. ..
Romania 886 455 52 84 76 .. .. .. .. .. ..
Other countries 3 763 3 318 767 872 942 .. .. .. .. .. ..
Total 23 725 21 086 8 238 6 901 5 072 .. .. .. .. .. ..
Note: For details on definitions and sources, please refer to the metadata at the end of the tables.1 2 http://dx.doi.org/10.1787/888933
Table B.6. Acquisition of nationality by country of former nationalityUNITED KINGDOM
2002 2003 2004 2005 2006 2007 2008 2009 2010 2011 2012OW
20
India 10 003 10 799 13 598 14 137 15 134 14 507 11 835 26 541 29 405 26 290 28 352
Pakistan 10 946 12 769 14 094 12 605 10 260 8 143 9 442 20 945 22 054 17 641 18 445
Nigeria 6 486 6 302 6 242 6 622 5 874 6 031 4 531 6 953 7 873 7 932 8 881
Philippines 1 344 1 609 2 011 3 797 8 839 10 844 5 382 11 751 9 429 7 133 8 122
China 2 362 1 863 1 918 2 425 2 601 3 117 2 677 6 041 7 581 6 966 7 198
South Africa 3 278 4 536 6 366 7 046 7 665 8 149 5 266 8 367 7 446 6 351 6 924
Sri Lanka 8 092 5 106 4 530 6 997 5 717 6 496 3 284 4 762 4 944 5 886 6 163
Bangladesh 5 737 6 133 5 786 3 637 3 724 2 257 3 633 12 041 7 966 5 149 5 702
Zimbabwe 798 1 428 1 814 2 128 2 556 5 592 5 707 7 703 6 301 4 877 5 647
Somalia 7 498 8 544 11 164 8 297 9 029 7 450 7 163 8 139 5 817 4 664 5 143
Ghana 3 080 3 515 3 217 3 307 2 989 3 373 3 134 4 662 4 551 3 931 4 744
Turkey 8 040 4 916 4 860 6 767 5 583 4 709 4 641 7 207 4 630 3 627 4 726
Afghanistan 874 1 612 4 055 4 951 3 397 10 554 5 539 5 012 5 281 3 951 4 600
Nepal 88 161 190 655 916 1 047 929 1 551 2 118 3 468 4 282
Iran 2 849 1 817 2 241 3 522 3 283 4 426 2 199 2 876 2 587 5 540 4 135
Other countries 48 646 59 425 66 187 74 806 66 451 67 942 54 015 69 238 67 063 64 379 71 145
Total 120 121 130 535 148 273 161 699 154 018 164 637 129 377 203 789 195 046 177 785 194 209
Note: For details on definitions and sources, please refer to the metadata at the end of the tables.1 2 http://dx.doi.org/10.1787/888933
INTERNATIONAL MIGRATION OUTLOOK 2014 © OECD 2014418

STATISTICAL ANNEX
f which:omen12 (%)
..
..
..
..
..
..
..
..
..
..
..
..
..
..
..
55
158493
Table B.6. Acquisition of nationality by country of former nationalityUNITED STATES
2002 2003 2004 2005 2006 2007 2008 2009 2010 2011 2012OW
20
Mexico 76 531 55 946 63 840 77 089 83 979 122 258 231 815 111 630 67 062 94 783 102 181
Philippines 30 487 29 043 31 448 36 673 40 500 38 830 58 792 38 934 35 465 42 520 44 958
India 33 774 29 761 37 975 35 962 47 542 46 871 65 971 52 889 61 142 45 985 42 928
Dominican Republic 15 591 12 607 15 464 20 831 22 165 20 645 35 251 20 778 15 451 20 508 33 351
China 32 018 23 991 27 309 31 708 35 387 33 134 40 017 37 130 33 969 32 864 31 868
Cuba 10 889 7 698 11 236 11 227 21 481 15 394 39 871 24 891 14 050 21 071 31 244
Colombia 10 634 7 939 9 819 11 396 15 698 12 089 22 926 16 593 18 417 22 693 23 972
Viet Nam 36 835 25 933 27 480 32 926 29 917 27 921 39 584 31 168 19 313 20 922 23 490
Haiti 9 280 7 247 8 215 9 740 15 979 11 552 21 229 13 290 12 291 14 191 19 114
El Salvador 10 716 8 719 9 602 12 174 13 430 17 157 35 796 18 927 10 343 13 834 16 685
Jamaica 13 973 11 218 12 271 13 674 18 953 12 314 21 324 15 098 12 070 14 591 15 531
Korea 17 307 15 928 17 184 19 223 17 668 17 628 22 759 17 576 11 170 12 664 13 790
Peru 7 375 6 130 6 980 7 904 10 063 7 965 15 016 10 349 8 551 10 266 11 814
Pakistan 8 658 7 424 8 744 9 699 10 411 9 147 11 813 12 528 11 601 10 655 11 150
Brazil 3 885 3 091 4 074 4 583 7 028 5 745 8 808 7 960 8 867 10 251 9 884
Other countries 255 755 209 760 245 510 269 471 312 388 261 827 375 567 313 974 280 151 306 395 325 474
Total 573 708 462 435 537 151 604 280 702 589 660 477 1 046 539 743 715 619 913 694 193 757 434
Note: For details on definitions and sources, please refer to the metadata at the end of the tables.1 2 http://dx.doi.org/10.1787/888933
INTERNATIONAL MIGRATION OUTLOOK 2014 © OECD 2014 419

STATISTICAL ANNEX
tection.
ce.
tice.
trativetorate.
ty,
Metadata related to Tables A.6. and B.6. Acquisition of nationality
Comments Source
Australia Conferrals by former country of citizenship. Department of Immigration and Border Pro
Austria Data refer to persons living in Austria at the time of acquisition. Statistics Austria and BMI(Ministry of the Interior).
Belgium All types of naturalisation. Include only foreigners who were living in Belgium when they gotnaturalised.
Directorate for Statistics and EconomicInformation (DGSEI) and Ministry of Justi
Canada Data refer to country of birth, not to country of previous nationality.Persons who acquire Canadian citizenship may also hold other citizenships at the same timeif allowed by the country of previous nationality.
Citizenship and Immigration Canada.
Chile Register of residence permits. Department of Foreigners and Migration,Ministry of the Interior.
Czech Republic Acquisition of nationality by declaration or by naturalisation. Ministry of the Interior.
Denmark Statistics Denmark.
Estonia Ministry of the Interior.
Finland Includes naturalisations of persons of Finnish origin. Statistics Finland.
France Data by former nationality for naturalisations by “anticipated declaration” is unknownfor the years 2004, 2006 and 2007.
Ministry of the Interior and Ministry of Jus
Germany Figures do not include ethnic Germans. Federal Office of Statistics.
Greece Data refer to all possible types of citizenship acquisition: naturalisation, declaration(for Greek descents), adoption by a Greek, etc.
Ministry of the Interior.
Hungary A simplified procedure was introduced in 2011, and made it possible to obtain citizenshipwithout residence in Hungary for the foreign citizens who have Hungarian ancestors.For all others, data only include naturalised persons who are resident in Hungary.
Hungarian Central Statistical Office,National Employment Office.
Iceland Includes children who receive Icelandic citizenship with their parents. Statistics Iceland.
Ireland From 2005 on, figures include naturalisations and Post nuptial citizenship figures. Department of Justice and Equality.
Italy Ministry of the Interior.
Japan Ministry of Justice, Civil Affairs Bureau.
Korea Ministry of Justice.
Luxembourg Excludes children acquiring nationality as a consequence of the naturalisation of their parents. Ministry of Justice.
Mexico Ministry of Foreign Affairs (SRE).
Netherlands Central Bureau of Statistics (CBS).
New Zealand The country of origin of persons granted New Zealand citizenship is the country of birth if birthdocumentation is available. If not, the country of origin is the country of citizenship as shownon the person’s passport.
Department of Internal Affairs.
Norway Statistics Norway.
Poland From 2002 on, data include naturalisations by marriage and acknowledgment of personsof Polish descent, in addition to naturalisation by ordinary procedure.
Office for Repatriation and Aliens.
Portugal From 2008 on, following the modification of the law on Portuguese citizenship in 2006and 2007, the data include every foreigner who used to have a foreign citizenship and obtainedPortuguese citizenship in the given year.Until 2007, data exclude acquisitions of nationality due to marriage or adoption.
National Statistical Office (INE)and Ministry of Justice (Central register).
Russian Federation Excludes citizenship acquired through consulates. From 2009 on, applicantsto Russian citizenship must have stayed in the country as temporary residents for at leasta year, and as permanent residents for at least five years. Majority of applicants acquirecitizenship through simplified procedure, waiting period is much shorter.
Federal Migration Service.
Slovak Republic Data refer to persons living in Slovak Republic at the time of acquisition. Ministry of the Interior.
Slovenia Include all grounds on which the citizenship was obtained. Ministry of the Interior – Internal AdminisAffairs, Migration and Naturalisation Direc
Spain Includes only naturalisations on grounds of residence in Spain. Excludes individuals recoveringtheir former (Spanish) nationality.
Ministry of Employment and Social Securibased on naturalisations registeredby the Ministry of Justice.
Sweden Statistics Sweden.
Switzerland Federal Office of Migration.
Turkey Ministry of Interior, General Directorateof Population and Citizenship Affairs.
United Kingdom The increase in 2009 is partly due to the processing of a backlog of applications filled priorto 2009.
Home Office.
United States Data by country of birth refer to fiscal years (October to September of the year indicated). US Department of Homeland Security.
Data for Serbia may include persons from Montenegro.
INTERNATIONAL MIGRATION OUTLOOK 2014 © OECD 2014420

ABBREVIATIONS
Abbreviations
AANZFTA ASEAN-Australia-New Zealand Free Trade Area
ACIDI Portugal High Commission for Immigration and Intercultural Dialogue
ALMP Active Labour Market Programmes
ANZSCO Australian and New Zealand Standard Classification of Occupations
DIBP Department of Immigration and Border Protection
DfID Department for International Development (DfID)
ECA Educational Credential Assessment
EEA European Economic Area
ENIC European Network of National Information Centres
EoI Expression of Interest
EPS Employment permit system (Korea)
ESID Essential Skills in Demand
EU European Union
EURES European Employment Services
FIC Forum Island Countries
FSWP Federal Skilled Workers Programme
FTA Free Trade Agreement
GATS General Agreement on Trade and Services
ICT Intra-Company Transfer
IOM International Organisation for Migration
ITA Invitation to Apply
ISCO The International Standard Classification of Occupations
LFS Labour Force Survey
LMC Labour Market Check
LMT Labour Market Test
LTSSL Long Term Skill Shortage List
MAC Migration Advisory Committee
MINT Mathematics, Informatics, Natural Sciences or Technology
NAFTA The North American Free Trade Agreement
NARIC National Academic Recognition and Information Centres
OEEC Organisation for European Economic Co-operation
PACER The Pacific Agreement on Closer Economic Relations
PBS Points-Based System
PES Public Employment System
PIC Pacific Island Country
RSE Recognised Seasonal Employer Scheme
SEF Services for Foreigners and Border Control
SMC Skilled Migrant Category
STEM Science, Technology, Engineering and Mathematics
INTERNATIONAL MIGRATION OUTLOOK 2014 © OECD 2014 421

ABBREVIATIONS
SWP Seasonal Workers Programme
TCN Third country national (non-EU/EEA national)
USCIS United States Citizenship and Immigration Services
VAC Visa Application Centres
VEVO Visa Entitlement Verification Online
WHM Working Holiday Maker
WHS Working Holiday Scheme
INTERNATIONAL MIGRATION OUTLOOK 2014 © OECD 2014422

LIST OF THE MEMBERS OF THE OECD EXPERT GROUP ON MIGRATION
List of the members of the OECD Expert Groupon Migration
AUSTRALIA David SMITH
Department of Immigration and Citizenship, Canberra
AUSTRIA Gudrun BIFFL
Danube University, Krems
BELGIUM Frédéric POUPINEL de VALENCÉ
Service public fédéral Emploi, Travail et Concertation sociale,
Brussels
BULGARIA Daniela BOBEVA
Bulgarian National Bank, Sofia
CANADA Martha JUSTUS
Citizenship and Immigration Canada, Ottawa
CHILE Reginaldo FLORES
Ministry of Interior, Santiago
CZECH REPUBLIC Jarmila MAREŠOVÁ
Czech Statistical Office, Prague
DENMARK Natalia KJAER
Danish Ministry for Social Affairs and Integration, Copenhagen
ESTONIA Liis VALK
Police and Border Guard Board, Tallinn
FINLAND Arja SAARTO
Ministry of Interior, Helsinki
FRANCE Yves BREEM
Ministry of the Interior, Paris
GERMANY Farid EL KHOLY
Ministry of Labour and Social Affairs, Berlin
GREECE Anna TRIANDAFYLLIDOU
Hellenic Foundation for European and Foreign Politic, Athens
HUNGARY Orsolya KISGYÖRGY
Ministry of National Economy, Budapest
IRELAND Philip O’CONNELL
The Economic and Social Research Institute, Dublin
ISRAEL Gilad NATHAN
Ruppin Academic Center, Jerusalem
ITALY Carla COLLICELLI and Maurizio MASTROLEMBO
CENSIS, Rome
INTERNATIONAL MIGRATION OUTLOOK 2014 © OECD 2014 423

LIST OF THE MEMBERS OF THE OECD EXPERT GROUP ON MIGRATION
JAPAN Masaki SUGAMIYA
Ministry of Justice, Tokyo
Mari YAMAMOTO
Ministry of Health, Labour and Welfare, Tokyo
KOREA Yongjin NHO
Seoul National University of Technology, Seoul
LITHUANIA Audra SIPAVI IEN
Vilnius
LUXEMBOURG Christiane MARTIN
Office luxembourgeois de l’Accueil et de l’Intégration
MEXICO Rafael FERNÁNDEZ DE CASTRO
Mexico Autonomous Institute of Technology, Mexico
NETHERLANDS Godfried ENGBERSEN and Eric SNEL
Erasmus University, Rotterdam
NEW ZEALAND Paul MERWOOD
Department of Labour, Wellington
NORWAY Espen THORUD
Ministry of Children, Equality and Social Inclusion, Oslo
POLAND Pawel KACZMARCZYK
University of Warsaw
PORTUGAL Jorge MALHEIROS
University of Lisbon
ROMANIA Mihaela MATEI
Bucharest
RUSSIAN FEDERATION Olga CHUDINOVSKIKH
Centre for Population Studies, Moscow
SLOVAK REPUBLIC Martina LUBYOVA
Slovak Academy of Sciences, Bratislava
SLOVENIA Sonja MALEC
Ministry of Labour, Family and Social Affairs, Ljubljana
SPAIN Diego NUÑO
Ministry for Foreign Affairs and Co-operation, Madrid
SWEDEN Michael HAGOS
Ministry of Employment, Stockholm
SWITZERLAND Clovis VOISARD and Kathrin GÄUMANN
Federal Office of Migration, Berne
TURKEY Ahmet ICDUYGU
Koç University, Istanbul
UNITED KINGDOM John SALT
University College London, Department of Geography, London
INTERNATIONAL MIGRATION OUTLOOK 2014 © OECD 2014424

LIST OF OECD SECRETARIAT MEMBERS INVOLVED IN THE PREPARATION OF THIS PUBLICATION
List of OECD Secretariat members involvedin the preparation of this publication
International Migration DivisionJean-Christophe Dumont, Head of Division
Thomas Liebig, Principal Administrator
Theodora Xenogiani, Principal Administrator
Jonathan Chaloff, Administrator
Cécile Thoreau, Administrator
Friedrich Poeschel, Administrator
Emily Farchy, Administrator
Yves Breem, Secondee
Sankar Ramasamy, Secondee
Philippe Hervé, Statistician
Véronique Gindrey, Statistician
Cansin Arslan, Consultant
Thomas Huddleston, Consultant
Rachele Poggi, Consultant
Anne-Sophie Schmidt, Consultant
Sylviane Yvron, Assistant
Natalie Lagorce, Assistant
Salomé Drouard, Trainee
INTERNATIONAL MIGRATION OUTLOOK 2014 © OECD 2014 425


l and
and
, the
tting
good
ublic,
orea,
enia,
takes
and
and
ORGANISATION FOR ECONOMIC CO-OPERATIONAND DEVELOPMENT
The OECD is a unique forum where governments work together to address the economic, socia
environmental challenges of globalisation. The OECD is also at the forefront of efforts to understand
to help governments respond to new developments and concerns, such as corporate governance
information economy and the challenges of an ageing population. The Organisation provides a se
where governments can compare policy experiences, seek answers to common problems, identify
practice and work to co-ordinate domestic and international policies.
The OECD member countries are: Australia, Austria, Belgium, Canada, Chile, the Czech Rep
Denmark, Estonia, Finland, France, Germany, Greece, Hungary, Iceland, Ireland, Israel, Italy, Japan, K
Luxembourg, Mexico, the Netherlands, New Zealand, Norway, Poland, Portugal, the Slovak Republic, Slov
Spain, Sweden, Switzerland, Turkey, the United Kingdom and the United States. The European Union
part in the work of the OECD.
OECD Publishing disseminates widely the results of the Organisation’s statistics gathering
research on economic, social and environmental issues, as well as the conventions, guidelines
standards agreed by its members.
OECD PUBLISHING, 2, rue André-Pascal, 75775 PARIS CEDEX 16
(81 2014 10 1 P) ISBN 978-92-64-21118-6 – 2014

Special Focus: Mobilising Migrants’ Skills for Economic Success
Consult this publication on line at http://dx.doi.org/10.1787/migr_outlook-2014-en.
This work is published on the OECD iLibrary, which gathers all OECD books, periodicals and statistical databases.Visit www.oecd-ilibrary.org for more information.
International Migration Outlook 2014
International Migration Outlook 2014Contents
Editorial
Executive summary
Chapter 1. Recent developments in international migration trends
Chapter 2. Labour market integration of immigrants and their children: Developing, activating and using skills
Chapter 3. Managing labour migration: Smart policies to support economic growth
Chapter 4. Country notes: Recent changes in migration movements and policies
Statistical Annex
www.oecd.org/migration/imo
ISBN 978-92-64-21118-681 2014 10 1 P
Internatio
nal M
igratio
n Ou
tloo
k 2014