international trade patterns and trends in international trade gains from trade absolute and...
TRANSCRIPT

International Trade
•Patterns and Trends in International Trade
•Gains from trade
•Absolute and comparative advantage revisited
•Tariffs
•Quotas
•Welfare loss from trade restrictions
•Arguments for trade restrictions
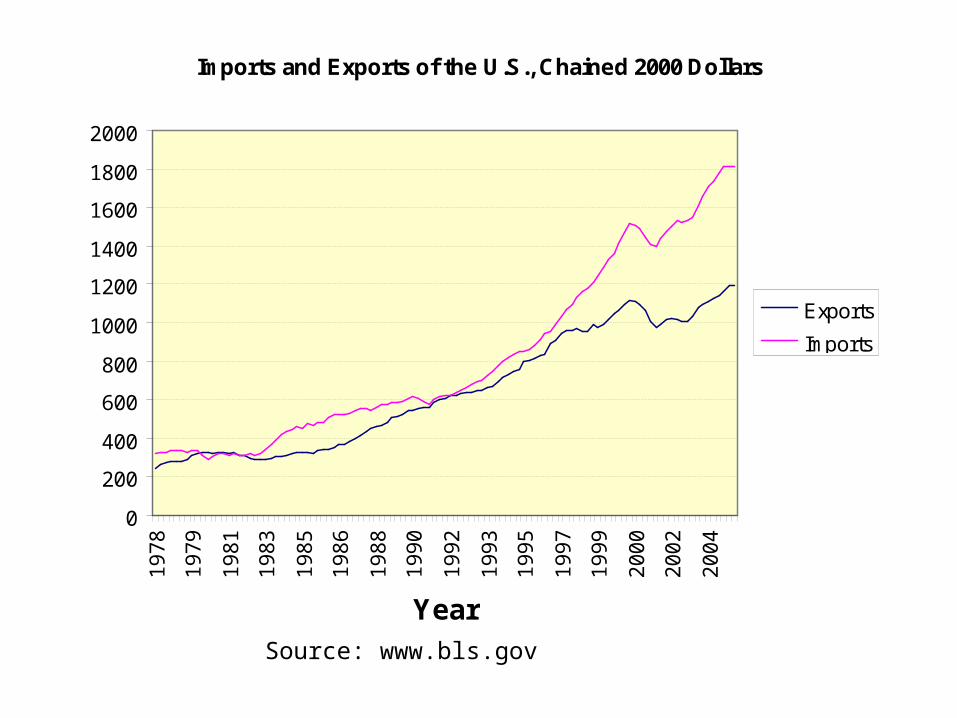
Imports and Exports of the U.S., Chained 2000 Dollars
0
200
400
600
800
1000
1200
1400
1600
1800
20001
97
8
19
79
19
81
19
83
19
85
19
86
19
88
19
90
19
92
19
93
19
95
19
97
19
99
20
00
20
02
20
04
Year
Exports
Imports
Source: www.bls.gov


8
10
12
14
16
18
20
1980 1985 1990 1995 2000 2005
Import Share of Gross Domestic Product in the USA (Percent)
Year/Quarter
Source: Bureau of Economic Analysis
Recessions are shaded

-700
-600
-500
-400
-300
-200
-100
0
90 92 94 96 98 00 02 04 06 08
Figure 1: Net Exports of the United StatesBillions of chained 2000 dollars
Year/Quarter
Source: Bureau of Economic Analysis

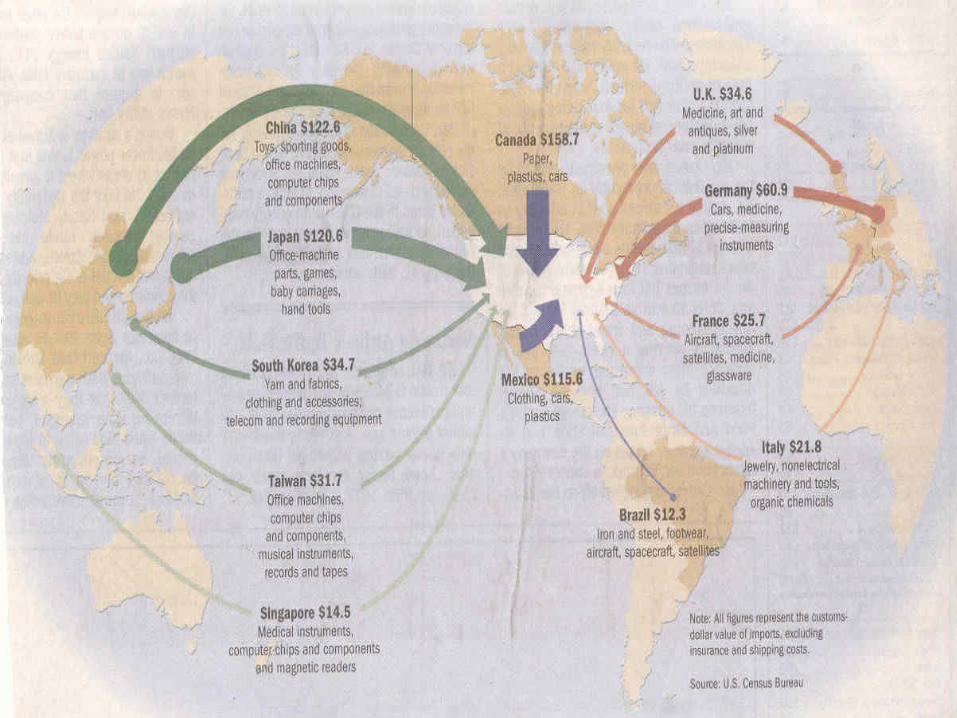
Composition of U.S. Imports and Exports
• Composition of US merchandise exports and imports in 2006
7
8
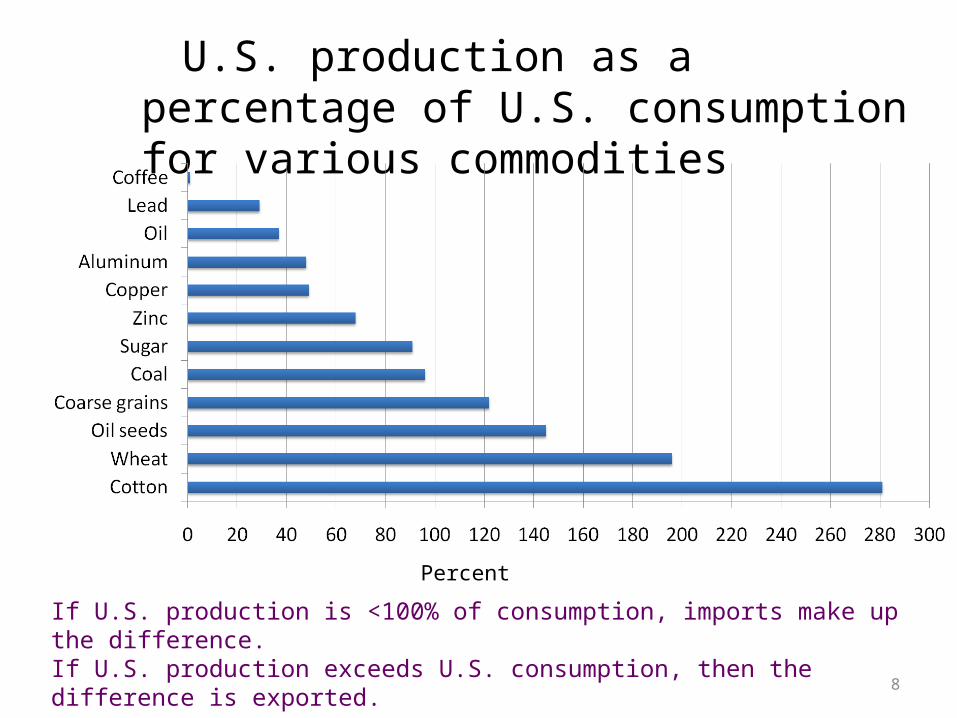
U.S. production as a percentage of U.S. consumption for various commodities
If U.S. production is <100% of consumption, imports make up the difference.If U.S. production exceeds U.S. consumption, then the difference is exported.
Percent

Ricardo’s principle of comparative advantage shows how trade between nations can be mutually beneficial

11
Production possibilities for United States and Izodia
(a) United StatesProduction possibilities with 100 million workers
(millions of units per day)
U1 U2 U3 U4 U5 U6
FoodClothing
6000
48060
360120
240180
120240
0300
(b) IzodiaProduction possibilities with 200 million workers
(millions of units per day)
I1 I2 I3 I4 I5 I6
FoodClothing
2000
16080
120160
80240
40320
0400

12
Production possibilities frontiers for the United States and Izodia without trade (millions of units per day)
100
200
300
400
500
600
Food
(a) United States
U1
U2
U3
U5
100 200 300 400 Clothing0
100
200
300
400
500
600
Food
(b) Izodia
I1 I2
I4
I5
100 200 300 400 Clothing0
Slope: opportunity cost of an additional unit of food is ½ unit of clothing
An additional unit of food costs 2 units of clothing.
Food is produced at a lower opportunity cost in the United States.
U4
U6
I3
I6

Measuring opportunity cost:
For the United States•Food: 60 clothing/120 food = ½ clothing per food.•Clothing: 120 food/60 clothing = 2 food per clothing
For Izodia•Food: 80 clothing/40food = 2 clothing per food•Clothing: 40 food/80 clothing = ½ food per clothing
Thus the Unites States has the comparative advantage in food and Izodia has the comparative advantage in clothing.

How much of one good exchanges for a unit of another good.
As long as the Americans can get more than ½ unit of
clothing for each unit of food , and as long as the Izodians can get more than ½ unit of food
for a unit of clothing, both sides benefit from
specialization and trade

These terms work for both sides

16
Production (and consumption) possibility frontiers with trade (millions of units per day)
100
200
300
400
500
600
Food
(a) United States
100 200 300 400 Clothing0
100
200
300
400
500
600
Food
(b) Izodia
100 200 300 400 Clothing0
U
I
Trade: 1 unit of clothing for 1 unit of food. Both countries are better off as a result of international trade.
I3
U4

United States IzodiaClothing(units)
Food(units)
Clothing(units)
Food(units)
No Trade 180 240 160 120Trade 200 400 200 200Gain 20 160 40 80

•Trade embargos: Prohibitions on the importation (or exportation) of goods and services. Examples: 1973 Oil embargo, trade embargo with Iraq, embargo on imported sugar from Cuba.
•Tariffs: Taxes imposed on imported goods.
•Quotas: Limits on the quantity or value of goods or services that can be imported or exported. Examples: The textile quota, the sugar quota, export quota on raw timber.
•Subsidies: payments by government to exporters. These stimulate trade by allowing the exporter to charge a lower price.

The Japanese trade ministry (MITI) decided that snow skis
made in the U.S. were not safe enough for Japanese ski
enthusiasts
•Health and safety standards—such as European ban on genetically-modified soybeans and hormone-treated beef.•Product design standards•Licensing requirements•Bureaucratic red tape

20
Consumer and producer surplus from market exchange
$0.50
0.25Pric
e pe
r pou
nd
0 60 Chicken(pounds per day)
S = marginal cost
D = marginal benefit
Consumer surplus
Producer surplus
21
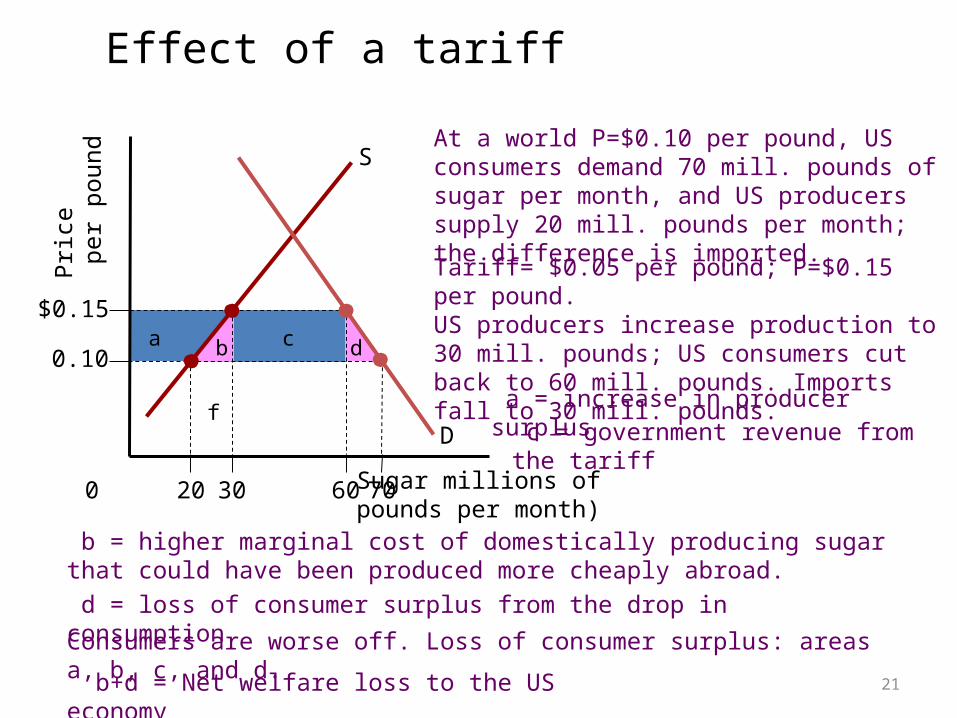
Effect of a tariff
$0.15
0.10
Pric
e p
er p
ound S
D
0 30 Sugar millions of pounds per month)
20 60 70
a b c d
f
At a world P=$0.10 per pound, US consumers demand 70 mill. pounds of sugar per month, and US producers supply 20 mill. pounds per month; the difference is imported.
Tariff= $0.05 per pound; P=$0.15 per pound. US producers increase production to 30 mill. pounds; US consumers cut back to 60 mill. pounds. Imports fall to 30 mill. pounds.
Consumers are worse off. Loss of consumer surplus: areas a, b, c, and d.
a = increase in producer surplus
b = higher marginal cost of domestically producing sugar that could have been produced more cheaply abroad.
c = government revenue from the tariff
d = loss of consumer surplus from the drop in consumption
b+d = Net welfare loss to the US economy

S’
22
Effect of a quota
$0.15
0.10
Pric
e p
er p
ound S
D
0 Sugar (millions of pounds per month)20 50 70
$0.15
0.10
Pric
e p
er p
ound S
D
0 30 Sugar (millions of pounds per month)
20 60 70
a b c d
S’
e
Quota=30 mill., world price=$0.10. S’=supply curve (imports and US production; new price $0.15: intersection of D and S’. Loss of consumer surplus: a+b+c+d; a = transfer from US consumers to US producers; b+d = net loss; c = gain for sellers of foreign-grown sugar
Given the preceding analysis , why are trade restrictions so pervasive?

•National security•Save domestic jobs•Anti-dumping•Infant industry
