internet performance evaluation for - home - ofcom · carry out an internet performance evaluation....
TRANSCRIPT

Quality benchmarking and Digital supply chain management 24th October 2014
Actual Experience plc The Tramshed, Beehive Yard, Bath BA1 5BB t: +44 1225 731 340 e: [email protected] w: www.actual-experience.com Company number: 06838738 VAT number: 971 9696 56
Internet Performance Evaluation
for

1 Executive summary ............................................................................................................................... 5
2 Introduction ............................................................................................................................................. 6 2.1.1 Actual Experience’s engagement with Ofcom .............................................................................. 6 2.1.2 Aims and goals .............................................................................................................................. 7
2.2 Digital quality and Actual Experience ................................................................................................... 8 2.2.1 Current market perceptions .......................................................................................................... 9
2.2.1.1 Is line speed relevant? ...................................................................................................................................................... 9 2.3 Internet digital supply chains .............................................................................................................. 10 2.4 Applications considered...................................................................................................................... 12
2.4.1 Relevance of the applications chosen ......................................................................................... 12 2.4.2 Scope for additional analysis ...................................................................................................... 12
2.5 Access types considered ..................................................................................................................... 13 2.5.1 Technology .................................................................................................................................. 13 2.5.2 Package speeds ........................................................................................................................... 13 2.5.3 Line-rates..................................................................................................................................... 13
2.6 Subscriber base ................................................................................................................................... 14 2.6.1 Requirements of the ITT .............................................................................................................. 14 2.6.2 Subscriber groupings ................................................................................................................... 14
2.6.2.1 Line-rate ............................................................................................................................................................................... 14 2.6.2.2 Host operating system ................................................................................................................................................... 15 2.6.2.3 Geographic distribution ................................................................................................................................................ 16
3 Measurement Methodology ............................................................................................................. 17 3.1 Background from previous work ........................................................................................................ 17 3.2 The BBFix® Project ............................................................................................................................... 18 3.3 Measurements taken .......................................................................................................................... 19
3.3.1 What does the Digital User actually do?..................................................................................... 19 3.3.2 Quantification of experience ....................................................................................................... 20
3.3.2.1 The MOS concept .............................................................................................................................................................. 20 3.3.3 Quantification of line-rate........................................................................................................... 20
3.3.3.1 Comparison to ‘speed test’ concepts ....................................................................................................................... 21 3.3.4 Digital supply chain enumeration ............................................................................................... 21
3.3.4.1 Provider determination ................................................................................................................................................ 21 3.3.5 Impairment analysis .................................................................................................................... 21
3.3.5.1 Device behaviour analysis ........................................................................................................................................... 21 3.4 Independent verification of results .................................................................................................... 22
4 Results ..................................................................................................................................................... 24 4.1 Application Experience ....................................................................................................................... 24
4.1.1 General observations .................................................................................................................. 25 4.2 The effect of line-rate on experience ................................................................................................. 26
4.2.1 Distributions seen ........................................................................................................................ 26 4.2.1.1 Overall ................................................................................................................................................................................... 26
4.2.2 Experience vs. line-rate results .................................................................................................... 27 4.2.2.1 In aggregate ........................................................................................................................................................................ 27
4.2.3 Does line-rate influence experience across all speed distributions? ........................................... 30 4.3 Dominant factors affecting experience .............................................................................................. 31
4.3.1 Across line-rate distributions ...................................................................................................... 32 4.3.2 Conclusion: Line-rate as an indicator of experience.................................................................... 33
4.4 User survey results.............................................................................................................................. 34
2 | P a g e

5 Summary ................................................................................................................................................ 36 5.1 Implications following a successful project ........................................................................................ 37
Annex A – Additional information ....................................................................................................... 38 Recruiting methodology ............................................................................................................................... 38 ISPs seen ....................................................................................................................................................... 38 Applications Analysed .................................................................................................................................. 38
Annex B – Evidence of conditions impacting experience ............................................................ 39 Impairments ................................................................................................................................................. 39
In home .................................................................................................................................................... 39 Network provider .................................................................................................................................... 41 Upstream (network infrastructure) ......................................................................................................... 42 Upstream (content provider) ................................................................................................................... 43
Weaknesses and bottlenecks in the digital supply chains ........................................................................... 44
3 | P a g e

List of Figures
Figure 1 – Delivery of content across Internet digital supply chains................................................................. 11 Figure 2 – Distribution of subscribers by line-rate ............................................................................................ 14 Figure 3 – Percentage of subscribers by host operating system ....................................................................... 15 Figure 4 – Geographic distribution of UK subscribers ....................................................................................... 16 Figure 5 – Actual Experience measurement data-flow ..................................................................................... 19 Figure 6 – Network device congestion .............................................................................................................. 22 Figure 7 – Application impairment .................................................................................................................... 23 Figure 8 – Distribution of experience across certain application types analysed ............................................. 25 Figure 9 – Percentage of subscribers by line-rate ............................................................................................. 26 Figure 10 – Experience vs. line-rate for selected application types .................................................................. 27 Figure 11 – Experience vs. line-rate for per application, with standard deviation ........................................... 28 Figure 12 – Experience vs. line-rate for per application for the worst 10% of scores ...................................... 29 Figure 13 – Relative impairments across all applications.................................................................................. 31 Figure 14 – Relative sources of impairment across line-rates .......................................................................... 32 Figure 15 – Actual Experience Voice of the Customer compared to consumer survey results ........................ 34 Figure 16 – Poor WiFi performance .................................................................................................................. 39 Figure 17 – Poor CPE performance .................................................................................................................... 40 Figure 18 – Impairments in the ISP network ..................................................................................................... 41 Figure 19 – Impairments in the upstream network .......................................................................................... 42 Figure 20 – Poor content server performance .................................................................................................. 43
4 | P a g e

1 Executive summary
From the initial launch of ADSL in 2000, fixed-line broadband coverage in the UK has grown to 80% of households1, with average speeds seen by consumers increasing more than fourfold over the last five years2. Significant investment from service providers continues to drive availability of higher-speed services to 40Mbps ‘superfast’ connections and beyond. Against this background, this report considers the experience of consumers as access to faster broadband continues to increase. Specifically:
• Do faster broadband access speeds improve the Internet experience of UK consumers?
• Is there a threshold beyond which speed becomes less important in delivering a good experience?
• What other factors affect consumers’ experience and how do they affect different services?
• What, if any, are the major impediments across the Internet’s digital supply chain that must be addressed to improve UK consumers’ participation in the global Internet economy?
The results show a clear correlation between access speed and consumers’ experience up to around 8-10Mbps. Beyond this, there is only a marginal benefit to increased speed until ‘superfast’ connections of 40Mbps and above are reached. At these high speeds there is a small improvement in consistency, although the best experiences seen are not any better than at lower speeds. Above around 10Mbps, other factors determine whether consumer experience drops below the best that can be supported. This report shows evidence of impacts from WiFi in the home across all speed bandings along with congestion in the local infrastructures connecting consumers to their providers. Impacts are also seen from broadband provider network behaviour, upstream providers, and at the application level from content providers. The clear finding of this report is that a focus on quality, not quantity is required. With access speeds above 10Mbps, UK consumers can expect to have a very good experience of common Internet services, if digital supply chains are well managed. Any problems seen above this threshold are typically due not to a lack of broadband access speed, but behaviours in the digital supply chain that can be improved by the relevant providers. In conclusion, focus from broadband providers, upstream service providers and policy makers to ensure that UK infrastructures are well managed will deliver significant benefits in terms of consumer experience. This approach offers the ability to move beyond access speed as the sole measure by which the quality of Internet services is judged. This report demonstrates a practical, realistic methodology to understand consumer experience and a mechanism to inform providers, policy makers and other interested parties of the effects of the entire digital infrastructure that must be considered to deliver a high-quality service.
1 Ofcom: The Communications Market 2013 (August) 2 http://consumers.ofcom.org.uk/2013/08/average-uk-broadband-speed-continues-to-rise/
5 | P a g e

2 Introduction
Over the last few years, Ofcom has published much research into broadband access speeds3, setting a standard for other regulatory authorities around the world. Broadband speed tests have helped customers get a realistic view of the actual speed of their broadband connection4. However, Ofcom’s current thinking is that speed looks not to be the only factor when considering the quality of Internet services in the UK. Indeed, that “access speed alone provides no guarantee that one will not experience [poor] videoconferencing…VoIP, etc.”, given that “other performance parameters that characterise a consumer’s broadband connection may become more important.” 5 Coupled with this, data published in Ofcom’s infrastructure report indicates that consumer data usage does not significantly increase with access speeds beyond 10Mbps6, further indicating that other factors may be of importance and interest.
2.1.1 Actual Experience’s engagement with Ofcom
After a successful response to ITT 28-2013, Actual Experience has been contracted by Ofcom to carry out an Internet Performance Evaluation. This follows work carried out under ITT 31-2012, where the methodologies used by Actual Experience were evaluated across a small group of consumers. This previous work clearly showed detrimental effects from numerous types of behaviour in home, ISP, upstream provider and content provider infrastructures and hinted that speed may only be an important qualifier of experience up to a certain point. This report builds on that analysis of UK Internet digital supply chains and directly addresses the questions related to access speed though direct measurement and quality-based correlations.
3 http://stakeholders.ofcom.org.uk/market-data-research/other/telecoms-research/broadband-speeds 4 e.g. http://www.broadband.co.uk/broadband-speed-test 5 Ofcom, Internet Performance Evaluation – Tender: ITT 31/2012, p.21 6 http://stakeholders.ofcom.org.uk/binaries/research/telecoms-research/infrastructure-report/IRU_2013.pdf, Fig. 20
6 | P a g e
2.1.2 Aims and goals
The goals of the evaluation are stated as:
• To better understand the “State of the Net”
- Whether the UK’s internet delivery infrastructure is fit for purpose i.e. capable of supporting a variety of consumer and business applications;
- The evolution of UK’s broadband infrastructure over time
• To better understand “traffic management”
- Whether ISPs traffic manage particular applications;
- The extent to which, if any, traffic management is enhancing and/or disturbing the consumer’s experience.
• To better understand the major impediments on a consumer’s broadband connection
500 sample points were required to develop the analysis, with a variety of line-rates and access technologies:
• VDSL (any line-speed)
• Cable (any line-speed)
• ADSL – up to 2 Mbps line-speed
• ADSL – between 5 – 10 Mbps line-speed
Inevitably, ADSL line-speeds between 2 and 5Mbps and >10Mbps have also been evaluated as part of the sample group. Measurements taken from this sample group are then analysed by Actual Experience to determine the link between consumer experience and technical characteristics seen across the digital supply chain:
• What users would actually experience – the Voice of the Customer – for the applications under analysis
• What their digital supply chain is capable of supporting in terms of experience
• An analysis of reasons for the gap between the two – identifying behaviours in content and network provider infrastructures responsible for reduction or lack of consistency of the VoC
Each digital supply chain encompasses the home user environment, the local ISP, upstream providers and content infrastructure. Thus digital supply chains vary not only by user location, but also by the service analysed.
7 | P a g e

2.2 Digital quality and Actual Experience Physical products of all types – from cars to televisions to phones – are manufactured to consistently exceptional levels of quality, such that if the consumer perceives any defect at the point of delivery, the item will most likely be rejected.
Such standards of consistency and quality have come about through an intense focus on supply chain management over the past 30+ years, where techniques like Six Sigma have been applied to ensure that factories, manufacturing the component parts of the product, all work together in perfect harmony to deliver a consistent level of quality to the end consumer.
A critical element of such supply chain management is the ‘Voice of the Customer’ – direct feedback, from consumers, that informs manufacturers of the effect of their actions – investment, cost reduction, change, etc. If the result of the decision to change something results in positive or negative feedback from the customer, then the business can make decisions with direct reference to their effect on their products’ markets.
Actual Experience is the first company in the world7 to bring the Voice of the Customer to digital supply chains – the complex set of providers, network, content and end-user infrastructures that sit between consumers or business users and the content they consume.
With this information, providers, regulators, government and local bodies are able to see the direct effect of investment and change on the people who actually use the service – providing a direct linkage between action and effect. This Voice of the Customer – reporting continuously on the quality of Internet services, enables ‘digital supply chain management’ – the ability for all interested parties to better manage their digital supply-chains and understand how their actions can improve the quality of Internet and other services delivered to their customers across the UK.
The Actual Experience® platform analyses the quality of digital products delivered to consumers and business users. In the context of this project, the service:
• Provides a continuous quality scoring – the Voice of the Customer – for popular consumer applications
• Benchmarks the highest level of quality providers’ digital supply chains are able to support
• Diagnoses weaknesses and behaviours within those digital supply chains that adversely affect the Voice of the Customer by reducing Internet service quality and consistency
This project applies Actual Experience’s digital supply chain analysis to popular applications for UK consumers, delivered over fixed-line broadband.
7 The IET Innovation Awards 2012: “Actual Experience [is] …the only company in the world that can automatically create a…Supply Chain view based on user experience.”
8 | P a g e
2.2.1 Current market perceptions
It has long been considered a truism that ‘faster is better’ when considering broadband performance. Comparison sites routinely list providers based on two characteristics – speed and price8. Investment focus, from central government9 to local community level10 is typically around delivering faster access to more people.
2.2.1.1 Is line speed relevant?
Is speed always the dominant factor in determining the quality of a service? It is not unusual to hear anecdotal evidence of individuals moving from a slower to faster broadband package, yet perceiving that their Internet experience has not improved. Actual Experience has seen many such cases – for example, a consumer moving from a ‘legacy’ service to ‘superfast’ broadband and yet seeing a worse experience, due to the dominance of other factors in the new provider’s network11. By applying the Voice of the Customer to this project’s user base, Actual Experience is able to establish what, if any, systematic linkage exists between line-speed and consumers’ experience of the digital products under analysis. Further, if line-speed is not the dominant factor in determining product quality, then what other characteristics have been seen and should be considered? Line-speed has been defined in the ITT as access speed, i.e. the sync-rate of the consumer’s CPE router (CPE stands for Customer Premise Equipment – the gateway router and WiFi device supplied by the broadband provider to a subscriber).
8 http://www.broadbandspeedchecker.co.uk/compare_broadband.aspx http://www.money.co.uk/broadband/fastest-broadband.htm http://www.broadbandgenie.co.uk/broadband/fast-broadband
9 https://www.gov.uk/government/policies/transforming-uk-broadband 10 http://www.betterbroadbandnorfolk.co.uk/
http://www.connectingcambridgeshire.co.uk http://www.westsussex-betterconnected.org.uk/home
11 http://www.actual-experience.com/casestudies/broadband
9 | P a g e

2.3 Internet digital supply chains The Internet is a global mesh of interconnected providers of network, content and infrastructure services, all of which must work together to enable consumers and businesses to work, play, transact, interact and communicate on-line. When a user consumes a piece of content – be that a corporate application or BBC iPlayer at home, they must connect through this complex infrastructure to the location where the content they wish to view is held. The set of network and compute infrastructures between them and their content can be thought of as a digital supply chain. Visibility and understanding of how the components in this digital supply chain operate together is critical to the understanding of Internet users’ experience – in the same way as physical supply chains demand that factories or logistical elements must work together to deliver high-quality products to consumers. Actual Experience delivers digital supply chain analysis to organisations around the world – providing the visibility into digital supply chains that has been applied in the physical world for many decades. In the context of our work with Ofcom, this involves the use of Voice of the Customer metrics and enumeration of the digital supply chains that exist between consumers involved in the project and the content of interest to Ofcom. These digital supply chains contain many elements belonging to the multiple providers who either serve or carry content to consumers. In this report, these have been grouped together into the four broad areas shown overleaf.
10 | P a g e

Figure 1 – Delivery of content across Internet digital supply chains
Home: The consumer’s home environment, consisting of the router or other connectivity
device supplied by their ISP and WiFi or other mechanisms within the home, by which the consumer can connect to the Internet.
Access: The broadband provider’s local infrastructure – physically connecting the consumer to
the provider’s network, often along with many other consumers in that geographic area.
ISP: The regional and national networks of the broadband provider, upstream of the local
infrastructure considered in the ‘Access’ segment. Upstream: Other network provider and content provider infrastructures that form the part of the
digital supply chain between the ISP and the content itself.
Information delivered from content providers to consumers at home
11 | P a g e
2.4 Applications considered
2.4.1 Relevance of the applications chosen
Ofcom requested that a number of applications be analysed for this project, detailed in Annex A – Additional information. However, for clarity throughout the main body of the report, web browsing, video streaming and voice services are considered as a set of core Internet services commonly used by a large proportion of UK consumers. These provide for a range of sensitivities to different network and application-level behaviours (see §3 – Measurement Methodology, below).
2.4.2 Scope for additional analysis
In principle, any digital service can be analysed by Actual Experience. An enterprise version of the product is widely deployed in organisations ranging from mid-tier enterprises to global blue chips, from ISPs, MSPs and outsourcers to charities and government. Actual Experience would expect to be able to carry out analysis of any additional digital products or services required by Ofcom without significant additional development.
12 | P a g e

2.5 Access types considered
2.5.1 Technology
No restrictions have been placed on subscribers in terms of their access technology and the following have been seen in accordance with the requirements of the ITT: ADSL variants VDSL (FTTC) Cable
2.5.2 Package speeds
Users registering for the service were required to state their broadband speed. Options offered were <2Mbps, 2-5Mbps, 5-10Mbps, 10-40Mbps and >40Mbps.
2.5.3 Line-rates
Measured line-rates (see §3.3.3 – Quantification of line-rate, below) have been used to confirm users’ statements of ‘broadband speed’ and thus actual line-rates are considered in the results below as opposed to notional package speed. Line-rates have been grouped into the same bandings as noted above – capturing all line-rates stipulated in the ITT.
13 | P a g e

2.6 Subscriber base
2.6.1 Requirements of the ITT
The ITT stipulated a sample group of 500 measurement points, spread across the technology types and speed bands described above. Data from Actual Experience Digital User (DU) software, hosted by approx. 540 consumers has been used for the results in this document and, at the time of writing, there is a base of approx. 950.
2.6.2 Subscriber groupings
The plots below show subscriber groupings by a number of criteria of interest. These results represent subscribers who have declared the information, or where Actual Experience has been able to determine the category. Uncertain or undeclared results are not included in the percentage calculation. A representative spread of access technologies were seen, including ADSL, Cable and FTTC/VDSL services.
2.6.2.1 Line-rate
Based on user responses at the time of registering for the service
Figure 2 – Distribution of subscribers by line-rate
14 | P a g e
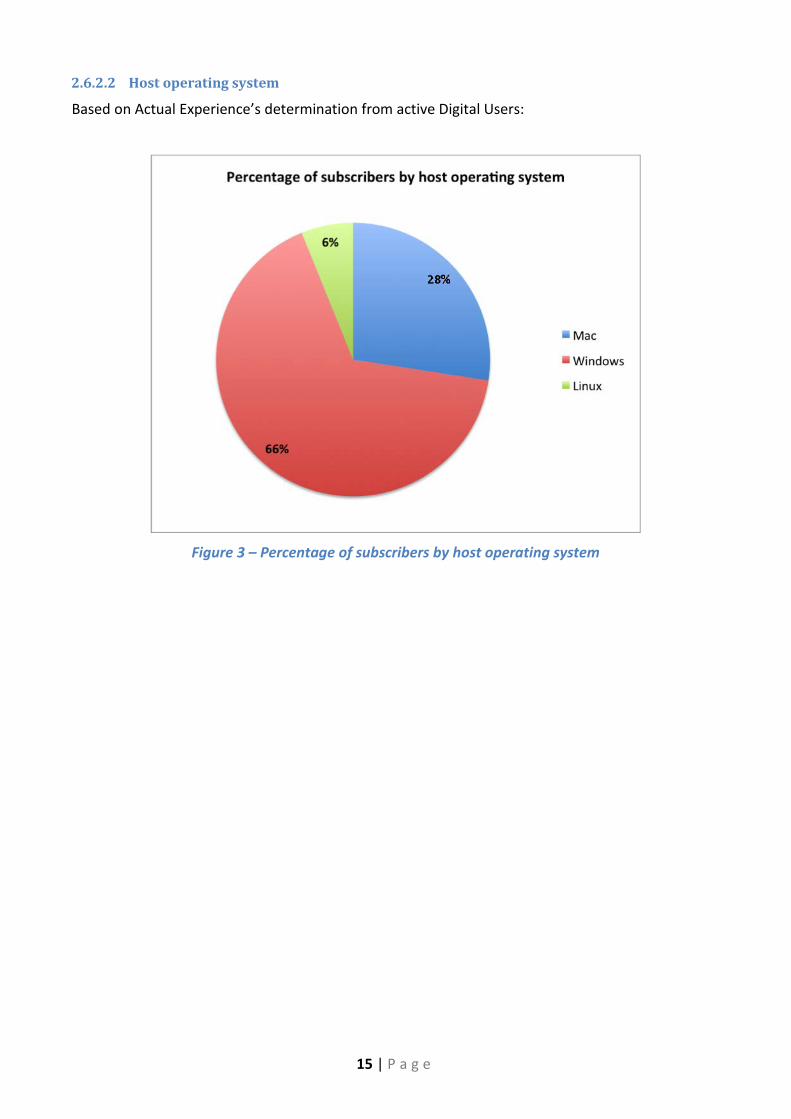
2.6.2.2 Host operating system
Based on Actual Experience’s determination from active Digital Users:
Figure 3 – Percentage of subscribers by host operating system
15 | P a g e

2.6.2.3 Geographic distribution
Based on valid postcodes declared at the point of registration of the current subscriber base. The numbers indicate the number of subscribers seen within 20km of the centre of each circle.
Figure 4 – Geographic distribution of UK subscribers
16 | P a g e

3 Measurement Methodology
3.1 Background from previous work Actual Experience is the commercialisation of 10 years of academic research, led by Professor Jonathan Pitts, at Queen Mary University of London (QMUL). This research is based on the contention that, when considering the performance of the applications and infrastructures making up a digital supply chain, the Voice of the Customer is the critical guide for improving quality and consistency of service. In the corporate context, this relates directly to the ability of users to be productive and is thus of profound economic value – something that is equally true when considering the social and economic productiveness of ‘Digital Britain’. There are three components to an Actual Experience deployment: Digital Users (DUs), the Analytics Cloud and the Web UI.
• A DU is a small piece of software that resides on a device in the same location as the users whose experience is being analysed. That device can be a user or standalone PC (Mac, Windows or Linux) or a Raspberry Pi. The DU takes the measurements that are then analysed to produce the Voice of the Customer quantification and understand the performance of the digital supply-chain.
• The Analytics Cloud is the heart of Actual Experience – where all the maths happens – and contains high-powered computational clusters located in secure UK datacentres. The Analytics Cloud processes the results of the measurements made by the DUs to produce VoC quantifications and the correlations required to benchmark digital supply chains and identify sources of weakness.
• The Web UI is how results are presented to customers. Access is via any modern web browser, and customers are able to access three core pieces of information:
o A benchmark of how good digital experience should be (i.e. if everything worked properly across that digital supply chain)
o A continuous Voice of the Customer score (consumers’ digital experience, benchmarked across every location)
o Continuous triaging of the digital supply chain (to find the things that affect the VoC score and hence allow resources to be focused to the greatest effect on improving the quality and consistency of the product)
17 | P a g e

3.2 The BBFix® Project BBFix is Actual Experience’s consumer recruitment programme – offering a version of our analysis and results, free of charge, to consumers around the world. It is from this crowd-sourced user-base that the subset of UK subscribers for this report was drawn. In the BBFix version of the UI shown below, these three core pieces of information are summarised for each application as:
• The Voice of the Customer score – current, monthly average and the best that supply chain can support
• An experience clock – a 24 hour clock - showing the continuous quantification of actual digital experience over the past 30 days
• Where it's going wrong – a visual indication of weaknesses in the digital supply chain (divided into Home, Broadband Provider, and The Internet)
18 | P a g e
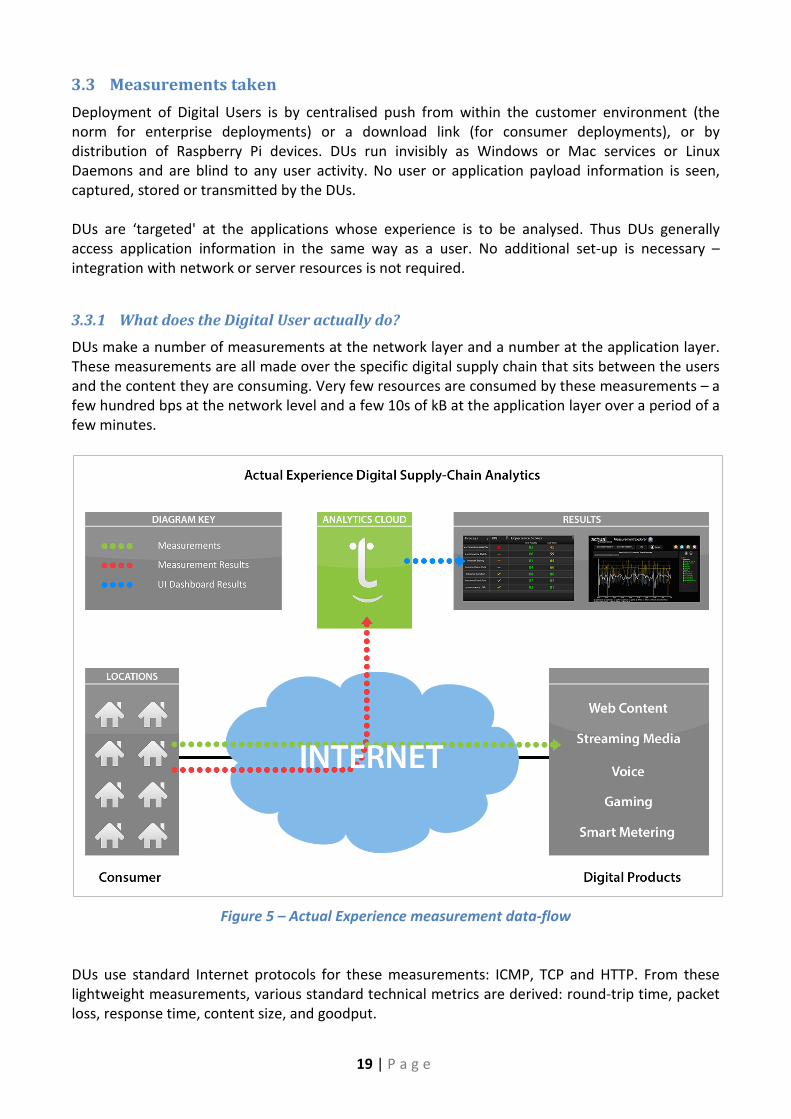
3.3 Measurements taken Deployment of Digital Users is by centralised push from within the customer environment (the norm for enterprise deployments) or a download link (for consumer deployments), or by distribution of Raspberry Pi devices. DUs run invisibly as Windows or Mac services or Linux Daemons and are blind to any user activity. No user or application payload information is seen, captured, stored or transmitted by the DUs. DUs are ‘targeted' at the applications whose experience is to be analysed. Thus DUs generally access application information in the same way as a user. No additional set-up is necessary – integration with network or server resources is not required.
3.3.1 What does the Digital User actually do?
DUs make a number of measurements at the network layer and a number at the application layer. These measurements are all made over the specific digital supply chain that sits between the users and the content they are consuming. Very few resources are consumed by these measurements – a few hundred bps at the network level and a few 10s of kB at the application layer over a period of a few minutes.
Figure 5 – Actual Experience measurement data-flow
DUs use standard Internet protocols for these measurements: ICMP, TCP and HTTP. From these lightweight measurements, various standard technical metrics are derived: round-trip time, packet loss, response time, content size, and goodput.
19 | P a g e

3.3.2 Quantification of experience
The standard technical metrics derived from lightweight measurements using standard Internet protocols are transformed into the Voice of the Customer for each specific application, regardless of whether the user is actually using that application. This is a very powerful feature of the analysis that entirely separates ‘real’ user activity from the ability to understand the consumer experience of any application. This is important both from a privacy and data protection perspective – no user information is ever stored, inspected or otherwise examined and also from the point of statistically relevant results; the VoC for any application of interest can be quantified from any location, regardless of actual user activity. The specific transformations (from technical metrics to VoC) are the outcome of research undertaken by Professor Jonathan Pitts that has resulted in a generalised Mean Opinion Score (MOS) methodology that Actual Experience terms the VoC score.
3.3.2.1 The MOS concept
Throughout much of the twentieth century, the quality of speech transmission was a focus for the engineering design of telephony networks. For example, “Telephonic Intelligibility” was the subject of an article published in 1910 in Philosophical Magazine. By the 1950s, researchers in the British Post Office had developed and published engineering design schemes that combined the performance rating of speech transmission links with the user evaluation of telephony service, i.e. aggregates of these links providing end-to-end service in operational networks. In the 1980s, the Consultative Committee for International Telegraphy and Telephony (now the ITU-T) was recommending the use of the Mean Opinion Score (MOS) as a method to quantify the subjective assessments of speech transmission quality. The subjective assessments (e.g. excellent, good, fair, etc.) made by individuals were given scores (on a scale of 1 to 4, or 1 to 5) and averaged to give the MOS. By the late 1990s, the ITU-T had published a computational model that related several transmission parameters to the conversational quality of telephony, as expressed by MOS. This provided a reliable substitute for human scores, enabling automated systems to be used to measure, manage and improve call quality in telephone networks. The research undertaken by Professor Jonathan Pitts, co-founder of Actual Experience and a professor at QMUL, has resulted in a method that relates key end-to-end technical measurements to the perception of the performance of any networked software application. Actual Experience calls this generalised MOS methodology the Voice of the Customer, in keeping with physical supply chain management processes such as Six Sigma.
3.3.3 Quantification of line-rate
Line-rate is quantified using a standard estimation method called the size-delay method. This makes use of different sized ICMP packets, which take slightly different times to be clocked out over a fixed line-speed. The differences in minimum round-trip times can be processed to estimate the line-speeds at each hop. Using the TTL expired capability means that, because the ICMP packet response is a fixed size, both outbound and inbound speeds can be evaluated.
20 | P a g e

3.3.3.1 Comparison to ‘speed test’ concepts
Standard 'speed test' methods transfer a large file to/from a nearby server in order to quantify the bottleneck link capacity in both directions. This data transfer co-exists with other traffic in the digital supply chain to the nearby server and, because its purpose is to fill the bottleneck link, is likely to cause temporary congestion at that link for any other services sharing parts, or all, of that digital supply chain. This methodology uses the maximum upload and download speeds obtained during the data transfers as estimates for the line-rate. By contrast, the size-delay method uses a much smaller volume of packets to achieve a line-rate estimate. However, both methodologies are sampling the digital supply chain when there might be other traffic present. For both methodologies this introduces errors into the estimates, errors that can only be minimized by repeated sampling. That said, the size-delay method has the potential to give more accurate access line-rate results (as required by this ITT), since bottlenecks upstream from the provider access will not affect the results.
3.3.4 Digital supply chain enumeration
DUs make one other set of measurements – based on ICMP – which is similar to the conventional 'traceroute' process. This uses the TTL count in an IP packet to elicit a TTL-expired-in-transit message from an intermediate router along the path from DU to the target application server. The TTL-expired-in-transit message supplies the IP address of routers along the path.
3.3.4.1 Provider determination
IP addresses obtained from ICMP TTL-expired-in-transit responses are matched against published CIDR prefixes in order to identify the layer 3 device sending the ICMP responses. This process enables broadband providers to be identified and confirmed. If a DU is mobile and makes use of multiple broadband providers, then the Analytics Cloud filters out any measurements that do not conform to the expected CIDR prefixes for the home broadband provider.
3.3.5 Impairment analysis
The round-trip time from a TTL-expired-in-transit message gives an indication of whether the path up to the router, or the router itself, is suffering from resource exhaustion. The specific value of the round-trip time is not in itself a reliable metric because the generation of ICMP responses is a low priority activity for a router. However, the very fact that it is a low priority activity means that it amplifies resource exhaustion when it occurs. Hence, it is possible, with sophisticated analytics, to quantify the contribution that a section of the path makes to impairing the Voice of the Customer score for an application.
3.3.5.1 Device behaviour analysis
For devices along the path that are diagnosed as impairing the VoC, the round-trip time and loss metrics to these devices are presented graphically. Notwithstanding the reliability of the metrics (in terms of their absolute values), the relative patterns of behaviour can be indicative of specific modes of impairment at devices. For example, loss due to traffic conditioning and delay due to queue build at a bottlenecked link have quite different and identifiable behaviour patterns.
21 | P a g e

3.4 Independent verification of results Outside of Actual Experience’s existing customer base, in which there are many examples of the application of our analytics and diagnostics, it is clearly important that any behaviours we identify in digital supply chains are easily and independently verifiable. Examples of such behaviours are shown below. In all cases, we are considering relatively simple technical characteristics of the devices whose behaviour has been identified as affecting consumer experience. The characteristics (network loss, delay, delay variation, application throughput, response time, etc.) are well known and our results are immediately verifiable with the existing instrumentation that an interested party would have. The intelligence that Actual Experience brings is to identify those technical behaviours that impact consumer experience. The root of the methodology for this analysis – MOS – has been considered mature and accepted for over 20 years. The only elements of the analysis that constitute trade secrets and are not explicitly detailed here concern the generalisation of the MOS concept and the nature of the correlations across the digital supply chain that are subsequently performed.
Figure 6 – Network device congestion
Figure 6 above shows a screenshot from a section of the Actual Experience UI, identifying the behaviour of a network device as causing a negative impact on the consumer’s experience of a particular application. Loss is plotted against delay (network latency) providing a determination of latency variation as well. In this example, both a high degree of loss and latency variation is seen. Both are well-known network characteristics identifiable by any network monitoring package that would be deployed by a provider or other interested party.
22 | P a g e
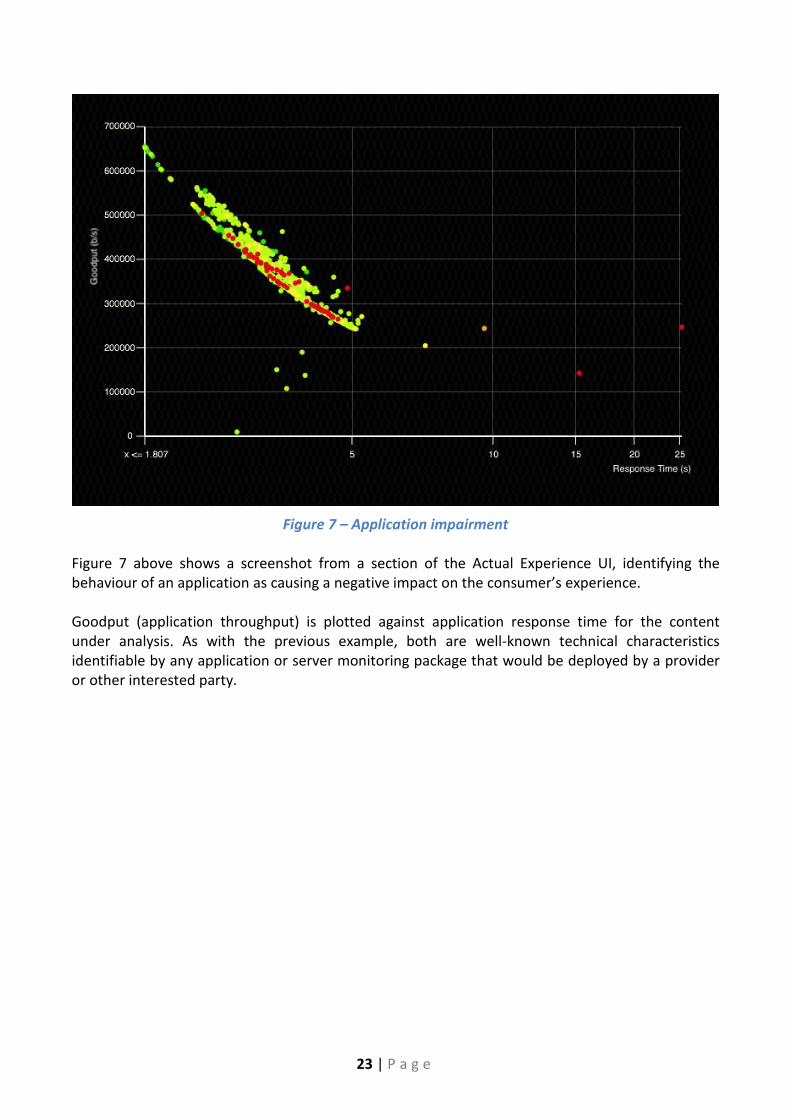
Figure 7 – Application impairment
Figure 7 above shows a screenshot from a section of the Actual Experience UI, identifying the behaviour of an application as causing a negative impact on the consumer’s experience. Goodput (application throughput) is plotted against application response time for the content under analysis. As with the previous example, both are well-known technical characteristics identifiable by any application or server monitoring package that would be deployed by a provider or other interested party.
23 | P a g e

4 Results
4.1 Application Experience Actual Experience is able to look at the entire digital supply chain between the consumer and the product being analysed. When problems exist in that supply chain that impact the consumer’s experience, these are visualised as drops in the Voice of the Customer scoring. The platform then automatically diagnoses and isolates the reasons for this effect, by the correlations described in §3 – Measurement Methodology, above. As discussed above, components of the digital supply chains are described here in four broad terms:
• Home user environment (Home)
• Local access to the broadband provider (Access)
• ISPs’ infrastructure upstream of the local access (ISP)
• Network and content providers upstream of the ISP (Upstream)
Considering the cumulative effect of behaviours in all these areas, Actual Experience derives the best possible experience that the digital supply chain can support for that specific application, along with a continuous scoring of the actual experience – the Voice of the Customer. Variations between this best possible benchmark and the actual VoC score are due to technical behaviours in one or more of these areas. Actual Experience isolates both the provider and the devices within their purview to show evidence of this behaviour and the magnitude of its impact on the consumer. Annex B – Evidence of conditions impacting experience, considers specific examples of such behaviour seen in each part of the digital supply chains analysed. These include effects from:
• Home environments including WiFi and provider CPE performance
• Congestion in the broadband provider’s local network
• Traffic policing at a peering point interconnect
• Application performance degradation within the content provider’s environment
24 | P a g e

4.1.1 General observations
The plots below consider the results seen for browsing, video streaming and voice, showing the spread of experience for each across the entire user base. We can see that there are clear differences, but for the majority of users, typical experience is good to excellent across the board. Streaming video services show very good consistency of experience, with the peak of the distribution accounting for around 90% of measurements seen. This peak sits in the ‘good’ category (median scores in the mid-70s), and users may see occasional dips in performance as evidenced by the ‘tail’ of the distribution. This would equate to e.g. momentary pauses, buffering or pixilation. Streaming services look to use sophisticated caching and streamlining techniques to deliver a consistent experience to consumers, and these results support the success of those strategies albeit that when there are brief drops in performance, the impact on the consumer is very noticeable. Greater variations occur with web browsing, and some reasons for this are given in the following sections.
Figure 8 – Distribution of experience across certain application types analysed
25 | P a g e

4.2 The effect of line-rate on experience
4.2.1 Distributions seen
4.2.1.1 Overall
The split of subscribers across the defined line-rate bandings was given in §2.5.2.1, above and is repeated here:
Figure 9 – Percentage of subscribers by line-rate
26 | P a g e

4.2.2 Experience vs. line-rate results
The results in this section are based upon a rigorous filtering applied under the methodology described in §3.3.3 – Quantification of line-rate, above. Only line-rates determined with a high degree of confidence are used in the following results.
4.2.2.1 In aggregate
Figure 10 – Experience vs. line-rate for selected application types This plot shows the Voice of the Customer scores for each application, as they vary with line speed. It is clear that there is a significant correlation to speeds approaching 8-10Mb, after which there is very little improvement at higher speeds. Voice services are typically excellent even at the lowest speeds seen – an unsurprising result given that voice packets require a maximum throughput of 84kbps (G.711 CODEC with overhead), or significantly less with compression. By contrast, streaming video and browsing suffer most at low speeds.
27 | P a g e

The plot below adds in the standard deviation of the scores. This shows evidence in line with the results above, in that the consistency of experience improves markedly to around 8-10Mbps, with little subsequent improvement until high speeds are reached in the 40Mbps and above banding. Variation of service can be a significant factor in a poor perception of quality and the reasons for such variation are discussed further in the following sections. Examples of specific instances where devices in provider infrastructures cause variable quality are given in Annex B – Evidence of conditions impacting experience, below.
Figure 11 – Experience vs. line-rate for per application, with standard deviation
This result supports the finding that approx. speeds of around 10Mbps are sufficient to deliver a good to excellent experience of all services considered here, and strongly underlines the conclusion that, beyond that point, good management of digital supply chains is the critical factor.
28 | P a g e
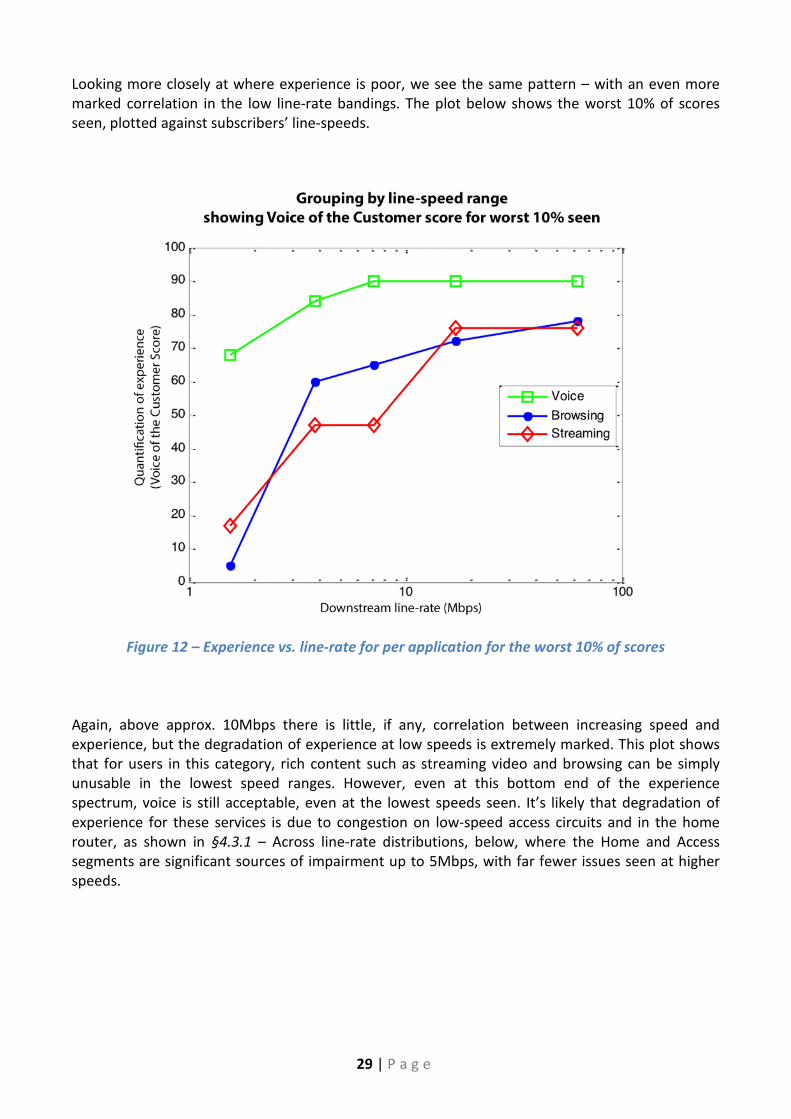
Looking more closely at where experience is poor, we see the same pattern – with an even more marked correlation in the low line-rate bandings. The plot below shows the worst 10% of scores seen, plotted against subscribers’ line-speeds.
Figure 12 – Experience vs. line-rate for per application for the worst 10% of scores
Again, above approx. 10Mbps there is little, if any, correlation between increasing speed and experience, but the degradation of experience at low speeds is extremely marked. This plot shows that for users in this category, rich content such as streaming video and browsing can be simply unusable in the lowest speed ranges. However, even at this bottom end of the experience spectrum, voice is still acceptable, even at the lowest speeds seen. It’s likely that degradation of experience for these services is due to congestion on low-speed access circuits and in the home router, as shown in §4.3.1 – Across line-rate distributions, below, where the Home and Access segments are significant sources of impairment up to 5Mbps, with far fewer issues seen at higher speeds.
29 | P a g e

4.2.3 Does line-rate influence experience across all speed distributions?
The results show that there isn’t a simple answer to this question. However, the following points are clear:
• There is a strong correlation between experience and line-speed up to approx. 8-10Mbps
• Above that point there is only a marginal improvement of typical experience
Consistency of experience also shows a strong correlation with line-speed up to the approx. 10Mbps point. Thereafter there is marginal improvement until ‘super-fast speeds’ of around 40Mbps and above are reached. There is then a small, but noticeable improvement in consistency of experience.
30 | P a g e

4.3 Dominant factors affecting experience Actual Experience analytics are able to isolate the causes of degraded experience (why is the digital supply chain operating below its optimum capability) for each user, for each application. This section presents those results to show evidence of systematic impairments overall, within the line-rate bandings considered and across the access technology types seen. Impairments have been grouped together as follows:
Home – user environments, including WiFi and router
Access – the access circuit and upstream ISP node (e.g. the local BRAS or DSLAM)
ISP – the provider’s infrastructure upstream of the local access node
Upstream – infrastructures (including content providers) upstream of the ISP
Figure 13 – Relative impairments across all applications This plot shows the region of the digital supply chain where behaviour is occurring that impacts experience of each application. In each case, the reasons for variable and lowered quality are spread across the digital supply chain – simply improving access speed, or indeed looking at any one of these areas will not resolve the set of issues that harm consumers’ experiences. It is the entirety of the digital supply chain, and its collaborative management by the various providers involved, that should be addressed if these issues are to be resolved and a higher quality of product delivered to consumers.
31 | P a g e

4.3.1 Across line-rate distributions
Figure 14 – Relative sources of impairment across line-rates
Here we see evidence of impacts across different access speeds and this plot shows the line-rate bandings considered plotted against the relative impairment. It is important to note that the presence of impairments does not directly imply a low Voice of the Customer score, not their absence a high score. The size of impairments relates to the difference between the benchmark (that indicates the best score that the digital supply chain can support) and typical consumer experience. So, a digital supply chain with a low benchmark may not exhibit many impairments and conversely, a digital supply chain with a high benchmark may exhibit a several impairments. The outcome could be the same typical experience for the consumer. However, impairments are an indication of why the digital supply chain fails to perform to the best of its ability, from the explicit perspective of consumer experience of each application. Greater levels of impairment imply greater variability of experience and less effective management of the digital supply chains involved. This variability can frequently lead to greater consumer frustration than consistent performance at a lower level of quality, because it’s clear that the service can perform better, but often or sometimes fails to do so.
32 | P a g e
The nature of these impairments is considered below.
• Impacts from WiFi and CPE are very high for the lower speed bandings (<2 and 2-5Mbps), implying that these devices simply do not perform as well as their higher speed counterparts. This is to be expected with respect to WiFi, in that older, typically ADSL CPE will not take advantage of the latest WiFi standards, particularly 802.11n and 802.11ac that have better performance in indoor environments. They may also be less well spec’d in terms of memory and cpu performance.
• Access impacts are similarly high, suggesting that lower speed connections are also less well managed. As increasing investment and focus is made into high-speed services, this may be an indication that lower speed products are getting left behind. While access generally is interpreted as the consumer to the local exchange, there can be multiple infrastructure elements involved.
• Negative effects from the ISP segment of the digital supply chain reduce markedly as speeds increase through the first two bandings. This is particularly noticeable in the <2Mbps banding. This may be as a result of better management for faster (>5Mbps) services, which again would correlate with increased focus and investment into higher speed services.
• In the upstream segment, there are also fewer impacts at higher speeds. This may indicate preferential routing and management for higher speed products although, especially in the <2Mbps banding, the negative effects of the upstream segment are being overshadowed by the other parts of the digital supply chain. It is interesting to note that, for the >40Mbps band, there is almost no impairment other than the upstream segment. This may be because ISP infrastructures are well managed for very high-speed services and are operating without impairment for the applications considered here.
In summary, these results strongly support the view that low speed (<5Mb) services are less consistent and experience more issues than those at higher line-rates. However, there is very little improvement between the 5 and 40Mbps bands and it is only at line-rates >40Mbps that consistency improves again to a significant degree.
4.3.2 Conclusion: Line-rate as an indicator of experience
So line-speed does influence experience up to a point and these results suggest that that point is reached around 8-10Mbps. Beyond that, management of the digital supply chain is the dominant factor that determines whether the good experience that can be delivered, is indeed seen and maintained. This result is, however, for a single user of the services considered here. A home with e.g. several people simultaneously consuming streaming video may well benefit from higher access speeds. An implication from these results is that the digital supply chains for higher speed products appear to be better managed – reducing the impairments seen in all areas and improving the consistency of the experience of applications. This is especially so for the newest ‘super-fast’ services. That this improvement is not directly about line-speed, but rather about the management of the digital supply chains is a very important result – suggesting that UK infrastructure is capable of supporting good to excellent experience for all but the lowest speed connections, given appropriate focus on infrastructure management.
33 | P a g e

4.4 User survey results As part of this project, Ofcom requested that a user survey be carried out to allow a direct correlation of users’ perception against the results given here. At this early stage, we offered consumers a limited survey, to understand their usage of the Internet as well as their experience of it. This included selected questions regarding their perception of applications and these are compared against Actual Experience Voice of the Customer scores below. As can be seen, for the applications considered here, a clear correlation exists, although less so with voice – and this result is explained overleaf. Clearly more work is necessary both in understanding the range of applications and services as well as the performance that is observed. In some cases, no responses were received to questions asked and overall, the statistical sample size was low (145 responses), so there was little benefit in asking more detailed questions.
Figure 15 – Actual Experience Voice of the Customer compared to consumer survey results
34 | P a g e

There is some discrepancy between the Actual Experience Voice of the Customer results and the survey results for voice, particularly with a greater proportion reporting ‘poor or bad’ for voice. This is not unexpected and is seen here for two principle reasons:
• Although the Actual Experience analysis is able to calibrate for different CODECs used in voice and video services, only the high-quality G.711 standard was considered here. So the scores produced indicate the quality of voice that would be experienced, if that CODEC were in use. However, many more aggressive CODECs exist in common consumer usage that sacrifice some degree of clarity to avoid call drops over low bandwidth or lossy connections. These would necessarily reduce the perceived quality of the call.
• Secondly, this report explicitly looks at the performance of UK infrastructure. For users making international Internet voice calls, the variables of those far more complex digital supply chains would be present, increasing the likelihood of impairment or simply low quality connections.
Both of these are obvious areas for future study and are within the current capabilities of the Actual Experience platform and methodology.
35 | P a g e

5 Summary
This project set out to analyse the Internet experience of UK consumers for popular applications. Specifically, the effect of broadband access speed was a focus and this report shows the following results:
• Broadband access speed is the dominant factor in determining consumer experience only up to speeds of around 10Mbps.
• As access speeds increase from approx. 10 to 40Mbps there is very little improvement in the experience of digital services. Beyond this point other factors in the digital supply chain are dominant in their effect on consumers’ experience.
• At lower speeds there is significant variation in consumer experience. As we move to higher speeds, there is some improvement of the consistency of experience, but the level of best and typical experience do not substantially improve.
• There are a number of reasons for this variability, with all parts of the digital supply chain contributing to the impact on consumers.
• Behaviours in the digital supply chain impacting consumer experience vary between applications. Performance issues have been seen in all parts of the supply chain; from the home, through access and ISP infrastructure; peering and upstream providers; to content providers.
These results lead to the following conclusions:
• Line-speed is a critical factor in determining performance, up to a certain point. However, beyond around 8-10Mbps, further increases in line-speed look to have limited benefit in improving consumer experience.
• Above around 10Mbps, the improvement in consumer experience looks to be driven more by improvements in management of the digital supply chain than by simply increasing line speed.
• Thus, the whole digital supply chain should be considered in its entirety – in terms of:
o Performance of consumer CPE devices
o How well providers manage their own networks
o Their upstream connections and routing to content providers
o How well content providers manage their applications and infrastructures
Effort from all parties involved in delivery across the digital supply chains, ensuring all of these elements work together in harmony, should be considered a primary route to improving consumer experience. Without this, even with significant investment in one or more specific areas, variability and poor performance in the other areas will remain – with a continuing impact on the consumer.
36 | P a g e

5.1 Implications following a successful project There are several factors to consider as a result of accepted conclusions from this report. Most importantly, if faster does not always mean better, then conclusions can be drawn as to where providers and policy makers can focus to improve consumer experience. Secondly, if a threshold speed has been seen, beyond which good experience is possible for all services considered, then this could define the entry level for ‘digital inclusion’ for consumers anywhere in the UK. Beyond that point, good management of provider infrastructures will maintain and improve that experience more effectively than faster access speeds. Although this project has over 500 participants, this is still a relatively small sample group. This has implications on how the data can be used. For example, there is an insufficient sample size to compare application behaviour across different ISPs at different line-speeds; to investigate systemic behaviours in providers; and to consider variations between different local areas. Given the variations of core and edge infrastructure that exist within large provider networks, a greater density of sample points would be required to understand any resultant variability in experience. From a consumer perspective, this report is useful in a general sense – e.g. in suggesting a minimum suitable speed, but much more data is required to understand local variations that would inform real consumer choice. In particular, the following would benefit from additional study at greater scale:
• Provider performance across line-speed bandings
• Meaningful analysis of individual providers
• An understanding of the relative effects of different access technologies
• Understanding the variability of behaviour in several scenarios, including impairment sources seen for specific applications
In addition, this report only considers the experience of consumers using fixed-line broadband. There is a huge increase in Internet usage from mobile devices (more then doubling between 2009 and 201312) and spectrum analysis is clearly an important area for concurrent study. The methodologies discussed here are equally applicable to mobile broadband services and, combined with additional fixed-line work, could give a more complete picture of consumer experience in the UK.
12 Ofcom: The Communications Market 2013 (August)
37 | P a g e

Annex A – Additional information
Recruiting methodology Recruitment has been carried out via a number of mechanisms:
• Existing subscribers to BBFix
• Word of mouth to personal and professional contacts
• Individuals associated with Actual Experience
• Local and national press either directly related to the BBFix project or more generally regarding Actual Experience
• Direct contact with parish magazines across the UK, to assist with generating (particularly) rural community interest
This has led to numbers in excess of the required subscriber base for this project and there is a steady increase in subscribers, day-by-day.
ISPs seen The following ISPs have been seen for UK subscribers as part of this project: Andrews and Arnold AOL (now TalkTalk) Be (now Sky) Breathe BT Claranet COLT Daisy Demon (now Vodafone)
Eclipse EE Exponential-e IDNet Jersey Telecom MDNX O2 (now Sky) Orange (now EE) Plusnet (a BT brand) Sky
Supanet TalkTalk TFM Vodafone Virgin Media WightFibre XILO XLN York Data Services Zen
Applications Analysed Media-rich web browsing General web browsing VoIP Two popular video streaming services VPN services Video conferencing Online gaming Smart metering
38 | P a g e

Annex B – Evidence of conditions impacting experience
Impairments As has been discussed above, Actual Experience analytics are capable of diagnosing specific behaviours in digital supply chains that impact human experience. Examples of such diagnoses, relevant to this report, are given below. Provider-identifying information, e.g. device IP addressing, has been blurred out.
In home
These diagnoses enable both individuals and providers to take appropriate action to remediate the issues seen that affect the human experience of the services analysed.
Figure 16 – Poor WiFi performance
Figure 16, above, (from the Actual Experience user interface) shows behaviour associated with poor WiFi performance. The device in the digital supply chain is identified as the local CPE router and the plot above shows loss vs. delay. This ‘signature’ of both significant loss and high delay variation, in the local access router is highly consistent with behaviours seen with poorly configured or poorly responding WiFi services.
39 | P a g e

Figure 17 – Poor CPE performance
In Figure 17, above, we see the CPE router again, but this time the signature is indicative of performance bottlenecks within the device, rather than poor WiFi. The high spread of latencies, without loss, indicate resource exhaustion in the CPE as traffic is processed. Typically, this equates to a device that is under-specified in terms of memory, cpu or both. Earlier results indicated that ‘home’ performance was especially poor for users in the lower speed bands (<5Mbps), who may well be using older devices with lesser performance characteristics than the CPE provided with faster services. Results such as these show why such devices may negatively impact the experience of subscribers.
40 | P a g e

Network provider
Figure 18 – Impairments in the ISP network
Figure 18, above, is from a local aggregation node – two hops up from the subscriber’s CPE router. This is indicative of both congestion (loss across latency bandings) and resource exhaustion along the digital supply chain to this point – the high spread of latencies indicating significant buffering and/or queuing and loss at low latency suggesting rapid buffer overflows. The implication from this result is that there are devices and/or link capacities in this segment of the digital supply chain that are under-specified for the traffic they are required to process, and they are having a negative impact on connected subscribers.
41 | P a g e

Upstream (network infrastructure)
Figure 19 – Impairments in the upstream network
Figure 19, above, shows the effects of policing at a peering point – a configuration that causes consumer traffic to be dropped under certain conditions, at a location where two or more providers physically connect together to allow traffic to pass between their networks.
42 | P a g e

Upstream (content provider)
Figure 20 – Poor content server performance
For ‘super-fast’ speed bandings, impairments were mostly seen in the upstream segment of the digital supply chain – the infrastructure between the ISP and content provider. In addition, media-rich browsing performance did not improve at very high speeds, suggesting that there may be a resource constraint within the content provider. Figure 20, above, shows evidence of that, with the plot of goodput (application throughput) vs. application response time indicating an inability of the content provider to serve data efficiently under load. In this case, the content is from a media-rich browsing server.
43 | P a g e

Weaknesses and bottlenecks in the digital supply chains It is apparent from these results that weaknesses exist across the digital supply chains and can have severe effects on the human experience of the applications considered. Principle conclusions are as follows:
• In the low speed bands (<5Mbps), there are severe impairments in the home environment (the CPE router and WiFi), the ISP access network and to a somewhat lesser extent the ISP network upstream of the access nodes.
• Consistency of experience is significantly improved in the 5-10Mbps and 10-40Mbps bands, but does not show significant change between them. Weaknesses are seen across all areas – home, access, ISP and content.
• With high-speed connections (the 40Mbps+ band), there is relatively little impairment from providers’ networks and CPE look to perform better, both in terms of passing traffic and general WiFi performance. This suggests that traffic from high-speed products is well managed by the ISPs seen. Impairments from content providers are more relevant here, and become the bottleneck – implying that even higher access speeds would deliver little noticeable return to the user, for the services considered.
44 | P a g e