introduction -...
TRANSCRIPT

Modelling the implications of reducing smoking prevalence: the benefits of increasing
the UK tobacco duty escalator to public health and economic outcomes
Knuchel-Takano A1, Hunt D2, Jaccard A1, Bhimjiyani A3, Brown M1, Retat L1, Brown K4,
Hinde S5, Selvarajah C2, Bauld L2,6, Webber L1
1 Department of Public Health Modelling, UK Health Forum (formerly the National Heart
Forum), London, UK
2 Department of Prevention, Cancer Research UK, London, UK
3 School of Clinical Sciences, University of Bristol, Bristol, UK
4 Department of Analysis and Evaluation, Cancer Research UK, London, UK
5 Centre for Health Economics, University of York, UK
6 Institute for Social Marketing and UK Centre for Tobacco and Alcohol Studies, University
of Stirling, UK
Correspondence to:
Laura Webber, Director Public Health Modelling, UK Health Forum, Fleetbank House,
London England EC4Y 8JX UK; [email protected]
+44 (0)2078326920
Word Count (excl. tables, references, abstract and ‘what this paper adds’, max. 3500):
3199
1
1
2
3
4
5
6
7
8
9
10
11
12
13
14
15
16
17
18
19
20
21
22

WHAT THIS PAPER ADDS
This paper is the first to calculate the substantially improved health outcomes that
could be delivered from increasing the tobacco duty escalator in the UK.
Increasing the tobacco duty escalator on cigarettes from 2% to 5% above inflation
could reduce smoking prevalence from an estimated 10% to around 6% in the UK,
avoiding around 75,200 cases of disease in the next twenty years.
Increasing the tobacco duty escalator would also have a substantial impact on
reducing costs to the NHS, social care and wider society.
2
23
24
25
26
27
28
29
30

ABSTRACT
Introduction
Taxing tobacco is one of the most effective ways to reduce smoking prevalence, mitigate its
devastating consequential health harms, and progress towards a tobacco-free society. This
study modelled the health and economic impacts of increasing the existing cigarette tobacco
duty escalator in the UK from the current 2% above consumer price inflation to 5%.
Methods
A two-stage modelling process was used. Firstly, a non-linear multivariate regression model
was fitted to cross-sectional smoking data, creating longitudinal projections from 2015 to
2035. Secondly, these projections were used to predict the future incidence, prevalence and
cost of 17 smoking-related diseases using a Monte Carlo microsimulation approach. A
sustained increase in the duty escalator was evaluated against a baseline of continuing
historical smoking trends and the existing duty escalator.
Results
A sustained increase in the tobacco duty escalator is projected to reduce adult smoking
prevalence to 6% in 2035, from 10% in a baseline scenario. After increasing the tobacco duty
escalator, only 65% of female and 60% of male would-be smokers would actually be
smoking in 2035. The intervention is projected to avoid around 75,200 new cases of
smoking-related diseases between 2015-2035. In 2035 alone, £49m in NHS and social care
costs and £192m in societal premature mortality and morbidity costs is projected to be
avoided.
Conclusion
Increasing the UK tobacco duty escalator to 5% above inflation could effectively reduce
smoking prevalence, prevent diseases, and avoid healthcare costs. It would deliver substantial
3
31
32
33
34
35
36
37
38
39
40
41
42
43
44
45
46
47
48
49
50
51
52
53
54

progress towards a tobacco-free society, and should be implemented by the UK Government
with urgency.
4
55
56

INTRODUCTION
Tobacco remains a product unlike any other; it kills up to two in three long term
users[1], is the leading preventable cause of a host of diseases[2,3] and is the largest single
driver of health inequities[4,5]. Within a comprehensive approach to tobacco control, fiscal
measures are one of the most effective policy levers to reduce the burden of disease[6-8]. The
Framework Convention on Tobacco Control, identifies “the effective and important means”
of price and tax measures to reduce tobacco consumption[9].
A broad international research base exists on the impact of tobacco taxation on
individual smoking behaviours[10-13] particularly among more deprived smokers[14-18];
cessation service uptake[19]; and motivations to quit[20]. At the population level, research
has typically focused on either taxation as a source of government revenue[21-23], or
interference by the tobacco industry to manipulate pricing strategies[24,25] and undermine
taxation policy[26,27-30]{Krasovsky, 2010 #2078}{Krasovsky, 2010 #2078}{Krasovsky,
2010 #2078}.
At 219% of the EU average, the UK price level index (PLI) of tobacco is the highest
among EU member states[31]. The tobacco tax in the UK is currently paid through a
combination of specific duty (a price per quantity of product, £3.93 per pack of 20 cigarettes
in 2016), ad valorem duty (a percentage of the retail price, 16.5% in 2016), and a standard
rate of 20% value-added tax (VAT)[32]. The two main products in the UK tobacco market
are cigarettes and hand-rolled tobacco (HR-T), and separate duties are paid for each. Recent
UK policies have addressed subsets of the UK tobacco market, includeing a minimum excise
tax to establish a base rate of tax per pack of cigarettes which impacts on the cheapest
available options[33] and increased duty on HR-T. Both policies are likely to discourage
‘downtrading’ to cheaper tobacco products[34].
5
57
58
59
60
61
62
63
64
65
66
67
68
69
70
71
72
73
74
75
76
77
78
79
80

Over the last 25 years, a notable UK policy has been a duty escalator on cigarettes
that rises above consumer price inflation, continuously increasing the price decreasing the
affordability of cigarettes[35]. This measure is unique among developed economies. In 1991,
the Chancellor of the Exchequer found “strong arguments for a big duty increase on
tobacco”[36], which followed in 1992/93. A duty escalator above inflation was implemented
in certain years up to 2001, including at 5% above inflation from 1997-2001, before being
scrapped and subsequently re-introduced in 2010. Since then the duty escalator has been set
at 2% above inflation, other than one year of increase to 5% above inflation in 2012-13.
Conducting research on tobacco taxation is important to ensure that it remains
effective. Research involving sSimulation models is particularly relevant tocan inform
planning for fiscal policies, predicting the impact of tobacco taxation on smoking prevalence,
disease and economic burdens, and disaggregateing the impact of a tax from other tobacco
control interventions. To date, simulation modelling has typically quantified the impact of
decreasing smoking prevalence on disease and economic outcomes[21,37-44]. There are
fewer examplesBy contrast, attempts to analyse of estimating the impact of specific taxation
policies on public health and economic outcomes are lacking. Particular countries have
implemented significant rises in tobacco excise taxes and modelled or evaluated outcomes,
including New Zealand[41,45-47] and Australia[11], where 12.5% tobacco excise increases
are planned until 2020. Other recent international examples include Lebanon and Greece are
only recently emerging[48,49].
OurThis UK study estimated the impact of increasing the tobacco duty escalator on
cigarettes and HR-T from 2% to 5% above inflation each year from 2015 to 2035 in the UK,
against a natural progression baseline scenario based on projections of current and historical
smoking prevalence and . It evaluated the impact of changing smoking trends on disease
burden the future UK burden of a range of cancers, coronary heart disease (CHD), stroke, and
6
81
82
83
84
85
86
87
88
89
90
91
92
93
94
95
96
97
98
99
100
101
102
103
104
105

chronic obstructive pulmonary disorder (COPD), and resulting costs to the UK National
Health Service (NHS), social care and society. The year 2015 was chosen as the start year
since the analysis was carried out in 2015. The year 2035 was selected since a policy of
interest in the UK tobacco control community is the Government establishing a ‘tobacco-free
ambition’ of 5% smoking prevalence or less by 2035[50]. Research that can help make
progress towards this ambition is important.
7
106
107
108
109
110
111

METHODS
Statistical analysis: The UKHF Microsimulation Model
A dual-module modelling process written in C++ software, developed by the UK
Health Forum (UKHF) is described in greater depth in Supplementary File 1 and Hunt et
al[44], and was used for this study. The year 2015 was chosen as the start year since the
analysis was carried out in 2015. The year 2035 was selected since a policy of interest in the
UK tobacco control community is the Government establishing a ‘tobacco-free ambition’ of
5% smoking prevalence or less by 2035[50].
Data sources
The literature was searched for the most up to date incidence, prevalence, mortality,
survival, and relative risk data. Model data inputs including A table of International
Classification of Diseases version 10 (ICD-10) codes by disease and epidemiological
parameters, included in the model is presented in Supplementary File 2. A summary of data
input references is provided in Supplementary File 3 and in Table 1 and data inputs are
provided in Supplementary File 4. Ddisease cost data were drawn from NHS programme
budget costs[51], and references are presented in the supplementary online material.
Table 1. Data inputs
Risk Factor data
1. Historical and current prevalence of smoker status (never smoker, ex-smoker and
smoker) broken down by age, sex and income quintile
Disease data
2. Most recent incidence, mortality and survival of the diseases of interest, broken
down by age and sex
3. Relative risk of acquiring the diseases of interest, broken down by age and sex
Demographic data
8
112
113
114
115
116
117
118
119
120
121
122
123
124
125
126
127

4. Most recent UK population, broken down by age and sex
5. Most recent mortality and fertility rates of the UK population
Health economic data
6. Mean utility weights of the diseases of interest without medical intervention
7. Most recent direct NHS costs associated with the diseases of interest
8. Most recent indirect societal costs associated with the diseases of interest
Tobacco duty escalator assumptions
9. Overall average retail price of cigarettes: £7.13[52]
10. Price of HR-T: £7.89[53]
11. Price elasticity: -0.5 for cigarettes, and -1.17 for HR-T[54]
12. Consumer price index: 2%
13. Level of taxation:
VAT at 20%;
ad valorem duty at 16.5%;
specific duty would increase from £176.20 per 1,000 cigarettes in 2013[53]
14. Pass on rate: 100%
15. Illicit trade: 10% of the total market
The model included 14 different smoking-related cancers classified by the
International Agency for Research on Cancer[55].
These are acute myelogenous leukaemia (AML), bladder, cervical, chronic
myelogenous leukaemia (CML), colorectal, gallbladder, kidney, laryngeal, liver, lung,
oesophageal, oral, ovarian, pancreatic. It also included Coronary Heart Disease (CHD),
Chronic Obstructive Pulmonary Disease (COPD) and stroke.
9
128
129
130
131
132
133
134

Table 1 and the supplementary file 5 provide detail of the assumptions used in the
tobacco duty escalatory scenario. To note, as well as average retail price, the prices of the two
tobacco products were further defined by the rate of consumer price inflation, level of
taxation, the ‘pass-on’ rate, and illicit trade. Based on the existing UK tobacco taxation, it
was assumed that from 2015 through to 2035: VAT would continue to apply at 20%; ad
valorem duty would continue to apply at a rate of 16.5%; and that specific duty would
increase in the duty escalator from the published rate of £176.20 per 1,000 cigarettes in
2013[53]. All other factors were assumed to be captured by the Consumer Price Index
inflation rate, which was also kept constant at 2% per annum. As a result, changes from the
2013 weighted average price of a pack of cigarettes were only affected by the specific duty
component of the escalator.
Consistent with the most recent available information at the time of data
collection[56], it was estimated that the illicit tobacco market would remain stable at 10% of
the total market, given the existence of a range of current activities to contain the illicit
market that are likely to continue for the foreseeable future. The illicit price of tobacco in the
UK is estimated to be 50% of the legal price[41], so the illicit price of both cigarettes and
HR-T was modelled as such.
A sensitivity analysis was carried out on the price elasticity for cigarettes to explore
the impact of this on later outcomes (supplementary file 6).
10
135
136
137
138
139
140
141
142
143
144
145
146
147
148
149
150
151
152
153
154

RESULTS
Increasing and sustaining the tobacco duty escalator in the UK would increase the
price of cigarettes by 87.6% and HR-T products by 78.2% in 2035 relative to the baseline
continuation of the 2% duty escalator, as displayed in Table 2. This results in an average
price of £17.38 per pack of 20 cigarettes and £15.57 of HR-T products in 2035.
Table 2. Predicted impact of the tobacco duty escalator in the baseline and intervention
scenario on the future price of cigarette products and hand-rolled tobacco (HR-T) between
2015 and 2035
Cigarettes Hand-rolled tobacco (HR-T)
Average price in
baseline scenario
Average price in
intervention
scenario
Average price in
baseline scenario
Average price in
intervention
scenario
2015 £7.05 £7.36 £6.61 £6.87
2020 £7.78 £9.07 £7.30 £8.37
2025 £8.59 £11.23 £8.06 £10.26
2030 £9.48 £13.95 £8.89 £12.61
2035 £10.47 £17.38 £9.82 £15.57
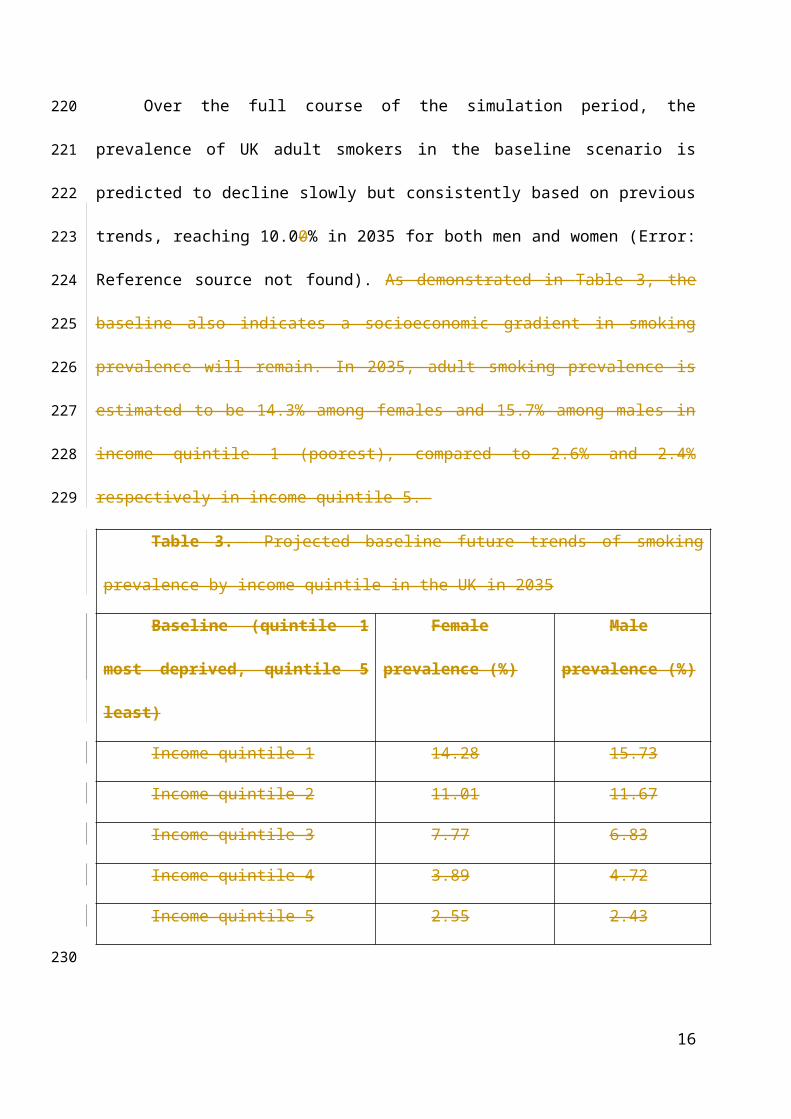
Over the full course of the simulation period, the prevalence of UK adult smokers in
the baseline scenario is predicted to decline slowly but consistently based on previous trends,
reaching 10.00% in 2035 for both men and women (Error: Reference source not found). As
demonstrated in Table 3, the baseline also indicates a socioeconomic gradient in smoking
prevalence will remain. In 2035, adult smoking prevalence is estimated to be 14.3% among
females and 15.7% among males in income quintile 1 (poorest), compared to 2.6% and 2.4%
respectively in income quintile 5.
11
155
156
157
158
159
160
161
162
163
164
165
166
167

Table 3. Projected baseline future trends of smoking prevalence by income quintile
in the UK in 2035
Baseline (quintile 1 most
deprived, quintile 5 least)
Female
prevalence (%)
Male
prevalence (%)
Income quintile 1 14.28 15.73
Income quintile 2 11.01 11.67
Income quintile 3 7.77 6.83
Income quintile 4 3.89 4.72
Income quintile 5 2.55 2.43
By contrast, iIncreasing the tobacco duty escalator would deliver a clear additional
impact on decreasing smoking prevalence relative to baseline, with this trend sustained
throughout the intervention period. While projections by income group for the intervention
were not calculated, Table 4 demonstrates the impact on male and female smoking
prevalence in five-year time periods. In just 5 years, smoking prevalence is predicted to fall
an additional 0.79% for women (from 15.00% to 14.21%) and 0.94% for men (16.00 to
15.06%). By 2025, smoking prevalence is predicted to fall an additional 1.62% for women
(13.00% to 11.38%) and 1.95% for men (14.00% to 12.05%). This rate of decline increases
further to 2035, where 6.04% of men and 6.46% of women smoke compared to 10.00% for
both in the baseline.
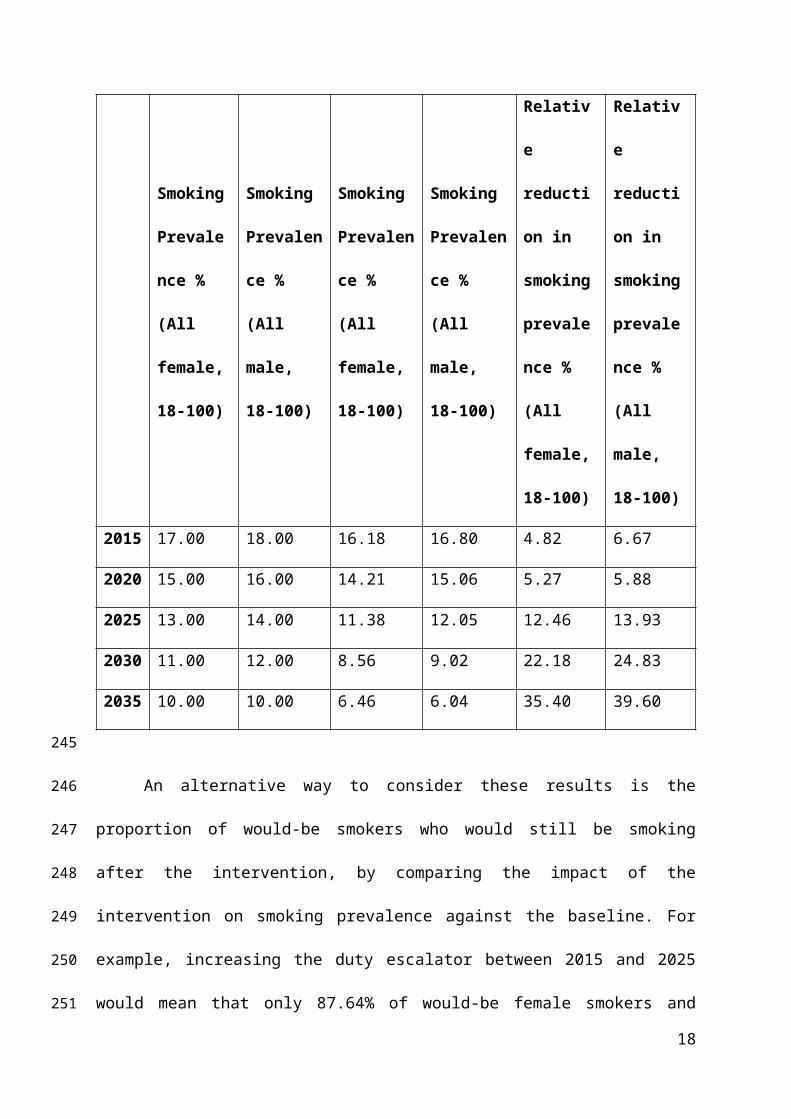
Table 4. Projected baseline and intervention future trends of smoking prevalence in the
UK between 2015 and 2035
Baseline continuation of
duty escalator at 2%
above inflation
Intervention increasing the tobacco duty escalator
at 5% above inflation
12
168
169
170
171
172
173
174
175
176
177
178

Smoking
Prevalence
% (All
female, 18-
100)
Smoking
Prevalence
% (All
male, 18-
100)
Smoking
Prevalence
% (All
female, 18-
100)
Smoking
Prevalence
% (All
male, 18-
100)
Relative
reduction
in smoking
prevalence
% (All
female, 18-
100)
Relative
reduction
in smoking
prevalence
% (All
male, 18-
100)
2015 17.00 18.00 16.18 16.80 4.82 6.67
2020 15.00 16.00 14.21 15.06 5.27 5.88
2025 13.00 14.00 11.38 12.05 12.46 13.93
2030 11.00 12.00 8.56 9.02 22.18 24.83
2035 10.00 10.00 6.46 6.04 35.40 39.60
An alternative way to consider these results is the proportion of would-be smokers
who would still be smoking after the intervention, by comparing the impact of the
intervention on smoking prevalence against the baseline. For example, increasing the duty
escalator between 2015 and 2025 would mean that only 87.64% of would-be female smokers
and 86.07% of would-be male smokers are predicted to still be smoking. This impact
increases over time, so that by 2035 only 64.6% of would-be female smokers and 60.4% of
would-be male smokers would still be smoking.
Increasing the tobacco duty escalator was estimated tocould also lead to a modest
reduction inof the disease burden over the time periodstudied,. It is predicted to avoiding
around 7,267 (1.6% of total) new cases of smoking-related disease in the UK in the year 2035
alone. The majority are cancers (2,907; 1.5%), predominantly lung cancers (2,180; 3.7%),
followed by COPD (2,180; 3.3%) and stroke (2,180; 2.5%), with no significant change
13
179
180
181
182
183
184
185
186
187
188
189
190
191

recorded for rates of CHD. These data are presented in Table 5, alongside the aggregate
impact over a 20-year period. Over this time, increasing the tobacco duty escalator is
predicted to avoid around 75,254 cumulative incident cases of disease in the UK.
Supplementary File 7 presents the incidence and cumulative incidence cases every 5 years of
the simulation.
Following these improved health outcomes, iIncreasing the tobacco duty escalator is
also predicted to avoid £49m in direct NHS and social care costs in the year 2035 alone,
mostly. Most of these costs are avoided as a result of fewer cancer cases (£25m), followed by
other diseases. Also presented in Table 5 are the broader economic savings delivered through
educed morbidity and mortality costs that impact economic productivity in the UK
population. Here, tThe intervention could delivering savings of around £192m in the year
2035 alone.
14
192
193
194
195
196
197
198
199
200
201
202
203
204

Table 5. Increasing the tobacco duty escalator versus a baseline projection, health and economic outcomes by disease. All data is for the UK population in 2035, except the cumulative incidence which is 2015-2035. Tobacco-related disease Baseline incidence (CI) TDE scenario
incidence (CI)Incidence cases avoidable(CI)
Baseline cumulative incidence (CI)
TDE scenario cumulative incidence (CI)
Cumulative incidence cases avoidable (CI)
Direct costs avoided (CI) /£million
Indirect costs avoided (CI)/£million
Coronary Heart Disease (CHD) 99552 (98825-100279) 99552 (98825-98825) 0 (-727-727) 1961426 (1959355-1963497)
1957284 (1959355-1963497)
4142 (1380-6904) 5 (2-8) -
Chronic Obstructive Pulmonary Disease (COPD)
65399 (64672-66126) 63219 (64672-64672) 2180 (1453-2907) 1494025 (1491954-1496096)
1474004 (1491954-1496096)
20022 (17260-22784) 9 (8-10) -
Stroke 85745 (85018-86472) 83566 (85018-85018) 2180 (1453-2907) 1837844 (1835773-1839915)
1817823 (1835773-1839915)
20022 (17260-22784) 10 (8-12) -
Smoking-related cancers 196197 (195169-197225) 193291 (195169-195169)
2907 (1879-3935) 4290145 (4286763-4293527)
4259077 (4286763-4293527)
31068 (26926-35210) 25 (18-32) -
Acute Myeloid Leukaemia (AML)
3633 (3633-3633) 3633 (3633-3633) 0 (0-0) 67659 (66969-68349) 67659 (66969-68349) 0 (-690-690) 13 (7-19) -
Bladder Cancer 13080 (13080-13080) 13080 (13080-13080) 0 (0-0) 289968 (289278-290658) 288587 (289278-290658) 1381 (691-2071) 0 (0-0) -Bowel Cancer 49413 (48686-50140) 49413 (48686-48686) 0 (-727-727) 956894 (955513-958275) 956204 (955513-958275) 690 (-1381-2761) 0 (-2-2) -Cervical Cancer 3633 (3633-3633) 3633 (3633-3633) 0 (0-0) 69730 (69040-70420) 69730 (69040-70420) 0 (-690-690) 0 (0-0) -Chronic Myeloid Leukaemia (CML)
727 (727-727) 727 (727-727) 0 (0-0) 15879 (15879-15879) 15879 (15879-15879) 0 (0-0) 0 (0-0) -
Gastric Cancer 8720 (8720-8720) 8720 (8720-8720) 0 (0-0) 176052 (175362-176742) 175362 (175362-176742) 690 (0-1380) 0 (-1-1) -Hepatic Cancer 5087 (5087-5087) 5087 (5087-5087) 0 (0-0) 106322 (105632-107012) 105631 (105632-107012) 690 (0-1380) 0 (-1-1) -Laryngeal Cancer 2907 (2907-2907) 2907 (2907-2907) 0 (0-0) 69730 (69040-70420) 69040 (69040-70420) 690 (0-1380) 1 (1-1) -Lung Cancer 58859 (58132-59586) 56679 (58132-58132) 2180 (1453-2907) 1427056 (1424985-
1429127)1410487 (1424985-
1429127)16570 (13808-19332) 8 (7-9) -
Oesophageal Cancer 10900 (10900-10900) 10900 (10900-10900) 0 (0-0) 272708 (272018-273398) 269256 (272018-273398) 3452 (2762-4142) 2 (1-3) -Oral Cancer 7993 (7993-7993) 7993 (7993-7993) 0 (0-0) 194002 (193312-194692) 190550 (193312-194692) 3452 (2762-4142) 1 (1-1) -Ovarian Cancer 8720 (8720-8720) 8720 (8720-8720) 0 (0-0) 176742 (176052-177432) 175362 (176052-177432) 1381 (691-2071) 1 (0-2) -Pancreatic Cancer 10900 (10900-10900) 10173 (10900-10900) 727 (727-727) 220928 (220238-221618) 219547 (220238-221618) 1381 (691-2071) 0 (-2-2) -Renal Cancer 11627 (11627-11627) 11627 (11627-11627) 0 (0-0) 246473 (245783-247163) 245782 (245783-247163) 690 (0-1380) 0 (0-0) -Total 446,894 (445,268-
448,519)439,627 (438,002-
441,253)7,267 (5,642-
8,891)9,583,440 (9,578,510-
9,588,371)9,508,187 (9,503,256-
9,513,117)75,254 (68,926-
81,581)49 (40-57) 192,054,0
31
15
205
206
DISCUSSION
Despite only being one policy in a suite of options to reduce smoking prevalence, and
a short time horizon of the study that is unlikely to capture all diseases avoided, tThis study
finds substantial benefits of increasing the tobacco duty escalator.
Findings show a sustained increase in the tobacco duty escalator can accelerate the
trend of declining smoking prevalence in the UK. While benefits begin to appearbe
demonstrated within a five-year period, equivalent to one UK Parliamentary term, it could
also deliver substantial progress towards achieving a tobacco-free ambition. As a
consequence, findings show increasing the tobacco duty escalator could avoid new cases of
disease, as well as avoid substantial costs to the NHS, social care and wider society.
This impact could be further maximised by One way to maximise the impact of
tobacco taxation is allocating the costs avoided or revenue raised to support tobacco control.
While difficult to quantify, it is possible to predict additional benefits if the resulting savings
could be spent on the NHS. Using a recent estimate by Claxton et al[57], investing the £49m
of direct health costs avoided in this study elsewhere in the NHS would generate the
equivalent of 1,923 Quality Adjusted Life Years (QALYs), additional to health gains directly
attributable tomade in the intervention.
One recurrent tobacco industry claim against increased taxation is its impact on illicit
trade. While ongoing support to enforce protections against tobacco smuggling is required to
underpin successful taxation policy, research has found industry claims inconsistent with
independent data[58]. Substantial progress has been made in the UK with illicit trade rates
having halved since 2000-01[56,59]. In addition, a European assessment found the supply of
illicit tobacco, rather than its price, is a key factor contributing to tax evasion[60].
The findings of this study demonstrate the importance of effective tobacco tax policy
in improving health as well as yielding economic benefits. They strengthen the case that,
16
207
208
209
210
211
212
213
214
215
216
217
218
219
220
221
222
223
224
225
226
227
228
229
230
231

adequately supported with measures to tackle illicit tobacco, increasing the tobacco duty
escalator can effectively reduce the disease and economic burden caused by smoking in the
UK.
Limitations and future work
This study has a number of limitations. First, it was not able to account for recent
policy developments. In particular, the UK Government’s 2016 commitment to a one-off 3%
increase in duty on HR-T has not been captured in this research[61]. However, this study
also modelled the increase in duty of cigarettes and HR-T both by 5% above inflation
annually. In reality, this calculation would not resolve existing disparity in duty between the
tobacco products, given a lower baseline duty on HR-T duty. In another discrepancy between
products, the rate of illicit trade for cigarettes was also applied to HR-T products in the
model, despite data suggesting higher rates of illicit trade for these products in the UK.
Further, research shows that use of HR-T has increased over recent years[62]. Future work
will be able to explore the impact of this recent, additional increase in duty on the prevalence
of HR-T use, and other policy mechanisms to address HR-T use such as a tax based on the
minimum consumption of tobacco products.
We assumed that the ad valorem rate of duty stayed fixed, which may in the future be
hindered by the European rule which fixes a maximum proportion of overall tobacco tax that
can be from specific duty. Future work might explain the impact that this will have on the
later outcomes.
Since this study only calculated data to 2035, and given the time lag between reducing
smoking prevalence and decreased risk of developing cancer, these projections will not have
captured all cases of disease avoided, nor economic burdens prevented, as a result of the
intervention. In addition, not all diseases caused or exacerbated by smoking were included in
17
232
233
234
235
236
237
238
239
240
241
242
243
244
245
246
247
248
249
250
251
252
253
254
255
the model, such as type 2 diabetes mellitus. As such, findings are likely to underestimate the
total impact of the tobacco duty escalator across the life course.
While this research assumed a pass-through rate of 100%, emerging research has
found the tobacco industry may over-shift prices in brand segments other than ultra-low price
cigarettes. There is evidence from the United Kingdom[63], United States[64] and New
Zealand[65] indicating that tobacco prices increase differently across product categories after
taxation. Ongoing research is required to simulate the complexities of tobacco industry
pricing strategies, and encourage more sophisticated responses from governments that
mitigate against ‘down-trading’ to cheaper tobacco products.
This study also did not calculate the impact of increasing the tobacco duty escalator
on smoking prevalence amongst more deprived groups, as disease outputs weare not
available. However, with higher smoking prevalence in the UK (as in many other countries)
among those in routine and manual professions, compared to professional and managerial
roles (15), it is reasonable to assume the benefit of reducing prevalence from a duty escalator
would be disproportionately seen in groups of higher smoking prevalence.
At the time of analysis only smoking prevalence data to 2012 were available.
Subsequent to that we have observed further declines in smoking prevalence (in line with our
predictions). Therefore, the results are not a full reflection of the number of disease cases that
could be avoided if the intervention was introduced in 2017, nor the full time-scale of all
disease that could occur across a person’s lifetime.
While data intensive, a review by the OECD deemed the microsimulation method the
most suitable for risk factor and chronic disease modelling, and is a strength of this study[66].
However, as with any model a number of assumptions have to be made, which may lead to
different sets of results. We used the most robust data inputs available, and validated
assumptions using both expert opinion and the literature[66]. We carried out a sensitivity
18
256
257
258
259
260
261
262
263
264
265
266
267
268
269
270
271
272
273
274
275
276
277
278
279
280

analysis on the price elasticity (supplementary file 6) where small changes were observed in
the disease outcomes over time. Unfortunately, it was not possible to carry out a full
stochastic sensitivity analysis given the many thousands of calculations and parameters
within the microsimulation, and the necessity of super computers. However, our future work
will use a variance based method (Sobol’s indices method) on a deterministic model using
PSUADE software (Jaccard et al, forthcoming).
The model includes a number of risk factors and a functionality to run multiple risks,
and has been utilised in over 70 countries[67-71]. However, certain inputs were not included
that should be considered in future work, either because data are lacking or it was not within
in the scope of the study. Data were found to be lacking in the following recent UK-specific
domains: cross-price elasticity figures of illicit tobacco products; elasticity figures for
tobacco products stratified by socio-economic class; cross elasticities between smoking,
drinking and other behavioural risk factors; pass-on rates for tobacco products; and recent
price elasticity of demand figures. The proportion of smokers using cigarettes and HR-T was
kept constant throughout the intervention, because of an absence of evidence calculating the
cross-price elasticities between tobacco products. Similarly, this study did not explore the
impact of other lower priced alternatives, such as e-cigarettes, in the market on the
effectiveness of increased taxation on smoking use of electronic nicotine delivery systems (e-
cigarettes) as the increasing price of tobacco may increase the relative affordability of such
products.
In relation to costs, price discounting was not included in calculations in the model. It
also did not assess the impact of increasing the duty escalator on revenue collection through
tax receipts. Indirect cost calculations only explored those resulting from indirect morbidity
and mortality and not the full range of harms of smoking to society, such as passive smoking,
domestic fires or litter.
19
281
282
283
284
285
286
287
288
289
290
291
292
293
294
295
296
297
298
299
300
301
302
303
304
305

To inform taxation policy, future research could: include a scenario analysis to
compensate for different levels of taxation mechanisms or a different time horizon for the
model; could calculate the revenue generated by increased tax; predict the negative
implications of impacts of decreasing tobacco taxation on health outcomes[72]; and
incorporating years of life saved through policy interventions. If conducted in countries
where a subsidised or nationalised health system (such as the NHS) is not accessible by all,
future research should consider the informal costs of treating a tobacco-related disease to the
individual and family. Finally, future work should ideally involve collaboration with policy-
makers, to help ensure that evidence can positively influence change to promote health
outcomes.
Figure legends:
Figure 1: Smoking prevalence by sex from 2015 to 2035 for baseline and TDE scenarios.
20
306
307
308
309
310
311
312
313
314
315
316
317
318
ACKNOWLEDGEMENTS
The research was commissioned by Cancer Research UK. The authors would like to
express gratitude to those organisations and individuals who supported this research, in
particular Anna Gilmore for providing invaluable support with industry pricing strategies and
Howard Reed for his welcome expertise on tobacco economic policy. The authors would also
like to thank Mark Sculpher, Gavin Roberts, and John Brazier for allowing us to make use of
their wider societal benefits approach to estimating indirect costs.
AUTHOR CONTRIBUTIONS
All authors were involved in the design of the study. AKT, AJ, LR and MB developed
the model methodology, including development of algorithms and model assumptions. AKT,
AB, AJ, LR and LW provided information on the study methodology, data inputs and carried
out the analysis of outputs, and DH wrote the introduction and discussion. AKT, DH, SH, LB
and LW have contributed to manuscript revisions.
COMPETING INTERESTS
AKT and AB worked at the UK Health Forum when this research was undertaken. No
other interests are declared.
21
319
320
321
322
323
324
325
326
327
328
329
330
331
332
333
334
335
336

REFERENCES
1. Banks E, Joshy G, Weber MF, et al. Tobacco smoking and all-cause mortality in a large
Australian cohort study: findings from a mature epidemic with current low smoking
prevalence. BMC Medicine 2015;13(1):1-10 doi: 10.1186/s12916-015-0281-
z[published Online First: 24 Feb 2015].
2. World Health Organization Regional Office for Europe. Health 2020 policy framework
and strategy. Malta, 2012.
http://www.euro.who.int/__data/assets/pdf_file/0020/170093/RC62wd08-Eng.pdf
(accessed Sept 2017).
3. Murray CJL, Richards MA, Newton JN, et al. UK health performance: findings of the
Global Burden of Disease Study 2010. Lancet 2013;381(9871):997-1020 doi:
10.1016/S0140-6736(13)60355-4[published Online First: 5 March 2013].
4. Mackenbach JP, Stirbu I, Roskam AJ, et al. Socioeconomic inequalities in health in 22
European countries. N Engl J Med 2008;358(23):2468-81 doi:
10.1056/NEJMsa0707519[published Online First: 5 June 2008].
5. Jha P, Peto R, Zatonski W, et al. Social inequalities in male mortality, and in male
mortality from smoking: indirect estimation from national death rates in England and
Wales, Poland, and North America. Lancet 2006;368(9533):367-70 doi:
10.1016/s0140-6736(06)68975-7[published Online First: 29 July 2006].
6. Chaloupka FJ, Yurekli A, Fong GT. Tobacco taxes as a tobacco control strategy. Tob
Control 2012;21(2):172-80 doi: 10.1136/tobaccocontrol-2011-050417[published
Online First: March 2012].
7. Azagba S, Burhoo P, Chaloupka FJ, et al. Effect of cigarette tax increase in combination
with mass media campaign on smoking behaviour in Mauritius: findings from the ITC
22
337
338
339
340
341
342
343
344
345
346
347
348
349
350
351
352
353
354
355
356
357
358
359
360
Mauritius Survey. Tob Control 2015;24 Suppl 3:iii71-iii75 doi:
10.1136/tobaccocontrol-2014-052096[published Online First: 20 Feb 2015].
8. Fishman PA, Ebel BE, Garrison MM, et al. Cigarette Tax Increase and Media Campaign.
Am J Prev Med;29(1):19-26 doi: 10.1016/j.amepre.2005.03.004[published Online
First: July 2005].
9. World Health Organization. Framework convention on tobacco control. Geneva, 2005.
http://apps.who.int/iris/bitstream/10665/42811/1/9241591013.pdf?ua=1 (accessed
Sept 2017).
10. Tabuchi T, Fujiwara T, Shinozaki T. Tobacco price increase and smoking behaviour
changes in various subgroups: a nationwide longitudinal 7-year follow-up study
among a middle-aged Japanese population. Tob Control 2016 doi:
10.1136/tobaccocontrol-2015-052804[published Online First: 14 December 2016].
11. Wakefield MA, Coomber K, Durkin SJ, et al. Time series analysis of the impact of
tobacco control policies on smoking prevalence among Australian adults, 2001-2011.
Bull World Health Organ 2014;92(6):413-22 doi: 10.2471/blt.13.118448[published
Online First: 18 March 2014].
12. Dunlop SM, Cotter TF, Perez DA. Impact of the 2010 tobacco tax increase in Australia
on short-term smoking cessation: a continuous tracking survey. Med J Aust
2011;195(8):469-72.
13. Guindon GE, Paraje GR, Chaloupka FJ. The impact of prices and taxes on the use of
tobacco products in Latin America and the Caribbean. Am J Public Health
2015;105(3):e9-19 doi: 10.2105/ajph.2014.302396[published Online First: 20 January
2015].
23
361
362
363
364
365
366
367
368
369
370
371
372
373
374
375
376
377
378
379
380
381
382
383

14. Thomas S, Fayter D, Misso K, et al. Population tobacco control interventions and their
effects on social inequalities in smoking: systematic review. Tob Control 2008;17 doi:
10.1136/tc.2007.023911[published Online First:21 April 2008].
15. Siahpush M, Wakefield MA, Spittal MJ, et al. Taxation reduces social disparities in adult
smoking prevalence. Am J Prev Med 2009;36(4):285-91 doi:
10.1016/j.amepre.2008.11.013[published Online First: 6 February 2009].
16. Hill S, Amos A, Clifford D, et al. Impact of tobacco control interventions on
socioeconomic inequalities in smoking: review of the evidence. Tob Control 2014;23
doi: 10.1136/tobaccocontrol-2013-051110[published Online First: 17 September
2017].
17. Main C, Thomas S, Ogilvie D, et al. Population tobacco control interventions and their
effects on social inequalities in smoking: placing an equity lens on existing systematic
reviews. BMC Public Health 2008;8:178 doi: 10.1186/1471-2458-8-178[published
Online First: 27 May 2008].
18. Ross H, Chaloupka FJ. Economic policies for tobacco control in developing countries.
Salud Publica Mex 2006;48 Suppl 1:S113-20.
19. Keller PA, Greenseid LO, Christenson M, et al. Seizing an opportunity: increasing use of
cessation services following a tobacco tax increase. BMC Public Health 2015;15:354
doi: 10.1186/s12889-015-1667-8
20. Grunseit AC, Ding D, Anderson C, et al. A profile of callers to the New South Wales
Quitline, Australia, 2008-2011. Nicotine Tob Res 2015;17(5):617-21 doi:
10.1093/ntr/ntu198[published Online First: 10 Apr 2015].
21. Goodchild M, Perucic AM, Nargis N. Modelling the impact of raising tobacco taxes on
public health and finance. Bull World Health Organ 2016;94(4):250-7 doi:
10.2471/blt.15.164707[published Online First: 1 April 2016].
24
384
385
386
387
388
389
390
391
392
393
394
395
396
397
398
399
400
401
402
403
404
405
406
407
408
22. Ross H, Stoklosa M, Krasovsky K. Economic and public health impact of 2007-2010
tobacco tax increases in Ukraine. Tob Control 2012;21(4):429-35 doi:
10.1136/tc.2010.040071[published Online First: July 2012].
23. Hu TW, Mao Z, Shi J, et al. The role of taxation in tobacco control and its potential
economic impact in China. Tob Control 2010;19(1):58-64 doi:
10.1136/tc.2009.031799[published Online First: February 2010].
24. Shang C, Chaloupka FJ, Fong GT, et al. The association between tax structure and
cigarette price variability: findings from the ITC Project. Tob Control 2015;24(Suppl
3):iii88-iii93 doi: 10.1136/tobaccocontrol-2014-051771[published Online First: July
2015].
25. Kostova D, Husain MJ, Chaloupka FJ. Effect of cigarette prices on smoking initiation and
cessation in China: a duration analysis. Tob Control 2016 doi:
10.1136/tobaccocontrol-2016-053338[published Online First: 16 September 2016].
26. Smith KE, Savell E, Gilmore AB. What is known about tobacco industry efforts to
influence tobacco tax? A systematic review of empirical studies. Tob Control
2013;22(2):144-53 doi: 10.1136/tobaccocontrol-2011-050098[published Online First:
March 2013].
27. Balwicki L, Stoklosa M, Balwicka-Szczyrba M, et al. Tobacco industry interference with
tobacco control policies in Poland: legal aspects and industry practices. Tob Control
2016;25(5):521-6 doi: 10.1136/tobaccocontrol-2015-052582[published Online First:
September 2016].
28. Krasovsky KS. "The lobbying strategy is to keep excise as low as possible" - tobacco
industry excise taxation policy in Ukraine. Tob Induc Dis 2010;8:10 doi:
10.1186/1617-9625-8-10[published Online First: 31 August 2010].
25
409
410
411
412
413
414
415
416
417
418
419
420
421
422
423
424
425
426
427
428
429
430
431
432

29. Shirane R, Smith K, Ross H, et al. Tobacco industry manipulation of tobacco excise and
tobacco advertising policies in the Czech Republic: an analysis of tobacco industry
documents. PLoS medicine 2012;9(6):e1001248 doi:
10.1371/journal.pmed.1001248[published Online First: 26 June 2016].
30. Skafida V, Silver KE, Rechel BP, et al. Change in tobacco excise policy in Bulgaria: the
role of tobacco industry lobbying and smuggling. Tob Control 2014;23(e1):e75-84
doi: 10.1136/tobaccocontrol-2012-050600[published Online First: 10 November
2012].
31. Eurostat. Comparative price levels for food, beverages and tobacco. Secondary
Comparative price levels for food, beverages and tobacco 2016.
http://ec.europa.eu/eurostat/statistics-explained/index.php/Comparative_price_levels_
for_food,_beverages_and_tobacco#Food.2C_beverages_and_tobacco (accessed Sept
2017).
32. HM Treasury. Tax on shopping and services. Secondary Tax on shopping and services
2016. https://www.gov.uk/tax-on-shopping/vat-duties (accessed Sept 2017).
33. HM Treasury. Closed consultation: minimum excise tax. Secondary Closed consultation:
minimum excise tax. 2014. https://www.gov.uk/government/consultations/minimum-
excise-tax/minimum-excise-tax (accessed Sept 2017).
34. HM Treasury. Budget Secondary Budget 2016.
https://www.gov.uk/government/publications/budget-2016-documents (accessed Sept
2017).
35. Blecher E. Targeting the affordability of cigarettes: a new benchmark for taxation policy
in low-income and-middle-income countries. Tob Control 2010.
36. Chambers J, Killoran A, McNeill A, et al. Smoking. BMJ (Clinical research ed)
1991;303(6808):973-7.
26
433
434
435
436
437
438
439
440
441
442
443
444
445
446
447
448
449
450
451
452
453
454
455
456
457

37. Avila-Tang E, Apelberg BJ, Yamaguchi N, et al. Modelling the health benefits of
smoking cessation in Japan. Tob Control 2009;18(1):10-7 doi:
10.1136/tc.2007.024620[published Online First: 4 October 2011].
38. Basu S, Stuckler D, Bitton A, et al. Projected effects of tobacco smoking on worldwide
tuberculosis control: mathematical modelling analysis. BMJ (Clinical research ed)
2011;343:d5506 doi: 10.1136/bmj.d5506[published Online First: 4 October 2011].
39. Cadilhac DA, Magnus A, Sheppard L, et al. The societal benefits of reducing six
behavioural risk factors: an economic modelling study from Australia. BMC Public
Health 2011;11:483 doi: 10.1186/1471-2458-11-483[published Online First: 21 June
2011].
40. Callum C, Boyle S, Sandford A. Estimating the cost of smoking to the NHS in England
and the impact of declining prevalence. Health Econ Policy Law 2011;6(4):489-508
doi: 10.1017/s1744133110000241[published Online First: 25 August 2010].
41. Cobiac LJI, Tak; Nghiem, Nhung; Blakely, Tony; Wilson, Nick. Modelling the
implications of regular increases in tobacco taxation in the tobacco endgame. Tob
Control 2014;0:1-7.
42. Naidoo B, Stevens W, McPherson K. Modelling the short term consequences of smoking
cessation in England on the hospitalisation rates for acute myocardial infarction and
stroke. Tob Control 2000;9(4):397-400 doi: 10.1136/tc.9.4.397[published Online
First: Devember 2000].
43. Allen K, Kypridemos C, Hyseni L, et al. The effects of maximising the UK's tobacco
control score on inequalities in smoking prevalence and premature coronary heart
disease mortality: a modelling study. BMC Public Health 2016;16:292 doi:
10.1186/s12889-016-2962-8[published Online First: 1 April 2016].
27
458
459
460
461
462
463
464
465
466
467
468
469
470
471
472
473
474
475
476
477
478
479
480
481
44. Hunt D, Knuchel-Takano A, Jaccard A, et al. Modelling the implications of reducing
smoking prevalence: the public health and economic benefits of achieving a ‘tobacco-
free’UK. Tob Control 2017 [published Online: 11 May 2017] doi:tobaccocontrol-
2016-053507
45. Blakely T, Cobiac LJ, Cleghorn CL, et al. Health, Health Inequality, and Cost Impacts of
Annual Increases in Tobacco Tax: Multistate Life Table Modeling in New Zealand.
PLoS medicine 2015;12(7):e1001856 doi: 10.1371/journal.pmed.1001856[published
Online First: 22 December 2016].
46. van der Deen FS, Wilson N, Blakely T. A continuation of 10% annual tobacco tax
increases until 2020: Modelling results for smoking prevalence by sex and ethnicity.
N Z Med J 2016;129(1441):94-7.
47. Grace RC, Kivell BM, Laugesen M. Predicting decreases in smoking with a cigarette
purchase task: evidence from an excise tax rise in New Zealand. Tob Control
2015;24(6):582-7 doi: 10.1136/tobaccocontrol-2014-051594[published Online First:
November 2015].
48. Salti N, Chaaban J, Nakkash R, et al. The effect of taxation on tobacco consumption and
public revenues in Lebanon. Tob Control 2015;24(1):77-81 doi:
10.1136/tobaccocontrol-2012-050703[published Online First: January 2015].
49. Alpert HR, Vardavas CI, Chaloupka FJ, et al. The recent and projected public health and
economic benefits of cigarette taxation in Greece. Tob Control 2014;23(5):452-4 doi:
10.1136/tobaccocontrol-2012-050857[published Online First: 6 March 2013].
50. ASH. Smoking still kills: Protecting children, reducing inequalities. In: Health AoSa, ed.,
2015.
28
482
483
484
485
486
487
488
489
490
491
492
493
494
495
496
497
498
499
500
501
502
503
504
51. NHS England. NHS Programme Budget costs 2013/14, 2012/13.
https://www.england.nhs.uk/resources/resources-for-ccgs/prog-budgeting/ (accessed
Sept 2017).
52. HMRC. Tax and Duty Bulletins. 2015.
https://www.uktradeinfo.com/Statistics/Pages/TaxAndDutybulletins.aspx (accessed
Sept 2017).
53. UK Trade Info. Tobacco Factsheet 2013.
https://www.uktradeinfo.com/Statistics/Statistical%20Factsheets/Tobacco_Factsheet_
2013.xls (accessed Sept 2017).
54. Townsend J. Price and consumption of tobacco. Br Med Bull 1996;52(1):132-42.
55. Cogliano VJ, Baan R, Straif K, et al. Preventable Exposures Associated With Human
Cancers. J Natl Cancer Inst 2011;103(24):1827-39 doi: 10.1093/jnci/djr483[published
Online First: 21 December 2011].
56. HMRC and Border Force. Tackling illicit tobacco: from leaf to light. The HMRC and
Border Force strategy to tackle tobacco smuggling. 2015.
57. Claxton K, Martin S, Soares M, et al. Methods for the estimation of the National Institute
for Health and Care Excellence cost-effectiveness threshold. Health Technol Assess
2015;19(14):1-503, v-vi doi: 10.3310/hta19140[published Online First: February
2015].
58. Rowell A, Evans-Reeves K, Gilmore AB. Tobacco industry manipulation of data on and
press coverage of the illicit tobacco trade in the UK. Tob Control 2014;23(e1):e35-43
doi: 10.1136/tobaccocontrol-2013-051397[published Online First: May 2014].
59. HMRC and UK Border Agency. Tackling Tobacco Smuggling – building on our success.
A renewed strategy for HM Revenue and Customs and the UK Border Agency. 2011.
29
505
506
507
508
509
510
511
512
513
514
515
516
517
518
519
520
521
522
523
524
525
526
527
528

60. Joossens L, Lugo A, La Vecchia C, et al. Illicit cigarettes and hand-rolled tobacco in 18
European countries: a cross-sectional survey. Tob Control 2014;23(e1):e17-23 doi:
10.1136/tobaccocontrol-2012-050644
61. HMRC. Business tax - policy paper: Hand-rolling tobacco duty rate. 2016.
https://www.gov.uk/government/publications/hand-rolling-tobacco-duty-rate/hand-
rolling-tobacco-duty-rate (accessed Sept 2017).
62. West R. Smoking in England 2007-2014: Slide 13. 2015.
http://www.smokinginengland.info/latest-statistics/ STS150825 (accessed Sept
2017).
63. Anna B. Gilmore BT, Gordon Taylor, Howard Reed. Understanding tobacco industry
pricing strategy and whether it undermines tobacco tax policy: the example of the UK
cigarette market. Addiction 2012;108(7):1317-26 doi: 10.1111/add.12159 [published
online first: April 2013].
64. Brock B, Choi K, Boyle RG, et al. Tobacco product prices before and after a statewide
tobacco tax increase. Tob Control 2016;25(2):166-73 doi: 10.1136/tobaccocontrol-
2014-052018 [published Online First: March 2016].
65. Marsh L, Cameron C, Quigg R, et al. The impact of an increase in excise tax on the retail
price of tobacco in New Zealand. Tob Control 2016;25(4):458-63 doi:
10.1136/tobaccocontrol-2015-052259[published Online First: July 2016].
66. Jillian Oderkirk FS, Michele Cecchini and Roberto Astolfi, OECD Health Division.
Toward a New Comprehensive International Health and Health Care Policy Decision
Support Tool: OECD Directorate for Employment, Labour and Social Affairs, 2012.
67. Webber L, Divajeva D, Marsh T, et al. The future burden of obesity-related diseases in
the 53 WHO European-Region countries and the impact of effective interventions: a
30
529
530
531
532
533
534
535
536
537
538
539
540
541
542
543
544
545
546
547
548
549
550
551
552

modelling study. BMJ Open 2014;4(7) doi: 10.1136/bmjopen-2014-004787[published
Online First: 25 July 2014].
68. Webber L, Kilpi F, Marsh T, et al. High rates of obesity and non-communicable diseases
predicted across Latin America. PloS One 2012;7(8):e39589-e89 doi:
10.1371/journal.pone.0039589[published Online First: 13 August 2012].
69. Webber L, Kilpi F, Marsh T, et al. Modelling obesity trends and related diseases in
Eastern Europe. Obes Rev 2012:744-51. [published Online First:9 May 2012].
70. McPherson K, Marsh T, Brown M. Foresight tackling obesities: Future choices –
modelling future trends in obesity and the impact on health. Foresight Tackling
Obesities Future Choices, 2007.
https://www.gov.uk/government/uploads/system/uploads/attachment_data/file/
295149/07-1662-obesity-modelling-trends.pdf (accessed Sept 2017).
71. Wang YC, McPherson K, Marsh T, et al. Health and economic burden of the projected
obesity trends in the USA and the UK. Lancet 2011;378(9793):815-25 doi:
10.1016/s0140-6736(11)60814-3 [published Online First: 27 August 2011].
72. Hamilton VH, Levinton C, St-Pierre Y, et al. The effect of tobacco tax cuts on cigarette
smoking in Canada. CMAJ 1997;156(2):187-91.
31
553
554
555
556
557
558
559
560
561
562
563
564
565
566
567
568
569