investigating the twitter behavior of tax experts networks
TRANSCRIPT

Investigating the Twitter Behavior of Tax Experts Networks in Social Network SitesAuthors: Regina Ruane & TL HillPresenter: Regina RuanePresenter’s email: [email protected]

Presenter Biosketch
Regina Ruane is an assistant professor of research in the Department of StatisticalScience and executive director of Temple University’s Data Science Institute. Ruanealso directs pedagogical research with the Fox Translational Research Center (TRC).
Ruane joined the Department of Statistical Science after having been a researchfellow for Harvard University and Temple’s Data Science Institute, where sheconducted research in data science and digital analytics with a focus on networks,information systems and statistics.
Prior to her work at the Fox School, Ruane founded and directed the First-YearExploratory Studies program at Drexel University, which became the fastest-growingprogram at the university with a 900 % enrollment increase within the first two years ofoffering. Additionally, she has been a strong leader, conducting visionary strategicplanning, innovative program development, and relationship and partnershipdevelopment.
Her work has appeared in journals across Information Systems and Education,including Communications of the Association for Information Systems and OnlineLearning, where she received the Best Paper Award.
Ruane earned her PhD from Drexel University, her MA from Columbia University and aBA from Villanova University.
Overview
With the pervasiveness of social network sites, determining andquantifying how content develops on these platforms andsubsequently impacts or affects other areas is becomingincreasingly important.
In this paper, we adopt a network analysis method that enables theestimation of the coevolution of the users’ social network structure.
Specifically, we offer a method to analyze social media data, typicallyrecorded in social media ecosystems, in the presence of networkeffects.
The proposed method can help disentangle network effects of interestfrom feedback effects on the network.

Introduction
Social network sites (SNS) provide a unique value with the engaginginteractions they offer between the two possible roles of users, i.e.“content producers” and “content consumers”.
Content producers actively post, comment, and share content withtheir friends and content consumers view and react to theinformation posted by content producers.
Content producers add considerable value by generating andsharing content through the network .
SNS user behavior is influenced in part by individual-level factors,such as demographics, traits, among others and partially by onlinesocial network dynamics, such as the extent of network clustering,network betweenness, and other social network factors.

Introduction
Earlier studies have demonstrated that networks form withadvantages constituted from social capital.
Previous research has also shown that people cluster into groups asa result of interaction opportunities defined by the places wherepeople meet [21].
Other studies have postulated that communication is more frequentand influential within than between groups as people in the samegroup develop similar views, demonstrating the influences ofhomophily and social influence [14].
Education, occupation, and occupational prestige have beenshown to have strong levels of effect on homophily in networkstudies [14].

Introduction
Future research surrounding expanded consideration of multiplexityof both networks and foci and the need for dynamic data onchanges over time in networks are necessary to determine:
the ways in which networks evolve over time through cumulativeprocesses of tie creation and
dissolution as they are embedded in a changing community ofmultiplex relations spawned by multiple organizational [14].

Introduction
To address this gap, we have made the following inferences aboutthe nature and extent of peer influence &
homophilous peer selection in content production in taxconversations on the SNS of Twitter.
1. we provide evidence for homophily based on similarity in the individual-level covariate of organization affiliation
2. we report the existence of peer influence,
1. finding different stages of friendship formation among independent andorganizational-related users.
2. Individuals befriend others who are similar in content production behavior
3. we provide evidence that the strength of social influence varies as afunction of the specific level of the behavior.

LITERATURE REVIEW
SNSs provide a unique value with the engaging interactions they offerbetween the two possible roles of users, i.e. “content producers” and“content consumers”.
Content producers actively post, comment, and share content withtheir friends
add considerable value by generating and sharing content through thenetwork
Content consumers view and react to the information posted bycontent producers.
SNS user behavior is influenced in part by individual-level factors, suchas demographics, traits,
& by online social network dynamics, such as the extent of networkclustering, network betweenness, and other social network factors.

LITERATURE REVIEW
Other studies have postulated that communication is more frequentand influential within than between groups as people in the samegroup develop similar views,
demonstrating the influences of homophily and social influence
Education, occupation, and occupational prestige have beenshown to have strong levels of effect on homophily in networkstudies [14].
Future research surrounding expanded consideration of multiplexityof both networks and foci are necessary to determine
the ways in which networks evolve over time through cumulativeprocesses of tie creation and dissolution as they are embedded in achanging community

Research
To address this gap, we have made the following inferences about thenature and extent of peer influence as well as homophilous peerselection in content production in tax conversations on the SNS ofTwitter.
1. providing evidence for homophily based on similarity in the individual-levelcovariate of organization affiliation.
2. reporting the existence of peer influence, finding different stages offriendship formation among independent and organizational-related users.Individuals befriend others who are similar in content production behavior.
3. providing evidence that the strength of social influence varies as a functionof the specific level of the behavior
4. We show that low content posters are more susceptible than heavycontent posters to have higher network measures, e.g indegree andoutdegree centrality.

Research
The findings are robust to the presence of significant differences inunderstanding the tax-related conversations due to the significantlevels of separate clusters.
While there are levels of understanding occurring between people,the levels in separate clusters are much greater.
These findings indicate high levels of nonredundant information thatare more additive to the conversations and advancement ofdiscussion.

Method
For this analysis, we collected 60,000 tweets sent between 1 Januaryand 31 October 2020 by United States tax policy actors.
The data collected included Twitter handles (names), hashtags,mentions, text, and time sent.
Such data is useful because it reveals the actual content andsharing patterns of user-generated content, not individuals’ self-reported perceptions and intentions.

Data
The data were scraped from the Twitter API
the collection process was seeded by a list of key tax policy actorsidentified by tax policy and social media experts.
The resulting dataset is the population of tweets, not a sample, and
fits the theoretical and methodological assumptions of networkanalysis.

Method
The method employed in this study has the following components:
i. construction of a sample of tax-related Twitter data from Twitter’spublic data API
ii. organization, analysis, and interpretation of the network clusters.
iii. The resulting data contains metadata for the tax-relateddiscussions from the aggregate activity on Twitter.

Network Analysis
The network analysis of Twitter that we conducted is based on thestructure induced by the communications surrounding tax.
The communications surrounding tax were determined by directedlinks between Twitter users,
i.e., a user has a (directed) edge to another user for each directedcommunication the user sends or receives.
With the extremely large dataset and the large number of edgesthe interactions of the users produced, the sociogramdemonstrated large amounts of activity.

The Tax Network
To examine connectivity of users, we used a threshold of a minimumof two or more direct communications and
filtered the network eliminating connections stemming from onlyone direct communication.
As part of the analysis, we examined the Twitter handles that wereconnected based on directed communications.
determined the level of closeness, i.e. whether handles were in thesame organization or not.
looked at the volume and type of communication among the twitterhandles and retweets.
investigated the betweenness centrality measure and the influentialaspects

The Tax Network
Figure 1 shows the filtered network. This allowed us to keep thenetwork within a size that we could process.

Clustering
To visualize the clusters of the Twitter network, we used R to representthe users and their directed interactions in sociogram form.
We added attribute data regarding organization affiliation for users.
User organization affiliation is denoted by color in the sociograms.
The organization affiliation distinctions allowed us to determine the tweetclustering for users and the larger signification(s) for the network.
The unconnected nodes denote users who did not have any directedcommunications (tweets) with other users.
These users may have tweeted broadcast messages to others or may havehad one directed communication with other users.

Clustering
Using the edge betweenness clustering algorithm in igraph, weperformed a clustering detection for the filtered tax network.
The edge betweenness clustering algorithm calculates the edgebetweenness of the graph,
removes the edge with the highest edge betweenness score,
then recalculates edge betweenness of the edges and
again removes the one with the highest score.
The algorithm performs a hierarchical clustering in which a node is assignedto a cluster if doing so maximizes the modularity of the network, continuinguntil either a single node remains or modularity cannot be increased further

Social Network Analysis
The social network analysis includes the creation of sociograms toview the network from a macro perspective, clustering andbetweenness centrality measures.
Typically, in social network analysis, the structure of a network isdefined as G=(N, Y),
in which N is a set of nodes that represent individual entities, and Y is aset of edges that represent the connectivity pattern among the nodes.
The social network analysis results show the coevolution of networkstructure and user behavior in online social networks.
We show that user-specific factors, like organizational affiliation, playcrucial roles in shaping users’ varying reactions to the policychange.

Social Network Analysis
The network analysis provides understanding of the nature of peereffects on social network evolution on social network platforms andhas clear practical implications.
1. we offer a framework within which online user contributions can bestudied to identify a larger and more involved network.
2. our results provide intelligence to identify and better targetpowerful and well-connected users on social network platforms.
3. our analysis offers insights into posting behaviors on these platforms,especially with the inclusion of attribute data that allows for theincorporation of larger network patterns,
such that managers and researchers can effectively determinestructural patterns and forecast the diffusion of this content throughsocial networks.
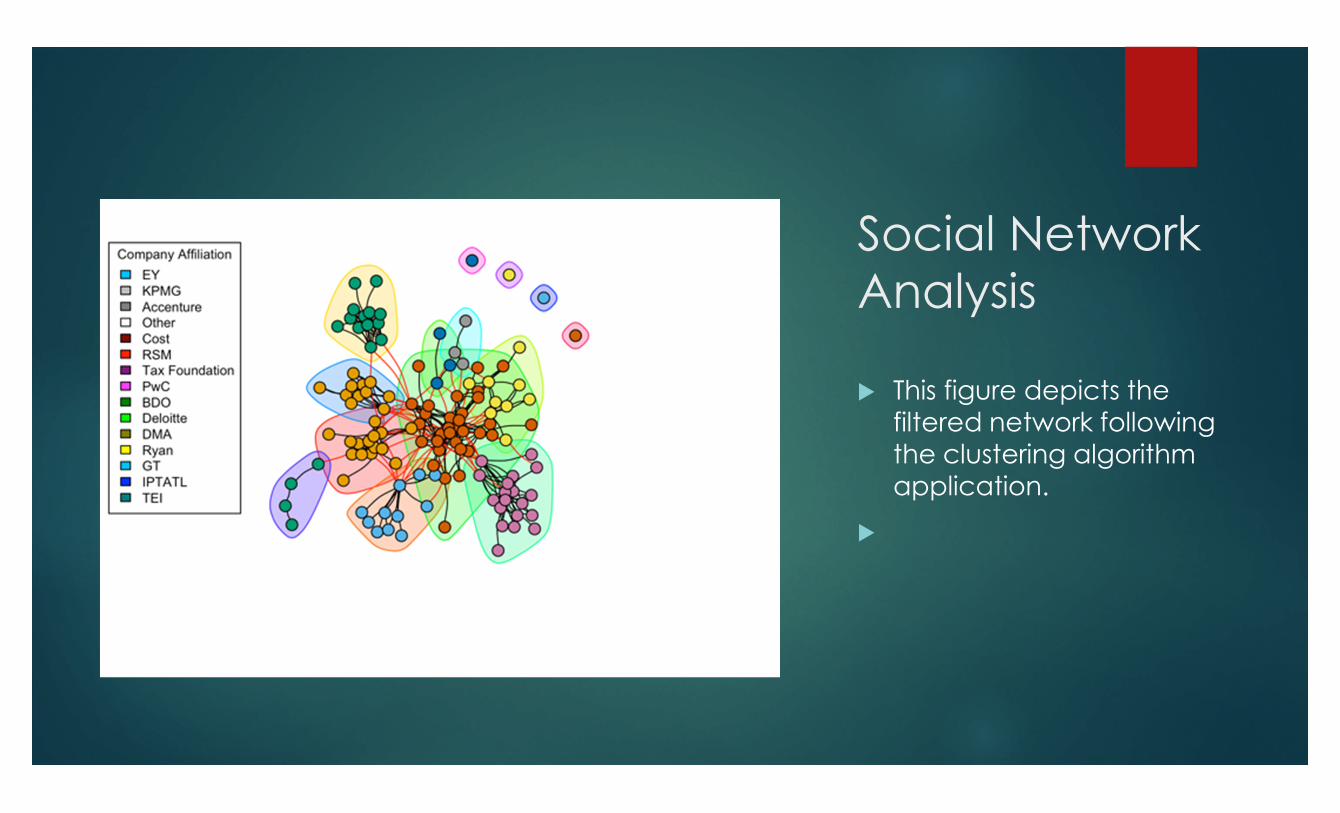
Social NetworkAnalysis
This figure depicts thefiltered network followingthe clustering algorithmapplication.

Social Network Analysis
Fig. 3 demonstrates a very high-level feel for the directionality ofthe tweets.
This network is a highly clustered,ordered network.
The cumulative arrows in gray
The Diffusion/flow implicationsshow that the central core bothreceives and is thereby thoughtof as powerful, demonstratinginfluence through outwardcommunications the manyactors outside of the centralcore.

Social Network Analysis
The measures listed are all positive andstatistically significant.
The mean indicates that the actors inaverage score are equal in terms ofprominence and influence.
The maximum scores indicate thatinfluence is a much more significantaspect of this network thanprominence with such a sharpdifference in the range of maximumscores.
The minimum scores indicate inactivitylevels among users in terms of directcommunications in this network.
The outdegree activity to other actorsdenotes the pushing out of informationabout tax policy to others across theentire network (not just the core).
INDEGREE
OUTDEGREE BETWEENNESS CLUSTERING
Min 0.0 0.0 0.00 0.00
25% 1.0 0.0 0.00 0.17
Median 1.0 0.0 0.00 1.00
Mean 1.5 1.5 17484.96 0.63
75% 1.0 0.0 0.00 1.00
Max 38.0 1079.0 11215427.66 1.00

Conclusion
Understanding the nature of network evolution on SNSs has clearand practical implications for social scientists, social mediaplatforms, and their users.
We offer a framework within which online user contributions can bestudied as a function of the underlying network.
Our analysis has shown that Twitter has a strongly-connected taxnetwork which is nonetheless differentiated through users’organizational affiliations and by directed communications by users.
Our analyses demonstrated the clusters that emerged through thedirected exchanges among users.
We observed that the clusters mostly developed based onorganizational affiliations, but that some users exchanged

Conclusion
This research represents the foundation for future social mediarelated applications targeting a multitude of possible applicationswith specialized foci, such as cryptocurrency and economic issues.
The large dataset of 60,000 tweets indicates the tax-related tweetscomprise substantial activity from more than a hundred users, manyof whom have reputable organizational affiliations in the tax sector.
Our network of Twitter users, though large, is only a partial depictionof the tax-related Twitter discussion and its evolution.
The majority of the Twitter data that we scraped and analyzed wasduring the COVID-19 pandemic.

Future Research
Further research could study a longer time period to extend ourwork and determine the patterns and network structure of tax-related discussion on Twitter.
As a network study of Twitter data, there are larger factors that mayhave influenced the twitter discussions, e.g. the Americanpresidential election results, among others.
Future research could explore these influences

Conclusion
This study serves to illustrate the network structure and patterns thatemerge from tax-related discussions in a social media platform.
As an initial attempt to model and analyze the coevolution ofnetwork structure and user behavior in the online social network,Twitter, this study is offers opportunities for future research.
This paper focuses on providing a sound method to uncover thedynamic nature of tax-related discussions in a social network.
Additional analyses are required to further separate the specificrationale behind why individuals show the observed clusteringeffects.