investigation of site characterization in the akdeniz ... file93 kurtulus,¸ c. et al. /...
TRANSCRIPT

International Journal of Applied and Physical Sciencesvolume 4 issue 3 pp. 92-102 doi: https://dx.doi.org/10.20469/ijaps.4.50003-3
Investigation of Site Characterization in the Akdeniz Region by UsingSeismic Refraction and Surface Wave Methods
Cengiz Kurtulus∗Department of Geophysics,
Kocaeli University, Kocaeli, Turkey
Fadime SertçelikDepartment of Geophysics,
Kocaeli University, Kocaeli, Turkey
Hamdullah LivaogluDepartment of Geophysics,
Kocaeli University, Kocaeli, Turkey
Ibrahim SertçelikDepartment of Geophysics,
Kocaeli University, Kocaeli, Turkey
Sena IblikçiDepartment of Geophysics,
Kocaeli University, Kocaeli, Turkey
Abstract: Multichannel Analysis of Surface Waves (MASW), Refraction Microtremor (ReMi) and Microtremor mea-surements was performed to predict site characterization at 65 strong motion stations of AFAD (Disaster and Emer-gency Management Presidency) in Akdeniz region in Turkey. Reliable field response information is required to in-vestigate the impacts of the region and to assess the risk of the area. The soil conditions of the Akdeniz region arespecified from MASW, ReMi and Microtremor studies of AFAD’s strong motion stations in this area. HVSR tech-nique was conducted to determine dominant frequency values at different amplification levels. The Akdeniz regionwas classified according to Vs30 based NEHRP Provisions [1], Eurocode-8 [2] and TBDY-2018 [3] and Rodrigez-Marek [4]. According to the [1], one station is classified as class A, 7 stations as B and 38 stations as C and 19 stationsto be class D. According to [2], 6 stations correspond to class A, 39 stations B, and 20 stations D. The soil classes inthe NEHRP system correspond to that of TBDY-2018 [3]. According to [4], 8 stations are classified as A, 17 stationsB, 8 stations C-1, 13 stations C-2, 5 stations C-3,11 stations D-1, 1station D-2, 1 station D-3, 1 station E and 1 stationis undistinguished. The predominant period of the region ranges from 0.07 to 1.47s, and the dominant magnificationvalues vary between 0.79 and 8.5.
Keywords: MASW, ReMi, microtremor measurements, Akdeniz region, Turkey
Received: 17 July 2018; Accepted: 18 September 2018; Published: 14 November 2018
I. INTRODUCTIONThe Akdeniz (Mediterranean) region is located in a
seismically active region in the southern part of Turkey.It constitutes about 15% of the total area of Turkey witha surface area of approximately 120,000 km2. The tec-tonic activity of the region shows a complex tectonic be-havior under the influence of the faults of the Dead Sea,Eastern Anatolia and Cyprus [5]. In the last century (BC
37-2015), the ten largest destructive earthquakes in thisarea have shown that local site conditions have a majorimpact on the ground shaking. It has been reported thatthe tsunamis occurring in 1822 and 1872 earthquakes inHatay lead to the death of 20 thousand people [6]. Mi-crotremor survey of the various regions in Turkey, earth-quake monitoring, a surface wave of research and severalfield effect study about the drilling data have been con-
∗Correspondence concerning this article should be addressed to Cengiz Kurtulus, Department of Geophysics, Kocaeli University, Kocaeli,Turkey. E-mail: [email protected]⃝ 2018 The Author(s). Published by KKG Publications. This is an Open Access article distributed under a Creative Commons Attribution-
NonCommercial-NoDerivatives 4.0 International License.

93 Kurtulus, C. et al. / International Journal of Applied and Physical Sciences 4(3) 2018
ducted [7, 8, 9, 10, 11, 12, 13, 14, 15, 16, 17, 18, 19, 20,21, 22, 23]. [13] have used (H/V) spectral ratios to pre-dict the strong motion site condition of Turkey. [15] and[24] applied geophysical and geotechnical studies in or-der to determine the field classification of Turkish strongmovement areas. [25] analyzed the microtremor datafor Antakya and suggested the initial micro-zonationmap proposed for Antakya province based on the domi-nant periods ranging from 0.2 to 0.8 sec and the shearwave velocities of the sediments covering the region.[26] examined the relationship between ground condi-tions and earthquake effect in Antakya. [27] investi-gated the seismicity of the region between Adana and
Antakya-Kahramanmaras with b and risk analysis. [28]attempted to investigate the local site effects of MATNet,which consists of 55 uniaxial force balance accelerom-eters, and tried to record explosions that could be es-tablished near Hatay-K.Maras sites and evaluate themas part of an early warning and pre-damage estimatesystem. [29, 30] conducted microtremor array researchon shallow S wavelength velocity profiles in 41 sites inthe Akdeniz region. In this study, seismic refraction,MASW, refraction microtremor (ReMi) and microtremorstudies were carried out to investigate the distribution ofS-wave velocity in shallow soils at 65 strong motion sta-tions in Akdeniz region (Figure 1).
Fig. 1. Location of the study area. Triangles indicate the measuring stations
II. GEOLOGY AND TECTONICS OF THEREGION
The Miocene aged Netritic limestones are generallyfound in the Hatay region. Miocene aged carbonateand clastics are formed in the east of the region. Or-dovician aged carbonates, Jura Neritic limestone, low-middle Cambrian quartz, Quaternary limestone are lo-cated in the central coastal areas. The Amanos Moun-tains and the Kzldag ophiolite massif at the south endof the Eastern Taurus Mountains also have an importantplace in the geology of the region (Figure 2). Pleis-tocene undifferentiated clastic are generally located in
Adana and Hatay regions. Most of the mountains inthe Mediterranean region constitute the western and cen-tral Taurus. Amanos Mountains and Samandag areamong the important mountains in the east of the region.The Mediterranean region and its surrounding seismicitywere formed as a result of the African and Arabian platesmoving northwardly according to Eurasia. The Africanplate has been moving northward at about 10 mm peryear in relation to Eurasia [31, 32]. Deep structures inthe region, generally E-W-oriented slope-displacementnormal faults, north-south-oriented strike-slip faulting,and west of the study area again consists of graben-horstblock systems developing this tectonic result.

Kurtulus, C. et al. / International Journal of Applied and Physical Sciences 4(3) 2018 94
Fig. 2. Geological map of Akdeniz region
III. DATA ACQUISITION AND ANALYSISSeismic refraction, MASW, REMI, and microtremor
data were collected at AFAD’s 65 strong motion stationsin Akdeniz region, southern Turkey.
Seismic refraction data were recorded for 2 sec witha sampling rate of 1 msec using a 50kg weight dropperenergy source 48 4.5 Hz P-wave geophones were fixedat 2m geophone intervals in line (Figure 3).
Fig. 3. Schematic of MASW data acquisition with a 48-channel linear receiving array
The shot records at each side were used in the anal-ysis of the surface waves (MASW) to estimate the Vs30profiles of the topmost 30m. The shot records were in-sulated from the refracted and reflected waves by mut-ing at first and afterward. It was filtered 2-4, 36-48 Hz
band-pass filter to remove low and high frequency noise(Figure 5(a). Later, plane wave decomposition was ap-plied to transform the data from offset time to phase thevelocity-against frequency domain [33, 34].

95 Kurtulus, C. et al. / International Journal of Applied and Physical Sciences 4(3) 2018
The dispersive curve of the fundamental mode of sur-face waves are picked from this domain. S-wave veloc-ity as a function of depth was determined to invert the
dispersion curve. For the fundamental mode, the disper-sion curve representing the variation of the phase veloc-ity with respect to frequency is determined as shown.
Fig. 4. (a) Seismic refraction records with picked firstarrival times showing in redline collected at the station no:0117 (b) traveltime curves of mid-point shot, (c) P-wave velocity-depth model
This dispersion curve was used to determine the S-wave velocity-depth profile of the stationary zone and theS-wave velocity-depth profile by the inversion method
(Figure 5(b).The dispersion curve showing the variationof the frequency and phase velocity for the basic mode isshown in Figure 5(c).
Fig. 5. (a) the shot record separated from the refraction and reflected waves at 0117 coded stations, (b) MASW dispersionspectrum of the surface waves. The MASW S-wave-depth profile (blue) and the modeled dispersion curve (black), (c) Vs-depthprofile and modeled dispersion curve.

Kurtulus, C. et al. / International Journal of Applied and Physical Sciences 4(3) 2018 96
The ReMi data were recorded as 32 seconds witha sampling rate of 2 sec with the same field pattern asthe seismic source, usually using ambient noise from thewind and traffic. 24-25 records are stacked in each ReMiinstallation. Rayleigh waves are distinguished fromother waves using two-dimensional slowness frequen-cies (p-f) transforms of noise recordings in both direc-tions. The Rayleigh wave dispersion is selected along theminimum velocity envelope of the energy in the slow-ness frequency spectral image. These Rayleigh wave dis-
persion curves are modeled by using the velocity-depthmodel to determine the shear wave velocity depth pro-file. The time-distance data are shown in Figure 6(a).The dispersive curve of the basic mode of surface wavesis taken from this domain. S-wave velocity as a functionof depth was determined inverting the dispersion curve(Figure 6(b)).This dispersion curve was used to deter-mine the S-wave velocity-depth profile of the stationaryzone by the inversion method Figure 6(c).
Fig. 6. (a) ReMi data at 0117 coded station, (b) the dispersion spectrum calculated by separating the plane-wave components ofthe surface waves present in the seismic record, (c) S-wave velocity-depth profile (blue) and modeled dispersion curve (black).The vertical axis indicates the S-wave velocity and the horizontal axis shows the frequency of the dispersion curve.
Fig. 7. a) Filtered time signal series, b) The amplitude spectra of the three components microtremor data the peak and (c) theH/V amplitude spectrums. The dashed lines show the standard deviation of amplitude and the two vertical gray areas indicate thepeak frequency standard deviation domains.

97 Kurtulus, C. et al. / International Journal of Applied and Physical Sciences 4(3) 2018
The velocity-based broadband sensor (0.03-50 Hzstraight response) was used for ambition noise record-ing. Whole data were recorded with the same sensorFigure 7(a) and Figure 7(b). The H/V amplitude spec-trum of the dominant frequency and the amplification ofthe 0117 coded stations is shown in Figure 7(c). As de-picted in Figure 7, the microtremor dominant period is0.80 seconds with 1.125 Hz frequency, and H/V peakamplitude values were 3.6. The predominant period of
the region ranges from 0.07 to 1.47s and the dominantmagnification values vary between 0.79 and 8.5.
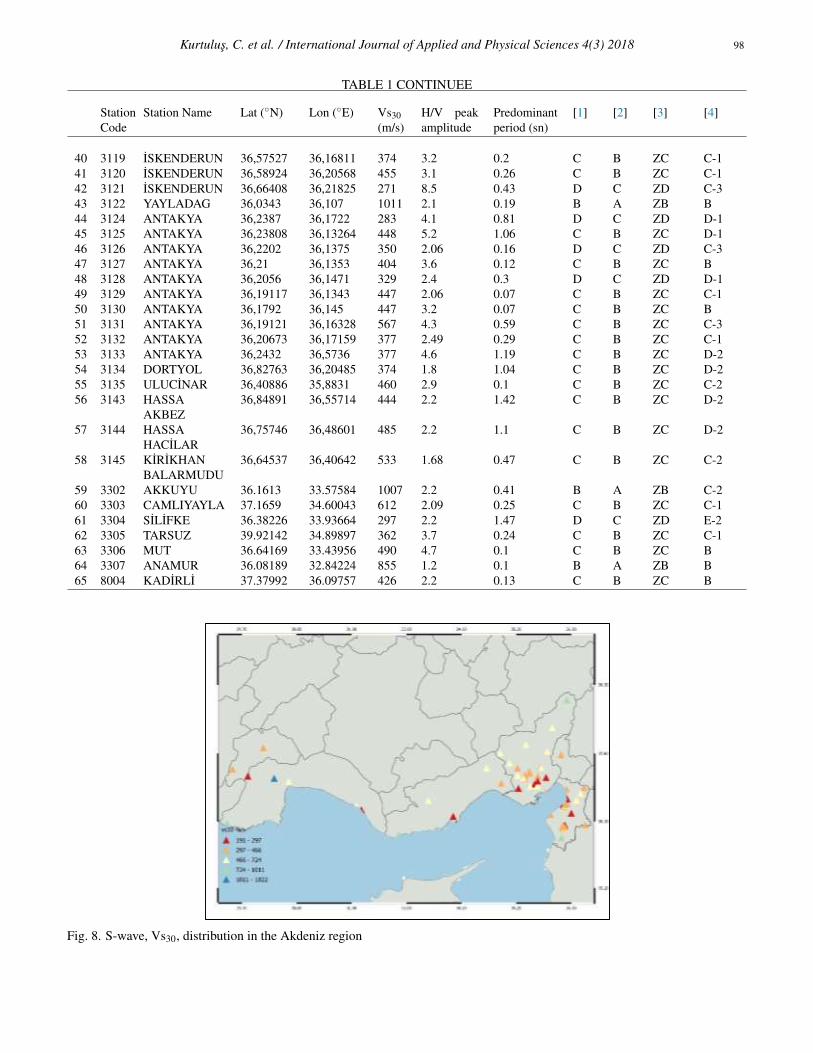
A. Site Classification for the Investigation AreaMASW, ReMi, and microtremor methods were con-
ducted at 65 stations and Vs30 velocity profiles were de-termined for the uppermost 30 m. The Vs30 values rangefrom 191 to 1822m/s. The lower velocities are generallydetermined on the plain areas (Figure 8 and Table 1).
TABLE 1LIST OF THE CLASSES FOR THE STRONG MOTION STATIONS IN AKDENIZ PROVINCE
StationCode
Station Name Lat (◦N) Lon (◦E) Vs30(m/s)
H/V peakamplitude
Predominantperiod (sn)
[1] [2] [3] [4]
1 101 STATION 37,044 35,226 478 3.7 1.47 C B ZC D-32 102 STATION 37.05792 35.36698 417 3.05 0.21 C B ZC C-13 103 STATION 36.995811 35.3706 423 1.01 0.20 C B ZC C-14 106 CEYHAN 36.908 35.567 210 3.15 0.55 D C ZD C-35 107 CEYHAN 37.033 35.633 405 3.1 0.67 C B ZC C-36 108 CEYHAN 36.876 35.617 654 2.00 0.14 C B ZC C-17 109 CEYHAN 37.178 35.689 253 2.7 1.17 D C ZD D-28 111 SEYHAN 37.166 35.226 461 0.79 0.43 C B ZC C-29 112 YUREGIR 36.871580 35.476279 490 1.6 0.57 C B ZC C-310 113 YUREGIR 36.955522 35.627320 267 3.11 0.50 D C ZD C-311 114 YUREGIR 37.175843 35.69286 483 1.05 0.66 C B ZC C-312 115 YUREGIR 37.081210 35.454380 322 2.1 1.01 D C ZD D-213 116 YUREGIR 37.104862 35.462624 466 0.8 0.55 B C ZB C-314 117 YUREGIR 36.838383 35.241111 215 3.6 0.80 D C ZD D-215 120 YUREGIR 36.77006 35.79005 439 3.1 0.16 C B ZC C-116 122 KOZAN 37.4339 35.82021 501 3.1 0.13 C B ZC C-117 123 YUREGIR 37.00338 35.34376 519 6.7 0.2 C B ZC C-118 124 POZANTI 37.4087 34.87911 583 5.8 0.16 C B ZC C-119 125 CEYHAN 37.01519 35.79577 216 1.94 1.03 D C ZD D-220 126 ALADAG 37.54551 35.39186 521 2.4 0.22 C B ZC C-121 127 FEKE 37.81619 35.92038 583 3.3 0.16 C B ZC B22 128 KARAISALI 37.25029 35.06279 494 2.3 0.8 C B ZC D-123 129 TUFANBEYLI 38.25915 36.21013 965 2.1 0.1 B A ZB B24 707 KORKUTELI 37.0007 30.35028 1822 3.8 1.47 A A ZA C-225 713 ALANYA 36.54286 32.00434 540 2.4 0.47 C B ZC C-226 714 ALANYA 36.55547 31.98667 607 1.4 0.47 C B ZC C-227 715 MAHMUT-
LAR36.48778 32.09627 285 4.8 0.8 D C ZD D-2
28 716 KALKAN 36.2685 29.4128 813 <2 0.5-0.1 B A ZB29 717 KEPEZ 36.9495 30.6419 724 1.7 0.19 C B ZC C-130 1506 GOLHISAR 37.14721 29.50946 337 1.6 0.58 D C ZD C-331 1507 KOZLUCA 37.4942 30.1336 359 0.8 1.1 D C ZD C-332 1508 SOGUT 37.0363 29.8214 206 1.4 0.23 D C ZD D-133 3111 KIRIKHAN
TOPBOGAZI36,00 36,30164 191 1.6 1.06 D C ZD D-2
34 3112 ISKENDERUN 36,58801 36,14766 233 6.6 0.2 D C ZD C-235 3113 ISKENDERUN 36,57752 36,15496 221 0.8 0.67 D C ZD C-336 3114 ISKENDERUN 36,56704 36,15135 215 3.2 1.35 D C ZD C-337 3115 ISKENDERUN 36,54634 36,16459 414 2.5 1.1 C B ZC D-238 3116 ISKENDERUN 36,61618 36,20661 870 1.6 0.23 B B ZB C-139 3117 ISKENDERUN 36,55712 36,17471 597 2.2 0.24 C B ZC C-1
Kurtulus, C. et al. / International Journal of Applied and Physical Sciences 4(3) 2018 98
TABLE 1 CONTINUEE
StationCode
Station Name Lat (◦N) Lon (◦E) Vs30(m/s)
H/V peakamplitude
Predominantperiod (sn)
[1] [2] [3] [4]
40 3119 ISKENDERUN 36,57527 36,16811 374 3.2 0.2 C B ZC C-141 3120 ISKENDERUN 36,58924 36,20568 455 3.1 0.26 C B ZC C-142 3121 ISKENDERUN 36,66408 36,21825 271 8.5 0.43 D C ZD C-343 3122 YAYLADAG 36,0343 36,107 1011 2.1 0.19 B A ZB B44 3124 ANTAKYA 36,2387 36,1722 283 4.1 0.81 D C ZD D-145 3125 ANTAKYA 36,23808 36,13264 448 5.2 1.06 C B ZC D-146 3126 ANTAKYA 36,2202 36,1375 350 2.06 0.16 D C ZD C-347 3127 ANTAKYA 36,21 36,1353 404 3.6 0.12 C B ZC B48 3128 ANTAKYA 36,2056 36,1471 329 2.4 0.3 D C ZD D-149 3129 ANTAKYA 36,19117 36,1343 447 2.06 0.07 C B ZC C-150 3130 ANTAKYA 36,1792 36,145 447 3.2 0.07 C B ZC B51 3131 ANTAKYA 36,19121 36,16328 567 4.3 0.59 C B ZC C-352 3132 ANTAKYA 36,20673 36,17159 377 2.49 0.29 C B ZC C-153 3133 ANTAKYA 36,2432 36,5736 377 4.6 1.19 C B ZC D-254 3134 DORTYOL 36,82763 36,20485 374 1.8 1.04 C B ZC D-255 3135 ULUCINAR 36,40886 35,8831 460 2.9 0.1 C B ZC C-256 3143 HASSA
AKBEZ36,84891 36,55714 444 2.2 1.42 C B ZC D-2
57 3144 HASSAHACILAR
36,75746 36,48601 485 2.2 1.1 C B ZC D-2
58 3145 KIRIKHANBALARMUDU
36,64537 36,40642 533 1.68 0.47 C B ZC C-2
59 3302 AKKUYU 36.1613 33.57584 1007 2.2 0.41 B A ZB C-260 3303 CAMLIYAYLA 37.1659 34.60043 612 2.09 0.25 C B ZC C-161 3304 SILIFKE 36.38226 33.93664 297 2.2 1.47 D C ZD E-262 3305 TARSUZ 39.92142 34.89897 362 3.7 0.24 C B ZC C-163 3306 MUT 36.64169 33.43956 490 4.7 0.1 C B ZC B64 3307 ANAMUR 36.08189 32.84224 855 1.2 0.1 B A ZB B65 8004 KADIRLI 37.37992 36.09757 426 2.2 0.13 C B ZC B
Fig. 8. S-wave, Vs30, distribution in the Akdeniz region

99 Kurtulus, C. et al. / International Journal of Applied and Physical Sciences 4(3) 2018
The sites were classified in accordance with NEHRPProvisions [1], Eurocode-8 [2], TBDY [3] and Rodrigezand Marez (2001), (Table 1). The NEHRP Provisionssuggest six site classes such as A, B, C, D, E, and F forthe recognition of site conditions. 1 station is classifiedas class A, 7 stations as B and 38 stations as C and 19 sta-tions to be class D. According to Eurocode-8 [2], 6 sta-tions correspond to class A, 39 stations B, and 20 stationsD which are similar to NEHRP provision. The classesof C, B, and A in NEHRP correspond to classes of B, A,and C in Eurocode-8 system since the boundary values of
class C in the NEHRP system coincide with the bound-ary values of class B in Eurocode-8, the boundary valuesof class B come up to the boundary values of class A andthe boundary values of class D match with the boundaryvalues of class C. The soil classes in the NEHRP sys-tem correspond to that of TBDY-2018 as seen in Table 1.According to [4] soil classifications, 8 stations are clas-sified as A, 17 stations B, 8 stations C-1, 13 stations C-2,5 stations C-3,11 stations D-1, 1 station D-2, 1 station D-3, 1 station E and 1 station is undistinguished (Figure 9,Figure 10, Figure 11, Figure 12).
Fig. 9. NEHRP classification of the Akdeniz region
Fig. 10. Eurocode-8 classification of the Akdeniz region Fig. 11. TBDY classification of the Akdeniz region

Kurtulus, C. et al. / International Journal of Applied and Physical Sciences 4(3) 2018 100
Fig. 12. Rodrigez and Marez classification of the Akdeniz re-gion
Fig. 13. Soil magnification of the Akdeniz region
B. Site amplification properties of Akdeniz regionAmplification ratios (H/V) and predominant periods
were determined at 65 stations. Soil amplification andpre-dominant periods were interpreted by Geopsy2004software. The H/V ratios were determined between 0.79-8.5. The small magnification values (0.79-2.3) are gen-erally observed on the stations located on the mountains,and higher values (2.3-8.5) were found in plain areas(Figure 13).
IV. DISCUSSION AND CONCLUSIONThe Vs30 values range from 191 to 1822m/s which
are similar to the velocities determined by [29] in theHatay province of this region. The lower velocities aregenerally determined on the plain areas. The lowest Vs30value was determined at 0117 coded Topbogazi stationand the highest value at 707 coded Korkuteli station.The Akdeniz region was classified according to NEHRP
Provisions [1], Eurocode-8 [2], Turkish Building Earth-quake Regulations [3] and [4]. According to NEHRPclassification system the soil class of 38 stations is C and19 stations is D indicating weak soil types. In this systemonly 1 station is determined as class A indicating strongsoil and 7 stations indicating moderately hard soil. Thesoil classes in the NEHRP system correspond to that ofTBDY-2018. According to Eurocode-8, 6 stations corre-spond to class A, 39 stations B, and 20 stations D whichare similar to NEHRP provision. According to [4] soilclassification; 8 stations are classified as A, 17 stationsB, 8 stations C-1, 13 stations C-2, 5 stations C-3,11 sta-tions D-1, 1 station D-2, 1 station D-3, 1 station E and 1station is undistinguished. The soil amplification valueswere determined between 0.7 and 8.5 sec. The lowestamplification value is observed at 111 coded Seyhan sta-tion and the highest at 3121 coded Iskenderun station.The higher amplification values are generally obtainedon the plain areas. These values are in good agreementwith the values determined by [29]. The max and themin predominant periods were determined as 0.07sec at3129 and 3130 coded stations and 1.47 sec at 101, 707and 3304 coded stations. Predominant periods of valuesgenerally increase with decreasing Vs30 velocities.
The results determined in this study formed the ba-sis of the site properties of the Akdeniz region. How-ever; more studies are necessary to define the detailedsite characteristics of the region.
REFERENCES[1] Building Seismic Safety Council, “NEHRP recom-
mended provisions for seismic regulations for newbuildings and other structures part 1: Provisions,”National institute of building sciences, Washing-ton, DC, WA, Tech. Rep., 2003.
[2] P. Bisch, E. Carvalho, H. Degee, P. Fajfar,M. Fardis, P. Franchin, M. Kreslin, A. Pecker,P. Pinto, A. Plumier, H. Somja, and G. Tsionis,“Eurocode 8: Seismic design of buildings workedexamples,” European Commission, Brussels, Bel-gium, Tech. Rep., 2012.
[3] TBDY. (2018) Turkey building earthquake regula-tion. [Online]. Available: https://bit.ly/2Dxgafu
[4] A. Rodriguez-Marek, J. D. Bray, and N. A. Abra-hamson, “An empirical geotechnical seismic siteresponse procedure,” Earthquake Spectra, vol. 17,no. 1, pp. 65–87, 2001. doi: https://doi.org/10.1193/1.1586167
[5] B. Kemal, E. Mustafa, M. Cihat, and E. Zahi, “Seis-mic from the past to the presentthe activity andwhat to do in the light of the international confer-

101 Kurtulus, C. et al. / International Journal of Applied and Physical Sciences 4(3) 2018
ence evaluation,” Turkish Engineer News, vol. 1,no. 423, pp. 51–53, 2003.
[6] U. Tarı, O. Tüysüz, S. Can Genç, C. Imren,B. A. Blackwell, N. Lom, Ö. Tekesin, S. Üsküplü,L. Erel, S. Altıok et al., “The geology and mor-phology of the Antakya Graben between the AmikTriple Junction and the Cyprus Arc,” Geodinam-ica Acta, vol. 26, no. 1-2, pp. 27–55, 2013. doi:https://doi.org/10.1080/09853111.2013.858962
[7] R. C. Ates and N. Bayülke, “The 19 August 1976Denizli, Turkey, earthquake: Evaluation of thestrong motion accelerograph record,” Bulletin ofthe Seismological Society of America, vol. 72,no. 5, pp. 1635–1649, 1982.
[8] N. N. Ambraseys, E. Durukal, and M. Free, “Re-evaluation of strong-motion data from Turkey,”Imperial College of Science, Technology andMedicine, London, UK, ESEE Research Report,No. 93/2, 1993.
[9] O. Aydan and Z. Hasgür, “The characteristics of ac-celeration waves of Turkish earthquakes,” In Pro-ceedings of the 4th National Conference on Earth-quake Engineering, Ankara, Turkey, 1997.
[10] M. Celebi, S. Akkar, U. Gulerce, A. Sanli, H. Bun-dock, and A. Salkin, “Main shock and aftershockrecords of the 1999 Izmit and Duzce, Turkeyearthquakes,” U.S. Geological Survey, Reston, VA,Tech. Rep., 2001.
[11] E. Durukal, Y. Alpay, T. Biro, A. Mert, andM. Erdik, “Analysis of strong motion data ofthe 1995 Dinar, turkey earthquake, second Japan–Turkey workshop: Earthquake disaster preventionresearch in Turkey,” Istanbul Technical University,stanbul, Turkey, Tech. Rep., 1998.
[12] M. Erdik and E. Durukal, “1999 Kocaeli andDüzce, Turkey earthquakes: Strong ground mo-tion,” In XV ICSMGE TC4 Satellite Conference onLessons Learned from Recent Strong Earthquakes,Istanbul, Turkey, 1999.
[13] M. Zaré and P.-Y. Bard, “Strong motion datasetof Turkey: Data processing and site classifica-tion,” Soil Dynamics and Earthquake Engineer-ing, vol. 22, no. 8, pp. 703–718, 2002. doi: https://doi.org/10.1016/s0267-7261(02)00028-3
[14] S. Ozalaybey, M. Ergin, M. Aktar, C. Tapirdamaz,F. Biçmen, and A. Yoruk, “The 1999 Izmit earth-quake sequence in Turkey: Seismological and tec-tonic aspects,” Bulletin of the Seismological Societyof America, vol. 92, no. 1, pp. 376–386, 2002. doi:https://doi.org/10.1785/0120000838
[15] E. M. Rathje, K. H. Stokoe, and B. Rosenblad,
“Strong motion station characterization and siteeffects during the 1999 earthquakes in Turkey,”Earthquake Spectra, vol. 19, no. 3, pp. 653–675,2003. doi: https://doi.org/10.1193/1.1596212
[16] M. Ergin, M. Aktar, and H. Eyidogan, “Present-day seismicity and seismotectonics of the CilicianBasin: Eastern Mediterranean Region of Turkey,”Bulletin of the Seismological Society of America,vol. 94, no. 3, pp. 930–939, 2004. doi: https://doi.org/10.1785/0120020153
[17] D. Kalafat, Y. Günes, M. Kara, P. Deniz, K. Keko-valı, H. Kuleli, L. Gülen, M. Yılmazer, andN. Özel, “A revised and extended earthquake cata-logue for Turkey since 1900 (m ≥ 4.0),” mathesis,Bogaziçi University, Istanbul, Turkey, 2007.
[18] Ö. Erdogan, “Main seismological features of re-cently compiled Turkish strong motion database,”Middle East Technical University, Ankara, Turkey,Tech. Rep., 2008.
[19] M. A. Sandkkaya, “Site classification of nationalstrong-motion recording sites,” mathesis, Civil En-gineering Department, Middle East Technical Uni-versity, Ankara, Turkey, 2008.
[20] M. A. Sandıkkaya, M. T. Yılmaz, B. S. Bakır,and Ö. Yılmaz, “Site classification of Turkish na-tional strong-motion stations,” Journal of Seismol-ogy, vol. 14, no. 3, pp. 543–563, 2010. doi: https://doi.org/10.1007/s10950-009-9182-y
[21] E. Kalkan and P. Gulkan, “Site-dependent spectraderived from ground motion records in Turkey,”Earthquake Spectra, vol. 20, no. 4, pp. 1111–1138,2004. doi: https://doi.org/10.1193/1.1812555
[22] R. Ulusay, E. Tuncay, H. Sonmez, andC. Gokceoglu, “An attenuation relationshipbased on turkish strong motion data and iso-acceleration map of Turkey,” EngineeringGeology, vol. 74, no. 3-4, pp. 265–291, 2004. doi:https://doi.org/10.1016/j.enggeo.2004.04.002
[23] Ö. Yılmaz, E. Savaskan, B. Bakır, M. Yılmaz,M. Eser, S. Akkar, B. Tüzel, Y. Iravul, Ö. Özmen,and Z. Denizlioglu, “Shallow seismic and geotech-nical site surveys at the Turkish national grid forstrong-motion seismograph stations,” In Proceed-ings14th World Conference on Earthquake Engi-neering, Beijing, China, 2008.
[24] P. Gulkan, U. Ceken, Z. Colakoglu, T. Ugras,T. Kuru, A. Apak, J. Anderson, H. Sucuoglu,M. Celebi, D. Akkar et al., “Enhancement of thenational strong-motion network in Turkey,” Seis-mological Research Letters, vol. 78, no. 4, pp. 429–438, 2007.

Kurtulus, C. et al. / International Journal of Applied and Physical Sciences 4(3) 2018 102
[25] S. Över, A. Büyüksaraç, Ö. Bekta, and A. Filazi,“Assessment of potential seismic hazard and siteeffect in Antakya (Hatay Province), SE Turkey,”Environmental Earth Sciences, vol. 62, no. 2,pp. 313–326, 2011. doi: https://doi.org/10.1007/s12665-010-0525-3
[26] H. Korkmaz, “Between antiquity soil propertiesand earthquake effect,” Journal of Relationships,Geographical Sciences, vol. 4, no. 2, pp. 49–66,2006.
[27] S. S. Horoz, “Analysis of the seismicity of the re-gion between adana-antakya-kahramanmara withthe parameter ‘b’ kahraman and risk analysis.”Cumhuriyet University, Sivas, Turkey, Tech. Rep.,2008.
[28] O. Polat and U. Çeken, “Investigation of the localsoil effects at the new strong-motion array (MAT-Net) in Hatay-K. Maras Region, Turkey,” In AGUFall Meeting, San Francisco, CA, 2014.
[29] Ö. T. Özmen, H. Yamanaka, M. A. Alkan,U. Çeken, T. Öztürk, and A. Sezen, “Microtremorarray measurements for shallow S-wave profilesat strong-motion stations in Hatay and Kahraman-maras Provinces, Southern Turkey,” Bulletin of theSeismological Society of America, vol. 107, no. 1,pp. 445–455, 2016. doi: https://doi.org/10.1785/0120160218
[30] S. V. Aditya, M. Duraiselvam, K. Parthiban, andV. Bagade, “Laser surface texturing of nickel su-peralloy to improve adhesion bond strength of ther-mal barrier coating,” International Journal of Ap-plied and Physical Sciences, vol. 3, no. 3, pp.85–92, 2017. doi: https://doi.org/10.20469/ijaps.3.50005-3
[31] T. S. Irmak and M. F. Özer, “23rd February, 1990cyprus earthquake welding mechanism,” Earth-quake Research Bulletin, vol. 80, pp. 109–134,1999.
[32] N. Febryanti and D. Gunawan, “PAPR reductionin OFDM system with wavelet transformation andpartial transmit sequence technique,” Journal ofAdvances in Technology and Engineering Studies,vol. 3, no. 1, pp. 1–5, 2017. doi: https://doi.org/10.20474/jater-3.1.1
[33] C. Park, R. Miller, and J. Xia, “Multi-channelanalysis of surface waves (MASW),” Geophysics,vol. 64, no. 3, pp. 800–808, 1999. doi: https://doi.org/10.1190/1.1444590
[34] J. Xia, R. D. Miller, and C. B. Park, “Estima-tion of near-surface shear-wave velocity by inver-sion of rayleigh waves,” Geophysics, vol. 64, no. 3,pp. 691–700, 1999. doi: https://doi.org/10.1190/1.1444578