investigation of splanchnic erfusion
TRANSCRIPT

1
INVESTIGATION OF SPLANCHNIC PERFUSION
UTILISING AN INTRALUMINAL OPTO-ELECTRONIC
SENSOR PLACED IN THE DUODENUM
CAROLINA DE ALMEIDA GAMA
A thesis submitted for the degree of
- Doctor of Philosophy -
School of Mathematics, Computer Science and Engineering
City University London
October 2015

THE FOLLOWING PARTS OF THIS THESIS HAVE BEEN REDACTED FOR COPYRIGHT REASONS: p 21: Fig 2.1. Image of three stages of respiration. p 27: Fig 2.2. Image of cardiac cycle. p 28: Fig 2.3. Image of cardiac cycle. p 30: Fig 2.4. Image of haemoglobin. p 31: Fig 2.5. Image of oxygen-haemoglobin. p 36: Fig 3.1. Image upper GI tract. p 40: Fig 3.2. Image of blood supply of the stomach. p 41: Fig 3.3. Image of blood supply of duodenum. p 48: Fig 4.1. Image of Clark electrode. p 51: Fig 4.2. Image of gastric tonometer. p 69: Fig 5.4. Image of absorption spectra of oxyhaemoglobin.

2
Table of contents
Abstract .................................................................................................................... 7
List of figures ............................................................................................................ 8
List of tables ........................................................................................................... 15
1 INTRODUCTION .................................................................................... 17
2 OXYGEN DELIVERY AND ROLE IN THE CELL .................................................... 20
2.1 Respiration .............................................................................................. 21
2.1.1 Pulmonary ventilation ............................................................................... 21
2.1.1.1 Mechanical ventilation ...................................................................... 22
2.1.2 External respiration ................................................................................... 23
2.1.3 Internal respiration ................................................................................... 23
2.2 Transport of oxygen ................................................................................. 25
2.2.1 Cardiovascular system .............................................................................. 25
2.2.1.1 The heart ............................................................................................ 25
2.2.1.1.1 ECG ................................................................................................ 27
2.2.1.2 Pulmonary circulation ........................................................................ 28
2.2.1.3 Systemic circulation ........................................................................... 29
2.2.2 Haemoglobin ............................................................................................. 29
2.2.2.1 Oxyhaemoglobin dissociation curve .................................................. 31
2.3 Oxygen deficiency in the cell .................................................................... 32
2.4 Conclusion ............................................................................................... 34

3
3 UPPER GASTROINTESTINAL ANATOMY AND BLOOD SUPPLY .............................. 36
3.1 Anatomy of the stomach and duodenum ................................................. 37
3.1.1 The stomach .............................................................................................. 37
3.1.2 The duodenum .......................................................................................... 37
3.1.3 Mucosa ...................................................................................................... 38
3.2 Blood supply to the upper gastrointestinal tract ....................................... 39
3.2.1 Arterial blood supply ................................................................................. 39
3.2.2 Venous blood drainage ............................................................................. 41
3.3 Regulation of blood supply ...................................................................... 42
3.3.1 Inadequate perfusion of the splanchnic region ........................................ 43
3.4 Conclusion ............................................................................................... 46
4 CURRENT TECHNOLOGIES FOR MONITORING PERFUSION OF THE GASTROINTESTINAL
TRACT ................................................................................................ 47
4.1 Polarographic sensors .............................................................................. 48
4.2 Gastric tonometry .................................................................................... 50
4.3 Laser Doppler flowmetry.......................................................................... 53
4.4 Pulse oximetry ......................................................................................... 56
4.5 Visible light spectroscopy ......................................................................... 61
4.6 Conclusion ............................................................................................... 62
5 PULSE OXIMETRY .................................................................................. 63
5.1 Photoplethysmography ............................................................................ 64
5.1.1 Origin of the PPG waveform ..................................................................... 65

4
5.2 Blood oxygenation measurement using absorption spectrophotometry ... 67
5.2.1 Beer-Lambert’s law ................................................................................... 67
5.2.2 Optical properties of haemoglobin ........................................................... 68
5.2.3 Functional oxygen saturation.................................................................... 70
5.3 Pulse oximetry ......................................................................................... 71
5.3.1 Manipulation of the Beer Lambert’s law .................................................. 71
5.3.2 Calibration ................................................................................................. 74
5.4 Pulse oximeter probes ............................................................................. 75
5.4.1 Transmission pulse oximeter probe .......................................................... 76
5.4.2 Reflectance pulse oximeter probe ............................................................ 77
5.4.3 Light emitting diodes................................................................................. 78
1.1.1.1 Principle of operation ........................................................................ 78
1.1.1.2 LEDs in pulse oximetry ....................................................................... 80
5.4.4 Photodetector ........................................................................................... 81
5.4.4.1 Principle of operation ........................................................................ 81
5.5 Limitations of Pulse Oximetry .................................................................. 82
5.5.1 Calibration assumption ............................................................................. 82
5.5.2 Dyshaemoglobins ...................................................................................... 82
5.5.3 Dyes and nail polish .................................................................................. 83
5.5.4 Optical interference .................................................................................. 83
5.5.5 Motion artefact ......................................................................................... 84
5.5.6 Inadequate pulsatile signals ...................................................................... 84

5
5.6 Monitoring of venous oxygen saturation .................................................. 85
6 DEVELOPMENT OF A TWO CHANNEL DUAL WAVELENGTH PPG PROCESSING SYSTEM 87
6.1 Instrumentation....................................................................................... 87
6.1.1 Multiplexing .............................................................................................. 89
6.1.1.1 Source code ....................................................................................... 90
6.1.2 Current driver ............................................................................................ 91
6.1.3 Transimpedance amplifier ........................................................................ 93
6.1.4 Demultiplexing .......................................................................................... 94
6.1.5 Signal conditioning .................................................................................... 95
6.1.6 ECG ............................................................................................................ 98
6.1.7 Airway pressure ...................................................................................... 100
6.1.8 Power supply ........................................................................................... 100
6.1.9 Data acquisition....................................................................................... 102
6.2 Mechanical construction ........................................................................ 102
6.3 Performance evaluation ......................................................................... 104
6.4 Conclusion ............................................................................................. 112
7 DEVELOPMENT OF A DATA ACQUISITION VIRTUAL INSTRUMENT ...................... 114
7.1 About LabVIEW ...................................................................................... 114
7.1.1 Data acquisition hardware ...................................................................... 115
7.2 Development of the Virtual Instrument for data acquisition using LabVIEW
115
7.2.1 Algorithm for data acquisition ................................................................ 116

6
7.2.2 Algorithm for saving acquired data......................................................... 119
7.2.3 Algorithm for continuous signal display ................................................. 122
7.2.4 Algorithm for the calculation of ratio and SpO2 ..................................... 124
7.2.5 Algorithm for the calculation of heart rate ............................................. 127
7.2.6 Front panel .............................................................................................. 128
7.3 Conclusion ............................................................................................. 130
8 IN VIVO INVESTIGATION OF PPG SIGNALS FROM THE DUODENUM DURING OPEN
LAPAROTOMY ..................................................................................... 131
8.1 Instrumentation..................................................................................... 131
8.1.1 Approved probe sheathing method for sterilization and electrical
insulation ............................................................................................................... 135
8.2 Clinical trial protocol .............................................................................. 138
8.3 Data analysis and results ........................................................................ 140
8.3.1 Other events ............................................................................................ 147
8.3.1.1 Case 1 ............................................................................................... 147
8.3.1.2 Case 2 ............................................................................................... 150
8.3.2 Gastric measurements ............................................................................ 153
8.4 Discussion .............................................................................................. 157
9 CONCLUSION ..................................................................................... 160
References ........................................................................................................... 164
Appendix 1 ........................................................................................................... 174
Appendix 2 ........................................................................................................... 176
Appendix 3 ........................................................................................................... 178

7
Abstract
The splanchnic region (abdominal gastrointestinal organs) is sometimes known as the
“canary of the body” for its susceptibility to develop hypoxia at an earlier stage,
analogue to the old times practice in coal mining. When the neuroendocrine response
is activated, it exhibits regulation of blood flow and extraction of oxygen, facilitating
redistribution of blood to vital organs. This can ultimately lead to systemic inflammatory
response and multiple organ failure. The vital need to monitor the perfusion of the
splanchnic region in critically ill patients has not yet been met by existing techniques.
The goal of this research was to evaluate the feasibility of using the technique of
photoplethysmography intraluminally in the duodenum in order to measure the
haemodynamic changes occurring in the splanchnic circulation in a minimally invasive
fashion. A bespoke processing system and data acquisition virtual instrument were
designed and developed to allow continuous and simultaneous monitoring of two
probes: an existing miniaturised PPG probe intended for intraluminal use and optically-
identical finger PPG probe. Nine anaesthetised patients undergoing elective open
laparotomy surgery were recruited and consented for the clinical trial at The Royal
London Hospital. Due to the great proximity to the surgical site, monitoring of duodenal
pulse oximetry signals could not be done in a continuous way. Also, the presence of
moderate respiratory modulation in otherwise good quality, high amplitude signals
seemed to result in an underestimation of arterial blood saturation of 2%. A frequency
domain algorithm was thus applied to the data with results in agreement with both the
finger PPG probe and commercial pulse oximeter. Blood oxygen saturation estimation
at respiratory frequency yielded values within the physiological range expected for
venous blood. For three of the patients, PPG signals were also acquired from the
stomach, with results showing a similar pattern to the ones obtained from the
duodenum. During the clinical trials, two patients experienced hypotension. PPG signals
obtained before, during and after showed a great decrease in estimated blood oxygen
saturations, which remained low even when monitored haemodynamical variables were
back to normal values. Finger PPG probe estimations and commercial pulse oximetry
values did not demonstrate this change. This suggests the possibility of
photoplethysmography identifying changes in tissue oxygenation and blood volume in
the splanchnic circulation resulting from external and/or internal regulatory
mechanisms. This clinical trial thus show the great promise of pulse oximetry as
complementary monitoring for patients at risk of developing splanchnic ischaemia.

8
List of figures
Figure 2.1: The three stages of respiration: 1 - pulmonary ventilation, 2 - external
respiration, 3 – internal respiration (adapted from:
http://www.vnacne.org/body.cfm?id=103&chunkiid=197587) .................................... 21
Figure 2.2: The phases of the cardiac cycle (blue colouring represents muscle contraction
and green represents valve opening) (in:
http://academic.kellogg.edu/herbrandsonc/bio201_mckinley/cardiovascular%20syste
m.htm) ............................................................................................................................. 27
Figure 2.3: Action potentials throughout the cardiac cycle and normal ECG trace. (in:
http://basic-clinical-
pharmacology.net/chapter%2014_%20agents%20used%20in%20cardiac%20arrhythmi
as.htm) ............................................................................................................................ 28
Figure 2.4: Haemoglobin is the main functional constituent of the red blood cell (in:
http://science.cabot.ac.uk/?p=2357) ............................................................................. 30
Figure 2.5: Oxygen-haemoglobin dissociation curve showing the relationship between
haemoglobin saturation and PO2 at normal body temperature (in:
http://www.frca.co.uk/article.aspx?articleid=100345) .................................................. 31
Figure 3.1: Upper GI tract, depicting the location of the stomach and the duodenum (in:
https://igehrprodisis.med3000.com/patiented/html/14878.html) ............................... 36
Figure 3.2: Blood supply of the stomach (in:
http://musom.marshall.edu/graphicdesign/ibooks/Gastrointestinal%20Normal.html)
......................................................................................................................................... 40

9
Figure 3.3: Blood supply of the duodenum (adapted from: http://web.uni-
plovdiv.bg/stu1104541018/docs/res/skandalakis%27%20surgical%20anatomy%20-
%202004/Chapter%2016_%20Small%20Intestine.htm) ................................................ 41
Figure 4.1: A Clark electrode, temperature sensor included for temperature correction
of measurements (in: http://www.laserfocusworld.com/articles/2008/03/bioprocess-
monitoring-photonics-takes-a-new-look-at-bioprocesses.html) ................................... 48
Figure 4.2: Gastric tonometer in place; note the inflated balloon (in:
http://www.clinicalwindow.liitin.net/cw_issue_02_article5.htm) ................................ 51
Figure 4.3: Regional circulatory difference in the stomach and lower oesophagus. The
mean value is shown with 95% confidence interval [82] ............................................... 55
Figure 4.4: Colour perfusion image map using SLDF of the stomach before mobilization
(a) and after mobilization (b). Before mobilization, the recorded levels of perfusion were
uniform in the three regions of interest defined in the images. Following mobilization,
there were large falls in the recorded perfusion detected in all parts of the stomach.[70]
......................................................................................................................................... 56
Figure 4.5: Handheld commercial pulse oximeter (in: http://ari-cn.com/pulse-oximeter-
c-29.html) ........................................................................................................................ 57
Figure 4.6: a) Tip of the monitoring device. 1 - enteral feeding tube, 2 – inflatable cuff, 3
- PPG sensor. b) Photograph of the monitoring device [88] ........................................... 59
Figure 5.1: The electrocardiogram (ECG) and corresponding AC PPG signal [97] .......... 64
Figure 5.2: A typical PPG waveform [99] ........................................................................ 65
Figure 5.3: Change in mean velocity during pulsatile flow of a suspension of normal
canine erythrocytes in plasma [110] ............................................................................... 66
Figure 5.4: Absorption spectra of oxyhaemoglobin (HbO2) and deoxyhaemoglobin (Hb)
showing the extinction coefficients from the ultraviolet to the near infrared ranges (in:
http://www.medphys.ucl.ac.uk/research/borl/sheddinglight/background.htm) ......... 69

10
Figure 5.5: Absorbed and transmitted light in living tissue. Time t1 corresponds to
diastole while t2 corresponds to systole (adapted from [21]) ....................................... 72
Figure 5.6: A photoplethysmographic probe used in transmission mode [115] ............ 76
Figure 5.7: A photoplethysmographic probe used in reflection mode [115] ................. 77
Figure 5.8: The p-n junction under forward bias showing injection electroluminescence.
(in: http://en.wikipedia.org/wiki/Light-emitting_diode) ................................................ 79
Figure 5.9: Principle of operation of digital pressure cuff method of measuring venous
blood oxygen saturation [127] ........................................................................................ 86
Figure 6.1: Block representation of the dual wavelength PPG acquisition system,
including the ECG channel and the airway pressure channel ......................................... 88
Figure 6.2: Diagram of four-state timing clock signals. .................................................. 90
Figure 6.3: LED current driver circuit .............................................................................. 92
Figure 6.4: Transimpedance amplifier circuit ................................................................. 94
Figure 6.5: Sample and hold circuit. The top LF398 receives clock 1 to output the
photodetector signal correspondent to the red LED, while the bottom LF398 circuit
corresponds to the infrared LED ..................................................................................... 95
Figure 6.6: Unity gain Sallen and Key low pass filter ...................................................... 96
Figure 6.7: Unity gain Sallen and Key high pass filter ..................................................... 97
Figure 6.8: Inverting amplifier for the AC PPG signal ...................................................... 97
Figure 6.9: Instrumentation amplifier used for the ECG channel ................................... 99
Figure 6.10: Inverting amplifier circuit for the ECG signal .............................................. 99
Figure 6.11: ECG bandpass filter implemented with Sallen and Key topology............. 100
Figure 6.12: Input filter for the DC-DC converter ......................................................... 101

11
Figure 6.13: Voltage regulator circuit ........................................................................... 102
Figure 6.14: Photograph of the study monitoring system (1 Power on/off switch with
blue light indicator, 2 ECG receptacle, 3 Gas sampling line luer connector, 4 Intraluminal
PPG probe connector, 5 Finger PPG probe connector) ................................................ 103
Figure 6.15: Photograph of the back panel of the study monitoring system (1 USB port
for data acquisition) ...................................................................................................... 104
Figure 6.16: Output of the microcontroller showing the timing clock signals ............. 105
Figure 6.17: Output of the transimpedance amplifier, showing both the red and infrared
components .................................................................................................................. 106
Figure 6.18: Sample and hold output (green) for the red (a) and infrared (b) wavelengths
as measured with the oscilloscope. The clocks timing signals (blue) and the output of the
transresistance amplifier (orange) are also represented ............................................. 107
Figure 6.19: Frequency response of the PPG bandpass filter. Experimental results are
represented by red diamonds, superimposed on simulation in Multisim in blue ....... 108
Figure 6.20: Frequency response of the PPG low pass filter. Experimental results are
represented by red diamonds, superimposed on simulation in Multisim in blue ....... 109
Figure 6.21: Sample red and infrared AC PPG signals from the intraluminal and the finger
PPG probes as measured on the oscilloscope .............................................................. 109
Figure 6.22: Frequency response of the ECG bandpass filter. Experimental results are
represented by red diamonds, superimposed on simulation in Multisim in blue ....... 110
Figure 6.23: ECG signal as measured on the oscilloscope ............................................ 110
Figure 6.24: Airway pressure signal during forced breathing as measured on the
oscilloscope ................................................................................................................... 111
Figure 6.25: Changes in voltage of the power lines during a cycle run of the processing
system ........................................................................................................................... 112

12
Figure 7.1: Configuration dialog box of the DAQ Assistant Express VI, showing details of
the physical channels in the DAQ card ......................................................................... 117
Figure 7.2: Data acquisition algorithm in LabVIEW ...................................................... 118
Figure 7.3: Algorithm for saving acquired data on LabVIEW, which also records a time
stamp with a hours, minutes and seconds format (%H:%M:%S) ................................. 120
Figure 7.4: Dialog box for Write to Measurement File VI ............................................. 121
Figure 7.5: Filtering and waveform display algorithm .................................................. 123
Figure 7.6: Algorithm for calculation and display of ratio of ratios and SpO2 values from
both the intraluminal PPG probe and the finger PPG probe ........................................ 125
Figure 7.7: SubVI for calculation of ratio of ratios and SpO2 values ............................. 126
Figure 7.8: Icon and connection diagram of the subVI with ratio of ratios and SpO2 values
as outputs ...................................................................................................................... 126
Figure 7.9: Dialog box for the Tone Measurements Express VI. The “Sample Data” and
“Sample Result” are examples and were not obtained as part of this work. ............... 127
Figure 7.10: Algorithm for the calculation and display of heart rate ........................... 128
Figure 7.11: Still of the Front Panel of the LabVIEW VI when it is running .................. 129
Figure 8.1: Layout of the surface mounted components on the board for the intraluminal
and for the finger PPG probes (measurements in mm) ................................................ 134
Figure 8.2: Photograph of the intraluminal PPG probe (left) and of the finger PPG probe
(right). ............................................................................................................................ 135
Figure 8.3: Water pressure test in progress. ................................................................ 136
Figure 8.4: (top left) Tips of the 21 Fr tube and 14 Fr tube. (top right) 21 Fr tube sealed.
(bottom) Intraluminal probe inside the sealed gastric tube ........................................ 137

13
Figure 8.5: AC and DC PPG signals obtained from the duodenum and finger. ECG and
airway flow is included .................................................................................................. 141
Figure 8.6: Mean of means AC amplitudes ................................................................... 143
Figure 8.7: Mean of means DC amplitudes ................................................................... 143
Figure 8.8: Mean of means SpO2 for the intraluminal PPG probe, the finger PPG probe
and the commercial pulse oximeter ............................................................................. 144
Figure 8.9: Frequency and time domain SpO2 values for the intraluminal PPG probe and
the finger PPG probe (highlighted in a darker colour) and mean commercial pulse
oximetry values (in light blue) ....................................................................................... 146
Figure 8.10: Scatter graph of mean SpO2 values obtained using frequency and time
domain algorithms for the intraluminal PPG probe and the finger PPG probe, in
comparison to the commercial pulse oximeter values. The different colours indicate
each patient’s SpO2 values and the black line represents the mean of means SpO2 for
each calculation method. .............................................................................................. 146
Figure 8.11: AC and DC PPG signals obtained from the duodenum and finger at three
different time-points (before, during and after portal vein clamping) ........................ 148
Figure 8.12: Mean AC PPG amplitudes before, during and after portal vein clamping 150
Figure 8.13: Mean DC PPG amplitudes before, during and after portal vein clamping150
Figure 8.14: AC and DC PPG amplitudes obtained from the duodenum and the finger at
three different time-points (before, during and after hypotensive event) .................. 151
Figure 8.15: Mean AC PPG amplitudes before, during and after hypotensive event .. 152
Figure 8.16: Mean DC PPG amplitudes before, during and after hypotensive event .. 152
Figure 8.17: AC and DC PPG signals obtained from the stomach and finger. ECG is
included ......................................................................................................................... 154

14
Figure 8.18: Mean of means AC PPG amplitudes from gastric and peripheral
measurements .............................................................................................................. 155
Figure 8.19: Mean of means DC PPG amplitudes from gastric and peripheral
measurements .............................................................................................................. 155

15
List of tables
Table 8.1: Opto-electronic and package characteristics of the red emitter. ................ 132
Table 8.2: Opto-electronic and package characteristics of the infrared emitter. ........ 132
Table 8.3: Opto-electronic and package characteristics of the photodetector. ........... 133
Table 8.4: Details of the patients recruited for the clinical study “Evaluation of a new
method of monitoring upper gastrointestinal arterial pulsation and oxygen saturations
using an intra-luminal opto-electronic probe”. ............................................................ 138
Table 8.5: Mean (± SD) AC amplitudes for intraluminal and peripheral PPG probes ... 142
Table 8.6: Mean (± SD) DC amplitudes for intraluminal and peripheral PPG probes ... 142
Table 8.7: Mean SpO2 (± SD) for the intraluminal PPG probe and the finger PPG probe,
and commercial pulse oximeter values ........................................................................ 144
Table 8.8: Frequency domain SpO2 values for the intraluminal and the finger PPG probes
....................................................................................................................................... 145
Table 8.9: Blood pressure and time and frequency domain SpO2 calculations before,
during and after portal vein clamping .......................................................................... 149
Table 8.10: Blood pressures and time and frequency domain SpO2 calculations before,
during and after hypotensive event .............................................................................. 153
Table 8.11: Mean (± SD) AC PPG amplitudes from gastric and peripheral measurements
....................................................................................................................................... 154
Table 8.12: Mean (± SD) DC PPG amplitudes from gastric and peripheral measurements
....................................................................................................................................... 155

16
Table 8.13: Mean (± SD) and mean of means of SpO2 calculations from gastric and
peripheral measurements and commercial pulse oximeter values ............................. 156
Table 8.14: Frequency domain SpO2 calculations for gastric and peripheral PPG probe
....................................................................................................................................... 156

17
Chapter
1
INTRODUCTION
In the past few decades there has been an increased understanding of the role
of the splanchnic circulation (blood flow to abdominal gastrointestinal organs) in the
development of sepsis and multiple organ failure in critically ill patients and
consequently an increased interest in monitoring this region [1], [2]. In the face of
circulatory distress, the splanchnic region exhibits auto regulation of blood flow and
extraction of oxygen, facilitating redistribution of blood to vital organs, such as the heart
and brain. Before central circulation is affected, hypoxia ensues within the splanchnic
circulation. Unnoticed, this results in mucosal barrier dysfunction, ultimately inducing
septic shock and multiple organ failure [3], [4]. The splanchnic region is therefore known
as the “canary of the body” [4], analogue to the old times practice in coal mining, and
similarly vital to monitor for early detection of inadequate oxygenation.
Existing techniques for monitoring perfusion of the splanchnic region from within
the gastrointestinal tract rely on either invasive procedures [5] or are based on indirect
parameters, like blood flow for laser Doppler flowmetry and magnetic resonance
angiography or mucosal carbon dioxide tension for gastric tonometry [6]. These
techniques, considering the metabolic mechanisms of increased oxygen extraction in
the splanchnic circulation [7], may not suffice in giving a true representation. Therefore,
there is a need for a simple, continuous and non-invasive method for monitoring oxygen
saturation in this region.

18
Pulse oximetry has become a standard of care present in most operating
theatres, intensive care units and during transport of critically ill patients [8]. It provides
non-invasive continuous monitoring of arterial blood oxygen saturation (SpO2) and heart
rate. Pulse oximetry estimates the percentage of oxygen bound to haemoglobin by
measuring the ratio of light absorbance of vascular tissue at two different wavelengths,
red and infrared, at the finger or ear lobe. The time dependant photoplethysmographic
(PPG) signals received at the photodetector of the pulse oximeter are assumed to be
caused exclusively by changes in the arterial blood volume associated with the cardiac
cycle [9]. More recent studies have suggested the possibly of measuring venous blood
oxygen saturation by isolating the respiratory modulation of the PPG signals [10], [11].
This project hypothesises that photoplethysmographic signals obtained from the
lumen of the duodenum may provide a window into the perfusion of splanchnic
circulation and enable the early detection of hypoxia. A bespoke processing system and
data acquisition virtual instrument were designed and developed to accept an existing
miniaturised PPG probe intended for intraluminal use and optically-identical finger PPG
probe. This will enable simultaneous monitoring and comparison of signals from the
lumen of the duodenum and the traditional pulse oximetry site during clinical trials on
nine patients undergoing open laparotomy.
Chapter 2 illustrates the importance of oxygen in cell metabolism and describes
the process by which it is made available to the cells through coordination of the
respiratory and cardiovascular system, giving particular focus on the oxygen carrying
molecule haemoglobin.
Chapter 3 covers the basic anatomy and blood circulation, both arterial supply
and venous drainage, of the stomach and duodenum. It also explains the processes of
blood flow and oxygenation regulation that occur in this area, discussing some of the
pathologies that arise due to inadequate perfusion.
Chapter 4 gives a review on the techniques used and/or under research for
estimating perfusion of the splanchnic circulation, focusing on those used intraluminally.
It details the physiological principle in which they are based, the technology used for the
measurement and an account of their use in both animal and human studies.

19
Chapter 5 introduces the principles of photoplethysmography (PPG) and pulse
oximetry that are the base to the technology used in this study. It begins with Beer-
Lambert’s law for the absorption of light, before highlighting the optical properties of
blood, more specifically of oxyhaemoglobin and deoxyhaemoglobin. It explains the
technique of PPG and the PPG waveform used in pulse oximetry to develop the
equations needed for calibration and estimation of arterial blood saturation. It also
describes the opto-electronic components and configurations used for pulse oximeter
probes. A brief overview of the limitations of pulse oximetry is also given. Following this,
it gives an overview on the research done on monitoring venous blood oxygen
saturation using the techniques of photoplethysmography and pulse oximetry.
Chapter 6 gives a description and evaluation of the dual wavelength processing
system used to drive the optics of the intraluminal and finger PPG probes, used in the
clinical study, and process the acquired signals. A 3-lead ECG channel and an air pressure
sensing channel were also incorporated in the hardware system.
Chapter 7 details the virtual instrument developed in LabVIEW for acquisition
and display of the photoplethysmographic signals.
Chapter 8 describes the clinical trials performed on nine anaesthetised patients
undergoing routine open laparotomy surgery. The intraluminal probe was positioned in
the duodenum and PPG signals were obtained in both stable and hypotensive
conditions. For three of the patients, PPG signals were also acquired from the stomach.
Data and statistical analysis of all acquired PPG signals is undertaken, presented and
discussed.
Chapter 9 presents the conclusions along with suggestions for further work.

20
Chapter
2
OXYGEN DELIVERY AND ROLE IN THE CELL
Oxygen plays a vital role in the human body. It is the most electronegative
element available to the cells and thus the strongest acceptor of electrons within the
chain of chemical reactions that convert glucose into adenosine triphosphate (ATP). ATP
is the energy currency for the metabolic processes of cells, which include maintenance
of membrane integrity, ionic pumps and other specialized functions [12].
In the absence of oxygen, hypoxia ensues and the cell has to resort to
energetically inefficient processes for ATP production. Ultimately this situation will lead
to irreversible cell damage and cell death.
The oxygen present in the atmosphere is made available to cells through the
coordinated actions of the respiratory and cardiovascular systems. Since gases aren’t
particularly soluble in the plasma of the blood, a specialized molecule present in red
blood cells, haemoglobin, facilitates transport and release of oxygen to every cell in the
human body to meet their metabolic needs.
This chapter will expand on oxygen transport, delivery to cells via haemoglobin
in red blood cells and what happens in the cell and tissues when it is insufficient to
support metabolism.

21
2.1 Respiration
Respiration occurs in three phases (Figure 2.1):
Pulmonary ventilation: exchange of air between the atmosphere and the lungs
through inspiration and expiration.
External respiration: exchange of gases between the alveoli of the lungs and the
blood in pulmonary capillaries.
Internal respiration: exchange of gases between blood in systemic capillaries and
tissue cells.
Figure 2.1: The three stages of respiration: 1 - pulmonary ventilation, 2 - external respiration, 3 – internal respiration (adapted from:
http://www.vnacne.org/body.cfm?id=103&chunkiid=197587)
2.1.1 Pulmonary ventilation
The act of breathing is mostly an involuntary process controlled by neuron
clusters located in the medulla oblongata and pons of the brain stem [13]. The excitation
of these neurons is transmitted to motor neurons in the spinal cord that cause
contraction of the diaphragm, pectoral muscles and intercostal muscles, lifting the ribs
and pulling them outward during inspiration. The expansion of the thoracic cavity causes
the tiny air sacs in the lungs, called alveoli, to enlarge. As the air inside the alveoli
expands, by Boyle’s law its partial pressure drops. This creates a negative pressure
gradient about of 3 mmHg between the lungs and the atmosphere [14], drawing air in

22
through the nose or mouth and into the body. The inspired air passes through the
pharynx and trachea, into the left and right bronchi. Inside the lungs, each bronchus
divides into even narrower bronchioles before the air reaches the alveoli. This is where
external respiration takes place.
Cyclically, the respiratory centre in the brain becomes inactive and the nerve
impulses cease. With no impulses arriving, the inspiratory muscles relax. Expiration
results from the natural elastic recoil of the lungs to its original volume and, according
to Boyle’s law, consequent increase in pressure to a value that is about 3 mmHg above
atmospheric pressure [13]. The pressure gradient is now reversed and the air is forced
out of the lungs into the atmosphere, until the two pressures are equalized.
The neurons of the respiratory centre of the brain control both rhythm and depth
of respiration. Normal quiet respiration rate averages 12 breaths per minute [13] but
this can be modified voluntarily, by emotional stimuli (i.e. during crying or laughing), by
chemical stimuli (increased carbon dioxide, decreased oxygen or decrease pH in blood)
or by other factors including temperature, pain, blood pressure or irritation of airways.
2.1.1.1 Mechanical ventilation
Mechanical ventilators are used to deliver additional oxygen or breathing
support to a patient who has either severe respiratory problems or is undergoing
general anaesthesia during a surgical procedure. The first workable mechanical
ventilators, developed in the 1920s, were negative pressure ventilators, known as iron
lungs [15]. This type of ventilator works by applying negative pressure around the
thoracic cavity. However, valuable in allowing a patient to remain connected for years
at a time, it greatly limits access to the patient for medical staff.
Positive pressure ventilators, on the other hand, force air into the alveoli by
creating a positive pressure gradient: gas at a higher pressure is applied to the airways
through an endotracheal tube, a tracheostomy tube or via a tight fitting face mask.
Exhalation occurs passively due to the elastic recoil of the lungs when the delivered air
pressure drops. These ventilators can be operated in either volume control or pressure
control modes and even in assist mode, helping with ventilation after the patient

23
initiates the breathing cycle. The addition of PEEP (positive end expiratory pressure)
minimizes the collapse of the airways and alveoli by maintaining the air pressure above
atmospheric pressure at the end of expiration.
However, the additional increase in intrathoracic pressure has a reflection on the
cardiovascular system leading to decrease in venous return, right ventricular output,
pulmonary blood flow and associated consequences [16].
2.1.2 External respiration
External respiration is the term used for the gas exchange between the inspired
air and blood occurring at the level of the alveoli through the process of diffusion.
Oxygen diffuses from the alveolar air, where its partial pressure is higher at 105 mmHg
[13], into the lower partial pressure environment of the blood in the pulmonary
capillaries. Under resting conditions, the partial pressure of oxygen (PO2) in the blood
that reaches the lungs to be re-oxygenated is around 40mmHg, but in exercise this value
can be even lower. Diffusion will continue until the pressures are equalized. Carbon
dioxide (CO2) is also subjected to a partial pressure gradient but in the opposite
direction: CO2 will move across the gas/blood barrier to the alveolar air by diffusion and
be expelled from the body during expiration.
The alveoli are ideally suited for the process of diffusion. According to Fick’s law,
the rate of diffusion of a gas across a membrane is not only dependent on the partial
pressure difference but also on properties of the membrane itself. An adult human has
approximately 600 million alveoli, totalling a 70 m2 of gas exchange surface area [13]. In
addition, a dense network of capillaries surrounds each alveolus and as much as 900 mL
[13] of blood is able to participate in gas exchange at any instant. Furthermore, the
membrane of the alveoli is approximately 0.3 µm thick [17] which, coupled with one cell
thick walled capillaries, decreases the diffusion distance.
2.1.3 Internal respiration
The purpose of respiration is to deliver oxygen to cells throughout the body for
cellular respiration. Oxygen is consumed in the breakdown of glucose into adenosine
triphosphate (ATP) [13]. ATP is the principal source of energy used in various metabolic

24
reactions in the cell and it must be continuously synthesised as the body’s reserves will
last no longer than a few minutes [12].
In the absence of oxygen or when there is a temporary increase in demand, the
cell is able to synthesise ATP through anaerobic processes, meaning they occur in the
absence of oxygen. In the first stage of glucose oxidation, denominated glycolysis, two
pyruvic acid molecules are produced with a net gain of two molecules of ATP. The
pyruvic acid is then removed from the cell through fermentation. The waste products of
this process will be lactic acid and carbon dioxide.
However, if enough oxygen is available to the cell, the pyruvic acid will enter the
mitochondria and undergo further oxidation with liberation of CO2 and production of
the energy containing molecules ATP, NADH+H+ and FADH2. These molecules are the
source of high energy electrons that are moved through the electron transport chain. As
electrons are passed to the protein complexes of the electron transport chain, protons
are pumped across the mitochondrial inner membrane, resulting in an electrochemical
gradient. In the fifth and last protein complex, the energy derived from the protons
flowing back into the matrix and subsequent collapse of pH gradient will be utilized to
form ATP. The strongest acceptor of electrons in this chain is the molecular oxygen. Each
atom of oxygen will accept two electrons transferred from the electron transport chain,
becoming negatively charged. It then picks up two hydrogen protons (H+) from the acidic
surrounding medium forming one water molecule. Even though this aerobic process,
known as oxidative phosphorylation, will take longer than the anaerobic option, it yields
a larger energy gain: 36 or 38 molecules of ATP can be generated from one molecule of
glucose [13].
Oxygenated blood in the systemic capillaries has a greater oxygen partial
pressure than the tissues it bathes, and exchange of gases will occur through diffusion
as well. Oxygen will diffuse into the interstitial fluid surrounding the cells before entering
the nearest cells, within a distance of about 1 mm. The waste product carbon dioxide
will diffuse from the cells into the blood.

25
2.2 Transport of oxygen
2.2.1 Cardiovascular system
In order to maintain homeostasis, the human body can consume over 1023
molecules of oxygen per second [9]. This amount of oxygen is made available to cells
through coordination between the cardiovascular and respiratory systems.
2.2.1.1 The heart
The heart is the primary pumping mechanism for maintaining a constant
circulation of blood throughout the body. It has four chambers: the atria that receive
blood, and the ventricles, that pump blood away from the heart to the systemic and
pulmonary circulations. The septum divides the left and right sides, separating
oxygenated and deoxygenated blood.
The contraction of the heart is initiated by the electrical activity generated by the
pacemaker cells in the sinoatrial node (SA). The action potential then propagates
through the conduction system to the atrioventricular (AV) node, causing polarization
and depolarization of the muscle fibres of the heart. This inherent electrical activity
ensures a rhythmical and alternating contraction of the atria and the ventricles [13]. The
heart rate and strength of heartbeat is controlled and regulated by the cardiovascular
centre of the autonomic nervous system located in the medulla oblongata of the brain
and by chemoreceptors that detect hormonal changes in the blood and baroreceptors
that detect changes in blood pressure. A healthy heart rate is between 50 to 70 beats
per minute but it may reach 200 beats per minute in a healthy young adult with maximal
nervous stimulation [13].
The action potential from the SA node spreads through the contractile fibres in
both atria to the AV node, causing atrial systole (contraction). As the pressure rises
inside the atria, the blood within is forced through the mitral (or bicuspid) valve in the
left side of the heart and through the tricuspid valve in the right side at the same time.
The end of atrial systole marks the end of ventricular diastole (relaxation). Rapid
ventricular depolarization causes ventricular systole, as the action potential spreads
through the ventricular contractile fibres. Pressure rises inside the chambers and pushes

26
blood up against the semilunar cups of the aortic valve in the left side of the heart and
the pulmonary valve in the right side, forcing them shut. Continued contraction causes
pressure inside the ventricles to rise sharply. When the pressure in the left ventricle
reaches about 80 mmHg the valve opens and the blood is pushed into the aorta to the
systemic circulation. The pressure inside the ventricle will continue to rise until
approximately 120 mmHg. In a resting adult, the volume of blood that is ejected from
the left ventricle each minute, called the cardiac output, is about 5 L, close to the total
blood volume [13]. In the right ventricle, the pressure will climb to 20 mmHg when the
pulmonary valve opens to the pulmonary trunk and the blood is pumped to the
pulmonary circulation. The pressure in the right ventricular will continue to rise to about
25 to 30 mmHg [13]. After contraction, ventricular repolarization causes ventricular
diastole (relaxation).
The different phases of the cardiac cycle can be observed in Figure 2.2.

27
Figure 2.2: The phases of the cardiac cycle (blue colouring represents muscle contraction and green represents valve opening) (in:
http://academic.kellogg.edu/herbrandsonc/bio201_mckinley/cardiovascular%20system.htm)
2.2.1.1.1 ECG
The electrocardiogram (ECG) is the recording of the electrical activity initiated by
the SA node by suitable electrodes at the surface of the body. Its trace represents the
temporal and spatial summation of the action potential of all the heart muscle fibres
throughout the cardiac cycle.
The first wave of the ECG trace is the P wave, which represents atrial
depolarization. The second recognizable feature, called the QRS complex, corresponds
to the rapid ventricular depolarization while the third wave, the T wave represents
ventricular repolarization just as the ventricles start to relax. The ECG trace is then flat
during the plateau period of depolarization [13] before the cardiac cycle starts gain with
atrial depolarization. Figure 2.3 provides a visualization of this process.

28
Figure 2.3: Action potentials throughout the cardiac cycle and normal ECG trace. (in: http://basic-clinical-
pharmacology.net/chapter%2014_%20agents%20used%20in%20cardiac%20arrhythmias.htm)
2.2.1.2 Pulmonary circulation
During inspiration, air flows into the lungs and, as explained previously, gas
exchange occurs at the level of the alveoli. Oxygen is diffused into the dense network of
capillaries that surrounds each alveolus. As this oxygen rich blood leaves the lungs, it is
drained through larger vessels, known as venules and eventually into the pulmonary
veins. Two left and two right pulmonary veins enter the left atrium of the heart.
From the right ventricle, the blood depleted of oxygen originating from the
systemic circulation, is pumped through the pulmonary valve into the pulmonary artery.
It is then carried by two branches, the right and left pulmonary arteries, to the alveoli in
the lungs for external respiration.

29
2.2.1.3 Systemic circulation
The systemic circulation carries the oxygenated blood that leaves the aortic valve
to supply nourishment and remove waste products from all the cells of the body,
excluding the alveoli.
The aorta is the largest artery of the body and all the major arteries that supply
all the major organs in the body branch off it. Arteries have a thick muscular elastic wall
with high compliance, allowing them to expand easily with the periodical pressure
variations of the blood inside. Vasoconstriction and vasodilation is also possible by
sympathetic and parasympathetic innervations of the smooth muscle fibres on their
tunica media [13].
These arteries will give rise to smaller diameter arterioles, which continue to
branch out into finer capillaries. An extensive network of thin walled capillaries
facilitates the exchange of gases and other nutrients to tissue. Oxygen is delivered to
the cells for internal respiration and carbon dioxide and waste products are picked up.
When it leaves the systemic capillaries, the level of oxygen in the blood has dropped
from 95-99% to 60-80% (or around 40% during exercise) [18]. This is commonly known
as deoxygenated blood, even though it isn’t completely desaturated of oxygen. The
capillaries will drain into a systemic venule, which will merge into systemic veins and
ultimately the superior and inferior vena cava. Veins, in contrast to arteries, have thinner
walls with larger lumens and, as a result, the venous pressure is lower than the arterial
pressure: the normal range for central venous pressure (CVP) is 0 to 6 mmHg [19]. Some
veins contain valves that prevent backflow of blood.
The blood returns to the right atrium of the heart, right ventricle and pulmonary
circulation to be re-oxygenated.
2.2.2 Haemoglobin
Gases are not particularly soluble in water and, obeying Henry’s law, at a partial
pressure of 100 mmHg, 100 ml of plasma contains 0.3 ml of oxygen, corresponding to
about 1.5% of the total oxygen transported [20]. The vast majority is bound to
haemoglobin in red blood cells (RBC), also called erythrocytes. RBCs are highly

30
specialized for the transport and delivery of O2: their surface area for diffusion of gas
molecules is increased by their biconcave disc shape and a strong plasma membrane
concedes them the flexibility and strength to deform without rupturing as they squeeze
through narrow capillaries. Being devoid of a nucleus and mitochondria, RBCs generate
ATP anaerobically and don’t consume any of the oxygen they transport. A healthy adult
has approximately 5 million of RBCs per microliter of blood and each cell contains about
280 million molecules of oxygen-carrying haemoglobin [13].
The molecule of haemoglobin consists of a protein globin, composed of two
alpha and two beta polypeptide subunits, and a haem group bound to each globin chain.
Each haem group contains one iron atom each that can form a reversible covalent bond
with an oxygen molecule, totalling 4 oxygen bonds for every haemoglobin molecule
(Figure 2.4).
Figure 2.4: Haemoglobin is the main functional constituent of the red blood cell (in: http://science.cabot.ac.uk/?p=2357)
When oxygen binds to one of the haem groups, the structure of the haemoglobin
molecule changes slightly, enhancing the attraction to oxygen by the remaining groups.
The loading of the first oxygen results in the rapid loading of the next three, forming
oxyhaemoglobin. Conversely, when one haem group unloads its oxygen, the others will
also unload rapidly [21]. This property of haemoglobin is called cooperative binding.
When the haemoglobin molecule is not fully saturated with oxygen it is known
as deoxyhaemoglobin. Together with oxyhaemoglobin, they are called functional
haemoglobins. The presence of carbon monoxide, for example, which has a higher
affinity to haemoglobin and so competes with oxygen for the binding position, leaves

31
the haemoglobin molecule unable to reconnect to oxygen. Carboxyhaemoglobin is then
called a dysfunctional haemoglobin species, along with methaemoglobin, an oxidised
haemoglobin molecule.
2.2.2.1 Oxyhaemoglobin dissociation curve
The success of cellular respiration is dependent on the ease of dissociation of
oxygen from haemoglobin. A useful tool to understand this relationship is the oxygen
dissociation curve (Figure 2.5). This is graphical representation of the amount of oxygen
chemically bounded to haemoglobin in blood as a function of oxygen partial pressure
(PO2).
PO2 is the most important factor that influences the affinity of haemoglobin to
oxygen. As can be seen in Figure 2.5, haemoglobin is close to 100% saturated at about
105 mmHg, the partial pressure of oxygen in the alveolar air at inspiration. It is also
important to notice that haemoglobin is still over 90% saturated with O2 at a PO2 of
60 mmHg and a nearly full load of oxygen can still be picked up from the lungs. On the
other hand, in active tissues, where PO2 can fall below 40 mmHg, large amounts of
oxygen dissociate from haemoglobin in response to small decreases in partial pressure
[13]. This characteristic sigmoid shape is a result of the cooperative binding of oxygen
to the haem groups.
Figure 2.5: Oxygen-haemoglobin dissociation curve showing the relationship between haemoglobin saturation and PO2 at normal body temperature (in:
http://www.frca.co.uk/article.aspx?articleid=100345)

32
Other factors that influence the affinity of haemoglobin for oxygen include the
acidity of the cell environment, temperature and carbon dioxide:
An increase in acidity shifts the oxygen dissociation curve to the right and will
enhance the unloading of oxygen from haemoglobin. An example of this is the presence
of lactic acid during anaerobic cell respiration.
An increase in temperature will also cause a curve shift to the right. Heat is a
byproduct of metabolic activity and active cells require more oxygen. Fever produces a
similar result.
Carbon dioxide can also bind to haemoglobin and, similarly to hydrogen ions (H+)
when acidity increases, it shifts the dissociation curve to the right [13]. The attachment
of carbon dioxide to the amino groups of the globin molecule is known as
carbaminohaemoglobin but doesn’t compete with oxygen for the iron binding positions
[21]. However, this isn’t the most efficient way of transport and most of CO2 is carried
by plasma in the form of carbonates.
2.3 Oxygen deficiency in the cell
The oxygen transport system operates to maintain a balance of oxygen
consumption and delivery to cells. Under resting conditions, the tissue cells will receive
more than adequate oxygen to meet their requirements and ensure aerobic
metabolism. Higher metabolic activity, i.e. during exercise, will lead to higher
requirements and cells extract more oxygen from haemoglobin and the saturation of
mixed venous blood falls below 70% [22].
Failure of oxygen supply to meet the demands of cells will lead to hypoxia
ensuing. Firstly, as the oxygen level decreases, the cell is able to adapt, going into a state
of hibernation [23]. As mitochondrial activity diminishes and enzymes adjust their
metabolism, ATP production is maintained at a sufficient level.
The next threshold of hypoxia, as defined by Connett et al [12], happens when
the cell has to resort to anaerobic metabolism for production of ATP to match the

33
energetic demand. Besides being energetically inefficient, the anaerobic metabolic
pathway produces lactic acid. Clearance by conversion to glucose is an ATP requiring
process and so lactic acid rapidly builds up in the cell. This has the effect of lowering the
pH of blood causing a shift to the right in the oxyhaemoglobin dissociation curve.
The third threshold of hypoxia is crossed when anaerobic metabolism becomes
insufficient to produce enough ATP to maintain cellular function. If oxygen deprivation
continues, cellular membrane disruption will follow resulting in electrolyte (potassium,
sodium and calcium) disturbance and ultimately irreversible cell damage and death by
necrosis or activated apoptosis (genetically encoded cell death) [24].
There are four types of hypoxia determined by the pathophysiological cause of
oxygen deprivation:
Ischaemic hypoxia: also known as stagnant hypoxia is the result of an inadequate
circulating volume, reduced cardiac output or arteriolar obstruction or vasoconstriction;
it can also be caused by intravascular blood stagnation due to impairment of venous
outflow or decreased arterial flow. It can be brought on by a variety of conditions
including cardiac arrest, pulmonary embolism or stroke [25].
Anaemic hypoxia: also known as hypemic hypoxia is seen when there is a
reduction in oxygen carrying capacity, whilst arterial partial pressure of oxygen remains
normal. It is attributable to a low total haemoglobin concentration in blood or low
functional haemoglobin concentration. Possible causes include anaemia, haemorrhage,
carbon monoxide poisoning and respiratory failure [25].
Hypoxic hypoxia: it is a state of oxygen deficiency in which the arterial partial
pressure of oxygen is low. It can be caused by a decrease in oxygen concentration of
inspired air, decreased pulmonary ventilation, the inability to diffuse the oxygen across
the alveoli membrane or a right to left shunt in the heart [25].
Histotoxic hypoxia: occurs when the cells are unable to use the oxygen
effectively, despite an adequate oxygen supply. Possible causes include sepsis, cyanide
poisoning and cellular metabolic disorders [25].

34
The fundamental physiological response to hypoxia is local vasodilation. Cells
release vasodilators that promote dilation of arterioles and relaxation of precapillary
sphincters [13] in order to increase blood flow and maybe restore normal oxygen levels.
However, this may have the adverse effect of decreasing systemic vascular resistance
and consequently lower the blood pressure.
The neuroendocrine response (fight-or-flight response) is also activated by the
release by the cell of numerous substances into the bloodstream to protect the body
from the effects of hypoxic injury. This leads to an increase in heart rate and cardiac
output as well as selective vasoconstriction and vasodilation in specific vascular beds to
redistribute circulating volume to vital organs, such as the heart and brain [24]. Lactic
acidosis in the circulation also stimulates chemoreceptors [26] that help maintain
arterial pressure and increase respiratory rate to eliminate the excess acid. These
compensatory mechanisms can however have harmful effects when activation is
continued for a longer time, with reduction of wound healing, cardiac function and
immune response to infection [27].
2.4 Conclusion
Hypoxia is a consequence of the interrupted supply of ATP available for cellular
work and the extent of the consequences of hypoxic injury will depend on the degree of
oxygen deprivation and the metabolic needs of the tissue. It is essential to promptly
detect and correct it in order to avoid progressive tissue dysfunction that can lead to
organ failure [28]. Medical interventions include providing supplemental oxygen and
fluid replacement, but must be directed to treating the underlying cause of hypoxia [23].
It was noted previously that when the neuroendocrine response is activated
some vascular beds are affected by selective vasoconstriction in order to redistribute
circulating volume to vital organs, such as the heart and brain. Splanchnic perfusion
exhibits vasoconstriction in the face of circulatory distress, leaving it susceptible to
hypoxia. In critically ill patients, this will contribute to the development of ischaemia,
sepsis, multiple organ failure and increased mortality. These pathologies will be

35
discussed further, along with the anatomy and arterial and venous vasculature of part
of the upper GI tract. The duodenum, which receives supply from the splanchnic
circulation, will be presented as an option for monitoring the splanchnic circulation for
the detection of hypoxia.

36
Chapter
3
UPPER GASTROINTESTINAL ANATOMY AND BLOOD SUPPLY
The gastrointestinal tract is used in the clinical setting as a site of minimally
invasive monitoring and diagnosis, and procedures like the TOE (trans-oesophageal
echocardiography) have become standard. Furthermore, the splanchnic region
(abdominal gastrointestinal organs, including stomach, liver, spleen, pancreas, small
intestine and large intestine) is known as the “canary of the body” for being more
susceptible to changes in the arterial supply [3] and, so, monitoring this region can yield
further information.
Figure 3.1: Upper GI tract, depicting the location of the stomach and the duodenum (in: https://igehrprodisis.med3000.com/patiented/html/14878.html)

37
This chapter aims to take a closer look at the anatomy and blood supply of this
region and its mechanisms of circulatory control, focusing on the stomach and
duodenum.
3.1 Anatomy of the stomach and duodenum
3.1.1 The stomach
The stomach is the most dilated part of the digestive tract and is situated
between the oesophagus and the duodenum (Figure 3.1), just below the diaphragm in
the mid upper abdomen. In the stomach, food is subjected to grinding and mixing with
strongly acidic gastric juices that aids in the digestion of starch, proteins and
triglycerides, to form the chyme that then is slowly delivered to the intestines. The
sphincter that connects to the duodenum is called the pylorus.
For convenience, the stomach is divided into different areas based on the
structure and cells of their mucosal layer [29]. The cardia is the area adjacent to the
gastroesophageal junction. The fundus is left lateral and superior to the cardia and lies
above the horizontal imaginary line drawn at the level of the gastroesophageal junction.
Inferior to the fundus is the larger central portion of the stomach, the corpus. The corpus
is the area with the largest number of acid secreting parietal cells. It follows the greater
curvature of the stomach until the incisura angularis. The antrum begins where the
corpus ends and extends to the pylorus. The right curved border of the stomach,
extending from the cardia to the pylorus, is called the lesser curvature. The greater
curvature is up to 5 times longer than the lesser curvature as it arches to the left and
upwards from the gastroesophageal junction, up to the level of the 5th left intercostal
space [30], before sweeping downwards towards the pylorus. The stomach is related to
the liver and biliary tree to the right, the spleen to the left, and the pancreas and
transverse colon posteriorly.
3.1.2 The duodenum
The duodenum (Figure 3.1) is the first part of the small intestine and acts as a
reservoir for evacuated gastric chyme. It also plays a part in gastric emptying through

38
release of hormones, in neutralising acidity from the stomach and promoting the
digestion of fats, carbohydrates and proteins by mixing the chyme with enzymatic
secretions and bile [31]. The digestion and absorption process continues in the jejunum
portion of the small intestine before later expulsion of the faeces from the body through
the anus.
The name duodenum, meaning two plus ten in Latin, originated because it is
roughly as long as the width of 12 fingers, 25 to 30 cm [32]. It is curved in an incomplete
circle, enclosing the head of the pancreas and terminates at the duodenojejunal flexure.
The duodenum is divisible into four parts for convenience of description: superior,
descending, inferior and ascending. The first part of the duodenum is located at the level
of the first lumbar vertebra, posteriorly to the liver and gallbladder and anteriorly to the
gastroduodenal artery, the portal vein and the inferior vena cava. Its first 2 cm, known
as the ampulla, for its bulb shape, are the most mobile and resemble the stomach in
that are covered by peritoneum [33]. The rest of the duodenum is retroperitoneal, has
no mesentery and is immobile.
The second part of the duodenum runs inferiorly parallel to inferior vena cava,
curving around the head of the pancreas [34]. The pancreatic duct from the pancreas
and the common bile duct from the liver and gall bladder pierce the duodenum to
deliver enzymatic secretions and bile. The third part of the duodenum runs transversally
to the left passing over the inferior vena cava, aorta and third lumbar vertebra. It is
crossed by the superior mesenteric artery and vein and the root of the mesentery of the
jejunum and ileum [34]. The ascending part of the duodenum runs superiorly and along
the aorta as far as the second lumbar vertebra, where it joins the jejunum at the
duodenojejunal flexure.
3.1.3 Mucosa
The mucosal wall is composed of three basic layers throughout the whole
gastrointestinal tract. Below the surface of the mucosa, lies the lamina propria,
composed of connective tissue rich in capillary blood vessels, lymphatic vessels, elastic
fibres, and a muscularis mucosa, a thin layer of smooth muscle [35], [36].

39
Below the mucosa lies the submucosa, a layer of dense connective tissue of
collagen and elastin fibres containing arterioles and venules, lymphatic vessels and
nerve plexus. Overlying the submucosa lays the muscularis externa, allowing for
differing contractile movements, and a thin connective tissue layer, either called serosa
covering peritoneal organs or adventitia covering retroperitoneal organs [35], [36].
The luminal surface of the stomach is smooth, blood-filled red colour with thick
longitudinal folds, known as rugae. The gastric mucosa surface is composed by a layer
of tightly packed simple columnar epithelial cells which extend down to the lamina
propria where they form secretory glands which open into narrow channels, the gastric
pits [13]. The nature of the epithelial cells that line the gastric glands differs from region
to region of the stomach, from acid-secreting in the body and fundus to gastrin-
producing in the pylorus [35].
In the pylorus, this mucosal configuration of glands and pits changes to villi lined
with absorptive cells, endocrine cells and surrounded by cripts of Lieberkühn [35].
Characteristic of the jejunum, these villi become progressively taller and thinner from
the proximal to the distal duodenum [36]. Besides the ampulla which is smooth and
featureless, the luminal surface forms numerous circular folds, called plicae circulares.
The submucosa of the duodenum is easily identifiable from the rest of the GI tract by
the presence of Brunner’s glands, secreting alkali mucous. The muscularis mucosa of the
duodenum is composed by a layer of inner circular muscle fibres surrounded by a layer
of longitudinally arranged fibres.
3.2 Blood supply to the upper gastrointestinal tract
3.2.1 Arterial blood supply
The arterial blood supply of the gastrointestinal tract is one the most variable in
the human body. A description of the most commonly found arterial pattern follows.
The celiac trunk forms the great majority of the blood supply to the stomach,
duodenum and the rest of the supramesocolonic organs [37]. The celiac trunk arises

40
from the aorta between the twelfth thoracic and first lumbar vertebrae. It gives rise to
the left gastric, hepatic and splenic arteries. The left gastric artery sends branches to the
cardia, as well as the lower oesophagus, to the fundus and to the lesser curvature. It
then descends towards the antrum and pylorus where it anastomoses with the right
gastric artery, a branch of the hepatic artery. The hepatic artery also gives rise to the
gastroduodenal artery that supplies the duodenum and pancreas and terminates at right
epiploic artery which courses along the greater curvature. The left epiploic artery, a
branch off the splenic artery, anastomoses with the right epiploic artery and both bathe
the anterior and posterior walls of the corpus of the stomach. The anterior and posterior
walls at the region of the fundus receive branches from the short gastric arteries, which
also originates from the splenic artery [38].
Figure 3.2: Blood supply of the stomach (in: http://musom.marshall.edu/graphicdesign/ibooks/Gastrointestinal%20Normal.html)
The arterial supply of the duodenum is determined by embryonic development.
The first part of the duodenum and the second part, up to the bile duct opening, is
supplied by branches of the celiac trunk that feeds the foregut organs – stomach and
oesophagus. From the celiac trunk arises the gastroduodenal artery, branching into the

41
superior pancreaticoduodenal artery which gives anterior and posterior branches to the
duodenum [35].
The rest of the duodenum receives blood from branches of the superior
mesenteric artery that also bathes the midgut – small intestine and pancreas. The
inferior pancreaoduodenal artery, a branch of the superior mesenteric artery, gives
anterior and posterior branches to the duodenum, anastomosing with the analogous
branches deriving from the superior pancreaticoduodenal artery [35].
Figure 3.3: Blood supply of the duodenum (adapted from: http://web.uni-plovdiv.bg/stu1104541018/docs/res/skandalakis%27%20surgical%20anatomy%20-
%202004/Chapter%2016_%20Small%20Intestine.htm)
3.2.2 Venous blood drainage
In the stomach, the capillary network in the lumen drains into mucosal venules
at the level of the lamina propria and into the submucosal venous plexus. The stomach

42
is then drained by 5 veins – the right and left gastric, the right and left gastroepiploic
and the short gastric veins – into the portal vein, like the lower oesophagus.
In the duodenum, submucosal and intramural veins give rise to
pancreaticoduodenal veins, which drain into the portal vein either directly or through
the superior mesenteric or splenic veins [34].
3.3 Regulation of blood supply
The arterial tree that supplies the splanchnic region is known to be innervated
by fibres of the sympathetic division of the autonomic nervous system [36], [39]. In the
gut, sympathetic activation of the alpha adrenergic receptors results in constriction of
the smooth muscle that encircles the blood vessels reducing local arterial blood flow.
The systemic nervous system favours physiological changes that support
vigorous physical activity and rapid production of ATP [13]. In situations of physical or
emotional stress, the hypothalamus sends nerve impulses that activate the entire
systemic nervous system producing the neuroendocrine response. It promotes
physiological changes including an increase in heart rate and cardiac output, increase in
breathing rate and bronchial dilation, dilation of pupils, release of glucose from liver and
dilation of blood vessels to the heart and skeletal muscles, organs involved in fighting a
foe or fleeing a predator. Functions that favour storage of energy are reduced and the
fight-or-flight response results in vasoconstriction of the cutaneous, renal and
gastrointestinal vascular beds. This allows redistribution of the cardiac output to cope
with the metabolic demands of vital organs, such as the heart and brain. The adrenal
medulla, also stimulated by the hypothalamus, releases cathecolamine hormones
(epinephrine, norepinephrine and dopamine) into the bloodstream, supplementing and
prolonging the fight-or-flight response. Adrenergic receptors also bind to both
epinephrine and norepinephrine [13]. The reduction in blood flow to the kidneys
promotes the release of renin which enters the renin-angiotensin-aldosterone pathway
to convert angiotensin I to angiotensin II. Angiotensin II is a strong peptide
vasoconstrictor and affects the splanchnic circulation more consistently than other

43
vascular beds [39]. Another important peptide hormone in the stress response is
vasopressin. It is synthetized in the hypothalamus but stored in the pituitary gland to be
released in response to hypovolaemia. It acts to constrict vascular smooth muscle and
increase its responsiveness to cathecolamines [40].
The splanchnic organs, except the spleen, exhibit some moment to moment auto
regulation in the face of changes in the supplying systemic system [41]. Two regulatory
mechanisms, the myogenic and the metabolic, have been proposed to explain the
intrinsic ability of the gastrointestinal tract to regulate its vasculature tone. The
myogenic response is based on the Young-Laplace equation for wall tension that relates
internal pressure to the radius of the vessel [7]. A sudden increase in vessel diameter
due to an increase in supplying arterial pressure would lead to contraction of vascular
smooth muscle (vasoconstriction), and vice versa, in order to keep blood flow relatively
unchanged [42]. The metabolic mechanism, on the other hand, is based on the
experimental evidence of a vasodilator by-product of cell metabolism in result of an
imbalance in oxygen demand/supply, as mentioned in section 2.3 [36]. The subsequent
increases in blood flow and capillary surface area would tend to increase oxygen supply
to tissue, restoring O2 homeostasis.
The region’s large capacity to adapt may stem from its important role in the
regulation of circulating blood volume [43]. When faced with a reduction in blood flow,
splanchnic oxygen extraction can increase up to 90% so as to maintain the cells’ normal
metabolic processes, even though the gut may be may already be hypoxic when
extraction approaches 70% [43].
However, it has been shown that this ability to regulate both blood flow and
oxygen extraction is overpowered by sympathetic nervous activity [44], leaving the gut
vulnerable to developing hypoxia in the face of circulatory complications at an earlier
stage than the rest of the body. It is also one of the last vascular beds to regain adequate
flow [45].
3.3.1 Inadequate perfusion of the splanchnic region
At very low rates of blood flow, the diffusion rate of oxygen to the cells reaches
a critical low level at which point mitochondrial O2 uptake is compromised [7], [36]. This

44
condition is known as ischaemia and is characterized by flow dependant oxygen
consumption, oxygen deficit and anaerobic metabolism with its resulting fall in cellular
pH, lactic acidosis and changes in AtP/ADP [39]. The severe hypoxia that ensues has
adverse effects on the secretory, absorptive and motor activity of the gastrointestinal
tract [7], ultimately contributing to a dysfunctional mucosal barrier. Injury of the luminal
mucosa starts within minutes of the onset of ischaemia and within 30 minutes can lead
to the translocation of viable bacteria and toxins into the surrounding sterile tissues [3],
[4], [39]. In addition to becoming a potential source of infection and activating the
immune response, this may also trigger the inflammatory response.
Migration of toxins and macrophages to distant sites such as the heart, lungs and
kidneys results in tissue injury and distant organ dysfunction. Along with systemic sepsis,
these are all components of the multiple organ failure (MOF) syndrome [39]. Evidence
of gut ischaemia is found in 80% of the patients with MOF [39], which has a mortality
rate of 60% [46].
In terms of the circumstances that cause oxygen delivery to fall below the
metabolic needs of tissue, the most common types of ischaemia seen in critically ill
patients are known as the non-occlusive and relative ischaemia. The third type, the
occlusive type, is mostly the result of an embolus or thrombosis.
Relative ischaemia is caused by an increase in the metabolic need for oxygen
beyond that being delivered [39] and it can be seen in sepsis. Sepsis is the systemic
inflammatory response syndrome (SIRS) in the presence of an infection, mainly
bacterial, but can also be of fungal or viral origin [39]. It is thought that the inflammatory
response leads to a change in plasma which induces mitochondrial dysfunction,
oxidative stress and apoptosis [47]. Since the mitochondria are responsible for
synthesizing ATP, its impairment will eventually lead to cell damage and tissue injury in
septic patients. Sepsis is accompanied by abnormal temperature and white blood cell
count and characterized by hypotension, decreased vascular resistance, high cardiac
output and altered blood coagulation [48]. Ischemia occurs despite the supranormal
delivery of oxygen. As the infection becomes more severe, the release of harmful toxins

45
from ischemic tissues causes further deterioration of the circulatory system and acute
organ dysfunction [48].
Non-occlusive ischaemia is caused by low blood flow and is seen in patients in
shock. Shock is a life threatening medical condition characterized by hypotension. The
delivery of oxygen and nutrients to tissue becomes inadequate resulting in reduced
metabolism and cell damage, eventually leading to tissue ischaemia. Sympathetic
activity and other factors compensate for the deterioration of the circulation. The
intense vasoconstriction of the splanchnic bed results in an increase of the effective
circulating volume and increase in systemic blood pressure, in what is known as
“autotransfusion” [39].
The most common causes of shock are sepsis (septic shock), low pump function
of the heart (cardiogenic shock) and low circulating volume (hypovolaemic shock). In
sepsis the release of inflammatory mediators from damaged cells causes vasodilation
and blood pooling [49]. Shock will become established if, in addition to the lowered
systemic vascular resistance, there is a fall in venous return and cardiac output, even
within the normal range. The consequent fall in blood pressure is the primary
physiological marker of the haemodynamic component of shock and, along with
inhomogeneous redistribution of blood flow, contributes to inadequate oxygen delivery
to some tissue beds. The splanchnic vascular bed is selectively underperfused in shock
and may have a pivotal role in the development of MOF.
Cardiogenic shock results from impaired cardiac function. Cell hypoxia and
hypoglycemia become increasingly more severe eventually leading to cardiac arrest.
Hypovolaemic shock is seen in trauma or massive gastrointestinal haemorrhage.
The decrease in intravascular volume causes the venous return to the heart to become
inadequate. Endogeneous cathecolamines are released in an attempt to compensate for
the lowered cardiac output, and up to 25% of volume reduction can be compensated for
[46]. However sympathetic stimulation is unable to maintain mean arterial pressure
when the loss of intravascular volume is prolonged or severe. Shock ensues with a
significant systemic inflammatory component initiated by the release of inflammatory

46
mediators by an ischaemic gut, resembling the effect of septic shock. This response can
be minimized by rapid and adequate resuscitation [46].
The hormonal, metabolic and inflammatory response in critically ill patients is
proportional to the magnitude and duration of the stress of trauma, surgery or severe
medical illness [50]. In patients, whose cardiorespiratory function is compromised, the
delivery of oxygen and nutrients is unable to meet the increased requirements [48] and
tissue is more susceptible to developing ischaemia.
3.4 Conclusion
The splanchnic region plays an important role in the regulation of circulating
blood volume and systemic blood pressure: along with peripheral tissue, it shows
intense vasoconstriction, regulated by sympathetic activity and the release of
endogenous hormones, during stress, facilitating redistribution of blood volume and
blood flow to vital organs. The resulting hypoxia renders the gut mucosa susceptible to
damage and bacterial translocation, ultimately contributing to immunological
impairment, sepsis, shock and the development of multiple organ failure.
Monitoring this region is therefore vital in order to prevent or limit the degree
and duration of these ischaemic episodes and optimize clinical treatment.
The next chapter will summarize the theory, advantages and disadvantages of
some of techniques in research or currently employed in the clinical setting in the
measurement of upper gastrointestinal tissue perfusion, focusing on intraluminal,
minimally invasive methods.

47
Chapter
4
CURRENT TECHNOLOGIES FOR MONITORING PERFUSION OF THE
GASTROINTESTINAL TRACT
The adequacy of global perfusion and oxygenation has been conventionally
assessed by measuring vital signs, urine output, cardiac output, global oxygen delivery
and chemical indicators of metabolic activity such as arterial pH or lactate concentration
in the blood [51], [52]. However, optimizing parameters of global perfusion does not
guarantee that the oxygen is actually delivered to any specific microvascular bed or the
tissue that it serves, and studies have revealed the gut to be particularly sensitive to
ischaemia [4], [52]. Gastrointestinal mucosal perfusion deficits have been associated
with hypoxic injury and decrease in barrier function, ultimately leading to systemic
inflammatory response and multiple organ failure [53]. Techniques such as angiography,
either visceral or CT (computed tomography) or MR (magnetic resonance) based
reconstruction methods, provide only anatomical vessel information and possibly
assessment of blood flow in major veins [6]. Even though these may allow identification
of splanchnic stenosis, which causes vasoconstriction and occlusive ischaemia,
information on actual ischaemia is imperative.
In current practice, it is the subjective visual analysis and judgement of colour by
the surgeon that is considered the gold standard to determine splanchnic
microcirculation viability [54]. There is a need for a reliable, quantitative method for
assessing splanchnic perfusion to identify patients at highest risk of ischaemic organ
failure and death and/or guide therapeutical interventions and resuscitation.

48
The gastrointestinal tract is readily accessible and may provide crucial
information about perfusion of the rest of the gastro-splanchnic bed. This chapter
provides an outline of the techniques that have been evaluated for intraluminal
monitoring of perfusion of this region and their limitations, focusing on studies within
the stomach and duodenum.
4.1 Polarographic sensors
The polarographic PO2 electrode has been considered the gold standard for
measuring tissue partial oxygen tension (PtO2) [55]. The electrode can be inserted into
the submucosa layer with a needle or catheter electrode or placed on the surface of
tissue with an array of electrodes [56]. It gives a direct quantitative measurement of the
average PO2 of tissue cells, capillaries and larger blood vessels in the vicinity of the
electrode, providing an assessment of tissue perfusion and oxygen consumption [56],
[57]. The literature provides PO2 values for normoxia and hypoxia for different organs,
and these are used to evaluate the metabolic state of the organ. However, the
functionality and the dynamic blood flow distribution for the different organs must be
taken into account for correct interpretation of tissue oxygenation data [55].
Figure 4.1: A Clark electrode, temperature sensor included for temperature correction of measurements (in: http://www.laserfocusworld.com/articles/2008/03/bioprocess-monitoring-
photonics-takes-a-new-look-at-bioprocesses.html)
Davies and Brink were the first to apply O2 polarography to animal tissue [58].
Clark and colleagues have greatly improved the technology and the Clark electrode has
become mainstream. The Clark electrode is based on the reduction of oxygen to

49
hydroxyl ions (OH-) when exposed to a polarizing voltage of 0.7 V [21]. It consists of a
platinum cathode and a silver anode immersed in a potassium chloride solution and
covered by a polypropylene oxygen-permeable and electrically insulating membrane. A
schematic of a Clark cell can be seen in Figure 4.1. Oxygen diffuses through this
membrane at a rate proportional to its partial pressure and undergoes reduction at the
cathode. The current generated between the two electrodes will also be proportional to
the oxygen tension in the sample. To aid O2 migration to the skin surface, the sensor is
heated to 42-45°C, dilating capillaries, decreasing O2 solubility and shifting the
oxyhaemoglobin curve to the right [58]. Miniature Clark-type electrodes were used by
Kram and colleagues to measure oxygen tension in the surface of brain, liver,
gallbladder, stomach, jejunum, ileum, colon and kidney of 10 patients during invasive
surgery [59]. They have found it to be a repeatable and practical method to assess local
oxygen delivery. Values were dependant on both arterial oxygen partial pressure and
local blood flow, providing a good assessment of tissue perfusion. A precision thermistor
corrected the Clark electrode temperature dependant variations.
After oesophagectomy, there is a significant risk of development of anastomotic
leakage due to ischemia. Cooper and colleagues have measured changes in tissue
oxygen tension in the gastric fundus adjacent to the site of anastomose, in eight patients
undergoing the procedure [60]. It was noted that PtO2 was halved after mobilization of
the stomach while there was no significant change in arterial oxygen concentration,
mean arterial pressure or oxygen delivery. Devascularisation was found to be the most
important surgical determinant of gastric tissue oxygen tension. Also focusing on the
influence of tissue oxygenation on anastomotic healing, Jacobi and colleagues used a
Clark-type oxygen electrode for submucosal measurements in 33 patients undergoing
oesophagogastrostomy [61]. To avoid dislocation for 84h after the operation, the
electrode was fixed to the skin by a single microclip. There was no significant decrease
of PtO2 during the operation, besides after mobilization, akin to the results from the
study by Cooper and colleagues. Postoperatively, patients with anastomotic leakage
showed a significant increase in PtO2 levels, suggesting a disorder in O2 consumption. It
was noted that, due to individual differences, it would be more accurate to assess the
adequacy of tissue perfusion by analysing PtO2:PaO2 ratio instead.

50
The main drawback of these oxygen electrodes is their limited area of
measurement, with penetration depths of about 15µm [56]. PO2 measurements must
be made at multiple sites in order to detect hypoxic areas in tissue. The use of a needle
electrode is invasive and may potentially lead to tissue damage or an infection.
Calibration is another downfall of this method. It requires a sample being drawn from
the tissue in observation and analysed in vitro in a blood gas analyser [21]. Technical
developments have helped in this area, but the sensor used by Kram and colleagues
needed a 20 minute procedure for preparation and a 2 point calibration using a sterile
solution and room air [59]. A temperature sensor is usually included in the electrode to
correct for temperature variations [60].
Although the polypropylene sheath helps to some extent, the tip of the electrode
needs to be kept clean [21] as coagulating blood on the surface of the electrode will
interfere with the results. Acquisition time is prolonged to ensure stabilization of the
electrode and the assessment can take up to 45 minutes [58]. The other downfall is that
with this method oxygen is consumed in the process of measurement.
4.2 Gastric tonometry
Gastric tonometry has been developed as a minimally invasive method of
monitoring the adequacy of perfusion of the gastrointestinal tract using measurements
of local mucosal carbon dioxide tension (PCO2). Tonometry is based on the physiological
principle that during ischemia, anaerobic cellular metabolism will lead to increased
carbon dioxide tension in the tissue. When the level of oxygen delivered is inadequate,
the rate of synthesis of the energy carrying molecule ATP fails to meet the demands of
tissue [62]. By-products of ATP hydrolysis, that would be consumed during synthesis
from oxidative phosphorilation, start accumulating including ADP, inorganic phosphate
and hydrogen ions [63]. Acidity in the cell is locally buffered by bicarbonate ions resulting
in an increase of CO2 levels [6], [64]. An alternative or additional explanation for this
increase is that there may be an inadequate washout of CO2 due to low blood flow [64].
By the diffusion theory, the PCO2 of the lumen of hollow visceral organs is assumed to

51
be in equilibrium with the PCO2 of the surrounding tissue, and an increased intraluminal
PCO2 may therefore indicate impaired perfusion of the mucosa.
The gastric tonometer consists of a catheter with a gas permeable silicon balloon
located at its tip. It can be inserted nasogastrically or rectally into the gut lumen. Figure
4.2 shows the tonometer catheter in place. Traditionally, the balloon is filled with saline
solution. CO2 diffuses from the intraluminal space and equilibrates through the semi
permeable membrane of the balloon. After an equilibration period, this fluid is
withdrawn and tested using a blood gas analyser. This procedure is both personnel
intensive and time consuming, with an equilibration period of 30 to 90 minutes [65],
[66] making this method less responsive to rapid changes in splanchnic perfusion.
Normal saline has no buffering ability and CO2 is easily lost if not dealt with
anaerobically. Furthermore, due to instability of carbon dioxide in saline solution,
certain blood gas analysers will consistently underestimate the PCO2 by as much as 60%
[67]. Air has since replaced saline solution as the tonometric medium; it is pumped
through the balloon and through an external closed circuit where the PCO2 is
determined by an infrared detector on a semi-continuous base [52]. With an
equilibration period within 20 to 30 minutes [64], [68] this may still not be an adequate
response time.
Figure 4.2: Gastric tonometer in place; note the inflated balloon (in: http://www.clinicalwindow.liitin.net/cw_issue_02_article5.htm)
From the measurement of PCO2 with the tonometer it is possible to derive an
index of gastric mucosal pH (pHi) using the modified Henderson-Hasselback equation:
Tonometer
balloon

52
𝑝𝐻𝑖 = 6.1 + 𝑙𝑜𝑔10 [
𝐻𝐶𝑂3−
𝑃𝐶𝑂2 (𝑠𝑡𝑒𝑎𝑑𝑦−𝑠𝑡𝑎𝑡𝑒) × 0.03]
Equation 4.1
, where 6.1 is the pK (logarithm of dissociation constant) for the HCO3-/CO2 system in
plasma at 37°C, and 0.03 is the solubility of CO2 in plasma at that temperature [63]. The
measurement of arterial bicarbonate is obtained from an arterial blood gas sample.
However, there are concerns over the validity of the calculated value for pHi and
discrepancies have been found under some physiological conditions [63]. The
Henderson-Hasselback equation assumes the value of PCO2 in the intraluminal space to
be in equilibrium with the mucosal PCO2 and that arterial bicarbonate level equals that
of the gastrointestinal mucosa, which is valid for stable physiological conditions but may
be affected in situations of low flow or no flow [62]. Assessment of the gradient between
gastric PCO2 and arterial PCO2 or end tidal PCO2 has been proposed as a more reliable
index of gastric perfusion [64], [67]. Known as the PCO2 gap, it accounts for the
influences of respiratory dysfunction and metabolic abnormalities [63], correcting the
effect of systemic PCO2 and pH on gut PCO2 [67].
Gastric tonometry has demonstrated a good accuracy in estimating perfusion of
tissue when compared to other extensively used parameters such as cardiac index [65],
mean arterial blood pressure, base excess or arterial pH [69]. It has been shown to be a
useful prognostic tool [52], [65], [70], providing clinicians with an opportunity to limit
the degree and duration of cell hypoxia [62]. However, enteral feeding and gastric
secretion may cause an increase in CO2 production by titration of acid with bicarbonate,
thereby introducing additional errors to the assessment of gastric PCO2 [52], [71]. Many
clinicians administer drugs to suppress gastric acid secretion and prevent back diffusion
of CO2 but in the process risking a possible increase in bacterial overgrowth and
increased risk of infection [63]. In order to avoid this problem, some researchers have
suggested using other monitoring sites, in particular the oesophagus [72].
Gastric tonometry is the only practical technique for assessing gastrointestinal
perfusion that is approved for clinical use [64]. As PCO2 is directly linked to blood flow,
tonometry is a useful prognostic tool to detect hypovolaemia, but may not be valid in
states of shock, when blood flow is normal or elevated [52], [73].

53
There seems to be no published articles on tonometry on the duodenum but it is
important to note Walley’s work on small bowel tonometry [74]. Walley and colleagues
have studied 10 pigs subjected to progressive haemorrhage plus 5 control pigs at 30
minute intervals where gastric tonometry, small bowel tonometry and other
heamodynamics parameters were evaluated. In most of the animals, it was found that
gut anaerobic metabolism occurred before whole body anaerobic metabolism, with
small bowel tonometer PCO2 increasing prior to the onset of anaerobic metabolism. It
was also found to be closely related with superior mesenteric vein PCO2. Gastric PCO2
results, on the other hand, were less reliable, with the critical PCO2 gap (difference
between tonometric reading and arterial PCO2) to be greater and have more inter-
animal variability, making it an inferior method for detecting gut hypoperfusion.
4.3 Laser Doppler flowmetry
Laser Doppler flowmetry (LDF) has emerged as a valuable tool for perfusion
monitoring because of its non-invasive nature and the ability to yield continuous and
real time measurements of microvascular blood flow. Microcirculation is composed of
the capillaries that deliver oxygen and nutrients to cells and the other vessels –
arterioles, venules and arteriovenous anastomoses – that feed and drain the capillary
network and play an important role in regulation of temperature. LDF is very versatile
and has been used to evaluate capillary blood flow in the gastrointestinal tract, kidney,
myocardium, skeletal muscle, bone, teeth, retina, skin and brain in experimental and
clinical situations [75].
LDF relies on the Doppler Effect. When coherent light is directed towards a tissue
and encounters a moving object, such as a red blood cell, the reflected photons undergo
a change in frequency, called a Doppler shift. The velocity at which blood cells are
moving is in the order of millimetres per second in the microcirculation. This gives rise
to a minute Doppler Shift of about 10-11 times smaller than the frequency of incident
light [76]. Laser light makes the ideal light source for this application as it is highly
monochromatic.

54
The laser Doppler flowmetry probe uses an emitting optic fibre bundle which
applies laser light to the tissue and a receiving optic fibre bundle returns the reflected
light for analysis. The distance between transmitting and receiving fibres (usually 0.25
mm), the wavelength of the laser light and the characteristics of tissue determine the
penetration depth: for human skin it is of 1 to 2 mm, but in the GI tract may be up to 6
mm [76]–[78].
The optical mixing of frequency shifted light and non-frequency shifted light give
rise to a photocurrent. The magnitude and frequency distribution of this photocurrent
carries information on speed and concentration of the moving blood cells traversing the
scattering volume [79]. Rather than overall tissue blood flow, it determines the flux of
red blood cells, measured in arbitrary perfusion units. The signal may exhibit vasomotion
oscillations with a rate of 10 to 25 oscillations per minute [80] due to microvascular
processes such as myogenic or neurogenic related metabolic activities [76].
Prior to clinical use, the system can be calibrated by immersing the distal tip of
the probe in a reference solution to read 0 and 250 perfusion units [77]. As this can be
a cumbersome procedure, flux is sometimes expressed as a relative change from
baseline [81].
LDF has been used as a quantitative, reproducible method for assessment of
blood flow and perfusion to determine organ viability. Studies in animals have shown an
almost linear correlation between the laser Doppler signal and the blood perfusion of
feline small intestine segments [82] and of the stomach of dogs with gastric dilatation-
volvulus [75]. Sigurdsson and colleagues monitored the blood flow in the kidney, liver,
pancreas and gastric, jejunal and colonic mucosa in anaesthetized pigs during surgery
and haemorrhagic shock [80]. It was found that the oscillations, characteristic of the
laser Doppler flowmetry signal, were unrelated to central haemodynamic parameters,
respiratory movements or level of anaesthesia and that they disappeared during severe
blood loss and during administration of cathecolamines. This suggests that these
oscillations are indeed locally mediated and that these auto regulatory mechanisms are
disrupted by states of shock.

55
Leung and colleagues have monitored laser Doppler flowmetry on the
duodenum of 27 rats [83]. The group showed it correlated with hydrogen gas clearance,
another method of assessing blood flow. The animals were subjected to reduced
perfusion due to haemorrhagic hypotension, or hyperaemia due to perfusion with
hydrochloric acid. They also found the values of laser Doppler flowmetry varied in
relation to the dose of acid used, but not in the long term (30 minutes), suggesting a
transient rather than permanent acid effect on the mucosa of the duodenum of the rats.
In humans, LDF has shown 100% sensitivity and 92.9% specificity in determining
viability of intestine [75]. Kvernebo and colleagues have examined blood circulation in
six areas of the stomach, in the distal oesophagus and the duodenum in 34 healthy
patients [82]. The regional differences in the microcirculation network and blood flow
can be observed in Figure 4.3.
Figure 4.3: Regional circulatory difference in the stomach and lower oesophagus. The mean value is shown with 95% confidence interval [82]
The group described not only vasomotion oscillations in their signals but also
fluctuations synchronous with the heart rate, respiration and peristalsis.
Limitations of LDF include the small sampling area and the necessity of contact
between the probe and the tissue being sampled, which may influence local perfusion.
Whilst heavy pressure may cause reduction in the flux value, no contact resulted in noisy
recordings from movements of the gastric wall, respiration or motion artefact [82]. The
angle of the probe to the tissue is usually kept between 0 to 60° from the perpendicular
axis [82]. The sampling volume of the laser Doppler probe is dependent upon its

56
geometry, but is usually 1mm3 [76]. Single measurements may not be representative of
overall perfusion.
Scanning Laser Doppler Flowmetry (SLDF) appears to address these limitations
of single-point measurement. A collimated laser beam scans the tissue area and the
reflected Doppler shifted beam is received by a series of mirrors [70]. Thousands of
individual measurements of tissue perfusion are made and converted into a colour
coded image (colour perfusion image map).
Boyle and colleagues have studied the stomach of 16 patients undergoing
oesophagectomy. Recorded scanning laser Doppler images show large falls in perfusion
in all parts of the stomach following mobilization, not noticeable to the surgeon’s eye
(Figure 4.4) [70]. No significant differences in pulse rate, mean arterial pressure or
central venous pressure were detected. Acquisition time is approximately 4 minutes per
scan which may be too long to obtain information on certain dynamic processes. Also,
the probability of movement artefacts increases with acquisition time.
a) b)
Figure 4.4: Colour perfusion image map using SLDF of the stomach before mobilization (a) and after mobilization (b). Before mobilization, the recorded levels of perfusion were uniform in the three regions of interest defined in the images. Following mobilization, there were large
falls in the recorded perfusion detected in all parts of the stomach.[70]
4.4 Pulse oximetry
Pulse oximetry provides non-invasive continuous monitoring of arterial blood
oxygen saturation (SpO2), using a combination of spectrophotometry and
photoplethysmography (PPG). Its efficiency and affordability has made it a standard of

57
care present in most operating theatres, intensive care units and during transport of
critically ill patients [8].
Figure 4.5: Handheld commercial pulse oximeter (in: http://ari-cn.com/pulse-oximeter-c-29.html)
Like other oximetry spectrophotometric techniques, pulse oximetry operates on
the principle that the absorption spectra for oxygenated haemoglobin and
deoxygenated haemoglobin are different [84]. Based on Beer-Lambert’s law, it is
possible to determine the concentration of these absorbers by shining light of two
specific wavelengths through a vascular tissue bed. The light emerging from the skin is
detected by a photodetector mounted either opposite or side by side to the light
sources. It is assumed that the pulsatile photoplethysmographic (PPG) signals
synchronous with the cardiac cycle are attributable only to the arterial blood component
[9], [85].
Currently available pulse oximeters use 660 nm in the red region of the spectrum
and 880 nm in the infrared region to estimate the percentage of oxygen bound to
haemoglobin from the ratio of absorption of light at these two wavelengths. Known as
the ratio of ratios, it divides the pulsatile (AC) component for the PPG by the
corresponding non pulsatile (DC) component [84]:

58
𝑅 =𝐴𝑅
𝐴𝐼𝑅
=(
𝐴𝐶𝐷𝐶)
𝑅
(𝐴𝐶𝐷𝐶)
𝐼𝑅
Equation 4.2
Calibration of pulse oximeters is done by experimentally derived calibration
curves relating the functional haemoglobin saturation to the ratio of ratios.
Pulse oximetry has demonstrated good accuracy in measuring arterial oxygen
saturation in the stomach and other splanchnic organs. Garcia-Granero and colleagues
have used in situ photoplethysmography to assess the perfusion of the stomach,
duodenum, jejunum and colon of 22 mongrel dogs during midline laparotomy [86]. With
progressive external compression being applied to the organ surface, it was found that
perfusion values decreased progressively and were linearly correlated to arterial
pressure, at a higher index for the stomach and duodenum than for the more distal parts
of the gastrointestinal tract. Since the compression periods were short in this study,
there was no time for the autoregulatory response to ischemia to be triggered.
Servais and colleagues set out to develop a wireless pulse oximetry probe to
monitor intra-operatively tissue oxygenation [87]. Their device, WiPOX, was tested in
the stomach, intestines and kidneys of anaesthetized rats and swine, with high accuracy
compared to commercially available pulse oximeters, before being used in human trials.
They found pulse oximetry to allow detection of early ischemia, despite tissue appearing
normal to the surgeon, and that body fluids, such as blood, ascites or bile, didn’t
interfere with the oximeter accuracy. Hickey and colleagues have also obtained good
quality PPG signals from the large bowel, small bowel, liver and stomach during open
laparotomy [5]. Measurements were done using a handheld fibre optic pulse oximetry
sensor in 17 human patients.
These studies have shown pulse oximetry to be a useful tool for the intra-
operative assessment of splanchnic perfusion and ischemic tissue detection. However
they rely on a highly invasive procedure – open laparotomy – for access to the target
organ. A less invasive technique that allows not only intraoperative monitoring but also

59
pre-operative diagnostic and assessment, and prolonged postoperative monitoring
would be invaluable. Intraluminally monitoring could provide a possible alternative.
In July 2014, after the patient trials described later on in this thesis took place,
Jacquet-Lagrèze and his team published an article describing a PPG sensor for evaluation
of duodenum mucosal perfusion [88]. It was tested in 13 piglets, 7 of which received an
infusion of Ringer’s lactate solution with a suspension of live Pseudomonas aeruginosa,
in order to induce septic shock.
a)
b)
Figure 4.6: a) Tip of the monitoring device. 1 - enteral feeding tube, 2 – inflatable cuff, 3 - PPG sensor. b) Photograph of the monitoring device [88]
The monitoring device was based on an enteral feeding tube with designated
lumens for aspiration of gastric contents and delivery of nutrients and/or drugs (Figure
4.6). The photoplethysmographic sensor was located in an inflatable balloon near the
tip of the tube. The sensor consists of a 905 nm infrared emitter 12 mm apart from a
photo detector. The monitoring device also included a pressure sensor allowing for safe
inflation of the balloon. Even though the cuff allows for a good contact between the
sensor and the mucosa, it was inflated for 5 minutes every 6 minutes which can
introduce artefact at important time points.
The PPG device was inserted in the duodenum of the piglets following a median
laparotomy and gastrostomy. A laser Doppler probe was also positioned on the serosa
of the intestinal wall a few centimetres distal to the inflatable balloon of the PPG device.

60
Parameters were recorded every 15 minutes for over 2 hours. It was found that during
septic shock there was a significant decrease in AC and DC PPG amplitudes. The PPG
parameters were correlated to the laser Doppler signal and to blood lactate levels,
especially at 60 minutes after infusion. However, there was no correlation with global
circulation parameters (heart rate, mean arterial pressure and cardiac index). Actually,
it was shown that decreases in the AC and the DC PPG signals preceded the decrease in
mean arterial pressure.
Jacquet-Lagrèze and colleagues acknowledge the fact that they resorted to
gastrostomy instead of taking advantage of the less invasive capabilities of their device.
Even though their study required a laparotomy for use of the laser Doppler, the PPG
monitoring device could have been inserted via the mouth of the piglet and threaded
through the GI tract to its final position in the duodenum avoiding extra surgical
procedures and the risks associated with them. Also, the sensor appears to have been
developed as a possible alternative to laser Doppler, and the group points at the
pulsatile PPG signal’s sensitivity to heamodynamic changes and the possibility for it to
reflect microcirculation. There was no justification given to the absence of a second
emitter wavelength and thus negating the possibility of further oximetric analysis.
More recently some groups have expanded the research of pulse oximetry into
the application of different wavelengths. It has been shown that near infrared radiation
penetrates deeper into biological tissue and that carboxyhaemoglobin has a small
optical absorption in this range, which would result in minimal interference to pulse
oximetry calculations [89]. López Silva and colleagues have developed a transmittance
pulse oximetry system employing 750 and 850 nm to the mesentery root, mesocolon,
gastric wall and aorta of one large white pig during laparotomy [90]. It was found that
the signals from the aorta had the greatest amplitudes comparing to the other sites.
There was a gradient in the amplitude of the pulsating component from the aorta to the
gastric wall, mesocolon and mesentery root that can be attributed to a physiological
decrease in pressure with distance to the heart or to differences in optical response of
each tissue. Fast Fourier transform (FFT) analysis has shown a peak frequency around
the heart rate in all cases, while respiratory frequency was seen only in the aorta. A

61
frequency peak, higher than the respiratory rate, seen in the gastric wall, was linked to
peristaltic movements.
4.5 Visible light spectroscopy
Visible light spectroscopy (VLS) is a more recently introduced oximetry
spectrosphotometric method for detection of hypoxaemia and ischemia. As the name
suggests, employs only a visible portion of the spectrum to measure the concentration
of each of the major forms of haemoglobin (oxyhaemoglobin, deoxyhaemoglobin and
optionally methaemoglobin and carboxyhaemoglobin). 476 to 584 nm (blue to yellow
light) penetrates the skin by approximately 1 mm within the capillary bed [54], [91]. This
allows for a measured saturation more closely related to tissue oxygen saturation. VLS
shares the pulse oximetry qualities of non-invasiveness, continuous measurements and
affordability.
Friedland and colleagues developed a fibreoptic catheter based VLS oximeter to
be inserted in the accessory channel of an endoscope [92]. This device was used in 30
healthy volunteers and in 3 patients diagnosed with chronic mesenteric ischemia
treated by percutaneous stenting to evaluate GI mucosal perfusion. Measurements
were made from the oesophagus, stomach, duodenum, jejunum and colon. It was found
that normal mucosal saturation was 72% in the stomach and 66% in the duodenum. The
measurements taken before stenting intervention were statistically different, as low as
19% in the second part of the duodenum of the second patient; this value increase to
51% post-stenting. The application of oximetry to confirm the success of endovascular
treatment shows the versatility and importance of these techniques to monitor
perfusion of the GI tract. However, Friedland and colleagues decided for taking
measurements at a specific times (namely pre and post-stent) and did not demonstrate
the possibilities of continuous monitoring.

62
4.6 Conclusion
There is a trend towards less invasive techniques, to provide safer bedside
monitoring and allow a more precise earlier detection of organ dysfunction [56]. The GI
tract is readily accessible and already a fundamental monitoring site in current daily
practice. It is no wonder different intraluminal techniques have been developed to
assess the perfusion of the splanchnic region. Not only do they have an advantage over
the very invasive laparotomy based procedures, all have been reported to produce
accurate results. However, they inherently have limitations when it comes to the
technique used for measurement or calibration procedure needed. Both polarographic
sensors and gastric tonometry require an extended period of time for equilibration of
electrodes, during which valuable information about certain physiological processes
could be lost. Calibration for the polarographic sensors involves drawing blood and a
temperature sensor needs to be included for temperature variation corrections.
Technology advances have greatly improved the gastric tonometry technique allowing
for measurements to be made semi-continuously, after equilibration, and it has become
the only technique available for clinical use. However it measures tissue pH, which may
be influenced by disparate mechanisms unrelated to perfusion [87]. Laser Doppler
flowmetry has shown good promise but it is an indicative of blood flow and not
oxygenation of the tissues. It is also limited by arteriovenous shunting, which causes
non-nutrient flow [87].
Pulse oximetry has become a widely accepted method for estimation of oxygen
for its simplicity, for being inexpensive and not requiring calibration. It has proven to be
reliable in measurements within the gastrointestinal tract and for that reason it is the
chosen technology for evaluation of the perfusion of the duodenum in patients
undergoing elective open laparotomy.
63
Chapter
5
PULSE OXIMETRY
The principle of pulse oximetry was conceived in 1972 by Japanese bioengineer
Takuo Aoyagi. It relies on the difference in absorption spectra of oxygenated and
reduced haemoglobin and on the pulsatile nature of arterial blood to selectively
measure the arterial blood oxygen saturation of living tissue [21], [93].
Before that, World War II had seen the biggest advances in the measurement of
blood oxygenation brought on by the needs of military pilots. In 1940 J.R. Squire
developed an oximeter for use on the web of the hand. It addressed the problem of
differentiating arterial blood by mechanical compression of tissue to squeeze out the
blood for initial zero setting [94]. This method was later adopted by Wood in 1942 in his
ear piece oximeter. E.A.G. Goldie and Glenn Milikan also developed their oximeters in
that year [94]. In the 1960s, Shaw developed an eight wavelength ear oximeter, later
marketed by Hewlett-Packard, that achieved arterialisation by heating the ear [95]. It
was large, heavy and needed frequent calibration.
By the 1980s, Nellcor, Inc had produced a smaller, less expensive, accurate
microprocessor-based pulse oximeter that needed no user calibration [21]. Pulse
oximetry has since become a standard monitoring device in hospital critical care units
and surgical theatres, even gaining the moniker of the 5th vital sign after heart rate,
blood pressure, respiration rate and temperature [96].

64
This chapter aims to give a description of the theoretical background of pulse
oximetry and the techniques of photoplethysmography and spectrophotometry that
form the basis of it. It will also describe the pulse oximeter probe and provide a brief
overview on the recent advances in analysis of the pulse oximetry signals to monitor
venous oxygen saturation.
5.1 Photoplethysmography
Photoplethysmography (PPG) is a non-invasive optical technique that can be
used to detect blood volume changes in the vascular bed of tissue [97]. Light is
transmitted to the skin where it undergoes reflection, absorption and multiple
scattering by tissue and blood. The modulated light level which emerges is measured
using a suitable photodetector.
The pulsatile component of the PPG signal, with a typical bandwidth of 0.5 to 20
Hz [21], is often called the AC component (Figure 5.1). It is found to be synchronous with
the heart rate, and its trough of greater absorption is assumed to be related to the influx
of arterialized blood into tissue during systole.
Figure 5.1: The electrocardiogram (ECG) and corresponding AC PPG signal [97]
By convention, the PPG signal is inverted so that the AC component correlates
positively with this influx of blood and to the blood pressure waveform [98].
The shape or contour of the pulsatile component has two defined phases [97]:
the rising edge of the pulse, usually known as anacrotic phase, is attributed to systole,

65
and the falling slope of the pulse, the catacrotic phase, attributed to the period of
diastole. A distinguishable characteristic of the catacrotic phase is the dicrotic notch,
seen between the systolic and diastolic peaks, in Figure 5.2.
Figure 5.2: A typical PPG waveform [99]
The AC component is superimposed on a slowly varying baseline, the DC
component, representing absorption from non-pulsating components such as skin,
bones and venous blood.
5.1.1 Origin of the PPG waveform
The amount of light that is received by the photodetector is known to be
influenced by changes in haemodynamics during the cardiac cycle and by other
physiological conditions [100], [101]. However there is no consensus on the exact
mechanism that forms the optical pulsations.
The word photoplethysmography, from the greek “plethysmos”, to increase,
implies a change in volume in the field of view of the probe. As mentioned before, the
AC component is normally assumed to be related to the rapid filing of the vascular bed
of tissue by the stroke volume delivered during the cardiac cycle that is then drained
into the venous system [102]. The extra volume of blood in the arteries causes an
increase in transmural pressure and subsequently an increase in the diameter of the
vessels. In terms of Beer-Lambert’s law of spectrophotometry (see section 5.2.1), which
relates the absorption of light to the properties of the compound in the solution through

66
which the light is travelling, this translates to an increase in optical density or increase
in path length and could explain the increase in absorption of radiation.
An alternative explanation is that the waveform could instead represent pulsatile
venous flow, supplied by arterio-venous anastomoses [103]–[105].
Yet, in vitro studies have demonstrated a pulsatile waveform is obtained where
volumetric changes should not be possible [106], [107]. This includes a recent study
using haemolysed and whole blood flowing through a 2 mm diameter acrylic tube [108].
Human pulsatile blood pressure was simulated by a roller pump. It was found that with
whole blood, the PPG AC signal varied with the pressure pulse. No pulsatile signals were
recorded with haemolysed blood.
D’Agroso and Hertzman were the first to suggest the role of red blood cell
orientation in the generation of the optical pulse. It is thought that the red blood cells
align their major axis parallel to the direction of flow during diastole and perpendicularly
during systole, not only increasing the light absorption path length through blood but
also contributing to changes in reflectance [106]. This could be the result of changes in
velocity of flow felt in the vessels throughout the cardiac cycle [106], [109]. It can be
seen in Figure 5.3 [110], how analogous the measured mean velocity flow of blood in an
in vitro experiment is to the PPG waveform.
Figure 5.3: Change in mean velocity during pulsatile flow of a suspension of normal canine erythrocytes in plasma [110]

67
5.2 Blood oxygenation measurement using absorption
spectrophotometry
Oximetry is the optical measurement of oxygen saturation in blood and is based
on the principles of spectrophotometry.
In spectrophotometry, light of a certain wavelength, λ, is used to irradiate a
sample of interest. This incident light will get absorbed when the energy of the photon
corresponds to a potential energy transition associated with the electrons of the particle
it interacts with. The definite value of this energy transition is related to the molecular
composition and structure of the light absorbing substance, i.e. chromophore, present
within the sample. The light that isn’t absorbed emerges at the other end, across a
known sample path length, where it is measured by a photodetector.
The fraction of incident light that passes through the sample is called
transmittance, T, and is defined by the following equation:
𝑇 =
𝐼
𝐼0
Equation 5.1
, where I0 is the intensity of the incident light and I is the intensity of the
transmitted light. Unscattered absorbance, A, also referred to as the optical density of
the medium, is defined as the negative natural logarithm of the measured
transmittance.
5.2.1 Beer-Lambert’s law
Beer-Lambert’s law states that absorbance is directly proportional to the
concentration of the absorbing chromophore and to the optical path length of the light
through the medium:
𝐴 = 𝜀(𝜆)𝑐𝑑
Equation 5.2
, where ε(λ) is the extinction coefficient or absorptivity of the chromophore at a
specific wavelength λ, c is the concentration of the absorbing chromophore and d is the
optical path length. Concentration of the chromophore is measured is mmol L-1 and the

68
extinction coefficient will then be expressed in L mmol-1 cm-1. It is also common to
express concentration in mol L-1, which is called a molar, M.
If more than one absorber is present in the medium, the properties of Beer-
Lambert’s law are still valid. Each absorber will contribute its part to the total
absorbance, which will be a superposition of the individual absorbing processes. It is
given by Equation 5.3 for a medium with n different absorbers.
𝐴𝑡 = 𝜀1(𝜆)𝑐1𝑑 + 𝜀2(𝜆)𝑐2𝑑 + ⋯ + 𝜀𝑛(𝜆)𝑐𝑛𝑑 = 𝑑 ∑ 𝜀𝑖(𝜆)𝑐𝑖
𝑛
𝑖=1
Equation 5.3
, where εi(λ) and ci refer to the extinction coefficient and concentration of each
chromophore i in the medium. It can be noted that by using monochromatic light it isn’t
possible to differentiate between the individual contributions of each absorber in the
medium. This problem can be solved by measuring At at different wavelengths, provided
that the extinction coefficients for all absorbers are known. The absorbance needs to be
measured for a number of wavelengths equal or greater than the number of absorbing
chromophores. The individual concentration of each absorber is obtained by solving a
set of simultaneous equations. When Beer-Lambert’s law is applied to oximetry, two
wavelengths are used in order to study oxyhaemoglobin and deoxyhaemoglobin.
Beer-Lambert’s law is based on the assumption that the sum of transmitted and
absorbed light equals the intensity of incident light. This doesn’t take into consideration
other physical processes including reflection of the light at the surface of the medium or
scattering of light in the medium.
5.2.2 Optical properties of haemoglobin
Oximetry by absorption spectrophotometry relies on the change of absorption
of light with the percentage of oxygen bound to haemoglobin. As haemoglobin binds
with oxygen, the shape of the quaternary structure of its molecule changes (as
mentioned in chapter 2), which alters its absorption spectrum proportionately [95].
Figure 5.4 shows how the extinction coefficients of fully oxygenated (HbO2) and fully
deoxygenated haemoglobin (Hb) vary in the wavelength range of 200 to 1100nm. Within
the visible and near infrared spectrum of radiation, the main absorber in blood is

69
haemoglobin, whether oxygenated or deoxygenated. Outside this window of radiation,
other constituents in blood play a major role in absorption. Water is a very strong
absorber in the ultraviolet and far infrared spectrum and the pigment melanin in tissue
will absorb at shorter wavelengths [97].
Figure 5.4: Absorption spectra of oxyhaemoglobin (HbO2) and deoxyhaemoglobin (Hb) showing the extinction coefficients from the ultraviolet to the near infrared ranges (in: http://www.medphys.ucl.ac.uk/research/borl/sheddinglight/background.htm)
It can be clearly seen in Figure 5.4 that the absorbance of light in the red region
of the spectrum, around 670nm, is much higher for deoxyhaemoglobin than for
oxyhaemoglobin. In the region of 805 to 1000nm, representative of near infrared, is
oxyhaemoglobin that becomes more absorptive. At 805nm the extinction coefficients of
both species are equal. This is called an isosbestic wavelength. These differences in
absorption spectra give blood its characteristic coloration: bright red when oxygenated
and a darker colour when saturation is reduced, like in venous blood.
Conventional pulse oximeters function by measuring absorption of blood at two
different wavelengths, usually 660 and 880 to 940 nm [89], one at each side of the
isosbestic wavelength. The choice of these wavelengths is based on two criteria. Firstly
a large difference in extinction coefficient between the two species will result in
detectable changes in absorption even with small changes in saturation. Another
criterion is the relative flatness of the absorption spectra around the chosen
wavelength. This avoids bias being introduced by shifts in peak wavelength of the
emitters. Although the curves are not flat at around 660nm, they are considerably flatter
than at shorter wavelengths.

70
5.2.3 Functional oxygen saturation
The main purpose of haemoglobin is to bind with oxygen in the pulmonary
capillaries and release it in the lower saturation environment of the systemic capillaries.
Haemoglobin species that are able to bind reversibly with oxygen are called functional
haemoglobins. Oxyhaemoglobin and deoxyhaemoglobin are known as functional
haemoglobins.
The functional haemoglobin saturation, also referred to as functional oxygen
saturation (SaO2), is determined by the ratio of the amount of oxyhaemoglobin present
to the total amount of the oxyhaemoglobin and deoxyhaemoglobin. Another way to
define this ratio is to use the concentration values cHbO2 and cHb. Functional SO2 is
expressed in percentage.
𝑆𝑎𝑂2 =
𝐻𝑏𝑂2
𝐻𝑏 + 𝐻𝑏𝑂2× 100%
=𝑐𝐻𝑏𝑂2
𝑐𝐻𝑏 + 𝑐𝐻𝑏𝑂2
× 100%
Equation 5.4
Under normal physiological conditions arterial blood is saturated at 95 to 99%
and venous blood at 70 to 75% [111].
Beer Lambert’s law equation for multiple absorbers (Equation 5.3) can be applied
assuming only these two species are present:
𝐴(𝜆) = 𝜀𝐻𝑏𝑂2(𝜆)𝑐𝐻𝑏𝑂2
𝑑 + 𝜀𝐻𝑏(𝜆)𝑐𝐻𝑏𝑑
= [𝜀𝐻𝑏𝑂2(𝜆)𝑆𝑂2 + 𝜀𝐻𝑏(𝜆)(1 − 𝑆𝑂2)](𝑐𝐻𝑏𝑂2
+ 𝑐𝐻𝑏)𝑑
Equation 5.5
, where 𝑆𝑂2 = 𝑐𝐻𝑏𝑂2(𝑐𝐻𝑏𝑂2
+ 𝑐𝐻𝑏)⁄ from Equation 5.4.
Although most of the haemoglobin in a healthy individual is functional
haemoglobin, they are not the only haemoglobin species present. So called
dysfunctional haemoglobin species can also be found in blood in lower concentrations,
such as carboxyhaemoglobin and methaemoglobin. Each of these forms of haemoglobin
has its own extinction coefficient curve and thus additional wavelengths are needed to
determine their concentration in a sample. Conventional pulse oximetry doesn’t

71
account for dysfunctional haemoglobins, which can lead to errors (further information
in section 5.5.2).
5.3 Pulse oximetry
Pulse oximetry takes advantage of the time dependant photoplethysmographic
signal received at the photodetector to discriminate between arterial blood and other
absorbers in tissue. Assumed to be caused exclusively by changes in the arterial blood
volume associated with the cardiac cycle it allows pulse oximetry to utilize Beer
Lambert’s law to estimate arterial blood oxygen saturation in vivo without the need for
additional zeroing procedures.
5.3.1 Manipulation of the Beer Lambert’s law
Applying Beer Lambert’s law to pulse oximetry is not without some important
assumptions and simplifications. Firstly, Beer Lambert’s law is only valid for
homogeneous and clear mediums with negligible scattering. However, visible and near
infrared light are strongly scattered by human tissue [103], [112]. Also, there should be
no reaction between the absorbent and its solvent and no possibility of a photochemical
reaction either [95]. Neither blood nor the other absorbants present in living tissue meet
these criteria [21], [84].
With multiple scattering and absorption occurring in tissue, the actual path
length of the detected light is instead of a well-defined constant, a mixture of the
surviving independent photon paths [103]. The detected photons travelling longer
distances provide more interaction with blood and allows for the light to bypass the
bone [84] while the detected photons with shorter routes result in larger amplitudes of
the PPG waveform. In order to account for the combining effects of scattering, the
optical path length is replaced by an effective mean path length, dmax, assumed
equivalent for both wavelengths throughout the cardiac cycle.

72
Figure 5.5: Absorbed and transmitted light in living tissue. Time t1 corresponds to diastole while t2 corresponds to systole (adapted from [21])
As mentioned before, pulse oximetry relies on the variation in intensity of
transmitted light throughout the cardiac cycle to differentiate the absorption
contribution of arterial blood. According to the photoplethysmographic method, during
diastole (t1, shown in Figure 5.5), the attenuation of light observed is due to the DC
components in the tissue under study (non-pulsating arterial blood, venous blood and
other tissue). Beer Lambert’s law may be written as a linear combination of absorbances
of each component/contributor present:
𝐴(𝑡1) = 𝐴𝑠𝑘𝑖𝑛 + Abone + Avenousblood + ⋯ = 𝐴𝐷𝐶
Equation 5.6
During systole (t2, shown in Figure 5.5) the influx of arterial blood results in an
increase in the absorbance of both red and infrared light by haemoglobin, creating the
pulsating AC component of the photoplethysmograph:
𝐴(𝑡2) = 𝐴𝑠𝑘𝑖𝑛 + Abone + Avenousblood + ⋯ + Apulsatingarterial
= 𝐴𝐷𝐶 + 𝐴𝐴𝐶
Equation 5.7

73
By analysing the absorbance for a certain wavelength at the time of diastole and
again during systole and subtracting them we are left with only the change in
absorbance due to the AC photoplethysmographic component, the pulsating arterial
blood, since the tissue’s concentrations of the other constituents don’t change over this
time period.
𝐴(𝑡2) − 𝐴(𝑡1) = 𝜀𝑖(𝜆)[𝑐𝑖(𝑡2) − 𝑐𝑖(𝑡1)]𝑑𝑚𝑎𝑥 = 𝜀𝑖(𝜆)∆(𝑐𝑖)𝑑𝑚𝑎𝑥
Equation 5.8
, where εi(λ) and ci represent the extinction coefficient and concentration of the
absorber i, in this case referring to pulsating arterial blood.
The amplitude of the AC photoplethysmographic signal at red and infrared
wavelengths is sensitive to changes in arterial oxygen saturation because of the
differences in extinction coefficient of oxyhaemoglobin and deoxyhaemoglobin at these
two wavelengths. Like in Equation 5.5 it is assumed that only these two haemoglobin
species are present:
𝐴(𝑡1) − 𝐴(𝑡2) = [𝜀𝐻𝑏𝑂2(𝜆)𝑆𝑂2
+ 𝜀𝐻𝑏(𝜆)(1 − 𝑆𝑂2)]∆(𝑐𝑖)𝑑𝑚𝑎𝑥
Equation 5.9
In terms of the transmitted light this can be written as:
𝐴(𝑡1) − 𝐴(𝑡2) = −𝑙𝑛 (
𝐼𝑜𝑢𝑡(𝑡1)
𝐼𝑖𝑛) + 𝑙𝑛 (
𝐼𝑜𝑢𝑡(𝑡2)
𝐼𝑖𝑛)
= 𝑙𝑛 (
𝐼𝑜𝑢𝑡(𝑡2)𝐼𝑖𝑛
𝐼𝑜𝑢𝑡(𝑡1)𝐼𝑖𝑛
) = 𝑙𝑛 (𝐷𝐶 + 𝐴𝐶
𝐷𝐶)
= 𝑙𝑛 (1 +𝐴𝐶
𝐷𝐶) ≈
𝐴𝐶
𝐷𝐶
Equation 5.10
, where DC represents the unchanging intensity offset received by the photodetector
and AC the varying transmitted intensity due to the pulsatile arterial blood. The
unknown input intensity Iin cancels since it is assumed to be constant.

74
In pulse oximetry, the arterial oxygen saturation is determined from the ratio, R,
of the absorption at red (R) and infrared (IR) wavelengths. Applying Equation 5.9, this
ratio can be expressed as:
𝐴(𝜆𝑅)
𝐴(𝜆𝐼𝑅)= 𝑅
=[𝜀𝐻𝑏𝑂2
(𝜆𝑅)𝑆𝑂2 + 𝜀𝐻𝑏(𝜆𝑅)(1 − 𝑆𝑂2)]∆(𝑐𝑖)𝜆𝑅𝑑𝑚𝑎𝑥
[𝜀𝐻𝑏𝑂2(𝜆𝐼𝑅)𝑆𝑂2 + 𝜀𝐻𝑏(𝜆𝐼𝑅)(1 − 𝑆𝑂2)]∆(𝑐𝑖)𝜆𝐼𝑅
𝑑𝑚𝑎𝑥
Equation 5.11
A further assumption made is to consider equal the Δci terms, which refer to the
pulsatile changes in tissue’s blood concentration that causes the detected light levels to
modulate. Equation 5.11 can be written as:
𝐴(𝜆𝑅)
𝐴(𝜆𝐼𝑅)= 𝑅 =
𝜀𝐻𝑏𝑂2(𝜆𝑅)𝑆𝑂2 + 𝜀𝐻𝑏(𝜆𝑅)(1 − 𝑆𝑂2)
𝜀𝐻𝑏𝑂2(𝜆𝐼𝑅)𝑆𝑂2 + 𝜀𝐻𝑏(𝜆𝐼𝑅)(1 − 𝑆𝑂2)
Equation 5.12
Solving Equation 5.12 for SO2 we get Equation 5.13. Now SO2 is referred to as
SpO2: SO2 measured by pulse oximetry.
𝑆𝑝𝑂2 =
𝜀𝐻𝑏(𝜆𝑅) − 𝑅𝜀𝐻𝑏𝑂2(𝜆𝐼𝑅)
𝑅[𝜀𝐻𝑏𝑂2(𝜆𝐼𝑅) − 𝜀𝐻𝑏(𝜆𝐼𝑅)] + 𝜀𝐻𝑏(𝜆𝑅) − 𝜀𝐻𝑏𝑂2
(𝜆𝑅)
Equation 5.13
5.3.2 Calibration
Early pulse oximeters used the Beer Lambert’s law model to compute the values
of blood oxygenation [84]. However instruments based on this simplistic theoretical
model tend to give erroneous estimates as not only are the Beer Lambert’s law’s
conditions not strictly met but also the wavelength of the light sources utilized in pulse
oximetry can vary up to 15 nm [21] within a batch, and the assumed set of extinction
coefficients used is no longer correct.
Calibration of modern pulse oximeters is done by empirical methods instead.
Healthy volunteers that range in age, gender and skin colour are asked to breathe in gas
mixtures progressively with less oxygen and more nitrogen making them progressively
hypoxic. The measured ratio of AC/DC signals from the red and infrared

75
photoplethysmographs, known as ratio of ratios (Equation 5.14), is then correlated to
discrete samples of arterial blood analysed with a Co-oximeter [95].
𝑅 =𝐴𝑅
𝐴𝐼𝑅
=(
𝐴𝐶𝐷𝐶)
𝑅
(𝐴𝐶𝐷𝐶)
𝐼𝑅
Equation 5.14
The US Food and Drug administration (FDA) recommends 15% of the volunteers
to be darkly pigmented [113]. Prescreening blood tests are done to ensure the levels of
dyshaemoglobins are within normal ranges.
An empirical calibration curve relating the functional haemoglobin saturation to
the ratio of ratios is obtained from the collected data. Each manufacturer uses a unique
calibration curve, not necessarily but normally in the form of a linear equation expressed
as:
𝑆𝑝𝑂2 = 𝑎 − 𝑏𝑅 Equation 5.15
, where a=110 and b=25 or a=118.8 and b=25.6 [114].
The biggest problem associated with this procedure is the ethics of deliberately
desaturating healthy subjects below a certain point due to the risk of hypoxic brain
damage. For this reason, it is then necessary to extrapolate the calibration curve for
values of SpO2 below 80% [95]. Research is being done to evaluate the possibility of in-
vitro calibration with human blood in an artificial circulation, or checking calibration of
pulse oximeters with non-blood samples [95].
5.4 Pulse oximeter probes
A conventional pulse oximeter probe consists of two small emitters of the
selected wavelengths and a photodetector highly sensitive to these wavelengths. These
components are assembled inside a reusable spring-loaded clip, a flexible probe or a
disposable adhesive wrap [9], designed to protect the photodetector from ambient light

76
interference. A flexible cable connects the probe to the pulse oximetry unit. It supplies
the probe with electric power and carries the signal from the photodetector.
There are two main operational configurations used in pulse oximeter probe
design: transmission and reflection. These are discussed below along with an overview
on the semiconductor components of the PPG probe.
5.4.1 Transmission pulse oximeter probe
Transmission mode is the most commonly applied in commercially available
pulse oximeters. In this mode, the emitters are mounted opposite the photodetector,
which detects the amount of light transmitted through the pulsating arterial bed. Figure
5.6 illustrates the relative positions of the optical components.
Figure 5.6: A photoplethysmographic probe used in transmission mode [115]
To be effective, the sensor must be placed somewhere in the body where
transmitted light can be readily detected [116]. This criterion restricts the locations in
the body where transmission mode can be used to peripheral sites such as the fingers,
toes, ear lobes, nasal septum and in infants’ feet and palms.
The photodetector should be placed as close to the skin in a snug fit, with a
constant but light pressure on the tissue so that the light can’t bypass the tissue [84].
However, an increase in the pressure the pulse oximeter sensor exerts on the skin will
result in vasoconstriction of the vessel leading to a decrease in AC signal amplitude and
thus a decrease in the AC/DC ratio [117]. Excessive force could cause trauma to tissue
[21].

77
5.4.2 Reflectance pulse oximeter probe
In the reflectance mode of operation the emitters and photodetector are
mounted side by side facing the tissue. A general reflectance probe is shown on Figure
5.7.
Figure 5.7: A photoplethysmographic probe used in reflection mode [115]
The measurement of arterial blood oxygen saturation by reflectance pulse
oximetry is based on the intensity of the light reflected back from tissue. As light from
the emitters enters the tissue it is diffused in all directions. In order to detect the most
of the backscattered radiation, the photodetector must be able to detect light from an
area concentric with the emitters.
The separation between the emitters and the photodetector has an effect on the
quality of the photoplethysmographic signals received. The light intensity received at
the photodetector decreases roughly exponentially as the separation between optical
components increases [116]. On the other hand, if placed too closely, the photodetector
will be saturated due to increased reflection from the blood free stratum corneum and
epidermal layers in the skin [21]. A different technique used to enhance the quality of
the photoplethysmographs is to use a large emitter driver current. Light intensity
increases the effective penetration depth of the incident light and the area of pulsatile
vascular bed illuminated.
Despite the fact that in vitro experiments suggest that in reflectance mode an
increase in blood volume increases the amount of light reflected back to the
photodetector, in vivo the relationship is similar to the transmission mode. It is thought

78
that the light reflecting back from deeper structures will undergo further absorption by
superficial blood vessels [98].
The reflectance mode doesn’t suffer the same restrictions as the transmission
mode when it comes to sensor placement. Reflectance probes can be placed virtually
on any part of the body where light reflection due to tissue can be expected, including
in the intraluminal spaces of the human body. Also, because reflectance mode probes
are usually adhered to the patient, they may not exert enough pressure to collapse the
venous system, so venous oscillations can be more significant than in transmission mode
[98].
5.4.3 Light emitting diodes
The choice of a suitable emitter for pulse oximetry involves not only
considerations of size and cost but also the requirement for a monochromatic light
source for the spectrophotometric measurement of haemoglobin concentration [84].
Historically, the eight wavelength oximeter marketed by Hewlett-Packard made use of
a tungsten-iodine lamp with a high output of light within the 650 to 1050 nm range [21]
and the pulse oximeter described by Yoshida and colleagues employed a quartz halogen
lamp [115]. Both devices had to be used in combination with light filters for wavelength
selection and bulky fibre optics to transmit the light. The breakthrough for pulse
oximetry came with the advent of light emitting diodes (LED) in the 1980s, which
allowed for smaller, easier to use and cheaper devices [118].
LEDs are characterized by high light emitting efficiency over a narrow wavelength
band, superior to other methods such as cathode, high-temperature and
photoluminescence. In terms of monochromaticity, laser light would be an excellent
choice but an expensive and fragile one due to the need for optical fibers to guide the
light to the patient [84]. Although not strictly monochromatic, LEDs eliminate the need
for optical fibres, and have become standard in pulse oximeters.
1.1.1.1 Principle of operation
An LED is an optoelectronic semiconductor diode that produces light by injection
electroluminescence [119].

79
Semiconducting material can be doped with impurities in order to change its
ability to conduct electrical current, adding free electrons (n-type material) or creating
holes where electrons can go (p-type material). In a diode, where n- and p-type of the
same semiconductor material meet, equilibrium is reached between the free carriers
and a region of free space is formed: the depletion region. The bulk of the
semiconductor however remains unaffected and retains its original conductivity type
[119].
When forward bias voltage is applied across the diode, the potential across the
depletion region is lowered. Injected carriers from both sides are able to cross the p-n
junction into the region of opposite polarity (Figure 5.8). As electrons recombine with
holes, the energy associated with the recombination transition is released as photons
according to the Equation 5.16 [119]:
𝐸𝑔 = ℎ𝑐
𝜆 Equation 5.16
The composition of the semiconductor influences the band gap energy (Eg) and
dictates the wavelength (λ) of the emitted photons [119].
Figure 5.8: The p-n junction under forward bias showing injection electroluminescence. (in: http://en.wikipedia.org/wiki/Light-emitting_diode)

80
The current-voltage characteristics of an ideal diode are given by [120]:
𝑖 = 𝑖0 [𝑒𝑥𝑝 (
𝑒𝑉
𝛽𝑘𝑇) − 1]
Equation 5.17
,where β represents the ideality factor. In forward bias, the current will increase
exponentially with voltage. If reverse bias is applied across the diode, when the p-type
region is connected to the negative terminal and the n-type to the positive terminal of
the voltage source, the internal potential barrier is increased and the current saturates
at i0 (Equation 5.17). No carrier injection takes place and, consequently, no light is
emitted.
1.1.1.2 LEDs in pulse oximetry
LEDs are ideally suited for pulse oximetry as they have a high efficiency of
emission over a narrow wavelength band. Due to the diode behaviour characteristics,
specified by Equation 5.17, the LEDs are preferentially driven by a constant current
source [119]. This allows for precise control of illumination intensity by linearly varying
the supplied current, essential when differences in absorption of the red and infrared
wavelengths and the variation in thickness and pigmentation of the area under study
[115] could result in either saturation of the photodetector or, on the other hand, an
insignificant portion of light being detected.
Another important characteristic of LEDs for use in pulse oximetry is their fast
response time to changes in the drive current. A switching speed of the order of
microseconds allows for high frequency multiplexing of the LEDs, faster than the
required for the arterial pulsatile waveform (≈1 s-1 = 1 Hz) [21]. An added advantage of
pulsed operation is that small LEDs used in pulse oximetry are able to tolerate
substantially higher current levels than if they were constantly on [21].
The common emitter wavelength of 660 nm for the red region and 880 nm or
940 nm for the infrared region, are readily available in the market at a relatively low
cost. The problem is that the exact peak wavelength of any single LED can vary by as
much as 15 nm [21]. A shift in emitted wavelength leads to erroneous calculations of
SpO2 as the pulse oximeter is working with a different set of extinction coefficients to

81
the one specified for the calibration curve. The error is more significant in the red region
because of the steep slope of the absorption spectra of oxyhaemoglobin and
deoxyhaemoglobin at these wavelengths.
5.4.4 Photodetector
Photodiodes are the detectors of choice as they have an output linear to the
incident light intensity, are sensitive to the wavelengths used in pulse oximetry and have
faster response times than other devices, such as the photocell [21].
5.4.4.1 Principle of operation
The photodiode consists of a p-n junction which is operated in reverse bias.
When a semiconductor diode is operated in reverse bias, the majority carriers are
prevented to cross the p-n junction and the minimal current seen is result of electrons
and holes being pulled away from depletion region [119]. If a photon strikes the
depletion region, its energy is absorbed by the semiconductor to create an electron-hole
pair. The internal electrical field across the junction will cause the electron and hole to
separate, generating electric current [120].
The detection of charge separation of the electrons and holes can be done in two
ways. The photovoltaic mode is when a light induced voltage can be measured between
the p and n regions of an open-circuit photodiode. In pulse oximetry the
photoconductive method is used. Operated under reversed bias, the external current
flowing is directly proportional to the incident light. This also means faster response,
better stability with temperature variations and greater dynamic range [120].
Like with LEDs, the wavelength of photon is dependent on the material used and
the physical depth of the p-n junction: only photons possessing energy equal or higher
than the band gap energy will be readily absorbed by the semiconductor [119]:
ℎ
𝑐
𝜆= 𝐸𝑔
Equation 5.18
The range of spectral response can span up to seven decades, even though the
sensitivity of the photodiode varies significantly, being higher for wavelengths closer to
the bang gap energy [120]. The photodiode is unable to distinguish between the

82
different wavelengths used in pulse oximetry and for that reason the pulse oximetry
processing system needs to include multiplexing.
The main disadvantage of photodiodes is the presence of a reversed bias leakage
current in even in dark conditions (absence of light), known as dark current.
In order to improve performance, an intrinsic region is incorporated in the
structure of the photodiode. Placed between the n and p regions, this very lightly doped
material will effectively widen the depletion region, maximising the absorption of
photons [119]. The PIN diode has virtually eliminated the standard p-n junction
configuration, including in pulse oximetry probes.
5.5 Limitations of Pulse Oximetry
5.5.1 Calibration assumption
As described previously, the calibration for modern pulse oximeters is done by
experimentally derived calibration curves. Several problems are associated with this
method. Firstly, ethical considerations prevent deliberately desaturating a healthy
subject due to the risk of inducing hypoxic brain injury [95]. It is then necessary to
extrapolate the calibration curve values below 80%. This leads to inaccuracy and bias at
these low levels. Also, the number and spacing of the calibration points affects the fitting
of the calibration curve derived from them [95].
5.5.2 Dyshaemoglobins
Pulse oximetry makes use of only two wavelengths of light to distinguish
between oxyhaemoglobin and deoxyhaemoglobin. However other haemoglobin species
can also be found in blood in lesser concentrations, most significantly
carboxyhaemoglobin (COHb) and methaemoglobin (MetHb). These are called
dyshaemoglobins as they are unable to bind to oxygen or interfere with the ability of
the haemoglobin molecule to release oxygen to tissue. The presence of these species
causes inaccuracy in pulse oximetry readings [3], [8].

83
COHb is caused by the inhalation of carbon monoxide commonly from tobacco
smoke and the internal combustion engine [95]. Its absorption at the red range is very
high like oxyhaemoglobin, leading to overestimation of oxygen saturation to as much as
1% for every 1% of COHb circulating [95]. Methaemoglobin, on the other hand, absorbs
highly at both red and infrared wavelengths, driving the ratio R to unity with SpO2
approaching 85% [21], [95]. MetHb can be induced by drugs, including anaesthetics, and
it formed by oxidation of haemoglobin from the normal ferrous state (Fe2+) to the ferric
state (Fe3+) [21].
When the presence of dyshaemoglobins is suspected, investigation should be
supplemented with in-vitro blood gas analysis.
5.5.3 Dyes and nail polish
Intravenously administered dyes methylene blue, indigo carmine and
indocyanine green all absorb strongly at 660 nm causing falsely low SpO2 readings [95],
[122].
In theory, skin pigmentation and other surface light absorbers, such as nail polish
or dried blood, shouldn’t cause interference in readings as they are cancelled out in
calculations for their non-pulsatile nature. However it has been found that black, blue
and green nail polishes can cause inaccurate SpO2 readings [21], [122]. The presence of
onychomycosis, a fungal infection which causes the nails to discolour to a yellow or
green colour, can also cause low SpO2 readings [123]. Solutions to these problems
include placing the probe sideways on the finger or using nail polish remover.
5.5.4 Optical interference
Interference from ambient light, sources including sunlight and fluorescence
surgical lights, affects all pulse oximeters [21]. In order to reduce this effect, probes are
manufactured of a black opaque material that doesn’t transmit light or are enclosed in
an opaque plastic housing [21]. Another solution is to incorporate in the clock timing
sequence a period where both light emitters are turned off and the photodetector
receives only ambient light, the influence of which is subsequently eliminated.

84
Optical shunt is another type of optical interference. It occurs when light from
the emitters reaches the photodetector without passing through a pulsatile arteriolar
bed [21]. Correct probe positioning is crucial to avoid this problem.
5.5.5 Motion artefact
The AC component of the photoplethysmographic signal accounts for only 1 to
2% of the total absorption [95] which renders the pulse oximeter very sensitive to
vibrations and pressure. Motion artefact, such as shivering, seizure activity and exercise,
results in false or erratic heart rate displays or distorted photoplethysmographic
waveforms [21]. Transient interference can also occur with surgical diathermy [124] and
evoked potential monitors and nerve stimulators placed on the same extremity [123].
A common method used to reduce the error due these artefacts is through
averaging the saturation values over several seconds before they are displayed [21].
More recently, leading pulse oximetry manufacturers have introduced advanced digital
signal processing algorithms with improved performance [9]. Another method
employed is to synchronize the pulse oximetry measurements with the R wave of the
patient’s electrocardiogram [21].
5.5.6 Inadequate pulsatile signals
Pulse oximetry relies on the presence of adequate photoplethysmographic
pulsations to calculate a value of SpO2 [21]. In states of hypovolaemia, hypothermia or
vasoconstriction, conventional pulse oximetry sites, such as the finger, toe or ear lobe,
can be compromised by poor peripheral perfusion leading to erroneous readings or
complete failure [121].
Local vasodilating drugs or a warming blanket are used to increase local
vascularisation and enhance the plethysmographic pulsations [21]. The forehead and
nose have been investigated as alternative measuring sites for pulse oximetry with
contradictory results: Rosenberg and colleagues report no improvement comparing to
the finger probe [121] while Cheung and colleagues have found forehead probes to be
stable at low saturations [21]. Kyriacou and colleagues have found an oesophageal

85
probe to be more reliable than a finger probe in cases of compromised peripheral
perfusion, since central blood flow is preferentially preserved [125].
The use of the sphygmomanometer for measuring arterial blood pressure
induces vasoconstriction, which renders the pulse oximeter unusable. It is then
advisable to place the pulse oximeter probe on the opposite limb for the length of the
measurement.
5.6 Monitoring of venous oxygen saturation
Recent advancements in computing technology and digital signal processing
have enabled processing of the PPG waveform beyond the calculation of arterial blood
oxygen saturation [105], [107].
The measurement of oxygen saturation in venous blood, SvO2, provides
information on tissue oxygen consumption and blood flow.
The pulse oximetry approach to measuring venous oxygen saturation requires a
variation in volume in the venous compartment disparate to the arterial blood pulsation.
One of the approaches used so far has been to apply a low pressure, at around 25mmHg,
to the forearm. Light absorption is compared before and after venous occlusion [126].
However, this method does not allow for continuous measurement, as it relies on
discrete interventions, and it may lead to potential complications such as venous stasis
and thrombosis [11].
Another approach for generating an artificial venous pulse consists of inflating
and deflating a small cuff tied to the base of the finger (Figure 5.9). The cuff is inflated
at a frequency of 6.5 to 8 Hz to a pressure below 40 mmHg [127], which is greater than
venous pressure to allow for venous pooling, but lower than diastolic pressure as so not
to interfere with the perfusion of the finger. A conventional pulse oximeter probe is
placed on the same finger. The 6.5 to 8 Hz frequency modulation of the venous blood
volume is processed the same way the arterial pulsations are to obtain the AC and DC
components of the ratio of ratios [127].

86
Figure 5.9: Principle of operation of digital pressure cuff method of measuring venous blood oxygen saturation [127]
It was noted previously that the PPG waveform is influenced by positive pressure
ventilation and that this has an effect on the tissue blood volume. An algorithm, VenSat,
was developed and assessed [11] to verify whether the respiratory modulation would
enable the measurement of venous oxygenation from the PPG waveform. The pulse
oximetry ratio of ratios is taken as the peak to trough amplitude of the DC waveform
divided by the DC offset for both wavelengths [11].
𝑅𝑉𝑒𝑛𝑆𝑎𝑡 =
(|𝐷𝐶|𝐷𝐶 )
𝑅
(|𝐷𝐶|𝐷𝐶 )
𝐼𝑅
Equation 5.19
It was found that the VenSat algorithm yields lower saturation values than the
SpO2 value. In data collected with an oesophageal PPG probe, the VenSat derived
saturations were around 80%, which is within the physiological range of venous
saturations [11].
Although it cannot replace the measurement of mixed venous oxygen saturation
at the pulmonary artery, the non-invasive monitoring of peripheral venous oxygenation
may serve as an early indicator of an imbalance in oxygen supply and demand in tissue
and act as a warning sign of the early phases of shock [11], [127].

87
Chapter
6
DEVELOPMENT OF A TWO CHANNEL DUAL WAVELENGTH PPG
PROCESSING SYSTEM
A prototype dual wavelength PPG processing system has been designed as part
of this thesis and developed to allow continuous and simultaneous monitoring of two
PPG probes, one designed for intraluminal placement and the other one for placement
in the finger. It drives the optical components of the PPG sensors as well as detecting
and pre-processing the signals from the photodetector prior to digitisation. It also
accommodates an ECG channel and an airway pressure channel to detect the patient’s
ventilation flow.
This chapter describes the different components of the PPG processing system,
its construction and the performance evaluation tests conducted. A complete circuit
schematic of the PPG processing system circuit is included in Appendix 1. The system
was originally designed for a dual PPG probe and therefore includes extra circuitry not
necessary with a single unit PPG probe. The extra circuitry will not be included in the
description below.
6.1 Instrumentation
A block diagram representation of the system can be seen in Figure 6.1:

88
LED current driver
Transimpedance amplifier
Sampleand hold
Filter and signal
conditioning
Microcontroller
Instrumental amplifier
Filter and signal conditioning
DAQ
PPG channel
ECG channel
Airway pressure sensor
Airway pressure channel
Dual oesophageal
and fingerPPG probes
3 leadECG
Gas samplingline
Power supply
Laptop with NI LabVIEW
clk 1
clk 2
Figure 6.1: Block representation of the dual wavelength PPG acquisition system, including the ECG channel and the airway pressure channel
The red and infrared LEDs are driven by a constant current source realised with
a basic operational amplifier circuit connected to a transistor. The two LEDs are
alternately illuminated using a four state clock, programmed into the multiplexer.
The photodetector produces a current proportional to the light power
backscattered from tissue. This current is fed into the PPG processing system to be
converted into a voltage signal and amplified by the transimpedance amplifier.
Representing light from both LEDs in sequence, the photodiode signal is then
demultiplexed using sample and hold circuitry. This operation is synchronized to the
switching of LEDs by the same clock inputs from the multiplexer.
Intraluminal and finger
PPG probes

89
The individual red and infrared signals from each of the two photodetectors are
passed through filtering and amplification stages to separate AC and DC PPG
components before digitisation.
This system incorporates a 3 lead ECG channel, used as a timing reference for the
intraluminal and finger probes. Signals originating from electrodes placed in the body
are transferred to an instrumental amplifier before undergoing further filtering and
amplification to be digitised along with the PPG signals.
An airway pressure sensor is also included in the processing system to allow
identification of the respiratory modulation in the PPG signals and enable computation
of local venous blood saturation.
For protection against electrical risk during clinical trials, the PPG processing
system is powered by two lead acid batteries and cannot be powered by mains.
6.1.1 Multiplexing
A crucial element of the pulse oximeter system is the timing of the LEDs and
synchronization with the detected light backscattered from tissue. As the photodiode is
unable to distinguish between different wavelengths of light, the two LEDs (red and
infrared wavelengths) are alternately switched on and off. Each LED is controlled by a
different clock signal, and the timing sequence for this project was decided upon to
include periods when both LEDs are off; this equates to each signal having a duty cycle
of 25%. With a multiplexing frequency of 300 Hz, the pulse width of each individual clock
signal has a value of 834 µs (the rise time of the LEDs is of 1.5 µs, which is within the
pulse width of the clocks). A diagram depicting both timing clock signals can be seen on
Figure 6.2:

90
Figure 6.2: Diagram of four-state timing clock signals.
These timing signals are provided by a programmable 8 bit AVR microcontroller,
which controls both the switching of the LEDs and the sample and hold circuit on the
demultiplexing stage. The chip selected for this project was the Atmel ATtiny2313
(Atmel Corporation, USA), ideal for its high performance with low power consumption
and smaller package. It executes a C code compiled using AVR Studio 4 (Atmel
Corporation, USA), a development environment that provides a project management
tool, source file editor, simulator and programming interface for the AVR STK500 Flash
Microcontroller Starter Kit (Atmel Corporation, USA).
6.1.1.1 Source code
The source code programmed into the microcontroller is as follows:
1 #include <avr\io.h> 2 #include <util\delay.h> 3 4 int main (void) 5 6 DDRB = 0x03; 7 while (1) 8 9 PORTB = 0b00000001; 10 _delay_us(834);

91
11 PORTB = 0b00000000; 12 _delay_us(834); 13 PORTB = 0b00000010; 14 _delay_us(834); 15 PORTB = 0b00000000; 16 _delay_us(834); 17 18
The header files lines 1 and 2 include the appropriate IO definitions for the device
in use and select the <util/delay.h> library. This contains routines for the delay function
used later in the code. The program is then initialized and declares the input and output
functionality of PORTB in line 6. The hexadecimal 0x03 defines pin 0 and pin 1 of port B
as outputs. These will be output ports of the timing clock signals.
The timing sequence is achieved with use of the delay function in a while loop.
While (1) creates a loop that will never end, as the condition always remains true. The
first statement within the while loop, line 9, selects pin 0 as ‘1’. This will correspond to
the high time of clock 1, where the red LED turns on and its contribution to the
photodetector input is selected at the sample and hold circuit. The delay function is
called and so pin 0 will stay ‘1’ for 834 µs. The delay function accepts only a known
constant as an expression. Line 11 turns both pins to ‘0’ and the delay function is called
again for 834 µs. The clock for the infrared is selected high at line 13 when pin 1 is
selected as ‘1’. The delay function ensures it is ‘1’ for 834 µs when both pins are turned
to ‘0’ again.
6.1.2 Current driver
LEDs, like other diodes, follow the ideal diode equation [119] according to which
the current through it varies exponentially with the voltage supplied. For this reason the
preferred method to drive the LED is with a constant current source. This can be
achieved with a high precision, low noise operational amplifier (OPA2227 Burr-Brown,
USA) and a series NPN transistor (2N3904 ON Semiconductors, UK) (Figure 6.3).

92
Figure 6.3: LED current driver circuit
When a negative feedback is applied around the OpAmp (operational amplifier)
through the transistor, the voltage at the inverting output approaches the value of the
voltage at the non-inverting input. This makes the voltage through the resistor equal to
Vin. The current through it can be derived using Ohm’s law.
In an NPN transistor, current flowing into the base results in a proportionally
larger current to flow between the collector and the emitter, and so it is said that the
current at the collector is approximately equal to the emitter current. As per Equation
5.16, the collector current is as given by Equation 6.1.
𝐼𝑐 =
𝑉𝑖𝑛
𝑅
Equation 6.1
The voltage input to the OpAmp is connected to the output clock signal of the
microcontroller for the corresponding LED wavelength. So, when the logic input is ‘high’,
Vin is 5 V. A variable resistor R2, in series with a fixed 62 Ω resistor R1, was used for
flexibility in selecting the most favourable current to drive the LEDs to achieve different
brightness for different situations. The variable resistor can be set between 0 and 500
Ω:
NPN2N3904
GND
+12V
-12V
CLK
2
31
A
84
OPA2227PA
62RR1
LED
+12V
500RR2

93
For R2= 0 Ω:
𝐼𝑐 =
𝑉𝑖𝑛
𝑅=
5𝑉
62Ω= 80.6𝑚𝐴
Equation 6.2
For R2= 500 Ω:
𝐼𝑐 =
𝑉𝑖𝑛
𝑅=
5𝑉
62 + 500Ω= 8.9𝑚𝐴
Equation 6.3
And so the current range available in this configuration is 8.9 mA to 80.6 mA,
which is below the peak forward currents accepted by both LEDs.
Four current drivers were included to allow different currents to be supplied not
only to red and infrared emitters but also to the intraluminal PPG probe and the finger
PPG probe.
The OpAmp is supplied in the positive input by a voltage of +12 V and on the
negative input by -12 V. 100 nF decoupling capacitors were added for stability.
6.1.3 Transimpedance amplifier
The red and infrared LEDs, driven by the circuit described above, will illuminate
the tissue under investigation. The reflected photons are absorbed by the
photodetector, which generates a flow of current linearly proportional to the incident
power [128]. This generated current is converted to voltage by a transimpedance
amplifier. Two transimpedance amplifiers are used in the processing system, one for
each PPG sensor.

94
Figure 6.4: Transimpedance amplifier circuit
A transimpedance amplifier (Figure 6.4) translates the output from a very high
impedance current source to a low impedance OpAmp output. This configuration
ensures a voltage across the photodetector equal to zero for all light intensities, due to
the virtual ground that the operational amplifier (OPA227 Burr-Brown, USA) maintains
at the inverting input.
Current flows through the feedback resistor and creates a voltage at the output,
with a gain equal to the value of the resistor:
𝑉𝑜𝑢𝑡 = −𝐼𝑑𝑅𝑓 Equation 6.4
The value of the feedback resistor (Rf=R1+R2) should be made as big as possible
as it is the biggest source of noise of this circuit [21]. In series with a 75 kΩ resistor, it
was chosen to include a 50 kΩ variable resistor to accommodate for different probes
and situations. The very high gain at which the transimpedance amplifier is operated
gives the signal a tendency for oscillation. A capacitor in the feedback loop improves
stability and avoids gain peaking.
6.1.4 Demultiplexing
The mixed output of each transimpedance amplifier is fed into two sample and
hold circuits (LF398, National Semiconductor, USA) for demultiplexing (Figure 6.5). This
circuit is capable of taking an instantaneous sample of the input signal and then holding
8
52
3
4
6
7
1OPA227PA
+12V
-12VGND
75kRR1
100pF
C1
50kRR2
PDK
GND

95
the sampled value in a holding capacitor. It tracks the input signal voltage when a ‘high’
logic signal is received. The output follows the input with only a minimal offset voltage.
When the logic input is ‘low’, the charged capacitor retains its value, isolated from
subsequent variations at the input. The capacitor will influence the acquisition time of
the sample and hold circuit and also the rate of change of the output when the logic
signal is ‘low’.
The logic signal used to trigger the sample and hold circuits is the same as the
one that drives the current source of the corresponding LED wavelength, so the voltages
corresponding to the reflected signals deriving from the red or infrared LEDs are the
outputs of this circuit.
Figure 6.5: Sample and hold circuit. The top LF398 receives clock 1 to output the photodetector signal correspondent to the red LED, while the bottom LF398 circuit
corresponds to the infrared LED
6.1.5 Signal conditioning
Conditioning of the demultiplexed red and infrared signals is provided within the
circuit by analogue filters. AC and DC components of the PPG signals are separated,
filtered and amplified for a better signal-to-noise ratio when the waveforms are to be
digitised.
IN3
V+1
OUT5
V-4
CH6
LOGIC REF7
OFFSET ADJ2
LOGIC8
SM PLHLD RD1
LF398AN
10nF
Cholda
+12V -12V
CLK1
GNDGND
IN3
V+1
OUT5
V-4
CH6
LOGIC REF7
OFFSET ADJ2
LOGIC8
SM PLHLD IR1
LF398AN
10nF
Choldb
Cap
+12V -12V
IN2
CLK2
GNDGND
IN1

96
For isolating the AC component, a band pass filter was designed using the Sallen
and Key topology with unity gain. A 2nd order low pass filter to reject the low frequency
band of the DC component was cascaded to a 2nd order high pass filter in order attenuate
the high frequency noise, including switching noise from the multiplexer. The OpAmp
used for this design was the OPA4277 by Burr-Brown.
The unity gain Sallen and Key configuration for the low pass filter can be seen in
Figure 6.6.
Figure 6.6: Unity gain Sallen and Key low pass filter
The cut off frequency for this filter is given by:
𝑓𝑐 =
1
2𝜋√𝑅1𝑅2𝐶1𝐶2
Equation 6.5
The values of both resistors and both capacitors were kept the same for
simplification:
𝑓𝑐 =
1
2𝜋𝑅𝐶
Equation 6.6
The value of resistors chosen was 360 kΩ and for the capacitors was 22 nF which
gives a filter cut off frequency of 20.09 Hz.
The unity gain Sallen and Key configuration for the high pass filter is as shown in
Figure 6.7. It is achieved by swapping the resistors and capacitors in each of its poles.
2
31
A
411
OPA4277PA
C2
C1
GND
-12V
+12V
R1 R2

97
Figure 6.7: Unity gain Sallen and Key high pass filter
Its cut off frequency is given by the same equation as the low pass filter. In this
case it was chosen to be around 0.5 Hz in order to not only eliminate the DC component
of the PPG but also to attenuate the effect of the respiratory component (0.2 to 0.3 Hz)
from the AC signal. The value of resistors used was 3.3 MΩ and the value of capacitors
was 100nF, which corresponds to a cut off frequency of 0.48 Hz.
The AC portion of the signal accounts for only 1 to 2% of the total amplitude of
the PPG. An amplification stage was added in order to optimise the range of signal to be
digitised using the data acquisition card.
An inverting amplifier was designed for this stage. A diagram of the circuit can
be seen in Figure 6.8.
Figure 6.8: Inverting amplifier for the AC PPG signal
The amplifier output is related to the input by the equation:
2
31
A
411
OPA4277PAC2C1
GND
-12V
+12V
R1
R2
2
31
A
411
OPA4277PA
GND-12V
+12V
R1
R2

98
𝑉𝑜𝑢𝑡 = −
𝑅2
𝑅1𝑉𝑖𝑛
Equation 6.7
With a closed loop gain of:
𝐴 =
𝑅2
𝑅1
Equation 6.8
The resistor values were chosen to be 330 kΩ for R2 and 3.9 kΩ for R1, which
translates in a gain applied to the input voltage of 84.62.
In order to extract the DC component of the signal, needed for calculation of R
value for oxygen saturation, a low pass filter was designed using the unity gain Sallen
and Key topology. The selected values for resistors and capacitors were 2.2 MΩ and 0.47
µF, respectively. This equates to a cut off frequency of 0.15 Hz.
6.1.6 ECG
Development of a 3 lead electrocardiogram (ECG) channel is described in this
section.
Three electrodes are placed on the right arm or right side of the chest (red lead),
the left arm or left side of the chest (yellow lead) and left leg or lower left side of the
chest (green lead). The configuration decided for use is the bipolar lead I, where red and
yellow leads are monitored for biopotentials and the green lead is used as ground [129].
These voltages are fed into a differential amplifier in order to detect the differential
signal between the bipolar lead amidst the common voltage at the two electrodes.
Instrumental amplifier INA114AP from Burr-Brown was used for this purpose.
The INA114 general purpose instrumentation amplifier (Figure 6.9) is a three
OpAmp design providing high common rejection ratio (115dB) and a very high input
impedance (1010Ω). The gain of the instrumentational amplifier can be set with an
external resistor, RG, to up to 10000. It is given by:
𝐺 = 1 +
50𝑘Ω
𝑅1
Equation 6.9

99
The resistor R1 value chosen was 560 Ω, providing a gain of 90 to the
instrumentation amplifier. Decoupling capacitors of 0.1 µF were added for stability and
noise reduction.
Figure 6.9: Instrumentation amplifier used for the ECG channel
Just like with the PPG signal, the ECG signal rides on a large offset and so an
inverting amplifier was added for optimization before it is digitised. A diagram of the
circuit can be seen in Figure 6.10. The operational amplifier chosen for this stage and for
the filtering stage was the TL084 (Texas Instruments, USA).
Figure 6.10: Inverting amplifier circuit for the ECG signal
The resistor values for R1 and R2 were chosen to be 10 kΩ and 100 kΩ,
respectively. By Equation 6.8 this provides a gain of 10 to the output signal of the
instrumentational amplifier.
123
Header 3H
GND
yellowredgreen
-V4
IN+3
IN-2
OUT6
REF5
RG1
RG8
+V7
INA1 14AP
-12V
+12VGND
560R
R1
2
31
A
411
OPA4277PA
GND-12V
+12V
R1
R2

100
A bandpass filter was used to remove DC level and environmental artefacts.
Figure 6.11 shows the high pass and low pass Sallen and Key filters used. The cut off
frequency for this filter configuration is given by Equation 6.5.
Figure 6.11: ECG bandpass filter implemented with Sallen and Key topology
For the high pass filter, the values of resistors and capacitors were chosen as 1
MΩ and 1 µF for a cut off frequency of 0.16 Hz. The low pass filter was chosen to have a
cut off frequency of 40.83 Hz, with resistors and capacitors values of 3.9 kΩ and 1 µF.
6.1.7 Airway pressure
A standard sterile gas sampling line, used in capnography measurements, will be
used to monitor the patient’s respiratory flow rate. This will allow identification of the
respiratory modulation in the PPG signals and subsequently enable computation of local
venous blood saturation. The gas sampling line will be connected to the ventilator side
of the airway adaptor so is separated from the patient by a bacterial filter.
The selected component for airway pressure sensing was the 40PC001B1A
(Honeywell S&C, USA), which accepts a bi-directional pressure range of ±50 mmHg with
an accuracy of 0.2%. It was not deemed necessary to calibrate the system as only the
frequency and shape of the positive pressure ventilation flow will be analysed.
6.1.8 Power supply
The power supply for the circuit was provided by two heavy duty 12 V sealed
lead-acid batteries (NP 1.2-12, Yuasa, Japan), with a 1.2 Ah 20-hour rate capacity. They
10
98
C
411
OPA4277PA1uF
C1
GND
12
1314
D
411
OPA4277PA
+12V+12V
-12V-12V
3.9kRR3
1MRR2
1uF
C21MRR1
3.9kRR3
1uFC1
1uFC1
GND

101
were connected in a parallel configuration which gives an improved capacity rating to
the circuit, and consequently a longer battery time before discharge.
A series configuration is more commonly used with the batteries’ junction acting
as a virtual ground for the circuit. However, it is possible for the batteries to discharge
unevenly, in which case a DC offset would emerge. A low power DC-DC converter was
introduced to achieve a dual output +/-12V and ground rail from the 12VDC supplied by
the batteries. The model chosen was the THD 15-1222N from TracoPower, which has
precisely regulated output voltage. An input filter (Figure 6.12) was added in order to
meet level B conducted emissions.
Figure 6.12: Input filter for the DC-DC converter
The current being drawn by the circuit is 150 mA on the positive rail and 80 mA
on the negative rail during normal operation. The DC-DC converter chosen is able to
output a maximum current of 250 mA.
In contrast to the rest of the circuit, the multiplexing microcontroller requires a
supply voltage of 5V. The voltage regulator (Figure 6.13) chosen for this purpose was the
LM2931 (National Semiconductors, USA) that provides a fixed DC output voltage of 5 V,
regardless of variations in input current or input voltage, within its operating range of
26 V.

102
Figure 6.13: Voltage regulator circuit
The capacitors were included to help maintain the stability.
6.1.9 Data acquisition
The output signals from the PPG and ECG filters and the output of the air
pressure sensor are passed onto a 16-bit data acquisition card (NI USB-6212, National
Instruments, USA) for analogue to digital conversion. It interfaces with a laptop
computer and is powered via a USB cable. The software designed for control of the
operation of the card and the acquisition of signals is the subject of the next chapter.
6.2 Mechanical construction
A complete schematic of the described PPG circuit was replicated in Altium
Designer (Altium Limited, Australia) for design of the PCB and to generate the Gerber
and NC drill files needed for manufacture. Routing and placement of the different
components within the PCB board was decided by dataflow and pre-defined design
rules. Width of tracks was kept at 0.5 mm, while power lines were made thicker at 0.7
mm. Hole sizes were kept uniform at 1.3 mm, constrained by the availability of drilling
bits for the CNC machine. Electrical clearance between components and tracks was
defined as 0.4 mm. The final dimensions of the PCB board were 185x143 mm.
The PCB board was constructed on a double sided 1 oz copper clad epoxy glass
FR4 board with 1.6 mm thickness (149060, Kelan, UK). Fabrication was from the done
by milling with a CNC machine (Mega 700-001 Bench drill/router, Mega, UK). After
milling and drilling, the copper board was polished and tinned for 15 minutes in a
+12V
GND
+5VIN3
OUT1
2
GND
V2
0.33uFC1
0.33uFC2

103
saturated solution of tin plating crystals. Both through-hole and surface mounted
components were mounted on the board by hand soldering techniques.
The circuit board, power supply and data acquisition card are enclosed in an
aluminium instrument case (M5625305F, METcase, UK), size w250 x d260 x h150 mm.
There are no moving parts: all parts are screwed to the bottom of the instrument case.
The connections to the two pulse oximetry probes, the ECG leads and the connector for
the gas sampling line are mounted on the front panel next to the power on-off switch
as shown in Figure 6.14. Connection to the PPG probes is done through a Lemo Redel 8
way panel mounted receptacle (PXG.M0.8GG.NG, Lemo, Switzerland), while the ECG
leads cable is connected by a mini 6 pin DIN and a luer to tubing panel mounted adapter
made of medical grade PVDF is used for the gas sampling line (FTLLB210-J1A, Value
Plastics, Inc, USA). Connection from the data acquisition card to the computer is
mounted on the back panel (Figure 6.15).
Figure 6.14: Photograph of the study monitoring system (1 Power on/off switch with blue light indicator, 2 ECG receptacle, 3 Gas sampling line luer connector, 4 Intraluminal PPG probe
connector, 5 Finger PPG probe connector)

104
Figure 6.15: Photograph of the back panel of the study monitoring system (1 USB port for data acquisition)
The total weight of the main processing unit is 3.4 Kg.
6.3 Performance evaluation
The PPG processing system was evaluated by bench tests for validation and
performance of its different components.
Both the current drivers for the emitters and the sample and hold circuitry for
demultiplexing are controlled by the timing clock signals of the multiplexing
microcontroller. Its outputs measured with an oscilloscope can be seen in Figure 6.16.

105
Figure 6.16: Output of the microcontroller showing the timing clock signals
Both timing clock signals can be clearly observed as square waves ranging from
0 V to 5 V at the programmed frequency of 300 Hz.
The output of each transimpedance amplifier is a mixed PPG signal as the
photodetector doesn’t differentiate between the red and infrared wavelengths. Figure
6.17 shows the output of one of the two transimpedance amplifiers in the circuit. The
effect from the infrared wavelength can be seen as the higher amplitude component.
The feedback capacitor is effective in reducing overshooting artefacts.

106
Figure 6.17: Output of the transimpedance amplifier, showing both the red and infrared components
The sample and hold circuitry provides a simple method of splitting the output
of the transimpedance amplifiers into their red and infrared components. Figure 6.18
shows the output of two adjacent sample and hold circuits used to demultiplex the
signal originating from one photodetector. Both circuits receive the same
transimpedance amplifier output but a different timing clock signal, synchronizing to the
red emitter current driver (a) and the infrared emitter current driver (b) for its sensor. It
can be observed how its output follows the output of the transimpedance amplifier
while the timing clock is high and keeps that value until the next clock.
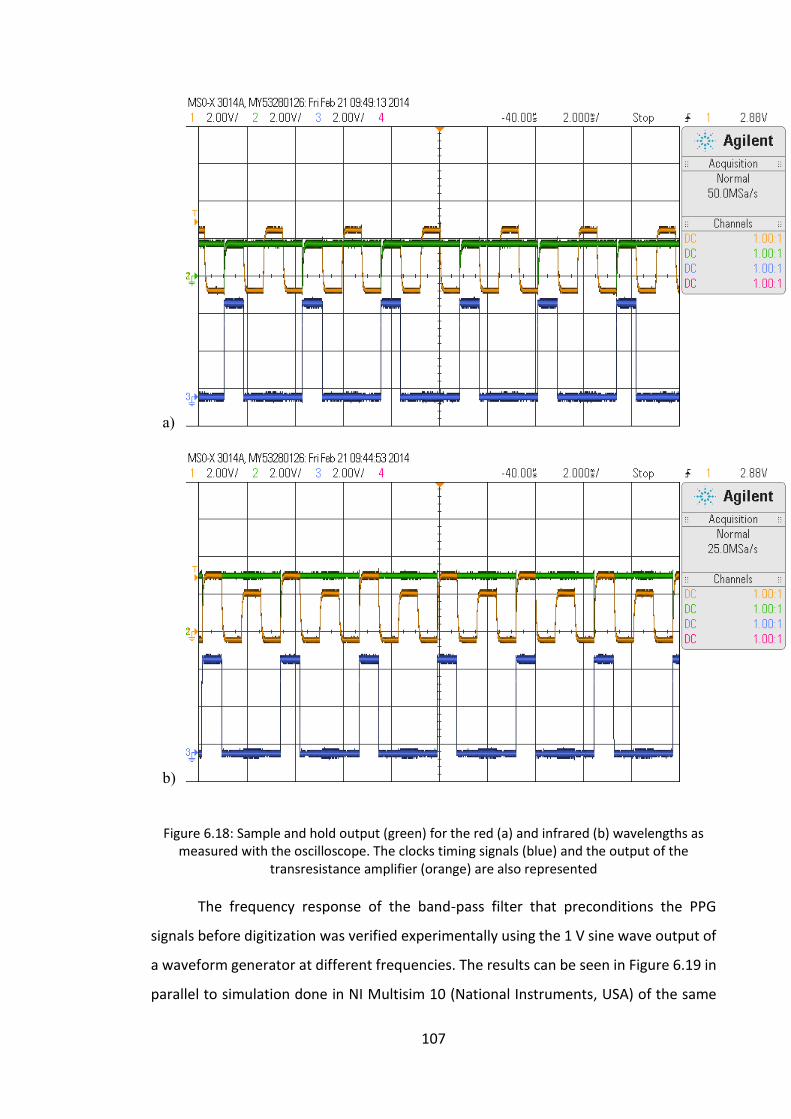
107
a)
b)
Figure 6.18: Sample and hold output (green) for the red (a) and infrared (b) wavelengths as measured with the oscilloscope. The clocks timing signals (blue) and the output of the
transresistance amplifier (orange) are also represented
The frequency response of the band-pass filter that preconditions the PPG
signals before digitization was verified experimentally using the 1 V sine wave output of
a waveform generator at different frequencies. The results can be seen in Figure 6.19 in
parallel to simulation done in NI Multisim 10 (National Instruments, USA) of the same

108
bandpass filter. Since the gain for this filter is 1 and the values of resistors and capacitors
are equal then the quality factor of the filter, Q factor, is 0.5 by the expression:
𝑄 =
√𝑚𝑛
𝑚 + 1
Equation 6.10
, where m is the ratio of the resistors and n is the ratio of the capacitors.
Figure 6.19: Frequency response of the PPG bandpass filter. Experimental results are represented by red diamonds, superimposed on simulation in Multisim in blue
Figure 6.19 shows the frequency response of the PPG bandpass filter, with the
cut off frequency delineated at the quality factor 0.5. The experimental cut off frequency
was then at approximately 0.5 Hz for the lower cut off point and 25 Hz for the higher.
Simulation in Multisim and experimental results were also obtained for the low
pass filter (Figure 6.20).
0
0.2
0.4
0.6
0.8
1
0.01 0.1 1 10 100 1000
Mag
nit
ud
e (
V)
Frequency (Hz)

109
Figure 6.20: Frequency response of the PPG low pass filter. Experimental results are represented by red diamonds, superimposed on simulation in Multisim in blue
Since the quality factor is the same as for the band pass filter, it can be seen in
Figure 6.20 the experimental cut off frequency is approximately 0.15 Hz.
Figure 6.21 shows the AC PPG signals for the intraluminal probe and the finger
probe as they are transferred to the DAQ card for further analysis. The test was
conducted using an indicator finger in lieu of the duodenal mucosa.
Figure 6.21: Sample red and infrared AC PPG signals from the intraluminal and the finger PPG probes as measured on the oscilloscope
0
0.2
0.4
0.6
0.8
1
0.01 0.1 1 10 100 1000
Mag
nit
ud
e
Frequency (Hz)

110
The output AC PPG signals to be digitised contain little noise and their definable
features (peak and dicrotic notch) can be clearly distinguished.
Like the filters implemented for PPG signal processing, the bandpass filter used
in the ECG channel is of unity gain with both resistors and capacitors of same value,
giving it a quality factor of 0.5. According to Figure 6.22, the experimental low cut off
frequency is approximately 0.15 Hz and the high cut off frequency is near 40 Hz.
Figure 6.22: Frequency response of the ECG bandpass filter. Experimental results are represented by red diamonds, superimposed on simulation in Multisim in blue
Figure 6.23Figure 6.23 shows the output of the ECG channel as measured on the
oscilloscope.
Figure 6.23: ECG signal as measured on the oscilloscope
0
0.2
0.4
0.6
0.8
1
0.01 0.1 1 10 100 1000
Mag
nit
ud
e
Frequency (Hz)

111
The output of the airway pressure channel was also evaluated on the
oscilloscope (Figure 6.24). During clinical trials, the gas sampling line will be connected
to the patient’s mechanical ventilation system. However for bench testing, forced
breathing was used instead to obtain a comparable waveform.
Figure 6.24: Airway pressure signal during forced breathing as measured on the oscilloscope
It was noted previously that the airway pressure channel is not calibrated. The
offset and amplitude of the waveform are not relevant to this study and will not be
displayed.
As the PPG processing system is battery operated, it was deemed necessary to
investigate how long the system can operate within its specifications after a full charge.
So, in order to test its running time, the +12 V and -12 V power lines, outputting from
the DC-DC converter, were connected to a data acquisition device to measure and
record the changes in voltage. Figure 6.25 shows the graph of voltage over time of this
experiment.

112
Figure 6.25: Changes in voltage of the power lines during a cycle run of the processing system
It can be seen from Figure 6.25 that the batteries had run continuously for over
6 hours before the DC-DC converter couldn’t output +12 V and -12 V anymore and the
processing system stopped its normal functioning.
6.4 Conclusion
A two channel dual wavelength PPG processing system has been successfully
developed to accommodate both the intraluminal PPG probe and the finger PPG probe
as well as an ECG channel and an airway pressure channel. The two PPG channels were
built electrically identical in order to enable quantitative comparison between the PPG
signals obtained from the intraluminal PPG probe and the peripheral finger PPG probe.
Each section of the processing system was bench tested to ensure its correct and
accurate performance. The signals measured on the oscilloscope are of good signal to
noise ratio and suitable for digitisation for further analysis.
After digitization, the signals are transferred to a laptop computer for saving,
processing and real time display using a Virtual Instrument implemented on LabVIEW,
to be covered in the next chapter. The computer used is the Dell Lattitude 6510 (Dell,
-15
-10
-5
0
5
10
15
00:00:00 01:00:00 02:00:00 03:00:00 04:00:00 05:00:00 06:00:00
Vo
ltag
e (
V)
Time (s)

113
USA), with an Intel Core i5 (2.5GHz), 2 GB RAM, Windows 7 64-bit OS and 160 GB HDD.
During clinical studies the laptop computer will run off its internal batteries.

114
Chapter
7
DEVELOPMENT OF A DATA ACQUISITION VIRTUAL INSTRUMENT
The main processing unit, described in the previous chapter, requires the use of
a Virtual Instrument (VI) for the effective acquisition and real time display of the PPG,
ECG and airway pressure outputs. The programming environment chosen for the
development of this VI was LabVIEW (National Instruments, USA), which provides full
integration to the analogue to digital conversion hardware installed in the main
processing unit enclosure.
After a brief introduction to LabVIEW and its capabilities, this chapter aims to
give a detailed description of the software written on LabVIEW, from saving of the raw
digitised signals for offline analysis to improving access to real time data through the
Front Panel and its extra features.
7.1 About LabVIEW
NI LabVIEW (National Instruments, USA), standing for Laboratory Virtual
Instrument Engineering Workbench, is a graphical programming environment optimised
for instrument control, data acquisition and processing and real time display of acquired
data. It uses high-level language, G, to represent programming actions graphically
instead of the more traditional lines of text used by other languages, such as C, C++ or
Java. LabVIEW follows a dataflow model, where the flow of data through the wires and
nodes on the Block Diagram determines the execution order of the VIs or functions. VIs,

115
or virtual instruments, are LabVIEW programs that imitate actual instruments by their
operation and appearance. Interaction with the user when the program is running is
done through controls and indicators on the Front Panel. The graphical nature of
LabVIEW allows for a faster program development, being more intuitive but still
maintaining the same programming concepts and the standard data types, loops, event
handling, variables and debugging capabilities as other languages.
7.1.1 Data acquisition hardware
As explained in the previous chapter, interface between the main processing unit
and the laptop computer is done via a data acquisition card, responsible for analogue to
digital signal conversion. National Instruments offers a wide range of data acquisition
(DAQ) devices to be used in conjunction with the LabVIEW software.
The device that was selected for this project is the Multifunction Data Acquisition
NI USB-6212 (National Instruments, USA), featuring 16 analogue inputs with a 16 bit
resolution at a sampling rate up to 400 kS/s and a maximum voltage range of -10 V to
+10V. This DAQ card also includes two analogue output channels, 32 digital I/O lines and
two 32-bit counter outputs. It communicates with the computer via USB port and does
not require external power. The main selection criteria for this device was the capability
of supporting a large number of analogue inputs and high resolution which is essential
when acquiring physiological signals.
7.2 Development of the Virtual Instrument for data acquisition using
LabVIEW
A virtual instrument was implemented, as part of this project, in LabVIEW to
acquire, process and display the PPG, ECG and airway pressure signals outputs of the
main processing unit. It consists of various features programmed to perform the
following tasks:
To accurately digitise and acquire the PPG, ECG and airway pressure
signals.
To save all the acquired raw data.
To filter and display in real time all signals.

116
To calculate and display the ratio R and SpO2 from all three PPG sensors.
To calculate and display heart rate from the ECG signal.
The complete Block Diagram can be seen on Appendix 2.
7.2.1 Algorithm for data acquisition
The first task required for the Virtual Instrument to perform is to communicate
with the data acquisition card for continuous acquisition of the 10 output signals from
the main processing unit: infrared and red AC intraluminal, infrared and red DC
intraluminal, infrared and red AC finger, infrared and red DC finger, ECG and airway
pressure signals.
The chosen DAQmx VI for data acquisition was the DAQ Assistant Express VI. NI-
DAQmx software enables the control and programming of the DAQ card from within the
LabVIEW environment and was introduced to optimize performance. As part of the
Express VI Development Toolkit, this function allows for interactive configuration
through a dialogue box.
When the DAQ Assistant Express VI is first initialized, it displays a dialogue box
for the creation of the task of acquiring the analogue inputs from the DAQ card. At this
point, a set of 14 virtual channels is created for measuring voltage from the specified
physical channels of the DAQ card corresponding to the 8 PPG signals, the ECG signal
and the airway pressure signal.
The subsequent dialogue box allows for configuration of channel-specific
settings (Figure 7.1). The input terminal configuration was chosen to be RSE (referenced
single-ended) where the voltage is measured with respect to ground, also connected to
the DAQ card. Maximum and minimum values were configured to +10 and -10 V. Under
timing settings, the acquisition mode was set to Continuous Samples, for continuous
acquisition until the VI is stopped, giving the option to specify Samples to Read and the
Rate of acquisition in Hertz. These were defined as 20 and 200 Hz respectively. The
sampling rate was chosen to satisfy the Nyquist criterion of the sampling theory, where
the sampling frequency needs to be at least twice the highest frequency present in the
signal. In order to satisfy this criterion for both PPG and ECG signals, a frequency of

117
Figure 7.1: Configuration dialog box of the DAQ Assistant Express VI, showing details of the physical channels in the DAQ card
200Hz was chosen. The Samples to Read parameter determines the buffer size and the
number of samples to read from the buffer for each channel in each iteration. Other
configurable settings on the dialogue box include the option to name and order the

118
virtual channels, corresponding to the physical connections to the DAQ card. Clicking
the OK button saves the settings and returns to the block diagram.
The “data” output of the DAQ Assistant Express VI is represented by a dark blue
wire (Figure 7.2) and contains the samples read from the task, along with their timing
information.
Like other software packages, DAQmx includes an error in/out condition
connecting the different VIs. The army green wire that represents this error contains
information relevant to it including its status (Boolean 1 for occurred error), code (if
status is true, this is a non-zero error code) and source. This allows for the programer to
include Boolean logic to halt the program in case of an error being detected. The General
Error Handler, placed at the end of the dataflow, returns a description of the error and
displays it in a dialog box (Figure 7.2).
Figure 7.2: Data acquisition algorithm in LabVIEW
Other parameters of the DAQ Assistant Express VI include “stop”/“stopped” and
“task out”. Since the acquisition mode was selected to continuously acquire samples,
the VI will run until the “stop” input is the Boolean “true” (Boolean type is represented
by a dotted green wire). The output “stopped” will turn to Boolean “true” when this
occurs, as well as when the error condition is “true”. “Task out” contains a reference to
the task that can be wired through a purple wire to other DAQmx VIs.

119
In order for the DAQ Assistant Express VI to run continuously, it needs to be
inserted within a loop condition. This is achieved with a While Loop. This loop repeats
the code within its subdiagram until a specific condition occurs. A Boolean logic stop
button in the Front Panel connected to the While Loop’s Condition Terminal (“Stop if
true” condition selected; a “Continue if true” condition is also available) halts the
execution of all programs within the loop. Other features of the program are also
included within this loop so that they will execute continuously until this stop button is
hit. The Condition Terminal is also driven by the status of the error condition.
A For Loop is also included inside the While Loop to aid the calculation of ratio R
and SpO2, detailed in section 5.3.1. A For Loop executes its subdiagram a set amount of
times, in this case 20. With a sampling frequency of 200 Hz this allows the collection of
400 samples, corresponding to 2 seconds of data to be used for the calculation of the
ratio of ratios and SpO2. The Boolean stop button on the Front Panel is wired to a stop
condition inside the For Loop so that it also halts its execution.
7.2.2 Algorithm for saving acquired data
An algorithm (Figure 7.3) for saving the PPG, ECG and air pressure data to a file
was included in this VI to enable offline analysis. It was decided that only the raw signals
from the DAQ Assistant Express VI would be saved in order to preserve as much
information as possible.

120
Figure 7.3: Algorithm for saving acquired data on LabVIEW, which also records a time stamp with a hours, minutes and seconds format (%H:%M:%S)
The Write to Measurement File VI writes data to a text based measurement file
or a binary measurement file with or without headers. Like the DAQ Assistant Express
VI, it opens a dialogue box with different configuration options of the type of file to be
created (Figure 7.4). The LabVIEW measurement file, with extension *.lvm, was the
chosen file format for this VI. It is a tab-delimited text file that can be opened in either
a spreadsheet or text-editing application. It includes a file header section with
information about the data, including date and time, followed by the data arranged in
rows and columns. It was chosen to use the tab character as a separator. The Action
option in the dialogue box configures the way the file is saved: it was chosen to save the
data in one file only and to prompt the user for a file name just once, instead of every
time the Write to Measurement File VI executes.

121
Figure 7.4: Dialog box for Write to Measurement File VI
When executed, the Write to Measurement File VI receives the output of the
DAQ Assistant Express VI into its “Signals” parameter input. A Boolean logic record
button in the Front Panel connected to the “enable” input prompts its execution. This
button was designed with a mechanical action of “Switch when pressed” which enables
the user to start, pause the recording of the data and restart it again. The data will
continue to be acquired into the same file. When the recording is started for the first
time since the program is run, a dialogue box appears prompting the user to input a
filename and select the destination folder. To note that this VI, just like the DAQmx VI,
includes an error condition that is connected to a General Error Handler at the end of
the program.
An event recording function was designed to capture a time stamp and save it
along with the raw signal data. It is important to account for certain events during clinical
trials such as induction of anaesthesia, drugs, change in ventilation mode, etc., and mark

122
the time they occurred to later be correlated to the acquired signals and facilitate offline
analysis.
This event recording function was accomplished with a Get Date/Time in Seconds
VI, which returns a time stamp of the current time. This was then formatted by a Format
Date/Time String VI into a time string only. Date information is already included in the
header of the created text file. The time format code used shows the time stamp into a
hour, minute and second format (%H:%M:%S) and is wired by a pink wire to the Format
Date/Time String VI. This formatted string is then wired into the “Comment” parameter
input of the Write to Measurement File VI. A Boolean logic event button was included
in the Front Panel to control when this function occurs. Since the Get Date/Time in
Seconds VI doesn’t have an “enable” input, this was done using a Case Structure with a
Boolean selector terminal. When the “true” condition is met, the Get Date/Time in
Seconds VI is executed; otherwise nothing happens.
It was decided to add the record time into the saved file as well. Since the record
button is outside the For Loop, it would have inserted a timestamp for each iteration.
Some logic was used to insure only the first timestamp is written in the saved file, which
also includes the use of shift registers. These sit directly opposite in the sides of a loop
structure and are able to shift the data stored at the right register to the left register to
be used in the next iteration.
7.2.3 Algorithm for continuous signal display
A Waveform Chart was used to display in real time the acquired signals (Figure
7.5). This VI can display one or more plots of data acquired at an automatic constant
rate. It provides assurance to the end user of this VI that the instrumentation is
functioning and that signals are of good quality for significant post processing and
analysis.

123
Figure 7.5: Filtering and waveform display algorithm
The output of the DAQ Assistant Express VI includes all acquired signals. In order
to display the signals from each PPG sensor in a separate graph, as well as the signals
from the ECG and the airway pressure, Split Signals Function and Merge Signals Function
VIs were utilized. As their names suggest, they split signals into its component signals
and can merge two or more signals together into a single output. The resulting signals
retain the original time information.
The x-axes of all graphs were configured to show the latest 10 second of data,
while the y-axes were selected differently for each type of signal. The y-axis for the PPG
graphs was configured to a value range of -10 to +10 V, but this can be adjusted during
measurements to better visualize the signals. It was not deemed necessary to include
the DC signals in the graphs, so only the AC photoplethysmographs are displayed. For
the ECG and airway pressure graphs, the y-axes were set to autoscale, in which the scale
is adjusted automatically to reflect the incoming data.
Despite the signal conditioning already provided in the main processing system,
the acquired signals may still have some noise, which may include quantisation noise,
added to the signal during digitisation. Two digital filters were therefore implemented

124
in LabVIEW before displaying the PPG and ECG signals (Figure 7.5). The chosen VI for this
task was the Filter Express VI. The filter for the AC PPGs was defined as a low pass, 6th
order Butterworth filter with a cut-off frequency of 10 Hz, while the filter for the ECG
signal was a band pass filter, with a low cut-off frequency of 0.5 Hz and a high cut-off
frequency of 15 Hz. All specifications are selected in a dialogue box, alike the ones from
the previously described VIs.
7.2.4 Algorithm for the calculation of ratio and SpO2
It has been mentioned previously that calibration of modern pulse oximeters is
done by comparison of arterial blood gas samples analysed in a CO-oximeter with the
measured ratio, R, of AC/DC signals from the red and infrared PPGs. It must be stressed
however that this is an uncalibrated system and, in order to derive SpO2, an existing
empirical calibration curve [21] will be used:
𝑆𝑝𝑂2 = 110 − 25𝑅 Equation 7.1
After acquisition and filtering, a Collector VI is employed inside the For Loop to
collect the input signals and return the most recent data. It creates an internal buffer to
store the individual points and discard the oldest points. The newest points are passed
out of the For Loop. The maximum number of samples per channel was specified to be
1000. After 20 iterations of the For Loop, each channel contains 400 points of data.
Collected at a rate of 200 samples/ second, this equates to 2 seconds of data for each
signal (approximately the duration of 2 heart beats) which is sufficient for the estimation
of the AC or DC components used in calculating the ratio R. With the For Loop it is
possible to achieve an almost continuous collection of data and calculation of SpO2; as
it is being called inside the While Loop, a new value is calculated every 2 seconds.

125
Figure 7.6: Algorithm for calculation and display of ratio of ratios and SpO2 values from both the intraluminal PPG probe and the finger PPG probe
In order to calculate the PPG AC and DC amplitudes to be used in calculating the
ratio R, an Amplitude and Level Measurements VI was introduced. This VI displays a
dialogue box with voltage measurement options to be applied to the signals, including
mean, RMS (root mean square), positive and negative peak, peak to peak, cycle average
and cycle RMS. The acquired signals were divided into AC and DC PPGs and the mean
voltage measurement was applied to the DC PPGs, while the peak to peak voltage
measurement was applied to the former.
The ratios of AC/DC for both red and infrared wavelengths were calculated using
a numeric function of division. The quotient of these two ratios gives the value of R, as
described by Equation 5.14. The empirical calibration curve depicted in Equation 5.15 is
also implemented with the use of numeric functions.
Because the calculation of the ratio R and SpO2 needs to be repeated for all 3
PPG sensors, this algorithm was designed as a subVI in order to simplify the main VI’s
Block Diagram.

126
Figure 7.7: SubVI for calculation of ratio of ratios and SpO2 values
The inputs and outputs of this subVI (Figure 7.7) are added as connections to the
terminal of the custom designed icon of the subVI that can be placed in the main VI
(Figure 7.5).
Figure 7.8: Icon and connection diagram of the subVI with ratio of ratios and SpO2 values as outputs
The calculated SpO2 is then displayed along with the ratio R value in the Front
Panel. In the case of the saturation falling below 75%, the SpO2 value will turn to red.
This is achieved with a Select VI wired to two Colour Box Constants and the Boolean
result of a Less or Equal? VI. Its result is inputted into a SpO2 display Property Node,
which allows changing the properties, including colour, of a reference in the Front Panel
directly from the Block Diagram.

127
7.2.5 Algorithm for the calculation of heart rate
A Collector VI is also employed to pass the ECG signal out of the For Loop, which
is then inputted into a Tone Measurements Express VI for calculation of the frequency
of the acquired signal.
Figure 7.9: Dialog box for the Tone Measurements Express VI. The “Sample Data” and “Sample Result” are examples and were not obtained as part of this work.
Like the previously described Express VIs, the Tone Measurements Express VI
displays a dialogue box with further options (Figure 7.9). The single tone frequency
option was selected and the VI allows for search in a specific frequency range: the
approximate frequency was selected to be 1 Hz and for the VI to search within ±5% of
this frequency. The output was multiplied by 60 using the numeric function
multiplication in order to display beats per minute instead of Hertz in the Front Panel.
The heart rate value will turn red when it falls below 50 or raises above 100 beats per

128
minute. This was achieve in a similar way to the SpO2 values, with a Select VI, a Colour
Box Constant, a Less or Equal? VI and a Property Node.
Figure 7.10: Algorithm for the calculation and display of heart rate
7.2.6 Front panel
Figure 7.11 shows a capture of the Front Panel when the program is running. It
shows in prominence the AC PPG signals from the intraluminal PPG probe (labelled
“Duodenum”) and from the finger PPG probe (“Finger”), the ECG signal (“ECG”) and the
airway pressure (“Air”), over a period of 10 seconds. It was decided not to display the
DC PPG signals, as it is common practice in commercial devices.

129
Figure 7.11: Still of the Front Panel of the LabVIEW VI when it is running

130
For the PPG signals, different colours were chosen to quickly differentiate
between sensors. The warmer colours (red and yellow) represent the waveforms
corresponding to the red LED, while the cooler colours (turquoise and blue) correspond
to the infrared LED. The two PPG waveform graphs have the same amplitude range: -10
to +10 V. This range can be adjusted during clinical trials. The calculated values of ratio
R and SpO2 are also displayed next to the waveform graphs. The SpO2 values for both
channels were rounded to the closest digit as is common practice in commercial pulse
oximeter devices. As mentioned previously, the SpO2 value will turn red if the saturation
falls below 75%. The heart rate value is also displayed and will turn red outside of the
50 to 100 beats per minute range. The airway pressure waveform is also displayed.
Also displayed on the Front Panel a button for the event recording and a time
display for when it is pressed, along with the stop button. Because it is called from within
a For Loop, it takes a couple of seconds for the stopping action to come into effect.
7.3 Conclusion
The Virtual Instrument was successfully designed and implemented in LabVIEW
to be used in conjunction with an intraluminal PPG probe and a finger PPG probe and
the main processing unit described in chapter 6. It allows for full control of digitisation,
saving, processing and real time display of the PPG, ECG and airway pressure signals. It
also estimates and displays SpO2 and heart rate every 2 seconds. The VI did not
noticeable slow down or crash during tests and the time stamps were confirmed to be
recorded along with the raw signals.
The successful completion of the virtual instrument, along with the developed
hardware, enables progression of the research to the stage of clinical studies.

131
Chapter
8
IN VIVO INVESTIGATION OF PPG SIGNALS FROM THE DUODENUM
DURING OPEN LAPAROTOMY
The vital need to monitor the perfusion of the splanchnic region in critically ill
patients has not yet been met by existing techniques. This chapter presents the findings
from a study evaluating the feasibility of photoplethysmography acquired intraluminally
from the duodenum in 9 patients undergoing open laparotomy.
The specifications of the intraluminal PPG probe and finger PPG probe, used in
conjunction with the processing system described in chapter 6, are also detailed.
8.1 Instrumentation
The PPG probe utilised for this study was previously developed by the Biomedical
Engineering Research Group at City University London for intraluminal oesophageal
monitoring in clinical research studies [125], [130], [131]. This reflectance
photoplethysmographic probe consists of a surface mounted photodetector flanked by
a red and an infrared surface mounted light emitting diode (LED) on each side. The
emitters selected for this probe were the CR10HRT (ELCOS GmbH, Germany) for the red
emitters and CR50IRH (ELCOS GmbH, Germany) for the infrared emitters, with a peak
wavelength of 655 nm and 880 nm, respectively, and the selected photodetector was
the CFD10 (ELCOS GmbH, Germany), with a spectral response range between 500 and
1000 nm. Their opto-electronic characteristics and packaging details are shown in Table
8.1, in Table 8.2 and in Table 8.3.

132
Table 8.1: Opto-electronic and package characteristics of the red emitter.
Table 8.2: Opto-electronic and package characteristics of the infrared emitter.
Electrical/optical characteristics at TA=25°C
Peak emission wavelength: 655 nm (typ)
Luminous intensity (at IF=20 mA): 15.0 mcd
Power dissipation: 130 mW
Forward voltage (at 20 mA): 1.8 V (typ)
Min. reverse voltage: 5 V
Reverse leakage current: 100 µA
Peak forward current (at 10µs): 800 mA
Continuous forward current: 75 mA
Light emission angle: 180°
Operating temperature: -25°C to +80°C
Soldering temperature (10 s): 250°C
All dimension in milimeters
Electrical/optical characteristics at TA=25°C
Peak emission wavelength: 880 nm
Radiated power (100 mA) / (20 mA): 9.2 mW / 2.0 mW
Power dissipation: 130 mW
Forward voltage (100 mA) / (20 mA): 1.65 V / 1.35 V
Min. reverse voltage: 8.0 V
Reverse leakage current: 100 µA
Peak forward current (at 10µs): 800 mA
Continuous forward current: 75 mA
Light emission angle: 160°
Operating temperature: -25°C to +80°C
Soldering temperature (10 s): 250°C
All dimension in milimeters

133
Table 8.3: Opto-electronic and package characteristics of the photodetector.
Electrical/optical characteristics at TA=25°C
Peak wavelength sensitivity: 880 nm
Range of spectral bandwidth (50%): 500 … 1000 nm
Active area: 7.34 mm2
Sensitivity (at VR=5 V, EV=1kLx): 85 nA/Lx
Junction capacitance (at VR=3 V, f=1 MHz): 50 pF
Open circuit voltage (at EV=1kLx): 365 mV
Light reverse current (at VR=5 V, EV=1kLx): 85 mA (typ)
Reverse dark current (at VR=10 V): 5 nA (typ)
Reverse voltage (at 25°C): 32 V
Power dissipation: 200 mW
Operating temperature: -25°C to +80°C
Soldering temperature (10 s): 260°C
All dimension in milimeters
The probe was constructed using surface mounted components soldered onto a
manually etched, epoxy glass copper clad, single sided PCB (dimensions: 20 mm x 3.5
mm x 1.0 mm) (Figure 8.1 top). The distance between the emitters and the
photodetector is 5 mm. Experimental studies have shown a separation of 4 to 5 mm
provides the best sensitivity in terms of detecting adequate photoplethysmographic
signals [21].
An electrically and optically identical reflectance finger PPG probe was also used
to enable comparison of the duodenum mucosal measurements with the traditional PPG
sensor location. The layout of the finger PPG probe is shown in Figure 8.1 (bottom).

134
Figure 8.1: Layout of the surface mounted components on the board for the intraluminal and for the finger PPG probes (measurements in mm)
A shielded 6 core cable from a pulse oximeter was used for carrying the power
to the LEDs from the main processing unit and also the detected PPG signals from the
photodetector. The intraluminal and the finger PPG probes have been manufactured
with a mini 6 pin DIN connector. A converter was manufactured to allow connection to
the 8 contact plug PAG.M0.8GL.AC52G (Lemo Redel, UK) installed in the main processing
unit.

135
Figure 8.2: Photograph of the intraluminal PPG probe (left) and of the finger PPG probe (right).
8.1.1 Approved probe sheathing method for sterilization and electrical insulation
The intraluminal PPG probe was designed to fit into a transparent disposable 21
French gauge gastro-duodenal tube (0391.21, Vygon, UK), a latex free 125 cm long tube
with four lateral eyes and a closed end.
The use of this commercially available, sterile, CE marked, single patient use
gastro-duodenal tube ensures sterility and avoids cross contamination during clinical
trials. Tube gauge French 21 is routinely utilized in anaesthetics and has been approved
to be used in this study by clinical collaborators, by the ethics committee to which this
study was presented to and by the Clinical Physics and Infection Control department at
Barts Health NHS Trust where the study took place.
As noted, the gastro-duodenal tube is manufactured with four side eyes. In order
to prevent digestive tract secretions and blood from reaching the electronic and optical
components of the intraluminal PPG probe during clinical trials, these side drainage
holes have to be completely sealed. The method approved by Clinical Physics and
Infection Control encompasses cutting the solid, round-ended closed tip of a smaller
gastric tube and inserting it into the French 21 gastro-duodenal tube. The French 14
gauge gastric tube RT-2014 (Pennine Healthcare, UK) was chosen. This is a Ryles tube
made of medical grade PVC, latex free with four side eyes and a closed end.
A water pressure test was undertaken to test the efficacy of the seal the French
14 tube achieves. A bladder syringe filled with water was used to apply pressure to a

136
column of water within the sealed gastro-duodenal tube. Figure 8.3 shows the setup of
the water pressure test. No water was noted to drip through the tight seal, even at high
pressure sufficient to blow apart the connection of the bladder syringe with the gastric
tube.
Figure 8.3: Water pressure test in progress.
In theatres, just prior to starting the clinical trial on the volunteer, both gastric
tubes (the French 21 and the French 14 tubes) were opened from their sterile packaging
onto a trolley covered with a sterile drape. A member of the research team in sterile
gloves cut the tip of the French 14 tube and inserted it into the most proximal
(uppermost) side drainage hole of the French 21 gastro-duodenal tube in the direction
of the open top of the tube, until this short segment was entirely contained within the
lumen of the outer French 21 tube. An air pressure test was conducted in a sterile
manner at this stage to ensure a tight seal. Another member of the research team then
fed the intraluminal PPG probe into the proximal, open ended port of the French 21
gastro-duodenal tube, ensuring that the tube remains sterile. The sheathed probe was
then ready to be inserted via the mouth into the stomach of the patient. Two new tubes
were used for each patient recruited to the study, and disposed of at the end of each
clinical trial.

137
The approved sealing protocol included undertaking a final air pressure test and
visual inspection of the probe after it was removed at the end of the clinical trial. In the
event of contamination, the intraluminal PPG probe would be permanently disposed of
in order to avoid transmitting infection to a subsequent patient.
Figure 8.4 shows the intraluminal PPG probe inside the gastro-duodenal tube.
Figure 8.4: (top left) Tips of the 21 Fr tube and 14 Fr tube. (top right) 21 Fr tube sealed. (bottom) Intraluminal probe inside the sealed gastric tube
During clinical trials the finger PPG probe was covered with a CE marked single
patient use adhesive (Tegaderm, 3M, USA) to further reduce the risk of cross
contamination between patients. Like the gastric tubes, this adhesive was disposed of
at the end of each clinical trial.
Both probes were also tested for electrical isolation. Electrical continuity was
tested with one tip on the sensor surface and the other tip on the electrical connections
of the terminating plug. The intraluminal probe was placed inside the gastro-duodenal

138
tube and the finger probe was covered with an adhesive as they would be during the
study. No current passed between continuity probe tips.
8.2 Clinical trial protocol
Ethical approval was obtained from the NHS Research Ethics Committee and
from the Barts Health NHS Trust Research and Development to recruit adult ASA I to III
patients for the clinical study “Evaluation of a new method of monitoring upper
gastrointestinal arterial pulsation and oxygen saturations using an intra-luminal opto-
electronic probe”.
As part of the application for ethics approval, the PPG main processing system
and both intraluminal and finger PPG probes were assessed by the Clinical Physics and
Infection Control department at Barts Health NHS Trust for conformity to the
requirements of the Trust’s policy and approved for their intended purpose in this
research study (Appendix 3).
Nine patients (6 male and 3 female, mean age (±SD): 67.1 ± 9.3) undergoing
elective open laparotomy were recruited for this study following informed written
consent. Table 8.4 summarizes the patients’ details. Patients with oesophageal
pathologies or blood clotting disorders were excluded from the study.
Table 8.4: Details of the patients recruited for the clinical study “Evaluation of a new method of monitoring upper gastrointestinal arterial pulsation and oxygen saturations using an intra-
luminal opto-electronic probe”.
Patient study number Sex Age Procedure
1 Male 79 Liver resection
2 Male 67 Liver resection
3 Female 73 Liver resection
4 Male 74 Open cholecystectomy
5 Male 59 Liver resection
6 Female 55 Liver resection
7 Female 52 Pancreatectomy
8 Male 67 Pancreatectomy
9 Male 78 Liver resection

139
The study was observational only and patients’ surgical and anaesthetic
management were as per routine. After induction of anaesthesia and tracheal
intubation, the intraluminal PPG probe was inserted under direct vision into the
oesophagus by a clinical member of the research team and placed in the stomach. In
addition to the routine theatre monitoring, the finger PPG probe was attached to the
patient’s finger and the 3 lead ECG positioned on the chest in a bipolar lead I
configuration. A gas sampling line was attached to the patient’s breathing circuit on the
circuit side of the filter to avoid contamination.
After the abdominal incision, as soon as convenient, the surgeon milked the
intraluminal PPG probe by hand from the stomach into the duodenum, where it was left
for the duration of the study. PPG traces from the intraluminal probe were recorded
simultaneously with the PPG traces from the finger probe, the ECG trace and the air
sensing trace. The main processing unit was turned off during periods when surgical site
artefact rendered the intraluminal PPG traces unviable for SpO2 calculation.
The surgeon was asked to review the position of the intraluminal PPG probe
occasionally to ensure it remained in the duodenum.
The intraluminal PPG probe was removed at the end of the surgical procedure,
before extubation and patients’ wakening.
Observations from the patient’s routine monitoring equipment were recorded
throughout the study. These included the SpO2 values from the peripheral commercial
pulse oximeter (OxyTip+ OXY-F-B, Datex Ohmeda, GE Healthcare, USA), the blood
pressure (arterial catheter on radial artery), the heart rate and mechanical ventilation
parameters (inspired O2 concentration (FiO2), Positive Airway Pressure (PAP) and
Positive End-Expiratory Pressure (PEEP)). In the case report forms were also recorded
the results from the arterial blood gas samples performed as part of the routine
anaesthetic care of the patients.

140
8.3 Data analysis and results
Data recorded using the main processing unit and the virtual instrumentation
system was saved under the patient’s study number for offline analysis.
During the pre-trial health and safety checks for patient 4, it was found that the
connector for the finger PPG probe was faulty. It was the clinical collaborator’s decision
to proceed with the study. For this patient, no peripheral PPG signals were acquired, and
therefore there is no reference with which to compare the intraluminal signals. This
problem was rectified before the recruitment of the next patient.
The recorded signals were scrutinised and appraised for the presence of surgical
site artefact. Periods with loss of recognisable effect of cardiac frequency modulations
were rejected.
In some patients it was necessary to place the finger PPG probe in the same arm
as the non-invasive blood pressure monitoring cuff. The periods when the cuff inflation
would cause a great dampening of the finger PPG amplitudes were also rejected to avoid
bias.
A macro was then written in LabChart (ADInstruments, New Zealand) to evaluate
the resulting data every two seconds. Cyclic measurements for all PPG channels were
recorded for further analysis detailed below.
Measurable PPG traces at both infrared and red wavelengths were obtained in
the duodenum of all nine patients.
Figure 8.5 depicts photoplethysmographic signals of good quality and high signal
to noise ratio obtained from the duodenum in one patient for a 20 second interval. It
can be seen that the acquired traces are synchronous with the peripheral finger PPG and
the ECG signals, and thus attributable to the arterial blood pulsation. A moderate
respiratory modulation can be detected in both intraluminal and peripheral signals. It
can also be noted from Figure 8.5 that the intraluminal PPG signals have greater

141
respiratory induced variations than the ones obtained from the peripheral PPG probe.
The airway pressure trace was included for comparison.
Figure 8.5: AC and DC PPG signals obtained from the duodenum and finger. ECG and airway flow is included
Since all patients were undergoing major surgical procedures, the quality of the
PPG signals was degraded at times when the surgical team was manually handling the
patient’s abdominal organs. The data recorded were also affected by different
intraoperative events, some of which will be examined further. For the purpose of
evaluating whether the duodenum is a feasible site for PPG measurements, a sample of
the stable PPG signals from each patient were selected for analysis.
-10123456789
1011121314151617181920212223242526272829303132333435
Am
plit
ud
e (V
)
Time (hh:mm:ss)
4
0
-4
2
0
-2
4
0
4 2
0
2
ECG
A
ir
Fin
ger
Red
Fin
ger
IR
D
uo
d R
ed
D
uo
d IR

142
For each patient, the mean and standard deviation of the AC and DC amplitudes
were calculated by averaging the infrared and red PPG amplitudes over approximately
1:30 to 2 minutes. Table 8.5 shows the results for both the intraluminal and the
peripheral probe AC amplitudes while Table 8.6 shows the results for the DC amplitudes.
Table 8.5: Mean (± SD) AC amplitudes for intraluminal and peripheral PPG probes
Duod IR AC (V) Duod Red AC (V) Finger IR AC (V) Finger Red AC (V)
P1 8.45 ± 1.48 2.76 ± 0.78 2.80 ± 0.39 0.73 ± 0.09
P2 5.46 ± 1.09 2.57 ± 0.74 8.17 ± 1.02 2.25 ± 0.27
P3 3.19 ± 0.52 1.34 ± 0.44 7.39 ± 1.17 1.63 ± 0.35
P4 3.69 ± 0.70 1.30 ± 0.42 N/A N/A
P5 3.73 ± 0.75 0.99 ± 0.30 11.42 ± 1.27 3.43 ± 0.42
P6 5.99 ± 0.64 1.73 ± 0.36 8.14 ± 0.54 2.44 ± 0.18
P7 6.26 ± 1.86 3.52 ± 1.51 9.74 ± 0.33 2.89 ± 0.14
P8 13.37 ± 3.33 4.61 ± 1.37 6.56 ± 1.79 1.69 ± 0.60
P9 5.85 ± 1.05 1.97 ± 0.47 6.76 ± 0.39 2.45 ± 0.15
Table 8.6: Mean (± SD) DC amplitudes for intraluminal and peripheral PPG probes
Duod IR DC (V) Duod Red DC (V) Finger IR DC (V) Finger Red DC (V)
P1 3.27 ± 0.07 2.27 ± 0.03 2.01 ± 0.02 0.96 ± 0.00
P2 2.78 ± 0.16 2.19 ± 0.07 1.62 ± 0.01 0.91 ± 0.00
P3 3.03 ± 0.04 2.04 ± 0.02 1.91 ± 0.13 0.92 ± 0.03
P4 3.55 ± 0.06 2.33 ± 0.03 N/A N/A
P5 3.14 ± 0.01 2.69 ± 0.01 2.09 ± 0.03 1.39 ± 0.00
P6 3.11 ± 0.02 2.65 ± 0.01 1.98 ± 0.01 1.36 ± 0.00
P7 4.24 ± 0.07 3.39 ± 0.06 2.20 ± 0.02 1.47 ± 0.01
P8 1.02 ± 0.02 0.70 ± 0.01 2.28 ± 0.16 1.19 ± 0.04
P9 2.85 ± 0.02 1.50 ± 0.02 1.93 ± 0.02 1.32 ± 0.01
In order to provide a comparison between PPG sites, the mean of means AC and
DC PPG amplitudes for the intraluminal and the peripheral probes were calculated from
the values of Table 8.5 and Table 8.6. Figure 8.6 illustrates the mean of means of AC
amplitudes for the duodenum and the finger PPG probes, while Figure 8.7 shows the
mean of means of the DC amplitudes.

143
Figure 8.6: Mean of means AC amplitudes
Figure 8.7: Mean of means DC amplitudes
By observing Figure 8.6 and Figure 8.7, it can be seen that the AC amplitudes are
comparable in both sites, while the DC amplitudes are larger in magnitude in the
duodenum than in the finger.
Although this is an uncalibrated system, the extracted photoplethysmographic
data was used for computation of blood oxygen saturations from both the duodenum
and the finger sensors. Table 8.7 shows the mean SpO2 values obtained for the same
0
2
4
6
8
10
12
Duod IR AC (V) Duod Red AC (V) Finger IR AC (V) Finger Red AC (V)
Mean of means AC amplitudes
0
1
2
3
4
Duod IR DC (V) Duod Red DC (V) Finger IR DC (V) Finger Red DC (V)
Mean of means DC amplitudes

144
patient data samples used above. The SpO2 values obtained at these times using a
commercial pulse oximeter, part of the patients’ routine monitoring, are also included.
Table 8.7: Mean SpO2 (± SD) for the intraluminal PPG probe and the finger PPG probe, and commercial pulse oximeter values
Duod SpO2 Finger SpO2 Comm SpO2
P1 98.28 ± 2.18 96.29 ± 1.14 99
P2 94.97 ± 3.51 97.78 ± 0.30 98
P3 94.23 ± 5.24 98.41 ± 2.36 99
P4 96.56 ± 3.42 N/A 99
P5 102.25 ± 1.73 98.70 ± 0.24 99
P6 101.52 ± 1.30 99.05 ± 0.44 100
P7 92.67 ± 3.75 98.97 ± 0.30 100
P8 97.42 ± 2.39 97.56 ± 2.91 99
P9 93.71 ± 2.87 96.74 ± 0.24 99
Figure 8.8 shows the mean of means SpO2 from all three sensors - duodenum
PPG probe, finger PPG probe and commercial pulse oximeter.
Figure 8.8: Mean of means SpO2 for the intraluminal PPG probe, the finger PPG probe and the commercial pulse oximeter
It can be noted from Figure 8.8 that the peripheral PPG probe is in good
agreement (97.93%) with the commercial pulse oximeter (99.1%). The results obtained
with the duodenum PPG probe have more variance in terms of SpO2, with the mean of
mean value (96.84%) showing an underestimation of approximately 2% in comparison
with the commercial device.
85
87
89
91
93
95
97
99
101
Duod SpO2 Finger SpO2 Comm SpO2
Mean of means SpO2

145
It was mentioned previously that a moderate respiratory modulation is
detectable in the PPG signals obtained. These variations were more visible in the
intraluminal signals in Figure 8.5. These could have an effect on the calculated SpO2
values shown on Figure 8.8.
In order to isolate the pulsatility of arterial blood, a frequency domain algorithm
was applied to the data. The PPG signal was subjected to a Fourier transform and the
frequency of interest, in this case the heart rate, was identified. The ratio of ratios R
variable needed to compute the saturation from the equation SpO2=110-25R (detailed
in chapter 5), is achieved from the spectral amplitude of the red and infrared AC signals
at heart rate. The denominator is selected as the spectral amplitude of the
corresponding DC signals at zero frequency. The same process was repeated at the
ventilation rate. This has been shown to yield lower saturation values [10], [11] and is
presumed to represent the saturations from the venous vascular bed.
Below, in Table 8.8, are the obtained blood saturations using the frequency
domain method at both the cardiac and respiratory frequencies for the intraluminal and
the finger probes.
Table 8.8: Frequency domain SpO2 values for the intraluminal and the finger PPG probes
Duod SpO2
Cardiac Finger SpO2
Cardiac Duod SpO2
Resp Finger SpO2
Resp
P1 100.90 100.28 96.16 98.29
P2 96.21 98.24 91.94 91.48
P3 101.73 101.09 93.76 95.85
P4 101.21 N/A 79.69 N/A
P5 107.64 99.21 100.59 100.08
P6 102.40 99.60 104.15 98.74
P7 97.74 99.07 91.58 96.55
P8 99.53 100.43 99.71 97.42
P9 98.05 99.38 95.65 98.57

146
Figure 8.9 shows the mean SpO2 from the values from Table 8.8, alongside the
SpO2 values calculated before using the time domain method and also the values from
the commercial pulse oximeter.
Figure 8.9: Frequency and time domain SpO2 values for the intraluminal PPG probe and the finger PPG probe (highlighted in a darker colour) and mean commercial pulse oximetry values
(in light blue)
Figure 8.10: Scatter graph of mean SpO2 values obtained using frequency and time domain algorithms for the intraluminal PPG probe and the finger PPG probe, in comparison to the
commercial pulse oximeter values. The different colours indicate each patient’s SpO2 values and the black line represents the mean of means SpO2 for each calculation method.
85
87
89
91
93
95
97
99
101
103
105
duod FFTcardiac
finger FFTcardiac
duod calcSpO2
finger calcSpO2
duod FFTresp
finger FFTresp
comm pulseoximeter
Mea
n S
pO
2 (
%)
75
80
85
90
95
100
105
110
duod FFTcardiac
fingerFFT
cardiac
duod calcSpO2
fingercalc SpO2
duod FFTresp
fingerFFT resp
commpulse
oximeter
Mea
n S
pO
2 (
%)
Mean ofmeans SpO2P1
P2
P3
P4
P5
P6
P7
P8
P9

147
The mean SpO2 values obtained using the frequency domain method at the
cardiac frequency are clearly of higher magnitude than the ones obtained using the time
domain method. Both intraluminal and peripheral values are nearer to the commercial
SpO2 value at 100.59 ± 3.15 and 99.66 ± 0.84, respectively. The respiratory frequency
estimation produced lower saturation values than the other calculations. It can be also
noted in Figure 8.9 that the time domain calculations fall between the cardiac and
respiratory frequency SpO2 calculations.
8.3.1 Other events
The study at hand was conducted on patients undergoing laparotomy as part of
elective surgery. During major surgery, both predictable and unpredictable events can
have an effect on the patient and therefore on the haemodynamic variables being
monitored.
It was referred previously that the data recorded from some of the patients were
affected by such events. Here we will focus on two such cases. In these two situations,
there were measurable traces during the event and also 10 to 20 minutes before and
after where the patients were stable and their vital signs were within the normal limits.
8.3.1.1 Case 1
During patient 1’s intervention, portal vein clamping compounded by an
elevated central venous pressure and blood loss, lead to a situation of hypotension.
Portal vein clamping is used as a method of controlling bleeding during liver
resection and of better preservation of organ function in the postoperative phase.
However, this method of inflow control can increase the risk of ischaemic injury and
splanchnic congestion [132].
AC and DC PPG signals obtained from the duodenum and finger at three different
time-points (before, during and after portal vein clamping) shows the changes in PPG AC
and DC waveform amplitude and morphology before, during and after the event.

148
Figure 8.11: AC and DC PPG signals obtained from the duodenum and finger at three different time-points (before, during and after portal vein clamping)
Table 8.9 shows the SpO2 values calculated using the time and frequency domain
methods for each period: before, during and after the portal vein clamping. Systolic and
diastolic blood pressures are also included, along with the commercial pulse oximeter
values.
-1
0
1
2
3
4
5
6
7
8
9
10
11
12
13
14
15
16
17
18
19
20
21
22
23
24
25
26
27
28
29
30
Am
plit
ud
e (V
)
Time (hh:mm:ss)
before ¦ during ¦ after
4
0
-4
2
0
-2
4
0
4 2
0
2
Fin
ger
Red
Fin
ger
IR
D
uo
d R
ed
D
uo
d IR

149
Table 8.9: Blood pressure and time and frequency domain SpO2 calculations before, during and after portal vein clamping
Before PVC During PVC After PVC
Systolic pressure 84 55 100
Diastolic pressure 45 32 53
Time domain:
Duod calc SpO2 93.87 ± 6.04 68.31 ± 14.76 77.07 ± 3.18
Finger calc SpO2 96.82 ± 1.78 95.29 ± 3.27 89.80 ± 9.79
Frequency domain:
Duod SpO2 cardiac 98.33 87.98 77.90
Finger SpO2 cardiac 100.62 100.55 97.21
Duod SpO2 resp 86.68 69.70 77.79
Finger SpO2 resp 91.69 85.36 79.24
Comm pulse oximeter 98 97 98
A change in SpO2 can be noted for every PPG signal on Table 8.9 throughout this
event, both intraluminally and peripherally. The results from the duodenum probe
shows a decrease in SpO2 during the portal vein clamp. It is important to notice the
differences between the time domain and frequency domain results. The time domain
calculations yield a greater drop during clamping than those on the frequency domain,
converging after clamp to the same value as the respiratory frequency calculation. On
the other hand, the time domain results obtained from the finger probe show a decrease
in SpO2 but mainly after portal vein clamping.
There is no major change in the values obtained from the commercial pulse
oximeter.
In terms of amplitudes of the PPG signals, the changes can be visualised in Figure
8.12 and Figure 8.13.

150
Figure 8.12: Mean AC PPG amplitudes before, during and after portal vein clamping
Figure 8.13: Mean DC PPG amplitudes before, during and after portal vein clamping
The biggest change in amplitude of PPG signals happened in the AC signals. There
was a reduction in amplitudes during portal vein clamp and an increase afterwards. This
was also true for the finger PPG signals, as could be seen in Figure 8.11.
8.3.1.2 Case 2
Patient 8 became hypotensive during the surgical procedure. Figure 8.14 shows
the changes in amplitude and morphology of the intraluminal and peripheral PPG signals
throughout this event.
0
1
2
3
4
5
6
7
before during after
Am
plit
ud
e (V
)
PPG AC amplitudes
Duod IR AC
Duod Red AC
Finger IR AC
Finger Red AC
0
1
2
3
before during after
Am
plit
ud
e (V
)
PPG DC amplitudes
Duod IR DC
Duod Red DC
Finger IR DC
Finger Red DC

151
Figure 8.14: AC and DC PPG amplitudes obtained from the duodenum and the finger at three different time-points (before, during and after hypotensive event)
From Figure 8.14 it can be noted that there is respiratory modulation in the
waveforms obtained from the duodenum PPG probe. This is not as noticeable in the
finger PPG waveforms. There is also a decrease in amplitude in the intraluminal signals
during the hypotensive event, with the opposite effect seen for the peripheral probe.
Figure 8.15 and Figure 8.16 demonstrate these changes graphically.
-2-10123456789
10111213141516171819202122232425262728293031323334353637383940414243
Am
plit
ud
e (V
)
Time (hh:mm:ss)
before ¦ during ¦ after
Fin
ger
Red
F
inge
r IR
D
uo
d R
ed
Du
od
IR
4
0
-4
2
0 -2
4
0
4 2
0 -2

152
Figure 8.15: Mean AC PPG amplitudes before, during and after hypotensive event
Figure 8.16: Mean DC PPG amplitudes before, during and after hypotensive event
The SpO2 values before during and after the hypotension event were calculated
using the time and frequency domain methods and can be seen in Table 8.10. Systolic
and diastolic blood pressures are also included, along with the commercial pulse
oximeter values.
0
2
4
6
8
10
12
14
16
before during after
PPG AC amplitudes
Duod IR AC
Duod Red AC
Finger IR AC
Finger Red AC
0
0.5
1
1.5
2
2.5
3
before during after
PPG DC amplitudes
Duod IR DC
Duod Red DC
Finger IR DC
Finger Red DC

153
Table 8.10: Blood pressures and time and frequency domain SpO2 calculations before, during and after hypotensive event
before During After
Systolic pressure 90 60 88
Diastolic pressure 55 38 45
time domain:
Duod calc SpO2 97.42 ± 2.39 103.91 ± 1.96 88.94 ± 3.90
Finger calc SpO2 97.56 ± 2.91 96.86 ± 0.45 97.82 ± 0.29
frequency domain:
Duod SpO2 cardiac 99.53 100.08 89.44
Finger SpO2 cardiac 100.43 99.99 99.16
Duod SpO2 resp 99.71 100.34 85.96
Finger SpO2 resp 97.42 97.43 99.76
Comm pulse oximeter 99 99 99
Table 8.10 shows a decrease in intraluminal SpO2 not during but after the
hypotension episode had been resolved. Time and frequency domain calculations show
the same trend. No significant change can be seen in either the finger PPG probe
calculations or the commercial pulse oximeter values.
8.3.2 Gastric measurements
As part of their procedure, all patients had a nasogastric tube inserted for
aspiration of gastric contents. This causes gastric decompression, enabling
measurements to be obtained from the stomach lining. As noted before, the surgeon
was asked to review the position of the intraluminal probe and in some patients it was
found located in the stomach. As detailed below, PPG signals can be successfully
recorded under these conditions. As soon as convenient, the intraluminal probe was
replaced in the duodenum.
Measurable PPG traces were obtained from the stomach of 3 patients.
Figure 8.17 depicts photoplethysmographic signals of good quality and high
signal to noise ratio obtained from the stomach lining in one patient for a 10 second
interval. It can be seen that the acquired traces are synchronous with the peripheral
finger PPG and the ECG signals, and thus attributable to the arterial blood pulsation.

154
Figure 8.17: AC and DC PPG signals obtained from the stomach and finger. ECG is included
Like with the data obtained from the duodenum, a sample of good quality signals
collected from the stomach for each patient were analysed. Table 8.11 and Table 8.12
show the average and standard deviation of the gastric and peripheral AC and DC
amplitudes.
Table 8.11: Mean (± SD) AC PPG amplitudes from gastric and peripheral measurements
Gastric IR AC (V) Gastric Red AC (V) Finger IR AC (V) Finger Red AC (V)
P2 4.68 ± 0.98 1.51 ± 0.48 6.28 ± 1.67 1.41 ± 0.34
P3 4.84 ± 1.03 2.33 ± 1.18 7.41 ± 0.61 1.41 ± 0.12
P6 4.07 ± 0.41 1.50 ± 0.34 12.38 ± 0.50 3.92 ± 0.16
-1
0
1
2
3
4
5
6
7
8
9
10
11
12
13
14
15
16
17
18
19
20
21
22
23
Am
plit
ud
e (V
)
Time (hh:mm:ss)
3
0
-3
2
0
-2
2
0
-2
1
0
-1
ECG
Fin
ger
Red
F
inge
r IR
Gas
tric
Red
Gas
tric
IR

155
Table 8.12: Mean (± SD) DC PPG amplitudes from gastric and peripheral measurements
Gastric IR DC (V) Gastric Red DC (V) Finger IR DC (V) Finger Red DC (V)
P2 2.73 ± 0.12 2.03 ± 0.01 1.81 ± 0.10 0.98 ± 0.03
P3 3.38 ± 0.11 2.48 ± 0.14 1.87 ± 0.05 0.84 ± 0.01
P6 3.02 ± 0.01 2.30 ± 0.01 2.00 ± 0.02 1.36 ± 0.01
The mean of means of the AC and DC amplitudes were calculated from the
results shown in Table 8.11 and Table 8.12. Figure 8.18 and Figure 8.19 provide a
comparison between the measurements taken from the stomach and the ones obtained
from the peripheral finger PPG probe.
Figure 8.18: Mean of means AC PPG amplitudes from gastric and peripheral measurements
Figure 8.19: Mean of means DC PPG amplitudes from gastric and peripheral measurements
0
0.5
1
1.5
2
2.5
3
3.5
Gastric IR DC (V) Gastric Red DC (V)
Mean of means AC amplitudes
0
0.5
1
1.5
2
2.5
3
3.5
Gastric IR DC (V) Gastric Red DC (V)
Mean of means DC amplitudes

156
The results obtained from the stomach show a similar pattern to the ones
obtained from the duodenum, when comparing to the finger PPG probe. In Figure 8.18
it can be seen that the AC amplitudes are comparable to the finger, but slightly smaller
in magnitude, while Figure 8.19 shows the stomach DC amplitudes to be of greater
magnitude than the finger ones.
Table 8.13 shows the mean SpO2 values obtained for the same patient data
samples used above. The mean of means is also included for all 3 probes – intraluminal
PPG probe, peripheral PPG probe and commercial pulse oximeter.
Table 8.13: Mean (± SD) and mean of means of SpO2 calculations from gastric and peripheral measurements and commercial pulse oximeter values
Gastric SpO2 Finger SpO2 Comm SpO2
P2 99.04 ± 2.93 99.52 ± 0.76 98
P3 93.90 ± 5.27 99.45 ± 0.61 99
P6 97.97 ± 1.86 98.37 ± 0.23 100
Mean of means 96.97 ± 2.21 99.11 ± 0.53 99.0 ± 0.82
It can be seen from Table 8.13 that the SpO2 values calculated for the data
obtained from the probe placed in the stomach have a greater variance than the ones
calculated and obtained from the finger probes. This lead to a mean of means SpO2
calculation underestimation of approximately 2%. The finger PPG probe results were in
good agreement with the commercial pulse oximeter values.
Frequency domain calculations were done for the same selected data for
comparison to the time domain calculations.
Table 8.14: Frequency domain SpO2 calculations for gastric and peripheral PPG probe
Gastric SpO2
cardiac Gastric SpO2
resp Finger SpO2
cardiac Finger SpO2
Resp
P2 99.83 93.64 99.97 93.09
P3 96.91 88.34 100.94 98.39
P6 103.51 86.48 98.97 98.85
Mean 100.08 ± 2.70 89.49 ± 3.04 99.96 ± 0.80 96.77 ± 2.62

157
Like the results from the duodenal position, Table 8.14 shows that, using the
frequency domain calculation at the cardiac frequency, the value of SpO2 in the stomach
is greater than the one calculated using the time domain algorithm and, so, in greater
agreement to the commercial pulse oximeter values. The respiratory frequency
calculations produced lower saturations with the greatest differences seen for the
gastric measurements.
8.4 Discussion
Good quality PPG signals with large amplitudes were obtained from all patients
recruited for the clinical study. However, since all measurements were obtained during
the regular surgical procedures, the data was at times compromised by motion artefact.
So, in order to evaluate the accuracy of measurements obtained from the duodenum, a
sample was selected of the best signals from each patient collected at periods of
haemodynamical stability. This was evaluated from the patients’ routine monitoring
parameters, which were recorded on the case report forms.
Analysis of the mean of means PPG amplitudes showed the AC amplitudes to be
comparable to the ones obtained with the finger PPG probe while the DC amplitudes
were greater for both infrared and red wavelengths. Regional differences in vascularity
may account for these differences; it is known that the luminal mucosa of the mid
gastrointestinal tract has particularly high vascular density. In contrast, the finger’s
external surface of the epidermis is composed of layers of dead tissue characterized by
the heavy presence of keratinocytes and thickened plasma membranes [13]. The
differences in tissue type and volume of blood lead to changes in the path length of the
light travelling through the tissue under investigation.
Calculation of SpO2 values showed an underestimation of the intraluminal probe
of approximately 2% when compared to the commercial pulse oximeter. Considering
this is an uncalibrated system, the difference is not alarming. This difference was not
seen for the finger PPG probe.

158
The obtained PPG signals presented with moderate modulation at respiratory
rate. Ventilator artefact has been described before when monitoring
photoplethysmographs from internal organs [5], [133], and could possibly have a
detrimental effect on the estimation of SpO2. It has also been hypothesized before that
the respiratory modulations on the tissue blood volume, brought on by changes in
thoracic pressure, could enable the measurement of venous oxygenation [104]. A
frequency domain algorithm was therefore applied to the data in order to isolate the
cardiac cycle modulations of the PPG signals. In pulse oximetry it is assumed that this
allows differentiation of the arterial blood component from the venous blood and other
tissues. The calculated SpO2 values are of higher magnitude and also closer to the finger
probe SpO2 values and the commercial pulse oximeter values.
The frequency domain algorithm was also applied at the respiratory frequency.
This yielded lower saturation values in the calculations for both intraluminal (94.80 ±
6.63 %) and finger (97.12 ± 2.47 %) PPG probes. These results are within the
physiological range expected for venous blood oxygen saturations.
During the clinical trials, two patients experienced hypotension. PPG signals
obtained before, during and after these events showed noteworthy variations. SpO2
calculations for patient 1 showed a significant decrease during hypotension from 93.87%
to 68.31%. Same as seen before, frequency domain calculations yielded saturations of
higher magnitude for the cardiac frequency and of lower magnitude for the respiratory
frequency, suggesting the time domain results may be affected by respiratory
modulation.
Considering the frequency domain calculations, however, there was a 10%
decrease in saturation for the cardiac frequency during the hypotensive event. The
respiratory frequency yielded a much lower saturation at 69.70%. These results could
signify the onset of hypoxia in the gut and the ability of photoplethysmography to detect
it.
Finger SpO2 calculations and commercial pulse oximeter values did not
demonstrate this change, even though the respiratory frequency calculation for the
finger PPG probe during the event showed a decrease to a saturation of 85.36%. Patient

159
1 was undergoing a portal vein clamp as part of his procedure and was in an unstable
situation of elevated central venous pressure and blood loss. This could explain a
reduced global venous blood oxygenation.
After the event, when monitored haemodynamic variables were back to normal
values, the calculated saturations for the duodenum and the respiratory frequency
calculation for the finger probe converged to a value of approximately 78%.
It was described before in section 3.3 that the splanchnic area is prone to hypoxia
in situations of hypotension and hypovolaemia, which may lead to ischaemia and shock.
An imbalance in oxygen demand/supply resulting from the region’s metabolic and
mechanic regulations may explain this lowered saturation. Also, the collateral
arrangement of blood vessels into intramural and extramural capillary beds [7] could
possibly lead to a propagation of the cardiac blood flow pulse into the venous
compartment.
Patient 8 also experienced a reduction in amplitude during his episode of
hypotension and a decrease in calculated SpO2 afterwards corroborates the splanchnic
region vulnerability on being the last to regain adequate flow and thus being more prone
to developing hypoxia.
In 3 patients, the intraluminal probe was found to have fallen into the stomach.
Since a nasogastric tube inserted for aspiration caused gastric decompression, good
quality measurements were obtained from the gastric lining. The results were similar to
the duodenum, with higher DC PPG amplitudes than the finger PPG probe. An
underestimation of 2% was found when comparing time domain SpO2 calculations to
the commercial pulse oximeter, and this difference was cancelled when frequency
domain calculations were applied. The mucosa layer of the stomach and its blood supply
are similar to the duodenum and therefore similar results are to be expected.
Nevertheless, the sample size is too small for further considerations regarding
photoplethysmography from the gastric mucosa.

160
Chapter
9
CONCLUSION
The goal of this research was to evaluate the feasibility of using the technique of
photoplethysmography intraluminally in the duodenum in order to measure the
haemodynamic changes occurring in the splanchnic circulation. Bespoke hardware and
data acquisition virtual instrumentation were developed to be used in conjunction with
existing intraluminal PPG probe during clinical trials on 9 patients undergoing open
laparotomy.
A two channel dual wavelength PPG processing system was successfully
developed to accommodate two PPG probes. These were an intraluminal probe and a
finger probe, both custom developed within the Biomedical Research Lab and used in
previous studies. This portable, battery powered system also included an ECG channel
and an airway pressure channel to detect the patient’s ventilation flow. After
digitisation, the PPG, ECG and airway pressure signals were transferred to a laptop
computer for saving, processing and real time display using a Virtual Instrument
implemented on LabVIEW. The system was evaluated in the laboratory and it was found
that good quality PPG signals could be obtained from the finger of a healthy volunteer.
Ethical approval was obtained from the NHS Research Ethics Committee and
from the Barts Health NHS Trust Research and Development for the clinical study
“Evaluation of a new method of monitoring upper gastrointestinal arterial pulsation and
oxygen saturations using an intra-luminal opto-electronic probe”.

161
As part of the application for ethics approval, the PPG processing system and
both intraluminal and finger PPG probes were assessed and approved for use by the
Clinical Physics and Infection Control department at Barts Health NHS Trust.
Good quality red and infrared PPG signals were obtained intraoperatively from
the duodenal mucosa of all 9 patients recruited to the clinical study following informed
written consent.
It is important to note that, due to the great proximity to the surgical site,
intraoperative monitoring of duodenal SpO2 could not be done in a continuous way, plus
during these measurements there was considerable movement artefact imposed on the
signals induced by the surgical team. Therefore, to check the accuracy of duodenal PPG,
offline analysis was conducted using a sample of the good quality PPG signals collected
from each patient at periods of haemodynamic stability. These signals were larger in
amplitude than the ones obtained with the finger PPG probe, but calculations of SpO2
showed an underestimation of 2% when compared to the both the finger probe and the
commercial device. Even though this is an uncalibrated system and thus prone to
displaying such behaviours, further investigations were warranted. Analysis of the PPG
waveform in the frequency domain has been previously described as a possible method
of estimating arterial blood oxygen saturation. At the heart rate frequency the
calculation of SpO2 yielded higher values, more in agreement with the finger PPG probe
and the commercial device. Close inspection of the duodenal PPG waveform reveals a
moderate modulation at the respiratory rate which could explain the difference in SpO2
between the duodenum and the finger calculations using the traditional method.
Previous research has demonstrated respiratory modulation of the venous
compartment and the possibility of estimating venous blood oxygen saturation from
PPG signals. Using the frequency domain algorithm at the respiratory rate, lower values
of blood oxygen saturation were obtained for both the duodenum and the finger PPG
signals; these were within the expected physiological range for venous blood.
During their routine surgical interventions, two of the patients recruited for this
observational clinical study experienced an episode of hypotension. Neither the finger
PPG probe nor the commercial pulse oximeter registered any noteworthy changes. In

162
contrast, the intraluminal PPG probe outputted a significant decrease in amplitude and
SpO2 calculations unveiled an interesting situation to consider in each case. For the first
patient, calculations at the cardiac frequency revealed a decrease of SpO2 of 10%, which
was not seen in the second patient. However, both of them showed a further decrease
10 to 20 minutes after the event, at a time when vital signs had returned to their normal
limits. SpO2 values match the calculated values at respiratory rate for both the
intraluminal and the finger PPG probes. This suggests the possibility of
photoplethysmography identifying changes in tissue oxygenation and blood volume in
the splanchnic circulation resulting from external and/or internal regulatory
mechanisms. Further investigations need to be conducted to determine whether these
haemodynamic changes may provide a warning sign for the development of ischaemia.
As the intraluminal PPG probe was not affixed to the duodenal mucosa, with the
intraoperative activity and movement, in some occasions it moved into the stomach. As
part of the surgical procedure, all patients had a nasogastric tube inserted which caused
decompression of the stomach. This enabled measurements to be taken from the gastric
mucosa. Stomach PPG signals were of good quality with SpO2 values within the
physiological range when using the frequency domain algorithm – time domain
calculations showed an underestimation alike the duodenal measurements. Due to the
reduced sample size, these results are not conclusive. But their trending shows
similarities to the duodenum, making the stomach, when deflated, a potential PPG site.
This is the first described study done in human patients of a minimally invasive
photoplethysmographic estimation of blood oxygen saturation of the splanchnic
circulation. Beyond accurately measuring SpO2 from the duodenum and the deflated
stomach, the developed PPG system with existing intraluminal probe demonstrated the
capability of identifying periods of compromised perfusion. It thus shows great promise
as complementary monitoring for patients at risk of developing splanchnic ischaemia.
Future work
Due to the potentially significant clinical use for the technique described in this
thesis, it may be important to consider the following lines of research:

163
Recruiting more patients in order to confirm and solidify hypothesis that
this technique may provide early detection of splanchnic hypoxia. Animal studies are
already present in literature confirming its potential.
The probe described by Jacquet-Lagrèze and colleagues [88], which
included an inflatable balloon to ensure contact of the sensor with the mucosal wall,
could be considered. It however required regular deflation. From the study presented
in this thesis, there seems to be a need for an instantaneous – even if not so much
continuous – blood oxygen calculation which wouldn’t be viable if a balloon had to be
inflated at regular times. Different technology of expanding tubular fabric, possibly
inspired by blood vessel stents, could be the subject of research.
The gastric mucosa should be investigated further.
Photoplethysmography has been avoided in the stomach, but the present study
confirms that signals can be obtained from the gastric mucosa if the organ is deflated.
Possibility of including a PPG sensor in the tip of nasogastric tube that causes deflation
could be under consideration.

164
References
[1] S. M. Pastores, D. P. Katz, and V. Kvetan, ‘Splanchnic ischemia and gut mucosal injury in sepsis and the multiple organ dysfunction syndrome’, Am. J. Gastroenterol., vol. 91, no. 9, pp. 1697–1710, Sep. 1996.
[2] D. A. Vagts and G. F. Nöldge-Schomburg, ‘[Hemodynamic monitoring of splanchnic circulation--does the benefit outweight risk of of regional circulation monitoring?]’, Anaesthesiol. Reanim., vol. 26, no. 4, pp. 96–101, 2001.
[3] Träger, P. Radermacher, A. Brinkmann, E. Calzia, and P. Kiefer, ‘Gastrointestinal tract resuscitation in critically ill patients.’, Curr. Opin. Clin. Nutr. Metab. Care, vol. 6, no. 2, pp. 587–591, 2003.
[4] D. R. Dantzker, ‘The Gastrointestinal Tract’, JAMA J. Am. Med. Assoc., vol. 270, no. 10, pp. 1247 –1248, 1993.
[5] M. Hickey, N. Samuels, N. Randive, R. M. Langford, and P. A. Kyriacou, ‘Investigation of photoplethysmographic signals and blood oxygen saturation values obtained from human splanchnic organs using a fiber optic sensor’, J. Clin. Monit. Comput., vol. 25, no. 4, pp. 245–255, Sep. 2011.
[6] J. J. Kolkman, M. Bargeman, A. B. Huisman, and R. H. Geelkerken, ‘Diagnosis and management of splanchnic ischemia’, World J. Gastroenterol. WJG, vol. 14, no. 48, pp. 7309–7320, Dec. 2008.
[7] P. R. Kvietys, The Gastrointestinal Circulation. San Rafael USA: Morgan & Claypool Life Sciences, 2010.
[8] D. L. Bowton, P. E. Scuderi, L. Harris, and E. F. Haponik, ‘Pulse oximetry monitoring outside the intensive care unit: progress or problem?’, Ann. Intern. Med., vol. 115, no. 6, pp. 450–454, Sep. 1991.
[9] J. G. Webster, Encyclopedia of Medical Devices and Instrumentation: Nanoparticles - Radiotherapy accessories. Wiley-Interscience, 2006.
[10] J. P. Phillips, A. Belhaj, K. Shafqat, R. M. Langford, K. H. Shelley, and P. A. Kyriacou, ‘Modulation of finger photoplethysmographic traces during forced respiration: Venous blood in motion?’, in 2012 Annual International Conference of the IEEE Engineering in Medicine and Biology Society (EMBC), 2012, pp. 3644 –3647.
[11] Z. D. Walton, P. A. Kyriacou, D. G. Silverman, and K. H. Shelley, ‘Measuring venous oxygenation using the photoplethysmograph waveform’, J. Clin. Monit. Comput., vol. 24, no. 4, pp. 295–303, Aug. 2010.

165
[12] T. Duke, ‘Dysoxia and lactate’, Arch. Dis. Child., vol. 81, no. 4, pp. 343–350, Oct. 1999.
[13] G. J. Tortora and B. Derrickson, Principles of Anatomy and Physiology. John Wiley and Sons, 2008.
[14] J. Enderle and J. Bronzino, Introduction to Biomedical Engineering. Academic Press, 2011.
[15] T. J. Johnson, Critical Care Pharmacotherapeutics. Jones & Bartlett Publishers, 2012.
[16] N. Soni and P. Williams, ‘Positive pressure ventilation: what is the real cost?’, Br. J. Anaesth., vol. 101, no. 4, pp. 446–457, Oct. 2008.
[17] A. B. Lumb and J. F. Nunn, Nunn’s applied respiratory physiology, 5th ed. Elsevier/Butterworth Heinemann, 2000.
[18] D. Damianou, ‘The wavelength dependence of plethysmography and its implications to pulse oximetry’, PhD Dissertation, University of Nottingham, 1995.
[19] ‘Anaesthesia UK : The central venous pressure.’ [Online]. Available: http://www.frca.co.uk/article.aspx?articleid=100035. [Accessed: 03-Apr-2013].
[20] R. N. Pittman, ‘Oxygen Transport’, 2011. [Online]. Available: http://www.ncbi.nlm.nih.gov/books/NBK54103/. [Accessed: 03-Apr-2013].
[21] J. G. Webster, Design of pulse oximeters. CRC Press, 1997.
[22] R. Law and H. Bukwirwa, ‘The physiology of oxygen delivery’, Update Anaesth., vol. 10, no. 1–2, p. 39, 1999.
[23] R. M. Leach and D. F. Treacher, ‘Oxygen transport--2. Tissue hypoxia’, BMJ, vol. 317, no. 7169, pp. 1370–1373, Nov. 1998.
[24] ‘Cellular pathophysiology. Part 2: responses following hypoxia.’ [Online]. Available: http://www.nursingtimes.net/cellular-pathophysiology-part-2-responses-following-hypoxia/200091.article. [Accessed: 03-Apr-2013].
[25] ‘The Four Hypoxias.’ [Online]. Available: http://er-trauma101.blogspot.co.uk/2011/04/four-hypoxias.html. [Accessed: 03-Apr-2013].
[26] D. D. Heistad and F. M. Abboud, ‘Dickinson W. Richards Lecture: Circulatory adjustments to hypoxia’, Circulation, vol. 61, no. 3, pp. 463–470, Mar. 1980.
[27] ‘Cellular pathophysiology. Part 1: changes following tissue injury.’ [Online]. Available: http://www.nursingtimes.net/cellular-pathophysiology-part-1-changes-following-tissue-injury/200093.article. [Accessed: 03-Apr-2013].

166
[28] C. Ince, ‘The microcirculation is the motor of sepsis’, Crit. Care, vol. 9, no. Suppl 4, pp. S13–S19, 2005.
[29] H. L. Bockus and J. E. Berk, Bockus gastroenterology, 2nd ed. WB Saunders, 1993.
[30] H. Gray, P. L. Williams, and L. H. Bannister, Gray’s anatomy: the anatomical basis of medicine and surgery. Churchill Livingstone, 1995.
[31] ‘Duodenum’, In The Hutchinson unabridged encyclopedia with atlas and weather guide. Helicon, Abington, United Kingdom, 2014.
[32] M. V. Jayaraman, W. W. Mayo-Smith, J. S. Movson, D. E. Dupuy, and M. T. Wallach, ‘CT of the duodenum: an overlooked segment gets its due’, Radiogr. Rev. Publ. Radiol. Soc. N. Am. Inc, vol. 21 Spec No, pp. S147–160, Oct. 2001.
[33] R. S. Snell, Clinical Anatomy by Regions. Lippincott Williams & Wilkins, 2011.
[34] K. L. Moore, A. F. Dalley, and A. M. R. Agur, Clinically Oriented Anatomy. Lippincott Williams & Wilkins, 2013.
[35] M. Feldman, L. S. Friedman, and L. J. Brandt, Sleisenger and Fordtran’s Gastrointestinal and Liver Disease: Pathophysiology, Diagnosis, Management, Expert Consult Premium Edition - Enhanced Online Features. Elsevier Health Sciences, 2010.
[36] T. Yamada, Textbook of gastroenterology. Blackwell Pub., 2009.
[37] F. H. Netter, The Netter Collection of Medical Illustrations: Digestive System: Upper Digestive Tract, 2nd ed., vol. Volume 3 Part 1. Novartis Publication, 1997.
[38] S. G. Schultz and J. D. Wood, Eds., Handbook of Physiology: Section 6: The Gastrointestinal System Volume I: Motility and Circulation, Parts 1 & 2. Oxford University Press, USA, 1989.
[39] A. Marston, Splanchnic Ischemia and Multiple Organ Failure. C.V. Mosby, 1989.
[40] S. M. Hollenberg, ‘Inotrope and Vasopressor Therapy of Septic Shock’, Crit. Care Clin., vol. 25, no. 4, pp. 781–802, Oct. 2009.
[41] D. A. Parks and E. D. Jacobson, ‘Physiology of the Splanchnic Circulation’, Arch Intern Med, vol. 145, no. 7, pp. 1278–1281, Jul. 1985.
[42] V. Starc, ‘Effects of Myogenic and Metabolic Mechanisms on the Autoregulation of Blood Flow Through Muscle Tissue: A Mathematical Model Study’, Cardiovasc. Eng. Int. J., vol. 4, no. 1, pp. 81–88, Mar. 2004.
[43] J. Takala, ‘Determinants of splanchnic blood flow’, Br. J. Anaesth., vol. 77, no. 1, pp. 50–58, Jul. 1996.

167
[44] L. Holm-Rutili, M. A. Perry, and D. N. Granger, ‘Autoregulation of gastric blood flow and oxygen uptake’, Am. J. Physiol., vol. 241, no. 2, pp. G143–149, Aug. 1981.
[45] L. Oud and M. T. Haupt, ‘Persistent gastric intramucosal ischemia in patients with sepsis following resuscitation from shock’, Chest, vol. 115, no. 5, pp. 1390–1396, May 1999.
[46] J. Hall, G. Schmidt, and L. Wood, Principles of Critical Care, Third Edition. McGraw Hill Professional, 2005.
[47] G. Garrabou, C. Morén, S. López, E. Tobías, F. Cardellach, O. Miró, and J. Casademont, ‘The effects of sepsis on mitochondria’, J. Infect. Dis., vol. 205, no. 3, pp. 392–400, Feb. 2012.
[48] A. C. Guyton and J. E. Hall, Human physiology and mechanisms of disease. Saunders, 1997.
[49] I. Greaves, K. M. Porter, and J. M. Ryan, Trauma Care Manual. Hodder Arnold, 2001.
[50] J. P. Desborough, ‘The stress response to trauma and surgery’, Br. J. Anaesth., vol. 85, no. 1, pp. 109–117, Jul. 2000.
[51] M. Nakatsuka, ‘Assessment of Gut Mucosal Perfusion and Colonic Tissue Blood Flow During Abdominal Aortic Surgery with Gastric Tonometry and Laser Doppler Flowmetry’, Vasc. Endovascular Surg., vol. 36, no. 3, pp. 193 –198, May.
[52] S. O. Heard, ‘Gastric Tonometry*’, Chest, vol. 123, no. 5 suppl, p. 469S –474S, May 2003.
[53] F. M. P. van Haren, J. W. Sleigh, P. Pickkers, and J. G. Van der Hoeven, ‘Gastrointestinal perfusion in septic shock’, Anaesth. Intensive Care, vol. 35, no. 5, pp. 679–694, Oct. 2007.
[54] A. Karliczek, D. A. Benaron, P. C. Baas, C. J. Zeebregts, A. van der Stoel, T. Wiggers, J. T. M. Plukker, and G. M. van Dam, ‘Intraoperative assessment of microperfusion with visible light spectroscopy in esophageal and colorectal anastomoses’, Eur. Surg. Res. Eur. Chir. Forsch. Rech. Chir. Eur., vol. 41, no. 3, pp. 303–311, 2008.
[55] A. Carreau, B. El Hafny-Rahbi, A. Matejuk, C. Grillon, and C. Kieda, ‘Why is the partial oxygen pressure of human tissues a crucial parameter? Small molecules and hypoxia’, J. Cell. Mol. Med., vol. 15, no. 6, pp. 1239–1253, Jun. 2011.
[56] T. Koch, S. Geiger, and M. J. R. Ragaller, ‘Monitoring of Organ Dysfunction in Sepsis/Systemic Inflammatory Response Syndrome: Novel Strategies’, J. Am. Soc. Nephrol., vol. 12, no. suppl 1, pp. S53–S59, Feb. 2001.
[57] J. Ragheb and D. J. Buggy, ‘Editorial III: Tissue oxygen tension (PTO2) in anaesthesia and perioperative medicine’, Br. J. Anaesth., vol. 92, no. 4, pp. 464 –468, Apr. 2004.

168
[58] P. J. Sheffield, ‘Measuring tissue oxygen tension: a review’, Undersea Hyperb. Med. J. Undersea Hyperb. Med. Soc. Inc, vol. 25, no. 3, pp. 179–188, 1998.
[59] H. B. Kram and W. C. Shoemaker, ‘Method for intraoperative assessment of organ perfusion and viability using a miniature oxygen sensor’, Am. J. Surg., vol. 148, no. 3, pp. 404–407, Sep. 1984.
[60] G. J. Cooper, K. M. Sherry, and J. A. Thorpe, ‘Changes in gastric tissue oxygenation during mobilisation for oesophageal replacement’, Eur. J. Cardio-Thorac. Surg. Off. J. Eur. Assoc. Cardio-Thorac. Surg., vol. 9, no. 3, pp. 158–160; discussion 160, 1995.
[61] C. A. Jacobi, H. U. Zieren, J. Zieren, and J. M. Müller, ‘Is tissue oxygen tension during esophagectomy a predictor of esophagogastric anastomotic healing?’, J. Surg. Res., vol. 74, no. 2, pp. 161–164, Feb. 1998.
[62] R. G. Fiddian-Green, ‘Gastric intramucosal pH, tissue oxygenation and acid-base balance’, Br. J. Anaesth., vol. 74, no. 5, pp. 591–606, May 1995.
[63] A. P. Marshall and S. H. West, ‘Gastric tonometry and monitoring gastrointestinal perfusion: using research to support nursing practice’, Nurs. Crit. Care, vol. 9, no. 3, pp. 123–133, Jun. 2004.
[64] G. Ackland, M. P. Grocott, and M. G. Mythen, ‘Understanding gastrointestinal perfusion in critical care: so near, and yet so far’, Crit. Care Lond. Engl., vol. 4, no. 5, pp. 269–281, 2000.
[65] F. Palizas, A. Dubin, T. Regueira, A. Bruhn, E. Knobel, S. Lazzeri, N. Baredes, and G. Hernández, ‘Gastric tonometry versus cardiac index as resuscitation goals in septic shock: a multicenter, randomized, controlled trial’, Crit. Care, vol. 13, no. 2, p. R44, Mar. 2009.
[66] A. B. J. Groeneveld and J. J. Kolkman, ‘Splanchnic tonometry: a review of physiology, methodology, and clinical applications’, J. Crit. Care, vol. 9, no. 3, pp. 198–210, Sep. 1994.
[67] J. A. Guzman, F. J. Lacoma, and J. A. Kruse, ‘Gastric and esophageal intramucosal PCO2 (PiCO2) during endotoxemia: assessment of raw PiCO2 and PCO2 gradients as indicators of hypoperfusion in a canine model of septic shock’, Chest, vol. 113, no. 4, pp. 1078–1083, Apr. 1998.
[68] P. Marik, ‘Gastric tonometry: the canary sings once again’, Crit. Care Med., vol. 26, no. 5, pp. 809–810, May 1998.
[69] N. Maynard, D. Bihari, R. Beale, M. Smithies, G. Baldock, R. Mason, and I. McColl, ‘Assessment of splanchnic oxygenation by gastric tonometry in patients with acute circulatory failure’, JAMA J. Am. Med. Assoc., vol. 270, no. 10, pp. 1203–1210, Sep. 1993.

169
[70] N. H. Boyle, A. Pearce, D. Hunter, W. J. Owen, and R. C. Mason, ‘Scanning laser Doppler flowmetry and intraluminal recirculating gas tonometry in the assessment of gastric and jejunal perfusion during oesophageal resection’, Br. J. Surg., vol. 85, no. 10, pp. 1407–1411, Oct. 1998.
[71] U. Janssens, H. Groesdonk, J. Graf, P. W. Radke, W. Lepper, and P. Hanrath, ‘Comparison of oesophageal and gastric air tonometry in patients with circulatory failure’, Br. J. Anaesth., vol. 89, no. 2, pp. 237–241, Aug. 2002.
[72] Y. Sato, M. H. Weil, W. Tang, S. Sun, J. Xie, J. Bisera, and H. Hosaka, ‘Esophageal PCO2 as a monitor of perfusion failure during hemorrhagic shock’, J. Appl. Physiol. Bethesda Md 1985, vol. 82, no. 2, pp. 558–562, Feb. 1997.
[73] V. Cerny and K. Cvachovek, ‘Gastric Tonometry and Intramucosal pH - Theoretical Principles and Clinical Application’, Physiol Res, no. 49, pp. 289–297, 2000.
[74] K. R. Walley, B. P. Friesen, M. F. Humer, and P. T. Phang, ‘Small bowel tonometry is more accurate than gastric tonometry in detecting gut ischemia’, J. Appl. Physiol., vol. 85, no. 5, pp. 1770–1777, Nov. 1998.
[75] E. Monnet, D. Pelsue, and C. MacPhail, ‘Evaluation of laser Doppler flowmetry for measurement of capillary blood flow in the stomach wall of dogs during gastric dilatation-volvulus’, Vet. Surg. VS, vol. 35, no. 2, pp. 198–205, Feb. 2006.
[76] A. Humeau, W. Steenbergen, H. Nilsson, and T. Strömberg, ‘Laser Doppler perfusion monitoring and imaging: novel approaches’, Med. Biol. Eng. Comput., vol. 45, no. 5, pp. 421–435, Mar. 2007.
[77] R. K. Mittal, V. Bhargava, H. Lal, and Y. Jiang, ‘Effect of esophageal contraction on esophageal wall blood perfusion’, Am. J. Physiol. Gastrointest. Liver Physiol., vol. 301, no. 6, pp. G1093–1098, Dec. 2011.
[78] Y. Jiang, V. Bhargava, Y. S. Kim, and R. K. Mittal, ‘Esophageal wall blood perfusion during contraction and transient lower esophageal sphincter relaxation in humans’, Am. J. Physiol. Gastrointest. Liver Physiol., vol. 303, no. 5, pp. G529–535, Sep. 2012.
[79] D. A. L. Hoff, H. Gregersen, and J. G. Hatlebakk, ‘Mucosal blood flow measurements using laser Doppler perfusion monitoring’, World J. Gastroenterol. WJG, vol. 15, no. 2, pp. 198–203, Jan. 2009.
[80] G. H. Sigurdsson, A. Banic, and J. T. Christenson, ‘Microcirculation in the Gastrointestinal Tract’, Dig. Surg., vol. 13, no. 4–5, pp. 250–254, 1996.
[81] J. C. Sicsic, J. Duranteau, H. Corbineau, S. Antoun, P. Menestret, P. Sitbon, A. Leguerrier, Y. Logeais, and C. Ecoffey, ‘Gastric mucosal oxygen delivery decreases during cardiopulmonary bypass despite constant systemic oxygen delivery’, Anesth. Analg., vol. 86, no. 3, pp. 455–460, Mar. 1998.

170
[82] K. Kvernebo, O. C. Lunde, E. Stranden, and S. Larsen, ‘Human gastric blood circulation evaluated by endoscopic laser Doppler flowmetry’, Scand. J. Gastroenterol., vol. 21, no. 6, pp. 685–692, Aug. 1986.
[83] F. W. Leung, ‘Comparison of Blood Flow Measurements by Hydrogen Gas Clearance and Laser Doppler Flowmetry in the Rat Duodenum’, Scand. J. Gastroenterol., vol. 25, no. 5, pp. 429–434, Jan. 1990.
[84] J. T. B. Moyle, Pulse oximetry. BMJ, 2002.
[85] P. A. Kyriacou, ‘Pulse oximetry in the oesophagus’, Physiol. Meas., vol. 27, no. 1, pp. R1–R35, Jan. 2006.
[86] E. Garcia-Granero, S. A. Garcia, R. Alos, J. Calvete, B. Flor-Lorente, J. Willatt, and S. Lledo, ‘Use of photoplethysmography to determine gastrointestinal perfusion pressure: an experimental canine model’, Dig. Surg., vol. 20, no. 3, pp. 222–228, 2003.
[87] E. L. Servais, N. P. Rizk, L. Oliveira, V. W. Rusch, M. Bikson, and P. S. Adusumilli, ‘Real-time intraoperative detection of tissue hypoxia in gastrointestinal surgery by wireless pulse oximetry’, Surg. Endosc., vol. 25, no. 5, pp. 1383–1389, May 2011.
[88] M. Jacquet-Lagrèze, J.-M. Bonnet-Garin, B. Allaouchiche, O. Vassal, D. Restagno, C. Paquet, J.-Y. Ayoub, J. Etienne, F. Vandenesch, O. Daulwader, and S. Junot, ‘A new device for continuous assessment of gut perfusion: proof of concept on a porcine model of septic shock’, Crit. Care Lond. Engl., vol. 18, no. 4, p. R153, 2014.
[89] S. M. Lopez Silva, M. L. Dotor Castilla, and J. P. Silveira Martin, ‘Near-infrared transmittance pulse oximetry with laser diodes’, J. Biomed. Opt., vol. 8, no. 3, pp. 525–533, Jul. 2003.
[90] S. M. López-Silva, J. P. Silveira, M. L. Dotor, R. Giannetti, D. Golmayo, and L. Herrera, ‘Transmittance photoplethysmography with near-infrared laser diodes in intra-peritoneal organs’, Physiol. Meas., vol. 27, no. 10, p. 1033, 2006.
[91] D. A. Benaron, I. H. Parachikov, S. Friedland, R. Soetikno, J. Brock-Utne, P. J. A. van der Starre, C. Nezhat, M. K. Terris, P. G. Maxim, J. J. L. Carson, M. K. Razavi, H. B. Gladstone, E. F. Fincher, C. P. Hsu, F. L. Clark, W.-F. Cheong, J. L. Duckworth, and D. K. Stevenson, ‘Continuous, noninvasive, and localized microvascular tissue oximetry using visible light spectroscopy’, Anesthesiology, vol. 100, no. 6, pp. 1469–1475, Jun. 2004.
[92] S. Friedland, D. Benaron, S. Coogan, D. Y. Sze, and R. Soetikno, ‘Diagnosis of chronic mesenteric ischemia by visible light spectroscopy during endoscopy’, Gastrointest. Endosc., vol. 65, no. 2, pp. 294–300, Feb. 2007.
[93] T. Aoyagi, ‘Pulse oximetry: its invention, theory, and future’, J. Anesth., vol. 17, no. 4, pp. 259–266, 2003.

171
[94] J. W. Severinghaus and P. B. Astrup, ‘History of blood gas analysis. VI. Oximetry’, J. Clin. Monit., vol. 2, no. 4, pp. 270–288, Oct. 1986.
[95] J. T. B. Moyle, Pulse oximetry. BMJ, 2002.
[96] L. Sh. Sangeeta Bagha, ‘A Real Time Analysis of PPG Signal for Measurement of SpO2 and Pulse Rate’, Int. JournalOf Comput. Appl., 2011.
[97] J. Allen, ‘Photoplethysmography and its application in clinical physiological measurement’, Physiol. Meas., vol. 28, no. 3, pp. R1–R39, Feb. 2007.
[98] A. Reisner, P. A. Shaltis, D. McCombie, and H. H. Asada, ‘Utility of the photoplethysmogram in circulatory monitoring’, Anesthesiology, vol. 108, no. 5, pp. 950–958, May 2008.
[99] M. Elgendi, ‘On the Analysis of Fingertip Photoplethysmogram Signals’, Curr. Cardiol. Rev., vol. 8, no. 1, pp. 14–25, Feb. 2012.
[100] S. P. McGrath, K. L. Ryan, S. M. Wendelken, C. A. Rickards, and V. A. Convertino, ‘Pulse oximeter plethysmographic waveform changes in awake, spontaneously breathing, hypovolemic volunteers’, Anesth. Analg., vol. 112, no. 2, pp. 368–374, Feb. 2011.
[101] S. C. Millasseau, J. M. Ritter, K. Takazawa, and P. J. Chowienczyk, ‘Contour analysis of the photoplethysmographic pulse measured at the finger’, J. Hypertens., vol. 24, no. 8, pp. 1449–1456, Aug. 2006.
[102] L. B. Cook, ‘Extracting arterial flow waveforms from pulse oximeter waveforms apparatus’, Anaesthesia, vol. 56, no. 6, pp. 551–555, Jun. 2001.
[103] P. D. Mannheimer, ‘The light-tissue interaction of pulse oximetry’, Anesth. Analg., vol. 105, no. 6 Suppl, pp. S10–17, Dec. 2007.
[104] D. J. Meredith, D. Clifton, P. Charlton, J. Brooks, C. W. Pugh, and L. Tarassenko, ‘Photoplethysmographic derivation of respiratory rate: a review of relevant physiology’, J. Med. Eng. Technol., vol. 36, no. 1, pp. 1–7, Jan. 2012.
[105] K. H. Shelley, ‘Photoplethysmography: beyond the calculation of arterial oxygen saturation and heart rate’, Anesth. Analg., vol. 105, no. 6 Suppl, pp. S31–36, tables of contents, Dec. 2007.
[106] V. C. Roberts, ‘Photoplethysmography- fundamental aspects of the optical properties of blood in motion’, Trans. Inst. Meas. Control, vol. 4, no. 2, pp. 101–106, Apr. 1982.
[107] J. Allen, ‘Photoplethysmography and its application in clinical physiological measurement’, Physiol. Meas., vol. 28, no. 3, pp. R1–R39, Mar. 2007.

172
[108] J. Näslund, J. Pettersson, T. Lundeberg, D. Linnarsson, and L.-G. Lindberg, ‘Non-invasive continuous estimation of blood flow changes in human patellar bone’, Med. Biol. Eng. Comput., vol. 44, no. 6, pp. 501–509, Jun. 2006.
[109] A. Sourice, G. Plantier, and J.-L. Saumet, ‘Red blood cell velocity estimation in microvessels using the spatiotemporal autocorrelation’, Meas. Sci. Technol., vol. 16, no. 11, pp. 2229–2239, Nov. 2005.
[110] J. W. Dellimore and R. G. Gosling, ‘Change in blood conductivity with flow rate’, Med. Biol. Eng., vol. 13, no. 6, pp. 904–913, Nov. 1975.
[111] S. Rao and V. Nagendranath, ‘Arterial blood gas monitoring’, Indian J Anaesth, vol. 46, no. 4, pp. 289–297, 2002.
[112] T. Vo-Dinh, Biomedical Photonics Handbook. CRC Press, 2003.
[113] C. for D. and R. Health, ‘Guidance Documents (Medical Devices and Radiation-Emitting Products) - Pulse Oximeters - Premarket Notification Submissions [510(k)s]: Guidance for Industry and Food and Drug Administration Staff.’ [Online]. Available: http://www.fda.gov/MedicalDevices/DeviceRegulationandGuidance/GuidanceDocuments/ucm341718.htm. [Accessed: 06-Oct-2013].
[114] M. S. Jianchu Yao and S. Warren, ‘Stimulating Student Learning with a Novel In-House Pulse Oximeter Design’, in Proceedings of the 2005 American Society for Engineering Education Annual Conference & Exposition, 2006.
[115] P. A. Kyriacou, ‘Investigation of new electro-optical techniques for monitoring patients with compromised peripheral perfusion in anaesthesia’, PhD Dissertation, Queen Mary University, London, 2001.
[116] Y. Mendelson and B. D. Ochs, ‘Noninvasive pulse oximetry utilizing skin reflectance photoplethysmography’, IEEE Trans. Biomed. Eng., vol. 35, no. 10, pp. 798–805, Oct. 1988.
[117] X. F. Teng and Y. T. Zhang, ‘The effect of applied sensor contact force on pulse transit time’, Physiol. Meas., vol. 27, no. 8, pp. 675–684, Aug. 2006.
[118] S. Kastle, F. Noller, S. Falk, A. Bukta, E. Mayer, and D. Miller, ‘A new family of sensors for pue oximetry’, Hewlett-Packard J., p. article 7, Feb. 1997.
[119] D. Wood, Optoelectronic semiconductor devices. Prentice Hall, 1994.
[120] J. Wilson and J. F. B. Hawkes, Optoelectronics, an introduction, 2nd ed. Prentice-Hall, 1989.
[121] P. A. Kyriacou, ‘Pulse oximetry in the oesophagus’, Physiol. Meas., vol. 27, no. 1, pp. R1–R35, Jan. 2006.
[122] A. Jubran, ‘Pulse oximetry’, Crit. Care, vol. 3, no. 2, p. R11, May 1999.

173
[123] K. V, ‘Pulse Oximetry.’, Indian J. Anaesth., vol. 46, no. 4, p. 261, Jul. 2002.
[124] M. B. Taylor and J. G. Whitwam, ‘The current status of pulse oximetry’, Anaesthesia, vol. 41, no. 9, pp. 943–949, Sep. 1986.
[125] P. A. Kyriacou, S. L. Powell, D. P. Jones, and R. M. Langford, ‘Evaluation of oesophageal pulse oximetry in patients undergoing cardiothoracic surgery’, Anaesthesia, vol. 58, no. 5, pp. 422–427, May 2003.
[126] M. Nitzan, A. Patron, Z. Glik, and A. T. Weiss, ‘Automatic noninvasive measurement of systolic blood pressure using photoplethysmography’, Biomed. Eng. OnLine, vol. 8, no. 1, p. 28, Oct. 2009.
[127] A. S. Echiadis, V. P. Crabtree, J. Bence, L. Hadjinikolaou, C. Alexiou, T. J. Spyt, and S. Hu, ‘Non-invasive measurement of peripheral venous oxygen saturation using a new venous oximetry method: evaluation during bypass in heart surgery’, Physiol. Meas., vol. 28, no. 8, pp. 897–911, Aug. 2007.
[128] J. C. Whitaker, The electronics handbook. CRC Press, 2005.
[129] P. K. Dash, ‘Electrocardiogram Monitoring’, Indian J. Anaesth., vol. 46, no. 4, pp. 251–260, 2002.
[130] P. A. Kyriacou, S. Powell, R. M. Langford, and D. P. Jones, ‘Investigation of oesophageal photoplethysmographic signals and blood oxygen saturation measurements in cardiothoracic surgery patients’, Physiol. Meas., vol. 23, no. 3, pp. 533–545, Aug. 2002.
[131] P. A. Kyriacou, A. R. Moye, D. M. Choi, R. M. Langford, and D. P. Jones, ‘Investigation of the human oesophagus as a new monitoring site for blood oxygen saturation’, Physiol. Meas., vol. 22, no. 1, pp. 223–232, Feb. 2001.
[132] L. Veltchev, ‘Technique for inflow blood control in liver surgery - /Review article/’, J. IMAB - Annu. Proceeding Sci. Pap., vol. 15, book 1, no. 2009, pp. 72–74, Mar. 2010.
[133] P. A. Kyriacou, A. R. Moye, A. Gregg, D. M. Choi, R. M. Langford, and D. P. Jones, ‘A system for investigating oesophageal photoplethysmographic signals in anaesthetised patients’, Med. Biol. Eng. Comput., vol. 37, no. 5, pp. 639–643, Sep. 1999.

174
Appendix 1

175

176
Appendix 2

177
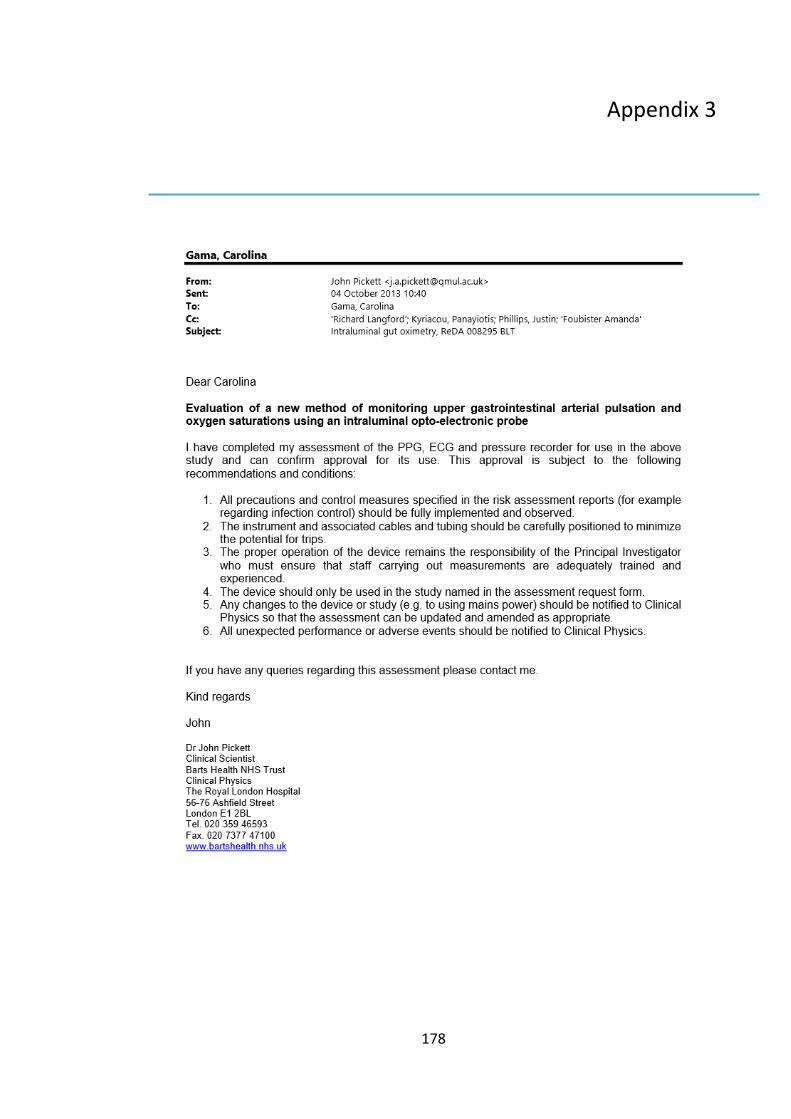
178
Appendix 3