investor presentation - kimberly-clark presentation ... certain matters in this presentation, ......
TRANSCRIPT

Investor
Presentation
Financial Informationas of December 31, 2016
www.kimberly-clark.com
Leading the world in
essentials for a better life
Highlights
• $18 billion global company founded in 1872
• Products used by one-quarter of world’s population
• Strong legacy of innovation – created 5 of the 8 major
product categories in which we compete
• Products sold in more than 175 countries
• #1 or #2 position in 80 countries
• Strong global brands, including five billion-dollar brands:
2

Our Values
33
Authentic
Our heritage is
one of honesty,
integrity and
doing the
right thing
Accountable
We take
ownership for
our business and
our future
Innovative
Our commitment
is to new ideas
that add value
Caring
We respect each
other and care for
the communities
where we live
and work

Commitment to Sustainability
4
• Sustainability 2022 (K-C’s 150th anniversary) is a commitment to:
Harness innovations to
reduce our impact on
natural forests
Improve social and
physical well-being in
communities around
the world
Set our sights on
zero waste
Build powerful
partnerships to create
a leading sustainable
and responsible
supply chain
Increase our energy efficiency and
use of alternative energy sources
each year
Read more about our sustainability strategy and performance at kimberly-clark.com/sustainability

Senior Leadership Team
5
J. Scott Boston
Senior Vice President and
Chief Human Resources Officer
Gustavo Calvo Paz
President,
Europe, Middle East and Africa
Maria Henry
Senior Vice President and
Chief Financial Officer
Sergio Cruz
President, Latin America
Sandra MacQuillan
Senior Vice President and
Chief Supply Chain Officer
Anthony Palmer
President, Global Brands
and Innovation
Jeffrey Melucci
Senior Vice President
and General Counsel
Kim Underhill
President, Kimberly-Clark
Professional
Thomas Falk
Chairman and CEO
Achal Agarwal
President, Asia-Pacific
Michael Hsu
President and
Chief Operating Officer
Larry Allgaier
Group President, Kimberly-
Clark North America
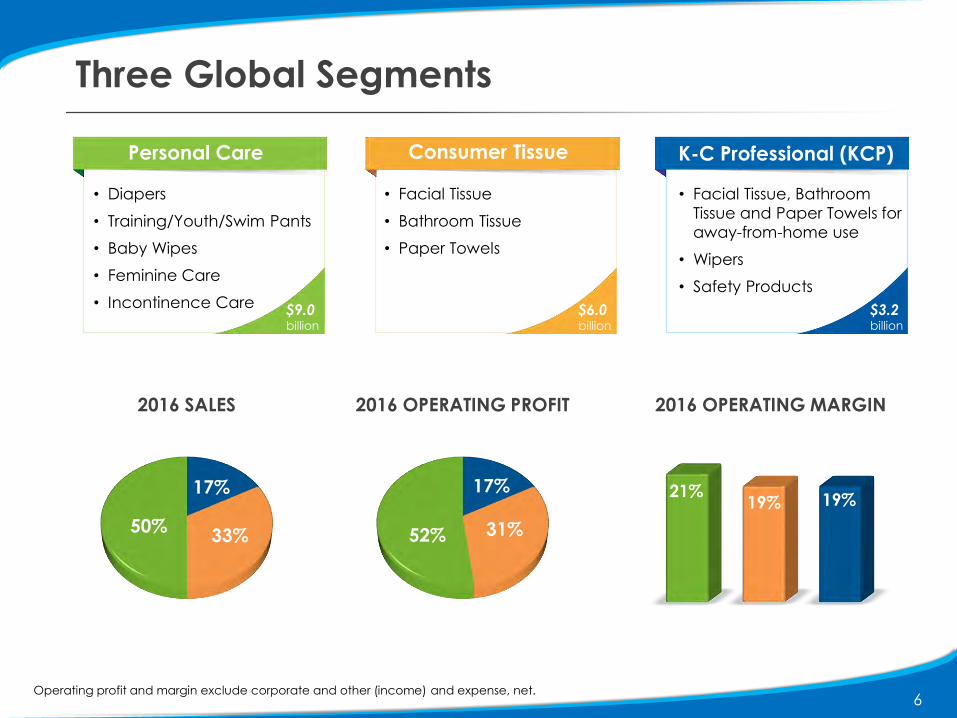
Three Global Segments
6
Personal Care Consumer Tissue K-C Professional (KCP)
• Diapers
• Training/Youth/Swim Pants
• Baby Wipes
• Feminine Care
• Incontinence Care
• Facial Tissue
• Bathroom Tissue
• Paper Towels
• Facial Tissue, Bathroom
Tissue and Paper Towels for
away-from-home use
• Wipers
• Safety Products
21%19% 19%
2016 SALES 2016 OPERATING PROFIT 2016 OPERATING MARGIN
Operating profit and margin exclude corporate and other (income) and expense, net.
$9.0billion
$6.0billion
$3.2billion
17%
33%50%
17%
31%52%
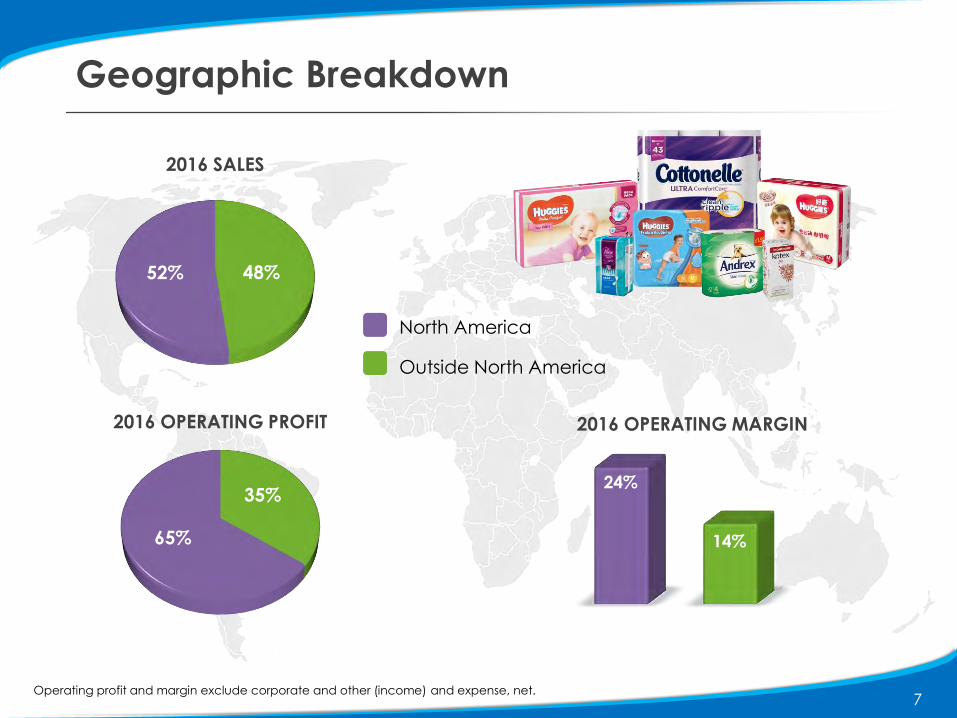
Geographic Breakdown
7
North America
Outside North America
Operating profit and margin exclude corporate and other (income) and expense, net.
48%52%
35%
65%
2016 SALES
2016 OPERATING PROFIT 2016 OPERATING MARGIN
24%
14%
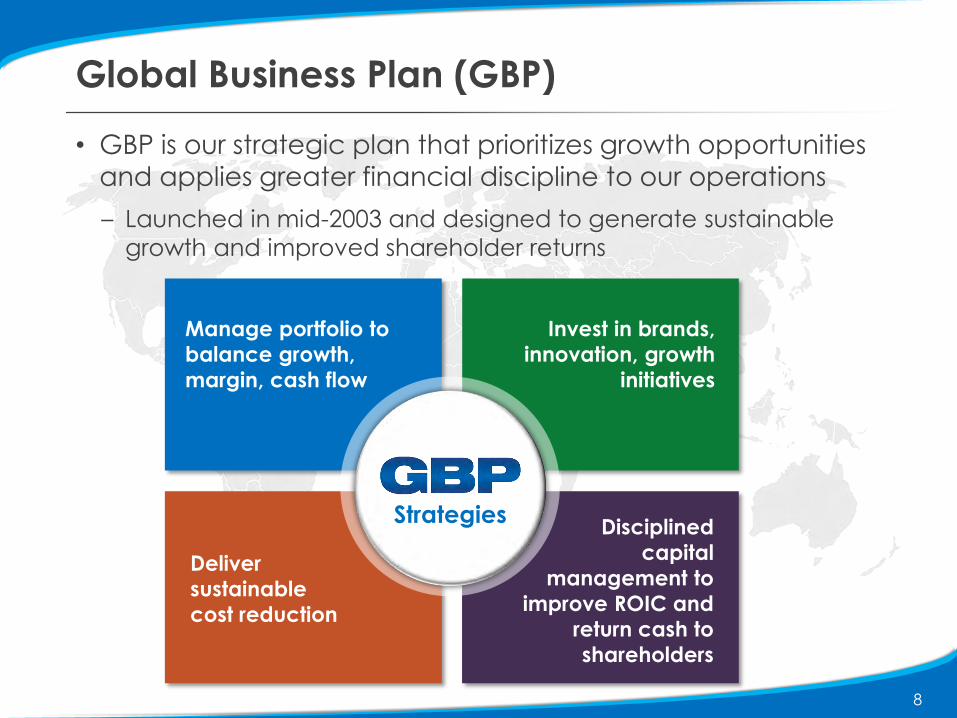
Global Business Plan (GBP)
8
Strategies
Invest in brands,
innovation, growth
initiatives
Manage portfolio to
balance growth,
margin, cash flow
Deliver
sustainable
cost reduction
Disciplined
capital
management to
improve ROIC and
return cash to
shareholders
• GBP is our strategic plan that prioritizes growth opportunities and applies greater financial discipline to our operations
– Launched in mid-2003 and designed to generate sustainable
growth and improved shareholder returns

GBP Objectives and Results
9* EPS and ROIC are adjusted.
Sales
Organic Sales
3 to 5 percent
3 to 5 percent
3 percent
4 percent
EPS*Mid- to high-
single digits6 percent
ROIC*20 to 40
basis points80 basis points
Dividend In line with EPS 8 percent
Annual
Improvement
Objective
2004 – 2016
CAGR
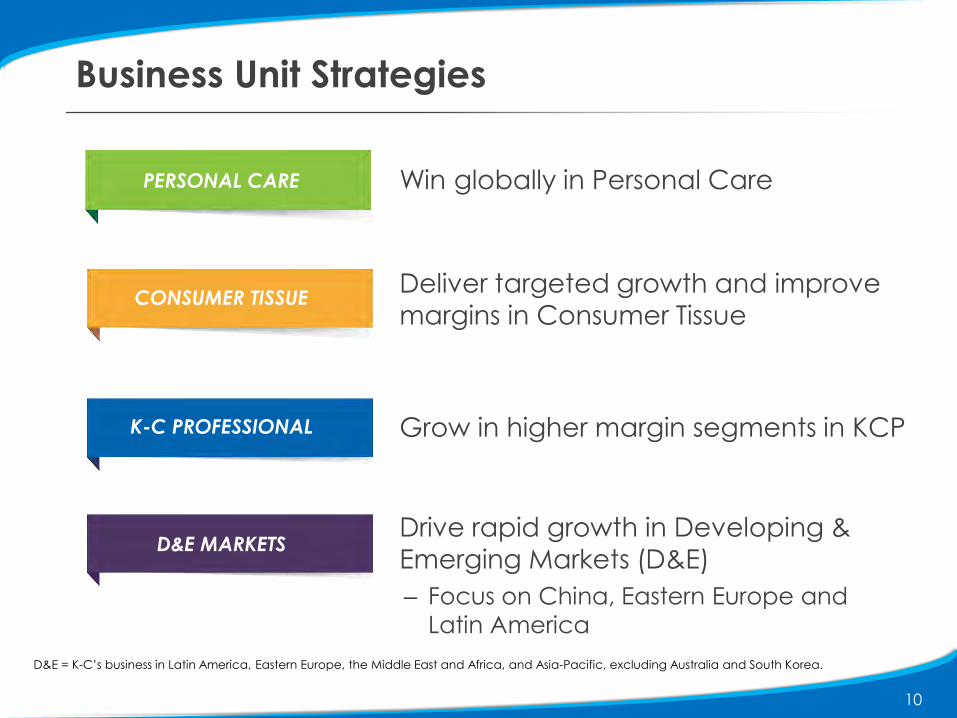
Business Unit Strategies
10
Drive rapid growth in Developing &
Emerging Markets (D&E)
– Focus on China, Eastern Europe and
Latin America
Deliver targeted growth and improve
margins in Consumer Tissue
Win globally in Personal Care
Grow in higher margin segments in KCP
D&E MARKETS
K-C PROFESSIONAL
CONSUMER TISSUE
PERSONAL CARE
D&E = K-C’s business in Latin America, Eastern Europe, the Middle East and Africa, and Asia-Pacific, excluding Australia and South Korea.
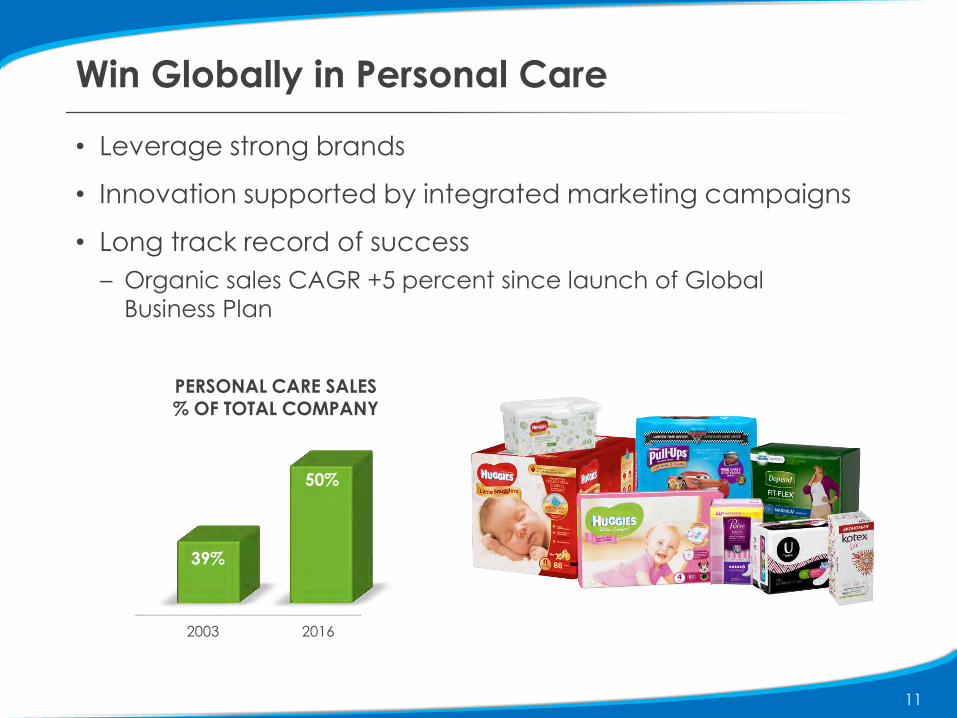
Win Globally in Personal Care
11
• Leverage strong brands
• Innovation supported by integrated marketing campaigns
• Long track record of success
– Organic sales CAGR +5 percent since launch of Global
Business Plan
39%
50%
PERSONAL CARE SALES % OF TOTAL COMPANY
2003 2016

Deliver Targeted Growth and Improve Margins in Consumer Tissue
• Launch value-added innovations
• Focus on net realized revenue, mix, cost reduction
• Excellent progress with margin improvement
• Operating profit up about 45 percent over last 5 years
12
2012 2013 2014 2015 2016
14%15%
16%18%
19%
OPERATING MARGIN
2012 2013 2014 2015 2016

Grow in Higher Margin Segments in KCP
• Provide essentials for a healthy,
safe and productive workplace
• Invest in high-growth, higher
margin Safety and Wiper
businesses
• Expand in D&E markets where industrialization and economic
development are occurring
• Improve mix and margin to
fund growth
13
17%
19%
3%
9%
ORGANIC SALES GROWTH(2012-2016 CAGR)
TOTAL KCP OPERATING MARGIN
KCP
SEGMENT
KCP
D&E MARKETS
2012 2016

Drive Rapid Growth in D&E Markets
• Excellent performance over last
several years
– 2011 to 2015 organic sales CAGR: 11 percent
• 2016 organic sales growth 4 percent
– Market positions remain broadly healthy
• Optimistic about long-term potential
– Attractive market dynamics
– Significant opportunities to increase penetration and frequency of usage
– Targeted geographic expansion and growth plans
14
14%
29%
D&E SALES % OF TOTAL COMPANY
2003 2016

D&E Focus Areas:China, Eastern Europe, Latin America – Personal Care
• Approximately 50 percent of
D&E business
• Organic sales growth
– 2011 to 2015 CAGR: 15 percent
– 2016: 5 percent (some category
slowdown; diaper pricing in China)
• Continue to execute long-term
growth plans
– Innovation
– Selling and marketing investments
– Focused distribution expansion
– Production capacity increases
15

Adult Care and Feminine Care in D&E Markets
16
• Excellent progress over last several years
• Driving category development
• Leveraging well-known brands
• Launching steady stream
of innovations
16%12%
ADULT CAREORGANIC SALES GROWTH
11%9%
FEMININE CAREORGANIC SALES GROWTH
2011-2015CAGR
2016
2011-2015CAGR
2016
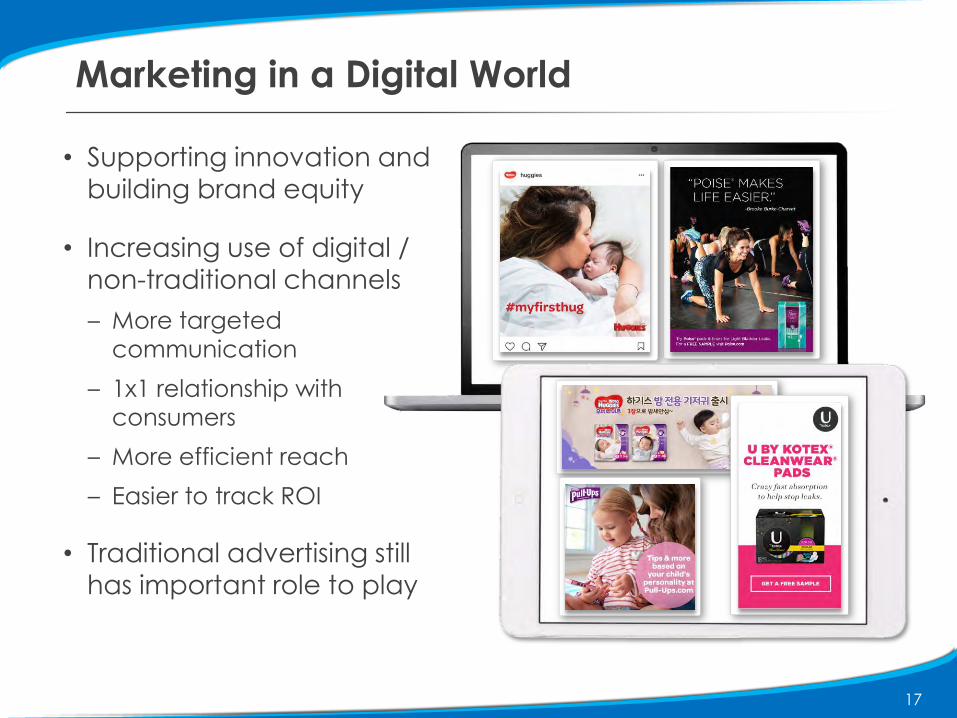
Marketing in a Digital World
• Supporting innovation and
building brand equity
• Increasing use of digital /
non-traditional channels
– More targeted
communication
– 1x1 relationship with
consumers
– More efficient reach
– Easier to track ROI
• Traditional advertising still has important role to play
17

$200
$320
$435
Sustainable Cost Reduction – FORCE
18
• Ongoing program
– Delivered $3.3 billion over past
13 years
– Performance has accelerated,
including record savings in 2016
• End-to-end supply chain focus
– Procurement, lean manufacturing
practices, product design
– Global supply chain organization
created in 2015 continuing to build
capability
• Important component of gross
margin improvement
* Adjusted
ANNUAL SAVINGS($ Millions)
2004-2011Avg.
2012-2015Avg.
2016
2012 2013 2014 2015 2016
33.4%34.1% 34.3%
35.9%36.6%
GROSS MARGIN*
2012 2013 2014 2015 2016

2014 Organization Restructuring
19
• Announced October 2014;
completed December 2016
• Offset impact of stranded
overhead costs from health care
business spin-off and improve
efficiency
– More flexibility to invest
– Further evidence of cost discipline
• Restructuring costs totaled $164
million (after tax)
• Cumulative annualized savings of
$140 million
– Achieved savings target one year
ahead of original commitment of
$120 to $140 million by end of 2017
$5
$70
$140
CUMULATIVE ANNUALIZEDRESTRUCTURING SAVINGS
($ Millions)
2014 2015 2016

73
Working Capital Improvement
20
• Strong improvement since
2008
– Extending payables terms
– Inventory management
– Health care spin-off
• Expect continued progress
going forward
– Building further capabilities
– Global supply chain
organization focus
(70%)
22
2008 2016
PRIMARY WORKING CAPITAL CASH CONVERSION CYCLE
(Days)
22
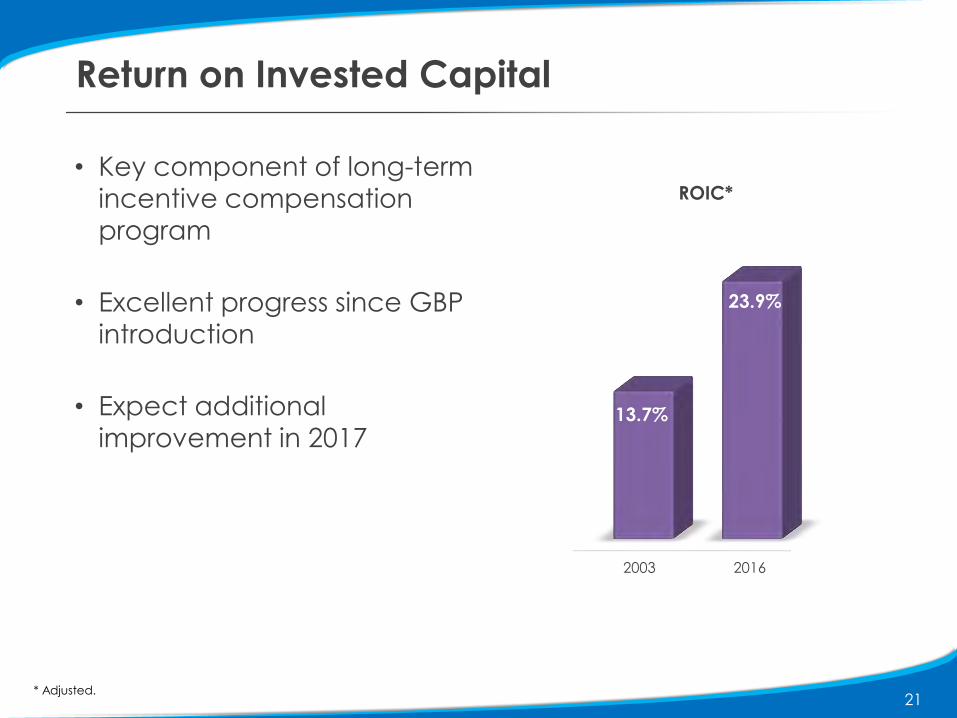
Return on Invested Capital
21
• Key component of long-term
incentive compensation
program
• Excellent progress since GBP
introduction
• Expect additional
improvement in 2017
* Adjusted.
13.7%
23.9%
ROIC*
2003 2016
Capital Allocation Strategy
• Maintain ‘A’ credit rating and balance sheet flexibility
• Fund business needs (growth, innovation, cost savings)
– Capital spending 4.5 to 5.5 percent of net sales
• Grow dividend
– Top-tier payout in Consumer Packaged Goods industry
• Consider M&A
– Not core part of growth strategy
• Return excess cash to shareholders via
share repurchases
22
Strategies
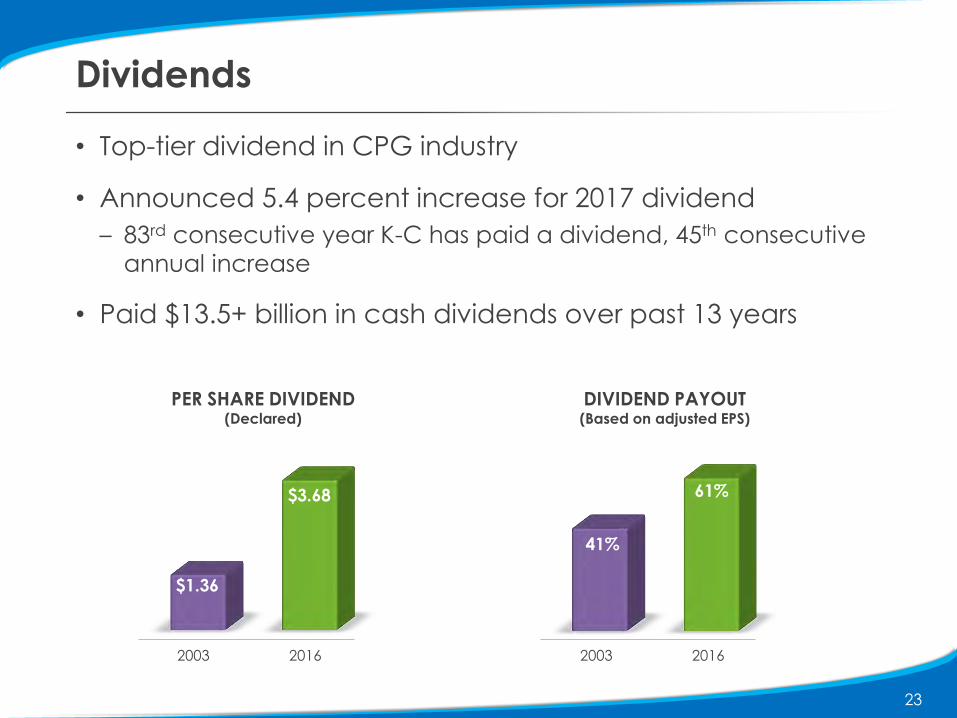
Dividends
• Top-tier dividend in CPG industry
• Announced 5.4 percent increase for 2017 dividend
– 83rd consecutive year K-C has paid a dividend, 45th consecutive
annual increase
• Paid $13.5+ billion in cash dividends over past 13 years
23
2003 2016
$1.36
$3.68
PER SHARE DIVIDEND(Declared)
2003 2016
41%
61%
DIVIDEND PAYOUT(Based on adjusted EPS)
2003 2016 2003 2016

24
Share Repurchases
• Cumulative share repurchases of $15.4 billion
2004-2016
• Strong track record of
reducing share count
• Targeting $800 million to
$1 billion in 2017
SHARES OUTSTANDING(Millions)
502
(29%)
Year-end2003
Year-end2016
357

Total Shareholder Returns Since Launch of GBP (July 2003)
25
266%
203%
268%
KMB S&P 500S&P Consumer
Staples Index

To Learn More About Kimberly-Clark
• Contact Investor Relations with your questions
– Paul Alexander, Vice President at (972) 281-1440
• Visit www.kimberly-clark.com/investors to view our annual
report, SEC filings or news releases
• To obtain copies of our 2016 Annual Report on Form 10-K, SEC filings or news releases, call (800) 639-1352
26

Safe Harbor Statement
27
Forward-Looking Information
Certain matters in this presentation, including our 2017 outlook, expectations and planning assumptions, and any estimates, projections, and statements relating to our business plans or objectives, constitute forward-looking statements and are based upon management’s expectations and beliefs concerning future events impacting the company. These statements are subject to risks and uncertainties, including currency rates and exchange risks, cost savings and reductions, raw material, energy, and other input costs, competition, market demand and economic and political conditions, the anticipated cost savings from the company’s FORCE program and contingencies. There can be no assurance that these future events will occur as anticipated or that the company’s results will be as estimated. Forward-looking statements speak only as of the date they were made, and we undertake no obligation to publicly update them. For a more complete listing and description of other factors that could cause the company’s future results to differ materially from those expressed in any such forward-looking statements, see Item 1A of the company’s Annual Report on Form 10-K for the year ended December 31, 2016 entitled “Risk Factors.”
Non-GAAP Financial Measures
This presentation contains some financial measures that have been adjusted to exclude certain items and differ from reported results using Generally Accepted Accounting Principles (GAAP). Management believes that reporting in this manner enhances investors’ understanding and analysis of the company’s performance. For additional information on why we make these adjustments and reconciliations to comparable measures under GAAP, see the supplemental information posted to the Investors section of our website (www.kimberly-clark.com/investors). This presentation also includes information on organic net sales, which describes the impact of changes in volume, net selling prices and product mix on net sales. Changes in foreign currency exchange rates also impact the year-over-year change in net sales.