investors presentation telelink business services · from the above for a variety of reasons,...
TRANSCRIPT

INVESTORS PRESENTATION Telelink Business Services
DisclaimerThis presentation (“Presentation”) is in relation to the admission for trading on the regulated market (the “Listing") of TELELINK BUSINESS SERVICES GROUP (“TBS Group”, “the Company“).
Neither this presentation nor any copy of it may be taken or transmitted into, or distributed, directly or indirectly in, the United States of America or its territories or possessions. ThisPresentation is not a public offer of securities for sale in the United States. The securities described herein have not been and will not be registered under the U.S. Securities Act of 1933 (the“Securities Act”) and may not be offered or sold in the United States absent registration or an exemption from registration under the Securities Act. TBS Group does not intend to register anyportion of the securities described in the Prospectus under the applicable securities laws of the United States or conduct a public offering of any such securities in the United States. Anyfailure to comply with these restrictions may constitute a violation of U.S. securities laws.
The distribution of this document in other jurisdictions may also be restricted by law, and persons into whose possession this document comes should inform themselves about, and observe,any such restrictions. This Presentation is being supplied to you solely for your information. This Presentation has been prepared by and is the responsibility of TBS Group and “ELANATrading”, the latter in its role of Sole Manager of the offering. The information herein, as well as in the Prospectus, may be subject to updating, completion, revision and amendment andsuch information may change materially. TBS Group and ELANA Trading are under no obligation to update or keep current the information contained in this Presentation.
This Presentation does not constitute, or form part of, any offer or invitation to sell or issue, or any solicitation of any offer to subscribe for or purchase any securities in TBS Group, nor shallit, or the fact of its distribution, form the basis of, or be relied upon in connection with, or act as any inducement to enter into, any contract or commitment whatsoever with respect to suchsecurities.
This Presentation has not been approved as a prospectus by the Bulgarian Financial Supervision Commission ("FSC") and has not been filed with the FSC pursuant to the Bulgaria ProspectusRules. Any offer of securities in TBS Group will be made in Bulgaria with the Prospectus and a Prospectus Supplement approved by the FSC with decisions # 1249- PD from Nov. 28th, 2019and #1331-PD from Dec 23rd, 2019.
This Presentation features preliminary and forward-looking information relative to unaudited historical results for 2019 and future results. Final audited and actual future results may differfrom the above for a variety of reasons, including such beyond TBS Group’s control. Likewise, historical data in this Presentation, audited or not, may not be assumed to be symptomatic offuture results.
This Presentation includes statements that are forward-looking in nature. By their nature, forward-looking statements involve (known and unknown) risks, uncertainties and assumptionsbecause they relate to events and depend on circumstances that will occur in the future whether or not outside the control of the Company. Actual results and developments may differmaterially from those expressed in such statements and from historical trends depending on a variety of factors. Such factors may cause actual results and developments to differ materiallyfrom those expressed or implied by these forward-looking statements.
This Presentation should not be considered as the giving of investment advice by TBS Group and ELANA Trading or any of its directors, officers, agents, employees or advisors. Each party towhom this Presentation is made available must make its own independent assessment of TBS Group after making such investigations and taking such advice as may be deemed necessary. Inparticular, any estimates or projections or opinions contained in the Presentation involve elements of subjective judgment, analysis and assumption and each recipient should satisfythemselves in relation to such matters. Neither the issue of this Presentation nor any part of its contents is to be taken as any form of commitment on the part of TBS Group to proceed withany transaction and the right is reserved to terminate any discussions or negotiations with any prospective investors. In no circumstances will TBS Group and ELANA Trading be responsiblefor any costs, losses or expenses incurred in connection with any appraisal or investigation of TBS Group.

HOW WESTARTED

Defined as a business unit in Telelink 16 years ago.

Had been carving out as an edge company for8 years.

Separated as a standalone entity in the end of 2017.

WHERE WE ARENOW
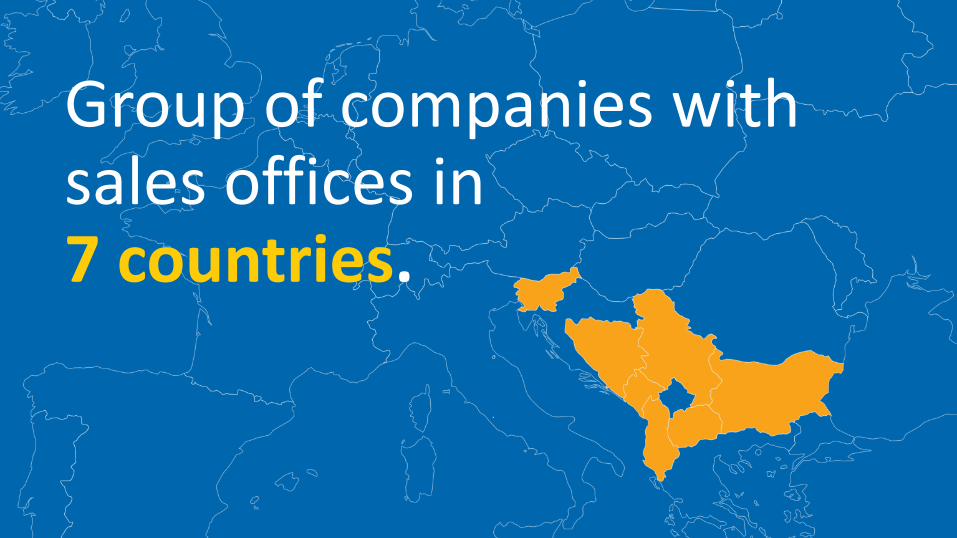
Group of companies with sales offices in 7 countries.
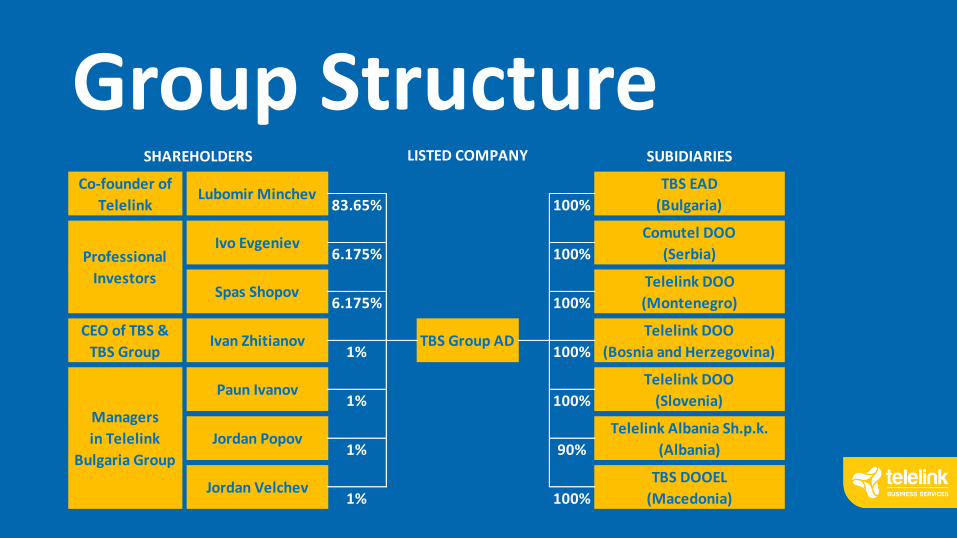
Group Structure83.65% 100%
6.175% 100%
6.175% 100%
1% 100%
1% 100%
1% 90%
1% 100%
LISTED COMPANY
Telelink DOO
(Bosnia and Herzegovina)
Paun IvanovTelelink DOO
(Slovenia)
SHAREHOLDERS
Managers
in Telelink
Bulgaria Group
Professional
Investors
Jordan VelchevTBS DOOEL
(Macedonia)
SUBIDIARIES
Co-founder of
Telelink
CEO of TBS &
TBS Group
Jordan PopovTelelink Albania Sh.p.k.
(Albania)
Lubomir MinchevTBS EAD
(Bulgaria)
Ivo EvgenievComutel DOO
(Serbia)
Spas Shopov
Ivan Zhitianov
Telelink DOO
(Montenegro)
TBS Group AD
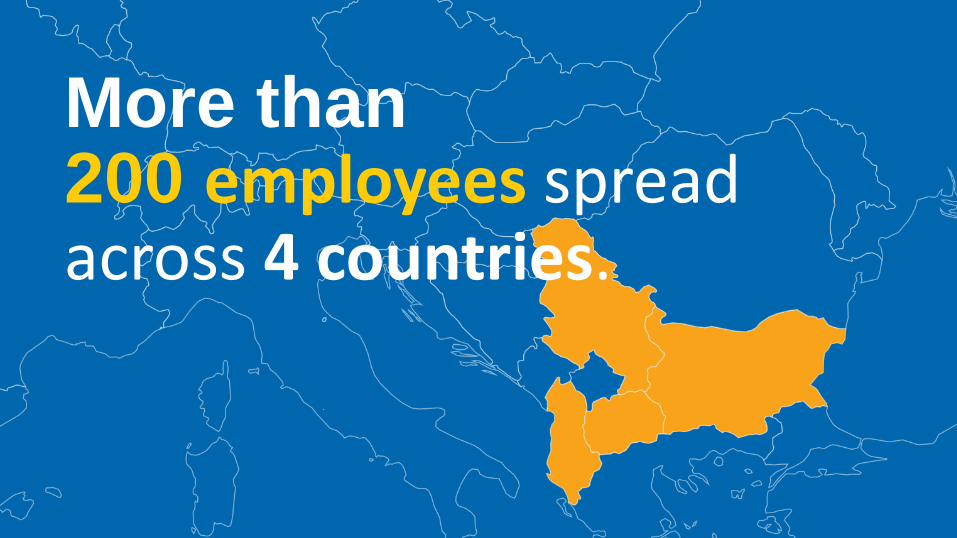
More than 200 employees spread across 4 countries.

Servicing customers in more than 30 countries on 4 continents.

More than 50 major international Partners.
More than 200 mid-size and enterprise customers.

Industry expertise
finance & banking
utilitiespu
blic
se
cto
r
transportation & logistics
soft
war
e d
eve
lop
me
nt
he
alth
care
telecom

Differentiators Flexibility
Broad View
Attention to Detail
Extra Mile
Simplicity

Organizational MatrixTechnology
Operations
Region
CEO
C-LEVEL
TECH / FUNC / COUNTRY OWNERS
LINE OF BUSINESS MANAGEMENT
A
B
C
D


EXPERTISEOUR

TAILORED
PROJECTS
MANAGED
SERVICES
COMPLEX
TECH TO
MASS

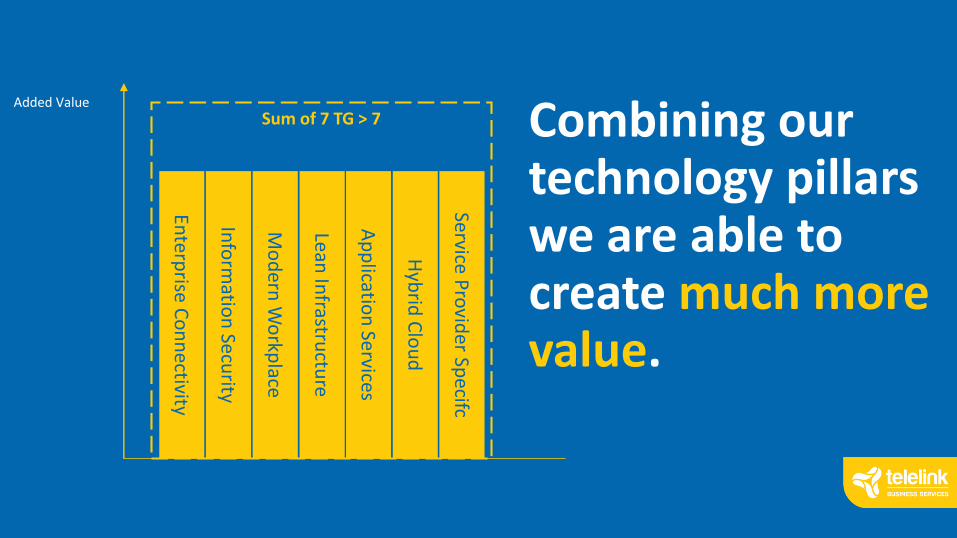
Seven technology groups.

ENTERPRISE
CONNECTIVITY
Connectivity nowadays is a commodity, but it is also the foundation for everything we do. We can build the foundation you can trust.
(SD)WAN | (SD)Fixed Access | (SD)Wireless Access | DC Networking | SAN | Telephony | Video Conferencing
Revenue
0% 100%25%
€ 14.3

€ 12.3
HYBRIDCLOUD
Simplify and increase the performance of any data center by adding visibility, orchestration, self-servicing, and connection to the public cloud.
Compute | Storage | Backup | Hypervisors | VDI | Orchestration | Public IaaS
Revenue
0% 100%22%

With the increased rate of digital transformation, Information Security is becoming more critical than ever. The decision to invest in IS is hard, with no tangible ROI. We make security affordable, simple, and result-oriented.
INFORMATION
SECURITY
Endpoint Protection Platforms (EPP) | Data Leakage Prevention (DLP) | SIEM | Behavior Analytics | Encryption | Identity | Access Management | Cloud Security Access Brokers (CASB)
Revenue
0% 100%3%
€ 2
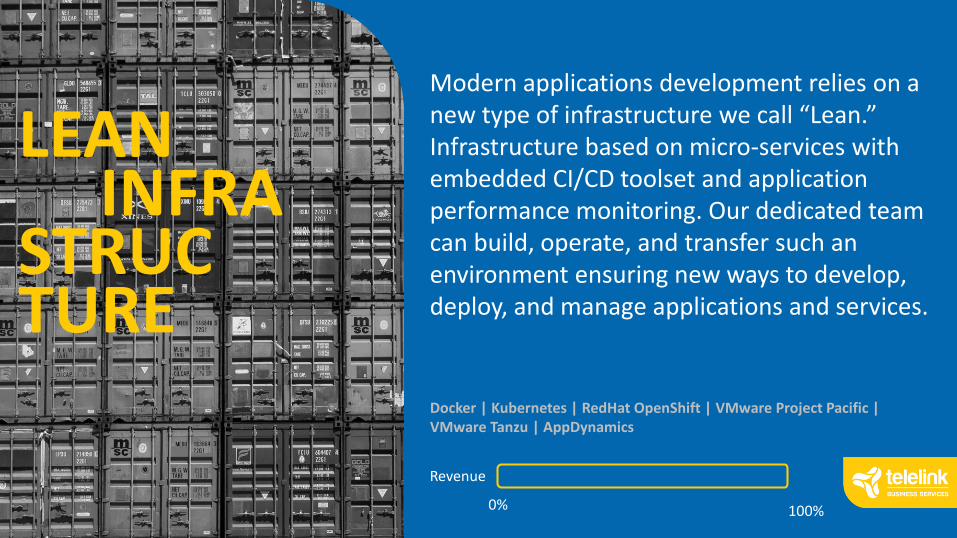
LEANINFRA
STRUCTURE
Modern applications development relies on a new type of infrastructure we call “Lean.” Infrastructure based on micro-services with embedded CI/CD toolset and application performance monitoring. Our dedicated team can build, operate, and transfer such an environment ensuring new ways to develop, deploy, and manage applications and services.
Docker | Kubernetes | RedHat OpenShift | VMware Project Pacific | VMware Tanzu | AppDynamics
Revenue
0% 100%

€ 7.3
MODERNWORK
PLACE
We provide a variety of technology solutions, but none of them would make sense if the benefits are not transferred to each employee. We empower teams to be productive and work together securely, everywhere, from any device. Utilizing technology, people, and processes analytics, we aim to deliver not just another tool, but the desired organizational change.
Revenue
0% 100%13%
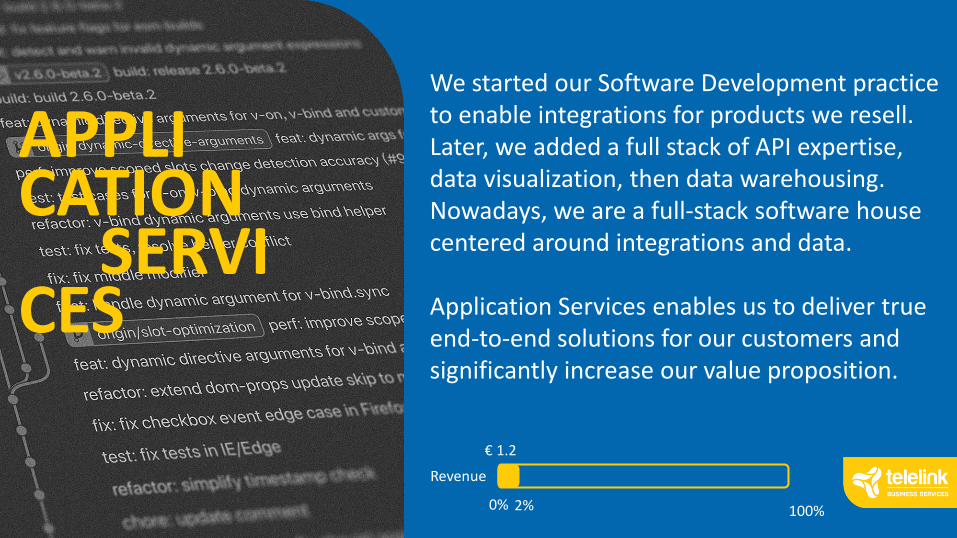
APPLICATION
SERVICES
We started our Software Development practice to enable integrations for products we resell. Later, we added a full stack of API expertise, data visualization, then data warehousing. Nowadays, we are a full-stack software house centered around integrations and data.
Application Services enables us to deliver true end-to-end solutions for our customers and significantly increase our value proposition.
Revenue
0% 100%2%
€ 1.2

Service Providers are a specific set of customers. They have unique business needs to account for and a particular stack of technology to understand. That is why we have dedicated a team focused on them, building knowledge and understanding for their needs.
SERVICEPROVI
DERSPECI
FICTransport Networking | Optical Networking | Network Functions Virtualizations (NFV) | CPE Management | DevNet | Orchestration | Video Head-End
Revenue
0% 100%33%
€ 18.5
Enterp
rise Co
nn
ectivity
Added Value
Info
rmatio
n Secu
rity
Mo
dern
Wo
rkplace
Lean In
frastructu
re
Ap
plicatio
n Services
Hyb
rid C
lou
d
Service Pro
vider Sp
ecifc
Sum of 7 TG > 7 Combining our technology pillars we are able to create much more value.

PEOPLETBS

Team EvolutionN
um
ber
of
Emp
loye
es a
s o
f p
erio
d e
nd
109 123140
185
1818
19
249
127141
159
218
2016 2017 2018 2019
Macedonia & Albania
Mid-western Balkans
Bulgaria
Total
Expanding resources to assure targeted growth
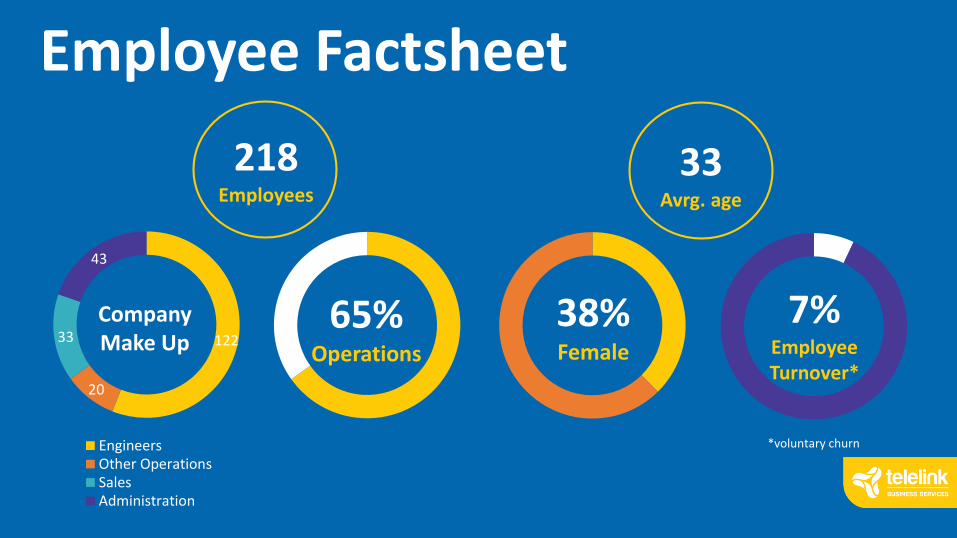
122
20
33
43
EngineersOther OperationsSalesAdministration
Employee Factsheet
38% Female
7%Employee Turnover*
65% Operations
Company Make Up
33Avrg. age
218Employees
*voluntary churn

1 1
1621
Level A Level B
Level C Level D
Management Factsheet
0%Top
Management Turnover
>50% Internal
Promotion vs. Hiring
ManagmentMake Up

Leadership
Nikoleta
Director Finance
Ivo
Director Sales
Orlin
Director HR & Partners and Channels
IvanCEO

Leadership
DimitarDirector Business
Process Automation
TeodorDirector Enterprise networking
& Private Cloud
OgnyanDirector Modern Workplace &
App Services
OrhanDirector Service Provider
Solutions
LyubomirDirector Lean Infrastructure
TodorDirector Information
Security
IvanCEO

IN NUMBERSTBS

P&L Performance
50,454,2
59,556,3
3,6 3,6
5,05,9
2,7 2,4
3,9 4,2
0
2
4
6
8
10
12
14
16
18
20
0
10
20
30
40
50
60
2016 2017 2018 2019
Revenue EBITDA Net Profit
• Revenue:• 3Y CAGR of 4%
• Net Profit:• 3Y CAGR of 16%
• Margin 2019 = 7.4%
• EBITDA:• 3Y CAGR of 18%
• Margin 2019 = 10.5%EUR
mill
ion

Geographical Portfolio
17,522,7 25,3
32,9
32,831,2
32,821,6
0,20,3
1,41,8
2016 2017 2018 2019
Multinational Clients
Western Balkans
Bulgaria
Growing in Bulgaria and Multinational clients
EUR
mill
ion
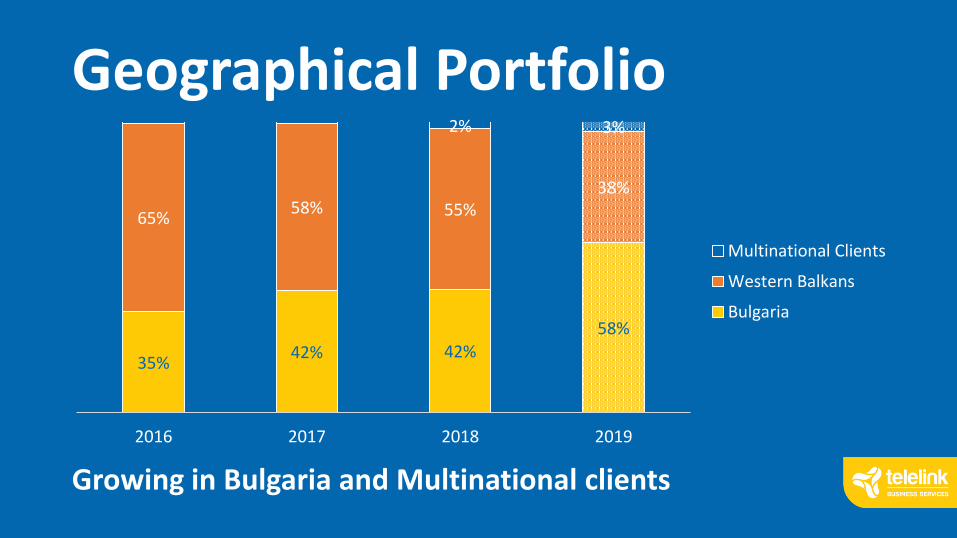
Geographical Portfolio
35%42% 42%
58%
65%58% 55%
38%
2% 3%
2016 2017 2018 2019
Multinational Clients
Western Balkans
Bulgaria
Growing in Bulgaria and Multinational clients

Product Portfolio
34,7 31,1 32,7
18,5
6,26,9 7,2
14,3
6,1 9,710,0
12,3
1,83,9
4,87,31,1
0,82,5
2,0
2016 2017 2018 2019
Other
Passive Infrastructure
Information Security
Modern Workplace
Application Services
Private Cloud
Enterprise Connectivity
Service Provider Specific
Growing in Data Center, Productivity, Security &Enterprise Networks, incl. Managed Services
EUR
mill
ion

Product Portfolio
69%57% 55%
33%
12%
13% 12%
25%
12%
18%17%
22%
2%2%
2%
4% 7%8% 13%
2% 2% 4% 3%
2016 2017 2018 2019
Other
Passive Infrastructure
Information Security
Modern Workplace
Application Services
Private Cloud
Enterprise Connectivity
Service Provider Specific
Growing in Data Center, Productivity, Security &Enterprise Networks, incl. Managed Services

Growth in New Tech GroupsModern Workplace
3Y CAGR = 58%
Information Security
3Y CAGR = 21%
Private Cloud + Application Services
3Y CAGR = 30%
Enterprise Connectivity, incl. Managed Services
3Y CAGR = 32%

Client Diversity200+ clients, incl. 40+ with annual revenues of 100+ K Euro
36,8 34,9 35,9
23,1
7,6 13,2 14,9
18,8
6,16,0
8,7
14,4
2016 2017 2018 2019
Enterprise
Public
Telecom
EUR
mill
ion
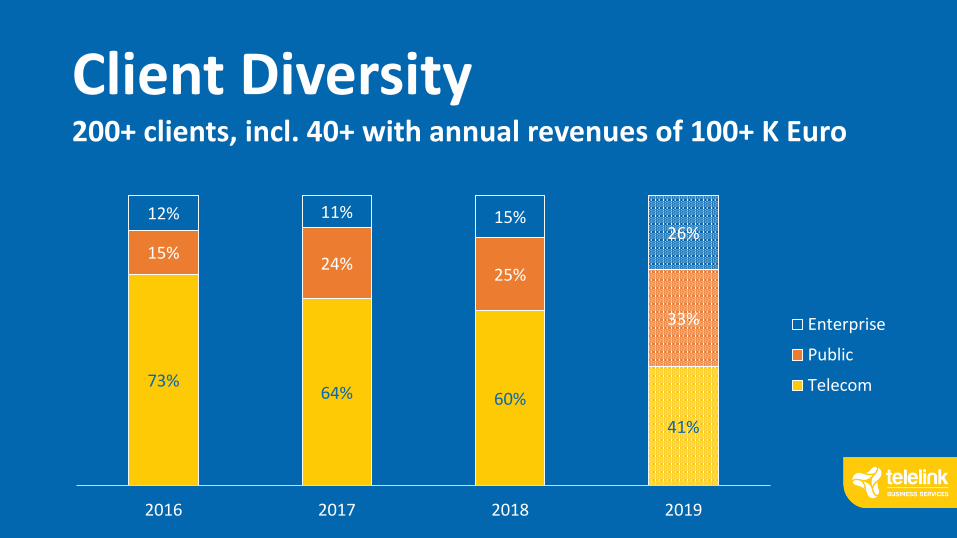
Client Diversity200+ clients, incl. 40+ with annual revenues of 100+ K Euro
73%64% 60%
41%
15%24%
25%
33%
12% 11% 15%26%
2016 2017 2018 2019
Enterprise
Public
Telecom
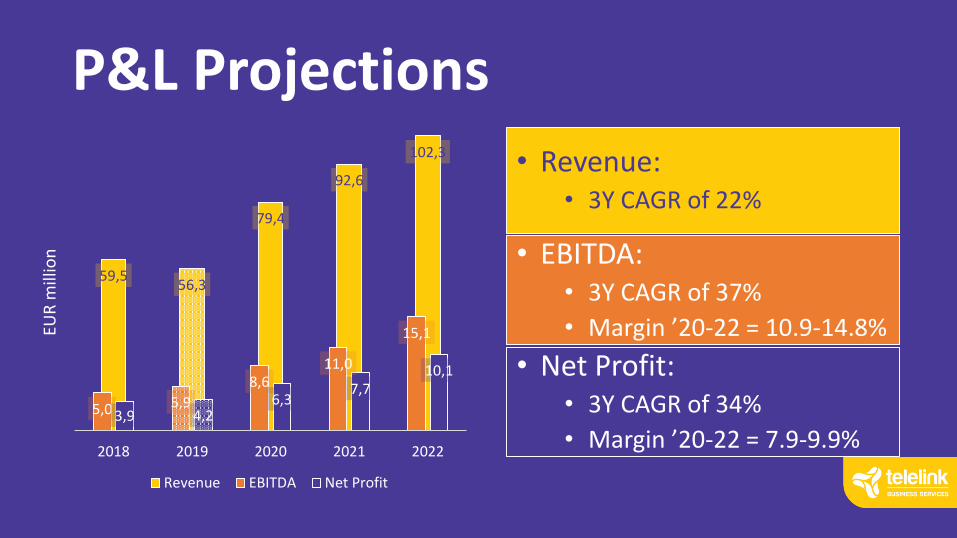
• EBITDA:• 3Y CAGR of 37%
• Margin ’20-22 = 10.9-14.8%
• Revenue:• 3Y CAGR of 22%
• Net Profit:• 3Y CAGR of 34%
• Margin ’20-22 = 7.9-9.9%
P&L Projections
59,556,3
79,4
92,6
102,3
5,0 5,9
8,611,0
15,1
3,9 4,26,3
7,710,1
0
5
10
15
20
25
30
35
40
0
20
40
60
80
100
2018 2019 2020 2021 2022
Revenue EBITDA Net Profit
EUR
mill
ion
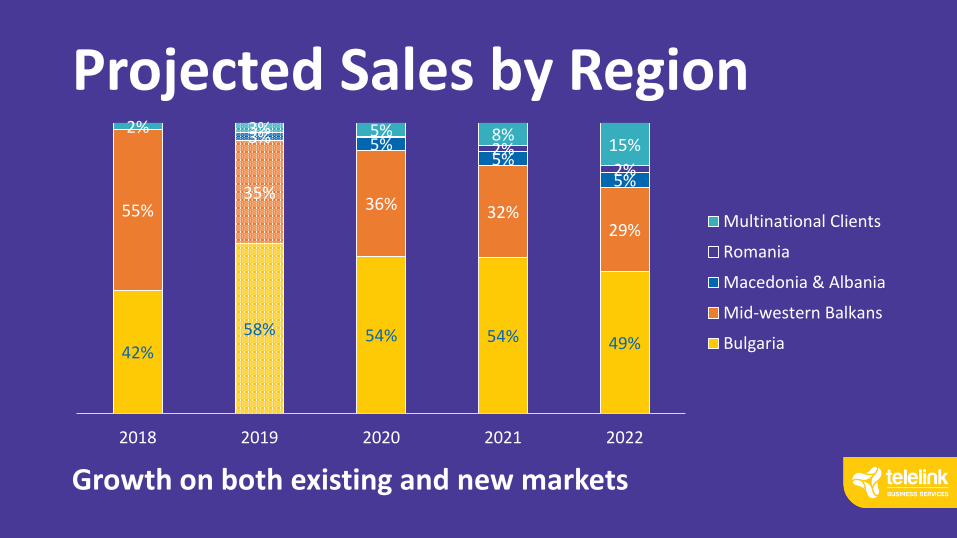
Projected Sales by Region
Growth on both existing and new markets
42%58% 54% 54% 49%
55%35%
36% 32%29%
3% 5%5%
5%
2%2%
2% 3% 5% 8%15%
2018 2019 2020 2021 2022
Multinational Clients
Romania
Macedonia & Albania
Mid-western Balkans
Bulgaria

Vertical Portfolio Evolution
60%
41% 41% 38% 34%
25%
33% 39%38%
33%
15%26% 20% 24%
33%
2018 2019 2020 2021 2022
Enterprise
Public
Telecom
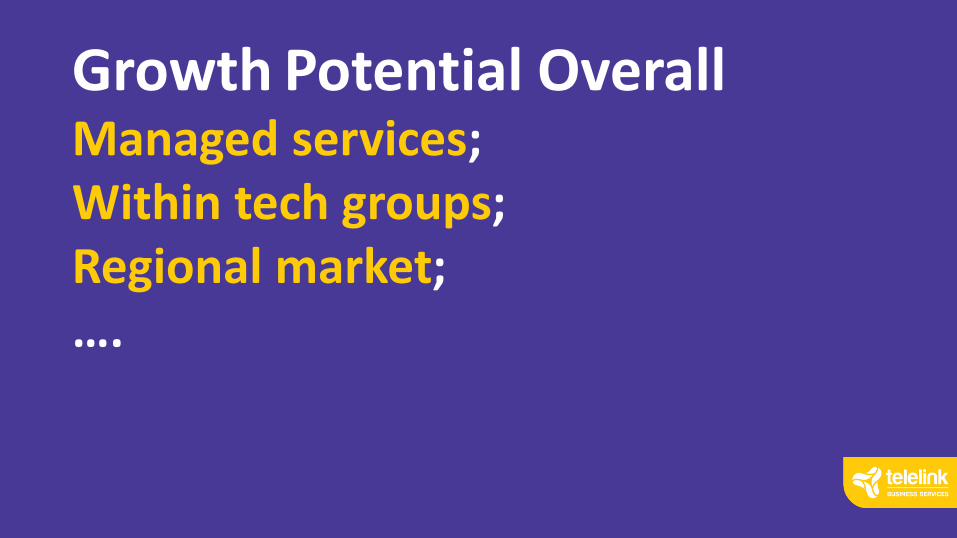
Growth Potential OverallManaged services;Within tech groups;Regional market;….
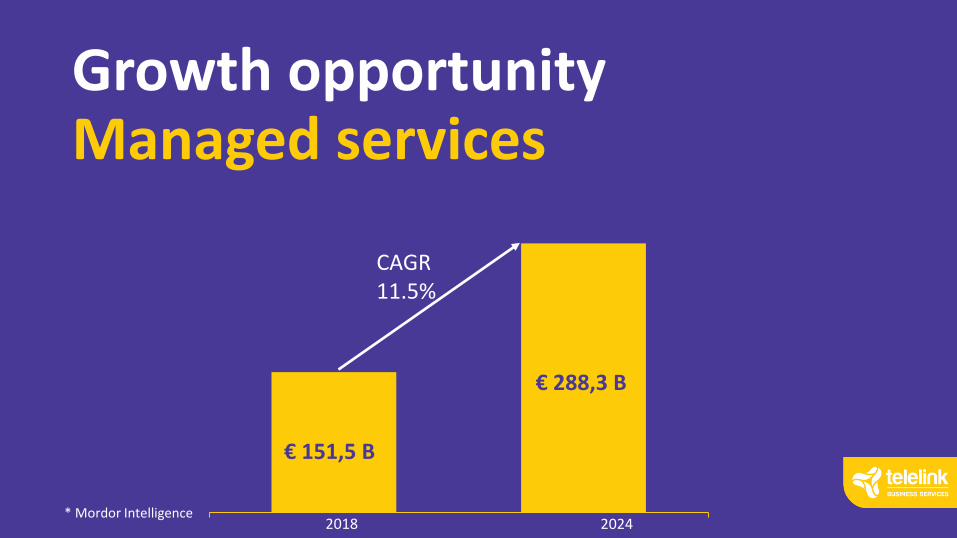
Growth opportunity Managed services
€ 151,5 B
€ 288,3 B
CAGR 11.5%
2018 2024* Mordor Intelligence
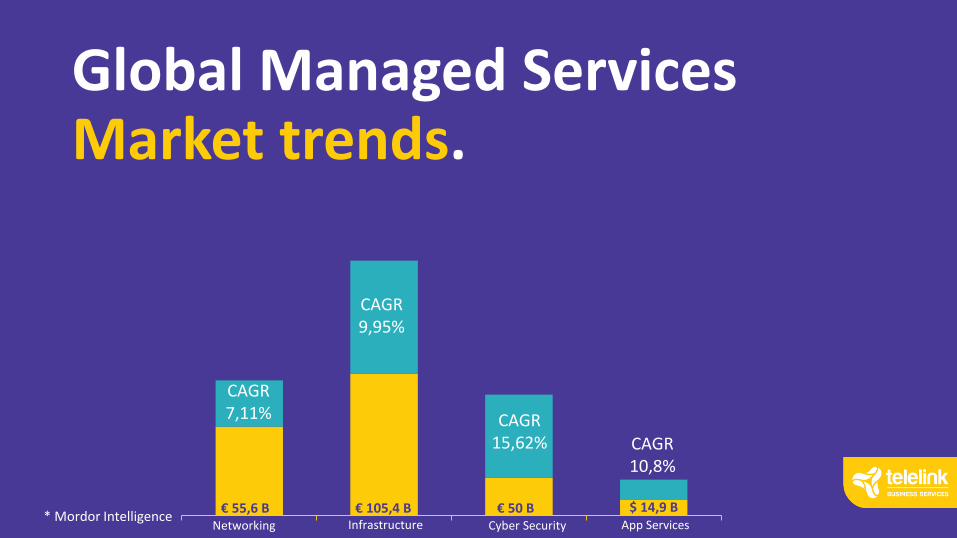
Global Managed Services Market trends.
Infrastructure App Services€ 55,6 B
Networking Cyber Security
€ 105,4 B € 50 B $ 14,9 B
CAGR 9,95%
CAGR 15,62% CAGR
10,8%
CAGR 7,11%
* Mordor Intelligence
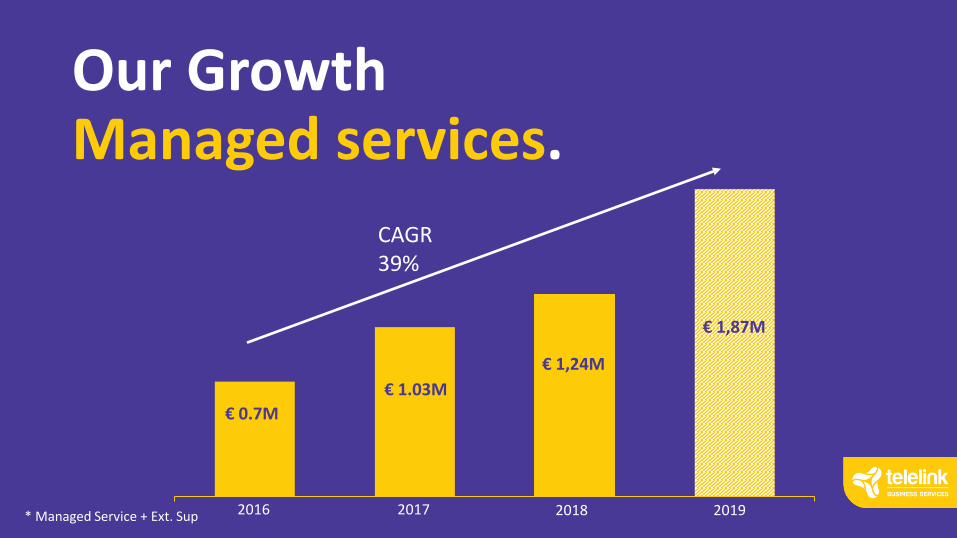
Our GrowthManaged services.
€ 0.7M
€ 1.03M
€ 1,24M
CAGR 39%
20172016* Managed Service + Ext. Sup 2018 2019
€ 1,87M
Managed services growthutilizing:
diversified portfolio; diversified resource hubs;diversified client list;developed operations.

Annual Revenue Growth
2019-2022 (m. Euro)Bulgaria
Mid-west
Balkans
Macedonia
& AlbaniaRomania
Multi-
nationalsTotal
Service Provider Specific 5.4 4.9 0.6 2.3 0.1 13.3
Enterprise Connectivity 2.4 0.9 0.9 0.0 11.6 15.9
Private Cloud 1.7 1.3 0.9 0.0 0.6 4.5
Cloud Native 0.6 0.0 0.0 0.0 0.2 0.8
Application Services 1.8 0.0 -0.1 0.0 0.0 1.7
Modern Workplace 0.9 0.9 0.6 0.0 0.4 2.8
Information Security 4.4 1.7 0.8 0.0 0.5 7.4
Total 17.0 9.7 3.6 2.3 13.4 46.0
Growth by Product/Region

Enterprise Connectivity growth.
Significant Managed Services potential;Software Defined Refresh Phenomena;SaaS Specific Demands;Need for Speed.
Service Providersgrowth.
Consolidation in the region5G is a game changerDevNet / Software DefinedNetwork Function Virtualization (NFV)

Growth opportunity Information Security
€ 131 B
€ 290 B
CAGR 10.6%
2018 2026* Mordor Intelligence
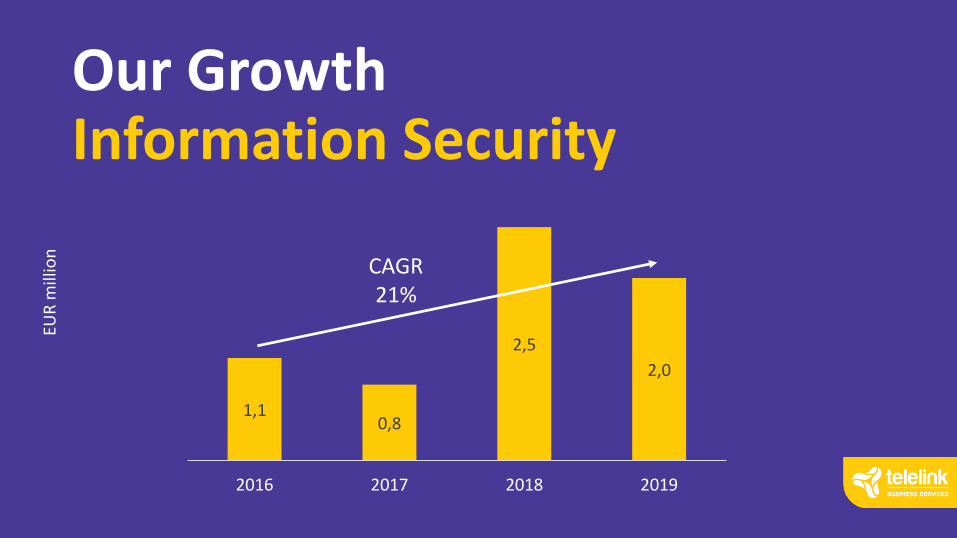
1,10,8
2,5
2,0
2016 2017 2018 2019
Our GrowthInformation Security
CAGR 21%
EUR
mill
ion

Information Security has no direct ROI.

Information Security requires complex integration.

Information Security requires 24/7 analytics.

Information Security experts are hard to recruit, train and retain.

Information Security introduce complexity which if managed, creates differentiator.

Growth in Info Secutilizing
as a service model; developed team - ASOC;Affordable and effective security.
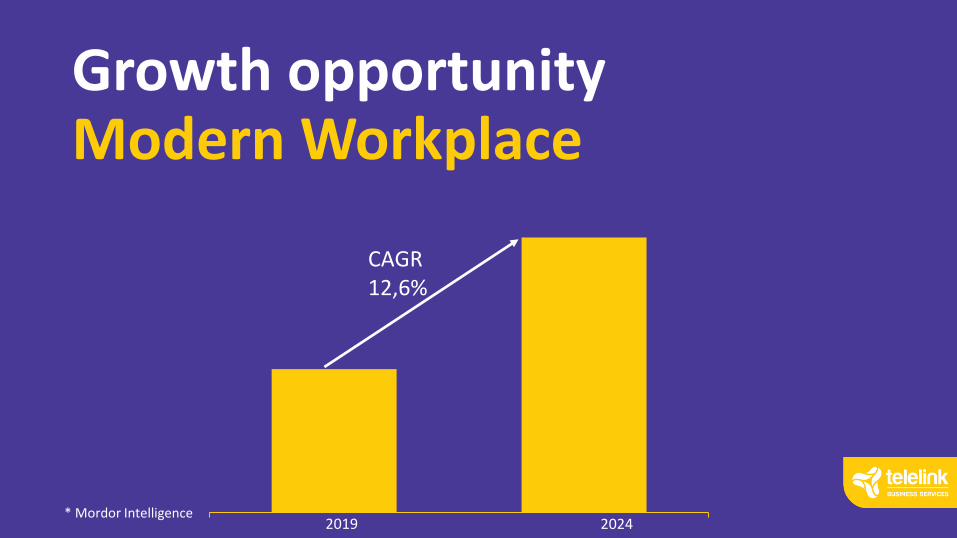
Growth opportunity Modern Workplace
CAGR 12,6%
2019 2024* Mordor Intelligence

1,8
3,94,8
7,3
2016 2017 2018 2019
Our GrowthModern Workplace
CAGR 58%
EUR
mill
ion
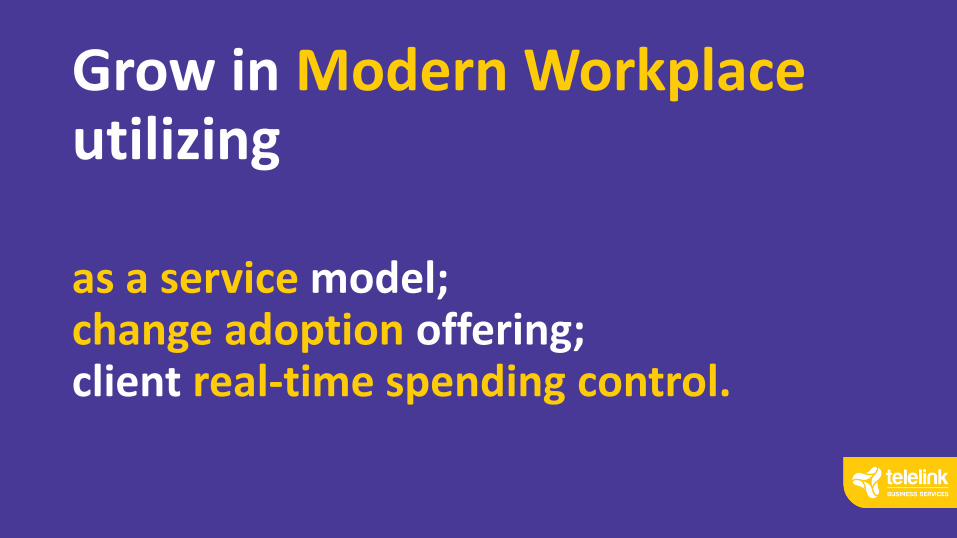
Grow in Modern Workplaceutilizing
as a service model; change adoption offering;client real-time spending control.

Public Offering RationaleEstablish a profit sharing scheme
Take a mature company to the next level
Establish advanced corporate governance
Get reputable investors onboard
Increase public image and recognition
Gain access to public fund-raising for future capital needs, incl.
potential M&A

Public Offering DetailsISSUER TELELINK BUSINES SERVICES GROUP AD
Placement Initial Public Offering of existing shares
Total shares 12 500 000 ordinary shares
Offered shares Up to 30% (3,750.000 shares)
Initial Price BGN 7.60 per share
Listing market Bulgarian Stock Exchange (BSE)
IPO manager ELANA Trading
IPO method Transaction(s) on the regulated market of the BSE
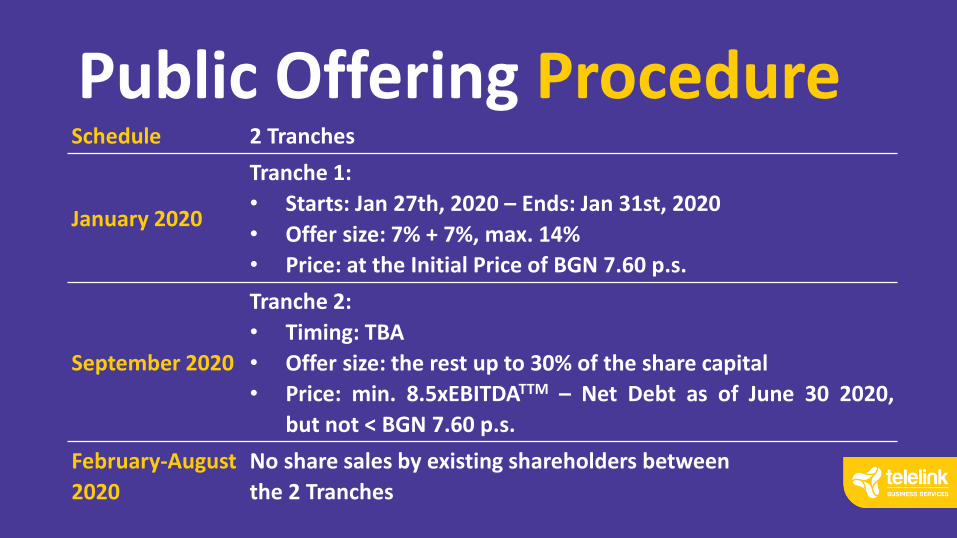
Public Offering ProcedureSchedule 2 Tranches
January 2020
Tranche 1:
• Starts: Jan 27th, 2020 – Ends: Jan 31st, 2020
• Offer size: 7% + 7%, max. 14%
• Price: at the Initial Price of BGN 7.60 p.s.
September 2020
Tranche 2:
• Timing: TBA
• Offer size: the rest up to 30% of the share capital
• Price: min. 8.5xEBITDATTM – Net Debt as of June 30 2020,
but not < BGN 7.60 p.s.
February-August
2020
No share sales by existing shareholders between
the 2 Tranches

Shareholder CommitmentsSelling
shareholders
Lyubomir Minchev (Founder): 23.9%-30% out of 83.7%Ivo Evgeniev & Spas Shopov: 0%-3.1% out of 6.2% eachOthers (4): 0% out of 4.0%
Lock-upCurrent shareholders to retain min. 70% by the end of 2020
Founder to retain min. 51% by the end of 2021
Minimum PriceCurrent shareholders not to sell at < BGN 7.60 p.s. in 2020
Founder not to sell at < BGN 7.60 p.s. by the end of 2021
Dividend policy
Minimum payout: 50% of the Issuer’s annual/semi-annual net
profit
Dividend of BGN 4 M expected in Q3 2020, implying
a 4.2% Dividend Yield over the minimum listing price

THANK YOU!