iowa school performance profiles user guide
TRANSCRIPT

User Guide
School PerformanceIOWA
PROFILES

Iowa School Performance Profiles User Guide Page 1
IntroductionThe Iowa School Performance Profiles is an online tool showing how public schools have performed on multiple measures.
The website meets federal and state requirements for publishing online school report cards: The federal Every Student Succeeds Act (ESSA), which replaced the No Child Left Behind Act, and House File 215, adopted by Iowa lawmakers in 2013.
The website includes scores on a set of accountability measures required under ESSA, as well as ratings based on the scores and identification of schools for support and improvement (Comprehensive and Targeted) based on the scores.
The website also includes additional data that are required for public reporting purposes under state or federal law but do not figure into a school’s accountability score.
Components of the Iowa School Performance Profiles are explained in the following sections:
MeasuresScores and RatingsNavigating the Site

Iowa School Performance Profiles User Guide Page 2
Measures
Learning MeasuresEach school receives an overall score based on its performance on accountability measures, which are under the “Learning Measures” dropdown menu and listed below. Schools also receive a score for each subgroup of students, such as students with disabilities (subgroups must have 20 or more students to receive a score). These measures are:●StudentParticipationonStateAssessments:
This requires that a minimum of 95 percent of a school’s enrollment participate in annual state assessments. The 95 percent rule also applies to a school’s student subgroups.
●AcademicAchievement:Thismeasurestwothings:
●Proficiency:Thepercentageofstudentsin a school who are proficient in math and English language arts (ELA) based on assessment results
●AverageScaleScore:Informationaboutthe average performance of students in ELA and mathematics in a school.
●StudentGrowth:Thisexaminesstudentgrowthby looking at assessment scores over time to determine whether a student performed better or worse than his/her academic peers (students at the same grade level with similar scores).
●GraduationRate(HighSchools):Thismeasuredetermines the percent of students who graduate from high school in four or five years.
●ProgressinAchievingEnglishLanguageProficiency: For students whose first language is not English, this measures a student’s progress in obtaining English language proficiency across the domains of reading, writing, listening and speaking. This measure is based on Iowa’s English language proficiency assessment, ELPA21.
●ConditionsforLearning:Thismeasuresschoolsafety, engagement and learning environment based on a survey of students in grades 5 through 12.
Additional MetricsThe Iowa School Performance Profiles include additional metrics that are required by either federal or state law but are not included in a school’s accountability score. The metrics are:●Attendance:Thismeasureshowstheaverage
daily attendance rate of students across the year.
●Chronicabsenteeism:Chronicabsenteeismis defined as missing 10 percent or more of school days for any reason, excused or unexcused – for vacation, health conditions, suspensions, etc.
●Percentofstudentsassessed:Thismeasureshows the percentage of students who took a reading or mathematics assessment.
●Staffretention:Thismeasureswhatkindofturnover the school experiences, with the thought that the higher the turnover, the more challenges the school may face with constantly having to train new staff.
●Suspensionandexpulsion:Thismeasureprovides information about the number of suspension and expulsion incidents by different student groups in the prior year.
●ProgressonStateGoals:Thisprovidesinformation about student performance and interim progress toward meeting state long-term goals for academic achievement, graduation rates, and English language proficiency, set forth in the state’s plan.
Achievement GapsThis section provides important information about closing gaps in achievement among subgroups of students, such as students with disabilities, English learners, students from low-income families (low socio-economic status), and students by race/ethnicity.
Data show how student subgroups are performing compared to each other, compared to the state average and compared to the benchmark cut score that identifies a school as Targeted.

Iowa School Performance Profiles User Guide Page 3
Schools receive a score for each accountability measure (listed under “Learning Measures”), and then the scores are combined into an overall score. Schools also receive a score for each subgroup of students, such as students with disabilities. Subgroups must have 20 or more students to receive a score. The average overall statewide school score is 54.91. School scores are used in two ways:
1. Identify schools in need of support and improvement (Comprehensive and Targeted)
2. Assign ratings of Exceptional, High Performing, Commendable, Acceptable, Needs Improvement, and Priority
Comprehensive & Targeted SchoolsComprehensive: A school is identified for
Comprehensive support and improvement if its overall score falls within the lowest 5 percent of Title I schools in the state or its graduation ratefallsbelow67.1percent.Generally,theseschools need assistance and support based on the performance of the entire student population.
Targeted: A school is identified for Targeted support and improvement if a student subgroup score is as low as the lowest 5 percent of schools in the state. Student subgroups are: Students who are eligible for free and reduced-price meals, English learners, students with disabilities, and students by racial/ethnic minority group (White, African American, Asian, Hispanic, Native American, Hawaiian/Pacific Islander, Multi-Racial).
Scores and Ratings
On the low end, schools that receive an overall score below 43.95 would be considered in the bottom 5 percent, or Comprehensive. A school with a student subgroup score of 43.95 or below, is considered a Targeted school.
Comprehensive and Targeted schools maintain their designations for three years, giving the schools time to come up with a meaningful plan that will be effective and sustaining.
Met vs. Not Met: Schools may be either Comprehensive or Targeted, but they cannot be both. For example, if a Comprehensive school has an underperforming student subgroup, the school’s Targeted column will say “Not Met.” A Not Met designation indicated the school is struggling or a subgroup is underperforming.
No Designation Listed: The majority of Iowa’s schools will not be identified for support and improvement. Schools that are identified receive additional support from the state and develop school improvement plans. However, they are subject to annual reporting requirements, and their scores will be available in the Iowa School Performance Profiles. An indication of “Met” means the school has not been identified in that area.

Iowa School Performance Profiles User Guide Page 4
Navigating the Site
HomepageFollow either step 1 or step 2 below:
1. Click “View State Report” to see statistics for Iowa schools as a whole.2. Click into the search field marked “Search by district or school name” and type in the name of the
school or district.
District & State OverviewsOnce a school district is selected, use the guidelines below to navigate through the website. The layout of the State Overview page is similar to that of the District Overview.
School RatingsSchools receive ratings based on their overall score. The ratings and corresponding score ranges are as follows:

Iowa School Performance Profiles User Guide Page 5
DemographicsIn the Demographics section, student subgroups are broken down for the district by race/ethnicity, gender, students with disabilities, low socio-economic status and English Learners. Each of these pie charts contains a color-coded legend to indicate which categories are represented by which color.
District InformationLocated at the top of the page are the district name, contact information, and website (if available).
Below the district’s general information is a navigation that will include the specific learning measures/reports for this district. Access these categories by clicking on “Learning Measures” to open the dropdown menu of measures. From there, navigate to the statistics by clicking on the individual measures, which will provide a more specific breakdown of that district’s performance in those categories. There is also an “Additional Metrics” dropdown menu which provides additional contextual data about a district.

Iowa School Performance Profiles User Guide Page 6
Performance in Each AreaThis section shows the district’s overall performance in different categories. These are scored on a scale of 1-100, and the numbered markers at the top of the chart provide a visual representation of each score on the chart. Each performance category also has an exact score listed on the far right.

Iowa School Performance Profiles User Guide Page 7
SchoolsThis section lists out all of the schools included in the district, including some basic information such as grades served, school type, Comprehensive status (if applicable), and Targeted status (if applicable). To see a specific school’s score, click the plus sign on the left side of the school’s name. Each of the school names are linked; clicking on a school’s title will take users to that school’s report card page, where more in-depth charts and data about that school’s performance and demographics will be available. These school report cards can be accessed either within the district page or by choosing the Search/Compare link in the header of the site and searching by school name.
FooterNo matter which page of the performance profile you are on, there is a footer with a button that reads, “ReadThroughOurUserGuide.”Thiswillopenupthisuserguide,whichcanbeusedtogivemorereference for the sections included on the report card pages. In addition, there is a resource link “Read ThroughOurTechnicalGuide”whichprovidesdetailabouthowmeasuresarecalculatedandmoreinformation about each measure.
District Learning MeasuresBack at the top of the district page, the individual learning measures pages can be accessed by clicking the “Learning Measures” dropdown from the district overview page and clicking on the measure title needed.
Using “Participation Rate” as an example (see image below), this shows the percentage of students who participated in state assessments in math and reading. It further breaks down this information by student subgroups (students with disabilities, low socio-economic status and English Learners).
Goingbacktothetop,pulldown“LearningMeasures”andopen“Growth.”Thisshowshowstudentsubgroups fared in the student growth measure. Inside each bar is a number that indicates the statewide average.
Allothermeasuresaresimilarto“Growth.”

Iowa School Performance Profiles User Guide Page 8
Iowa School Performance Profiles User Guide Page 9
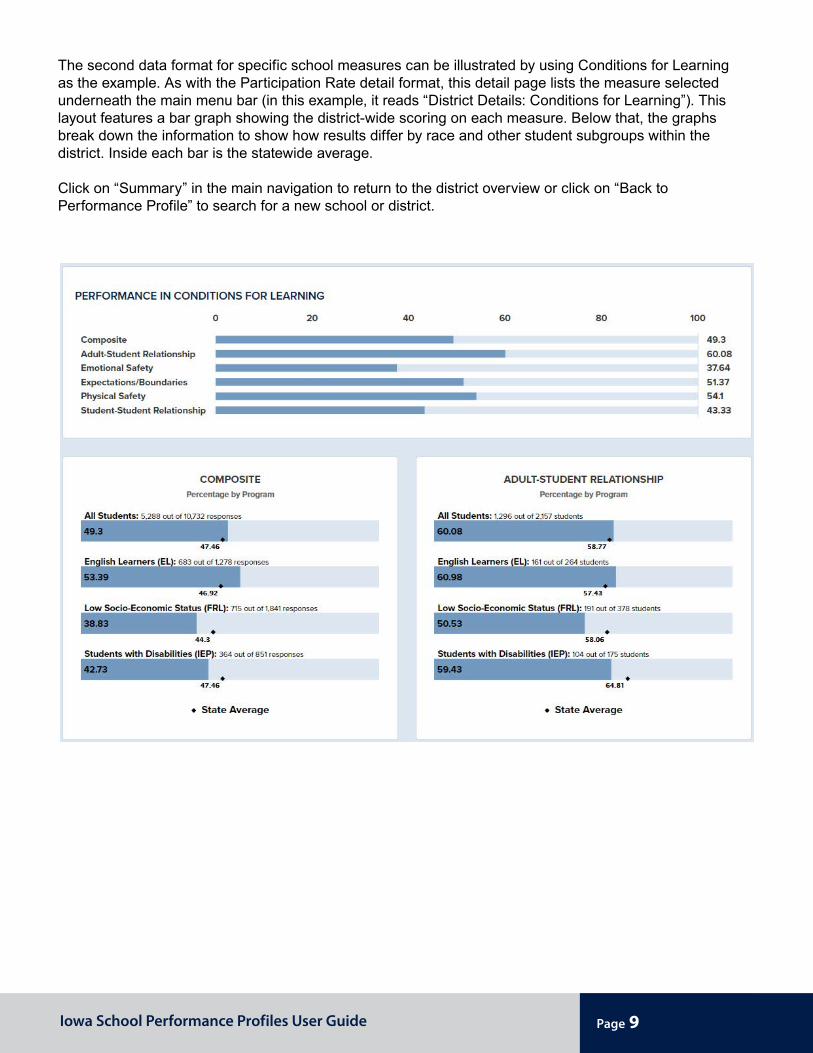
The second data format for specific school measures can be illustrated by using Conditions for Learning as the example. As with the Participation Rate detail format, this detail page lists the measure selected underneath the main menu bar (in this example, it reads “District Details: Conditions for Learning”). This layout features a bar graph showing the district-wide scoring on each measure. Below that, the graphs break down the information to show how results differ by race and other student subgroups within the district. Inside each bar is the statewide average.
Click on “Summary” in the main navigation to return to the district overview or click on “Back to Performance Profile” to search for a new school or district.

Iowa School Performance Profiles User Guide Page 10
AboutBelow the school’s information is some more specific information about the school selected: principal, enrollment numbers, grades served, address and telephone number.
School OverviewOnce a school is selected, use the guidelines below to navigate through the data.
School InformationThe format is similar to the top of the District and State overview pages. The top of the page includes the school name, contact information, and website (if it is available). Use the “Back to Performance Profile” button at the upper right to go back and search for another school or district.
Below the school’s general information is a navigation that will include the specific measures/reports for this school. Click through these categories and pages (found on the dropdown menus or page titles) to navigate immediately to the data, or continue scrolling down the page to see a statistical overview of the school.
Overall Performance
Under the Overall Performance graphic is the school’s performance rating (Exceptional, High Performing, Commendable, Acceptable, Needs Improvement or Priority). For a deeper look into how the school is performing – and to ascertain whether the school needs additional support for improvement – is the selected school’s score out of 100, with numbers and a visual representation. To the right is a short description of how overall performance should be understood. To the left is a school’s Comprehensive or Targeted designation, if applicable. If both
say “met,” then the school is not designated for additional support.
If, after Comprehensive status it says “Comprehensive,” then the school is in the bottom 5 percent of the state’s Title I schools based on performance. If “Targeted” is listed after Targeted Status, the school has one or more student subgroups performing as low as the lowest 5 percent of schools in the state.
Below this is a Demographics section, which the user can choose to display or hide.

Iowa School Performance Profiles User Guide Page 11
Performance in Each AreaThis chart lists each measure that contributes to the overall school score and the score earned in each category. These are scored on a scale of 1-100, and the numbered markers at the top of the chart give a visual representation of each score on the chart. Each performance category has a number listed on the right for the school’s exact score in that category.

Iowa School Performance Profiles User Guide Page 12
Performance DetailThe performance detail chart shows how the raw scores are transformed into a weighting of each measure. When added up, all the measures total the school’s overall score. To understand what each measure means, click on the measure for a detailed explanation.
Raw scores represent a school’s actual score from 1 to 100.
Standard scores are designed to create fairness and comparability in the scoring system by ensuring that schools with missing measures are treated the same as schools with all measures. For example, without standardization, high schools would be at an advantage over elementary and middle schools because most have a high graduation rate.

Iowa School Performance Profiles User Guide Page 13
School Learning Measures and Additional MetricsThe individual learning measures pages can be accessed by clicking the “Learning Measures” dropdown on the school overview page and clicking on the measure title needed.
Learning Measures data are displayed in one of two ways. Using “Participation Rate” as an example, this detail page lists the measure selected underneath the main menu bar (in this example, it reads “School Details: Participation Rate”). Below that is an introduction to the school’s Participation Rate breakdown (or the breakdown of whichever measure was selected in the dropdown), which features one or two circle graphs showing the school’s percentage out of 100 for each category. Images below show examples of measures with two circle graphs and one circle graph, respectively. Conditions for Learning is the featured example for a learning measure detail page with only one circle graph.
Similar to the district learning measures detail pages, below the top section of the page is a block layout that breaks down the school’s data categories for each measure by student subgroup.

Iowa School Performance Profiles User Guide Page 14
Click on “Summary” in the main navigation to return to the district overview or choose “Back to Performance Profile” to search for a new school or district.

Iowa School Performance Profiles User Guide Page 15
The “In-Depth View” was added to provide additional information about student performance. By clicking the “Accountability View” toggle, the display will switch to “In-depth View.” The “In-depth View” is more inclusive and displays performance for all students and has a minimum student size of 10. The “In-Depth view” provides additional data for students where one bad test score would not skew the results. Some teachers still may find the information in the “In-depth view” useful in looking into smaller subgroups. For example, a student who enrolled the day before the assessment window would be included in the “In-Depth View” but would not be included in the “Accountability View.” The “In-Depth View” also includes additional subgroups which are required to be reported under ESSA. Additional subgroups included are: Migrant, FosterCare,MilitaryConnected,Gender,HomelessandGradebreakdown.
Additional ToolsA new feature has been added to the site to provide more information about student performance. By default, the site displays the “Accountability View,” which shows data for the students and subgroups that are part of a school’s overall score. In the “Accountability View,” a student has to be enrolled for a full academic year to be included. The minimum student group size is 20 for the “Accountability View.” That’s because 20 is the minimum number needed to ensure that the score is statistically meaningful. Especially in smaller school districts, the “Accountability View” often will not include subgroups of students -- such as minorities or those who receive free or reduced-price lunches -- because there are fewer than 20 students in them.

Iowa School Performance Profiles User Guide Page 16
Comparison ChartIn addition, users have the ability to compare their schools to others by clicking Search/Compare at the top right of the page. That will take you to what’s called a scatter plot graphic. It is designed to give users the ability to compare and contrast using multiple attributes such as school type (elementary, middle, high) and school rating across multiple accountability measures, such as growth and proficiency. Stakeholders can use this information to identify like schools that are excelling and determine what practices are in place that lead to student success.
The comparison chart provides tool to explore school performance across multiple accountability measures. This is a scatter plot visualization where each bubble on the display represents a school. The default display shows student enrollment on the vertical axis (y) and overall school score on the horizontal (x) axis. This default display show there is no relationship between the number of students in a school and a school’s overall score.

Iowa School Performance Profiles User Guide Page 17
Inaddition,ausercanusetheGroupBydropdown to view schools by: School Type (Elementary, Middle, High School), Rating Category (Exceptional, High Performing, Commendable, Acceptable, Needs Improvement and Priority), Comprehensive Status and Targeted Status.
Lastly, you can use the Locate By dropdown to locate a particular school on the scatter plot.
There are several important features which allow a user to choose different accountability measures. By clicking the X Axis and Y Axis any of the measures: Participation Rate, GraduationRate,Growth,ConditionsforLearning and Progress in Achieving English Language Proficiency may be choose to fetch new results.