ireland's tidal energy resource: an assessment of a site
TRANSCRIPT

Technological University Dublin Technological University Dublin
ARROW@TU Dublin ARROW@TU Dublin
Articles School of Mechanical and Design Engineering
2014
Ireland's Tidal Energy Resource: an Assessment of a Site in the Ireland's Tidal Energy Resource: an Assessment of a Site in the
Bulls Mouth and the Shannon Estuary Using Measured Data Bulls Mouth and the Shannon Estuary Using Measured Data
Fergal O'Rourke Dundalk Institute of Technology, [email protected]
Fergal Boyle Technological University Dublin, [email protected]
Anthony Reynolds Technological University Dublin, [email protected]
Follow this and additional works at: https://arrow.tudublin.ie/engschmecart
Part of the Engineering Commons
Recommended Citation Recommended Citation O’Rourke,F.,Boyle, F. & Reynolds, A. (2014) Ireland’s tidal energy resource; An assessment of a site in the Bulls Mouth and the Shannon Estuary using measured data, Energy Conversion and Management, Vol. 87, pp. 726-734, ISSN 0196-8904, doi:10.1016/j.enconman.2014.06.089
This Article is brought to you for free and open access by the School of Mechanical and Design Engineering at ARROW@TU Dublin. It has been accepted for inclusion in Articles by an authorized administrator of ARROW@TU Dublin. For more information, please contact [email protected], [email protected].
This work is licensed under a Creative Commons Attribution-Noncommercial-Share Alike 4.0 License

1
Ireland's tidal energy resource; an assessment of a site in the Bulls Mouth
and the Shannon Estuary using measured data
Fergal O’Rourkea,b,*
, Fergal Boylea, Anthony Reynolds
a
aDepartment of Mechanical Engineering, Dublin Institute of Technology, Bolton Street, Dublin 1, Ireland
bDepartment of Electronic and Mechanical Engineering, Dundalk Institute of Technology, Dundalk, Co. Louth, Ireland
Abstract
The issues associated with Ireland’s over reliance on fossil fuels to meet energy demands have sparked an
interest in renewable energy. Renewable energy resources typically are intermittent and vary significantly in
energy intensity. Tidal energy however has the advantage of predictability over large time scales and high power
densities. A study of Ireland's tidal-current-energy resource has identified several viable sites. As part of this
resource assessment, Acoustic Doppler Current Profilers were installed at two locations along Ireland's west
coast, at a site in the Bulls Mouth and the Shannon Estuary. The Acoustic Doppler Current Profilers measured
tidal current speed and direction at 30 minute intervals over a 30 day period at a range of depths through the
water column. This is the first time the measured data appears in the literature as it has only recently been made
public. This paper presents tidal current speed and direction, frequency of occurrence of speed, tidal roses at
several depths through the water column, and a comparison of theoretical tidal-current-speed profiles with
measured data for a site in the Bulls Mouth and in the Shannon Estuary. The paper compares power density at
both sites over a lunar month and also proposes a best fit power law exponent with the measured data through
the water column. Finally, the paper presents an energetic performance comparison for a tidal current turbine
operating at both sites. The data presented in this paper can be used in the design process to estimate the
hydrodynamic and structural performance of a tidal current turbine operating under real-life conditions. The data
can also be used to assess different control strategies and to design a tidal current turbine to suit the site-specific
characteristics.
Contents
1 Introduction ................................................................................................................................................... 2
2 Tidal energy in Ireland .................................................................................................................................. 2
3 Results and analysis ...................................................................................................................................... 5
4 Conclusions ................................................................................................................................................. 16
Keywords; Tidal current energy, assessment, Ireland, ADCP
* Corresponding author. Tel.:+353 4293 70200 (2695)
E-mail address: [email protected]

2
1 Introduction
Ireland's over dependence on the combustion of
fossil fuels to meet energy demands has led to
several energy related issues. These issues include
security of supply, climate change, and fluctuating
costs. The effect of the outlined issues has forced
political leaders to consider alternative energy
sources, and in particular renewable energies[1].
Most renewable energy sources are unpredictable
in nature and vary significantly in intensity[2].
Tidal energy has the advantage of predictability
over large time scales and, as a result, is an
excellent choice as a base-load energy supply[3-5].
Recent research and development efforts in tidal
energy extraction have been focused on tidal-
current-turbine technology which utilises tidal
currents; however, this technology is still at an
early stage of development[6, 7].
Sites where tidal-current-energy extraction is
feasible are generally found along coastlines, inlets,
channels and between headlands, as in these areas
the tidal current speed is generally greater than tidal
current speeds in the open ocean. When assessing
the suitability of a site for tidal-current-energy
extraction the tidal current speed is the main
determinant[8]. The frequency of occurrence of
speed is an excellent indicator as to the annual
energy output which can be achieved.
A tidal-current-energy resource assessment was
conducted for Ireland in 2004[9]. The assessment
employed a 2-D numerical model for tidal current
prediction, and by applying theoretical, technical,
practical, accessible and viable limitations 11 sites
were identified as viable for tidal-current-energy
extraction. Some of the identified sites boast tidal
current speeds close to 4 m/s[10]. Acoustic Doppler
Current Profilers (ADCPs) were installed at two
locations along Ireland's west coast, in the Bulls
Mouth and the Shannon Estuary. The purpose of
their installation was to validate the 2-D numerical
model of the tidal current around Ireland only and,
as a result, the measured data has only recently
been made public.
This is the first time this measured data has
appeared in the literature. This paper presents tidal
current speed and direction, frequency of
occurrence of speed, tidal roses at several depths
through the water column and a comparison of
theoretical tidal-current-speed profiles with
measured data for both sites. An analysis of the
measured data is also presented which includes a
comparison of theoretical tidal current speed
profiles with measured data, the power density and
an energetic performance comparison. The data can
be used in the design process to model the
hydrodynamic and structural performance of a
tidal-current-turbine design under real-life
conditions. The data can also be used to assess the
effect of different control strategies e.g. the use of
pitch and yaw control. Also a tidal current turbine
could be designed to suit the site-specific
characteristics of the Bulls Mouth and the Shannon
Estuary. The data may also be used for arranging
the site-specific layout of tidal current turbines.
2 Tidal energy in Ireland
2.1 Introduction
Ireland is situated on the east of the Atlantic ocean
with a coastline approximately 7500 km long[11,
12]. Along this coastline are numerous inlets and
islands between which there are channels which are
ideal for tidal-current-energy extraction due to the
high tidal current speeds. Strong tidal currents are
common along the north and east coasts and are
particularly energetic entering the Irish Sea from
the St. Georges Channel and the North
Channel[10]. Figure 1 illustrates the oceans around
Ireland and the direction of the flood[13-15]. The
bathymetry and hydrography of Ireland’s coastline

3
influences the local tidal currents. The kinetic flux
density is an excellent indicator of the tidal current
energy resource available at a site which is
proportional to the fluid density and the cube of its
speed[16-19]. Therefore the speed is the most
significant factor when deciding if a site is feasible
for energy extraction[20-23]. Most of the tidal-
current-flow research along the coastline to-date
was done for the purpose of mapping fish species
and spawning areas, and for the benefit of shipping.
Relatively little work has been published in the
interest of tidal-current-energy resource
assessment.
Atlantic
Ocean
St. Georges
Channel
North
Channel
Irish Sea
Figure 1. The oceans around Ireland and the
tidal current direction during a flood tidal
movement[24]
2.2 Resource assessment
The currently-accepted tidal-current-energy
resource assessment was completed by Sustainable
Energy Authority Ireland (SEAI), an organisation
set up by the Irish government with the objective of
promoting the use of sustainable energy, and
published in a report entitled Tidal and Current
Energy Resources in Ireland in 2004. As part of
this resource assessment, RPS Kirk McClure
Morton (UK), an engineering and environmental
consultancy group, developed a 2-D numerical
model of the tidal currents around Ireland. The
numerical model was developed using Mike 21
software. Mike 21, developed by the Danish
Hydrographic Institute, is an engineering software
package designed for the simulation of fluid flows,
waves, sediments and ecology in rivers, estuaries,
seas and coastal regions. The 2-D numerical model
predicted the tidal current surface speeds and was
validated using measured data from two purposely-
installed ADCPs. These were installed by
AquaFact International Services Ltd, one at a site
in the Bulls Mouth and the other at a site in the
Shannon Estuary.
In the resource assessment the theoretical tidal-
current-energy resource was first identified. This is
the gross tidal energy content of the tidal current
flow within a strip encircling Ireland. The landward
boundary of the strip was taken at the point where
the water depth reaches 10 m and the seaward
boundary was taken at the 12 nautical mile
territorial limit from the coast. Within this strip the
numerically-predicted peak spring-tide surface
speeds were depth-averaged using a 1/7th
power
law to calculate the mid-depth tidal-current speeds.
The mean tidal-current power, , per unit area
was then calculated using[25]
( ) (1)
where is the density of seawater, is the speed
availability factor (0.424), is the neap/spring
factor (0.57) and is the peak spring-tide mid-
depth speed.
In order to calculate the theoretical extractable
tidal-current energy, a turbine power coefficient,
, of 0.59, a turbine spacing array layout and a
turbine cross-sectional area based on the depth of

4
the water column were applied. The turbine spacing
array layout assumed a lateral spacing of five
diameters and an upstream/downstream spacing of
10-20 diameters. The diameter of the rotor was
assumed to be 0.7 times the depth of the water
column. The theoretical tidal-current-energy
resource amounted to 230 TWh/y. The technical
tidal-current-energy resource was assessed by
applying technical limitations to the theoretical
resource. A turbine efficiency of 0.39 was applied
and locations with tidal current speeds below 1.5
were excluded[24]. It was assumed that tidal
current energy technology will not operate
effectively at tidal current speeds below 1.5 m/s.
The technical tidal-current-energy resource was
calculated as 10.46 TWh/y. The practical tidal-
current-energy resource was subsequently obtained
by applying practical limitations to the technical
tidal-current-energy resource. Only sites with a
water depth of between 20-40 m were included in
the resource assessment, while areas such as
shipping lanes and restricted areas were excluded.
After the application of the practical limitations 11
sites remained and are shown in Figure 2[26]. The
practical tidal-current-energy resource amounted to
2.633TWh/y. The accessible tidal-current-energy
resource was calculated by applying accessible
limitations to the practical tidal-current-energy
resource. The accessible tidal-current-energy
resource limitations had no effect on the practical
tidal-current-energy resource and, as a result, the
accessible tidal-current-energy resource also
amounted to 2.633 TWh/y. The viable tidal-
current-energy resource is the resource obtained
after applying commercial limitations to the
accessible tidal-current-energy resource. In order to
calculate the viable tidal-current-energy resource an
economic model developed by Marine Current
Turbine Ltd was used. The economic model
calculated the optimum size of a turbine for a site
based on water depth, tidal current speed, turbine
costs, etc. From this model the viable tidal-current-
energy resource was estimated at 0.915 TWh/y[24].
Figure 2. Location of the 11 sites identified in
the practical tidal-current-energy resource
assessment for Ireland including the two sites at
which measurements were made: the Bulls
Mouth and the Shannon Estuary[24]
2.3 Measurement instrumentation and site
description
A Teledyne RDI, Workhorse Sentinel 600 kHz
ADCP was used to measure the tidal current speed
and direction[27]. The accuracy of the ADCP
measured speed is ±0.003 m/s and the default speed
range is ±5 m/s up to a maximum of ±20 m/s. The
number of cell depths available range from 1-255
with a ping rate of up to 10 Hz. The compass
(fluxgate type) includes a built-in field calibration
feature and has an accuracy of ±2°; however, this
accuracy can be improved to <±1° after calibration.
ADCPs were installed by AquaFact International
Services Ltd at two locations on Ireland's west

5
coast, at a site in the Bulls Mouth and at a site in
the Shannon Estuary. The Bulls Mouth and
Shannon Estuary are shown in Figure 2. Table 1
gives information on the two ADCPs' location and
their installation period. Both sites have a water
depth of approximately 14 m. The seabed at both
sites is relatively flat, consisting of rough sand with
the occasional larger boulder scattered over the
seabed. The ADCPs were bottom frame mounted
and hardwired to a monitoring station which
recorded the data. The ADCPs measured tidal
current speed and direction at 30 minutes intervals
over a 30 day period. Tidal-current-speed and
direction data was recorded from a depth of two to
10 metres in one-metre depth intervals.
Measurements were not made outside of this
interval. Once the ADCP was retrieved, the binary
data was processed using the RDI software
WinADCP in order to output the speed and
direction of the tidal currents.
Site Latitude
(deg N)
Longitude
(deg W)
Installation Period
Bulls Mouth 54° 00.598' 9° 55.204' 25th
June 2004 - 27th
July 2004
Shannon Estuary 52° 35.656' 9° 31.308' 24th
June 2004 - 28th
July 2004
Table 1. Location of the two ADCPs along Ireland’s west coast and their installation period
3 Results and analysis
3.1 Tidal current speed
Figure 3 and Figure 4 show the variation of the
mid-depth tidal-current speed over a lunar month
for a site in the Bulls Mouth and in the Shannon
Estuary respectively. The overall variation of tidal
current speed with respect to time is important
when accessing the availability of tidal energy
during daily periods. The two sites experience
contrasting peak spring-tide speeds. A peak spring-
tide speed of 1.01 m/s was recorded at the site in
the Bulls Mouth over the lunar month in
comparison with a peak spring-tide speed of 2.02
m/s at the site in the Shannon Estuary. Comparing
both sites, it can be seen that the site in the
Shannon Estuary is much more attractive for tidal-
current-energy extraction.
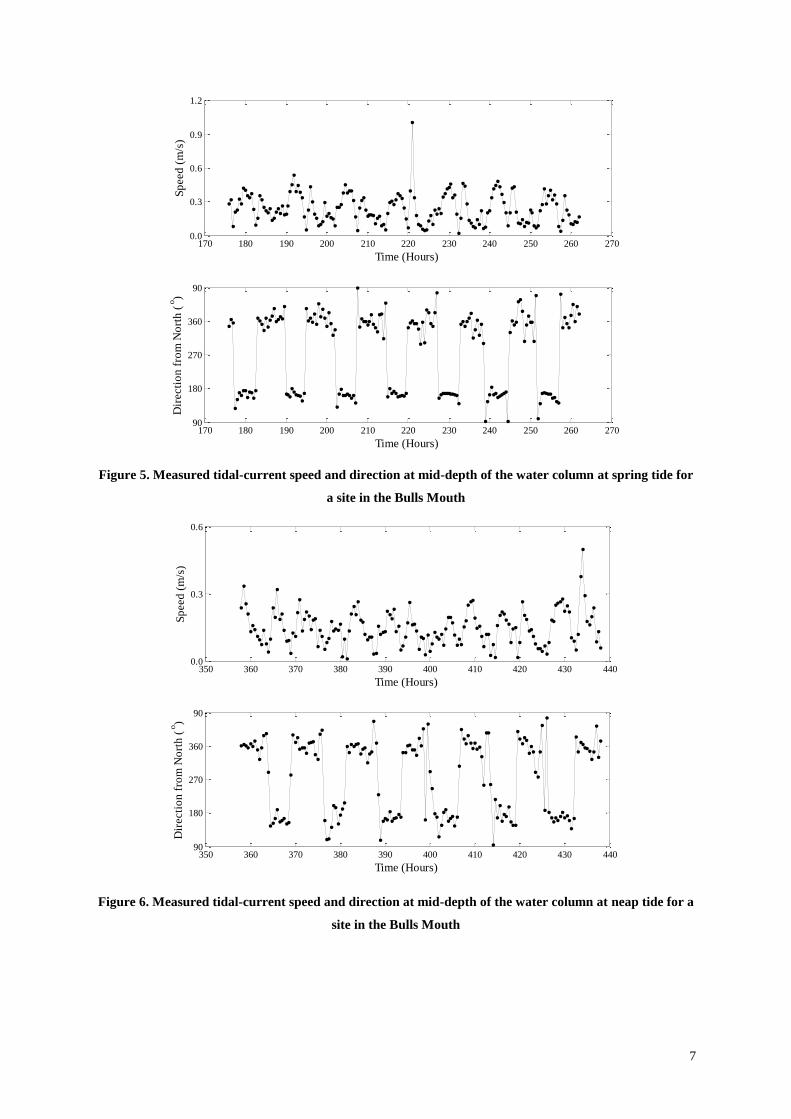
Figure 5 and Figure 6 show both the tidal current
speed and direction at mid-depth of the water
column in the Bulls Mouth at spring and neap tide
respectively. Figure 7 and Figure 8 show the
corresponding data for the site in the Shannon
Estuary. The speed and direction at the site in the
Bulls Mouth vary significantly throughout the
duration of spring and neap tide. Comparing the
site in the Bulls Mouth with the site in the Shannon
Estuary, it can be seen that the tidal current speed
and direction in the Shannon Estuary are much
more predictable.
For both sites, there is a notable difference in the
tidal current speeds over the spring/neap cycle. The
tidal cycle of the Shannon Estuary and the Bulls
Mouth are dominated by the principal M2 and S2
tidal constituents [28]. As a result, the power
generated by a tidal current turbine will vary
significantly between spring tide and neap tide and
on a daily basis between the peak tidal flow and
slack water. Power averaging is often used to
remove the daily tidal current speed variation. The

6
power averaging approach given in [17] can be
used to find the maximum average power that can
be extracted for a tidal channel which is driven by
multiple tidal constituents.
Figure 3. Measured tidal-current speed at mid-depth of the water column over a lunar month for a site in
the Bulls Mouth
Figure 4. Measured tidal-current speed at mid-depth of the water column over a lunar month for a site in
the Shannon Estuary
0 100 200 300 400 500 600 7000.0
0.2
0.4
0.6
0.8
1.0
1.2
Time (Hours)
Sp
eed
(m
/s)
Spring tide
Neap tide
0 100 200 300 400 500 600 7000.0
0.5
1.0
1.5
2.0
2.5
Time (Hours)
Sp
eed
(m
/s)
Spring tide
Neap tide
7
Figure 5. Measured tidal-current speed and direction at mid-depth of the water column at spring tide for
a site in the Bulls Mouth
Figure 6. Measured tidal-current speed and direction at mid-depth of the water column at neap tide for a
site in the Bulls Mouth
170 180 190 200 210 220 230 240 250 260 2700.0
0.3
0.6
0.9
1.2
Time (Hours)
Sp
eed
(m
/s)
170 180 190 200 210 220 230 240 250 260 27090
180
270
360
90
Time (Hours)
Dir
ecti
on
fro
m N
ort
h (
o)
350 360 370 380 390 400 410 420 430 4400.0
0.3
0.6
Time (Hours)
Sp
eed
(m
/s)
350 360 370 380 390 400 410 420 430 44090
180
270
360
90
Time (Hours)
Dir
ecti
on
fro
m N
ort
h (
o)

8
Figure 7. Measured tidal-current speed and direction at mid-depth of the water column at spring tide for
a site in the Shannon Estuary
Figure 8. Measured tidal-current speed and direction at mid-depth of the water column at neap tide for a
site in the Shannon Estuary
200 210 220 230 240 250 260 270 280 2900.0
0.5
1.0
1.5
2.0
2.5
Time (Hours)
Sp
eed
(m
/s)
200 210 220 230 240 250 260 270 280 2900
50
100
150
200
250
300
Time (Hours)
Dir
ecti
on
fro
m N
ort
h (
o)
360 370 380 390 400 410 420 430 440 450 4600.0
0.5
1.0
1.5
Time (Hours)
Sp
eed
(m
/s)
360 370 380 390 400 410 420 430 440 450 4600
50
100
150
200
250
300
Time (Hours)
Dir
ecti
on
fro
m N
ort
h (
o)

9
3.2 Tidal-current-speed frequency of
occurrence
A frequency distribution analysis was conducted on
the measured tidal-current-speed data for the two
sites to obtain an understanding of the size of
energy resource. The results of this analysis are
presented in Figure 9 and Figure 10 where the
frequency of occurrence of mid-depth speed over a
lunar month for a site in the Bulls Mouth and the
Shannon Estuary respectively are shown. It can be
seen from the two histograms that the higher speeds
occur more frequently at the site in the Shannon
Estuary than at the site in the Bulls Mouth.
Figure 9. Frequency of occurrence of mid-depth
speed over a lunar month for a site in the Bulls
Mouth
Figure 10. Frequency of occurrence of mid-
depth speed over a lunar month for a site in the
Shannon Estuary
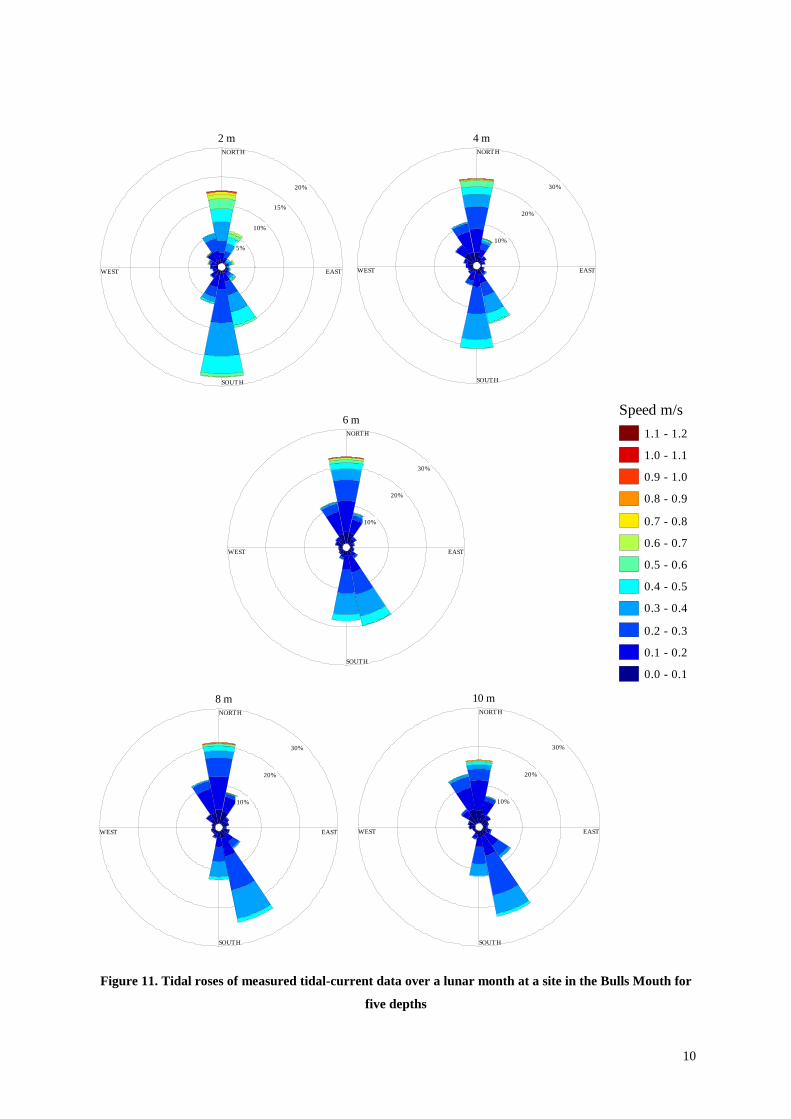
3.3 Tidal roses
In order to obtain a complete understanding of the
tidal characteristics of a site tidal roses were
created from the measured data at depths of two,
four, six, eight and 10 metres for the site in the
Bulls Mouth and the Shannon Estuary. A tidal rose
provides information on the occurrence of a range
of speeds and their corresponding flow directions.
The circles drawn on the tidal roses show the
frequency of occurrence of speed and direction of
the tidal current. Figure 11 and Figure 12 illustrate
the tidal roses for a site in the Bulls Mouth and the
Shannon Estuary over a lunar month respectively.
Figure 11 shows that the tidal current primarily
flows from the north and south at the site in the
Bulls Mouth. At this site the direction of the tidal
currents stay relatively constant from the north and
vary from the dominant south direction to a south-
south-east direction with an increase in depth.
Figure 12 shows that the tidal current primarily
flows from the east and the west-south-west at the
site in the Shannon Estuary. Interestingly the
directions of the tidal currents do not vary
considerably through the depth of the water column
over the lunar month.
0.0 0.2 0.4 0.6 0.8 1.0 1.2 1.40.00
0.01
0.02
0.03
0.04
0.05
0.06
0.07
0.08
0.09
0.10
Mid-Depth Speed (m/s)
No
rmali
sed
Fre
qu
en
cy
of
Occu
ran
ce
0.0 0.5 1.0 1.5 2.0 2.50.000
0.005
0.010
0.015
0.020
0.025
0.030
0.035
0.040
0.045
0.050
Mid-Depth Speed (m/s)
No
rmali
sed
Fre
qu
en
cy
of
Occu
ran
ce
10
Figure 11. Tidal roses of measured tidal-current data over a lunar month at a site in the Bulls Mouth for
five depths
5%
10%
15%
20%
WEST EAST
SOUTH
NORTH
0.0 - 0.1
0.1 - 0.2
0.2 - 0.3
0.3 - 0.4
0.4 - 0.5
0.5 - 0.6
0.6 - 0.7
0.7 - 0.8
0.8 - 0.9
0.9 - 1.0
1.0 - 1.1
1.1 - 1.2
2 m
Velocity m/s10%
20%
30%
WEST EAST
SOUTH
NORTH
0.0 - 0.1
0.1 - 0.2
0.2 - 0.3
0.3 - 0.4
0.4 - 0.5
0.5 - 0.6
0.6 - 0.7
0.7 - 0.8
0.8 - 0.9
0.9 - 1.0
1.0 - 1.1
1.1 - 1.2
4 m
Velocity m/s
10%
20%
30%
WEST EAST
SOUTH
NORTH
0.0 - 0.1
0.1 - 0.2
0.2 - 0.3
0.3 - 0.4
0.4 - 0.5
0.5 - 0.6
0.6 - 0.7
0.7 - 0.8
0.8 - 0.9
0.9 - 1.0
1.0 - 1.1
1.1 - 1.2
Speed m/s
10%
20%
30%
WEST EAST
SOUTH
NORTH
0.0 - 0.1
0.1 - 0.2
0.2 - 0.3
0.3 - 0.4
0.4 - 0.5
0.5 - 0.6
0.6 - 0.7
0.7 - 0.8
0.8 - 0.9
0.9 - 1.0
1.0 - 1.1
1.1 - 1.2
6 m
Velocity m/s
10%
20%
30%
WEST EAST
SOUTH
NORTH
0.0 - 0.1
0.1 - 0.2
0.2 - 0.3
0.3 - 0.4
0.4 - 0.5
0.5 - 0.6
0.6 - 0.7
0.7 - 0.8
0.8 - 0.9
0.9 - 1.0
1.0 - 1.1
1.1 - 1.2
8 m
Velocity m/s10%
20%
30%
WEST EAST
SOUTH
NORTH
0.0 - 0.1
0.1 - 0.2
0.2 - 0.3
0.3 - 0.4
0.4 - 0.5
0.5 - 0.6
0.6 - 0.7
0.7 - 0.8
0.8 - 0.9
0.9 - 1.0
1.0 - 1.1
1.1 - 1.2
10 m
Velocity m/s

11
Figure 12. Tidal roses of measured tidal-current data over a lunar month at a site in the Shannon Estuary
for five depths
10%
20%
30%
40%
WEST EAST
SOUTH
NORTH
0.0 - 0.2
0.2 - 0.4
0.4 - 0.6
0.6 - 0.8
0.8 - 1.0
1.0 - 1.2
1.2 - 1.4
1.4 - 1.6
1.6 - 1.8
1.8 - 2.0
2.0 - 2.2
2.2 - 2.4
2 m
Velocity m/s15%
30%
45%
WEST EAST
SOUTH
NORTH
0.0 - 0.2
0.2 - 0.4
0.4 - 0.6
0.6 - 0.8
0.8 - 1.0
1.0 - 1.2
1.2 - 1.4
1.4 - 1.6
1.6 - 1.8
1.8 - 2.0
2.0 - 2.2
2.2 - 2.4
4 m
Velocity m/s
15%
30%
45%
WEST EAST
SOUTH
NORTH
0.0 - 0.2
0.2 - 0.4
0.4 - 0.6
0.6 - 0.8
0.8 - 1.0
1.0 - 1.2
1.2 - 1.4
1.4 - 1.6
1.6 - 1.8
1.8 - 2.0
2.0 - 2.2
2.2 - 2.4
Speed m/s
15%
30%
45%
WEST EAST
SOUTH
NORTH
0.0 - 0.2
0.2 - 0.4
0.4 - 0.6
0.6 - 0.8
0.8 - 1.0
1.0 - 1.2
1.2 - 1.4
1.4 - 1.6
1.6 - 1.8
1.8 - 2.0
2.0 - 2.2
2.2 - 2.4
6 m
Velocity m/s
15%
30%
45%
WEST EAST
SOUTH
NORTH
0.0 - 0.2
0.2 - 0.4
0.4 - 0.6
0.6 - 0.8
0.8 - 1.0
1.0 - 1.2
1.2 - 1.4
1.4 - 1.6
1.6 - 1.8
1.8 - 2.0
2.0 - 2.2
2.2 - 2.4
8 m
Velocity m/s15%
30%
45%
WEST EAST
SOUTH
NORTH
0.0 - 0.2
0.2 - 0.4
0.4 - 0.6
0.6 - 0.8
0.8 - 1.0
1.0 - 1.2
1.2 - 1.4
1.4 - 1.6
1.6 - 1.8
1.8 - 2.0
2.0 - 2.2
2.2 - 2.4
10 m
Velocity m/s

12
3.4 Tidal-current-speed profiles
Numerical simulations of the tidal current are often
conducted to get a better understanding of the
typical speeds which may occur at a particular site.
These numerical simulations typically calculate the
surface speed. The theoretical tidal-energy resource
is then calculated using a power law or log law
approximation to calculate the speed at the depth of
interest in the water column. However, other
approximations, given in [29], can be used to
calculate the tidal current speed profile. The power
law represents a rudimentary model for the
variation in tidal current speed through the water
column and is given as:
( ) (
)
(2)
where ( ) is the tidal current speed, is the height
above the seabed, is the reference tidal current
speed, is the reference height above the seabed
and is the power law exponent. The exponent
can vary significantly from site-to-site. The main
parameters which affect are the tidal current
speed and the seabed roughness, and several
empirical methods can be used to calculate . A
value of 1/7 is a typical value for the power law
exponent; however, this may not be a best fit for all
sites. The speed profile can also be calculated using
the log law:
( ) ( (
)
( )) (3)
where the terms are as before and represents the
seabed roughness. Table 2 gives values for seabed
roughness for various seabed conditions.
Seabed Description Seabed Roughness,
(mm)
Silt/sand 0.02
Sand/shell 0.3
Mud/sand/gravel 0.3
Mud/sand 0.7
Rippled sand 6.0
Mud 0.2
Sand/gravel 0.3
Unrippled sand 0.4
Gravel 3.0
Table 2. Seabed description and roughness for various seabed conditions[30]
Figure 13 and Figure 14 show a comparison of
theoretical peak spring-tide and neap-tide speed
profiles with measured data for a site in the Bulls
Mouth respectively. The measured tidal-current
speeds do not follow any theoretical speed profile
and varies significantly through the water column.
It can also be seen from both graphs that the 1/10th
power law fits closely to the log law using a seabed
roughness of mm based on a seabed
description of mud/sand/gravel. The importance of
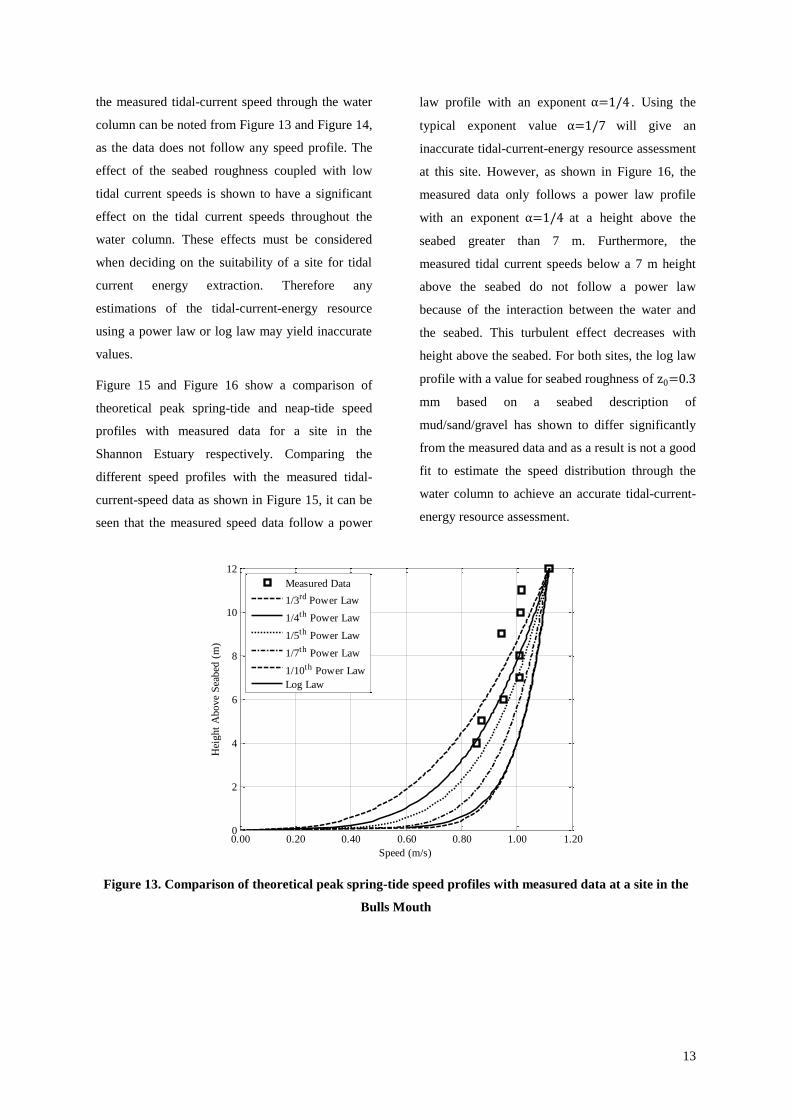
13
the measured tidal-current speed through the water
column can be noted from Figure 13 and Figure 14,
as the data does not follow any speed profile. The
effect of the seabed roughness coupled with low
tidal current speeds is shown to have a significant
effect on the tidal current speeds throughout the
water column. These effects must be considered
when deciding on the suitability of a site for tidal
current energy extraction. Therefore any
estimations of the tidal-current-energy resource
using a power law or log law may yield inaccurate
values.
Figure 15 and Figure 16 show a comparison of
theoretical peak spring-tide and neap-tide speed
profiles with measured data for a site in the
Shannon Estuary respectively. Comparing the
different speed profiles with the measured tidal-
current-speed data as shown in Figure 15, it can be
seen that the measured speed data follow a power
law profile with an exponent . Using the
typical exponent value will give an
inaccurate tidal-current-energy resource assessment
at this site. However, as shown in Figure 16, the
measured data only follows a power law profile
with an exponent at a height above the
seabed greater than 7 m. Furthermore, the
measured tidal current speeds below a 7 m height
above the seabed do not follow a power law
because of the interaction between the water and
the seabed. This turbulent effect decreases with
height above the seabed. For both sites, the log law
profile with a value for seabed roughness of
mm based on a seabed description of
mud/sand/gravel has shown to differ significantly
from the measured data and as a result is not a good
fit to estimate the speed distribution through the
water column to achieve an accurate tidal-current-
energy resource assessment.
Figure 13. Comparison of theoretical peak spring-tide speed profiles with measured data at a site in the
Bulls Mouth
0.00 0.20 0.40 0.60 0.80 1.00 1.200
2
4
6
8
10
12
Speed (m/s)
Hei
gh
t A
bo
ve
Sea
bed
(m
)
Measured Data
1/3rd Power Law
1/4th Power Law
1/5th Power Law
1/7th Power Law
1/10th Power Law
Log Law

14
Figure 14. Comparison of theoretical neap-tide speed profiles with measured data at a site in the Bulls
Mouth
Figure 15. Comparison of theoretical peak spring-tide speed profiles with measured data at a site in the
Shannon Estuary
0.00 0.05 0.10 0.15 0.20 0.250
2
4
6
8
10
12
Speed (m/s)
Hei
ght
Above
Sea
bed
(m
)
Measured Data
1/3rd Power Law
1/4th Power Law
1/5th Power Law
1/7th Power Law
1/10th Power Law
Log Law
0.00 0.50 1.00 1.50 2.00 2.500
2
4
6
8
10
12
Speed (m/s)
Hei
ght
Above
Sea
bed
(m
)
Measured Data
1/3rd Power Law
1/4th Power Law
1/5th Power Law
1/7th Power Law
1/10th Power Law
Log Law

15
Figure 16. Comparison of theoretical neap-tide speed profiles with measured data at a site in the Shannon
Estuary
3.5 Power density
Table 3 shows the mid-depth peak spring-tide
speed, the mid-depth mean speed and the power
density over a lunar month for both sites. The
instantaneous power density, , of a tidal current
flow is calculated using
(4)
where is the density of seawater and is the tidal
current speed. Power density is often used as an
indicator of tidal-current-energy hotspots[4]. The
power density for each site was calculated by
taking the mean of the distribution of instantaneous
power densities. It is clear from Table 3 that the
power density for the site in the Shannon Estuary is
significantly greater than the power density for the
site in the Bulls Mouth.
Site Mid-depth peak spring-
tide speed
Mid-depth mean
speed
Power density
(m/s) (m/s) (Wm-2
)
Bulls Mouth 1.01 0.2 10
Shannon Estuary 2.02 0.83 521
Table 3. Mid-depth peak spring-tide speed, mid-depth mean speed and power density over a lunar month
for a site in the Bulls Mouth and in the Shannon Estuary
3.6 Tidal energy output comparison for the
two sites
As described above, speed and direction
measurements recorded at the Bulls Mouth and the
Shannon Estuary were used to determine the annual
energy output of a tidal current turbine operating at
each site. Table 4 illustrates the technical and
operating data for the SERG tidal current turbine
0.00 0.20 0.40 0.60 0.80 1.00 1.20 1.400
2
4
6
8
10
12
Speed (m/s)
Hei
gh
t A
bo
ve
Sea
bed
(m
)
Measured Data
1/3rd Power Law
1/4th Power Law
1/5th Power Law
1/7th Power Law
1/10th Power Law
Log Law

16
and the two sites. This analysis assumed that the
tidal current turbine at each site had a fixed pitch
and variable yaw design arrangement. Also, the
rated speed and rated power of the tidal current
turbine was varied to obtain the maximum annual
energy output for each site[31, 32]. The analysis
showed that, using the measured data and the
SERG tidal current turbine technical specification,
the annual energy output calculated from the site in
the Shannon Estuary and the Bulls Mouth was
137.39 MWh and 2.16 MWh respectively. In order
to gain a better understanding of the performance
of a tidal current turbine operating at each site, the
capacity factor for each site was calculated. The
capacity factor is an excellent way to evaluate the
energy performance of a tidal current turbine at a
site. The capacity factor, CF, is the ratio of the
actual energy outputted by a tidal current turbine
over a given period of time, typically one year, and
the energy outputted by the tidal current turbine if
it was to operate at its rated capacity for the same
duration of time. The capacity factor is calculated
using:
(5)
where E is the energy outputted by the turbine over
a given period of time, T, and Pr is the rated power
of the turbine[33, 34]. The values of annual energy
output yielded a capacity factor of 0.12 and 0.19
for the site in the Bulls Mouth and Shannon
Estuary respectively. These values indicate that the
tidal current turbine captures less than 20% of the
maximum available energy, based on the installed
capacity, at both sites. However, varying the rated
power of the tidal current turbine, while keeping
the rotor diameter constant, will have an effect the
capacity factor.
Site Bulls Mouth Shannon Estuary
Rated Speed (m/s) 0.5 1.75
Rated Power (kW) 2 83
Hub Height (m) 7 7
Rotor Diameter (m) 10 10
Power Coefficient 0.39 0.39
Power-Law Profile 1/4 1/4
Table 4. Technical data for the SERG tidal current turbine with fixed pitch and variable yaw [15, 35].
4 Conclusions
ADCPs were installed at two potential tidal-energy
sites along Ireland's west coast and measured tidal
current speed and direction at 30 minute intervals
over a 30 day period. The site in the Shannon
Estuary has the greater tidal energy potential with
maximum mid-depth speeds in excess of 2 m/s.
The site in the Bulls Mouth experiences maximum
speeds of approximately 1 m/s. A histogram
displaying the normalised frequency of speed

17
occurrence for both sites was presented. The two
sites differ greatly when comparing the frequency
of occurrence of speeds considered suitable for
energy extraction. Tidal roses were produced at
several depths of the water column for both sites,
illustrating the frequency of occurrence of speeds
and the direction in which they occur. The
directions of the tidal currents in the Bulls Mouth
stay relatively constant from the north and vary
from the dominant south direction to a south-south-
east direction with an increase in depth. The
directions of the tidal currents in the Shannon
Estuary stay relatively constant throughout the
depth of the water column.
A comparison of theoretical tidal-current-speed
profiles with measured data was conducted for both
sites. To-date most tidal-current-energy
assessments assume a 1/7th
power law to calculate
the speed variation with depth. This methodology
has been adopted from the wind industry. However,
importantly, from the comparison conducted a 1/4th
power law is shown to provide a better fit to the
measured data.
The mean power density was calculated for both
sites. The results show a significant difference with
the site in the Shannon Estuary having a power
density significantly greater than the site in the
Bulls Mouth with values of 521 Wm-2
and 10 W/m-
2 respectively. Also an energetic performance
comparison for a tidal current turbine operating at
both sites was conducted showing significant
difference. The annual energy output for the
Shannon Estuary and the Bulls Mouth was 137.39
MWh and 2.16 MWh respectively. This
corresponded to a capacity factor of 0.19 and 0.12
for the Shannon Estuary and the Bulls Mouth
respectively.
Due to the deficiency of measured tidal-current
data in the literature, the data presented in this
paper is invaluable for the further development of
tidal-current-energy technology. In particular, the
data can be used in the numerical modelling of tidal
current turbines. Furthermore, calculating the
energy yields, capacity factors, forces and moments
using the measured data will give the technology
developer a better understanding of the materials
and control strategy needed to maximise
performance.
To further increase the depth of understanding of
tidal current characteristics at a site such as
turbulence, wave induced speeds, etc, higher
frequency data recording is required. Recording
speed and direction on a second basis rather than
minute basis would yield the transient behaviour of
the tidal current speed and direction. Important
numerical-model inputs such as turbulence
intensity could be calculated using real-life data
and ultimately increase the accuracy of numerical
predictions.
Acknowledgments
The authors greatly acknowledge AquaFact
International Services Ltd, RPS Group Ltd and
SEAI for their support and the use of collected
data. The authors would also like to thank Mark
Costelloe of AquaFact International Services Ltd
for his help and useful discussions on the data.
References
1. O'Rourke, F., Boyle, F., Reynolds, A.,
Renewable energy resources and
technologies applicable to Ireland.
Renewable and Sustainable Energy
Reviews, 2009. 13(8): p. 1975-1984.
2. Elliott, D., Renewable energy policy in the
UK: Problems and opportunities.
Renewable Energy. 9(1-4): p. 1308-1311.
3. Bryden, I.G., and Couch, S.J., ME1--
Marine Energy Extraction: Tidal
Resource Analysis. Renewable Energy,
2006. 31(2): p. 133-139.
4. Grabbe, M., Lalander, E., Lundin, S. and
Leijon, M., A review of the tidal current

18
energy resource in Norway. Renewable
and Sustainable Energy Reviews, 2009.
13(8): p. 1898-1909.
5. Barbarelli, S., Amelio, M., Castiglione, T.,
Florio, G., Scornaienchi, N. M., Cutrupi,
A., Lo Zupone, G., Analysis of the
equilibrium conditions of a double rotor
turbine prototype designed for the
exploitation of the tidal currents. Energy
Conversion and Management, 2014(0).
6. Ramos, V., Carballo, R., Sanchez, M.,
Veigas, M., Iglesias, G., Tidal stream
energy impacts on estuarine circulation.
Energy Conversion and Management,
2014. 80(0): p. 137-149.
7. Sarma, N.K., Biswas, A., Misra, R. D.,
Experimental and computational
evaluation of Savonius hydrokinetic
turbine for low velocity condition with
comparison to Savonius wind turbine at
the same input power. Energy Conversion
and Management, 2014. 83(0): p. 88-98.
8. Li, Y., Lence, B.J. and Calisal, S.M., An
integrated model for estimating energy
cost of a tidal current turbine farm.
Energy Conversion and Management,
2011. 52(3): p. 1677-1687.
9. O Rourke, F., F. Boyle, and A. Reynolds,
Tidal energy update 2009. Applied
Energy. 87(2): p. 398-409.
10. O'Rourke, F., Boyle, F., and Reynolds, A.,
Tidal current energy resource assessment
in Ireland: Current status and future
update. Renewable and Sustainable
Energy Reviews, 2010. 14(9): p. 3206-
3212.
11. Nairn, R., Ireland's Coastline: Exploring
its Nature and Heritage. 2005: Collins
Press. 220.
12. Neilson, B., and Costello, M.J., The
Relative Lengths of Seashore Substrata
Around the Coastline of Ireland as
Determined by Digital Methods in a
Geographical Information System.
Estuarine, Coastal and Shelf Science,
1999. 49(4): p. 501-508.
13. Boyle, G., Renewable Energy Power for a
Sustainable Future. Second Edition ed.
2004: Oxford University Press.
14. Charlier, R.H., A "Sleeper" Awakes: Tidal
Current Power. Renewable and
Sustainable Energy Reviews, 2003. 7(6):
p. 515-529.
15. Bahaj, A.S., Molland, A.F., Chaplin, J.R.,
and Batten, W.M.J., Power and Thrust
Measurements of Marine Current
Turbines under various Hydrodynamic
Flow Conditions in a Cavitation Tunnel
and a Towing Tank. Renewable Energy,
2007. 32(3): p. 407-426.
16. Adcock, T.A.A. The available power
obtainable from tidal stream turbines from
a flow around an idealised headland. in
3rd International Association for Hydro-
Environment Engineering and Research
Europe Congress. 2013. Porto.
17. Garrett, C., and Cummins, P., The power
potential of tidal currents in channels.
Proceedings of the Royal Society a -
Mathematical Physical and Engineering
Sciences, 2005.
18. Garrett, C.a.C., P., The efficiency of a
turbine in a tidal channel. Journal of Fluid
Mechanics, 2007.
19. Houlsby, G.T., Draper, S., Oldfield, M.,
Application of linear momentum actuator
disc theory to open channel flow 2008,
Technical Report 2296-08 University of
Oxford.
20. Palmer, J., The Tide is Turning. The New
Scientist, 2008. 200(2677): p. 35-36.
21. Lemonis, G., and Cutler, J.C., Wave and
Tidal Energy Conversion, in Encyclopedia
of Energy. 2004, Elsevier: New York. p.
385-396.
22. Li, D., Wang, S., and Yuan, P., An
overview of development of tidal current
in China: Energy resource, conversion
technology and opportunities. Renewable
and Sustainable Energy Reviews, 2010.
14(9): p. 2896-2905.
23. Liu, H.-w., Ma, S., Li, W., Gu, H.-g., Lin,
Y.-g., and Sun, X.-j., A review on the
development of tidal current energy in
China. Renewable and Sustainable Energy
Reviews, 2011. 15(2): p. 1141-1146.
24. Sustainable Energy Ireland, Tidal &
Current Energy Resources in Ireland.
2004.
25. P.L. Fraenkel, Power from marine
currents. Proceedings of the Institution of
Mechanical Engineers, Part A: Journal of
Power and Energy, 2002(216 (A1),): p.
pp. 1–14. .
26. O'Rourke, F., Boyle, F. and Reynolds, A.,
Marine current energy devices: Current
status and possible future applications in
Ireland. Renewable and Sustainable
Energy Reviews, 2010. 14(3): p. 1026-
1036.
27. WorkHorse Monitor ADCP User's Guide,
RD Instruments. 2001.
28. Adcock, T.A.A., Draper, S.,, Power
extraction from tidal channels - Multiple

19
tidal constituents, compound tides and
overtides. Renewable Energy, 2014. 63(0):
p. 797-806.
29. Soulsby, R., Dynamics of Marine Sands: A
Manual for Practical Applications. 1997:
Thomas Telford.
30. Hardisty, J., The Analysis of Tidal Stream
Power. 2009: John Wiley and Sons.
31. Myers, L., Bahaj, A. S., Simulated
electrical power potential harnessed by
marine current turbine arrays in the
Alderney Race. Renewable Energy, 2005.
30(11): p. 1713-1731.
32. Bahaj, A.S., Myers, L. E., Fundamentals
Applicable to the Utilisation of Marine
Current Turbines for Energy Production.
Renewable Energy, 2003. 28(14): p. 2205-
2211.
33. Ramos, V., and Iglesias, G., Performance
assessment of Tidal Stream Turbines: A
parametric approach. Energy Conversion
and Management, 2013. 69(0): p. 49-57.
34. Carballo, R., Iglesias, G., A methodology
to determine the power performance of
wave energy converters at a particular
coastal location. Energy Conversion and
Management, 2012. 61(0): p. 8-18.
35. Batten, W.M.J., Bahaj, A.S., Molland,
A.F., and Chaplin, J.R., The Prediction of
the Hydrodynamic Performance of Marine
Current Turbines. Renewable Energy,
2008. 33(5): p. 1085-1096.