iso 2016-2017 transmission planning process … · iso 2016-2017 transmission planning process...
TRANSCRIPT
ISO 2016-2017 Transmission Planning Process
Supplemental Sensitivity Analysis:
Benefits Analysis of Large Energy Storage
January 4, 2018
Contents 1. Introduction ..................................................................................................................... 1
2. Background ...................................................................................................................... 1
3. Objectives of Further Study in 2017 ................................................................................ 5
4. Summary of Results ......................................................................................................... 6

California ISO/MID 1
1. Introduction
This report summarizes the informational studies conducted by the ISO to assess the benefits large scale
energy storage projects may provide to ratepayers in the ISO footprint as the state moves towards
higher renewable generation levels and provides the results of the most recent sensitivity results that
were conducted in 2017 as an extension of the 2016-2017 planning cycle studies.
As discussed in more detail below, the 2016-2017 Base Case assumptions generally leaned to
underestimate the value the large scale storage is reasonably able to provide, leading to the additional
sensitivity analysis performed in 2017.
Given the evolution of the analysis over several years, it is necessary to review the background of the
past efforts, to put into context the latest results and the observations drawn from those results.
It must also be noted that the planning assumptions included in the additional sensitivity analysis were
finalized in early 2017. This analysis does not reflect ongoing evolution of the CPUC’s Integrated
Resource Planning proceeding, or changes in planning assumptions being made through that process.
2. Background
During the 2016-2017 planning cycle, the ISO undertook further study of the benefits large scale energy
storage projects may provide to ratepayers in the ISO footprint as the state moves from the 33 percent
RPS to a 50 percent RPS. This analysis began in the 2015-2016 transmission planning cycle with a 40
percent RPS-based analysis that was later updated to a 50 percent RPS-based analysis.1 The 2016-2017
study used the same methodology as the previous ones and provided a further update using the latest
assumptions and load forecasts, and assessed the benefits in reduction of renewable generation
curtailment, CO2 emission and production cost as well as the financial costs to achieve the benefits. The
ISO also expanded the study scope to consider potential locational benefits.
The study and results were documented in Section 6.5 of the 2016-2017 Transmission Plan.
The study was provided on an information-only basis and the results are dependent on the assumptions
made in the study. The methodology, assumptions, and results of the study are set out in this section.
Initial Base Case in 2016-2017 Analysis
The 2016-2017 special study was conducted based on the 50 percent RPS “in-state portfolio with full
capacity deliverability” portfolio the CPUC provided for the ISO 2016-2017 50 percent RPS special
studies. The 50 percent RPS Base Case was developed based on the Default Scenario of the CPUC 2016
1 See http://www.caiso.com/Documents/Board-Approved2015-2016TransmissionPlan.pdf and
http://www.caiso.com/Documents/BulkEnergyStorageResource-2015-2016SpecialStudyUpdatedfrom40to50Percent.pdf

California ISO/MID 2
LTPP/TPP Assumptions and Scenarios.2 The assumptions have some major changes compared to that of
the last 50 percent RPS based bulk energy storage study in the 2015-2016 transmission planning cycle.
The changes are mostly in the following areas:
The retirement of non-dispatchable generation resources;
Dispatchability of CHP resources;
Energy forecast and Additional Achievable Energy Efficiency (AAEE);
Renewable energy needed to achieve the 50 percent RPS target (not curtailment included); and
The prices for renewable curtailment.
Table 1 below has the comparison of these changes.
Table 1: Comparison of Assumptions with Major Changes
Assumption 2016-2017 TPP 50% RPS Study 2015-2016 TPP 50% RPS Study
Changes in
non-dispatchable
generation resources
Diablo Canyon nuclear plant (2,300
MW) is retired
2,786 MW CHP in operation
Diablo Canyon in operation
4,684 MW CHP in operation
Dispatchability of CHP
resources
50% of the 2,786 MW CHP is
dispatchable
All 4,684 MW CHP is non-dispatchable
California load forecast 64,009 MW 1-in-2 No AAEE
non-coincident peak load
301,480 GWh energy
70,763 MW 1-in-2 No AAEE
non-coincident peak load
322,218 GWh energy
California AAEE 9,418 MW non-coincident peak impact
39,779 GWh energy
CEC provided hourly profiles that
usually have higher values in the late
afternoon and early evening
5,713 MW non-coincident peak impact
24,535 GWh energy
No hourly profile, offsetting load
proportionally to the hourly load values
California RPS Portfolio 36,776 MW installed capacity
110,288 GWh energy
40,986 MW installed capacity
125,307 GWh energy
Price of renewable
generation curtailment
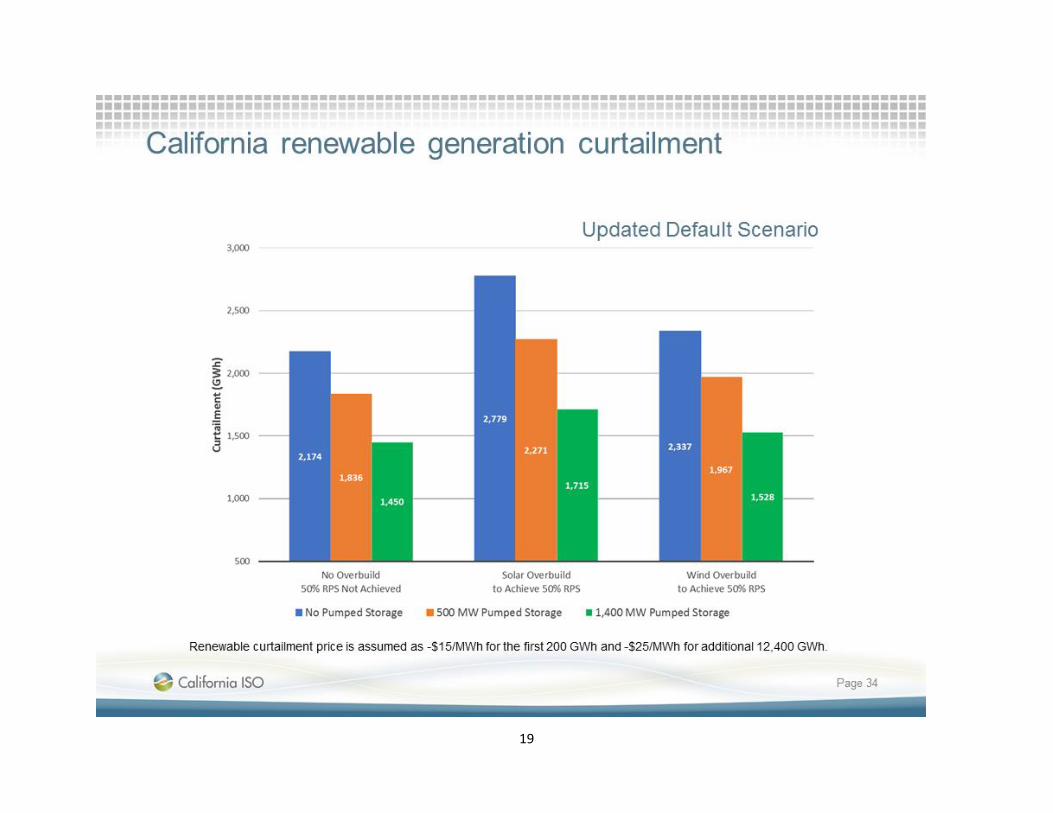
-$15/MWh for the first 200 GWh, -
$25/MWh for additional 12,400 GWh
and -$300/MWh thereafter
-$300/MWh for all curtailment
Hydro condition 2005 hydro generation 2005 hydro generation
ISO maximum net export
capability
2,000 MW 2,000 MW
2 See http://docs.cpuc.ca.gov/PublishedDocs/Efile/G000/M162/K005/162005377.PDF
California ISO/MID 3
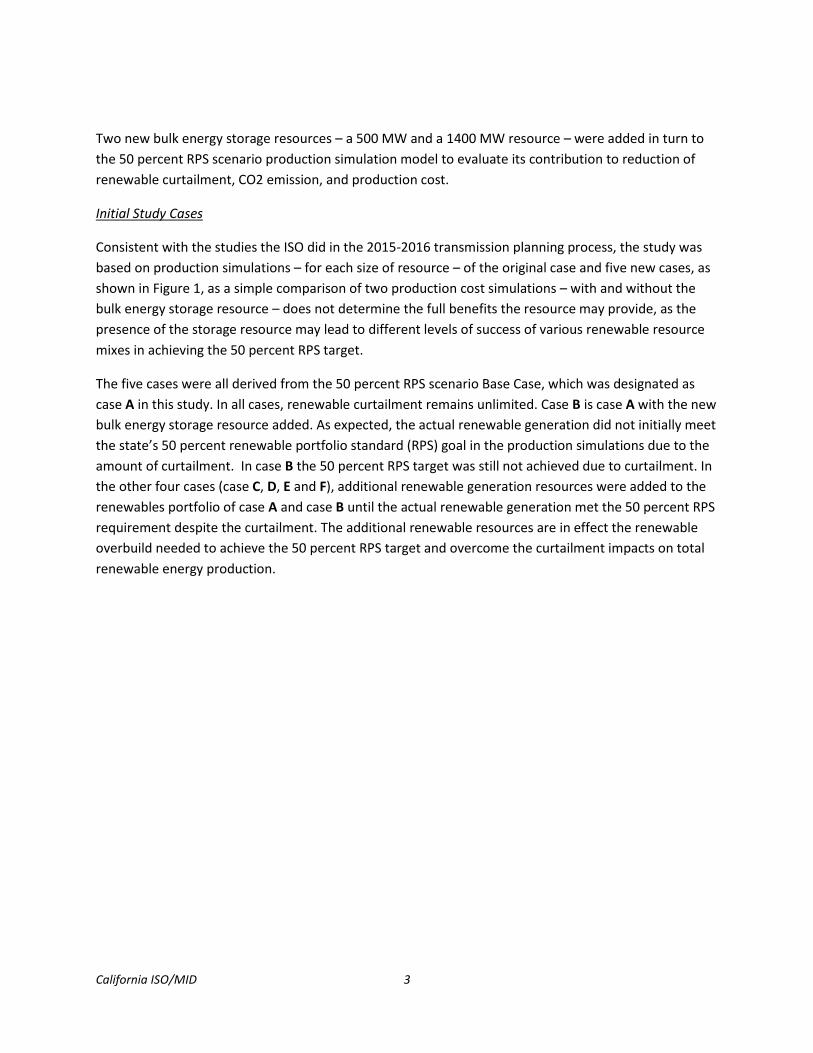
Two new bulk energy storage resources – a 500 MW and a 1400 MW resource – were added in turn to
the 50 percent RPS scenario production simulation model to evaluate its contribution to reduction of
renewable curtailment, CO2 emission, and production cost.
Initial Study Cases
Consistent with the studies the ISO did in the 2015-2016 transmission planning process, the study was
based on production simulations – for each size of resource – of the original case and five new cases, as
shown in Figure 1, as a simple comparison of two production cost simulations – with and without the
bulk energy storage resource – does not determine the full benefits the resource may provide, as the
presence of the storage resource may lead to different levels of success of various renewable resource
mixes in achieving the 50 percent RPS target.
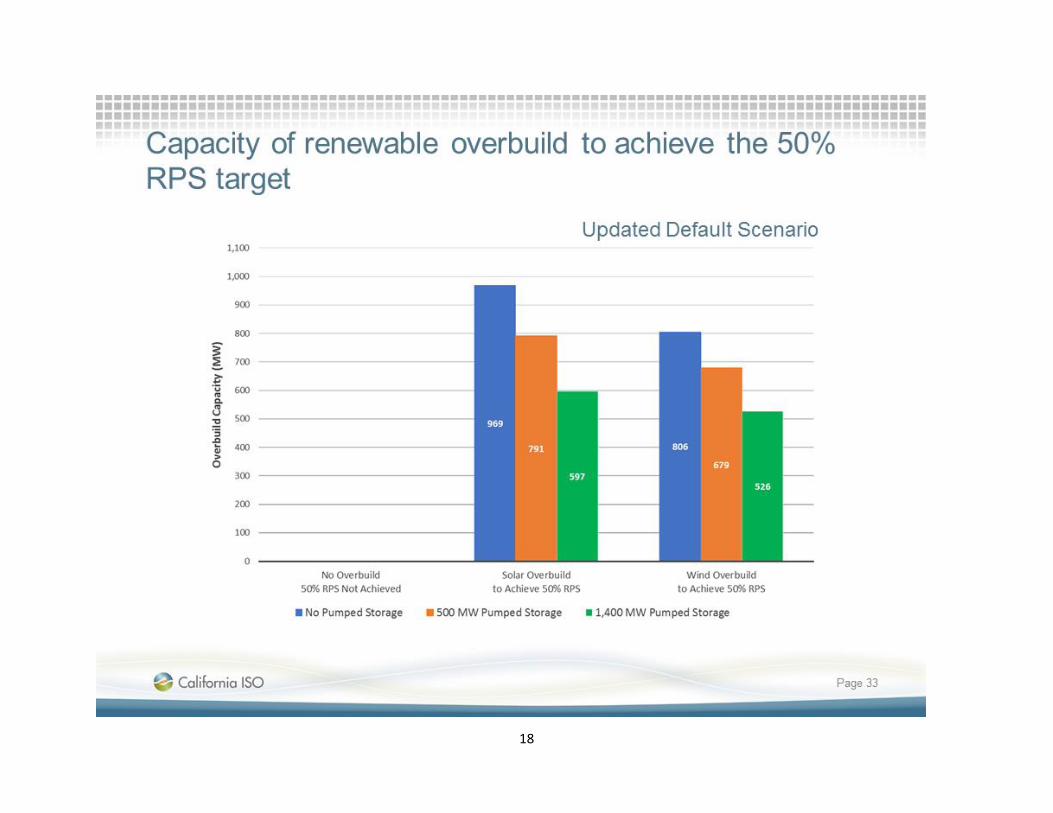
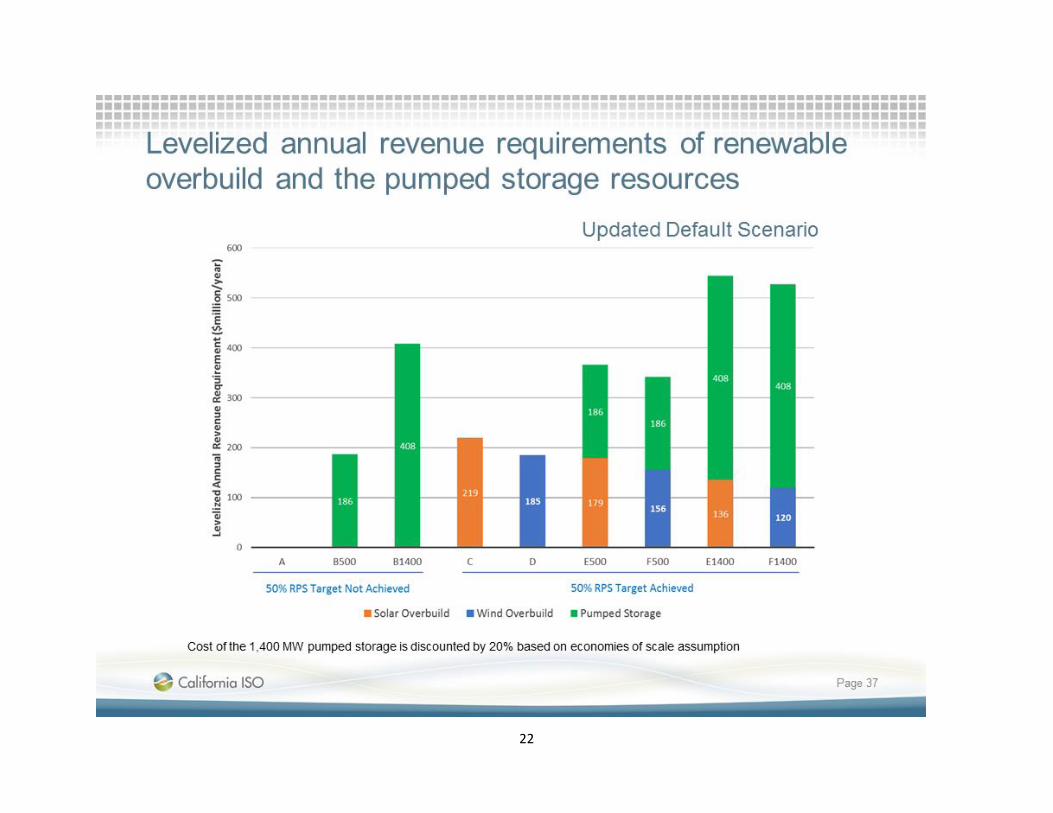
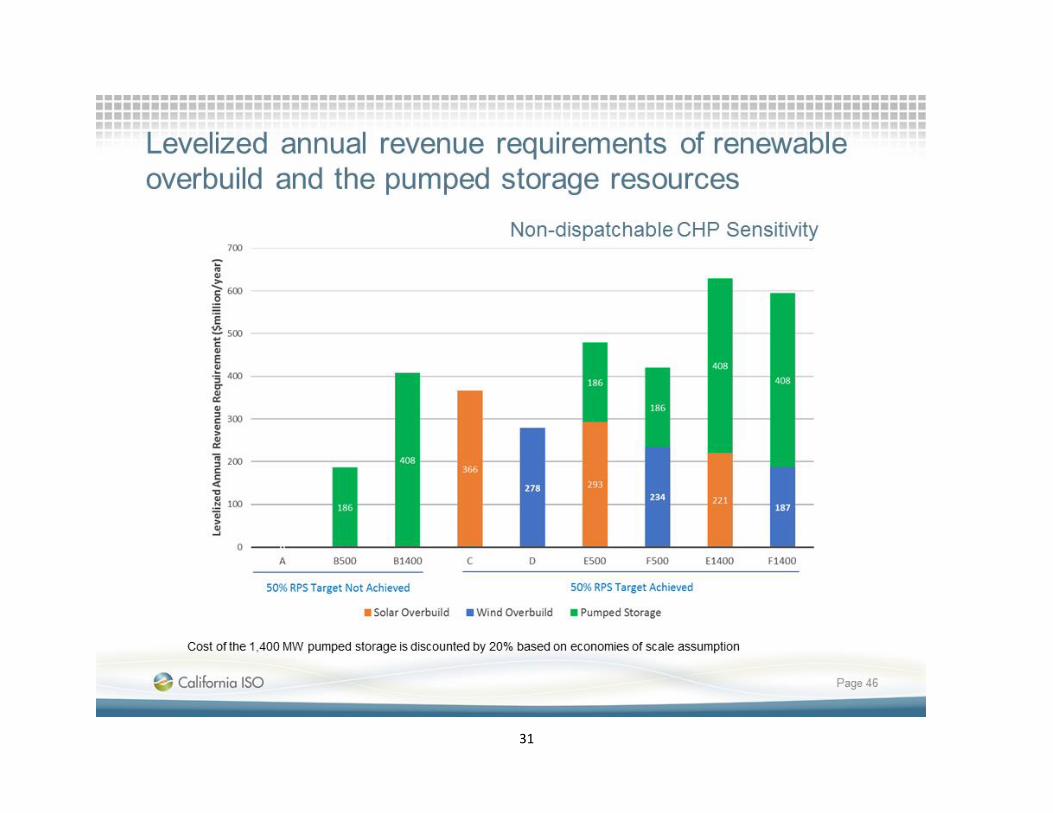
The five cases were all derived from the 50 percent RPS scenario Base Case, which was designated as
case A in this study. In all cases, renewable curtailment remains unlimited. Case B is case A with the new
bulk energy storage resource added. As expected, the actual renewable generation did not initially meet
the state’s 50 percent renewable portfolio standard (RPS) goal in the production simulations due to the
amount of curtailment. In case B the 50 percent RPS target was still not achieved due to curtailment. In
the other four cases (case C, D, E and F), additional renewable generation resources were added to the
renewables portfolio of case A and case B until the actual renewable generation met the 50 percent RPS
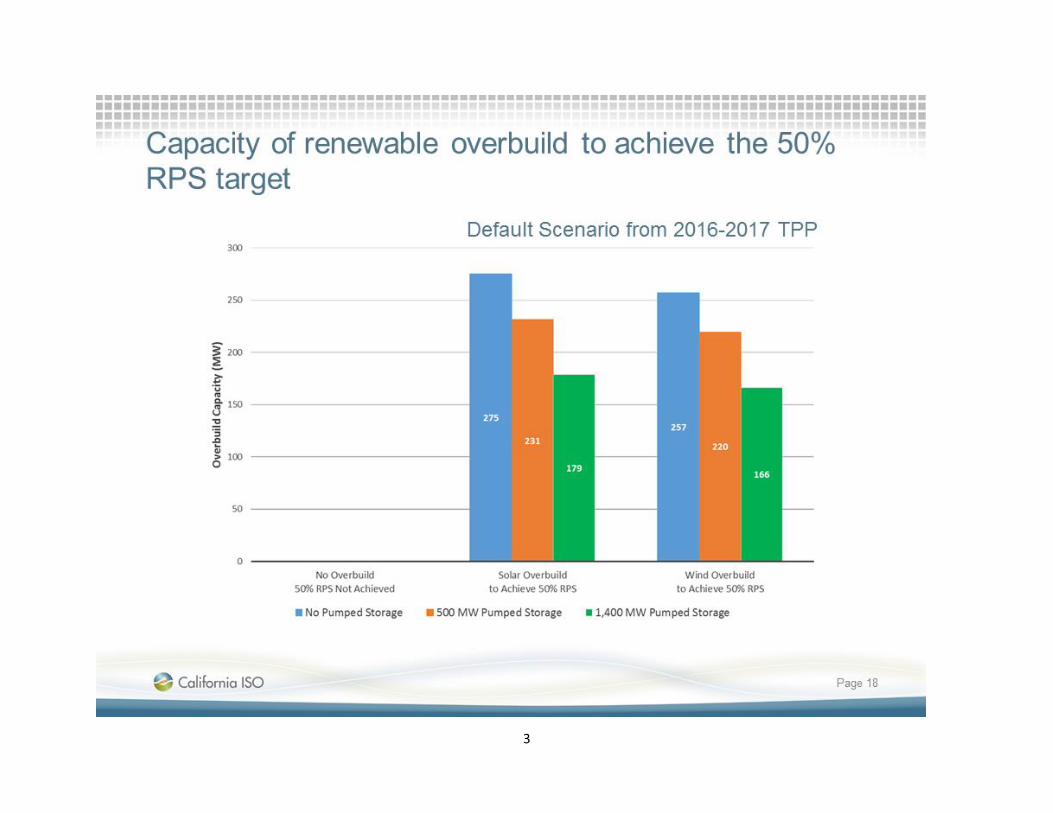
requirement despite the curtailment. The additional renewable resources are in effect the renewable
overbuild needed to achieve the 50 percent RPS target and overcome the curtailment impacts on total
renewable energy production.
California ISO/MID 4
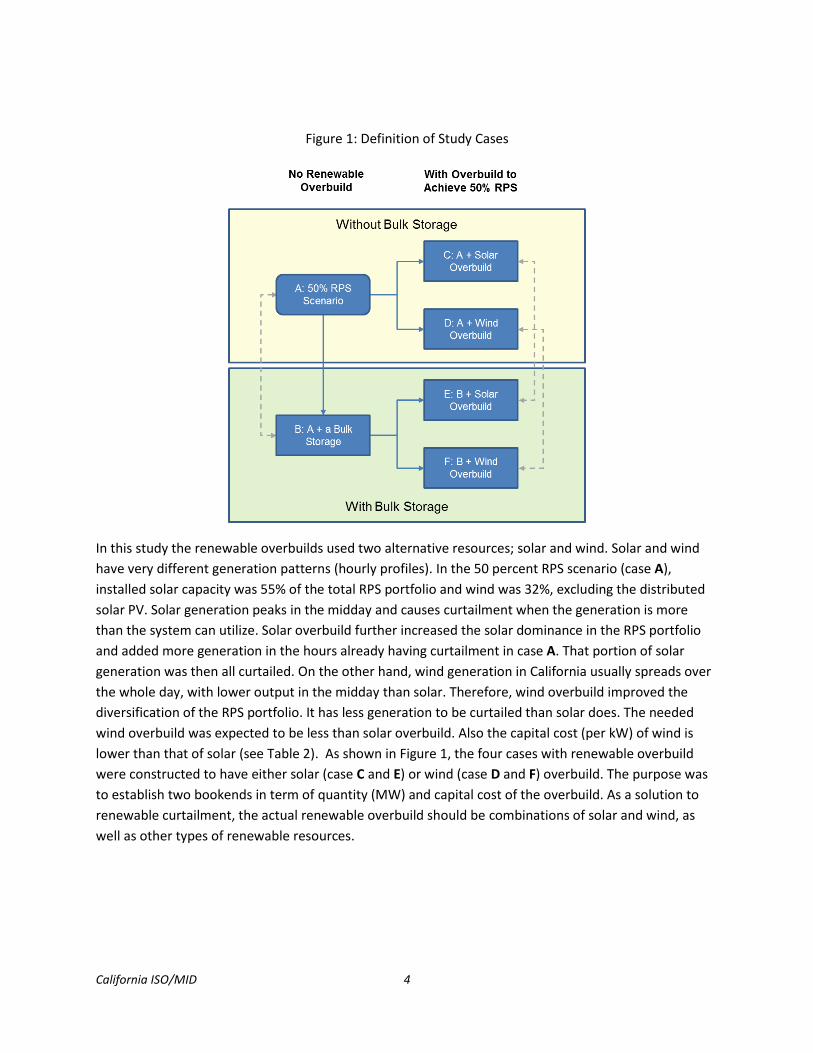
Figure 1: Definition of Study Cases
In this study the renewable overbuilds used two alternative resources; solar and wind. Solar and wind
have very different generation patterns (hourly profiles). In the 50 percent RPS scenario (case A),
installed solar capacity was 55% of the total RPS portfolio and wind was 32%, excluding the distributed
solar PV. Solar generation peaks in the midday and causes curtailment when the generation is more
than the system can utilize. Solar overbuild further increased the solar dominance in the RPS portfolio
and added more generation in the hours already having curtailment in case A. That portion of solar
generation was then all curtailed. On the other hand, wind generation in California usually spreads over
the whole day, with lower output in the midday than solar. Therefore, wind overbuild improved the
diversification of the RPS portfolio. It has less generation to be curtailed than solar does. The needed
wind overbuild was expected to be less than solar overbuild. Also the capital cost (per kW) of wind is
lower than that of solar (see Table 2). As shown in Figure 1, the four cases with renewable overbuild
were constructed to have either solar (case C and E) or wind (case D and F) overbuild. The purpose was
to establish two bookends in term of quantity (MW) and capital cost of the overbuild. As a solution to
renewable curtailment, the actual renewable overbuild should be combinations of solar and wind, as
well as other types of renewable resources.
California ISO/MID 5
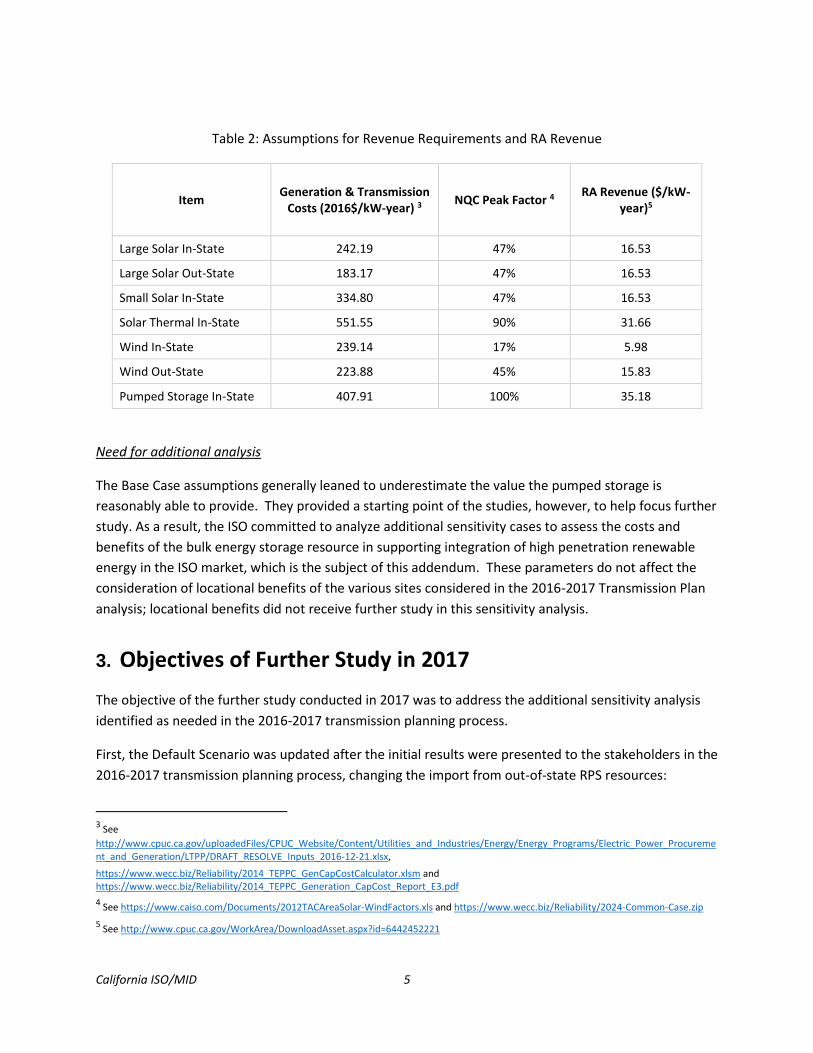
Table 2: Assumptions for Revenue Requirements and RA Revenue
Item Generation & Transmission
Costs (2016$/kW-year) 3 NQC Peak Factor 4
RA Revenue ($/kW-year)5
Large Solar In-State 242.19 47% 16.53
Large Solar Out-State 183.17 47% 16.53
Small Solar In-State 334.80 47% 16.53
Solar Thermal In-State 551.55 90% 31.66
Wind In-State 239.14 17% 5.98
Wind Out-State 223.88 45% 15.83
Pumped Storage In-State 407.91 100% 35.18
Need for additional analysis
The Base Case assumptions generally leaned to underestimate the value the pumped storage is
reasonably able to provide. They provided a starting point of the studies, however, to help focus further
study. As a result, the ISO committed to analyze additional sensitivity cases to assess the costs and
benefits of the bulk energy storage resource in supporting integration of high penetration renewable
energy in the ISO market, which is the subject of this addendum. These parameters do not affect the
consideration of locational benefits of the various sites considered in the 2016-2017 Transmission Plan
analysis; locational benefits did not receive further study in this sensitivity analysis.
3. Objectives of Further Study in 2017
The objective of the further study conducted in 2017 was to address the additional sensitivity analysis
identified as needed in the 2016-2017 transmission planning process.
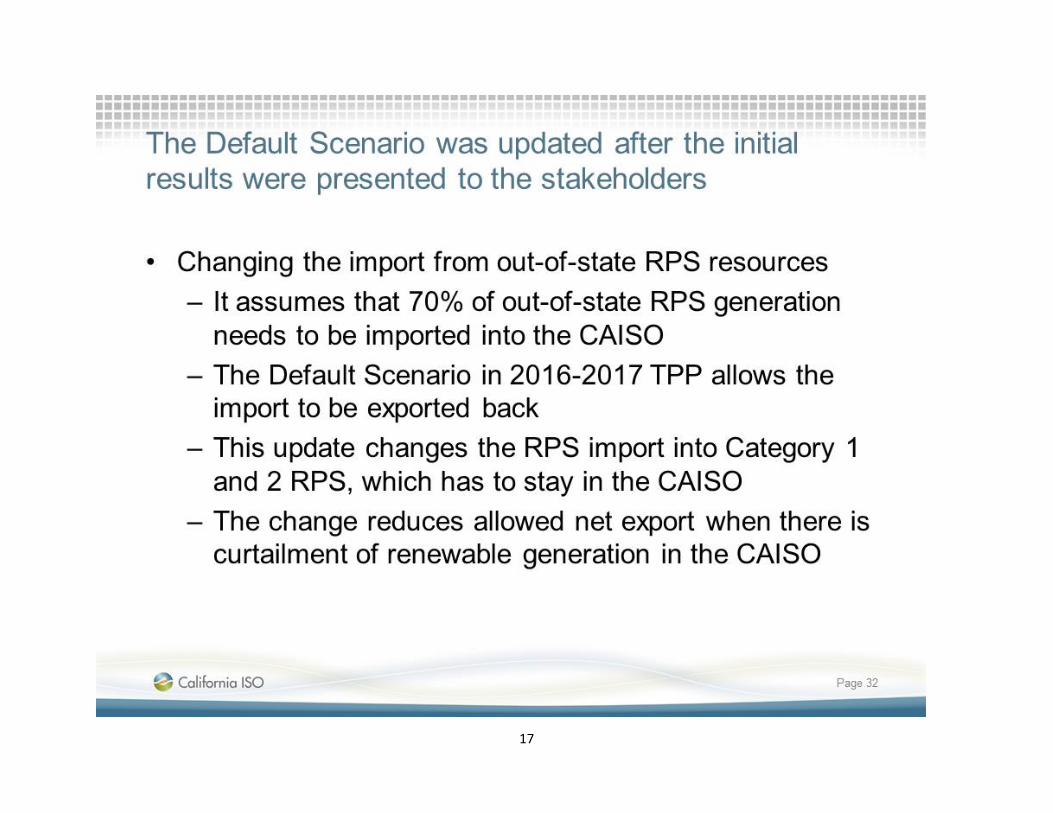
First, the Default Scenario was updated after the initial results were presented to the stakeholders in the
2016-2017 transmission planning process, changing the import from out-of-state RPS resources:
3 See
http://www.cpuc.ca.gov/uploadedFiles/CPUC_Website/Content/Utilities_and_Industries/Energy/Energy_Programs/Electric_Power_Procurement_and_Generation/LTPP/DRAFT_RESOLVE_Inputs_2016-12-21.xlsx,
https://www.wecc.biz/Reliability/2014_TEPPC_GenCapCostCalculator.xlsm and https://www.wecc.biz/Reliability/2014_TEPPC_Generation_CapCost_Report_E3.pdf
4 See https://www.caiso.com/Documents/2012TACAreaSolar-WindFactors.xls and https://www.wecc.biz/Reliability/2024-Common-Case.zip
5 See http://www.cpuc.ca.gov/WorkArea/DownloadAsset.aspx?id=6442452221
California ISO/MID 6
• The study assumes that 70% of out-of-state RPS generation needs to be imported into the CAISO
• The Default Scenario in 2016-2017 TPP allows the import to be exported back
• This update changes the RPS import into Category 1 and 2 RPS, which has to stay in the CAISO
• The change reduces allowed net export when there is curtailment of renewable generation in
the CAISO.
Those additional sensitivity analyses focused on the following assumptions:
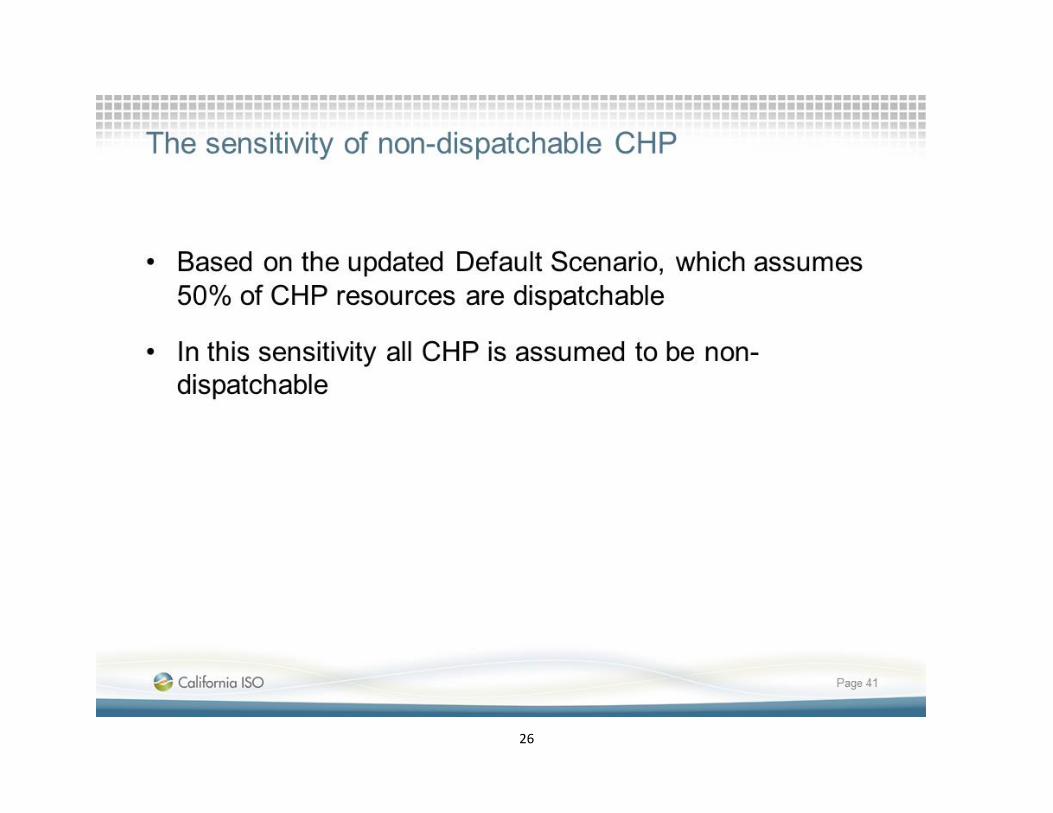
- Dispatchability of CHP resource (The updated Default Scenario assumed 50% of CHP resources
are dispatchable – this sensitivity assumes all CHP is non-dispatchable.)
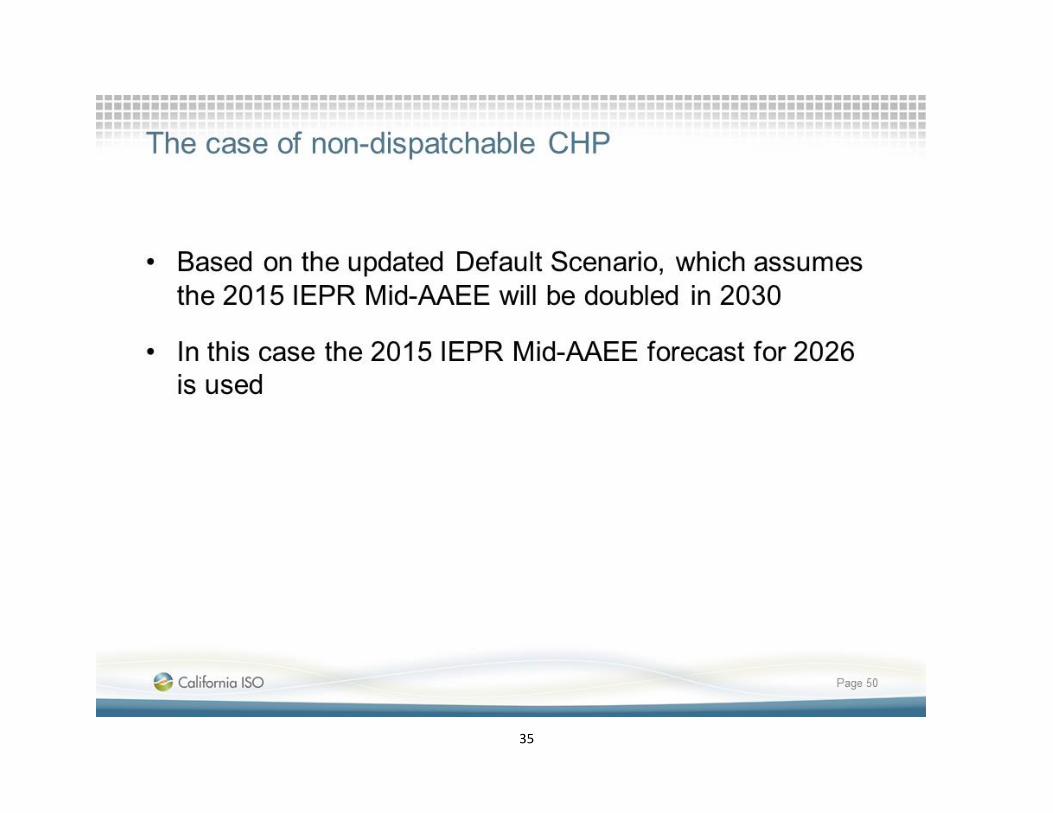
- Level of AAEE (The updated Default Scenario assumed the 2015 IEPR Mid-AAEE will be doubled
in 2030 – this sensitivity assumes the 2015 IEPR Mid-AAEE forecast for 2026)
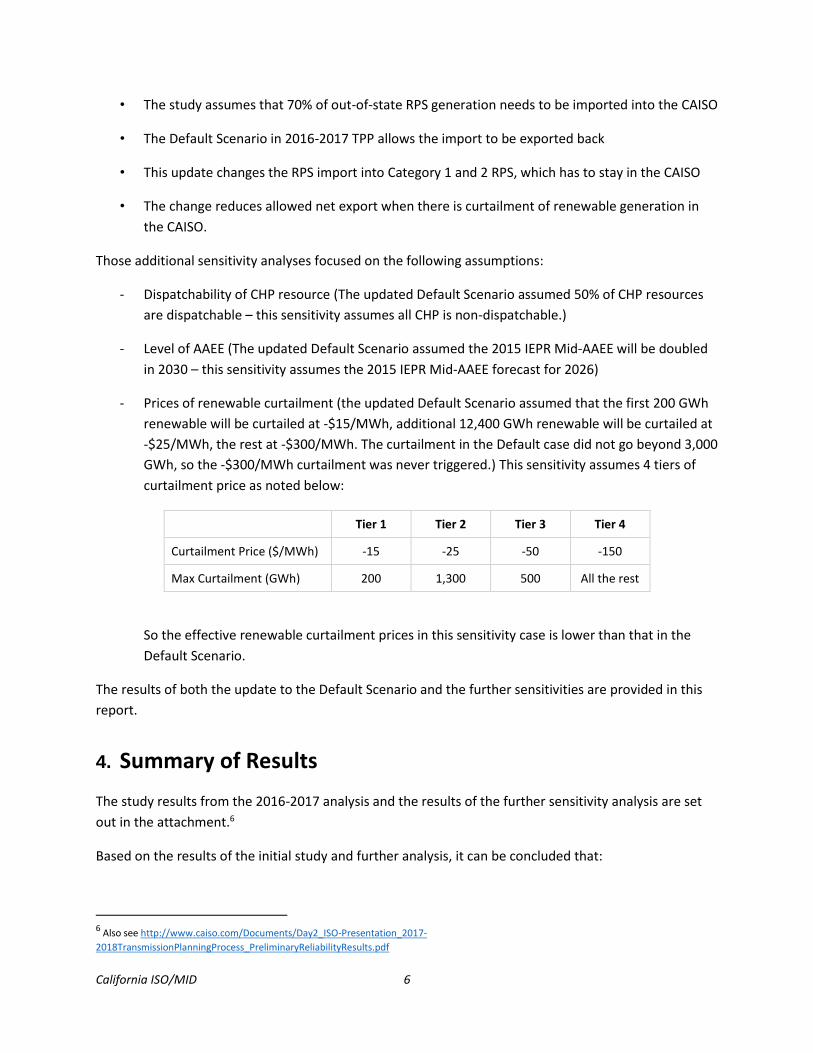
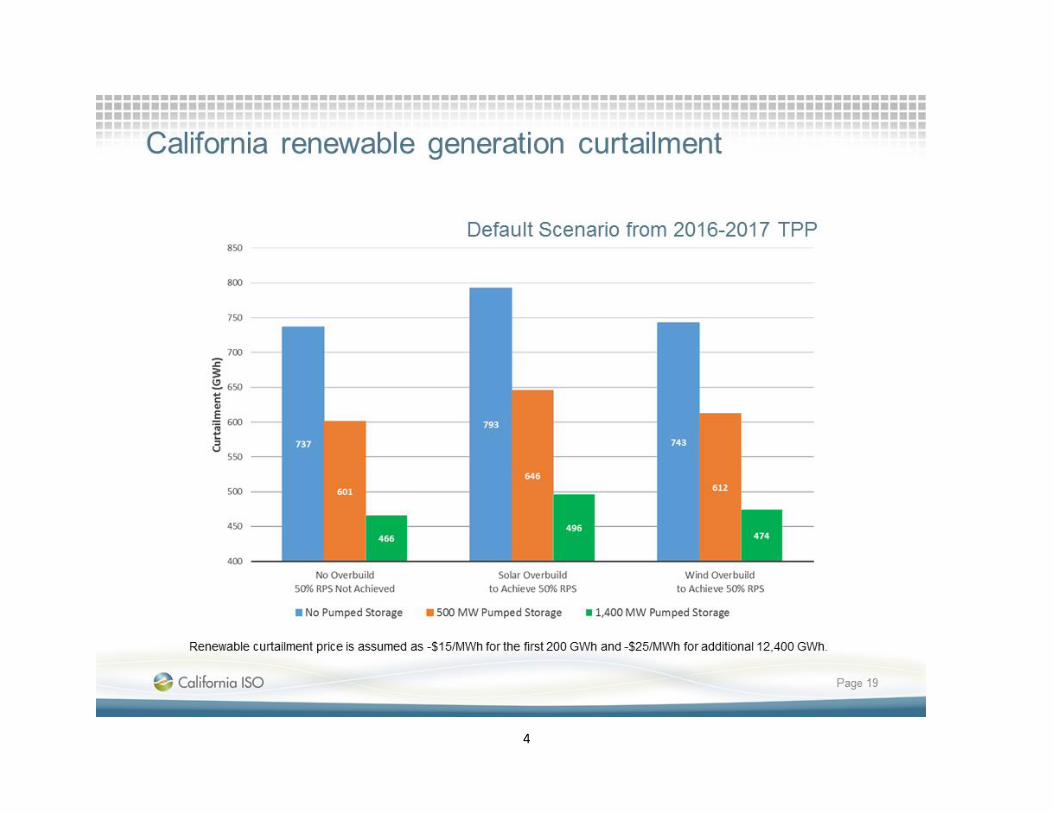
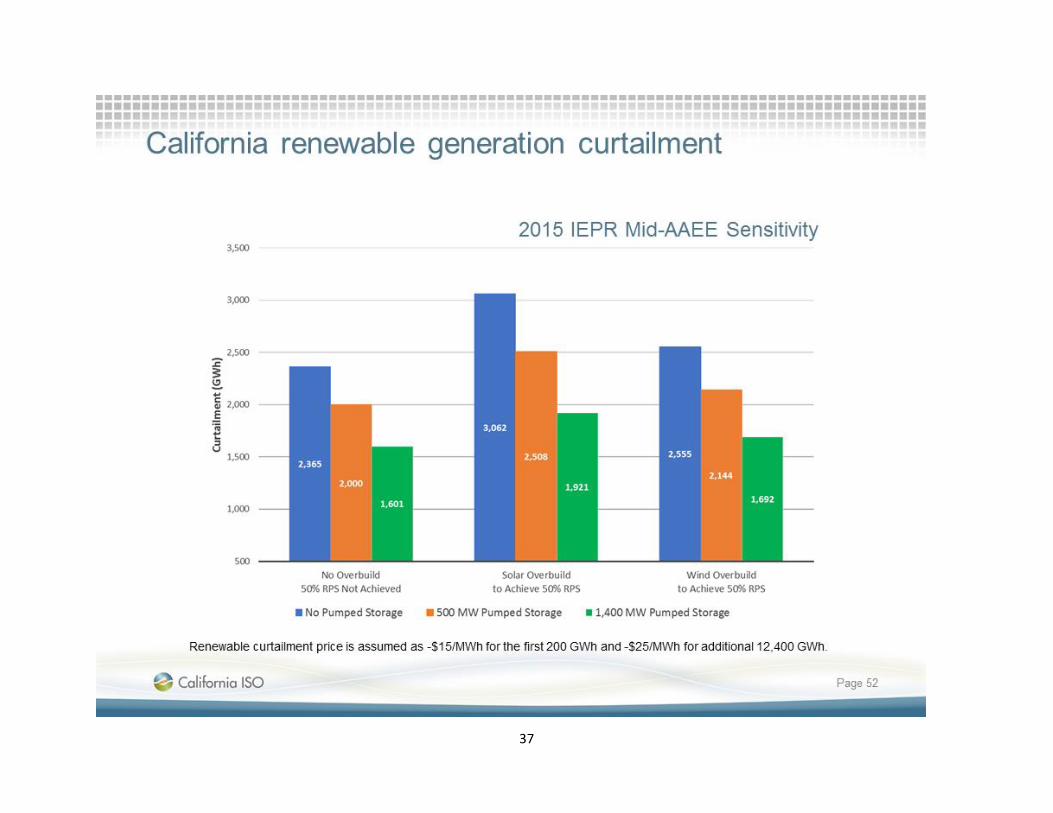
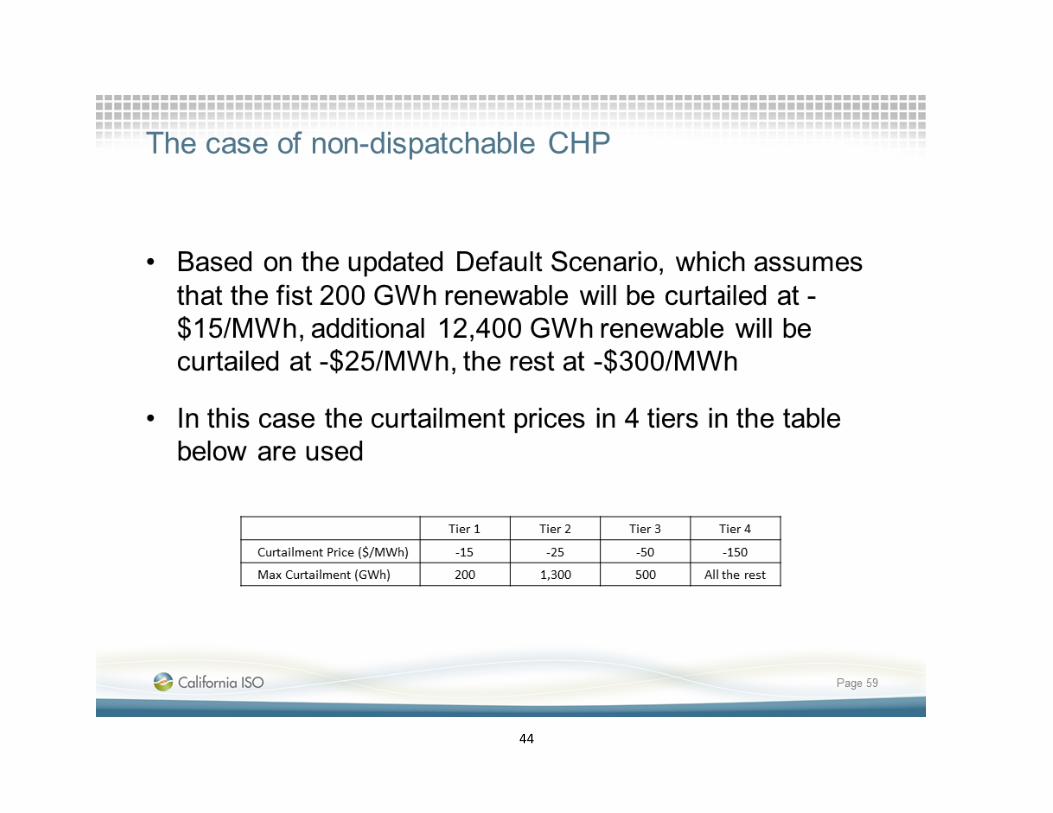
- Prices of renewable curtailment (the updated Default Scenario assumed that the first 200 GWh
renewable will be curtailed at -$15/MWh, additional 12,400 GWh renewable will be curtailed at
-$25/MWh, the rest at -$300/MWh. The curtailment in the Default case did not go beyond 3,000
GWh, so the -$300/MWh curtailment was never triggered.) This sensitivity assumes 4 tiers of
curtailment price as noted below:
Tier 1 Tier 2 Tier 3 Tier 4
Curtailment Price ($/MWh) -15 -25 -50 -150
Max Curtailment (GWh) 200 1,300 500 All the rest
So the effective renewable curtailment prices in this sensitivity case is lower than that in the
Default Scenario.
The results of both the update to the Default Scenario and the further sensitivities are provided in this
report.
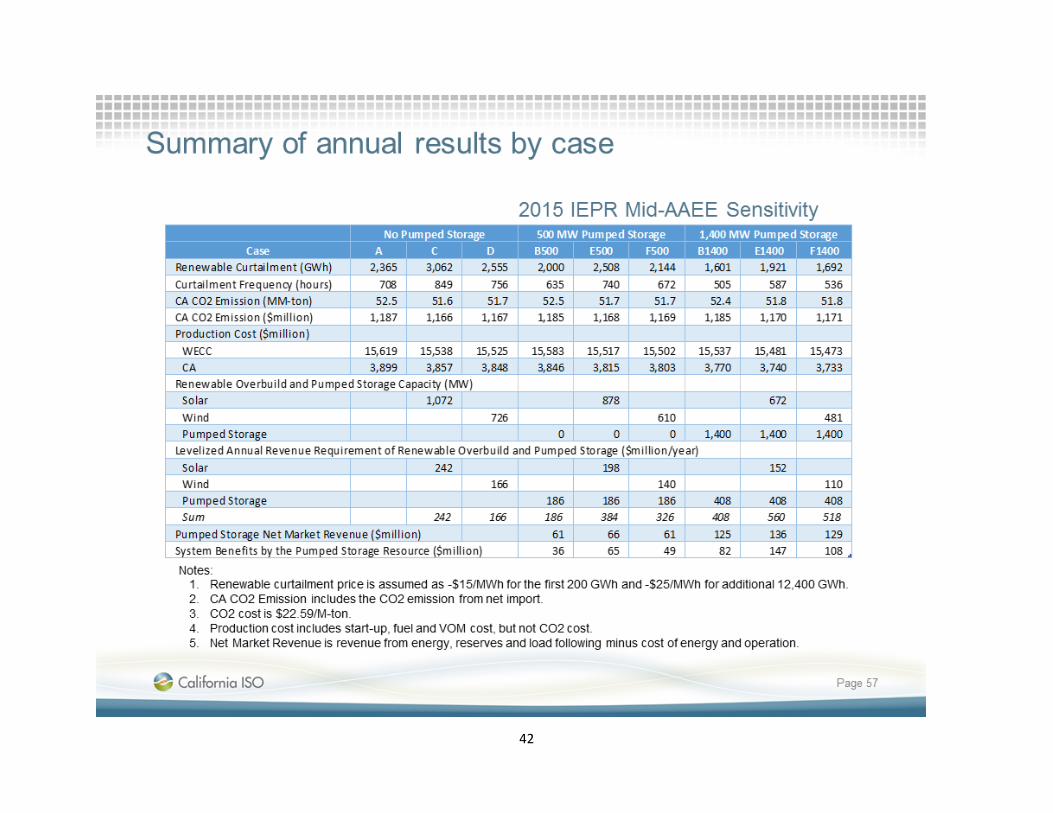
4. Summary of Results
The study results from the 2016-2017 analysis and the results of the further sensitivity analysis are set
out in the attachment.6
Based on the results of the initial study and further analysis, it can be concluded that:
6 Also see http://www.caiso.com/Documents/Day2_ISO-Presentation_2017-
2018TransmissionPlanningProcess_PreliminaryReliabilityResults.pdf
California ISO/MID 7
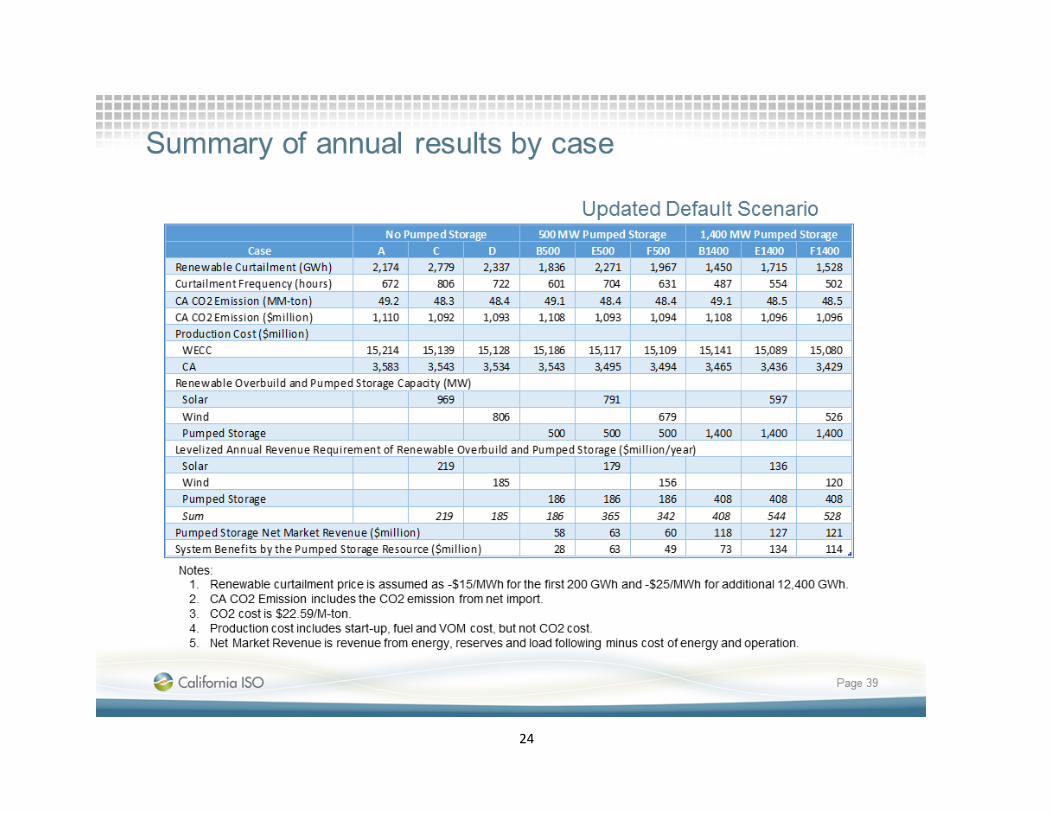
The new pumped storage resources brought significant benefits to the system, including
o reducing renewable curtailment and renewable overbuild needed to meet the 50% RPS target;
o making use of the recovered renewable energy from curtailment as well as low cost out-of-
state energy during hours without renewable curtailment;
o providing lower cost energy during the net peak hours in early evening and flexibility to
provide ancillary services and load-following and to help follow the load in the morning and
evening ramping processes; and,
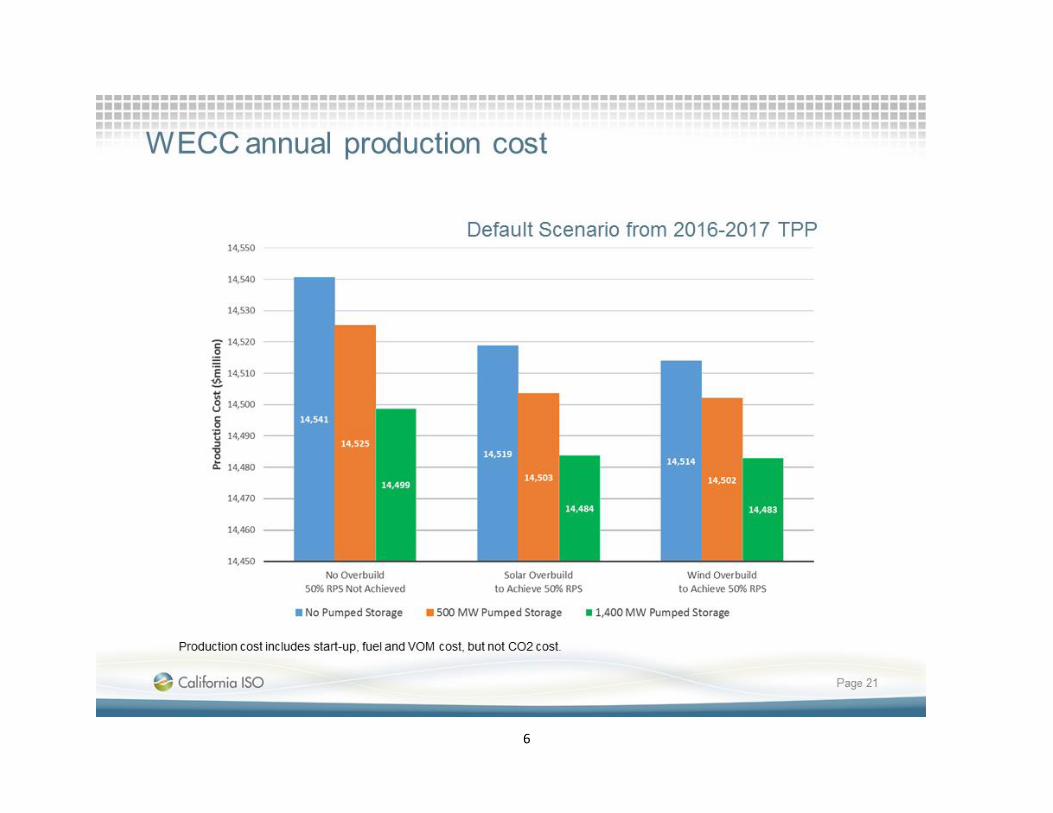
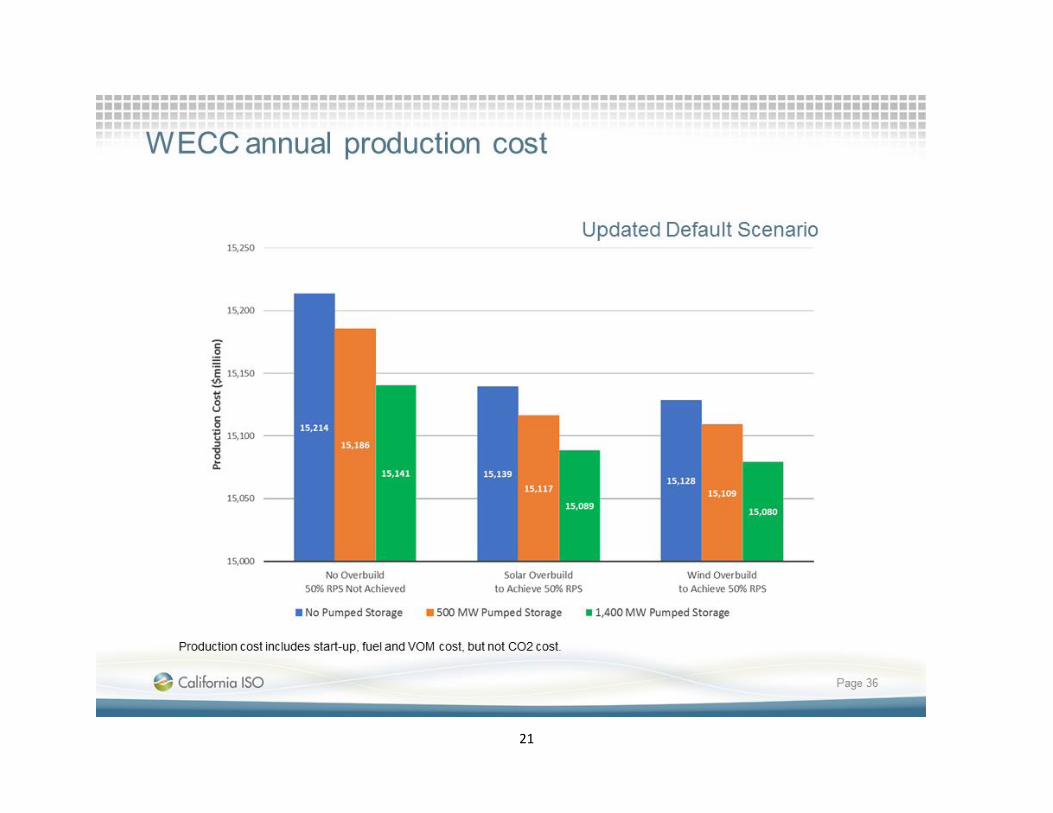
o lowering system production cost to serve the load.
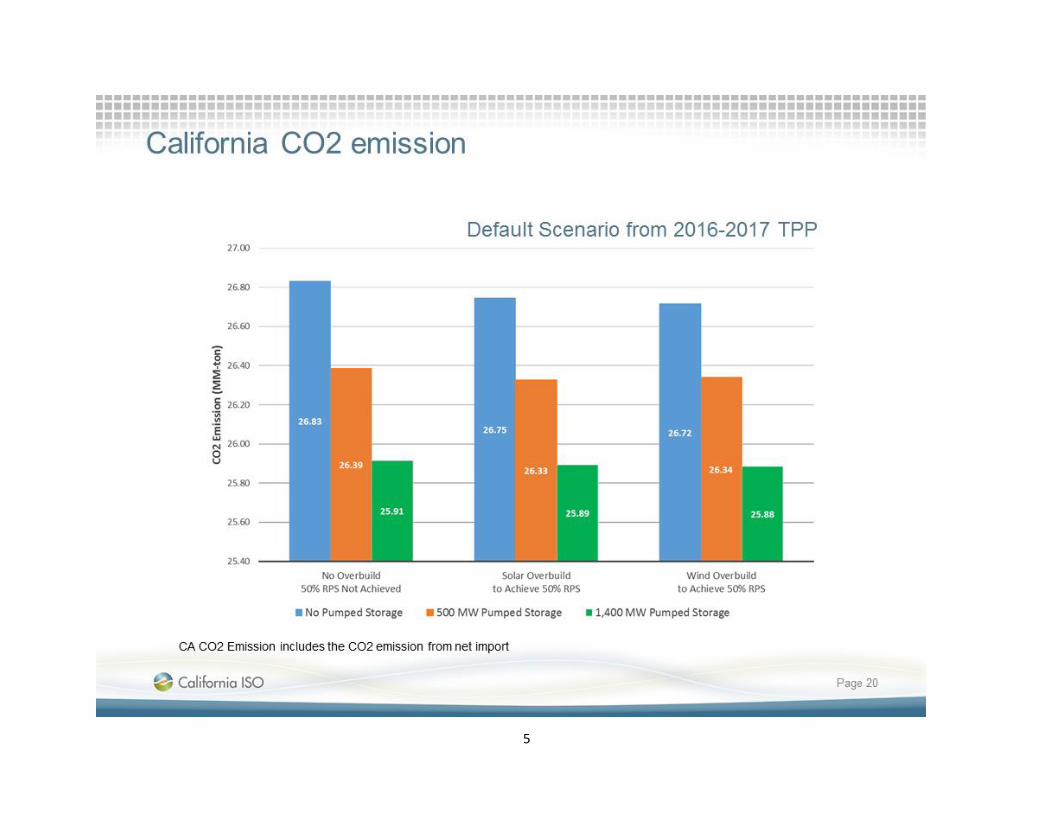
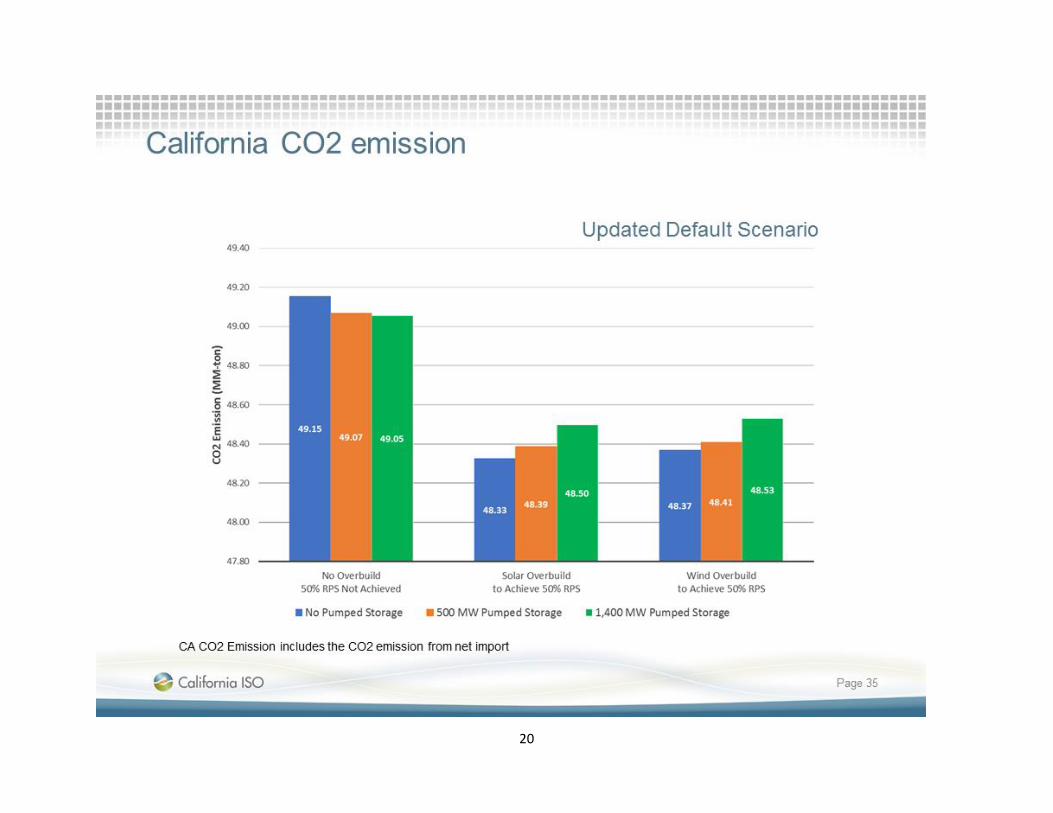
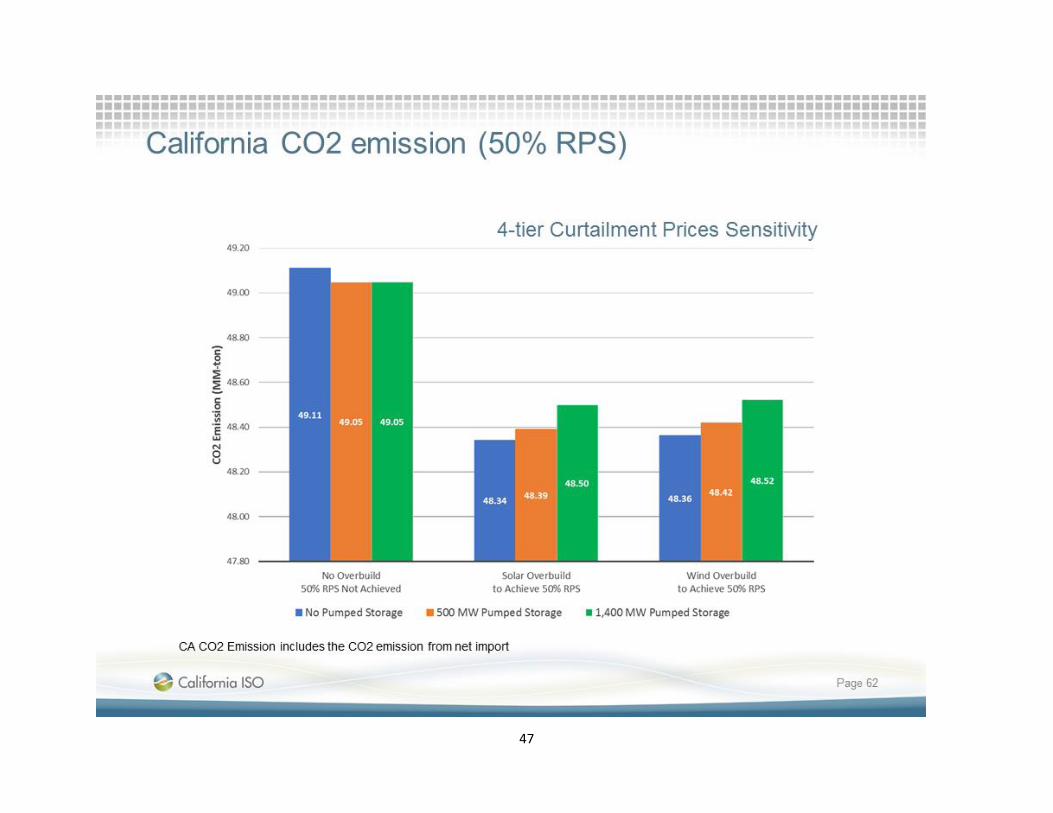
The new pumped storage resources also took advantage of low cost out-of-state energy during
hours without renewable curtailment. They also resulted in higher net import to California and
slightly increased CO2 emissions7 within California footprint.
Pumped storage was more effective with a high solar concentration renewables portfolio than with
a more diversified renewables portfolios. However a more diversified renewables portfolio has more
system benefits, resulting in overall lower costs through lower curtailment, production cost and
revenue requirement.
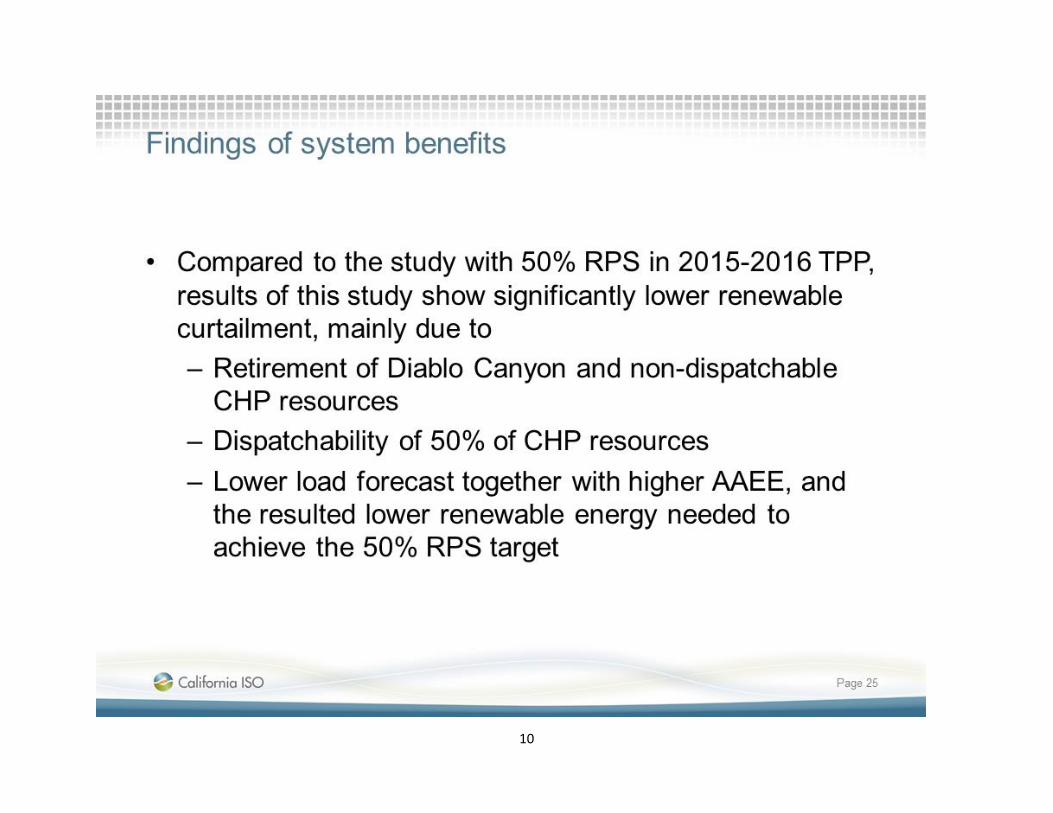
Compared to the study with 50% RPS in 2015-2016 TPP, results of this study show significantly lower
renewable curtailment, mainly due to the following assumptions:
o Retirement of Diablo Canyon and non-dispatchable CHP resources;
o Dispatchability of 50% of CHP resources; and
o Lower load forecast together with higher AAEE, and the resulted lower renewable energy
needed to achieve the 50% RPS target
Because of low renewable curtailment, the effectiveness of the pumped storage resources in
reducing renewable curtailment, renewable overbuild, and production costs was limited in this
study.
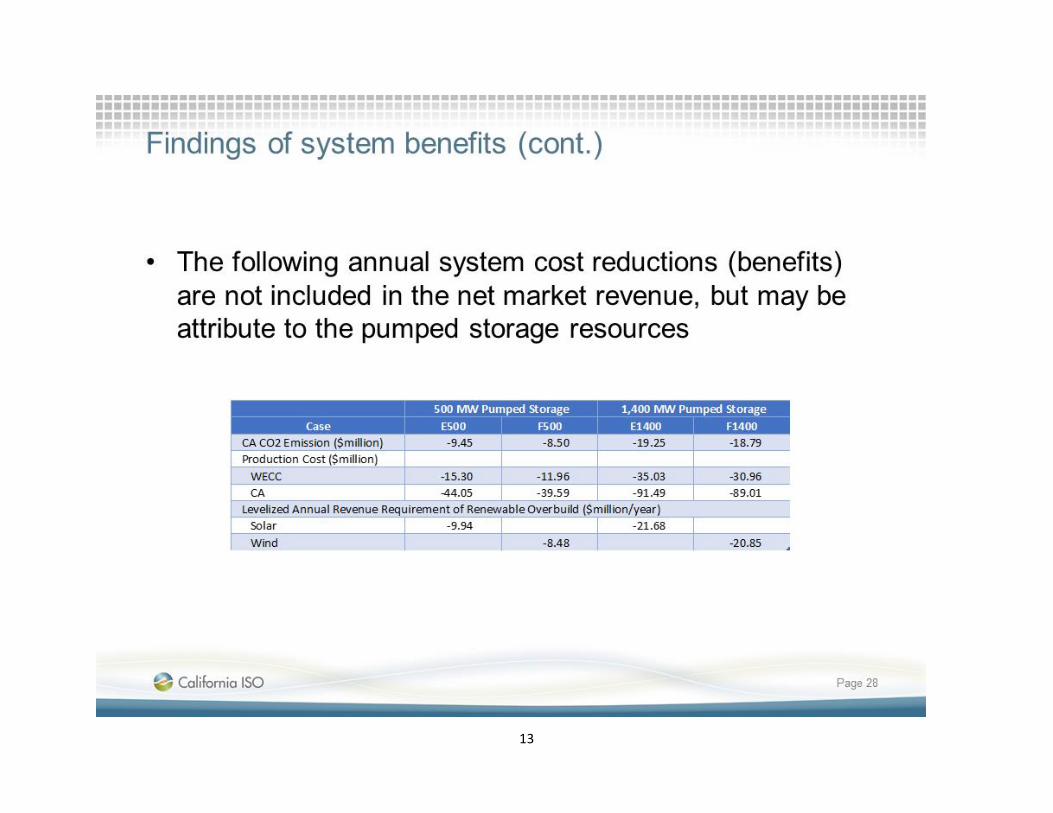
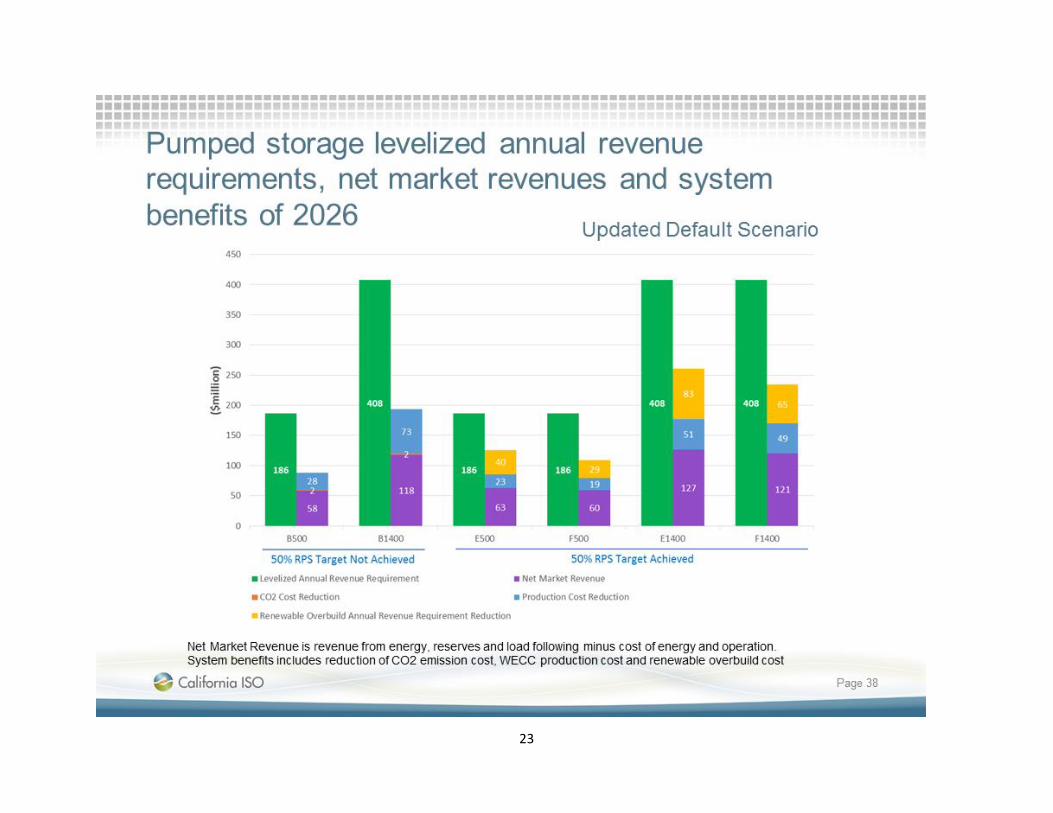
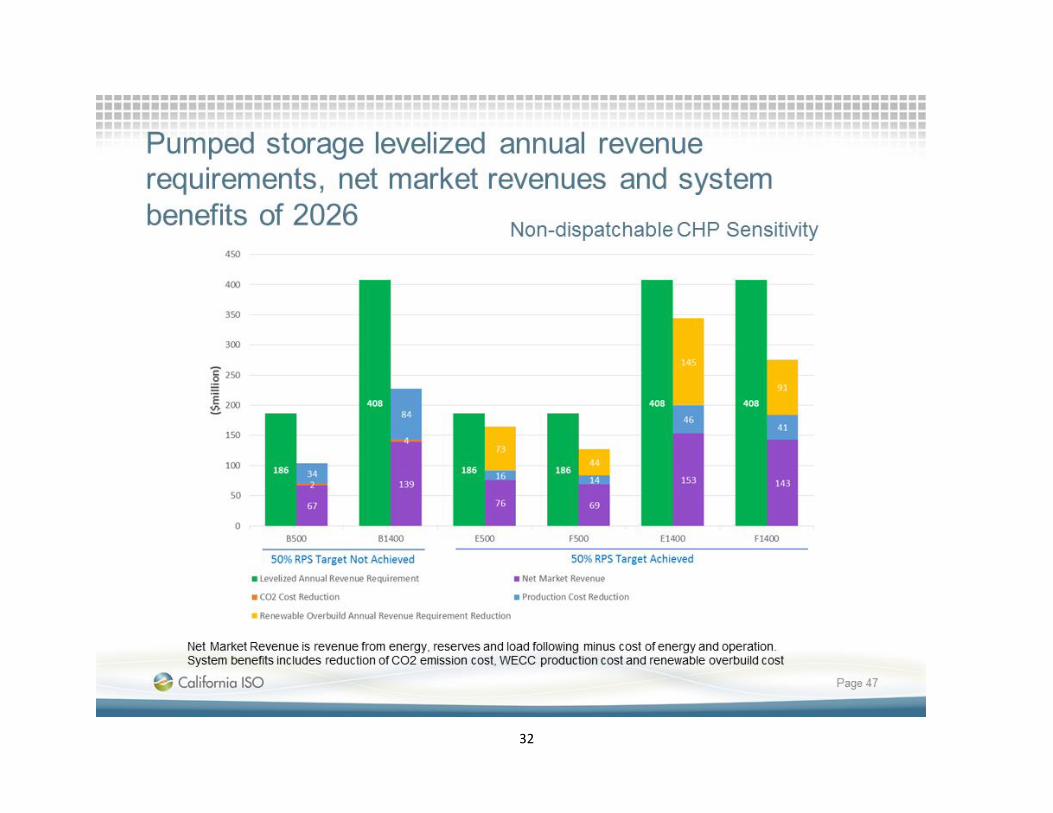
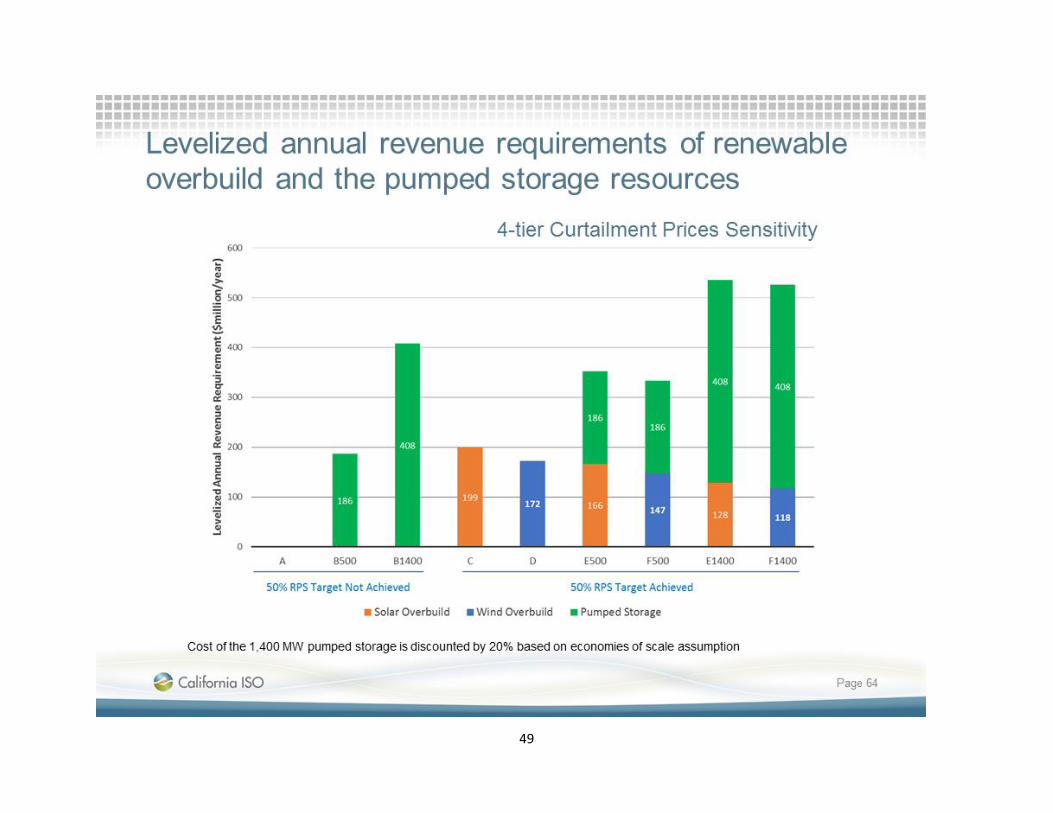
The net market revenue of the pumped storage resources provided only a portion of the levelized
annual revenue requirements. Developing pumped storage resources would need other sources of
revenue streams, which could be developed through policy decisions.
7 The slightly increased CO2 emissions result from the assumptions regarding the GHG adder relied upon in the study and the assumption that
the pumped storage would pump when low cost energy is available regardless of source. Higher GHG adders or other restrictions on these pumping opportunities would mute this impact, albeit with some corresponding impact on benefits.
California ISO/MID 8
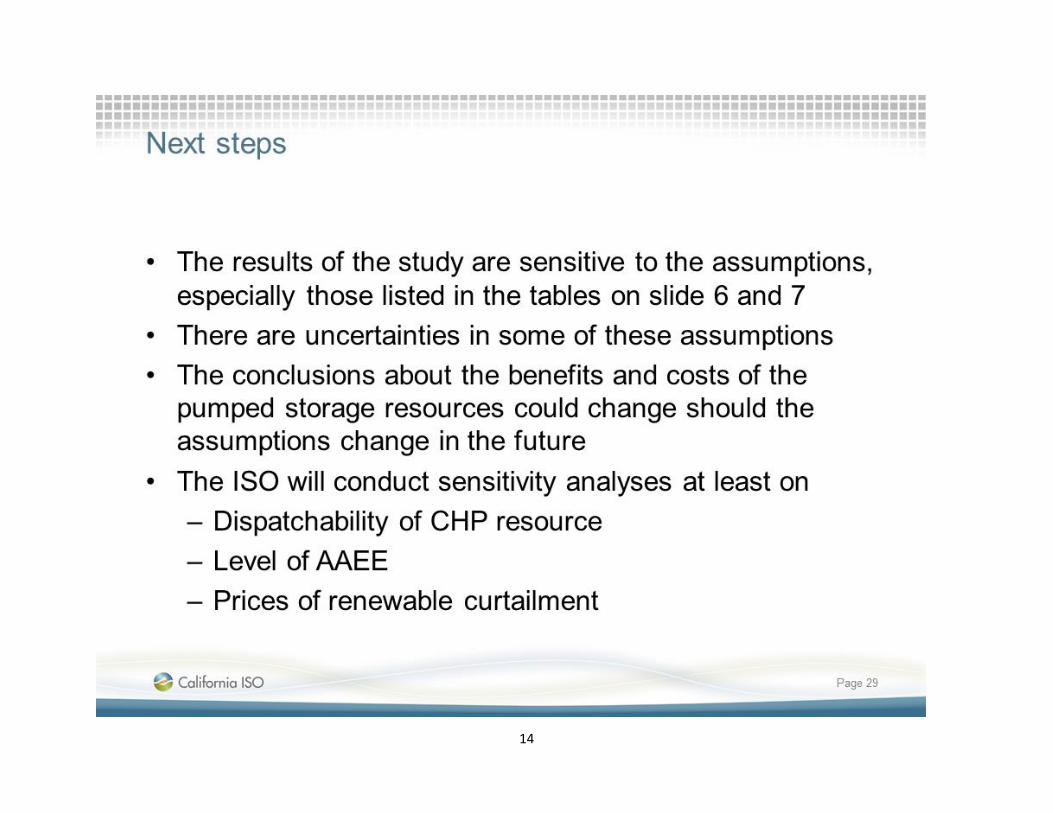
The results of the study are sensitive to the assumptions, especially the dispatchability of the CHP
resources, the level and AAEE, and the prices of renewable curtailment. The conclusions about the
benefits and costs of the pumped storage resources will change should the assumptions change.
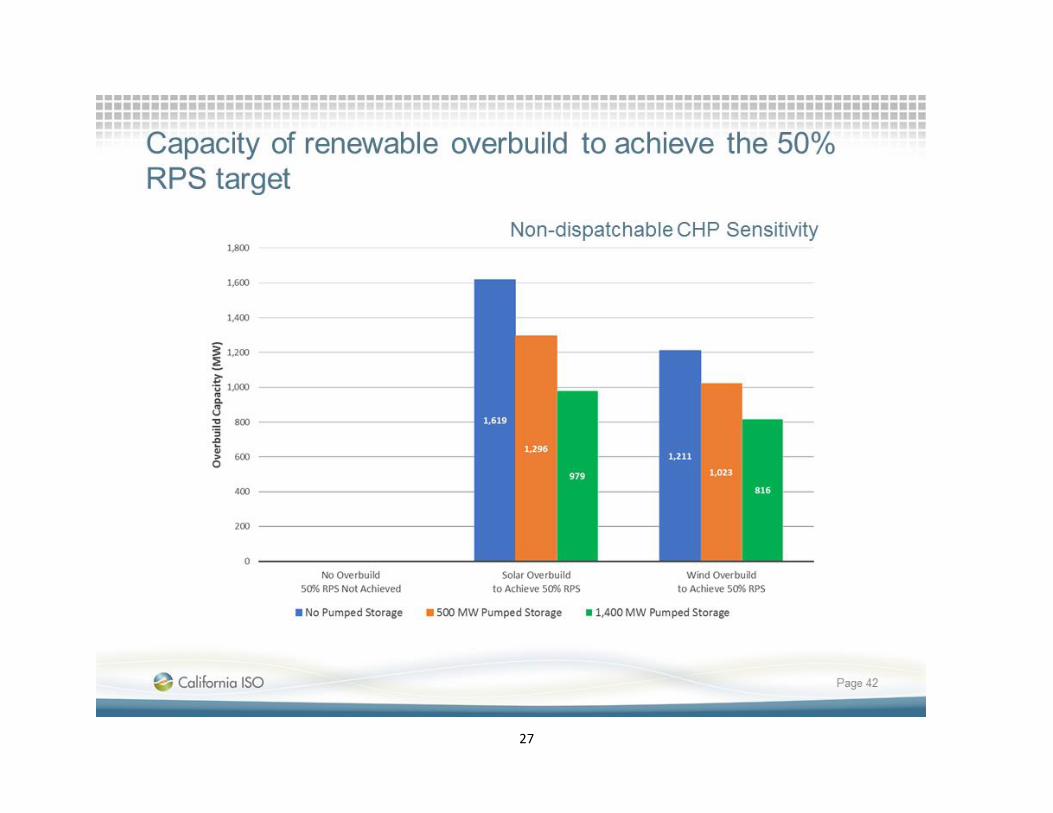
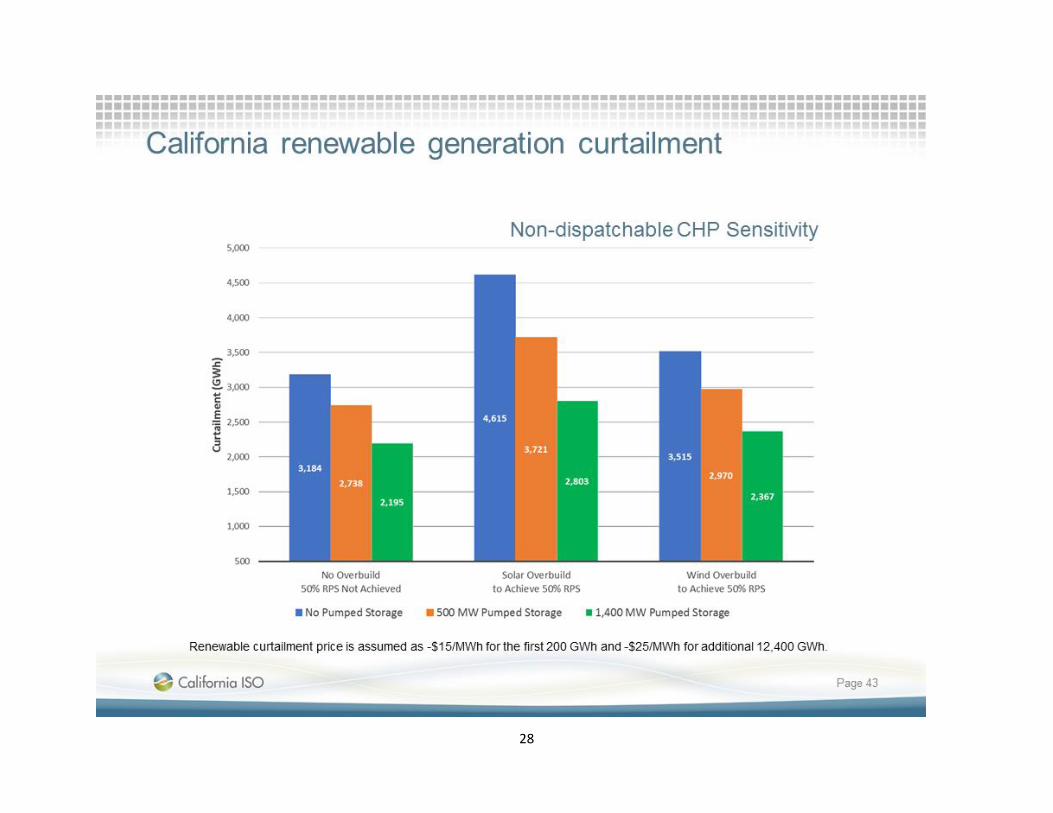
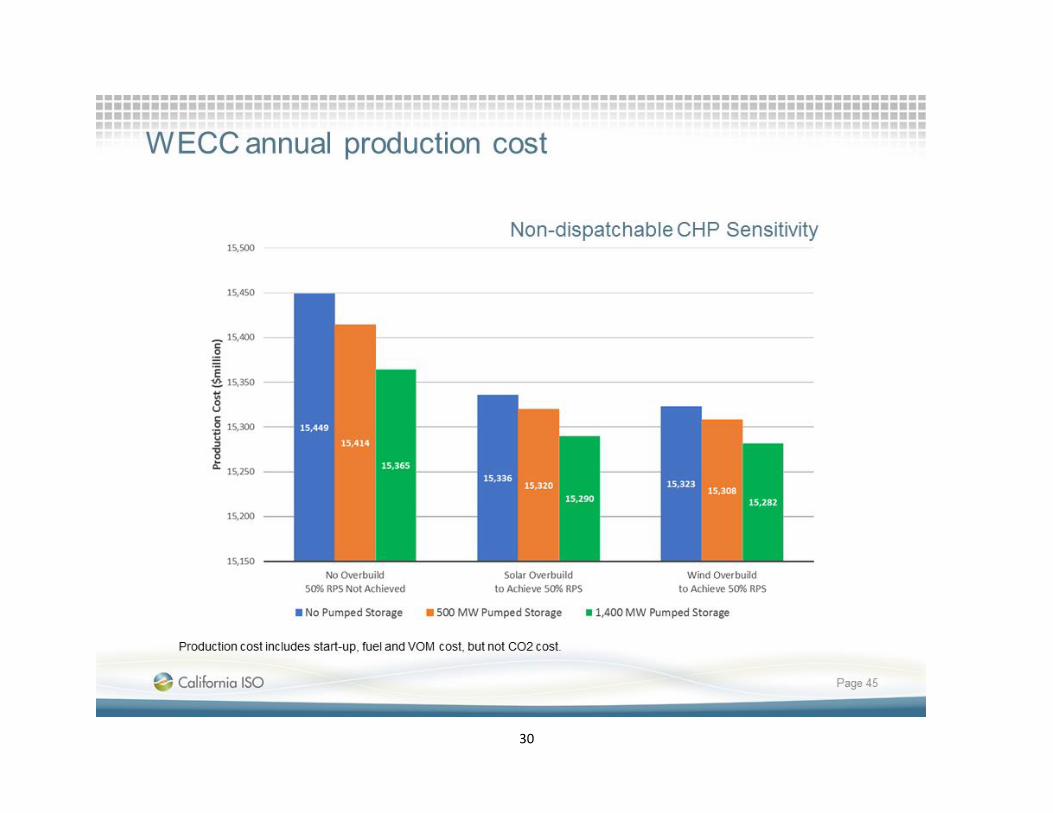
When all CHP resources are assumed to be non-dispatchable, the renewable curtailment as well as
the needed renewable overbuild to meet the 50% RPS target increased significantly, as do the
production costs. The pumped storage resources were able to take advantage of the higher
curtailment and increased their net market revenue and benefits to the system. However, the sum
of net market revenue and system benefits still fell short to meet the levelized revenue
requirements of the pumped storage resources.
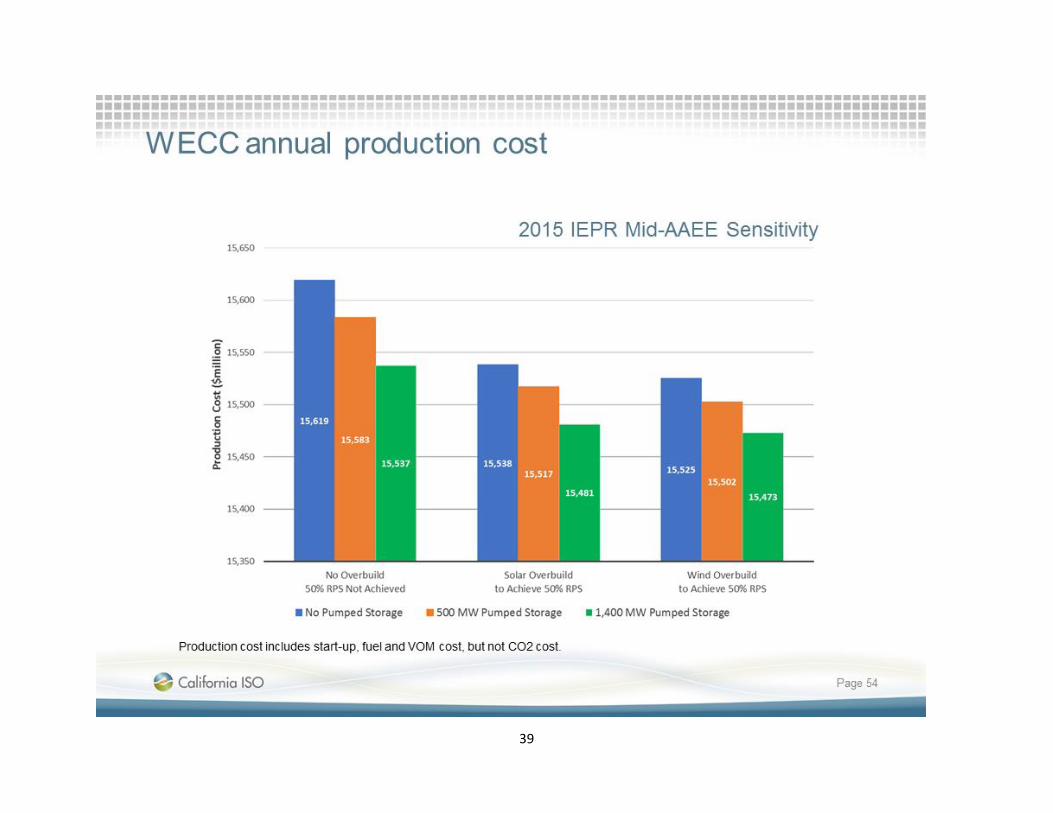
With the AAEE reduced to the 2015 IEPR forecasted level (see Table 1), retail sales of electricity
increases and more renewable energy is needed to meet the 50% RPS target. Then more solar is
added to the RPS portfolio. As a result, more solar generation was curtailed in the simulations and
more overbuild was needed. The production cost also increased because more flexible non-
renewable resources were utilized to support the renewable generation. The pumped storage
resources were able to take advantage of more renewable curtailment to increase their net market
revenue and their contribution to the system.
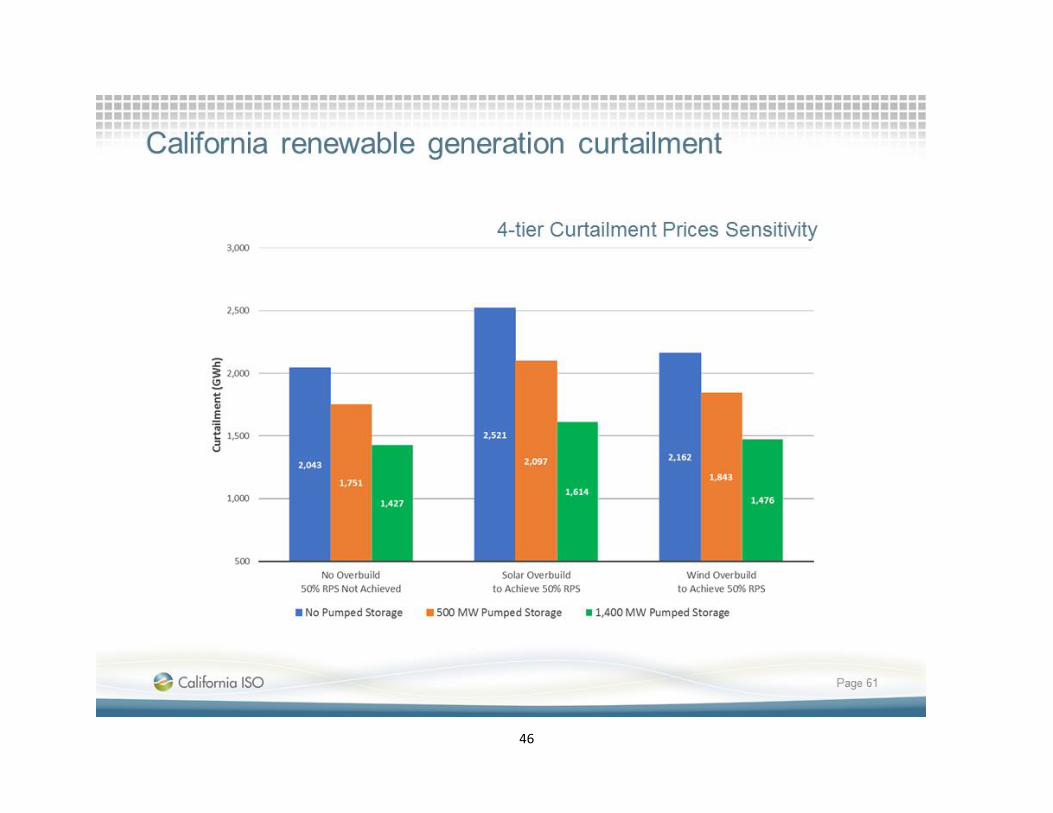
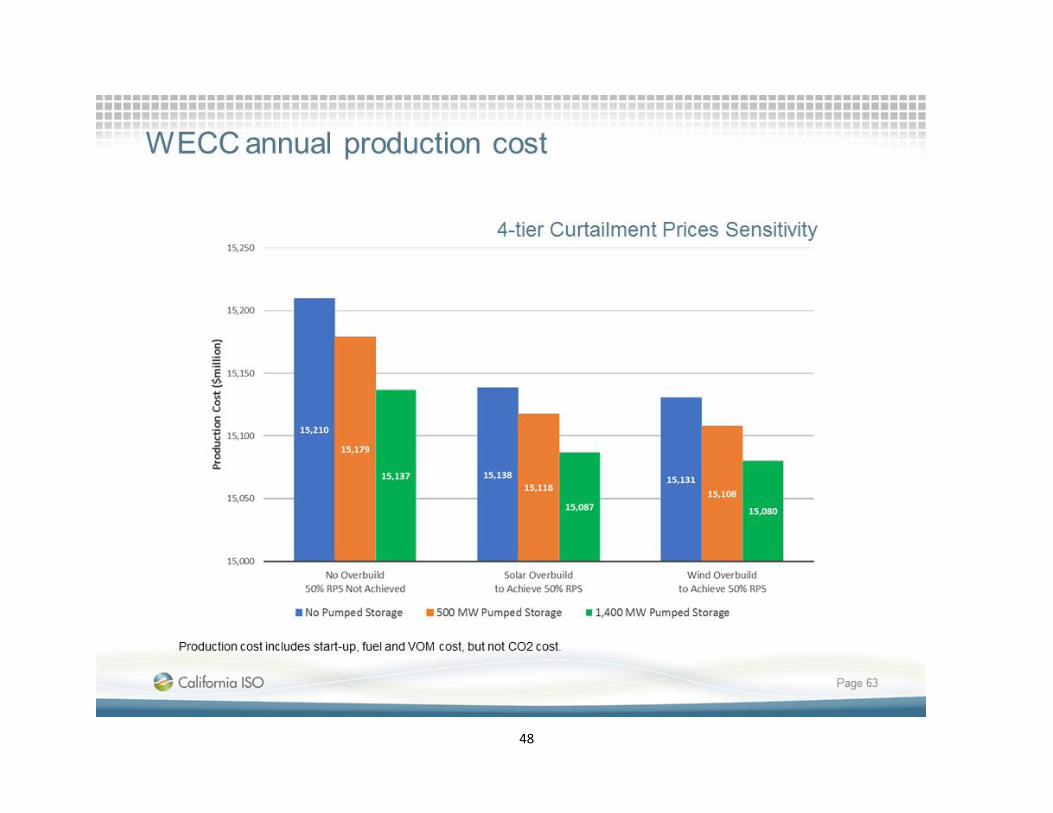
With lower renewable curtailment prices, renewable curtailment was reduced, so was the needed
renewable overbuild, the system production cost, the pumped storage resources’ net market
revenue and their benefits to the system.

1
Attachment
Slide Deck – September 20, 2017 (Revised)
Transmission Planning Process
Stakeholder Session

2
3
4
5
6

7

8

9
10

11

12
13
14
15
16
17
18
19
20
21
22
23
24
25
26
27
28

29
30
31
32

33
34
35

36
37

38
39

40

41
42

43
44

45
46
47
48
49

50

51