transmission coordination and planning committee … · transmission coordination and planning...
TRANSCRIPT
2013 LOCAL TRANSMISSION PLAN:
TRANSMISSION COORDINATION AND PLANNING COMMITTEE ANNUAL TRANSMISSION ASSESSMENT
FOR THE
COMMON USE TRANSMISSION SYSTEM
PREPARED BY BLACK HILLS CORPORATION
TRANSMISSION PLANNING
December 19, 2013

_________________________________________________________________________________________________________________ Common Use System: Transmission Coordination and Planning Committee 2013 Local Transmission Plan December 19, 2013
2
Executive Summary
In December of 2007, the Common Use System (“CUS”) participants filed with FERC Attachment K to the Joint Open Access Transmission Tariff (“JOATT”) to meet the requirements outlined in FERC Order 890. Through their Attachment K filing, the CUS participants created the Transmission Coordination and Planning Committee (“TCPC”) as the forum to conduct long-range planning studies while promoting stakeholder input and involvement. This report, intended to serve as the 2013 Local Transmission Plan (“LTP”), outlines the 2013 study cycle and presents the findings of the planning study. The report also serves as evidence of compliance with the NERC TPL Standards. The 2013 TCPC study consisted of a series of analysis methods to determine the long-term adequacy of the transmission system. These methods included steady-state power flow and transient stability performed on short term and long term scenarios to provide a comprehensive understanding of expected future transmission system performance. The 2013 study confirmed the need for several projects that were previously identified and planned for completion within the 10-year planning horizon, and a new potential reliability concern at the tail-end of the planning horizon was identified for future consideration. A brief summary of study results is included below:
• A second 230/69 kV transformer at Yellow Creek Substation was selected as an
alternative to the St. Onge substation to address transformation capacity concerns in the northern Black Hills area. The expected in-service date is 2018. (BHP)
• Local transmission providers should finalize an agreement for an exemption from the frequency limits specified in the WECC Disturbance-Performance Table (Table W-1) of Allowable Effects on Other Systems. (BHP/BEPC)
• The need for more transformation capability in the Wyodak 69 kV area was confirmed due to expected load growth and the retirement of the NSS1 power plant. (BHP)
• The TCPC should continue to evaluate the need to replace the 100 MVA transformer at Lange with a larger unit as Rapid City load growth requires. (BHP)
• The Teckla-Osage and Osage-Lange 230 kV lines should proceed as planned with expected in-service dates in 2014 and 2015, respectively. (BHP)
This report serves as the 2013 Local Transmission Plan and meets the requirements of Attachment K to the BHBE JOATT, as well as the requirements of the NERC TPL Standards and WECC System Performance Criteria. Please note that there are references to the Sundance Substation throughout this report and that this substation is now officially known as the Bill Durfee Substation.

_________________________________________________________________________________________________________________ Common Use System: Transmission Coordination and Planning Committee 2013 Local Transmission Plan December 19, 2013
3
Table of Contents
1. Introduction ............................................................................................................................... 5
1.1. Common Use Transmission System Background .............................................................. 5
1.2. Stakeholder Participation .................................................................................................... 5
2. Study Methodology ................................................................................................................... 7
2.1. Study Criteria ...................................................................................................................... 7
2.2. Study Area .......................................................................................................................... 8
2.3. Study Case Development .................................................................................................... 9
2.4. Transmission Planning Assumptions ................................................................................ 10
3. Evaluation of the Common Use Transmission System ........................................................ 11
3.1. Steady-State Analysis ....................................................................................................... 11
3.2. Category D Extreme Outage Analysis .............................................................................. 14
3.3. Transient Stability Analysis .............................................................................................. 15
3.4. Results Summary .............................................................................................................. 18
4. Transmission System Expansion ........................................................................................... 18
4.1. Previously Identified/Existing Projects ............................................................................ 18
4.2. Recommended Projects ..................................................................................................... 19
5. Conclusions .............................................................................................................................. 19
....................................................................................... A-1 Appendix A Prior and Force Outage List
............................................................................ B-1 Appendix B Loads and Resources Assumptions
_________________________________________________________________________________________________________________ Common Use System: Transmission Coordination and Planning Committee 2013 Local Transmission Plan December 19, 2013
4
List of Tables
Table 1: CUS Interconnection Points ................................................................................................. 9 Table 2: Study Case Naming Convention ......................................................................................... 11 Table 3: 2017HS Category D Outage Summary .............................................................................. 14 Table 4: 2017LA Category D Outage Summary .............................................................................. 15 Table 5: Transient Stability Analysis Fault Summary ...................................................................... 17
List of Figures
Figure 1: Common Use Transmission System ................................................................................... 6
_________________________________________________________________________________________________________________ Common Use System: Transmission Coordination and Planning Committee 2013 Local Transmission Plan December 19, 2013
5
1. Introduction In December of 2007, the Common Use System (“CUS”) participants filed with FERC Attachment K to the Joint Open Access Transmission Tariff (“JOATT”) to meet the requirements outlined in FERC Order 890. Through their Attachment K filing, the CUS participants created the Transmission Coordination and Planning Committee (“TCPC”) as the forum to conduct long-range planning studies while promoting stakeholder input and involvement. This report, intended to serve as the 2013 Local Transmission Plan (“LTP”), will outline the 2013 study cycle and present the findings of the planning study. 1.1. Common Use Transmission System Background Black Hills Power, Inc., Basin Electric Power Cooperative and Powder River Energy Corporation (referred to hereinafter as the Transmission Provider) each own certain transmission facilities with transmission service pursuant to a FERC-approved Joint Open Access Transmission Tariff (“JOATT”). The Transmission Provider commonly refers to these facilities as the Common Use System (“CUS”). A diagram of the CUS is shown in Figure 1.
1.2. Stakeholder Participation All interested parties were encouraged to participate in the 2013 TCPC study process. An open stakeholder kick-off meeting was held via webinar on March 14, 2013 to inform stakeholders of the proposed study plan and to provide an opportunity for suggestions and feedback on the study process. Requests for data pertaining to the modeling and evaluation of the transmission system were made by the Transmission Provider. Additional stakeholder meetings were held on April 16, 2013, September 24, 2013, and December 19, 2013. All meeting notices were distributed via email and posted along with presentation materials in the ‘Transmission Planning’ folder on the Common Use System/BHBE OASIS page at http://www.oatioasis.com/BHBE.

_________________________________________________________________________________________________________________ Common Use System: Transmission Coordination and Planning Committee 2013 Local Transmission Plan December 19, 2013
6
Figure 1: Existing Common Use Transmission System
_________________________________________________________________________________________________________________ Common Use System: Transmission Coordination and Planning Committee 2013 Local Transmission Plan December 19, 2013
7
2. Study Methodology The Common Use transmission system was evaluated with planned system additions for 2018 under both peak summer and off-peak autumn load levels to identify any deficiencies in system performance. Steady state voltage and thermal analyses, as well as transient stability analysis was performed. Additional upgrades were identified and modeled as necessary to mitigate any reliability criteria violations. The steady-state portion of the analysis was repeated for the 2023 off-peak winter and 2024 peak summer load scenarios to validate any upgrades identified in the near-term study as well as assess the long-term integrity of the transmission system. A list of prior and forced outages used in the 2013 LTP study process was included in Appendix A.
2.1. Study Criteria The criteria used in this analysis are consistent with the NERC TPL Reliability Standards, the WECC System performance Regional Business Practice (TPL-001-WECC-RBP-2) and Colorado Coordinated Planning Group’s Voltage Coordination Guide. Pre-existing voltage and thermal loading violations outside the localized study area were ignored during the evaluation. Worst-case Category D outages were evaluated in the 2018HS and LA scenarios for risk and consequence. 2.1.1. Steady State Voltage Criteria Under system intact conditions (NERC/WECC Category A), steady state bus voltages must remain between 0.95 and 1.05 per unit. Following a NERC/WECC Category B or C contingency, bus voltages must remain between 0.90 and 1.10 per unit.
2.1.2. Steady State Thermal Criteria All line and transformer loading must be less than 100% of their established continuous rating for system normal conditions (NERC/WECC Category A). All line and transformer loadings must be less than 100% of their established continuous or emergency rating under outage conditions (NERC/WECC Category B and C). BHP utilizes an allowable 30-minute overload on transformers of up to 153% of the continuous thermal rating for emergency situations, but flags all loading in excess of the continuous rating for further evaluation.
2.1.3. Transient Voltage and Frequency Criteria NERC Standards require that the system remain stable and within applicable thermal ratings and voltage limits for Category A, B, and C disturbances. The WECC Disturbance – Performance Table of Allowable Effects on Other Systems states the following requirements:
• Category B: Any transient voltage dip must not exceed 25% at load buses or 30% at non-
load buses. The dip also must not exceed 20% for more than 20 cycles at load buses. Frequency must not drop below 59.6 Hz for 6 or more cycles at a load bus, including generation station service load.
• Category C: Any transient voltage dip must not exceed 30% at load buses or 30% at non-load buses. The dip also must not exceed 20% for more than 40 cycles at load buses. Frequency must not drop below 59.0 Hz for 6 or more cycles at a load bus, including station service load.

_________________________________________________________________________________________________________________ Common Use System: Transmission Coordination and Planning Committee 2013 Local Transmission Plan December 19, 2013
8
Based in part on the NERC/WECC requirements, the following criteria were used to determine acceptable transient system performance:
• All machines in the system shall remain in synchronism as demonstrated by their relative
rotor angles. • System stability is evaluated based on the damping of the relative rotor angles and the
damping of the voltage magnitude swings. • For central, northern and eastern Wyoming and western South Dakota, the following
dynamic stability guidelines have been established: Following a single contingency disturbance with normal fault clearing, the transient bus voltage swing on all buses should not be lower than 0.70 per unit, and the system should exhibit positive damping.
• The frequency criteria specified in Table W-1 of the WECC Disturbance-Performance Table of Allowable Effects on Other Systems was utilized for the analysis. However, CUS transmission providers and neighboring transmission providers may adopt a less stringent requirement than the NERC/WECC Planning Standard. See Section 4.1.3 for details regarding this proposed change.
2.1.4. Cascading NERC Standards require that the system remain stable and no Cascading occurs for Category A, B, and C disturbances. Cascading is defined in the NERC Glossary as “The uncontrolled successive loss of system elements triggered by an incident at any location. Cascading…… cannot be restrained from sequentially spreading beyond an area predetermined by studies.” A potential triggering event for Cascading will be investigated upon one of the following results:
• A generator pulls out of synchronism in transient stability simulations. Loss of synchronism occurs when a rotor angle swing is greater than 180 degrees. Rotor angle swings greater than 180 degrees may also be the result of a generator becoming disconnected from the BES; or
• A transmission element experiences thermal overload and the minimum transmission relay load-ability threshold is exceeded. Thermal overloads of greater than 150% will be further investigated to determine the risk of Cascading by manually removing those facilities in sequence until the outage is contained or Cascading is confirmed.
• Negative margin occurs in voltage stability simulations.
2.2. Study Area

_________________________________________________________________________________________________________________ Common Use System: Transmission Coordination and Planning Committee 2013 Local Transmission Plan December 19, 2013
9
The 2013 LTP study area will include all CUS transmission equipment as well as neighboring transmission system elements bound by TOT4B to the northwest, TOT4A to the southwest, Dave Johnston and Stegall to the south, and Rapid City to the east. Points of interconnection between the CUS and neighboring utilities are shown in Table 1.
Table 1: CUS Interconnection Points
Interconnection Name Interconnecting Utility1 Sheridan City of Sheridan, PAC
Carr Draw PAC Wyodak PAC Antelope PAC Windstar PAC
Dave Johnston WAPA-RMR, PAC, MBPP Stegall WAPA-RMR, MBPP
Rapid City DC Tie WAPA-UGPR 2.3. Study Case Development The baseline cases for the 2013 LTP Study were chosen to ensure that a range of forecasted CUS demand levels and critical conditions were analyzed. They were also chosen based upon availability of updated regional study cases, planned transmission system and resource upgrades, and previously completed planning studies. A complete list of individual case changes for each scenario is available upon request. 2.3.1. 2018 Heavy Summer and Light Autumn Study Cases The 2018 heavy summer scenario was chosen for the near-term analysis for several reasons. The summer demand levels, in combination with more restrictive transmission facility ratings, have historically been the most critical of the seasonal load patterns in the study area. The case originated as the 2018HS CCPG case. The 2018 light autumn scenario was chosen to allow for an assessment of the ‘bookends’ of demand levels within the CUS at the latter end of the near-term study time frame. The starting case was the 2018LA CCPG case. Updates to the case loads, resources, and topology were solicited from TCPC members as well as neighboring systems and applied to the models. Significant changes to the existing 2013 Common Use transmission system to create the 2018 models included:
1 PAC means PacifiCorp; WAPA means Western Area Power Administration; MBPP means Missouri Basin Power Project
_________________________________________________________________________________________________________________ Common Use System: Transmission Coordination and Planning Committee 2013 Local Transmission Plan December 19, 2013
10
• the addition of the planned Teckla-Osage-Lange 230 kV line • the retirement of the Osage power plant • the retirement of the Ben French power plant • the retirement of the NSS1 power plant • addition of the Cheyenne Prairie Generation Station
2.3.2. 2023 Light Winter Study Case The 2023 light winter time scenario was chosen to allow for an assessment of the ‘bookends’ of demand levels within the CUS in the far-term study time frame. The starting case was the WECC 22HW1 base case approved in March 2012. As with the 2018 cases, current load and resource forecasts were modeled, as well as expected system topology for that time frame. There were no major transmission system projects modeled in addition to those included in the 2018 scenarios.
2.3.3. 2024 Heavy Summer Study Case The 2024 case was created by the Colorado Coordinated Planning Group (“CCPG”) members for their 2013 annual study plan. As with the 2018 cases, current load and resource forecasts were modeled, as well as expected system topology for that time frame. There was no major transmission system projects modeled in addition to those included in the 2018 scenarios.
2.4. Transmission Planning Assumptions The 2013 LTP study was performed for both the 5 and 10-year time frames with the following assumptions:
• All existing and planned facilities and the effects of control devices and protection systems
were accurately represented in the system model. • All normal CUS Operational Procedures were included in the system model. • Projected firm transfers were represented per load and resource updates from each
stakeholder. • Existing and planned reactive power resources were modeled to ensure adequate system
performance. • There were no specific planned outages identified for the 2018, 2023, and 2024 study
periods. A series of prior and forced outages on facilities deemed to be most critical by the transmission planner was simulated to identify potential risks associated with such outages in the study time frame. A list of the evaluated prior and forced outages is included in Appendix A.
• For system intact solutions, transformer taps and switched shunts were allowed to adjust. Following a contingency, adjustment of these devices was disabled unless designed to allow such operation. For all solutions, area interchange control and phase shifter adjustments were disabled, while DC tap adjustment was enabled. A fixed slope decoupled Newton solution method was utilized through the analysis.
• System load and generation dispatch assumptions are included in Appendix B.
_________________________________________________________________________________________________________________ Common Use System: Transmission Coordination and Planning Committee 2013 Local Transmission Plan December 19, 2013
11
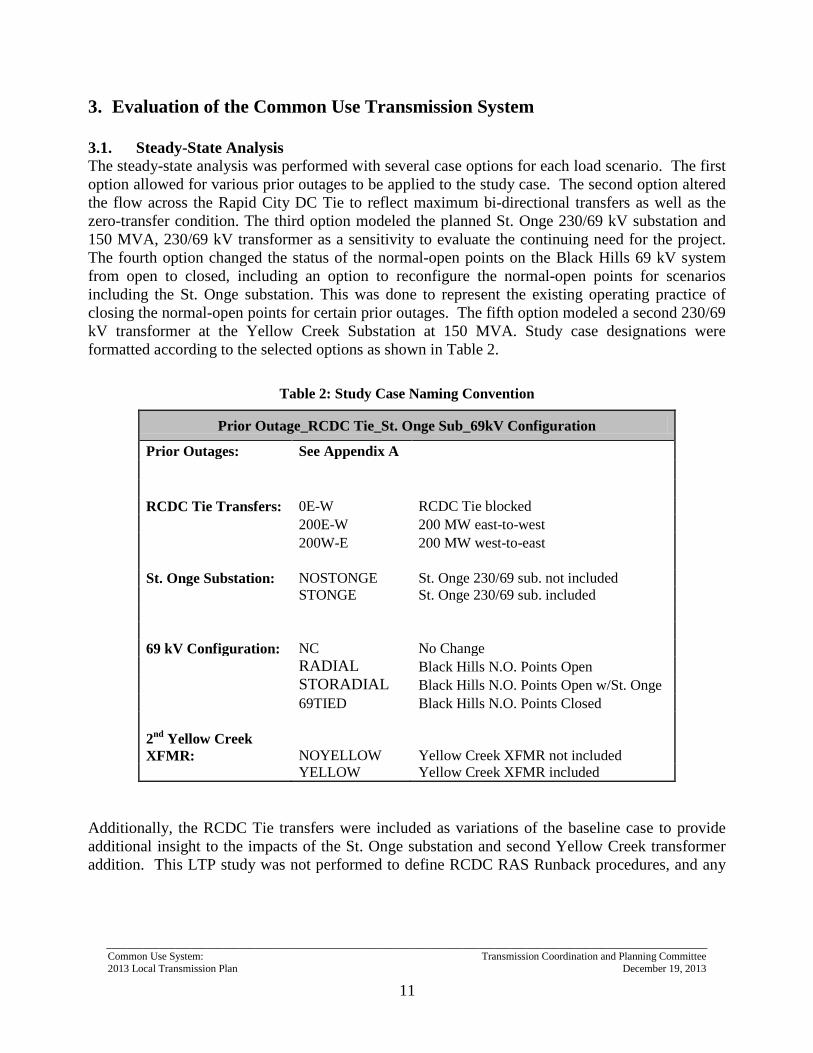
3. Evaluation of the Common Use Transmission System 3.1. Steady-State Analysis The steady-state analysis was performed with several case options for each load scenario. The first option allowed for various prior outages to be applied to the study case. The second option altered the flow across the Rapid City DC Tie to reflect maximum bi-directional transfers as well as the zero-transfer condition. The third option modeled the planned St. Onge 230/69 kV substation and 150 MVA, 230/69 kV transformer as a sensitivity to evaluate the continuing need for the project. The fourth option changed the status of the normal-open points on the Black Hills 69 kV system from open to closed, including an option to reconfigure the normal-open points for scenarios including the St. Onge substation. This was done to represent the existing operating practice of closing the normal-open points for certain prior outages. The fifth option modeled a second 230/69 kV transformer at the Yellow Creek Substation at 150 MVA. Study case designations were formatted according to the selected options as shown in Table 2.
Table 2: Study Case Naming Convention
Prior Outage_RCDC Tie_St. Onge Sub_69kV Configuration Prior Outages: See Appendix A RCDC Tie Transfers: 0E-W RCDC Tie blocked 200E-W 200 MW east-to-west 200W-E 200 MW west-to-east St. Onge Substation: NOSTONGE St. Onge 230/69 sub. not included STONGE St. Onge 230/69 sub. included 69 kV Configuration: NC No Change RADIAL Black Hills N.O. Points Open STORADIAL Black Hills N.O. Points Open w/St. Onge 69TIED Black Hills N.O. Points Closed 2nd Yellow Creek XFMR: NOYELLOW Yellow Creek XFMR not included YELLOW Yellow Creek XFMR included
Additionally, the RCDC Tie transfers were included as variations of the baseline case to provide additional insight to the impacts of the St. Onge substation and second Yellow Creek transformer addition. This LTP study was not performed to define RCDC RAS Runback procedures, and any
_________________________________________________________________________________________________________________ Common Use System: Transmission Coordination and Planning Committee 2013 Local Transmission Plan December 19, 2013
12
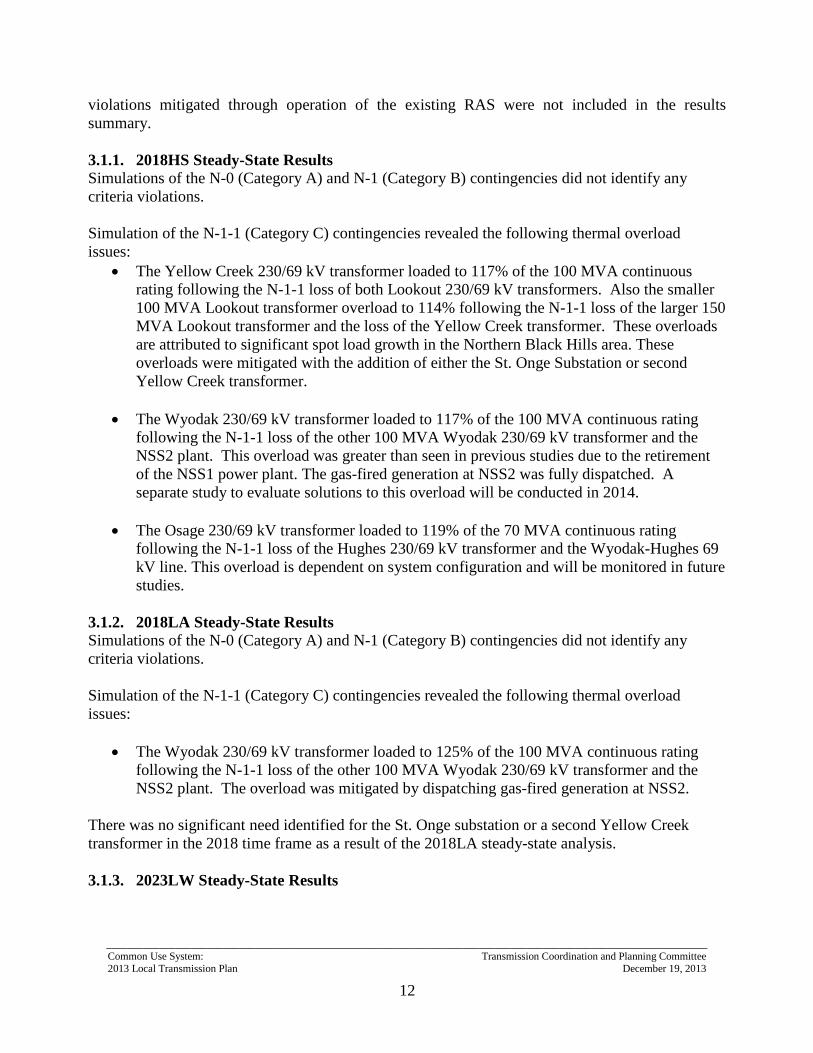
violations mitigated through operation of the existing RAS were not included in the results summary. 3.1.1. 2018HS Steady-State Results Simulations of the N-0 (Category A) and N-1 (Category B) contingencies did not identify any criteria violations. Simulation of the N-1-1 (Category C) contingencies revealed the following thermal overload issues:
• The Yellow Creek 230/69 kV transformer loaded to 117% of the 100 MVA continuous rating following the N-1-1 loss of both Lookout 230/69 kV transformers. Also the smaller 100 MVA Lookout transformer overload to 114% following the N-1-1 loss of the larger 150 MVA Lookout transformer and the loss of the Yellow Creek transformer. These overloads are attributed to significant spot load growth in the Northern Black Hills area. These overloads were mitigated with the addition of either the St. Onge Substation or second Yellow Creek transformer.
• The Wyodak 230/69 kV transformer loaded to 117% of the 100 MVA continuous rating
following the N-1-1 loss of the other 100 MVA Wyodak 230/69 kV transformer and the NSS2 plant. This overload was greater than seen in previous studies due to the retirement of the NSS1 power plant. The gas-fired generation at NSS2 was fully dispatched. A separate study to evaluate solutions to this overload will be conducted in 2014.
• The Osage 230/69 kV transformer loaded to 119% of the 70 MVA continuous rating
following the N-1-1 loss of the Hughes 230/69 kV transformer and the Wyodak-Hughes 69 kV line. This overload is dependent on system configuration and will be monitored in future studies.
3.1.2. 2018LA Steady-State Results Simulations of the N-0 (Category A) and N-1 (Category B) contingencies did not identify any criteria violations. Simulation of the N-1-1 (Category C) contingencies revealed the following thermal overload issues:
• The Wyodak 230/69 kV transformer loaded to 125% of the 100 MVA continuous rating following the N-1-1 loss of the other 100 MVA Wyodak 230/69 kV transformer and the NSS2 plant. The overload was mitigated by dispatching gas-fired generation at NSS2.
There was no significant need identified for the St. Onge substation or a second Yellow Creek transformer in the 2018 time frame as a result of the 2018LA steady-state analysis. 3.1.3. 2023LW Steady-State Results

_________________________________________________________________________________________________________________ Common Use System: Transmission Coordination and Planning Committee 2013 Local Transmission Plan December 19, 2013
13
Simulations of the N-0 (Category A) and N-1 (Category B) contingencies did not identify any criteria violations. Simulation of the N-1-1 (Category C) contingencies revealed the following thermal overload issues:
• The Wyodak 230/69 kV transformer loaded to 125% of the 100 MVA continuous rating following the N-1-1 loss of the other 100 MVA Wyodak 230/69 kV transformer and the NSS2 plant. A separate study to evaluate solutions to this overload will be conducted in 2014.
There was no significant need identified for the St. Onge substation or second Yellow Creek transformer in the 2023 time frame as a result of the 2023LW steady-state analysis. This is attributed to lighter loading in the area as this is typically a summer peaking load area. 3.1.4. 2024HS Steady-State Results Simulations of the N-0 (Category A) and N-1 (Category B) contingencies did not identify any criteria violations. Simulation of the N-1-1 (Category C) contingencies revealed the following thermal overload issues:
• Several 230/69 kV transformer overloads were encountered following the N-1-1 loss of two transformers in the Black Hills area. The Yellowcreek transformer loading reached the 2-hour emergency rating of 126% following the loss of both Lookout transformers. Additional generation in Rapid City did not mitigate the overload. The addition of St. Onge reduced the loading to 77%. The addition of a new 150 MVA transformer at Yellow Creek reduced the loading to 71%.
• The Lookout #1 230/69 kV transformer reached 123% of the 100 MVA continuous rating
following the N-1-1 loss of the Yellow Creek (100 MVA) and Lookout #2 (150 MVA) transformers. The overload was not mitigated by dispatching additional Rapid City generation. The addition of St. Onge reduced the loading to 82%. The addition of a new 150 MVA transformer at Yellow Creek reduced the loading to 87%.
• The Lange #1 230/69 kV transformer (100 MVA) became loaded to 145% following the N-
1-1 loss of the South Rapid City and Lange #2 230/69 kV transformers. The overload was mitigated by dispatching all Rapid City gas-fired generation, assuming Ben French was unavailable due to retirement of the unit. The transformer also loaded to 114% following the N-1-1 loss of the South Rapid City-Lange 230 kV line and the Lange #2 transformer. This overload was mitigated by dispatching Rapid City gas-fired generation. The addition of the St. Onge substation or the second Yellow Creek transformer had no significant impact on the Lange transformer overloads. It is suggested that the unit be replaced with a
_________________________________________________________________________________________________________________ Common Use System: Transmission Coordination and Planning Committee 2013 Local Transmission Plan December 19, 2013
14
150 MVA transformer in the event of a failure, or as Rapid City load growth requires. The loading on the Lange #1 transformer will continue to be monitored in future studies.
• The Wyodak 230/69 kV transformer loaded to 118% of the 100 MVA continuous rating
following the N-1-1 loss of the other 100 MVA Wyodak 230/69 kV transformer and the NSS2 plant. All gas-fired generation at NSS2 was online for this scenario. A separate study to evaluate solutions to this overload will be conducted in 2014.
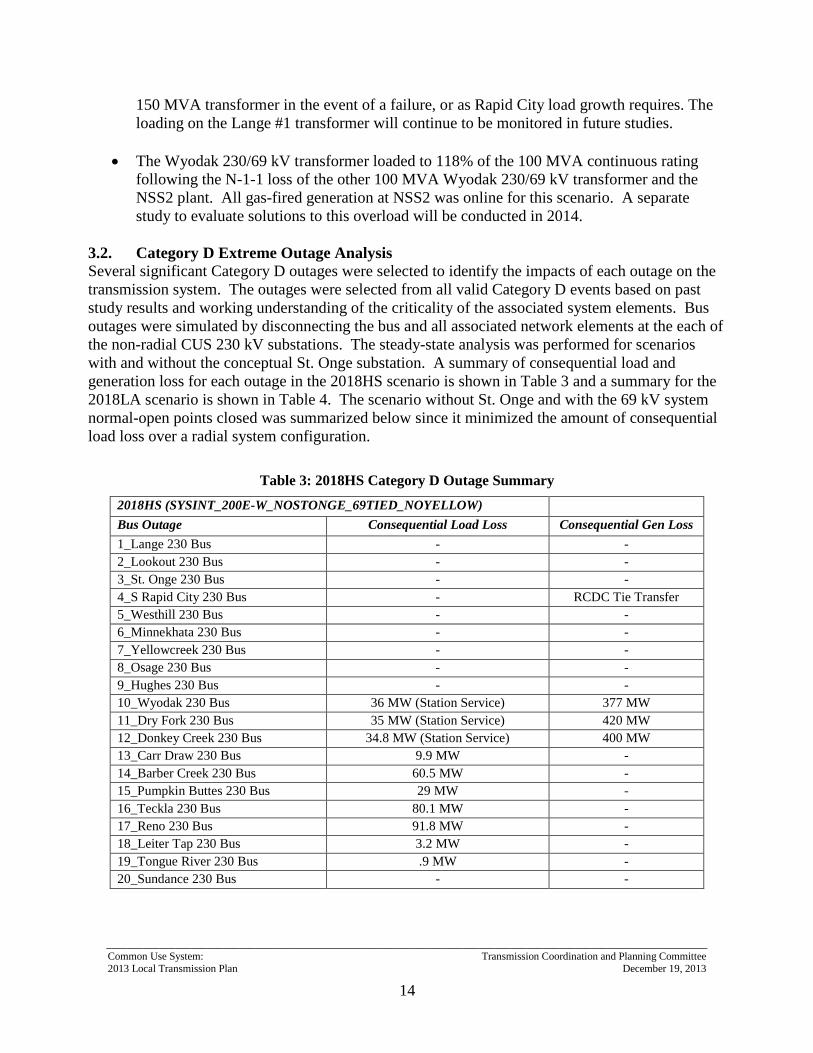
3.2. Category D Extreme Outage Analysis Several significant Category D outages were selected to identify the impacts of each outage on the transmission system. The outages were selected from all valid Category D events based on past study results and working understanding of the criticality of the associated system elements. Bus outages were simulated by disconnecting the bus and all associated network elements at the each of the non-radial CUS 230 kV substations. The steady-state analysis was performed for scenarios with and without the conceptual St. Onge substation. A summary of consequential load and generation loss for each outage in the 2018HS scenario is shown in Table 3 and a summary for the 2018LA scenario is shown in Table 4. The scenario without St. Onge and with the 69 kV system normal-open points closed was summarized below since it minimized the amount of consequential load loss over a radial system configuration.
Table 3: 2018HS Category D Outage Summary 2018HS (SYSINT_200E-W_NOSTONGE_69TIED_NOYELLOW) Bus Outage Consequential Load Loss Consequential Gen Loss 1_Lange 230 Bus - - 2_Lookout 230 Bus - - 3_St. Onge 230 Bus - - 4_S Rapid City 230 Bus - RCDC Tie Transfer 5_Westhill 230 Bus - - 6_Minnekhata 230 Bus - - 7_Yellowcreek 230 Bus - - 8_Osage 230 Bus - - 9_Hughes 230 Bus - - 10_Wyodak 230 Bus 36 MW (Station Service) 377 MW 11_Dry Fork 230 Bus 35 MW (Station Service) 420 MW 12_Donkey Creek 230 Bus 34.8 MW (Station Service) 400 MW 13_Carr Draw 230 Bus 9.9 MW - 14_Barber Creek 230 Bus 60.5 MW - 15_Pumpkin Buttes 230 Bus 29 MW - 16_Teckla 230 Bus 80.1 MW - 17_Reno 230 Bus 91.8 MW - 18_Leiter Tap 230 Bus 3.2 MW - 19_Tongue River 230 Bus .9 MW - 20_Sundance 230 Bus - -

_________________________________________________________________________________________________________________ Common Use System: Transmission Coordination and Planning Committee 2013 Local Transmission Plan December 19, 2013
15
Table 4: 2018LA Category D Outage Summary 2018LA (SYSINT_200E-W_NOSTONGE_69TIED_NOYELLOW) Bus Outage Consequential Load Loss Consequential Gen Loss 1_Lange 230 Bus - - 2_Lookout 230 Bus - - 3_St. Onge 230 Bus - - 4_S Rapid City 230 Bus - RCDC Tie Transfer 5_Westhill 230 Bus - - 6_Minnekhata 230 Bus - - 7_Yellowcreek 230 Bus - - 8_Osage 230 Bus - - 9_Hughes 230 Bus - - 10_Wyodak 230 Bus 36 MW (Station Service) 377 MW 11_Dry Fork 230 Bus 35 MW (Station Service) 420 MW 12_Donkey Creek 230 Bus 32.2 MW (Station Service) 286 MW 13_Carr Draw 230 Bus 10.1 MW - 14_Barber Creek 230 Bus 56.7 MW - 15_Pumpkin Buttes 230 Bus 26.4 MW - 16_Teckla 230 Bus 55.2 MW - 17_Reno 230 Bus 70.7 MW - 18_Leiter Tap 230 Bus 2.5 MW - 19_Tongue River 230 Bus 1 MW - 20_Sundance 230 Bus - -
The dynamic analysis was performed only for the 2018HS and LA scenarios that did not include St. Onge and had RCDC Tie transfers of 200 MW E-W. The Category D events listed in Table 3 and Table 4 were evaluated by modeling a 3-phase 5-cycle fault at the appropriate bus before clearing that bus and running the simulation for 5 seconds. There was no evidence of cascading or system instability in any of the 2018HS or LA scenarios during the Category D steady-state or transient stability outage analysis. 3.3. Transient Stability Analysis Transient analysis was performed to evaluate the dynamic characteristics of the transmission system in proximity to the CUS footprint following various disturbances. With the exception of Powder River Energy Corp. loads, system loads were modeled using the WECC generic motor load at a penetration of 20 percent, with the under voltage load shedding function disabled to provide a worst-case representation of system performance. The non-coal bed methane (“CBM”) PRECorp loads were modeled as 30 percent motor load and the CBM loads were modeled as 80 percent motor load. The 2018HS and LA scenarios that were evaluated included RCDC Tie transfers of 200 MW EW, no St. Onge project, and the 69 kV normal-open points were closed. The critical outage combinations evaluated in the transient analysis were selected based on significance with respect to proximity to local generation, clearing of a CUS tie line, or performance during steady state
_________________________________________________________________________________________________________________ Common Use System: Transmission Coordination and Planning Committee 2013 Local Transmission Plan December 19, 2013
16
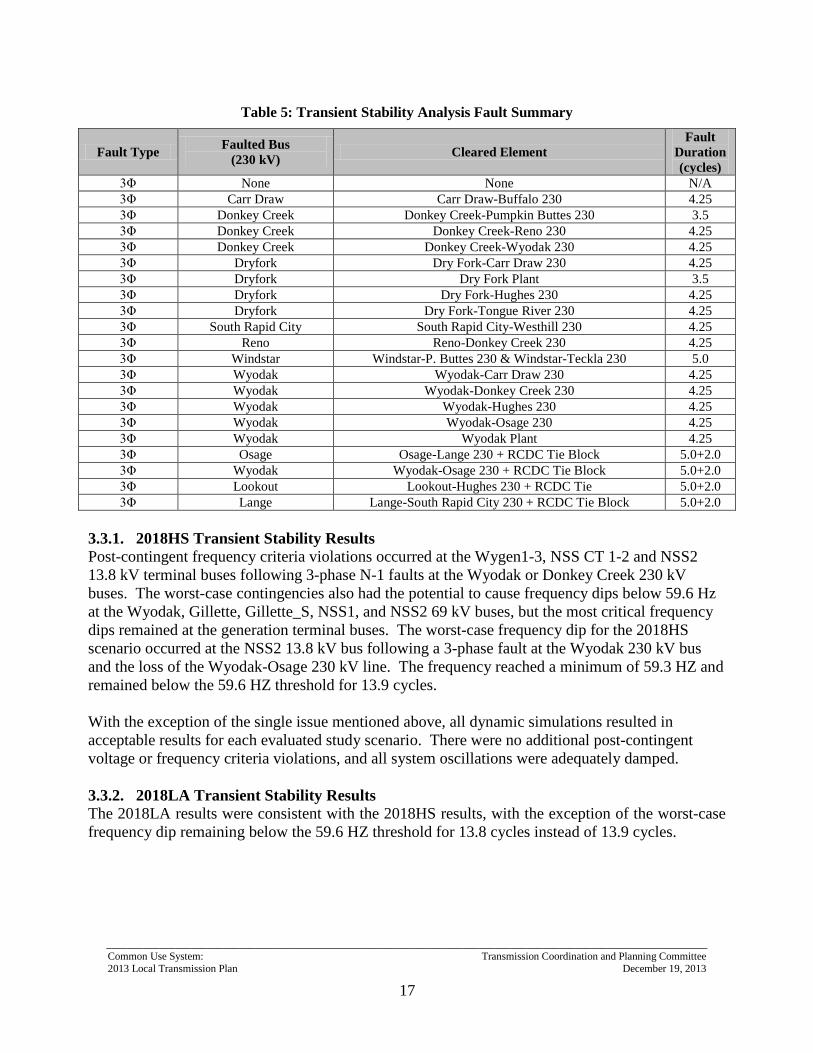
analysis. The 3-phase faults listed in Table 5 were simulated for the 2018HS and LA system intact and prior outage scenarios. For each five second simulation, plots including bus voltages and generator rotor angles at various points on the transmission system were created, as well as simulation summary reports. Due to the large quantity of files created, they are not included in this report but are available upon request.
_________________________________________________________________________________________________________________ Common Use System: Transmission Coordination and Planning Committee 2013 Local Transmission Plan December 19, 2013
17
Table 5: Transient Stability Analysis Fault Summary
Fault Type Faulted Bus (230 kV) Cleared Element
Fault Duration (cycles)
3Φ None None N/A 3Φ Carr Draw Carr Draw-Buffalo 230 4.25 3Φ Donkey Creek Donkey Creek-Pumpkin Buttes 230 3.5 3Φ Donkey Creek Donkey Creek-Reno 230 4.25 3Φ Donkey Creek Donkey Creek-Wyodak 230 4.25 3Φ Dryfork Dry Fork-Carr Draw 230 4.25 3Φ Dryfork Dry Fork Plant 3.5 3Φ Dryfork Dry Fork-Hughes 230 4.25 3Φ Dryfork Dry Fork-Tongue River 230 4.25 3Φ South Rapid City South Rapid City-Westhill 230 4.25 3Φ Reno Reno-Donkey Creek 230 4.25 3Φ Windstar Windstar-P. Buttes 230 & Windstar-Teckla 230 5.0 3Φ Wyodak Wyodak-Carr Draw 230 4.25 3Φ Wyodak Wyodak-Donkey Creek 230 4.25 3Φ Wyodak Wyodak-Hughes 230 4.25 3Φ Wyodak Wyodak-Osage 230 4.25 3Φ Wyodak Wyodak Plant 4.25 3Φ Osage Osage-Lange 230 + RCDC Tie Block 5.0+2.0 3Φ Wyodak Wyodak-Osage 230 + RCDC Tie Block 5.0+2.0 3Φ Lookout Lookout-Hughes 230 + RCDC Tie 5.0+2.0 3Φ Lange Lange-South Rapid City 230 + RCDC Tie Block 5.0+2.0
3.3.1. 2018HS Transient Stability Results Post-contingent frequency criteria violations occurred at the Wygen1-3, NSS CT 1-2 and NSS2 13.8 kV terminal buses following 3-phase N-1 faults at the Wyodak or Donkey Creek 230 kV buses. The worst-case contingencies also had the potential to cause frequency dips below 59.6 Hz at the Wyodak, Gillette, Gillette_S, NSS1, and NSS2 69 kV buses, but the most critical frequency dips remained at the generation terminal buses. The worst-case frequency dip for the 2018HS scenario occurred at the NSS2 13.8 kV bus following a 3-phase fault at the Wyodak 230 kV bus and the loss of the Wyodak-Osage 230 kV line. The frequency reached a minimum of 59.3 HZ and remained below the 59.6 HZ threshold for 13.9 cycles. With the exception of the single issue mentioned above, all dynamic simulations resulted in acceptable results for each evaluated study scenario. There were no additional post-contingent voltage or frequency criteria violations, and all system oscillations were adequately damped. 3.3.2. 2018LA Transient Stability Results The 2018LA results were consistent with the 2018HS results, with the exception of the worst-case frequency dip remaining below the 59.6 HZ threshold for 13.8 cycles instead of 13.9 cycles.

_________________________________________________________________________________________________________________ Common Use System: Transmission Coordination and Planning Committee 2013 Local Transmission Plan December 19, 2013
18
With the exception of the single issue mentioned above, all dynamic simulations resulted in acceptable results for each evaluated study scenario. There were no additional post-contingent voltage or frequency criteria violations, and all system oscillations were adequately damped. 3.4. Results Summary All evaluated scenarios confirmed a known issue of N-1 frequency dips below the 59.6 HZ threshold for a period longer than 6 cycles at generator terminal buses in the Wyodak area. This issue has been discussed with the affected parties, and they understand there is no risk of under-frequency load shedding action related to the phenomenon. It is fully expected that an exemption to the Regional Business Practice will be finalized and adopted in the near future. The exemption will be crafted to accommodate the system performance through the 10-year planning horizon without impacting existing protection settings in the affected area. The addition of the St. Onge 230/69 kV substation project showed real benefits in the 2018HS scenario by avoiding N-1-1 overloads on the Lookout and Yellow Creek 230/69 kV transformers. The addition of a second transformer at the Yellow Creek 230/69 kV substation also proved to be effective in mitigating the N-1-1 overloads on the Lookout and Yellow Creek 230/69 kV transformers. The second Yellowcreek transformer would also provide the benefit of significant cost savings over the St. Onge substation option. For that reason, the Yellow Creek transformer was selected as the preferred option for implementation by 2018. Loading on the 100 MVA Lange 230/69 kV transformer was also identified as an issue. The overload was mitigated by dispatching Rapid City gas-fired generation, assuming Ben French was unavailable. It is suggested that Rapid City load growth is monitored closely and the 100 MVA transformer be replaced with at least a 150 MVA unit in the event of a failure of the existing unit, or as load growth requires. The Wyodak 230/69 kV transformer exceeded the 100 MVA continuous rating by 17% following the N-1-1 loss of the other 100 MVA transformer and the NSS2 plant in the 2018HS scenario. All available gas-fired NSS CT generation was online, so there were no immediate measures to reduce loading other than demand reduction. The load growth on the Wyodak 69 kV system should be monitored closely to better define the critical time frame for mitigation options. Items for future evaluation include a demand reduction plan for the critical contingency as well as increased transformation capacity into the area. A dedicated study will be performed in 2014 to address these concerns. The addition of the Bill Durfee 230/69 kV Substation interconnection was included in this study as sensitivity. The projected in-service date for this project is year-end 2014. This substation addition had no negative impacts to the local transmission system. 4. Transmission System Expansion
4.1. Previously Identified/Existing Projects
_________________________________________________________________________________________________________________ Common Use System: Transmission Coordination and Planning Committee 2013 Local Transmission Plan December 19, 2013
19
The following projects have been previously identified and are currently planned projects for the CUS 230 kV transmission or 69 kV sub-transmission system.
4.1.1. St. Onge 230/69 kV Substation (BHP) The St. Onge project has been replaced by the Yellow Creek 230/69 kV transformer project, and will no longer be included in the Local Transmission Plan. 4.1.2. Yellow Creek 230/69 kV 150 MVA Transformer (BHP) The addition of a Yellow Creek 150 MVA transformer is currently in the Strategic Plan for 2018. The estimated cost of the Yellow Creek transformer is $3,538,817 and will take approximately 18-24 months to complete. 4.1.3. Exemption from NERC/WECC Regional Business Practice (BHP/BEPC) CUS members and neighboring utilities are developing an agreement for an exemption from the WECC Disturbance-Performance Table (Table W-1) of Allowable Effects on Other Systems as it pertains to minimum frequency dips following a Category B event. The stated exemption will make current system performance acceptable and will nullify performance criteria violations. It is expected that the agreement will be enacted and submitted to WECC in 2014.
4.2. Recommended Projects The following transmission projects are recommended for possible future inclusion in the BHBE LTP. Further analysis of the expected load growth and completion of other system upgrades is necessary to confirm the need and expected in-service date of these projects.
4.2.1. Additional Wyodak-Area Transformation Capacity (BHP) The 2018HS scenario identified insufficient transformation capacity to serve the Wyodak-area 69 kV load following a single N-1-1 outage. The retirement of NSS1 has compounded this issue and should be addressed in the near term. Options for additional transformation capacity in the area are being considered and will be evaluated in 2014. 5. Conclusions
An open and transparent process was utilized in conducting the 2013 Local Transmission Plan study. Stakeholders were provided several opportunities for involvement and input into the study process and scope. Through this process, the TCPC participants believe they have fulfilled the requirements of Attachment K to the Joint Open Access Transmission Tariff (JOATT). A review of expected load growth and planned resource development should continue to be incorporated in the development of the next ten-year LTP. Solutions for the Wyodak area transformer overloads will need to be addressed through continued coordination with affected stakeholders in 2014. Possible solutions include more transformation capability in the area along with a temporary demand reduction plan for the critical contingency.
_________________________________________________________________________________________________________________ Common Use System: Transmission Coordination and Planning Committee 2013 Local Transmission Plan December 19, 2013
20
Also, the critical nature of the loss of a 230/69 kV transformer on the CUS system, in conjunction with the considerable lead time necessary to replace one, should instigate a discussion on the philosophy of maintaining a spare transformer. Note that the Bill Durfee 230/69 kV Substation was included as a sensitivity in this study. It was found not to have any negative impacts to the local transmission system. Assessment of the identified system enhancements will continue through additional transmission planning studies and the next TCPC study cycle. Active stakeholder involvement will be a key component as the process continues. This will ensure the CUS will effectively meet the long-term requirements for all transmission customers. Cascading and instability were not identified as valid issues in the 2013 TCPC analysis. All identified violations of NERC and WECC TPL criteria were accompanied by a suggested mitigation plan, including estimated cost and implementation schedule. It was determined that this analysis satisfied the requirement of the TPL-001 through 004 Standards for CUS transmission providers.

_________________________________________________________________________________________________________________ Common Use System: Transmission Coordination and Planning Committee 2013 Local Transmission Plan December 19, 2013
A-1
Appendix A
Prior and Forced Outage Lists
_________________________________________________________________________________________________________________ Common Use System: Transmission Coordination and Planning Committee 2013 Local Transmission Plan December 19, 2013
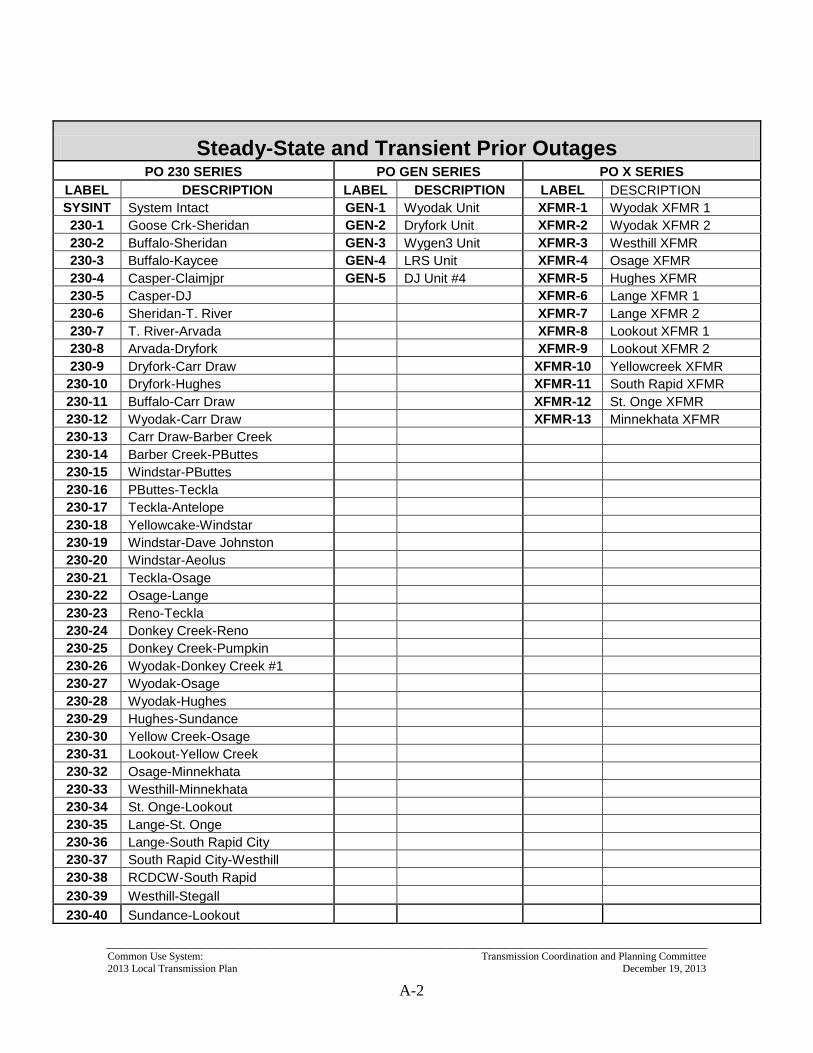
A-2
Steady-State and Transient Prior Outages PO 230 SERIES PO GEN SERIES PO X SERIES
LABEL DESCRIPTION LABEL DESCRIPTION LABEL DESCRIPTION SYSINT System Intact GEN-1 Wyodak Unit XFMR-1 Wyodak XFMR 1 230-1 Goose Crk-Sheridan GEN-2 Dryfork Unit XFMR-2 Wyodak XFMR 2 230-2 Buffalo-Sheridan GEN-3 Wygen3 Unit XFMR-3 Westhill XFMR 230-3 Buffalo-Kaycee GEN-4 LRS Unit XFMR-4 Osage XFMR 230-4 Casper-Claimjpr GEN-5 DJ Unit #4 XFMR-5 Hughes XFMR 230-5 Casper-DJ XFMR-6 Lange XFMR 1 230-6 Sheridan-T. River XFMR-7 Lange XFMR 2 230-7 T. River-Arvada XFMR-8 Lookout XFMR 1 230-8 Arvada-Dryfork XFMR-9 Lookout XFMR 2 230-9 Dryfork-Carr Draw XFMR-10 Yellowcreek XFMR
230-10 Dryfork-Hughes XFMR-11 South Rapid XFMR 230-11 Buffalo-Carr Draw XFMR-12 St. Onge XFMR 230-12 Wyodak-Carr Draw XFMR-13 Minnekhata XFMR 230-13 Carr Draw-Barber Creek 230-14 Barber Creek-PButtes 230-15 Windstar-PButtes 230-16 PButtes-Teckla 230-17 Teckla-Antelope 230-18 Yellowcake-Windstar 230-19 Windstar-Dave Johnston 230-20 Windstar-Aeolus 230-21 Teckla-Osage 230-22 Osage-Lange 230-23 Reno-Teckla 230-24 Donkey Creek-Reno 230-25 Donkey Creek-Pumpkin 230-26 Wyodak-Donkey Creek #1 230-27 Wyodak-Osage 230-28 Wyodak-Hughes 230-29 Hughes-Sundance 230-30 Yellow Creek-Osage 230-31 Lookout-Yellow Creek 230-32 Osage-Minnekhata 230-33 Westhill-Minnekhata 230-34 St. Onge-Lookout 230-35 Lange-St. Onge 230-36 Lange-South Rapid City 230-37 South Rapid City-Westhill 230-38 RCDCW-South Rapid 230-39 Westhill-Stegall 230-40 Sundance-Lookout
_________________________________________________________________________________________________________________ Common Use System: Transmission Coordination and Planning Committee 2013 Local Transmission Plan December 19, 2013
A-3
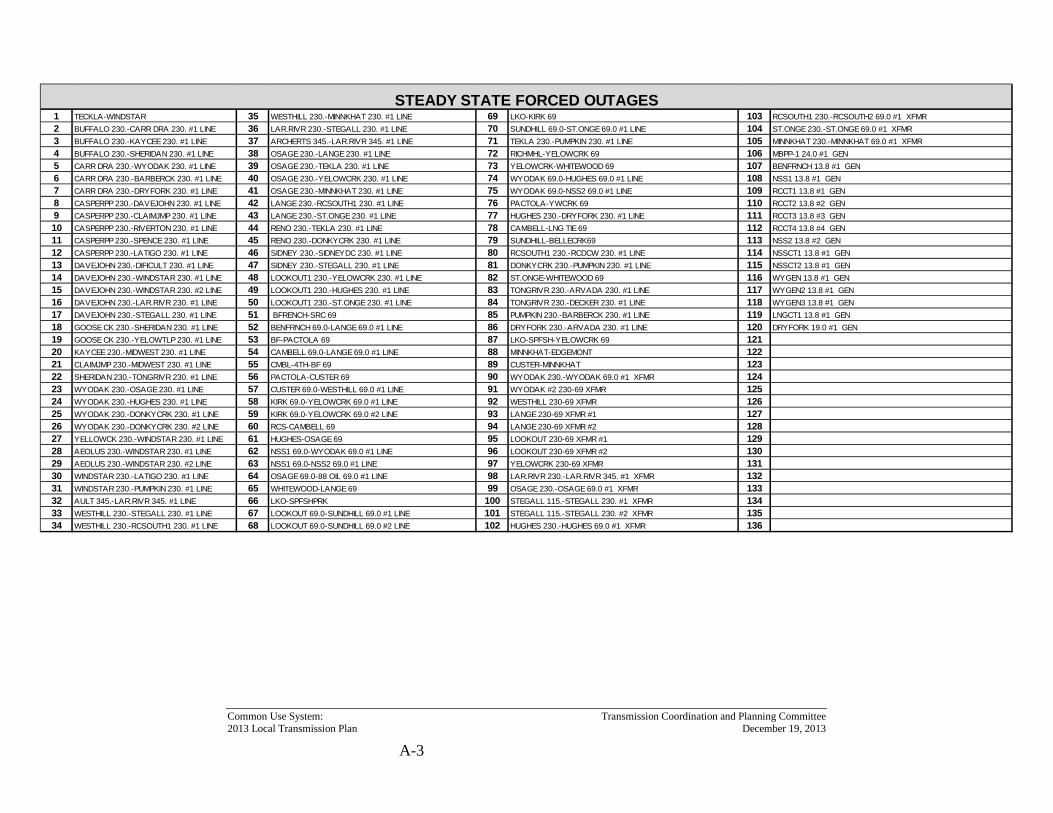
1 TECKLA-WINDSTAR 35 WESTHILL 230.-MINNKHAT 230. #1 LINE 69 LKO-KIRK 69 103 RCSOUTH1 230.-RCSOUTH2 69.0 #1 XFMR 2 BUFFALO 230.-CARR DRA 230. #1 LINE 36 LAR.RIVR 230.-STEGALL 230. #1 LINE 70 SUNDHILL 69.0-ST.ONGE 69.0 #1 LINE 104 ST.ONGE 230.-ST.ONGE 69.0 #1 XFMR 3 BUFFALO 230.-KAYCEE 230. #1 LINE 37 ARCHERTS 345.-LAR.RIVR 345. #1 LINE 71 TEKLA 230.-PUMPKIN 230. #1 LINE 105 MINNKHAT 230.-MINNKHAT 69.0 #1 XFMR 4 BUFFALO 230.-SHERIDAN 230. #1 LINE 38 OSAGE 230.-LANGE 230. #1 LINE 72 RICHMHL-YELOWCRK 69 106 MBPP-1 24.0 #1 GEN 5 CARR DRA 230.-WYODAK 230. #1 LINE 39 OSAGE 230.-TEKLA 230. #1 LINE 73 YELOWCRK-WHITEWOOD 69 107 BENFRNCH 13.8 #1 GEN 6 CARR DRA 230.-BARBERCK 230. #1 LINE 40 OSAGE 230.-YELOWCRK 230. #1 LINE 74 WYODAK 69.0-HUGHES 69.0 #1 LINE 108 NSS1 13.8 #1 GEN 7 CARR DRA 230.-DRYFORK 230. #1 LINE 41 OSAGE 230.-MINNKHAT 230. #1 LINE 75 WYODAK 69.0-NSS2 69.0 #1 LINE 109 RCCT1 13.8 #1 GEN 8 CASPERPP 230.-DAVEJOHN 230. #1 LINE 42 LANGE 230.-RCSOUTH1 230. #1 LINE 76 PACTOLA-YWCRK 69 110 RCCT2 13.8 #2 GEN 9 CASPERPP 230.-CLAIMJMP 230. #1 LINE 43 LANGE 230.-ST.ONGE 230. #1 LINE 77 HUGHES 230.-DRYFORK 230. #1 LINE 111 RCCT3 13.8 #3 GEN 10 CASPERPP 230.-RIVERTON 230. #1 LINE 44 RENO 230.-TEKLA 230. #1 LINE 78 CAMBELL-LNG TIE 69 112 RCCT4 13.8 #4 GEN 11 CASPERPP 230.-SPENCE 230. #1 LINE 45 RENO 230.-DONKYCRK 230. #1 LINE 79 SUNDHILL-BELLECRK69 113 NSS2 13.8 #2 GEN 12 CASPERPP 230.-LATIGO 230. #1 LINE 46 SIDNEY 230.-SIDNEYDC 230. #1 LINE 80 RCSOUTH1 230.-RCDCW 230. #1 LINE 114 NSSCT1 13.8 #1 GEN 13 DAVEJOHN 230.-DIFICULT 230. #1 LINE 47 SIDNEY 230.-STEGALL 230. #1 LINE 81 DONKYCRK 230.-PUMPKIN 230. #1 LINE 115 NSSCT2 13.8 #1 GEN 14 DAVEJOHN 230.-WINDSTAR 230. #1 LINE 48 LOOKOUT1 230.-YELOWCRK 230. #1 LINE 82 ST.ONGE-WHITEWOOD 69 116 WYGEN 13.8 #1 GEN 15 DAVEJOHN 230.-WINDSTAR 230. #2 LINE 49 LOOKOUT1 230.-HUGHES 230. #1 LINE 83 TONGRIVR 230.-ARVADA 230. #1 LINE 117 WYGEN2 13.8 #1 GEN 16 DAVEJOHN 230.-LAR.RIVR 230. #1 LINE 50 LOOKOUT1 230.-ST.ONGE 230. #1 LINE 84 TONGRIVR 230.-DECKER 230. #1 LINE 118 WYGEN3 13.8 #1 GEN 17 DAVEJOHN 230.-STEGALL 230. #1 LINE 51 BFRENCH-SRC 69 85 PUMPKIN 230.-BARBERCK 230. #1 LINE 119 LNGCT1 13.8 #1 GEN 18 GOOSE CK 230.-SHERIDAN 230. #1 LINE 52 BENFRNCH 69.0-LANGE 69.0 #1 LINE 86 DRYFORK 230.-ARVADA 230. #1 LINE 120 DRYFORK 19.0 #1 GEN 19 GOOSE CK 230.-YELOWTLP 230. #1 LINE 53 BF-PACTOLA 69 87 LKO-SPFSH-YELOWCRK 69 12120 KAYCEE 230.-MIDWEST 230. #1 LINE 54 CAMBELL 69.0-LANGE 69.0 #1 LINE 88 MINNKHAT-EDGEMONT 12221 CLAIMJMP 230.-MIDWEST 230. #1 LINE 55 CMBL-4TH-BF 69 89 CUSTER-MINNKHAT 12322 SHERIDAN 230.-TONGRIVR 230. #1 LINE 56 PACTOLA-CUSTER 69 90 WYODAK 230.-WYODAK 69.0 #1 XFMR 12423 WYODAK 230.-OSAGE 230. #1 LINE 57 CUSTER 69.0-WESTHILL 69.0 #1 LINE 91 WYODAK #2 230-69 XFMR 12524 WYODAK 230.-HUGHES 230. #1 LINE 58 KIRK 69.0-YELOWCRK 69.0 #1 LINE 92 WESTHILL 230-69 XFMR 126 25 WYODAK 230.-DONKYCRK 230. #1 LINE 59 KIRK 69.0-YELOWCRK 69.0 #2 LINE 93 LANGE 230-69 XFMR #1 127 26 WYODAK 230.-DONKYCRK 230. #2 LINE 60 RCS-CAMBELL 69 94 LANGE 230-69 XFMR #2 128 27 YELLOWCK 230.-WINDSTAR 230. #1 LINE 61 HUGHES-OSAGE 69 95 LOOKOUT 230-69 XFMR #1 12928 AEOLUS 230.-WINDSTAR 230. #1 LINE 62 NSS1 69.0-WYODAK 69.0 #1 LINE 96 LOOKOUT 230-69 XFMR #2 13029 AEOLUS 230.-WINDSTAR 230. #2 LINE 63 NSS1 69.0-NSS2 69.0 #1 LINE 97 YELOWCRK 230-69 XFMR 131 30 WINDSTAR 230.-LATIGO 230. #1 LINE 64 OSAGE 69.0-88 OIL 69.0 #1 LINE 98 LAR.RIVR 230.-LAR.RIVR 345. #1 XFMR 13231 WINDSTAR 230.-PUMPKIN 230. #1 LINE 65 WHITEWOOD-LANGE 69 99 OSAGE 230.-OSAGE 69.0 #1 XFMR 13332 AULT 345.-LAR.RIVR 345. #1 LINE 66 LKO-SPFSHPRK 100 STEGALL 115.-STEGALL 230. #1 XFMR 13433 WESTHILL 230.-STEGALL 230. #1 LINE 67 LOOKOUT 69.0-SUNDHILL 69.0 #1 LINE 101 STEGALL 115.-STEGALL 230. #2 XFMR 13534 WESTHILL 230.-RCSOUTH1 230. #1 LINE 68 LOOKOUT 69.0-SUNDHILL 69.0 #2 LINE 102 HUGHES 230.-HUGHES 69.0 #1 XFMR 136
STEADY STATE FORCED OUTAGES

_________________________________________________________________________________________________________________ Common Use System: Transmission Coordination and Planning Committee 2013 Local Transmission Plan December 19, 2013
B-1
Appendix B
Load and Resource Assumptions

_________________________________________________________________________________________________________________ Common Use System: Transmission Coordination and Planning Committee 2013 Local Transmission Plan December 19, 2013
B-2
Table B1: Load and Resource Assumptions
BUS # GENERATOR NAME GENERATOR OUTPUT (MW)
2018HS 2018LA 2023LW 2024HS 66730 WYODAK 377 377 377 377 73285 BENFRNCH 0 0 0 0 73288 NSS1 0 0 0 0 73289 RCCT1 0 0 0 0 73291 RCCT2 0 0 0 0 73292 RCCT3 0 0 0 0 73293 RCCT4 0 0 0 0 73321 OSAGE1 0 0 0 0 73322 OSAGE2 0 0 0 0 73323 OSAGE3 0 0 0 0 73341 NSS2 91 80 90 93 73520 BFDIESEL 0 0 0 0 74014 NSS_CT1 0 0 0 12 74015 NSS_CT2 0 0 0 12 74016 WYGEN 91 80 90 93 74017 WYGEN2 100 85 91 100 74018 WYGEN3 110 92 93 110 74029 LNG_CT1 0 0 0 0 74060 CPGSTN 42 0 42 42 76301 ARVADA1 5 5 6 5 76302 ARVADA2 5 5 6 5 76303 ARVADA3 5 5 6 5 76305 BARBERC1 5 5 6 5 76306 BARBERC2 5 5 6 5 76307 BARBERC3 5 5 6 5 76309 HARTZOG1 5 5 6 5 76310 HARTZOG2 5 5 6 5 76311 HARTZOG3 5 5 6 5 76404 DRYFORK 376 376 376 376 76502 SPFSHPRK 0 0 0 0
TOTAL CUS GENERATION: 1232 1135 1213 1260
TOTAL CUS LOAD + LOSSES: 1061 961 1116 1108