issn: 1061-8600 (print) 1537-2715 (online) journal
TRANSCRIPT

Full Terms & Conditions of access and use can be found athttp://www.tandfonline.com/action/journalInformation?journalCode=ucgs20
Download by: [Carnegie Mellon University] Date: 16 May 2016, At: 10:19
Journal of Computational and Graphical Statistics
ISSN: 1061-8600 (Print) 1537-2715 (Online) Journal homepage: http://www.tandfonline.com/loi/ucgs20
Penalized Fast Subset Scanning
Skyler Speakman, Sriram Somanchi, Edward McFowland III & Daniel B. Neill
To cite this article: Skyler Speakman, Sriram Somanchi, Edward McFowland III & Daniel B. Neill(2016) Penalized Fast Subset Scanning, Journal of Computational and Graphical Statistics, 25:2,382-404, DOI: 10.1080/10618600.2015.1029578
To link to this article: http://dx.doi.org/10.1080/10618600.2015.1029578
Accepted author version posted online: 18Apr 2015.Published online: 10 May 2016.
Submit your article to this journal
Article views: 57
View related articles
View Crossmark data

Penalized Fast Subset Scanning
Skyler SPEAKMAN, Sriram SOMANCHI, Edward MCFOWLAND III,and Daniel B. NEILL
We present the penalized fast subset scan (PFSS), a new and general frameworkfor scalable and accurate pattern detection. PFSS enables exact and efficient identifica-tion of the most anomalous subsets of the data, as measured by a likelihood ratio scanstatistic. However, PFSS also allows incorporation of prior information about each dataelement’s probability of inclusion, which was not previously possible within the subsetscan framework. PFSS builds on two main results: first, we prove that a large classof likelihood ratio statistics satisfy a property that allows additional, element-specificpenalty terms to be included while maintaining efficient computation. Second, we provethat the penalized statistic can be maximized exactly by evaluating only O(N) subsets.As a concrete example of the PFSS framework, we incorporate “soft” constraints onspatial proximity into the spatial event detection task, enabling more accurate detec-tion of irregularly shaped spatial clusters of varying sparsity. To do so, we develop adistance-based penalty function that rewards spatial compactness and penalizes spa-tially dispersed clusters. This approach was evaluated on the task of detecting simulatedanthrax bio-attacks, using real-world Emergency Department data from a major U.S.city. PFSS demonstrated increased detection power and spatial accuracy as comparedto competing methods while maintaining efficient computation.
Key Words: Disease surveillance; Likelihood ratio statistic; Pattern detection; Scanstatistic.
1. INTRODUCTION
Detecting patterns in massive datasets has multiple real-world applications in fieldssuch as public health, law enforcement, and security. For example, spatial scan statistics arecommonly used to alert public health officials to an unexpected increase in the number ofEmergency Department complaints from patients in some spatial region (i.e., set of nearbyzip codes), which may indicate the early stages of an emerging disease outbreak or attack.
In this work, we consider the “subset scan” approach to pattern detection, which treats theproblem as a constrained search over subsets of data elements, with the goal of finding themost anomalous subsets. Unlike “bottom-up” approaches that find and aggregate individual
Skyler Speakman (E-mail: [email protected]), Sriram Somanchi (E-mail: [email protected]),Edward McFowland III (E-mail: [email protected]), and Daniel B. Neill (E-mail: [email protected]), AssociateProfessor and Director, Event and Pattern Detection Laboratory, Carnegie Mellon University, Pittsburgh, PA 15213.
C© 2016 American Statistical Association, Institute of Mathematical Statistics,and Interface Foundation of North America
Journal of Computational and Graphical Statistics, Volume 25, Number 2, Pages 382–404DOI: 10.1080/10618600.2015.1029578Color versions of one or more of the figures in the article can be found online at www.tandfonline.com/r/jcgs.
382
Dow
nloa
ded
by [
Car
negi
e M
ello
n U
nive
rsity
] at
10:
19 1
6 M
ay 2
016
PENALIZED FAST SUBSET SCANNING 383
anomalies, and “top-down” approaches that detect globally anomalous trends and thenlocalize them, subset scanning approaches maintain high detection power for both highlylocalized and global trends (Neill 2009b, 2012). However, subset scanning approachespose two main challenges. First is appropriately evaluating the “anomalousness” of a givensubset, and second is the computational issue of searching through the 2N possible subsetsof a dataset containing N elements. Previous approaches (Kulldorff 1997; Neill et al. 2005;Neill 2009b, 2012) have addressed the first concern by “scoring” each subset using a log-likelihood ratio statistic, such as the expectation-based scan statistics (Neill et al. 2005;Neill 2009b) considered here.
For spatial data, the computational challenge of subset scanning has been addressed inseveral ways: limiting the search space to only consider regions of a given shape, such ascircles (Kulldorff 1997) or rectangles (Neill and Moore 2004; Wu et al. 2009), or perform-ing a heuristic search over subsets, which is not guaranteed to find the most anomaloussubsets (Duczmal and Assuncao 2004; Agarwal et al. 2006). Such approaches enable ef-ficient computation at the expense of reduced detection power and spatial accuracy (Neill2012). The fast subset scan (FSS) approach (Neill 2012) resolves these computationalchallenges through exact and efficient identification of the highest-scoring subset, for anyscore function satisfying the linear-time subset scanning (LTSS) property. However, ratherthan performing an unconstrained search over all possible subsets of the data, we oftenwish to incorporate either “hard constraints” (ruling out some subsets completely) or “softconstraints” (penalizing less likely subsets) into the search procedure.
Certain types of hard constraints are possible to incorporate within the FSS framework:for example, the “fast localized scan” (Neill 2012) enforces a hard constraint on spatialproximity by performing a search over the “local neighborhood” consisting of each spatiallocation and its k − 1 nearest neighbors. Similarly, GraphScan (Speakman, McFowland,and Neill 2015) incorporates hard connectivity constraints by ruling out subsets that aredisconnected in an assumed underlying graph structure. However, soft constraints (e.g., aprior belief that some locations are more likely to be affected) cannot be easily incorporated.Given a score function satisfying the LTSS property, a penalized version of that scorefunction is not guaranteed to satisfy LTSS, and thus FSS cannot efficiently identify thehighest-scoring penalized subset. An example is provided in Section 4.
In this work, we introduce and formalize a new property of scoring functions, Additivelinear-time subset scanning (ALTSS), which allows incorporation of prior informationabout each data element’s probability of inclusion. We demonstrate that many commonlyused log-likelihood ratio scan statistics satisfy the ALTSS property. Thus, we show that thepenalized version of these statistics (where we have included each element’s prior log-oddsof being part of an anomalous subset as a bonus or penalty for including that element)can be exactly and efficiently optimized over all subsets of the data, without requiring anexhaustive search over all subsets.
We highlight three contributions in this work that follow from the ALTSS property. Thefirst is the penalized fast subset scan (PFSS) framework laid out in Section 3. PFSS isvery general, enabling any element-specific priors to be incorporated into the search oversubsets while maintaining computational efficiency and exactness. Our second contributionis an investigation of the connections between ALTSS and the LTSS property (Neill 2012).
Dow
nloa
ded
by [
Car
negi
e M
ello
n U
nive
rsity
] at
10:
19 1
6 M
ay 2
016

384 S. SPEAKMAN ET AL.
More specifically, we show that scoring functions in the form of expectation-based scanstatistics from the exponential family satisfy LTSS. This contribution extends LTSS, whichwas previously limited to the “separable” subfamily of the exponential family. Expectation-based scan statistics using the binomial and negative binomial distributions (which are notpart of the separable subfamily) may now be efficiently optimized in their penalized andunpenalized forms.
Our final contribution is a specific application of PFSS based on motivating examplesfrom the fields of bio-terrorism and disease surveillance. While the “fast localized scan”(subset scan with hard constraints on spatial proximity) has been shown to achieve highdetection power and spatial accuracy in this setting (Neill 2012), it does not take intoaccount the spatial attributes of the locations beyond the “hard” proximity constraint ofbeing one of the k − 1 nearest neighbors of a center location, and considers each of the2k subsets of the neighborhood equally likely.
Soft proximity constraints incorporate the prior expectation that locations closer to thecenter of an outbreak are more likely to be affected, thus rewarding spatial compactness andpenalizing spatially dispersed clusters. We demonstrate that this approach increases bothdetection power and spatial accuracy as compared to the fast localized scan. Additionally,while fast localized scan achieves high performance for well-chosen values of the neighbor-hood size k, it performs worse than the standard, circular spatial scan (Kulldorff 1997) forbadly chosen k. We demonstrate in Section 7 that incorporation of soft constraints enablesour penalized version of the fast localized scan to be much more robust to the choice ofk, while still guaranteeing that the most anomalous penalized subset of locations will beexactly and efficiently identified. This robustness to parameter selection is critical whena limited number of labeled training examples exist or when a public health surveillancesystem must be able to detect a wide range of possible outbreak types.
1.1 EXPECTATION-BASED SCAN STATISTICS
We now review the use of expectation-based scan statistics (Neill et al. 2005) for spatialevent detection. In the subset scanning framework, our goal is to identify a subset of the dataS ⊆ D that maximizes a score function F (S). In the spatial event detection setting consid-ered here, the dataset D consists of spatial time series data: observed counts xi and expectedcounts μi at a set of spatial locations si (i = 1, . . . , N ) and possibly other parameters, suchas the standard deviations σi . Likelihood ratio statistics have been commonly used as scorefunctions (Kulldorff 1997; Neill et al. 2005). The log-likelihood ratio statistic is defined asF (S) = log (Pr(D |H1(S))/Pr(D |H0)), where the alternative hypothesis H1(S) assumesan event occurring in region S ⊆ {s1, s2, . . . , sN } and the null hypothesis H0 assumes thatno events are occurring. For the expectation-based scan statistics, the alternative hypothesisH1(S) assumes that counts xi are drawn with mean qμi inside region S and mean μi out-side region S, for some constant multiplicative factor q > 1 known as the relative risk orseverity. We can then write the expectation-based scan statistic as
F (S) = maxq>1
∑si∈S
(log Pr(xi | qμi)− log Pr(xi | μi)) . (1)
Dow
nloa
ded
by [
Car
negi
e M
ello
n U
nive
rsity
] at
10:
19 1
6 M
ay 2
016

PENALIZED FAST SUBSET SCANNING 385
A pivotal insight of our work is that for a fixed value of the relative risk q, the expectation-based scan statistics from the exponential family can be written as an additive set functionover the data elements si contained in S. This insight leads to three useful consequences.First, additional penalty terms may be added at the element level (i.e., a bonus or penalty�i for each element si) and the resulting penalized function will still be additive. Second,the highest scoring penalized subset can be efficiently identified by selecting only thosedata elements si making a positive contribution to the penalized scoring function. Finally,we show in Section 3.2 that only a small number of values of q must be considered, thusleading to efficient optimization of (penalized or unpenalized) score functions F (S) overall q > 1.
Kulldorff’s spatial scan statistic (Kulldorff 1997) is also a scoring function based onlikelihood ratio statistics, but it is not an expectation-based scan statistic. Kulldorff’s statisticrequires two parameters under the alternative hypothesis, qin and qout, which represent themultiplicative increase in counts for locations inside and outside of S, respectively; in thiscase, F (S | qin, qout) can be written as an additive function. Neill (2009a) demonstratedthat Kulldorff’s statistic has low detection power for large outbreaks that cover much ofthe search region, since qin ≈ qout for all S and no subset appears particularly anomalous.Expectation-based scan statistics use only data from within S and therefore represent a morenatural model when identifying locations with higher activity than expected. The expectedcounts μi for expectation-based scan statistics can be derived from a variety of time seriesforecasting methods, including simple moving averages or more complex functions thatadjust for seasonal and day-of-week trends (Burkom, Murphy, and Shmueli 2007).
We note that the assumptions of conditionally independent counts and a constant, multi-plicative risk q are standard in the spatial scan literature (Kulldorff 1997). The assumptionof constant risk q, estimated by maximum likelihood, is preferable to the alternative ofestimating risks qi independently for each location. The latter approach tends to overfit thenoise in the data, since any locations with xi even slightly larger than μi would make apositive contribution to the score function and would be included in the highest-scoringsubset.
2. THE ADDITIVE LINEAR TIME SUBSETSCANNING PROPERTY
We now define the ALTSS property. Informally, a score function F (S) satisfies ALTSSif conditioning on the relative risk q allows the function to be written as an additive setfunction over the data elements si contained in S.
Definition 1. For a given dataset D, the score function F (S) satisfies the ALTSS propertyif for all subsets S ⊆ D, we have F (S) = maxq>1 F (S | q), where F (S | q) =∑
si∈S λi(q),and λi(q) depends only on the given value of q, the observed count xi , and expected countμi (and in some cases standard deviation σi) for element si .
Theorem 1. Expectation-based scan statistics from the (single parameter) exponentialfamily satisfy the ALTSS property.
Dow
nloa
ded
by [
Car
negi
e M
ello
n U
nive
rsity
] at
10:
19 1
6 M
ay 2
016

386 S. SPEAKMAN ET AL.
Table 1. Derivation of λi (q) for expectation-based scan statistics in the exponential family
Distribution θ (qμi ) φ(qμi ) λi (q)
Poisson log(qμi ) qμi log(qμi )− qμi xi log q + μi (1− q)
Gaussian qμi
σ 2i
(qμi )2
2σ 2i
xiμi(q−1)σ 2i
+ μ2i
(1−q2
2σ 2i
)
Exponential − 1qμi
− log(qμi )xiμi
(1− 1q
)− log q
Binomial log(
qμini−qμi
)qμi log
(qμi
ni−qμi)+ ni log(ni − qμi ) xi log(q)+ (ni − xi ) log
(ni−qμini−μi
)
Negativebinomial
log(
qμiri+qμi
)qμi log
(qμi
ri+qμi)− ri log(ri + qμi ) xi log (q)+ (ri + xi ) log
(ri+μiri+qμi
)
Proof of Theorem 1. Following the notation in Neill (2012), we write the distribu-tions from the exponential family as log Pr(x | μ) = T (x)θ (μ)− ψ(θ (μ)) = T (x)θ (μ)−μθ (μ)+ φ(μ), where T (x) is the sufficient statistic, θ (μ) is a function mapping the meanμ to the natural parameter θ , ψ is the log-partition function, and φ is the convex conjugateof ψ . Plugging this form of the exponential family into (1) gives
F (S) = maxq>1
∑si∈S
(T (xi) (θ (qμi)− θ (μi))+ μiθ (μi)− qμiθ (qμi)
+ φ(qμi)− φ(μi)) . (2)
Let λi(q) = T (xi) (θ (qμi)− θ (μi))+ μiθ (μi)− qμiθ (qμi)+ φ(qμi)− φ(μi) and thenF (S) satisfies the ALTSS property.
Table 1 summarizes the derivation of λi(q) for the expectation-based scan statistics fromseveral distributions in the exponential family.
An important consequence of scoring functions being written as additive functionsover the data elements contained in the subset is that additional bonus or penaltyterms �i may be included for each data element si while maintaining the additiveproperty.
Corollary 1. Given a scoring function F (S) that satisfies the ALTSS property,assume an additive bonus or penalty �i for each si ∈ S. The resulting penalized scorefunction,Fpen(S) = F (S)+∑
si∈S �i , also satisfies ALTSS.
Proof of Corollary 1.
Fpen(S) = F (S)+∑si∈S
�i
= maxq>1
F (S | q)+∑si∈S
�i
Dow
nloa
ded
by [
Car
negi
e M
ello
n U
nive
rsity
] at
10:
19 1
6 M
ay 2
016

PENALIZED FAST SUBSET SCANNING 387
= maxq>1
∑si∈S
(λi(q)+�i)
= maxq>1
∑si∈S
γi(q),
where γi(q) = λi(q)+�i is referred to as the total contribution of data element si to thepenalized scoring function for a fixed risk q.
The �i terms are a function of the given data element si ; they cannot depend on thesubset S. We plan to investigate more sophisticated penalties in future work.
A second important consequence of scoring functions being written as additive functionsis that the highest scoring subset for a fixed risk q can be easily identified.
Corollary 2. For a fixed risk q, functions satisfying ALTSS can be efficiently optimizedover all subsets S ⊆ D by including all and only those data elements making a positivecontribution to the scoring function, that is, si ∈ arg maxS⊆D F (S | q) if and only if γi(q) =λi(q)+�i > 0.
The proof of Corollary 2 follows immediately from the fact that F (S | q) =∑si∈S γi(q).
3. PENALIZED FAST SUBSET SCANNING
Penalized fast subset scanning (PFSS) is a novel method for scalable and accuratepattern detection, which uses the ALTSS property of commonly used scoring functionsto incorporate prior information for each data element. This is in contrast to the FSSmethod (Neill 2012), which does not allow for additional terms to influence the subset’sscore and therefore considers each element equally likely to be included in the highestscoring unpenalized subset. The first half of this section focuses on how the additional,element-specific terms are interpreted in the PFSS framework and the second half explainshow the penalized scoring function may be exactly and efficiently optimized over allpossible subsets.
3.1 PRIOR LOG-ODDS INTERPRETATION OF PENALTIES �i
We first show that the penalty terms �i can be usefully interpreted as the prior log-odds that each data record si is affected. Let us assume a simple generative modelwhere some subset of records Strue ⊆ {s1, s2, . . . , sN } is affected, and each si is inde-pendently chosen to be included in Strue with prior probability pi . We now considerthe penalized score function Fpen(S) = F (S)+∑
si∈S �i , where the log-likelihood ratioF (S) = log (Pr(D |H1(S))/Pr(D |H0)) and �i = log (pi/(1− pi)) . Given the priors pi ,we show that this choice of �i satisfies two useful properties: the highest-scoring penal-ized subset S∗ = arg maxS Fpen(S) minimizes the total probability of error, and is also amaximum a posteriori (MAP) estimate of the true affected subset Strue.
First, when comparing the detected subset S∗ and the true affected subset Strue, we wishto minimize both the probability of incorrectly including extra records (Type I error) and
Dow
nloa
ded
by [
Car
negi
e M
ello
n U
nive
rsity
] at
10:
19 1
6 M
ay 2
016

388 S. SPEAKMAN ET AL.
the probability of failing to detect truly affected records (Type II error). We show that thechoice of �i = log (pi/(1− pi)) minimizes the sum of these two probabilities.
Theorem 2. Let �i = log (pi/(1− pi)), where pi is the prior probability that recordsi ∈ Strue. This choice of�i minimizes the sum of the Type I and Type II error probabilitieswhen comparing S∗ = arg maxS Fpen(S) and Strue.
The proof of Theorem 2 is in the Appendix. Next, we show that S∗ =arg maxS Fpen(S) may be interpreted as the MAP estimate of Strue.
Theorem 3. Let �i = log (pi/(1− pi)), where pi is the prior probability that recordsi ∈ Strue. This choice of �i makes S∗ = arg maxS Fpen(S) the MAP estimate of the trueaffected subset Strue.
Proof of Theorem 3.
log Pr(H1(S) |D) ∝ log Pr(D |H1(S))+ log Pr(H1(S))
∝ F (S)+ log
⎛⎝∏si∈S
pi∏si /∈S
(1− pi)⎞⎠
= F (S)+∑si∈S
(logpi − log(1− pi))+N∑i=1
log(1− pi)
= F (S)+∑si∈S
�i −N∑i=1
log(1+ exp(�i))
∝ F (S)+∑si∈S
�i,
where terms independent of S have been ignored. Thus, choosing the subset S∗ that maxi-mizes Fpen(S) = F (S)+∑
si∈S �i also maximizes the posterior probability ofH1(S) mak-ing S∗ the MAP estimate of Strue.
This Bayesian interpretation of the penalized maximum likelihood estimate should notbe confused with the Bayesian and multivariate Bayesian scan statistics (Neill, Moore, andCooper 2006; Neill and Cooper 2010), which calculate marginal likelihoods and computethe total posterior probability that each subset S has been affected. The Bayesian scanframework in previous work is limited to Gamma-Poisson count data and cannot be easilygeneralized to other settings.
3.2 EFFICIENT OPTIMIZATION OF THE PENALIZED SCORE FUNCTION
We now consider how the optimal penalized subset S∗ = arg maxS⊆D Fpen(S) can beefficiently computed. As noted above in Corollary 2, for a given value of the relative riskq, Fpen(S | q) can be efficiently optimized over subsets by including all and only those dataelements making a positive contribution to the penalized scoring function, that is, those
Dow
nloa
ded
by [
Car
negi
e M
ello
n U
nive
rsity
] at
10:
19 1
6 M
ay 2
016

PENALIZED FAST SUBSET SCANNING 389
data elements with γi(q) = λi(q)+�i > 0. We now show that only linearly rather thanexponentially many values of q must be considered.
Theorem 4. The optimal subset S∗ = arg maxS Fpen(S) maximizing a penalizedexpectation-based scan statistic from the exponential family may be found by evaluat-ing only O(N ) subsets, where N is the total number of data elements.
Proof of Theorem 4. Let γi(q) = λi(q)+�i as defined above, and assume that all�i are independent of q. The first derivative γ ′i (q) = λ′i(q) = μi[T (xi)− qμi]θ ′(qμi) hasonly one zero, obtained when q = T (xi)/μi (the maximum likelihood estimate). Thus,γi(q) has at most two zeros. More precisely, we must have either (a) there exists someqmini and qmax
i such that γi(qmini ) = γi(qmax
i ) = 0 and γi(q) > 0 for all qmini < q < qmax
i ,or (b) for all q, γi(q) ≤ 0. In the latter case, data element si will never be included in thehighest-scoring penalized subset. Critically, we must consider at most 2N distinct values ofq, since we consider the qmin
i and qmaxi for each si , i = 1, . . . , N . This property also holds
when restricting q > 1; see Figure 1 for an example using the penalized expectation-basedPoisson scan statistic. We now sort these values of q (eliminating any duplicate q values)and let I1, . . . , I2N be the disjoint intervals formed by consecutive values of the sorted q. Byconstruction, within each interval Ij , we have for each si that either γi(q) > 0 for all q ∈ Ij ,in which case including si will increase the penalized score for all values of q in this interval,or γi(q) < 0 for all q ∈ Ij , in which case including si will decrease the penalized score forall values of q in this interval. Also, we note that if q /∈⋃2N
j=1 Ij , then Fpen(S | q) ≤ 0 for
all S, and hence we only need to evaluate the best subset for q ∈⋃2Nj=1 Ij . We can write
S∗ = arg maxS maxq>1Fpen(S | q)
= arg maxS maxq∈⋃2Nj=1 Ij
Fpen(S | q)
= arg maxj∈{1,...,2N}Fpen(S∗j ),
Figure 1. A three-record example of forming the O(N ) intervals needed to evaluate Fpen(S | q). Throughoutinterval I1, records 1 and 2 are making positive contributions and would be included in S∗1 . S∗2 would includeall three records. S∗3 would include records 2 and 3, and S∗4 would include record 2 only. Further details:x1 = 130, μ1 = 110, �1 = 0; x2 = 26, μ2 = 20, �2 = 0.5; x3 = 40, μ3 = 30, �3 = −1. I1 = [1, 1.132], I2 =[1.132, 1.3844], I3 = [1.3844, 1.557], and I4 = [1.557, 1.760].
Dow
nloa
ded
by [
Car
negi
e M
ello
n U
nive
rsity
] at
10:
19 1
6 M
ay 2
016

390 S. SPEAKMAN ET AL.
where S∗j = arg maxS Fpen(S | q ∈ Ij ). We can construct these sets efficiently as follows:
S∗j = {si : γi(q) > 0 for all q ∈ Ij }.
Note that S∗j is the set of all elements that make positive contributions to the scoreFpen(S | q ∈ Ij ) through γi(q). Hence, S∗j is an optimal subset for any q ∈ Ij . Therefore,we need to evaluate onlyO(N ) subsets (one for each interval) to find the optimal penalizedsubset S∗.
4. RELATIONSHIP BETWEEN ALTSS AND LTSS
The LTSS property enables exact and efficient optimization of unpenalized scoringfunctions from the “separable” exponential family. Insights from the ALTSS propertyexpand on the LTSS property in two ways. First, we consider an alternative priority functionthat enables us to broaden the class of functions that satisfy LTSS to expectation-based scanstatistics from the entire exponential family. Second, our PFSS framework introduced inSection 3 enables exact and efficient optimization of both penalized and unpenalized scorefunctions, while LTSS applies only in the unpenalized case.
A function satisfies LTSS if and only if maxS⊆D F (S) = maxj=1,...,N F ({s(1), . . . ,
s(j )}) where s(j ) represents the jth highest priority data element according to a providedpriority function (Neill 2012). The highest scoring subset must be composed of the j highestpriority data elements for some priority function g(si) and some j between 1 and N. Neill(2012) defined a “separable” subfamily of the exponential family, including those distri-butions such as the Poisson, Gaussian, and exponential for which θ (qμi) can be expressedas ziθ0(q)+ vi , for zi and vi independent of q. He then proved that expectation-based scanstatistics from the separable exponential family satisfy LTSS with the priority functiong(si) = xi
μi. In other words, the highest scoring subset must consist of the j data elements
si with largest ratios of xi to μi , for some j between 1 and N. The ratio of observed countsto expected counts is also the maximum likelihood estimate of the relative risk q for theindividual record si . This is referred to as qmle
i .The binomial distribution, while part of the exponential family, is not included in the
separable exponential family. We show that the expectation-based binomial (EBB) scanstatistic cannot be efficiently optimized using the priority function qmle
i . EBB assumes thateach count xi is drawn from a binomial distribution Bin(ni, pi), with meanμi = nipi , underH0. See Table 1 for more details. Consider a dataset with three elements {s1, s2, s3}, where(x1, μ1, n1) = (1500, 300, 4000); (x2, μ2, n2) = (25, 8, 40); and (x3, μ3, n3) = (12, 4, 40).The priority function g(si) = xi
μi= qmle
i suggests {s1}, {s1, s2}, and {s1, s2, s3} as the threesubsets to evaluate. However, the subset that maximizes the EBB statistic is S∗ = {s1, s3},with F (S∗) ≈ 1437 at q = 4.97. We note that s2 would make a negative contribution to thescore for all q ≥ 4.7, so it is not included in S∗.
We now provide an alternative priority function that satisfies LTSS for unpenalizedscoring functions from the single-parameter exponential family including the binomial andnegative binomial distributions. Recall that for each record si there exists qmin
i and qmaxi such
Dow
nloa
ded
by [
Car
negi
e M
ello
n U
nive
rsity
] at
10:
19 1
6 M
ay 2
016

PENALIZED FAST SUBSET SCANNING 391
that λi(qmini ) = λi(qmax
i ) = 0. For unpenalized scoring functions (�i = 0), qmini = 1 for all
i, while qmaxi is a function of the observed count xi and expected count μi .
Theorem 5. Unpenalized expectation-based scan statistics from the single-parameterexponential family satisfy the LTSS property with priority function g(si) = qmax
i , whereqmaxi is the unique q > 1 such that λi(qmax
i ) = 0.
Proof of Theorem 5. We denote the jth highest priority record as s(j ) with s(1) as the highestpriority record and s(N) as the lowest. We write the priority of record s(j ) as g(s(j )) = qmax
(j ) .Assume that the jth priority record s(j ) is included in the optimal subset S∗. It sufficesto show that all higher priority records, s(1), . . . , s(j−1), must also be included in S∗. ByTheorem 1, we know that expectation-based scan statistics from the exponential familysatisfy ALTSS and may be written as additive functions over the data elements containedin the subset for a fixed risk q. By Corollary 2, we know that if s(j ) ∈ S∗ then there existsa fixed relative risk q∗, where q∗ = arg maxq>1 F (S | q), such that the jth highest priorityrecord is making a positive contribution at that risk, λ(j )(q∗) > 0. Furthermore, we haveqmin
(j ) = 1 < q∗ < qmax(j ) . Finally, consider any higher priority record s(h) and note that the
priority ordering implies qmax(h) > qmax
(j ) . It follows that s(h) must also have qmin(h) = 1 < q∗ <
qmax(h) , which implies λ(h)(q∗) > 0 and therefore s(h) ∈ S∗.
In summary, using priority function g(si) = qmaxi , we have shown that inclusion of the jth
highest priority record in the highest scoring subset necessitates the inclusion of all higherpriority records. Therefore, the optimal subset may be efficiently identified by sorting therecords based on qmax
i and evaluating only the N subsets of the form {s(1), . . . , s(j )} forj = 1, . . . , N . Figure 2 provides a visual comparison for the expectation-based Poisson(EBP) and binomial scoring functions and the two priority functions qmax
i and qmlei discussed
in this section.Theorem 5 shows a connection between LTSS and ALTSS for unpenalized scoring
functions. We now provide a penalized scoring function that satisfies ALTSS but notLTSS. Consider maximizing the expectation-based Poisson scoring function with a penaltyon subset size, Fpen(S) = FEBP(S)− |S|. The unpenalized EBP scoring function satisfiesthe LTSS property, but including the size penalty violates LTSS, preventing the efficientoptimization of the penalized scoring function over subsets of the data. Consider a datasetwith three elements: (x1, μ1) = (5, 2), (x2, μ2) = (68, 55), and (x3, μ3) = (68, 55). Notethat s1 is the optimal penalized subset of {s1, s2} so if Fpen(S) satisfies LTSS, s1 mustbe higher priority than s2. However, the highest scoring penalized subset of {s1, s2, s3} is{s2, s3}. This implies that s2 must be higher priority than s1, which is a contradiction. Thus,no priority function can exist for which Fpen(S) satisfies the LTSS property.
This penalized scoring function does satisfy ALTSS: F (S) = maxq>1∑
si∈S(λi(q)+�i), where λi(q) = xi log q + μi(1− q) from Table 1, and �i = −1 for all data elementssi , since
∑si∈S(−1) = −|S|. This enables us to efficiently maximize the penalized scoring
function in our new PFSS framework. Due to the �i penalty terms, we no longer haveqmini = 1 for all i. As shown in Theorem 3, this creates a partitioning over q instead of
a priority ordering over q. The partitioning creates at most 2N intervals over the rangeof q > 1, and for each interval we need only to consider the subset of records making
Dow
nloa
ded
by [
Car
negi
e M
ello
n U
nive
rsity
] at
10:
19 1
6 M
ay 2
016

392 S. SPEAKMAN ET AL.
Figure 2. The top panel provides a three-record example using the expectation-based Poisson scoring function,which is a member of the “separable” exponential family. In this setting, both priority functions g(si ) = qmle
i (in-troduced in Neill 2012) and g(si ) = qmax
i (introduced in this work) satisfy LTSS. Note the same ordering producedby either function. Further details: x1 = 8, μ1 = 6, qmle
1 = 1.33, qmax1 = 1.74; x2 = 35, μ2 = 28, qmle
2 = 1.25,qmax
2 = 1.54. x3 = 170,μ3 = 150, qmle3 = 1.133, qmax
3 = 1.28. The bottom panel provides a three-record examplefrom the expectation-based binomial scoring function, which is not a member of the “separable” exponential family.In this setting, the two priority functions result in different orderings. We prove in Theorem 5 that g(si ) = qmax
i isthe correct priority ordering to satisfy LTSS for expectation-based scan statistics formed by distributions from theentire exponential family. Further details: x1 = 40, n1 = 140, p1 = 0.075, qmle
1 = 3.81, qmax1 = 7.95; x2 = 125,
n2 = 190, p2 = 0.15, qmle2 = 4.39, qmax
2 = 6.51; x3 = 130, n3 = 155, p3 = 0.18, qmle3 = 4.66, qmax
3 = 5.555.
a positive contribution to the scoring function. These 2N subsets are the only ones thatmust be evaluated to identify the highest scoring penalized subset in the PFSS framework.This partitioning of q intervals rather than use of a priority function differentiates thecontributions from ALTSS in this work and LTSS in previous work. Table 2 summarizesthe comparison of LTSS and ALTSS.
5. PFSS WITH SOFT PROXIMITY CONSTRAINTS
The fast localized scan (Neill 2012) performs searches for each local neighborhood(center location sc and its k − 1 nearest neighbors), thus enforcing hard constraints onspatial proximity.
Dow
nloa
ded
by [
Car
negi
e M
ello
n U
nive
rsity
] at
10:
19 1
6 M
ay 2
016
PENALIZED FAST SUBSET SCANNING 393
Table 2. Summary of the LTSS and ALTSS comparisons
Scoring functions Priority functionNumber of subsets
to be evaluated Notes
Separable exponential familywith no penalty terms
(a) g(si ) = xiμi
or N (a) is from Neill 2012.(b) g(si ) = qmax
i (b) is proposed here.
Entire exponential family withno penalty terms
g(si ) = qmaxi N We expand the class of
scoring functionsthat satisfy LTSS.
Entire exponential family withpenalty terms
No priority functionsatisfies LTSS
2N We introduce ALTSSto efficientlyincorporate penaltyterms.
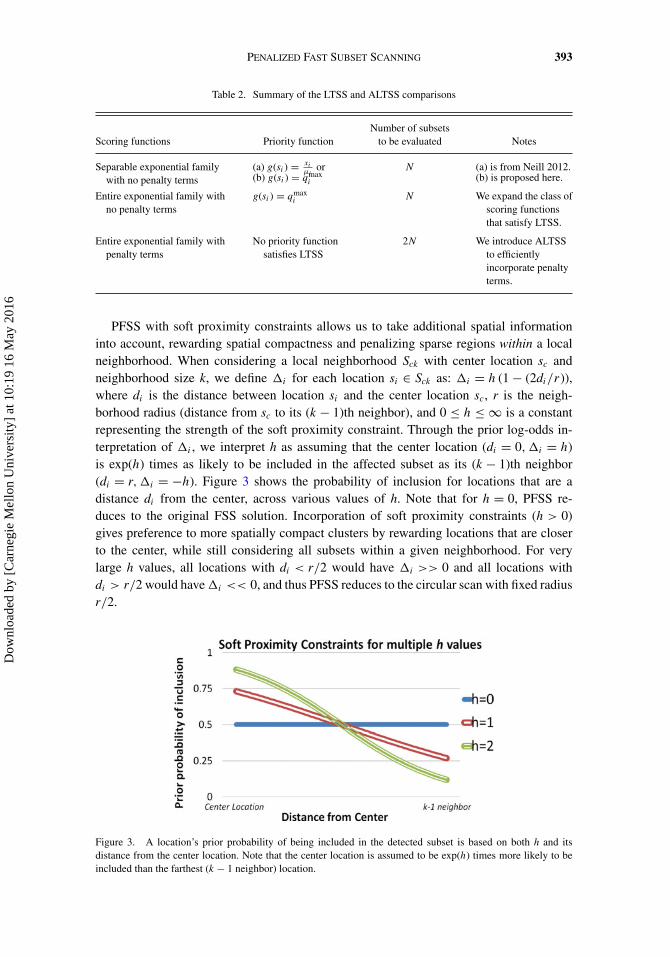
PFSS with soft proximity constraints allows us to take additional spatial informationinto account, rewarding spatial compactness and penalizing sparse regions within a localneighborhood. When considering a local neighborhood Sck with center location sc andneighborhood size k, we define �i for each location si ∈ Sck as: �i = h (1− (2di/r)),where di is the distance between location si and the center location sc, r is the neigh-borhood radius (distance from sc to its (k − 1)th neighbor), and 0 ≤ h ≤ ∞ is a constantrepresenting the strength of the soft proximity constraint. Through the prior log-odds in-terpretation of �i , we interpret h as assuming that the center location (di = 0,�i = h)is exp(h) times as likely to be included in the affected subset as its (k − 1)th neighbor(di = r,�i = −h). Figure 3 shows the probability of inclusion for locations that are adistance di from the center, across various values of h. Note that for h = 0, PFSS re-duces to the original FSS solution. Incorporation of soft proximity constraints (h > 0)gives preference to more spatially compact clusters by rewarding locations that are closerto the center, while still considering all subsets within a given neighborhood. For verylarge h values, all locations with di < r/2 would have �i >> 0 and all locations withdi > r/2 would have�i << 0, and thus PFSS reduces to the circular scan with fixed radiusr/2.
Figure 3. A location’s prior probability of being included in the detected subset is based on both h and itsdistance from the center location. Note that the center location is assumed to be exp(h) times more likely to beincluded than the farthest (k − 1 neighbor) location.
Dow
nloa
ded
by [
Car
negi
e M
ello
n U
nive
rsity
] at
10:
19 1
6 M
ay 2
016

394 S. SPEAKMAN ET AL.
The PFSS algorithm with soft proximity constraints (Algorithm 1) builds a localneighborhood of size k for each center location, then computes the penalties �i andmaximizes the penalized scoring function Fpen(S) for each neighborhood. Note thatwe are considering each location si , i = 1, . . . , N , as a possible center. To comparescores across different neighborhoods, we subtract the sum
∑si∈Sck log (1+ exp(�i)).
This insures that Fpen(S) is proportional to the log-posterior probability Pr(H1(S) |D),and thus we maintain the interpretation of S∗ = arg maxS Fpen(S) as a MAP estimate(Theorem 3).
Algorithm 1: Penalized Fast Subset Scanning with soft proximity constraints.
1: for c = 1, . . . , N do2: Let Sck be center location sc and its k − 1 nearest neighbors.3: for each si ∈ Sck do4: Compute �i , qmin
i , and qmaxi .
5: end for6: Q← sort and remove duplicates({qmin
1 , qmax1 , . . . , qmin
2k , qmax2k }).
7: If there exists any q ∈ Q such that q < 1, exclude all q < 1 and add q = 1 to Q.8: S ← {∅}.9: for j = 1, . . . , 2k do10: If Qj is a qmin
i , then S ← S ∪ {si}. If Qj is a qmaxi , then S ← S \ {si}.
11: Record Fpen(S) = F (S)+∑si∈S �i .
12: end for13: Subtract
∑si∈Sck log (1+ exp(�i)) from Fpen(S).
14: end for15: Output the optimal subset S∗ = arg maxS Fpen(S).
We conclude this section with a complexity analysis for PFSS. To find the optimal subsetfor a given neighborhood, we sort the at most 2k values of q, which is an O(k log k) op-eration, and step through the sorted values of q, which is an O(k) operation. Over Nneighborhoods, the total computational complexity of this algorithm is O(Nk log k). Thisassumes that the k-nearest neighbors have been precomputed for each location, since thisis a one-time operation; otherwise, computation of the k-nearest neighbors of each locationcan be done naively in O(N2 logN ) or more quickly using space-partitioning data struc-tures. PFSS was able to identify the highest scoring penalized subset for a single day ofour Emergency Department data described in Section 7 (with N = 97 locations) in 40–50milliseconds for all values of k = 5, . . . , 50, which is comparable to the runtimes of theoriginal FSS and the circular spatial scan.
6. RELATED WORK
PFSS with soft proximity constraints combines penalized likelihood ratio statistics, spa-tial data, and subset scanning to increase detection power for irregularly shaped spatial
Dow
nloa
ded
by [
Car
negi
e M
ello
n U
nive
rsity
] at
10:
19 1
6 M
ay 2
016

PENALIZED FAST SUBSET SCANNING 395
clusters. The subset scanning approach is unique in separating this present work frommethods that also use spatial information and attempt to optimize a penalized likelihoodratio statistic. For example, Yiannakoulias, Rosychuk, and Hodgson (2005) penalizednonconnected search regions, while Duczmal et al. (2007) and Kulldorff et al. (2006)computed the geometric regularity of the search region and penalized more elongated andirregularly shaped clusters. More sophisticated methods combine geometric and noncon-nectivity penalties in a multi-objective framework (Cancado et al. 2010). However, mostof these methods rely on a heuristic search to optimize the penalized scan statistic, whichis computationally expensive and not guaranteed to identify the highest-scoring cluster,while Kulldorff et al. (2006) limited their search to elliptical clusters, reducing detectionpower, and spatial accuracy for any subsets that are not well approximated by an ellipse.In contrast, our PFSS approach is extremely computationally efficient and scalable whileguaranteeing that the highest-scoring penalized subset will be found. It is also worth notingthat the previously proposed methods focus on penalizing or rewarding properties of the re-gion as a whole rather than individual data elements, while our penalties at the data-elementlevel have a direct interpretation as the prior log-odds for each element’s inclusion in theoptimal subset. Either of these types of penalty could be preferable for a given applicationdomain.
We note that the ALTSS property is distinct from prior work in submodular functionoptimization (Nemhauser, Wolsey, and Fisher 1978; Leskovec et al. 2007), which has beenused for sensor placement among many other applications. As shown by Neill (2012),the expectation-based Poisson statistic does not satisfy submodularity. Further, methodsbased on submodularity typically find approximate rather than exact solutions, while ourapproach is guaranteed to find the optimal subset that maximizes the penalized statistic.
7. EVALUATION
We provide an example for the PFSS method with soft proximity constraints in the pub-lic health surveillance domain. Emergency Department data from 10 Allegheny County,Pennsylvania hospitals from January 1, 2004, to December 31, 2005, serves as the back-ground data for both validation of the PFSS framework and a performance evaluation fordetecting aerosolized anthrax bio-attacks. Through processing of each case’s InternationalClassification of Diseases (ICD-9) code and the free text in its “chief complaint” string, acount dataset was created recording the number of patient records with respiratory symp-toms (such as cough or shortness of breath) for each day and each zip code in AlleghenyCounty. The dataset had a daily mean of 44.0 cases, and a standard deviation of 12.1 cases.The latitude and longitude coordinates of the centroid of the N = 97 zip codes formed thespatial component of the dataset.
To validate the PFSS approach, we examine a simulation that varies the size and spatialdensity of the affected region (i.e., subset of zip codes with additional counts injected intothe background data) and thus understand the effects of these parameters on the relativeperformance of the competing methods. We then evaluate the detection performance ofPFSS using state-of-the-art dispersion models of an aerosolized anthrax release (Hoganet al. 2007). Both experiments and their results are discussed in their respective sections
Dow
nloa
ded
by [
Car
negi
e M
ello
n U
nive
rsity
] at
10:
19 1
6 M
ay 2
016
396 S. SPEAKMAN ET AL.
below. We use the expectation-based Poisson likelihood ratio statistic throughout, andcompare three methods in each setting:
• Kulldorff’s circular spatial scan statistic (circles), which returns the highest scoringcircular region, searching over all N distinct circles with neighborhood size k centeredat the N locations (Kulldorff 1997).
• Fast subset scan (FSS) that returns the highest scoring unpenalized subset withina region consisting of a center location and its k − 1 nearest neighbors for a fixedparameter k (Neill 2012). This can be considered a special case of PFSS with thestrength of the soft proximity constraint h = 0.
• Penalized fast subset scan (PFSS) with soft proximity constraints, which returns thehighest scoring penalized subset within a region consisting of a center location andits k − 1 nearest neighbors for a fixed parameter k. The soft proximity constraintsreward spatial compactness while penalizing sparse regions. We provide results forboth weaker (h = 1) and stronger (h = 2) constraints. Choice of h is discussed below.
We consider two evaluation metrics: detection power (proportion of outbreaks detected)at a fixed false positive rate of 1 per year and spatial accuracy measured by the “overlapcoefficient” between true and detected clusters. Overlap is a combination of precision andrecall and requires two sets, Strue of affected locations and S∗ of detected locations. Then theoverlap coefficient is defined as: Overlap= |Strue
⋂S∗|/|Strue
⋃S∗|. An overlap coefficient
of 1 (or 100%) represents perfect precision and recall, while an overlap of 0 correspondsto disjoint sets Strue and S∗.
For the three methods considered here, Type I error can be controlled by the use ofrandomization testing or empirical calibration to set the threshold score for detection. Forexample, for a fixed false positive rate of 1/year, we would set the threshold score at the100(1− 1
365 ) ≈ 99.7th percentile of the distribution of daily maximum scores under thenull. We can then compare the methods’ detection power for the given Type I error rate.
7.1 VALIDATION ON SIMULATED OUTBREAKS
We create a large set of simple simulated outbreaks for validation to compare the relativeperformance of PFSS, FSS, and the circular spatial scan (circles) as a function of outbreaksize, spatial density, and neighborhood size k. For each simulated outbreak, the simulatorselects the affected subset of zip codes Strue uniformly at random (between 5 and 10 affectedzip codes). Then Poisson(wi |Strue|) additional cases are injected into each location in Strue,where wi = ci/(
∑sj∈Strue
cj ) represents the relative “weight” of zip code si , proportional tothe total number of cases in that zip code for the entire 2 years of Emergency Departmentdata. The simulated outbreaks are categorized by spatial density, measured by the ratio ofthe number of affected locations to the total number of locations in the smallest circle thatcontains all affected locations and size measured by the total number of affected locations.Figure 4 provides two examples. Results for nine scenarios are provided; three categoriesof density (0.1–0.4 for “low,” 0.4–0.7 for “medium,” and 0.7–1.0 for “high”) and threecategories of size based on the number of affected zip codes (5–6 for “small,” 7–8 for“medium,” and 9–10 for “large”).
Dow
nloa
ded
by [
Car
negi
e M
ello
n U
nive
rsity
] at
10:
19 1
6 M
ay 2
016

PENALIZED FAST SUBSET SCANNING 397
Figure 4. Two examples of inject density. Figure (a) is a region with a density of 5/6 and (b) is a region withdensity 7/14.
Figures 5 and 6 have the same layout with spatial density increasing between panelsfrom left to right and outbreak size increasing between panels from bottom to top. Thelower left panel of few, highly dispersed affected zip codes represents the most difficultdetection scenario while the upper right panel of many, highly compact affected zip codesreflects the easiest scenario.
Figure 5 provides a comparison of detection power (proportion of outbreaks detected at 1false positive per year). As expected, the overall performance for all methods increases withthe number and spatial density of the affected zip codes. We note the poor performance ofthe spatial scan statistic (circles) for the low density outbreaks. This is due to only scanningover circular regions, which results in much lower detection power for irregularly shapedclusters. The spatial scan statistic performs comparably in the high density outbreaks thatare compact and close to circular in shape. We also examine the effect that the neighborhoodsize k has on the methods and note that the detection power of FSS is heavily influencedby the choice of k. The influence of k is more pronounced in outbreaks composed of few,compact affected zip codes (lower right panel). In contrast, we note that the detection powerof PFSS remains strong for a wide range of neighborhood sizes, densities, and numbersof affected locations. Despite the lack of spatial structure in the low density outbreaks, the
Figure 5. Comparison of detection power for multiple methods at a fixed false positive rate of 1 per year. Eachpanel represents different outbreak spatial density and size. Neighborhood sizes from k = 5, . . . , 50 are providedwithin each panel.
Dow
nloa
ded
by [
Car
negi
e M
ello
n U
nive
rsity
] at
10:
19 1
6 M
ay 2
016

398 S. SPEAKMAN ET AL.
Figure 6. Comparison of spatial accuracy (overlap coefficient) for multiple methods. Each panel representsdifferent outbreak spatial density and size. Neighborhood sizes from k = 5, . . . , 50 are provided within eachpanel.
penalized methods (which reward spatially compact subsets) outperform the unpenalizedmethod, FSS. We attribute this strong performance to PFSS’s robustness to noise in thebackground data, increasing overall detection power. For large values of k, FSS is morelikely to give high scores to spatially dispersed subsets in the background data, increasingthe threshold needed to detect the simulated events, while PFSS will only identify suchspurious clusters if they happen to be spatially localized.
Figure 6 provides a comparison of spatial accuracy. We note that larger, more spatiallycompact outbreaks result in higher spatial accuracy for all methods. The circular spatialscan statistic consistently underperforms FSS and PFSS, particularly for the low densityclusters. It tended to return overly large circular regions with high recall but low precision,resulting in a low overlap coefficient. The robustness of the PFSS methods is shown againfor the low density outbreaks. Although low density injects have a relative lack of thespatial structure that PFSS is designed to reward, the ability of PFSS to penalize sparseregions increases spatial precision while maintaining reasonably high recall, resulting inspatial accuracy that is comparable to FSS.
7.2 EVALUATION ON BARD ANTHRAX ATTACKS
The anthrax attacks are based on a state-of-the-art, highly realistic simulation of anaerosolized anthrax release, the Bayesian Aerosol Release Detector (BARD) simula-tor (Hogan et al. 2007). These complex simulations take into account weather data whencreating the affected zip codes, Strue, and demographic information when calculating thenumber of additional Emergency Department cases within each affected zip code. Winddirection, wind speed, and atmospheric stability all influence the elongated shape and sizeof the affected area. Although the simulator produces data for a 10-day period after thespores are released, we simplify the temporal component by using only the data from themidpoint (day 5) of the simulation.
We consider two coverage scenarios. In the 100% coverage case, we assume that all of theanthrax victims present at an Emergency Department with a functioning bio-surveillance
Dow
nloa
ded
by [
Car
negi
e M
ello
n U
nive
rsity
] at
10:
19 1
6 M
ay 2
016

PENALIZED FAST SUBSET SCANNING 399
Figure 7. Comparison of detection power for multiple methods on simulated anthrax bio-attacks at a fixedfalse positive rate of 1 per year, for 50% and 100% coverage scenarios, respectively. Neighborhood sizes fromk = 5, . . . , 75 are provided within each panel.
program and are appropriately accounted for. This assumption is extremely optimistic, sowe provide a possibly more realistic 50% coverage case where half of the population ofanthrax victims seek medical attention from institutions that do not collect or share thistype of data, creating a more difficult detection problem.
Figure 7 provides a comparison of detection power for anthrax attacks. Intuitively,the optimistic 100% coverage scenario has higher detection rates for all methods. In themore difficult 50% coverage setting, the penalized scoring functions show higher detectionrates and greater robustness to the choice of neighborhood size parameter, k. The unpe-nalized FSS method struggles for improperly chosen k even in the easier 100% coveragescenario.
Figure 8 provides a comparison of spatial accuracy for anthrax attacks. The strongperformance of the subset scanning methods compared to the circular spatial scan is due tothe elongated, noncircular regions (based on assumed, randomly generated wind directionand speed) of affected zip codes produced by the BARD simulation. The performance of“circles” is similar in the 100% and 50% coverage scenarios, suggesting that it is limitedby the geometry of the circular spatial scan.
Figure 8. Comparison of spatial accuracy (overlap coefficient) for multiple methods on simulated anthrax bio-attacks, for 50% and 100% coverage scenarios, respectively. Neighborhood sizes from k = 5, . . . , 75 are providedwithin each panel.
Dow
nloa
ded
by [
Car
negi
e M
ello
n U
nive
rsity
] at
10:
19 1
6 M
ay 2
016

400 S. SPEAKMAN ET AL.
Figure 9. Comparison of detection power (averaged over all neighborhood sizes) for multiple methods onsimulated bio-attacks, for 50% and 100% coverage scenarios. Soft proximity constraint strengths from h =0, . . . , 7 are provided within each panel. The black marker represents the h that maximized average detectionpower for a separate training dataset. Note different y-axis scales.
Figure 9 demonstrates PFSS’s robustness to the choice of the proximity constraintstrength, h, by comparing average detection power of the anthrax bio-attacks (averagedover neighborhood sizes k = 5, 10, . . . , 75) for varying h = 0, . . . , 7. For this analysis,the 82 BARD-simulated anthrax attacks were split into separate training and test groups.The black cross represents the value of h that maximized average detection power for thetraining dataset.
In both coverage scenarios, we note the strong performance of PFSS as compared toFSS for all values of h = 0, . . . , 7. This increased performance is a combination of therobustness of PFSS to choice of h and the sensitivity of FSS to poorly chosen neighborhoodsize, k. The circular scan is also robust to neighborhood size k and therefore performscomparably to PFSS in the 100% coverage scenario. We note that near-optimal values of hcan be learned from a small number of labeled training examples. The learned h = 1.8 andh = 1.7, for 50% and 100% scenarios, respectively, out-performed circles and FSS whenevaluated on held out test data.
8. CONCLUSIONS
This work introduced and formalized the additive linear-time subset scanning (ALTSS)property, which allows exact and efficient optimization of penalized likelihood ratio scanstatistics over all subsets of data elements. We demonstrated that this property holds forexpectation-based scan statistics from the exponential family, thus providing flexibilityto incorporate other parametric scan statistic models such as the Gaussian, exponential,binomial, and negative binomial scans. We note that this result is more general than Neill(2012) in two aspects: the incorporation of penalty terms and the extension to the entireexponential family (rather than the “separable” exponential family defined by Neill).
We incorporated this property into a penalized fast subset scan (PFSS) framework, whichenables the scan statistics to be efficiently optimized including additional, element-specificpenalty terms. Our critical insight is that the scoring function F (S) may be written as an
Dow
nloa
ded
by [
Car
negi
e M
ello
n U
nive
rsity
] at
10:
19 1
6 M
ay 2
016

PENALIZED FAST SUBSET SCANNING 401
additive function, summing over all data elements si ∈ S, when conditioning on the relativerisk q. This form provides two advantages. First, additional terms may be added to thestatistic to represent the prior log-odds of each data element being included, while main-taining the additive structure of the scoring function. Second, optimization of either theunpenalized scan statistic F (S | q) or the penalized scan statistic Fpen(S | q) over subsetscan be performed very efficiently, by including all and only those records making a positivecontribution to the score. Moreover, we demonstrated that only a small (linear rather thanexponential) number of values of the relative risk q must be considered, making the com-putation of the highest scoring penalized subset S∗ = arg maxS maxq>1 Fpen(S | q) com-putationally tractable. Unpenalized likelihood ratio statistics from the exponential familycan be optimized while only considering N subsets; penalized likelihood ratio statisticscan be optimized while considering at most 2N subsets, and finding the exact solution isguaranteed in both cases. If the alternative hypothesis H1(S) is true for some subset S, thehighest scoring penalized subset can be interpreted as a MAP estimate of the true affectedsubset.
As a straightforward application of our PFSS framework, we developed “soft” constraintson spatial proximity (i.e., for a given local neighborhood under consideration, locationscloser to the center are assumed to be more likely to have been affected). We then appliedPFSS with soft proximity constraints to the task of detecting anthrax bio-attacks, comparingits detection power and spatial accuracy to the current state of the art. PFSS demonstratedstrong results, outperforming the traditional, circular spatial scan statistic (Kulldorff 1997),and the FSS (Neill 2012) in both detection power and spatial accuracy. Compared to fastsubset scan (FSS), PFSS showed remarkable robustness to selection of the neighborhoodsize k, and this robustness extended even to low density outbreaks designed to challengethe use of soft proximity constraints.
Our PFSS framework with soft constraints introduced a parameter h for the strength ofthe spatial proximity constraint. The extreme cases of h = 0 and h→∞ correspond to theunpenalized FSS and a fixed-radius circular scan, respectively. In this work, we showed thatnear-optimal values of h can be learned from a small number of labeled training examples(∼40). Additionally, PFSS demonstrated robustness to the choice of h, outperforming FSSfor all values h = 0, . . . , 7.
Soft proximity constraints serve as one example of many different applications that cantake advantage of including additional prior information in the subset scanning framework.Another is to incorporate “temporal consistency constraints,” which use prior informationbased on records that were included in the highest scoring subset at a previous time step, toincrease detection power for dynamic patterns where the affected subset changes over time.Incorporating these constraints that penalize abrupt, unrealistic changes can be applied todetecting a contaminant spreading in a water distribution system (Speakman, Zhang, andNeill 2013).
APPENDIX: MINIMIZING ERROR WITH �i
We show that if we can correctly estimate the prior probability pi for location si to be in theaffected subset Strue, then setting �i = log( pi
1−pi ) (the prior log-odds) minimizes the total probability
Dow
nloa
ded
by [
Car
negi
e M
ello
n U
nive
rsity
] at
10:
19 1
6 M
ay 2
016

402 S. SPEAKMAN ET AL.
of error, including both Type I errors (including location si in the detected subset S∗ when si /∈ Strue)and Type II errors (failing to include a location si ∈ Strue in the detected subset S∗).
Assume si ∈ Strue with probability pi , and that we observe xi ∼ Dist1 if si ∈ Strue and xi ∼ Dist0 ifsi �∈ Strue. Moreover, assume that λi and �i are the log-likelihood ratio and penalty for loca-tion si , respectively, where λi = log(p(xi | Dist1)/p(xi | Dist0)) and �i can be any real num-ber. The (unconstrained) penalized subset scan will include si in the detected subset S∗ if andonly if λi +�i > 0. We now show that the total probability of error is minimized for �i = log( pi
1−pi ):
Pr(error |�i) = Pr(si ∈ S∗ | si �∈ Strue,�i)Pr(si �∈ Strue)
+ Pr(si �∈ S∗ | si ∈ Strue,�i)Pr(si ∈ Strue)
= (1− pi)Pr((λi +�i > 0) | si �∈ Strue)+ piPr((λi +�i < 0) | si ∈ Strue)
= (1− pi)(1− CDF0(−�i))+ piCDF1(−�i),
where the cumulative density functions CDF0 and CDF1 are defined as follows:
CDFj (z) =∫ z
−∞p(λi = k | xi ∼ Distj ) dk, j ∈ {0, 1},
and we also define the corresponding probability density functions PDF0 and PDF1:
PDFj (z) = p(λi = z | xi ∼ Distj ), j ∈ {0, 1}.
Furthermore, we note the key property PDF1(z)/PDF0(z) = exp(z), since PDF1(z) andPDF0(z) are, respectively, sums of p(xi) for all xi with corresponding λi = z, and for each suchxi , we know that p(xi | Dist1)/p(xi | Dist0) = exp(z).
We proceed by setting the first derivative of Pr(error) equal to 0:
dPr(error)
d�i
= (1− pi)PDF0(−�i)− piPDF1(−�i)
= (1− pi − pi exp(−�i))PDF0(−�i) = 0.
This expression has a single zero at �i = log (pi/(1− pi)). The second derivative at this point is
− (1− pi − pi exp(−�i)) dPDF0(−�i)+ pi exp(−�i)PDF0(−�i)
=(
1
1+ exp(�i)
)PDF0(−�i) ≥ 0,
so this is the value of �i that minimizes the probability of error.
ACKNOWLEDGMENTS
This work was partially supported by the National Science Foundation, grants IIS - 0916345, IIS - 0911032, andIIS-0953330. Additionally, Edward McFowland III was supported by an NSF Graduate Research Fellowship (NSFGRFP-0946825) and an AT&T Labs Fellowship.
Dow
nloa
ded
by [
Car
negi
e M
ello
n U
nive
rsity
] at
10:
19 1
6 M
ay 2
016

PENALIZED FAST SUBSET SCANNING 403
[Received October 2014. Revised February 2015.]
REFERENCES
Agarwal, D., McGregor, A., Phillips, J. M., Venkatasubramanian, S., and Zhu, Z. (2006), “Spatial Scan Statistics:Approximations and Performance Study,” in Proceedings of the 12th ACM SIGKDD International Conferenceon Knowledge Discovery and Data Mining, pp. 24–33. [383]
Burkom, H. S., Murphy, S. P., and Shmueli, G. (2007), “Automated Time Series Forecasting for Biosurveillance,”Statistics in Medicine, 26, 4202–4218. [385]
Cancado, A. L., Duarte, A. R., Duczmal, L. H., Ferreira, S. J., Fonseca, C. M., and Gontijo, E. C. (2010),“Penalized Likelihood and Multi-objective Spatial Scans for the Detection and Inference of Irregular Clusters,”International Journal of Health Geographics, 9, 55. [395]
Duczmal, L., and Assuncao, R. (2004), “A Simulated Annealing Strategy for the Detection of Arbitrary ShapedSpatial Clusters,” Computational Statistics and Data Analysis, 45, 269–286. [383]
Duczmal, L., Cancado, A. L., Takahashi, R. H., and Bessegato, L. F. (2007), “A Genetic Algorithm for IrregularlyShaped Spatial Scan Statistics,” Computational Statistics and Data Analysis, 52, 43–52. [395]
Hogan, W. R., Cooper, G. F., Wallstrom, G. L., Wagner, M. M., and Depinay, J.-M. (2007), “The Bayesian AerosolRelease Detector,” Statistics in Medicine, 26, 5225–5252. [395,398]
Kulldorff, M. (1997), “A Spatial Scan Statistic,” Communications in Statistics: Theory and Methods, 26, 1481–1496. [383,384,385,396,401]
Kulldorff, M., Huang, L., Pickle, L., and Duczmal, L. (2006), “An Elliptic Spatial Scan Statistic,” Statistics in
Medicine, 25, 3929–3943. [395]
Leskovec, J., Krause, A., Guestrin, C., Faloutsos, C., VanBriesen, J., and Glance, N. (2007), “Cost-EffectiveOutbreak Detection in Networks,” in Proceedings of the 13th ACM SIGKDD International Conference onKnowledge Discovery and Data Mining, pp. 420–429. [395]
Neill, D. B. (2009a), “An Empirical Comparison of Spatial Scan Statistics for Outbreak Detection,” International
Journal of Health Geographics, 8, 20. [385]
——— (2009b), “Expectation-Based Scan Statistics for Monitoring Spatial Time Series Data,” International
Journal of Forecasting, 25, 498–517. [383]
——— (2012), “Fast Subset Scan for Spatial Pattern Detection,” Journal of the Royal Statistical Society, SeriesB, 74, 337–360. [383,384,386,387,390,392,395,396,400,401]
Neill, D. B., and Cooper, G. F. (2010), “A Multivariate Bayesian Scan Statistic for Early Event Detection andCharacterization,” Machine Learning, 79, 261–282. [388]
Neill, D. B., and Moore, A. W. (2004), “Rapid Detection of Significant Spatial Clusters,” in Proceedings of
the 10th ACM SIGKDD International Conference on Knowledge Discovery and Data Mining, pp. 256–265. [383]
Neill, D. B., Moore, A. W., and Cooper, G. F. (2006), “A Bayesian Spatial Scan Statistic,” in Advances in NeuralInformation Processing Systems, eds. Y. Weiss, B. Schlkopf, and J.C. Platt, Vol. 18, Cambridge, MA: MITPress, pp. 1003–1010. [388]
Neill, D. B., Moore, A. W., Sabhnani, M. R., and Daniel, K. (2005), “Detection of Emerging Space-TimeClusters,” in Proceedings of the 11th ACM SIGKDD International Conference on Knowledge Discovery andData Mining, pp. 218–227. [383,384]
Nemhauser, G., Wolsey, L., and Fisher, M. (1978), “An Analysis of the Approximations for Maximizing Sub-modular Set Functions,” Mathematical Programming, 14, 265–294. [395]
Speakman, S., McFowland, E., and Neill, D. B. (2015), “Scalable Detection of Anomalous PatternsWith Connectivity Constraints,” Journal of Computational and Graphical Statistics, 24, 1014–1033.DOI:10.1080/10618600.2014.960926. [383]
Dow
nloa
ded
by [
Car
negi
e M
ello
n U
nive
rsity
] at
10:
19 1
6 M
ay 2
016

404 S. SPEAKMAN ET AL.
Speakman, S., Zhang, Y., and Neill, D. B. (2013), “Dynamic Pattern Detection With Temporal Consistency andConnectivity Constraints,” in Proceedings of the 13th IEEE International Conference on Data Mining, pp.697–706. [401]
Wu, M., Song, X., Jermaine, C., Ranka, S., and Gums, J. (2009), “A LRT Framework for Fast Spatial AnomalyDetection,” in Proceedings of the 15th ACM SIGKDD International Conference on Knowledge Discovery
and Data Mining, pp. 887–896. [383]
Yiannakoulias, N., Rosychuk, R. J., and Hodgson, J. (2005), “Adaptations for Finding Irregularly Shaped DiseaseClusters,” International Journal of Health Geographics, 6, 28. [395]
Dow
nloa
ded
by [
Car
negi
e M
ello
n U
nive
rsity
] at
10:
19 1
6 M
ay 2
016