itu-wp6a-c-0504-e_drm single frequency network field test results
TRANSCRIPT

R07-WP6A-C-0504!!MSW-E_DRM_SFN.DOC 02.05.11 08.05.11
Introduction
This document describes the results of recent field testing of single frequency network (“SFN”)
operations using Digital Radio Mondiale in robustness mode E (DRM+). The tests were conducted
in the spring of 2011 in Hannover, Germany using two transmitters. The tests demonstrated the
viability of implementing SFN networks for DRM+ to both extend the range of coverage and fill in
areas of compromised signal.
Proposal
That the observations and measurements of the DRM system in the VHF bands reported in this
document be used in furtherance of the acceptance of Digital Radio Mondiale (DRM) as digital
system G in Rec. ITU-R BS.1114 as given in Annex 6 of Working Party 6A Chairman’s Report
(Document 6A/454) and that they be used to develop a working document towards a preliminary
draft new Report ITU-R BS.[DRM+] which will gather together appropriate field trial data and so
provide a reference document on the capabilities of DRM+.
Radiocommunication Study Groups
Document 6A/504-E
2 May 2011
Received: 29 April 2011
Reference: Annex 6 to Document 6A/454 English only
Digital Radio Mondiale
DRM SINGLE FREQUENCY NETWORK FIELD TEST RESULTS
- 2 -
6A/504-E
R07-WP6A-C-0504!!MSW-E_DRM_SFN.DOC 02.05.11 08.05.11
______________________________________________________________________________
A DRM+ Single Frequency Network trial
in Hannover 2./3.2011
_____________________________________________________________________________
Author:
Friederike Maier
Institute of Communications Technology
University of Hanover
Germany
- 3 -
6A/504-E
R07-WP6A-C-0504!!MSW-E_DRM_SFN.DOC 02.05.11 08.05.11
April, 2011
1 Introduction
DRM+ is an enhancement of the existing DRM (Digital Radio Mondiale) standard up to the VHF
band III. It has been approved in the ETSI DRM standard [1] in 2009.
As a digital, OFDM radio system DRM+ is capable of transmitting in a single frequency network
(SFN). Here several transmitters can work on the same frequency, due to a guard interval added
after every symbol, differences in time of arrival from the different transmitters do not decrease the
performance. This offers the possibility of covering a big area with several transmitters on only one
frequency which saves bandwidth and simplifies frequency planning significantly. It also enhances
the reception quality in areas with obstacles as buildings, hills or mountains.
In order to prove the functionality of DRM+ operating in an SFN a field test was set up in
Hannover. Measurements have been conducted in urban areas, to analyze and compare the
performance of a one antenna system and a SFN setup with the same power. Additionally the
behaviour in the overlapping area of the two transmitters and the coverage of the SFN setup are
analyzed.
This report contains a description of the DRM+ system parameters, the system setup and equipment
that was used in the trial and the measuring results that were obtained in the measuring campaign.
2 DRM+ System parameters
DRM+ is an OFDM system and offers different sub-carrier modulations and variable error
protection to get full flexibility between the coverage area, robustness and data rate. The DRM+
system parameters are shown in the following table:
System parameter
Modulation OFDM
Data rate 37-186 kbps
Sub-carrier modulation 4-/16-QAM
Signal bandwidth 96 kHz
Sub-carrier spacing 444.444 Hz
Number of sub-carriers 213
Symbol duration 2.25 ms
Guard interval duration 0.25 ms
Frame length 100 ms
Number of programmes 1-4
In order to improve the robustness of the bitstream against channel errors, bit interleaving is carried
out over one frame (100 ms) and convolution cell interleaving over 6 frames (600 ms).
- 4 -
6A/504-E
R07-WP6A-C-0504!!MSW-E_DRM_SFN.DOC 02.05.11 08.05.11
2.1 Flat fading in the overlapping area
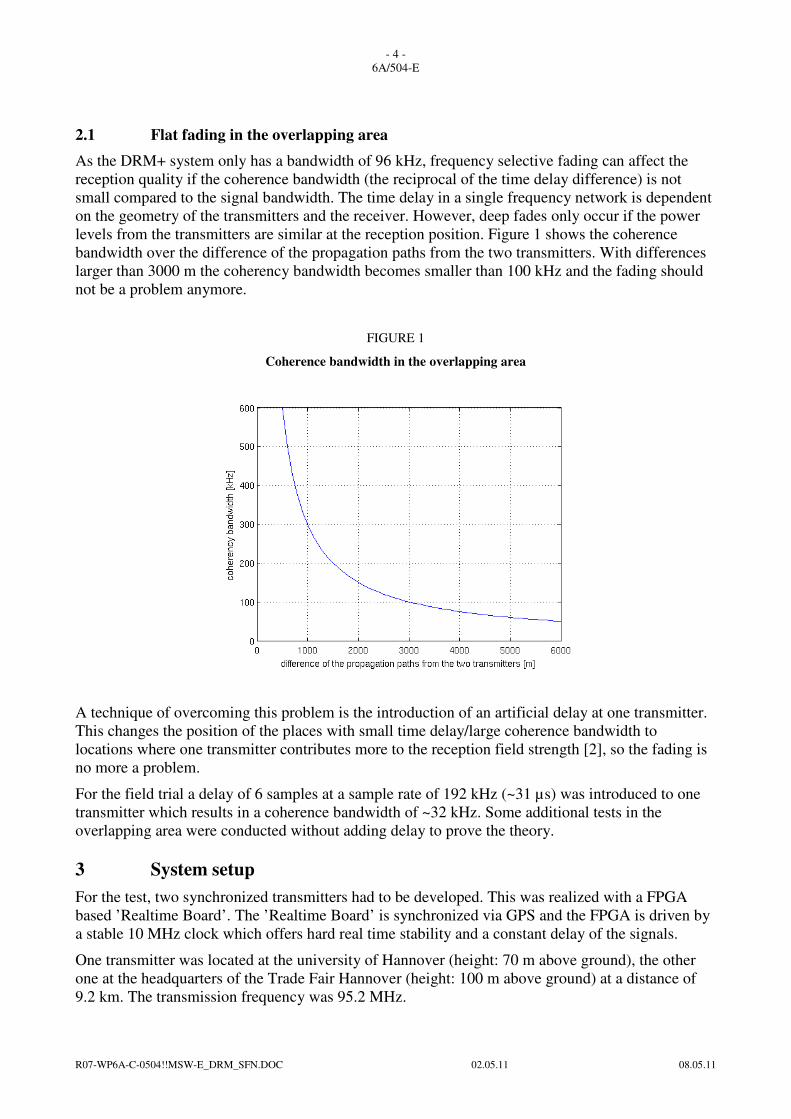
As the DRM+ system only has a bandwidth of 96 kHz, frequency selective fading can affect the
reception quality if the coherence bandwidth (the reciprocal of the time delay difference) is not
small compared to the signal bandwidth. The time delay in a single frequency network is dependent
on the geometry of the transmitters and the receiver. However, deep fades only occur if the power
levels from the transmitters are similar at the reception position. Figure 1 shows the coherence
bandwidth over the difference of the propagation paths from the two transmitters. With differences
larger than 3000 m the coherency bandwidth becomes smaller than 100 kHz and the fading should
not be a problem anymore.
FIGURE 1
Coherence bandwidth in the overlapping area
A technique of overcoming this problem is the introduction of an artificial delay at one transmitter.
This changes the position of the places with small time delay/large coherence bandwidth to
locations where one transmitter contributes more to the reception field strength [2], so the fading is
no more a problem.
For the field trial a delay of 6 samples at a sample rate of 192 kHz (~31 µs) was introduced to one
transmitter which results in a coherence bandwidth of ~32 kHz. Some additional tests in the
overlapping area were conducted without adding delay to prove the theory.
3 System setup
For the test, two synchronized transmitters had to be developed. This was realized with a FPGA
based ’Realtime Board’. The ’Realtime Board’ is synchronized via GPS and the FPGA is driven by
a stable 10 MHz clock which offers hard real time stability and a constant delay of the signals.
One transmitter was located at the university of Hannover (height: 70 m above ground), the other
one at the headquarters of the Trade Fair Hannover (height: 100 m above ground) at a distance of
9.2 km. The transmission frequency was 95.2 MHz.
- 5 -
6A/504-E
R07-WP6A-C-0504!!MSW-E_DRM_SFN.DOC 02.05.11 08.05.11
For the measurements a robust 4-QAM modulation with Protection Level 1 (49.7 kbps) was chosen.
3.1 Transmitter setup
The following transmitter equipment was used for the measurements:
• 1 off Fraunhofer DRM ContentServer.
• 2 off RFmondial Modulator.
• 2 off GPS synchronized ‘Realtime’ Boards for the SFN setup developed by the Institute of
Communications Technology, University of Hannover.
• 2 off Nautel Exciter/Amplifier NVE at 95.2 MHz.
An audio signal was transmitted in stereo over DRM+, together with a PRBS sequence for the
evaluation of the bit error rate, while conducting the test.
3.2 Receiver setup
• Antenna: Kathrein K 51 16 4 / BN 510 351 magnetic monopole antenna mounted on the
roof of a van at a height of around 2 m.
• RFmondial DRM+ Frontend.
• RFmondial Software Receiver.
3.3 Measurement parameters
The following parameters were recorded and analyzed during the measurements:
• GPS coordinates.
• RSCI data (Receiver Status and Control Interface [3]), the SNR and the receiver status
(synchronization errors, FAC CRC, SDC CRC and the audio errors has been analysed.
• Field strength.
• Bit error rate.
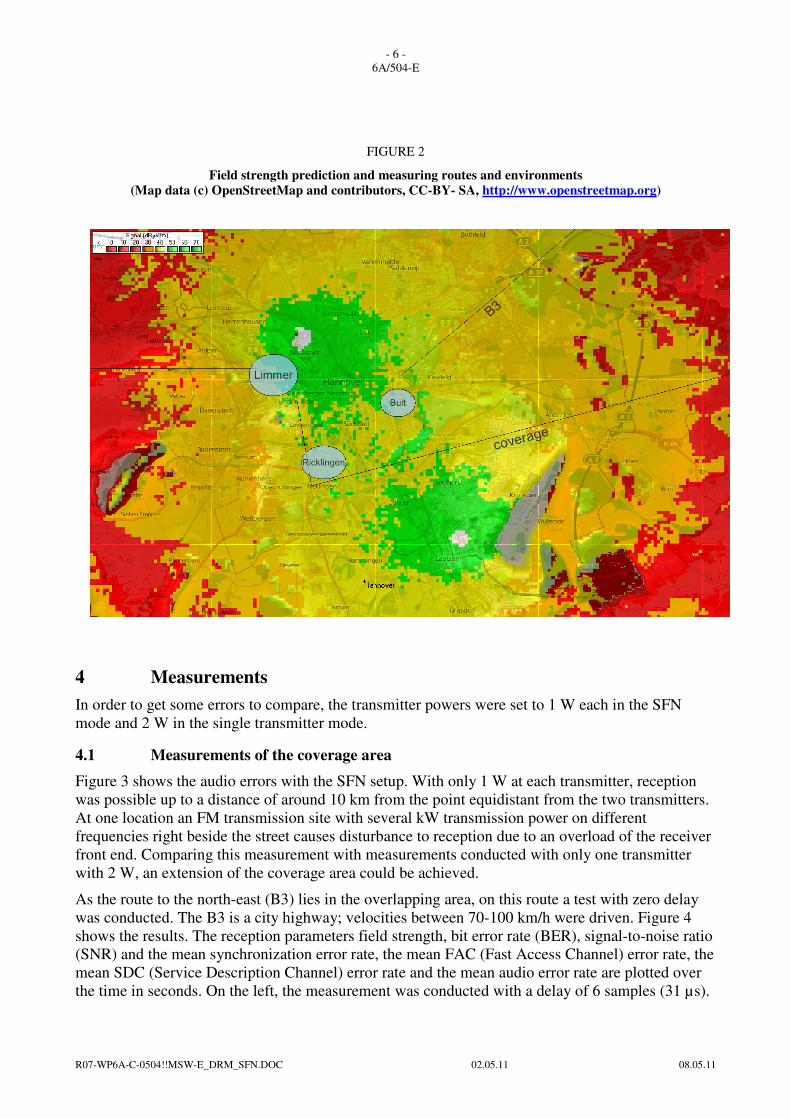
3.4 Field strength prediction and measurement locations overview
A field strength prediction was made with the free radio propagation simulation program ‘Radio
Mobile’. Radio Mobile is based on the ITS (Longley-Rice) propagation model. The program uses
topographic data (SRTM data from the Space Shuttle Radar Terrain Mapping Mission), but no
Morphology (buildings, woods, etc.). Therefore in urban areas the predictions are very optimistic.
The prediction was conducted with 1W power at each transmitter.
Mobile reception with DRM+ 4-QAM should be possible with field strength above ~35 dBµV/m
according to the DRM+ planning parameters.
Additionally the different measurement routes and the overlapping area (similar distances to both
transmitters) are added to the prediction in Figure 2.
- 6 -
6A/504-E
R07-WP6A-C-0504!!MSW-E_DRM_SFN.DOC 02.05.11 08.05.11
FIGURE 2
Field strength prediction and measuring routes and environments
(Map data (c) OpenStreetMap and contributors, CC-BY- SA, http://www.openstreetmap.org)
4 Measurements
In order to get some errors to compare, the transmitter powers were set to 1 W each in the SFN
mode and 2 W in the single transmitter mode.
4.1 Measurements of the coverage area
Figure 3 shows the audio errors with the SFN setup. With only 1 W at each transmitter, reception
was possible up to a distance of around 10 km from the point equidistant from the two transmitters.
At one location an FM transmission site with several kW transmission power on different
frequencies right beside the street causes disturbance to reception due to an overload of the receiver
front end. Comparing this measurement with measurements conducted with only one transmitter
with 2 W, an extension of the coverage area could be achieved.
As the route to the north-east (B3) lies in the overlapping area, on this route a test with zero delay
was conducted. The B3 is a city highway; velocities between 70-100 km/h were driven. Figure 4
shows the results. The reception parameters field strength, bit error rate (BER), signal-to-noise ratio
(SNR) and the mean synchronization error rate, the mean FAC (Fast Access Channel) error rate, the
mean SDC (Service Description Channel) error rate and the mean audio error rate are plotted over
the time in seconds. On the left, the measurement was conducted with a delay of 6 samples (31 µs).

- 7 -
6A/504-E
R07-WP6A-C-0504!!MSW-E_DRM_SFN.DOC 02.05.11 08.05.11
Here also the minimum field strength necessary for reception can be seen. When the field strength
falls under ~35 dBµV/m errors come up.
On the right the same route in the other direction is plotted without delay. As the B3 lies mostly in
the overlapping area, as expected the standard deviation and the errors increase due to flat fading
over the whole signal bandwidth. This can be avoided by adding a delay at one transmitter.
FIGURE 3
Measurement of the coverage area (red: one or more audio errors, green, no audio error, Map data (c)
OpenStreetMap and contributors, CC-BY- SA, http://www.openstreetmap.org)
FIGURE 4
Measurement of the coverage
- 8 -
6A/504-E
R07-WP6A-C-0504!!MSW-E_DRM_SFN.DOC 02.05.11 08.05.11
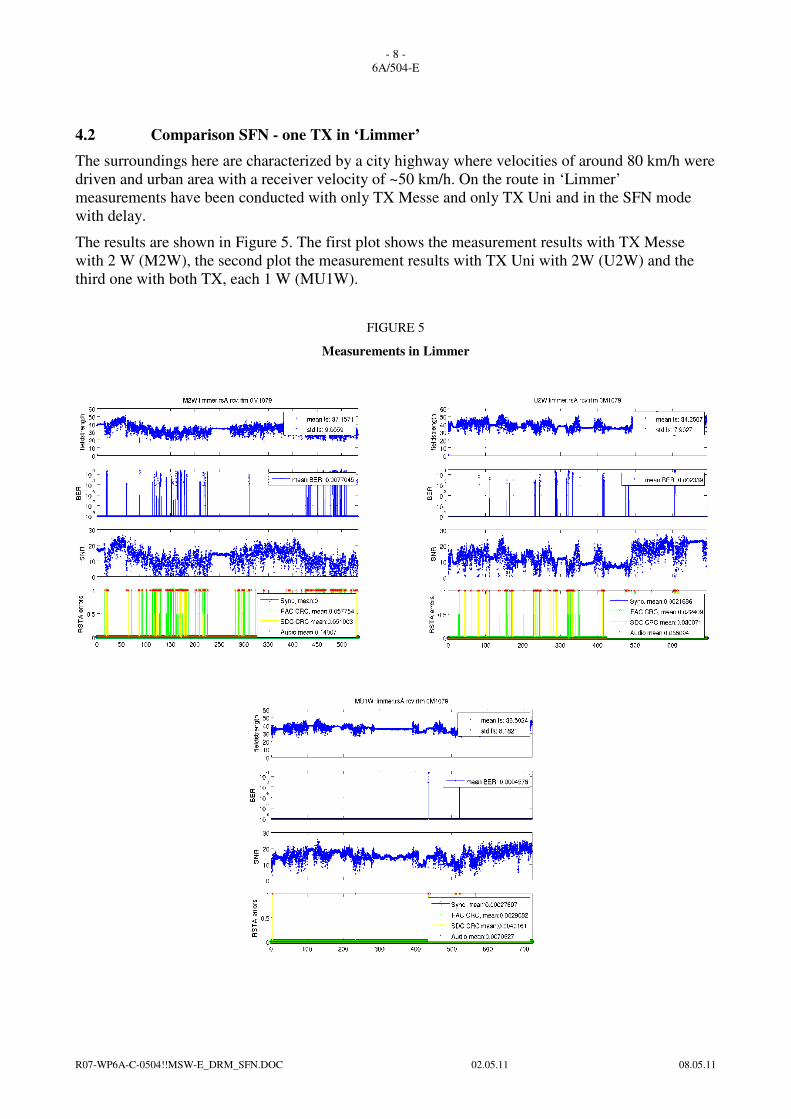
4.2 Comparison SFN - one TX in ‘Limmer’
The surroundings here are characterized by a city highway where velocities of around 80 km/h were
driven and urban area with a receiver velocity of ~50 km/h. On the route in ‘Limmer’
measurements have been conducted with only TX Messe and only TX Uni and in the SFN mode
with delay.
The results are shown in Figure 5. The first plot shows the measurement results with TX Messe
with 2 W (M2W), the second plot the measurement results with TX Uni with 2W (U2W) and the
third one with both TX, each 1 W (MU1W).
FIGURE 5
Measurements in Limmer
- 9 -
6A/504-E
R07-WP6A-C-0504!!MSW-E_DRM_SFN.DOC 02.05.11 08.05.11
In the following table the mean values are summarized, which shows clearly the enhancement of
reception with SFN.
Mode Median field
strength
[dBµV/m]
Standard
deviation of the
field strength
BER Audio error
rate
M2W 37.15 9.0 0.0077 0.14
U2W 34.26 7.9 0.0023 0.056
MU1W 36.5 8.2 0.0004 0.007
Although the median reception field strength was not equal from both transmitters, the bit error rate
(BER) and audio error rate decrease with both transmitters switched on at half power. Due to the
different median field strength the standard deviation of the SFN mode is in between the ones with
one transmitter. However the second transmitter can fill deep fades which occur in the propagation
path from one side.
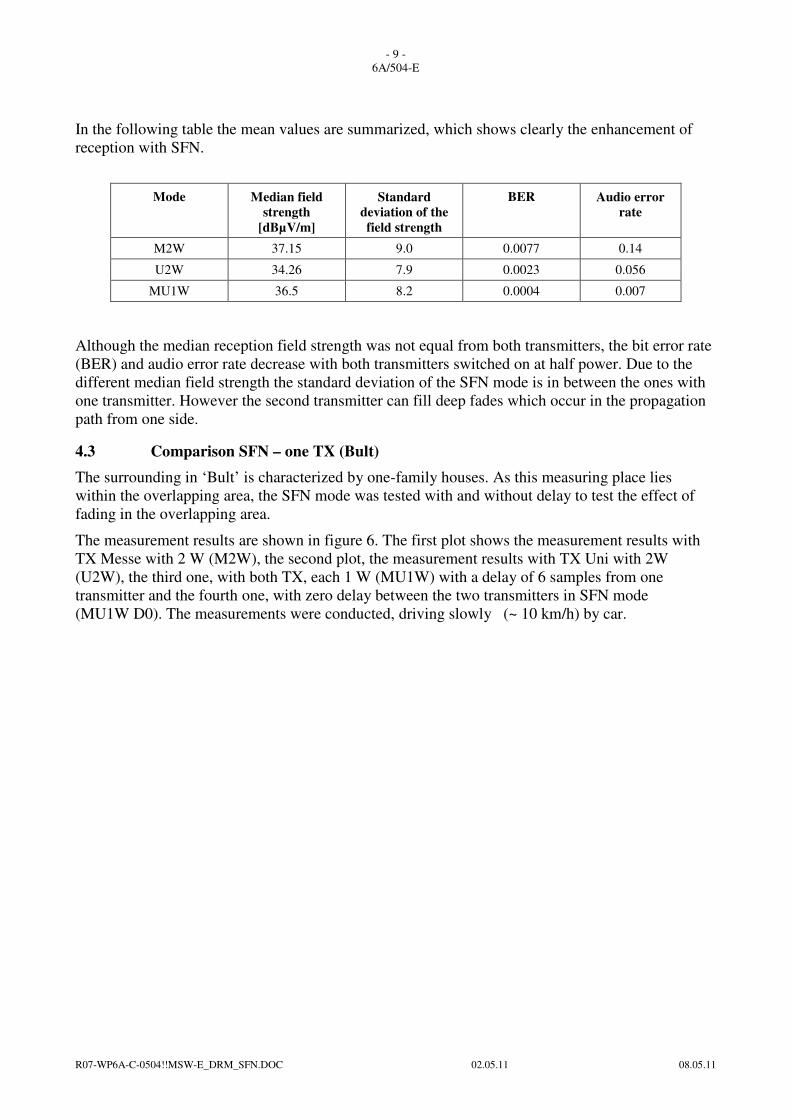
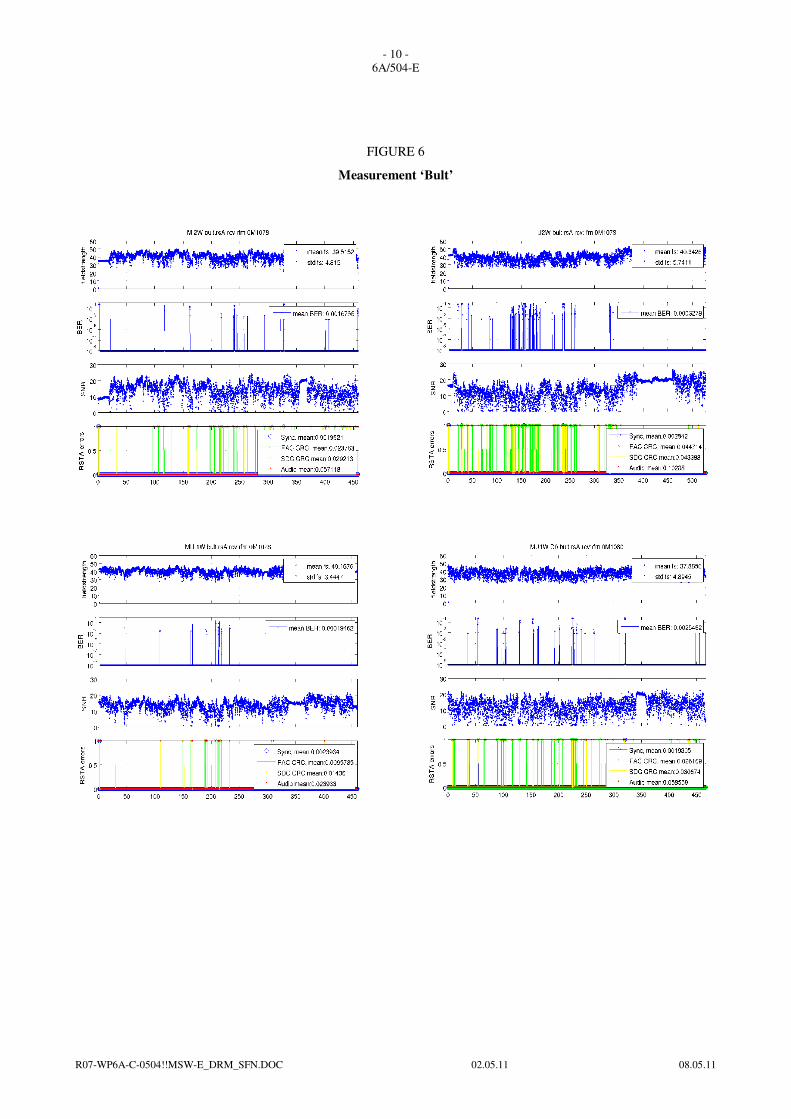
4.3 Comparison SFN – one TX (Bult)
The surrounding in ‘Bult’ is characterized by one-family houses. As this measuring place lies
within the overlapping area, the SFN mode was tested with and without delay to test the effect of
fading in the overlapping area.
The measurement results are shown in figure 6. The first plot shows the measurement results with
TX Messe with 2 W (M2W), the second plot, the measurement results with TX Uni with 2W
(U2W), the third one, with both TX, each 1 W (MU1W) with a delay of 6 samples from one
transmitter and the fourth one, with zero delay between the two transmitters in SFN mode
(MU1W D0). The measurements were conducted, driving slowly (~ 10 km/h) by car.
- 10 -
6A/504-E
R07-WP6A-C-0504!!MSW-E_DRM_SFN.DOC 02.05.11 08.05.11
FIGURE 6
Measurement ‘Bult’
- 11 -
6A/504-E
R07-WP6A-C-0504!!MSW-E_DRM_SFN.DOC 02.05.11 08.05.11
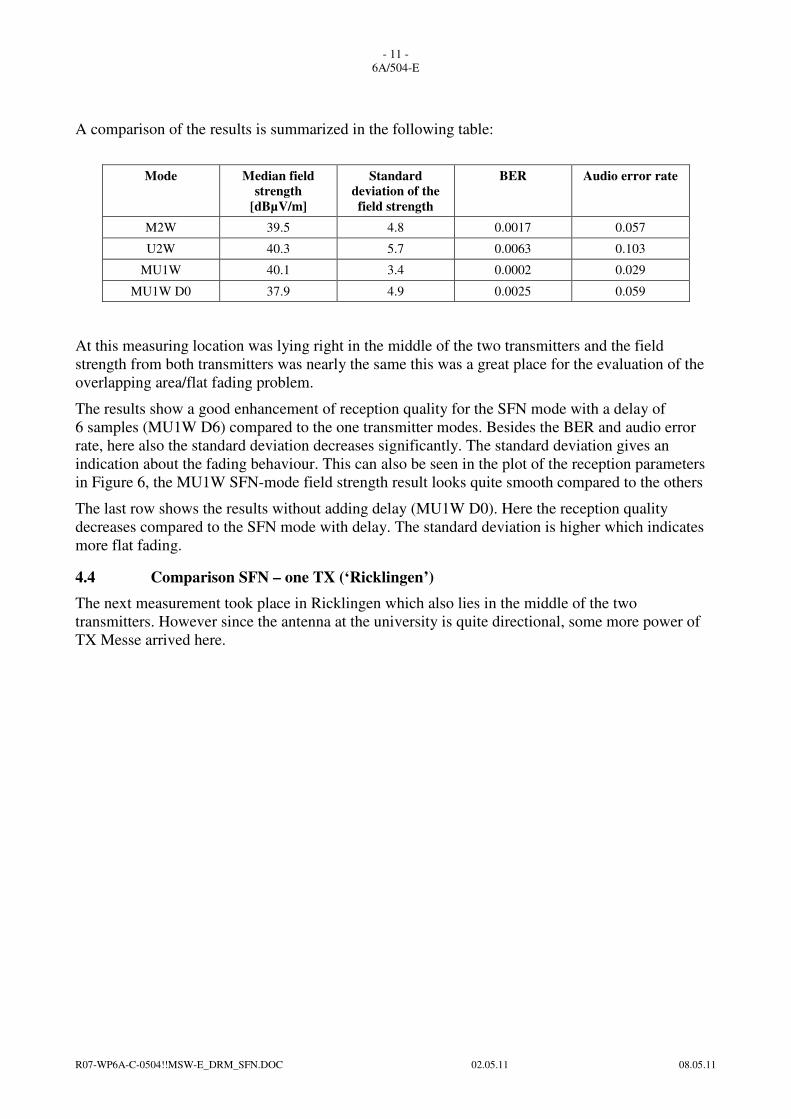
A comparison of the results is summarized in the following table:
Mode Median field
strength
[dBµV/m]
Standard
deviation of the
field strength
BER Audio error rate
M2W 39.5 4.8 0.0017 0.057
U2W 40.3 5.7 0.0063 0.103
MU1W 40.1 3.4 0.0002 0.029
MU1W D0 37.9 4.9 0.0025 0.059
At this measuring location was lying right in the middle of the two transmitters and the field
strength from both transmitters was nearly the same this was a great place for the evaluation of the
overlapping area/flat fading problem.
The results show a good enhancement of reception quality for the SFN mode with a delay of
6 samples (MU1W D6) compared to the one transmitter modes. Besides the BER and audio error
rate, here also the standard deviation decreases significantly. The standard deviation gives an
indication about the fading behaviour. This can also be seen in the plot of the reception parameters
in Figure 6, the MU1W SFN-mode field strength result looks quite smooth compared to the others
The last row shows the results without adding delay (MU1W D0). Here the reception quality
decreases compared to the SFN mode with delay. The standard deviation is higher which indicates
more flat fading.
4.4 Comparison SFN – one TX (‘Ricklingen’)
The next measurement took place in Ricklingen which also lies in the middle of the two
transmitters. However since the antenna at the university is quite directional, some more power of
TX Messe arrived here.
- 12 -
6A/504-E
R07-WP6A-C-0504!!MSW-E_DRM_SFN.DOC 02.05.11 08.05.11
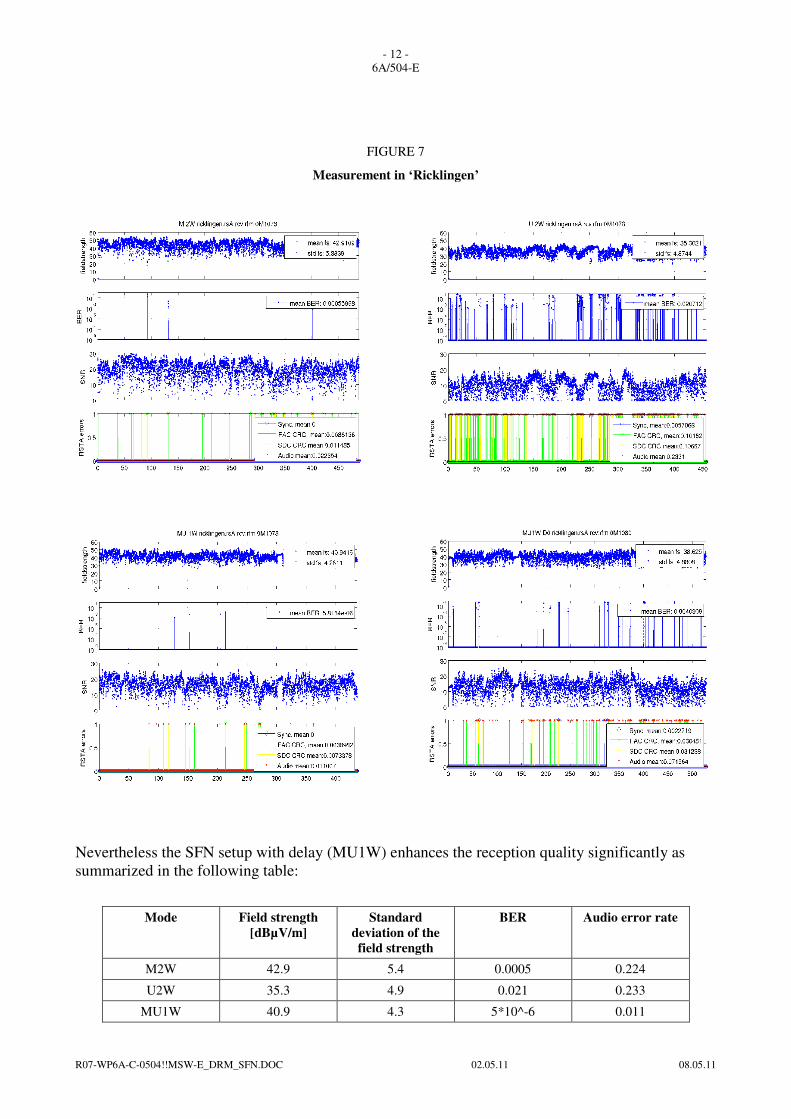
FIGURE 7
Measurement in ‘Ricklingen’
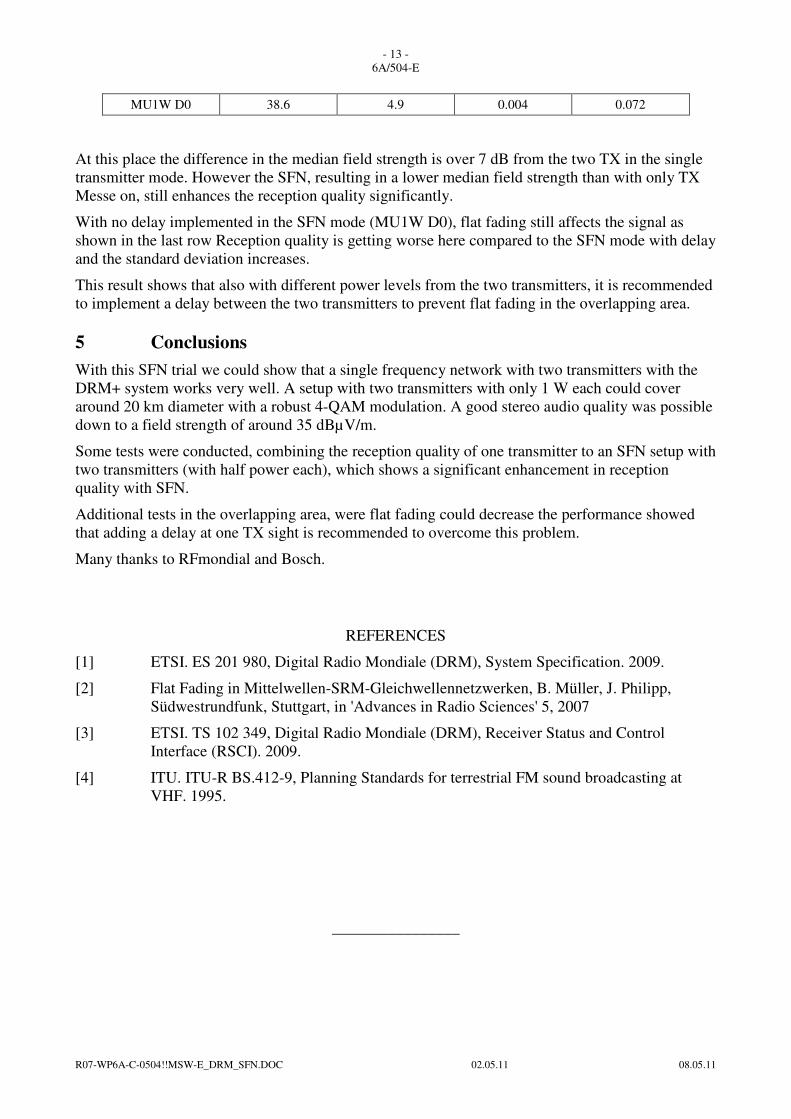
Nevertheless the SFN setup with delay (MU1W) enhances the reception quality significantly as
summarized in the following table:
Mode Field strength
[dBµV/m]
Standard
deviation of the
field strength
BER Audio error rate
M2W 42.9 5.4 0.0005 0.224
U2W 35.3 4.9 0.021 0.233
MU1W 40.9 4.3 5*10^-6 0.011
- 13 -
6A/504-E
R07-WP6A-C-0504!!MSW-E_DRM_SFN.DOC 02.05.11 08.05.11
MU1W D0 38.6 4.9 0.004 0.072
At this place the difference in the median field strength is over 7 dB from the two TX in the single
transmitter mode. However the SFN, resulting in a lower median field strength than with only TX
Messe on, still enhances the reception quality significantly.
With no delay implemented in the SFN mode (MU1W D0), flat fading still affects the signal as
shown in the last row Reception quality is getting worse here compared to the SFN mode with delay
and the standard deviation increases.
This result shows that also with different power levels from the two transmitters, it is recommended
to implement a delay between the two transmitters to prevent flat fading in the overlapping area.
5 Conclusions
With this SFN trial we could show that a single frequency network with two transmitters with the
DRM+ system works very well. A setup with two transmitters with only 1 W each could cover
around 20 km diameter with a robust 4-QAM modulation. A good stereo audio quality was possible
down to a field strength of around 35 dBµV/m.
Some tests were conducted, combining the reception quality of one transmitter to an SFN setup with
two transmitters (with half power each), which shows a significant enhancement in reception
quality with SFN.
Additional tests in the overlapping area, were flat fading could decrease the performance showed
that adding a delay at one TX sight is recommended to overcome this problem.
Many thanks to RFmondial and Bosch.
REFERENCES
[1] ETSI. ES 201 980, Digital Radio Mondiale (DRM), System Specification. 2009.
[2] Flat Fading in Mittelwellen-SRM-Gleichwellennetzwerken, B. Müller, J. Philipp,
Südwestrundfunk, Stuttgart, in 'Advances in Radio Sciences' 5, 2007
[3] ETSI. TS 102 349, Digital Radio Mondiale (DRM), Receiver Status and Control
Interface (RSCI). 2009.
[4] ITU. ITU-R BS.412-9, Planning Standards for terrestrial FM sound broadcasting at
VHF. 1995.
________________