james bay residents bear social and health costs ... · james bay neighbourhood association quality...
TRANSCRIPT

James Bay Neighbourhood Association Quality of Life & Environment Committee Report
JBNA Mission statement: “Enabling the community to be actively involved in the preservation, rehabilitation and planned development of James Bay, so as to preserve
and enhance the quality of the environment and life therein.”
Noise
Purpose:
Noise pollution is a Quality of Life issue. James Bay, the most populous neighbourhood in Victoria, is the residential area most impacted by tourism transportation.
The JBNA, building on work done as part of the James Bay Air Quality Study, initiated studies to examine the social costs of these activities, including the impact of transportation on residents of James Bay. A traffic noise study was one component.
An acoustics study was commissioned and measurements taken in June, 2009. Measurements showed that residential areas near the primary focus of cruise tourism, Ogden Point, are submitted to community noise levels at, or greater than, the highest levels of acceptable community noise.
February 2010 _______________________________________________________________________

JBNA: Quality of Life and Environment February 2010 Noise page 1
Noise To us the “noise pollution” has been the biggest and most steadily increasing change over the last 10 years or so.” (Ontario St resident: JBNA QoL Survey) 1. Background: Noise pollution has been an environmental problem for both modern, and ancient, civilisations. In ancient Rome, rules existed as to the noise created by the iron wheels of wagons. Today, vehicular traffic is the main source of environmental noise pollution. The effects of noise are widespread and have long-term health consequences. At JBNA meetings, starting around 2001, discussions during the Community Concerns section often focussed on tourism traffic. Anecdotal stories suggested that some people had felt compelled to move away from James Bay to avoid the social costs created by pollution associated with the various modes of transportation in James Bay. A review of the minutes from 2006 reveals transportation as the most pressing issue facing residents. James Bay, as home to much of the City’s seasonal tourism activities, is the residential area most impacted by tourism transportation. Since 1990, annual cruise ship visits to Ogden Point have grown from 34 to over 200, and the ships became larger. Passenger numbers increased from 24,000 to over 400,000. In one year, from 2000 to 2001 passengers doubled to over 100,000. This significant increase in cruise tourism has been accompanied by a marked increase in land-based tourism transportation including buses, taxis, kabuki-cabs and horse drawn carriages, and in trucking activities involved with servicing the cruise ships (see graphs 1 and 2). Noise created by helicopters and floatplanes are also a significant noise source for residents in parts of James Bay. In response to noise and emissions issues, the JBNA undertook a number of initiatives.
· From 2006 onwards, the James Bay Air Quality Study (JBAQS) has been ongoing.
· In 2008, Trans Tech Data Services collected traffic data as part of the JBAQS. Brian Scarfe (see Appendix A) analysed this data. Analysis clearly demonstrates the correlation between traffic volume and cruise ship activity with each cruise ship generating an additional 317 vehicle movements along the Dallas Road – Erie Street route. With three cruise ships in port, an additional 950 vehicle movements are generated. A considerable proportion of the additional vehicles are larger than motor cars.
· In 2009, 28 households contributed funding, to enable the JBNA to carry out a small noise study. Including the generous $1000 funding from VIHA, over $3000 was raised. This document includes some of the data and information gathered and commissioned for the 2009 JBNA noise study. Aspects of the study relating to Ogden Point activities have been isolated from the fuller examination of noise throughout James Bay.

Graph 1 Victoria Ogden Point - Cruise Ship Activity (data obtained from GVHA publications, newspaper reports and internet sources) Note: Ogden Point is being fitted for the new generation of super-size cruise ships which are 365 m in length and serve 3,800 passengers (current values: 304 m & 3,200 passengers).
Cruise Ship Passengers/Crew per Year
0
100000
200000
300000
400000
500000
600000
700000
1990
1992
1994
1996
1998
2000
2002
2004
2006
2008
Year
Num
ber o
f peo
ple
Crew
Passengers
Graph 2
2009 Cruise Ship Activity (planned) Graphs 2 illustrates the daily profile of cruise ship activity during the 2009 season: data was based on available information as of May/June cruise ship schedule.
Daily Profile of Cruiseship Activity 2009 Cruise Ship Season
0
1
2
3
4
5
15-M
ay
14-J
un
14-J
ul
13-A
ug
12-S
ep
12-O
ct
No.
of C
ruis
e S
hips
Per
Day
JBNA: Quality of Life and Environment February 2010 Noise page 2
JBNA: Quality of Life and Environment February 2010 Noise page 3
2. Project Design: Objective
The traffic noise study is one component of the Search for Alternate People Movement Strategies Initiative which is directed towards improving residents’ quality of life through mitigation of adverse impacts associated with tourism and encouraging the cruise industry to focus on more sustainable, greener excursion alternatives for valued tourists.
The study measured noise and compared vehicular noise levels to other studies, WHO Guidelines and other community noise standards.
The project results inform James Bay residents and the City about the level of noise pollution present in this predominantly residential area.
Traffic includes residents’ cars, commercial diesel trucks, fishing industry trucks including reefers, tour buses, hop-on/off buses, cruise ship tour buses, cruise shuttle buses, BC transit buses, school buses, military and coast guard vehicles, taxis, horse carriages, kabuki-cabs, bicycles and motorcycles. Of the five or six types of bus activities in James Bay, only two necessarily involve cruise tourism.
To understand the impact of cruise tourism on traffic noise, it was necessary to monitor noise on a day with cruise ships in port and on a day without cruise ships in port. Constraints
Several constraints and considerations limited and defined the scope of the project and selection of sites, dates, and times for noise measurement collection.
Funding was half of the desired level and scheduling constraints included consultant staff hours, cruise ship schedule, and street closures due to City engineering storm drain street work. Site Selection
Two sites were chosen for the study. One at the Dolphins, a residential building across Dallas Rd at Ogden Point, and a second site at Shoal Point. For the purposes of this document, information relates to the Dolphin site (see photo on page 4). 2. Methodology:
Sound measurement occurred in two ways. Wakefield Acoustics Ltd. was contracted to carry out the principal noise acoustics study. In addition, sound measurements were taken throughout James Bay to provide snap-shots of sound.
Nationally recognised, Wakefield Acoustics Ltd. has done studies for Transport Canada, included monitoring sites at residential locations near Ogden Point. Most of these studies are publicly available.
Three sets of dates satisfying the constraints as detailed above were selected. As the first set of dates approached and the weather forecast appeared suitable, the monitoring was set for June 9 – 11, 2009.

Site 1: Dolphin 104 Dallas Road, Victoria The sites chosen for monitoring were the west side of the Dolphins facing Ogden Point (see photo) and a site on the east side of Shoal Point. The equipment, once situated, was visible from the street but did not draw attention to itself.
Acoustics Methodology:
On the morning of June 9, Wakefield Acoustics Ltd established long-term (48-hour) noise-monitoring locations at the two sites. “While continuous unattended noise monitoring was underway at Sites 1 and 2, attended monitoring was also conducted to note the times of the major noise events and their noise levels. This was done at each location on June 10 and 11 during the mid-afternoon.”1 The equipment was removed at about 5 p.m. on June 11. “Continuous ambient noise monitoring was conducted using Larson-Davis Model 820 Community Noise Analyzers … set to collect a complete statistical description of the noise environment every minute. For each… interval, these instruments store the equivalent sound level, or Leq, and the maximum sound level, or Lmax, expressed in units of A-weighted decibels, or dBA. Statistical noise level descriptors, or “Exceedance Levels”, notably L90, were also collected… The L90 represents the sound levels that were exceeded 90% of the time and is considered a measure of the background sound level that exists during the quietest periods. In addition, the Model 820’s also logged the Leq(5 sec) and Lmax(5 sec) expressing a more detailed noise level history in 5 second intervals.” Snap-Shots of Sound:
A volunteer recorded sound measurements of typical activities at various locations throughout James Bay during the days of the Wakefield acoustics monitoring. 3. Observations:
Weather Conditions:
During the study period, temperatures ranged from a low of 10.4°C at night to a daytime high of 20.9°C. Winds were light in morning increasing to 20 knots from SW in afternoon. There was no precipitation. Cruise Ships: (note: scheduled arrival/departure times given with actual arrival in bold)
On June 9 there were no cruise ships in port. June 10 and 11 saw several ships in port. June 10: Carnival Splendor (12:00 -23:59 08:15), Mariner of the Seas (12:00-23:59 11:23) Pacific Princess (17:00-23:59 17:00) June 11: Sea Princess (06:00-14:00 05:50), Rhapsody of the Seas (09:00-18:00 09:00) Celebrity Infinity (14:00-22:00 14:55)
JBNA: Quality of Life and Environment February 2010 Noise page 4
1 Wakefield Acoustics Memorandum, July 17, 2009

JBNA: Quality of Life and Environment February 2010 Noise page 5
Other:
A freighter was in port from June 9 through most of the morning June 10, contributing to an overall higher background noise. A yacht was also in port for part of the period.
Road closures on Superior Street, east of St Lawrence to Montreal, sent some traffic away from the St Lawrence/Erie area.
Trotec Marine used a compressor for 15-20 minutes to power wash boats a few times.
Bus traffic over the two periods of manual monitoring was consistent with similar numbers of buses counted in the observation periods.
BC Transit and Helijet schedules would likely be the same for the three midweek days.
Float plane activities may have varied over the three day period. The use of runway alpha versus runway bravo was not known.
On June 10, Carnival Splendor, scheduled for noon arrival, docked almost 4 hours early at 8:15 am. 4. Project Outcomes:
What the study captured
The Noise study captured typical noise effects during periods when no cruise ship was in port and for periods when three cruise ships were in port. Three cruise ships are frequently in port at the same time (see Cruise Ship schedule).
What the study missed
The study did not succeed in measuring a 24 hour period when no cruise ships were in port. The four hour early arrival of the Carnival Splendor on the morning of June 10 created a surge of traffic activity which served to raise Leq /Ldn values (see figure 1 & 2).
The study did not include attended monitoring in the late night hours, a period of high activity on cruise ship evenings when typically three ships are scheduled to depart before midnight within minutes of each other.
The study did not capture what is thought to be higher non-tourism traffic use of the Dallas area during weekends.
The study was not able to isolate cruise ship (resting) noise from other Ogden sound.
The study did not isolate road traffic noise because it did not remove aircraft noise. “One Minute” Noise Level Histories (see Figures on Following pages)2
Site Location Date Duration Leq Ldn Comment _________________________________________________________________________________________________________________________________________________________________________________________________________________________________________________________________________________________________________________________________________________________________________________________________________________________________________----
Jn 9-10 24 hrs 60.5 dBA 63.6 dBA Cruise Ship docked on 22nd hour of 24-hour monitoring period
1 The Dolphins Jn 10 6.9 hrs 63.4 dBA - Cruise ship arrivals/departures near Ogden during monitoring period
Jn 10-11 24 hrs 63.7 dBA 65.6 dBA Cruise ship arrivals/departures during monitoring period _________________________________________________________________________________________________________________________________________________________________________________________________________________________________________________________________________________________________________________________________________________________________________________________________________________________________________----
2 ibid, p.5 Note: all values in the table below are provided in the Memorandum.

Wakefield Concluding Comments
“The Leq(24) at Site 1, the Dolphins location, was 3.2 dBA higher for the second 24-hour monitoring session day when numerous cruise ships were berthed at Ogden Point. Since the scheduled seaplane and Helijet arrival and departure noise would be roughly the same for the two adjacent 24-hour periods and transit bus noise would be expected to be the same over this period, the increase in noise levels is considered to be largely due to increased tour bus activities associated with the cruise ships. This substantial 3.2 dBA increase in noise levels over 24-hours corresponds, that is, would be equivalent in effect to, roughly a doubling of all transportation noises over the day....”3
Noise Sources and Levels of Sound
Ranges of typical sound levels (Lmax dBA) as measured follow (similar to 2001 studies):
Floatplane departure 69.5 – 82.5 Floatplane arrival 68.8 – 69.5
Tour bus passby 72.0-81.2 BC transit passby 71.9-73.4 (Hybrid 66.8)
Helijet run-up 75.0-75.5 Helijet departure 76.5-88.4 Comparison of 5 second and one minute data (figures created by Tom Coyle with Wakefield data) The figure below was created with a small portion of the Wakefield data. It displays the level of detail that may be obtained from 5 second data.
JBNA: Quality of Life and Environment February 2010 Noise page 6
June 11 Site 2 - 5 second data
45
55
65
75
85
95
105
Time 10:58:19 11:06:39 11:14:59 11:23:19 11:31:39 11:39:59 11:48:19 11:56:39 12:04:59 12:13:19 12:21:39 12:29:59 12:38:19 12:46:39 12:54:59 13:03:19 13:11:39
Nois
e Le
vel
GL DD GL DD
FP
CVCV, BCT, CV
PCLVSS BIGBUS
PWWS
CVGL Titantic
3 ibid, p.10

Graphic representation of Leq, Lmax and Ldn sound measures
Figures on page 7 were created by Wakefield Acoustics from the data collected on a one minute basis.
JBNA: Quality of Life and Environment February 2010 Noise page 7

JBNA: Quality of Life and Environment February 2010 Noise page 8
Snap-Shots of Sound “Random” measurements were made throughout James Bay to assess the impact of transportation throughout James Bay. Sound measures were also taken at an early hour (6- 6:30 am) when there was no cruise ship activity and little residential traffic. Noise levels on Simcoe St from Dallas towards Oswego varied from Lmax 33.7dBA to 41.2 dBA.
5. Wakefield Studies and Interpretation Wakefield Acoustics Ltd has produced several sound studies for Transport Canada and private sector clients in the James Bay area over the past several years. For a few of these studies, 90 Dallas and 130 Dallas, near Ogden Point were chosen as monitoring sites. The following table has summary data from near-Ogden sites.
Location year Ldn Leq(24) Comment ____________________________________________________________________________________________________________________________________________________________________________________________________________________
140 Dallas (Dolphins) 2009 65.6 63.7 Cruise ship days 63.4 afternoon – ships <63.6 <60.5 2-3hrs cruise ship _________________________________________________________________________________________________________________________________________________________________________________________________________________________________________________________________________________________
130 Dallas 2000 62.3 planned Ldn 62 2001 63.4 61.0 planned Ldn 57 _________________________________________________________________________________________________________________________________________________________________________________________________________________________________________________________________________________________
86/90 Dallas 1999 planned bravo 49 dBA 2000 62.4 planned Ldn 57 2001 64.7 61.8 planned Ldn 56 _________________________________________________________________________________________________________________________________________________________________________________________________________________________________________________________________________________________
From 1999 through to 2009, Wakefield carried out 5 studies which related to environmental noise. In the earlier studies, the level of aircraft noise, and particularly the role that aircraft noise makes on West James Bay, varied. In 1999, the aircraft noise contribution along Dallas was expected to be 47dBA at Simcoe and 49 at 86/90 Dallas. But in the 2000 and 2001 studies, it is apparent that measured noise levels and anticipated noise levels are not the same. During this period, due to possible competing noise effects, the site used for monitoring was shifted. Due to the uncertainly in the analysis introduced by the somewhat minor shift in location, the report states that comparison of 2000 and 2001 cannot be “considered conclusive”. However, having said this, the report goes on to state that, although in 2000 wherein the helicopter activity was the major contributing source to the high daily noise exposure at 130 Dallas Road, the traffic contribution was significant at 57.6 dBA. In 2001, Dallas Road traffic was considered to be the most major source contributing 62.3 dBA of the Ldn 63.4 dBA.4
4 Transport Canada Victoria Harbour Aircraft Noise Measurement Project Year 2001: Report prepared by Wakefield Report Acoustics Ltd May 2002, p.34 “The Ldn …(130 Dallas Road) in 2001, at 63.4 dBA, was

JBNA: Quality of Life and Environment February 2010 Noise page 9
Since the comments made about primary and secondary noise sources are somewhat dependent upon manned observation periods, the selection of contributing noise sources is somewhat dependent upon the time period during which the monitoring is done. Comparison of all noise sources including competing but significant sources such as floatplanes, helicopters and vehicular traffic is a mug’s game. Each and all contribute to the noise along the west side of James Bay. The season, cruise ships in port, the day of the week, and the time of day all work to determine which noise is prominent at any point in time. There are several reasons why the 2009 results are somewhat different than those of the previous Wakefield studies.
· The sites were well located and discreet, thereby minimizing driver alteration of noise.
· The increased cruise ship activity has resulted in higher numbers of large vehicles servicing the industry.
· Increased number of vehicles, speed of vehicles, and size of vehicles undoubtedly affect traffic noise levels (see Appendix B). 6. Community Noise: What are the effects?
“The growth in noise pollution is unsustainable because it involves direct, as well as cumulative, adverse health affects.”
The most referenced document for Community noise is the WHO Guidelines for Community Noise (1999) (see Appendix C). The control of environmental noise has been hampered by insufficient knowledge of its effects on humans and of dose-response relationships. Specific effects to be considered include: interference with speech; noise induced hearing loss (NIHL); sleep disturbance effects; cardiovascular and psycho-physiological effects; performance reduction effects; annoyance responses; and effects on social behaviour. The WHO Guidelines are recognised, to varying degrees, throughout the world in the creation of urban noise policies. These guidelines recommend that governments establish plans that apply to both new construction as well as to existing buildings. In Canada, the Canadian Mortgage and Housing Corporation and Transport Canada have, at the national level, created policies and guidelines which address noise. Although these policies are laudable, they are focussed, or perhaps interpreted, as being applicable only to new housing. · “CMHC identifies Leq(24) 55 as the threshold above which road or rail noise can begin to significantly interfere with essential human activities”. · Transport Canada has “with … the National Research Council, identified a similar threshold of Noise Exposure Forecast (NEF) 25” which equates to Leq(24) 56. “In a
1.1 dBA higher that that measured in 2000. Contrary to the conclusion reached in the 2000 report, it is now recognized that the overall daily noise exposure … is dominated by Dallas Road traffic.”

JBNA: Quality of Life and Environment February 2010 Noise page 10
recent (May 1996) amendment … Transport Canada recommends against residential development above NEF 30”. Transport Canada’s commitment to national sustainability programs with respect to noise and to the Transport Canada acknowledgement of the importance of noise in its policy document Part 4: Key Issues in Transportation and Themes for 2007-2009, states: “Air and noise pollution, especially in urban areas, decrease Canadians’ quality of life and contribute to health problems.” If existing policies and recommendations in Canada and in the City of Victoria were applied to existing housing along the west side of James Bay (particularly south/east of 60 Dallas), remediation would be required. When sound levels of over 60 dBA exist, housing requires more insulation than average housing. This would apply especially to housing south of 60 Dallas. Above 70 Ldn is not habitable. 7. Closing Comments:
James Bay is a challenged community. The growth in cruise tourism has contributed to the overall soundscape of the area in a negative way for residents whose homes are near Ogden Point or the routes frequented by vehicles servicing the industry. Buses operating within James Bay could be categorized into six groups. There are BC Transit buses, shuttle buses, Hop on/off buses, cruise tour buses, other tour buses, and school buses. Many of these operations, particularly those with fixed routes, have been established without any community consultation. James Bay is, overall, a residential area. It is NOT downtown. Most residents in James Bay live in multi-family dwellings, either four storey walk-ups or higher apartment buildings. Unlike downtown multi-unit residences, these buildings are designed for residential living on all floors. They do not have large “buffers” of retail and/or commercial floors and plazas below them. In James Bay, as elsewhere, there are residents who are in their homes for most hours of each day. Given the demographics of James Bay residents, these residents would include seniors with limited mobility. It would also include employees and self-employed business people working from their homes. (8% of employed work out of homes, including 40% of self-employed who work out of their homes) Problems arising from traffic are the most pressing community issues at JBNA forums.
Too many people have left the community due to on-going noise disturbances. Buildings along the Quebec/Kingston/StLawrence/Erie/Dallas route may become 'hollow buildings' with part-time residents who are rather more visiting Victoria than contributing to the community in a substantive way. Victoria, in the long term, will pay a large cost if neighbourhoods lose full-time residents. Victoria needs tourism; we also need to encourage the industry to be green. Greening of people movement (particularly tourism) throughout the city will become increasingly important to all Victoria communities. Other cities have successfully tackled this problem. It is time Victoria dealt with the issue.
Good Tourism interacts with community
Bad Tourism impacts on a community
JBNA: Quality of Life and Environment February 2010 Noise page 11
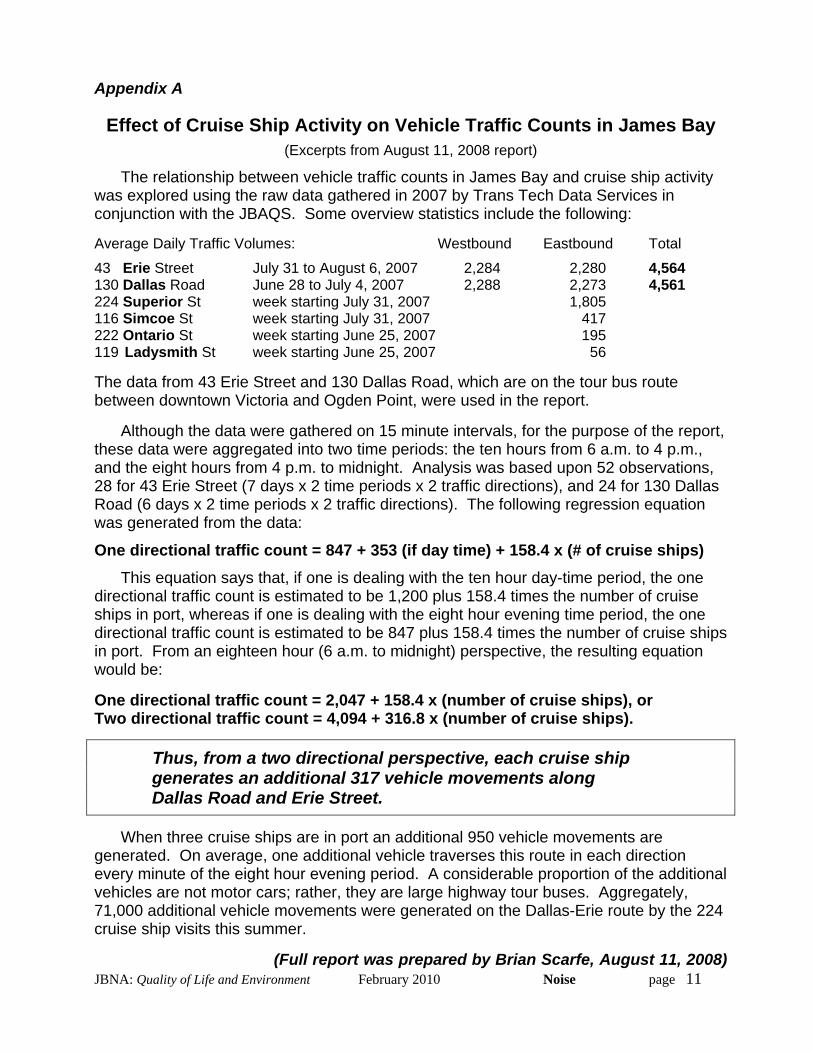
Appendix A
Effect of Cruise Ship Activity on Vehicle Traffic Counts in James Bay
(Excerpts from August 11, 2008 report)
The relationship between vehicle traffic counts in James Bay and cruise ship activity was explored using the raw data gathered in 2007 by Trans Tech Data Services in conjunction with the JBAQS. Some overview statistics include the following: Average Daily Traffic Volumes: Westbound Eastbound Total
43 Erie Street July 31 to August 6, 2007 2,284 2,280 4,564 130 Dallas Road June 28 to July 4, 2007 2,288 2,273 4,561 224 Superior St week starting July 31, 2007 1,805 116 Simcoe St week starting July 31, 2007 417 222 Ontario St week starting June 25, 2007 195 119 Ladysmith St week starting June 25, 2007 56 The data from 43 Erie Street and 130 Dallas Road, which are on the tour bus route between downtown Victoria and Ogden Point, were used in the report. Although the data were gathered on 15 minute intervals, for the purpose of the report, these data were aggregated into two time periods: the ten hours from 6 a.m. to 4 p.m., and the eight hours from 4 p.m. to midnight. Analysis was based upon 52 observations, 28 for 43 Erie Street (7 days x 2 time periods x 2 traffic directions), and 24 for 130 Dallas Road (6 days x 2 time periods x 2 traffic directions). The following regression equation was generated from the data:
One directional traffic count = 847 + 353 (if day time) + 158.4 x (# of cruise ships)
This equation says that, if one is dealing with the ten hour day-time period, the one directional traffic count is estimated to be 1,200 plus 158.4 times the number of cruise ships in port, whereas if one is dealing with the eight hour evening time period, the one directional traffic count is estimated to be 847 plus 158.4 times the number of cruise ships in port. From an eighteen hour (6 a.m. to midnight) perspective, the resulting equation would be: One directional traffic count = 2,047 + 158.4 x (number of cruise ships), or Two directional traffic count = 4,094 + 316.8 x (number of cruise ships).
Thus, from a two directional perspective, each cruise ship generates an additional 317 vehicle movements along Dallas Road and Erie Street.
When three cruise ships are in port an additional 950 vehicle movements are generated. On average, one additional vehicle traverses this route in each direction every minute of the eight hour evening period. A considerable proportion of the additional vehicles are not motor cars; rather, they are large highway tour buses. Aggregately, 71,000 additional vehicle movements were generated on the Dallas-Erie route by the 224 cruise ship visits this summer. (Full report was prepared by Brian Scarfe, August 11, 2008)

Appendix B
How Traffic Volume Affects noise
2000 vehicles per hour sound twice as loud as
200 vehicles per hour
How Speed Affects Traffic Noise
Traffic at 65 miles per hour (approx. 105 km/hr) sounds twice as loud as
Traffic at 30 miles per hour (approx. 48 km/hr)
How Trucks Affect Traffic Noise
One truck at 55 miles per hour (approx. 89 km/hr) sounds as loud as
28 cars at 55 miles per hour (approx. 89 km/hr) Federal Highway Administration, 2006 JBNA: Quality of Life and Environment February 2010 Noise page 12

JBNA: Quality of Life and Environment February 2010 Noise page 13
Appendix C World Health Organization: Community Noise General 21 page document: http://www.ruidos.org/Noise/Comnoise-1.pdf Same study/guidelines but fleshed out more: http://www.who.int/docstore/peh/noise/guidelines2.html The following table is from this link: http://www.who.int/mediacentre/factsheets/fs258/en/
WHO RESPONSE
WHO has responded in two main ways: by developing and promoting the concept of noise management, and by drawing up community noise guidelines. The field is marked by a scarcity of literature, especially for developing countries. Some 20 years after its last publication on noise, WHO has issued Guidelines for Community Noise. This publication, the outcome of a WHO expert task force meeting in London in March 1999, includes guideline values for community noise (listing also critical health effects ranging from annoyance to hearing impairment), for example: (ref Guidelines p. XVIII)
Environment Critical health effect Sound level dB(A)* Time hours
Outdoor living areas Annoyance 50 - 55 16
Indoor dwellings Speech intelligibility 35 16
Bedrooms Sleep disturbance 30 8
School classrooms Disturbance of communication 35 During class
Industrial, commercial and traffic areas Hearing impairment 70 24
Music through earphones Hearing impairment 85 1
Ceremonies and entertainment Hearing impairment 100 4
*The ear has different sensitivities to different frequencies, being least sensitive to extremely high and extremely low frequencies. (ref Fundamentals of Acoustics p. 19) Because of this varied sensitivity, the term "A weighting" is used: all the different frequencies, that make up the sound, are assessed to give a sound pressure level. The sound pressure level measured in dB is referred to as "A-weighted" and expressed as dB(A). (ref Guidelines p.IX and X).
The guidelines also offer recommendations to governments for implementation, such as extending (and enforcing) existing legislation and including community noise in environmental impact assessments. The role of WHO is to provide leadership and technical support.