jason barber, joel honeyman, and brenda lantz the … ... chapter 2. literature review ... providers...
TRANSCRIPT

LOGISTICAL CAPABILITIES OF TRUCKING FIRMS
Jason Barber, Joel Honeyman, and Brenda LantzThe Upper Great Plains Transportation Institute
North Dakota State UniversityFargo, North Dakota
August 1997

Disclaimer
The contents of this report reflect the views of the authors, who are responsible for the facts andthe accuracy of the information presented herein. This document is disseminated under the sponsorship ofthe Department of Transportation, University Transportation Centers Program, in the interest ofinformation exchange. The U.S. Government assumes no liability for the contents or use thereof.

Table of Contents
CHAPTER 1. INTRODUCTION . . . . . . . . . . . . . . . . . . . . . . . . . . . . . . . . . . . . . . . . . . . . . . . . . . . . . 1Research Objectives . . . . . . . . . . . . . . . . . . . . . . . . . . . . . . . . . . . . . . . . . . . . . . . . . . . . . . . . 2Report Organization . . . . . . . . . . . . . . . . . . . . . . . . . . . . . . . . . . . . . . . . . . . . . . . . . . . . . . . . 3
CHAPTER 2. LITERATURE REVIEW . . . . . . . . . . . . . . . . . . . . . . . . . . . . . . . . . . . . . . . . . . . . . . . . . 3The Trucking Industry After Deregulation . . . . . . . . . . . . . . . . . . . . . . . . . . . . . . . . . . . . . . . . 3Logistics in the Trucking Industry . . . . . . . . . . . . . . . . . . . . . . . . . . . . . . . . . . . . . . . . . . . . . . 6Information Systems and Technology . . . . . . . . . . . . . . . . . . . . . . . . . . . . . . . . . . . . . . . . . . . 7
Electronic Data Interchange . . . . . . . . . . . . . . . . . . . . . . . . . . . . . . . . . . . . . . . . . . . . 7Computer Software Used in Information Systems . . . . . . . . . . . . . . . . . . . . . . . . . . . . . . 9Barcoding . . . . . . . . . . . . . . . . . . . . . . . . . . . . . . . . . . . . . . . . . . . . . . . . . . . . . . . . 10Satellite Tracking Systems . . . . . . . . . . . . . . . . . . . . . . . . . . . . . . . . . . . . . . . . . . . . 10
CHAPTER 3. RESEARCH METHODS . . . . . . . . . . . . . . . . . . . . . . . . . . . . . . . . . . . . . . . . . . . . . . . . 13Data Collection . . . . . . . . . . . . . . . . . . . . . . . . . . . . . . . . . . . . . . . . . . . . . . . . . . . . . . . . . . 13
Survey Group Selection . . . . . . . . . . . . . . . . . . . . . . . . . . . . . . . . . . . . . . . . . . . . . . 13Mailings . . . . . . . . . . . . . . . . . . . . . . . . . . . . . . . . . . . . . . . . . . . . . . . . . . . . . . . . . 14Survey Design . . . . . . . . . . . . . . . . . . . . . . . . . . . . . . . . . . . . . . . . . . . . . . . . . . . . . 14
Data Analysis . . . . . . . . . . . . . . . . . . . . . . . . . . . . . . . . . . . . . . . . . . . . . . . . . . . . . . . . . . . 15
CHAPTER 4. EMPIRICAL RESULTS . . . . . . . . . . . . . . . . . . . . . . . . . . . . . . . . . . . . . . . . . . . . . . . . 18Overall Survey Results . . . . . . . . . . . . . . . . . . . . . . . . . . . . . . . . . . . . . . . . . . . . . . . . . . . . . 18
Respondent Characteristics . . . . . . . . . . . . . . . . . . . . . . . . . . . . . . . . . . . . . . . . . . . . 18Table 4.1. Percent of Respondents Based on Number of Power Units . . . . . . . . 19Table 4.2. Percent of Respondents Based on Equipment Usage . . . . . . . . . . . . . 19Table 4.3. Percent of Respondents based on Region(s) they Serve . . . . . . . . . . 20Figure 1. Federal Regions (Department of Transportation). . . . . . . . . . . . . . . . . 21
Scope of Logistical Services Offered . . . . . . . . . . . . . . . . . . . . . . . . . . . . . . . . . . . . . 21Table 4.4. Logistical Services Being Offered by Trucking Firms . . . . . . . . . . . . 22
Technology Characteristics . . . . . . . . . . . . . . . . . . . . . . . . . . . . . . . . . . . . . . . . . . . . 24Table 4.5. Overall Ranking of Features for Firms Using EDI . . . . . . . . . . . . . . . 24
Opinions on Current Policies and Trends . . . . . . . . . . . . . . . . . . . . . . . . . . . . . . . . . . 26Table 4.6. Responses to Opinion Questions Concerning Industry Trends . . . . . . 27
Survey Results Based on Company Size . . . . . . . . . . . . . . . . . . . . . . . . . . . . . . . . . . . 27Table 4.7. Percent of Respondents Using EDI, Satellite Technology,
and Close Partnerships with Shippers Based on Firm Size . . . . . . . . . . . 28Table 4.8. Opinion Question Results Based on Number of Power Units . . . . . . . 30
CHAPTER 5. SUMMARY AND CONCLUSIONS . . . . . . . . . . . . . . . . . . . . . . . . . . . . . . . . . . . . . . . . 33Discussion . . . . . . . . . . . . . . . . . . . . . . . . . . . . . . . . . . . . . . . . . . . . . . . . . . . . . . . . . . . . . 35
BIBLIOGRAPHY . . . . . . . . . . . . . . . . . . . . . . . . . . . . . . . . . . . . . . . . . . . . . . . . . . . . . . . . . . . . . . . 38
APPENDIX A: Actual Survey Sent to Trucking Firms . . . . . . . . . . . . . . . . . . . . . . . . . . . . . . . . . . . . . 40


1
CHAPTER 1. INTRODUCTION
Logistics and value-added services are becoming increasingly important in the trucking industry.
Shippers are not only looking for reliable transportation of their products, but often are interested in
other related services that add value to their products. Not surprisingly, many trucking companies are
positioning themselves to take advantage of opportunities to better serve their customers. Some of these
firms are beginning to offer a variety of services beyond their traditional transportation business
(Bigness, 1995).
There are a variety of reasons for the trend of trucking firms providing logistical services. First,
deregulation of the trucking industry has allowed motor carriers greater freedom in choosing which
markets and routes they serve, and has allowed them to negotiate long-term contracts with shippers.
These changes have enabled carriers and shippers to develop close relationships, which encourage
cooperation and sharing of information. As a result, many shippers have enjoyed improved service
levels and greater efficiency in their supply chain, improving their competitive position.
A second reason can be traced to recent philosophical changes regarding manufacturing in the
U.S. To remain competitive in the domestic and global environment, U.S. firms have been forced to
improve the efficiency of their operations and the quality of their products. This has resulted in Just-In-
Time (JIT) inventory management practices and quick response replenishment programs, similar to
programs used in Japan for many years (Bigness, 1995). With an emphasis on JIT and other programs,
the importance of logistics management has increased. These reasons have contributed to a demand for
third-party logistics services by manufacturing firms. Due to their core competencies in transportation
and related services, trucking firms have begun to fill the niche of providing these logistics services.

2
According to industry experts, the outsourcing of logistics has enormous growth potential.
Currently, U.S. manufacturers “hire third-party companies for only about 12 percent of their logistics,”
however “with the increased competition in a global economy, companies will find it more efficient to
outsource as much as 25 percent to 30 percent” (Bigness, 1995). An indication of this trend is that 16
of the largest 23 logistics companies have been created in the past eight years (Bigness, 1995).
While large trucking firms such as Schneider, J.B. Hunt, Ryder, and Roadway have led the way
in developing logistics management services, many smaller trucking companies also are offering value-
added services for their customers. Examples of these services include light subassembly, packaging,
warehousing, as well as inventory and supply chain management.
Research Objectives
The objectives of this research are to determine how regional trucking firms are incorporating
logistical services into their business, show some of the current trends regarding logistics in the trucking
business, and allow firms to evaluate themselves against the rest of the industry. The specific objectives
are:
1. Describe how the trucking industry has evolved since deregulation, and how the
industry is responding to the demand for logistical services.
2. Survey a random sample of firms from Minnesota, South Dakota, North Dakota,
Colorado, Montana, Wyoming, Utah, Iowa, and Nebraska to gather information on the
industry.
3. Evaluate how firms in the trucking industry are responding to current trends.
3
Report Organization
The report is divided into four remaining chapters. A literature review is presented in Chapter 2,
which summarizes a brief history of the trucking industry after deregulation, current technologies used in
the trucking industry, and a background description of logistics management. The survey instrument is
described in Chapter 3. Empirical results to the study are presented in Chapter 4. Finally, a summary
and conclusions are presented in Chapter 5.


5
CHAPTER 2. LITERATURE REVIEW
In this chapter, a brief history of the trucking industry after deregulation is described. This
section provides a historical background for the introduction of logistics services in the industry. In
addition, some logistics services are described, which are currently popular in the trucking industry.
Finally, current technologies such as satellite tracking and EDI are described.
The Trucking Industry After Deregulation
The Motor Carrier Act of 1980 substantially changed how motor carriers operate in the U.S.
The purpose of this legislation was to relax some of the federal regulations that had controlled the
trucking industry since 1935. Some of the important characteristics of the act included easing of criteria
for common carrier certification, creating a “fitness only” criterion for certain kinds of transportation.
The new criterions curtail the ability of existing carriers to protest entry, easing of restrictions on
commodities transported, points served, or routes traversed, and the establishment of a “zone of
reasonableness” for adjusting rates (Felton and Anderson, 1989).
The Motor Carrier Act of 1935, which regulated the industry, was mainly a product of the
Great Depression (Felton and Anderson, 1989). Due to the extreme economic hardship that affected
all sectors of the economy, the federal government was willing to try drastic measures to end the crisis.
In addition, regulating motor carriers was considered to be maintaining fair competition because the
railroads were already regulated. However, once the Great Depression ended, very little change
occurred in motor carrier legislation until the Motor Carrier Act of 1980. Changes that finally occurred
were due to changing political and economic environments, in addition to the regulatory experience

6
itself. Similar to the motor carrier industry, rail and air transportation modes underwent deregulatory
changes during the same time (Felton and Anderson, 1989).
Since deregulation, there have been some major changes in the industry that have contributed to
the development of trucking firms’ involvement in offering logistical services and the third party logistics
industry. One of the most important changes caused by deregulation has been the shippers’ ability to
reduce the number of carriers with whom they do business (Glaskowsky, 1986). In addition,
deregulation has allowed “route rationalization” so carriers can serve any markets they wish. Route
rationalization was not allowed under regulation when motor carriers had very restrictive operating
certificates, which limited operating routes. Reducing the number of carriers allows shippers to develop
close relationships, resulting in improved service (Thomas, 1994).
Detroit Diesel is an excellent example of the development of close relationships between
carriers and shippers. In 1986 Detroit Diesel began its quality transportation program, reducing the
number of carriers from 131 to 14. Detroit Diesel had increased service levels and productivity by
reducing the number of carriers used in its operation and developing close relationships with those
remaining (Thomas, 1994).
Another change in the motor carrier industry resulting from deregulation is that carriers are now
free to negotiate long-term contracts with customers. Contracts allow manufacturing companies to
eliminate their private carrier fleets, resulting in cost savings and freeing up capital for other ventures
(Cullen, 1996). Also, long-term contracts between carriers and shippers stimulate the development of
close partnerships. These close partnerships encourage the partnering firms to work as a team focusing
on quality, rather than as adversaries who negotiate service based strictly on price. Deregulation has

7
created more market opportunities for contract carriers and allowed carriers to develop “tailored”
service for their shipping customers (Glaskowsky, 1986).
Similar to motor carriers, other modes in the transportation industry have undergone changes
following deregulation. It has been argued that since deregulation, “largely artificial boundaries among
transportation modes (LTL, TL, air freight, railroads, barges, and so forth) have been vanishing.
Without the arbitrary restrictions imposed by regulatory systems, the transportation services sector is
becoming one market rather than separate markets. In fact, largely as a result of deregulation, shippers
are increasingly oriented toward a total, integrated logistics operation (including inventory management,
handling, and warehousing) rather than simply purchasing transportation” (Elzinga, 1994). With changes
in the economic environment, motor carriers are not only competing among themselves, but also with
other modes. Offering logistics services is one area where trucking firms can gain a competitive
advantage over rival firms in today’s market.
Logistics in the Trucking Industry
Logistics covers a broad spectrum of activities that businesses have been carrying out for many
years. These activities include transportation, inventory management, order processing, purchasing,
warehousing, materials handling, packaging, customer service, and scheduling (Balou, 1992).
Traditionally, logistical functions were carried out by the companies that needed them to produce
and/or deliver products. However, over the past two decades this practice has begun to change.
Increased global competition and changing market conditions have forced firms to become more
efficient and responsive to customer needs. This has opened up many opportunities for outside firms, or
“third-party” providers, to offer logistical services (Cullen, 1996).

8
Manufacturers and producers are outsourcing logistical functions for many reasons. First,
outsourcing allows firms to reduce costs and liabilities, or cost centers. Industry experts believe
outsourcing is necessary for firms to concentrate on their “core competencies,” or those activities firms
engage in to make money (Cullen, 1996). Second, outsourced logistics generally cost less than doing it
in-house (Cullen, 1996). Companies with large fleets or warehouse space usually can contract with
shippers at a reduced cost. Executives and managers often look to outsourcing logistics to reduce
physical assets and to reduce the costs of liability and government compliance (Cullen, 1996). Finally,
firms can gain flexibility by outsourcing logistics activities. “When business is down, you still own the
private fleet or warehouse. But if you’re using a public or contract warehouser and for-hire carriers,
you don’t pay when you don’t have inventory” (Cullen, 1996).
Many firms in the trucking industry have recognized the potential business that exists by offering
logistical activities and providing greater value to their customers. One estimate has the market for
outsourced logistics services worth $374 billion, with $278 billion going to transportation. However,
providers of outsourced logistics have only realized 2.5 percent, or $10 billion, of the total opportunities
(Cullen, 1996). Not surprisingly, the trucking industry has taken the lead in this initiative. In 1994,
motor carrier freight costs were estimated to account for more than 50 percent of the total logistics
costs in the U.S. (Delaney, 1995). Initiatives such as Just-In-Time (JIT), Electronic Consumer
Response (ECR), Quick Response, and Materials Requirements Planning (MRP) depend on accurate
and timely shipments, which motor carriers can provide. However, carriers must have access to
information and be involved in close relationships with their shipping customers for these and other
logistics initiatives to succeed (Cullen, 1996).

1Portions of this section were largely adapted from Barber and Dooley (1996).
9
Information Systems and Technology
The flow of information has become vitally important in today’s business environment.1 In
recent years, new information technology has made initiatives such as JIT and MRP II possible, and has
made outsourcing of logistics activities possible (Cullen, 1996). These new technologies have greatly
impacted many industry sectors, including transportation and logistics, by improving information flows
throughout the entire supply chain. This has allowed for the reduction of inventories and more accurate
tracking of the flow of materials (Robeson and Copacino, 1994). This substitution of information for
inventory is occurring because “the cost of information has been declining relative to other expenses
such as land, labor, and capital” (Robeson and Copacino, 1994).
Electronic Data Interchange
An important component of information systems is electronic data interchange (EDI). Electronic
data interchange is a format that links organizations and computer systems. The “purpose of EDI is to
eliminate duplicate data entry and to improve the speed and accuracy of the information flow by linking
computer applications between companies” (Robeson and Copacino, 1994). A key characteristic of
EDI is that it is intended to be a computer-to-computer link that does not require human interpretation,
thereby reducing data entry errors and time caused by multiple entry (Robeson and Copacino, 1994).
EDI is used for two primary purposes: to improve customer service and to improve the
efficiency of the logistical system (Robeson and Copacino, 1994). Examples of EDI usage include the
processing of freight bills, purchase order processing, and to enhance Just-In-Time (JIT) systems. In

10
addition, inventory reduction is often possible with the use of EDI (Robeson and Copacino, 1994). EDI
and other systems are so important that they are becoming “the key to taking costs out of a supply
chain operation without compromising the needs of the customer’s customer” (Cullen, 1996).
Similar to other industries, EDI is becoming more prevalent in the trucking industry. In fact, the
use of EDI may become extensive in the trucking industry because of the importance of transportation
in the supply chain (Crum, Premkumar, and Ramamurthy, 1996). A study recently completed by Crum,
Premkumar, and Ramamurthy (1996) looked exclusively at EDI in the trucking industry. The study
focused on Class I and II carriers with respect to annual revenues. Revenues of firms in the study
ranged from $5 million to greater than $1 billion.
This study showed that on average, trucking firms currently using EDI (i.e., adopters) are more
than twice as large as those not using EDI (i.e., non-adopters), suggesting that a firm’s size affects its
ability or willingness to implement EDI. However, it also should be noted that there were a number of
EDI adopters in the smallest size category. In addition to size, several environmental and organizational
factors were found to be different between adopters and non-adopters. Interestingly, most adopters in
the study implemented EDI because of initiatives from their large shipping customers. It appears that
most carriers feel the greatest benefits of EDI relate to customer service and marketing. Finally, one of
the study’s conclusions suggests “that non-adopters need to be educated about the benefits of EDI
relative to their current way of doing business” (Crum, Premkumar, Ramamurthy).
Computer Software Used in Information Systems
Computer software is a key component in any information system. Many types of software
exist for virtually all business functions. Areas that have grown rapidly in recent years are MRP and

11
computer integrated manufacturing (CIM) software. This market segment was predicted to generate
revenue of more than $2 billion in 1995 (Industrial Engineering, 1991). While most MRP II systems are
essentially similar, software has to be tailored to each individual firm. Types of hardware, size of the
system, and functionality determine what software package is needed. As more firms continue to
implement MRP II and better information systems, the demand for better software packages will grow.
Four factors will influence information system software development in the future (Industrial
Engineering, 1991). First is the continued integration of business functions throughout an organization
and the supply chain. The growing importance of JIT is the second factor influencing software
development. The third factor is hardware compatibility. Finally, shifts in hardware usage from
mainframes to mini and microcomputers as smaller machines become more powerful will influence
software development of information systems. While computers will continue to become an even more
important component of inventory management, the costs of these systems should drop and the
capabilities improve (Industrial Engineering, 1991).
A new type of software is finite-capacity-scheduling (FCS), which is used to enhance MRP
systems with regard to scheduling. Many managers do not understand how to fix scheduling problems,
but FCS software helps production planners solve problems by coordinating resources such as
manpower, machinery, and materials. While MRP tells a manager what is needed, it assumes there is
infinite capacity and does not recognize constraints. Finite-capacity-scheduling software is a planning
tool that is designed to handle some of these problems. Many companies have noticed significant cost
savings after they have implemented FCS software. For example, Crescent Manufacturing Company, a
firm in Ohio that produces 600 different products, already operated in a JIT system, but they scheduled
12
manually. Benefits of adding an FCS package included “reducing lead time from 60 to 30 days,
reducing inventory by 30 percent, and cutting setup time by at least 20 percent” (Stevens, 1994). Other
benefits that firms noticed with FCS were improved customer service and increased production
capacity (Stevens, 1994).
Barcoding
Barcoding has become popular due to its accuracy and speed. It entails the use of a scanner to
“scan” the universal product code (UPC) symbols on products. Data are then recorded automatically
for inventory purposes. Trends have shown that nearly 80 percent of companies are now using
barcoding for almost all products that move through their system (Robeson and Copacino, 1994).
Satellite Tracking Systems
Satellite technology is having a major impact on the trucking industry (Coyle, Bardi, and
Novack, 1994). Satellite tracking systems allow carriers to determine the exact location of a shipment
and relay this information to the customer. In addition, these systems can be used to route drivers to
loads or advise them of road and weather conditions. A home-based computer can transmit this
information to individual drivers through onboard computers. Satellite technology will continue to evolve
and become more important in the motor carrier industry (Coyle, Bardi, and Novack, 1994).
In this chapter, changes in the trucking industry since deregulation were summarized, including
how relationships between carriers and shippers have changed. Logistics in the trucking industry also
was discussed. This included how the demand for logistics services is increasing and some of the

13
opportunities that exist for third-party providers. Finally, the impacts of information systems and
technology on logistics and the trucking industry were examined.


15
CHAPTER 3. RESEARCH METHODS
In this chapter, the survey used in the study is discussed, as is data collection and data analysis
procedures. The section on data collection includes a discussion of the survey group selection and
mailings. A summary of the response rate to the survey also is shown in this chapter.
Data Collection
To better understand how trucking firms are responding to the demand for third-party logistics
services, a mail survey was sent to a sample of regional firms (Appendix A). This survey was used to
determine current capabilities regarding technology such as EDI and satellite systems, in addition to
logistics services that firms currently are offering. The survey also queried managers about their opinions
on specific topics, such as the impacts of technology and logistics on their business. Analysis and results
of collected data are presented in the next chapter. The survey and analysis techniques are further
described in this chapter.
Survey Group Selection
Surveys were mailed to a random sample of regional truckload (TL) firms operating more than
three power units. The sample was drawn from the National Motor Carrier Directory compiled by
Transportation Technical Services. Companies from the following states were included in the study:
Minnesota, South Dakota, North Dakota, Colorado, Montana, Wyoming, Utah, Iowa, and Nebraska.
Only truckload (TL) carriers were included in the study, but some firms indicated they also offered less-
than-truckload (LTL) services. Companies of varying sizes were sent the survey.

16
Mailings
A total of 1,035 surveys was mailed during the week of February 3, 1997. Two weeks later, a
reminder postcard was mailed to every firm in the original mailing. Ten surveys were returned as
undeliverable. In addition, approximately 20 firms responded either in writing or with a telephone call
that the survey did not pertain to them and they were not interested in filling it out. Of the surveys
returned, 116 contained usable information for a usable response rate of 11 percent.
Survey Design
The survey was a mail questionnaire consisting of 23 questions. It contained a combination of
open-ended and forced answer questions (see Appendix A for the complete survey). The survey was
separated into four main topic areas. The first section, containing four questions, was designed to
determine the scope of logistics services currently offered by the firm. The first question listed some
logistics services and asked respondents to indicate which services they currently offer and what
percentage of their customers use the service. The remaining questions asked when the firm began
offering logistics services and if these services are offered to clients other than their trucking customers.
The second section queried respondents about the use of technology in their firm. Included
were a number of questions about EDI. Respondents were asked to indicate the percent of their
customers that use each listed EDI function. This section also questioned respondents about their use of
satellite tracking and communication systems.
The next section contained questions concerning managers’ opinions about current logistics
related policies and trends in the trucking industry. These questions were presented in a scaled format
and included a range of five choices for each particular question. The purpose of this section was to

17
determine how trucking managers perceive the value of logistics services, technology, and close
partnerships with customers.
Firm characteristics was the topic of the final section of the survey. The first question in this
section queried respondents about close relationships, or preferred transportation provider programs,
their firm may be developing with its shipping customers. A close relationship is one where both parties
engage in cooperative practices, such as sharing information and negotiating service rates based on
overall value rather than lowest price. The goal of these programs is to create a win/win situation for
both parties involved in the partnership and eliminate traditional adversarial relationships.
This section also included questions about regions of the country the firm regularly serves, the
number of power units, and types of equipment operated. In addition, a question was asked that
ascertained the revenue contributions of logistics operations and trucking operations in percentage
terms to the firm’s total revenue. The primary purpose of this section was to categorize firms for further
analysis.
The last page of the survey provided respondents the opportunity to provide any additional
comments they had. A cover letter was included with the mailings to outline the objectives of the study.
A postage paid return envelope also was enclosed with each mailed survey.
Data Analysis
Data were entered into a Microsoft Access database as surveys were returned. Once the data
were ready to be analyzed, they were converted into a spreadsheet format in Microsoft Excel. Excel
was used to compute relevant statistics such as means, variations, and frequencies. The SAS (Statistical
Analysis Software) system also was used to compute more advanced statistics. In addition, the overall

18
data set was split into groups determined by firm size for analysis. The following chapter describes the
results of this analysis.

19
CHAPTER 4. EMPIRICAL RESULTS
Included in this chapter is a discussion of the results of the survey. Overall results are presented,
in addition to analysis based on firm size.
Overall Survey Results
A mail survey was used to gather data about logistical practices in the trucking industry
(Appendix A). Results are reflective of many different sized firms in the industry. However, many small
trucking firms, especially those in specific niche markets, indicated that many questions in the survey did
not apply to their operation.
Respondent Characteristics
A wide range of firms, based on the number of power units, responded to the survey (Table
4.1). Approximately 12.3 percent of respondents were very small firms with five or fewer power units,
25.4 percent indicated between six and 15 power units, 30.7 percent had 16 to 50 power units, 21.1
percent had 51 to 100 power units, and 10.5 percent of the sample consisted of large firms with more
than 100 power units. A following section of this chapter describes results based on firm size.

20
Table 4.1. Percent of Respondents Based on Number of Power Units
Number of Power Units Number of Respondents Percent of Respondents
1-5 14 12.3%
6-15 29 25.4%
16-50 35 30.7%
51-100 24 21.1%
More than 100 12 10.5%
Total 114 100.0%
Respondents also were categorized based on equipment operated (Table 4.2). Dry van was the
most popular type of equipment used, followed by refrigerated van, flatbed, tanker, and intermodal.
Other types of equipment that were listed as used by firms included hoppers, various dump trailers,
heavy haul equipment, car carriers, livestock carriers, and mail trailers.
Table 4.2. Percent of Respondents Based on Equipment Usage
Equipment Type Number of Respondents Percent of Respondents
Dry van 45 39.1%
Refrigerated van 34 29.6%
Flatbed 27 23.5%
Tanker 22 19.1%
Intermodal 7 6.1%
Other 30 26.1%
* Percentages in Table 4.2 do not add up to 100 percent because some firms operate multipletypes of equipment.
21
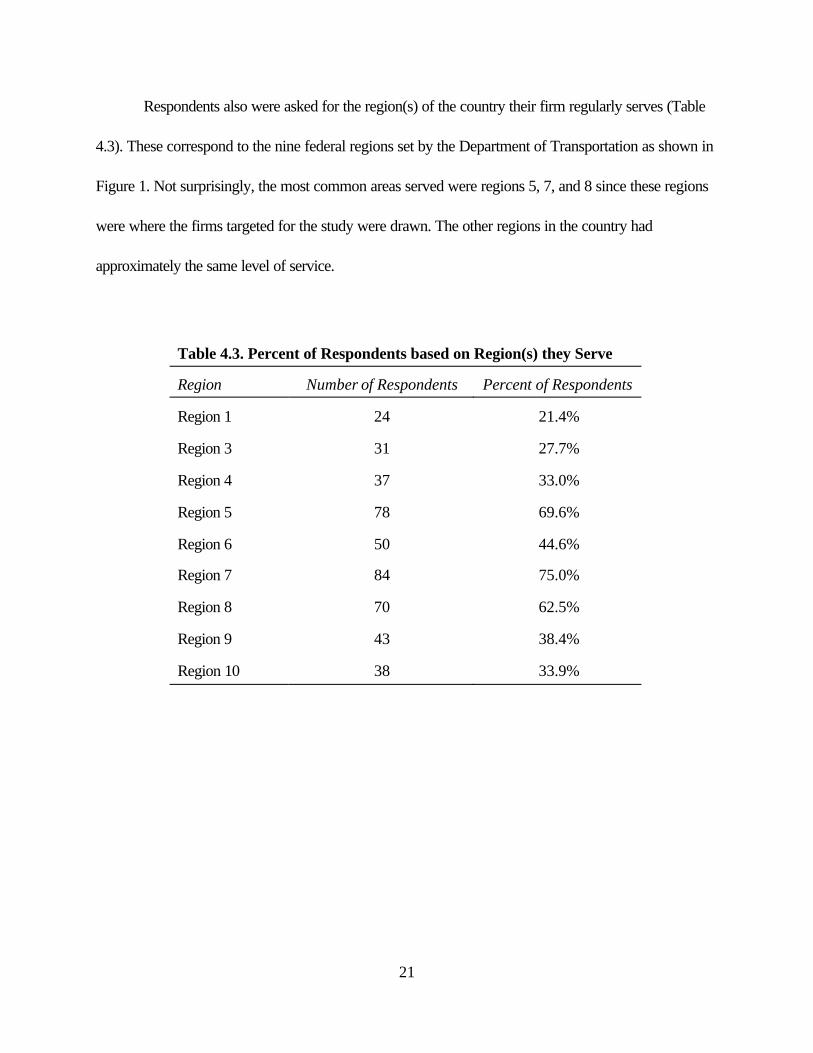
Respondents also were asked for the region(s) of the country their firm regularly serves (Table
4.3). These correspond to the nine federal regions set by the Department of Transportation as shown in
Figure 1. Not surprisingly, the most common areas served were regions 5, 7, and 8 since these regions
were where the firms targeted for the study were drawn. The other regions in the country had
approximately the same level of service.
Table 4.3. Percent of Respondents based on Region(s) they Serve
Region Number of Respondents Percent of Respondents
Region 1 24 21.4%
Region 3 31 27.7%
Region 4 37 33.0%
Region 5 78 69.6%
Region 6 50 44.6%
Region 7 84 75.0%
Region 8 70 62.5%
Region 9 43 38.4%
Region 10 38 33.9%

22
Figure 1. Federal Regions (Department of Transportation).
Scope of Logistical Services Offered
The first question in the survey concerned logistical services offered by firms. Eleven services
were listed in a table. For each service, a five-point scale was used to measure the usage of that
service. A value of “1” indicated the service was not offered by the firm, and a value of “5” indicated
more than 75 percent of customers used the service. A mean value was generated for each logistical
service, in addition to the percent of respondents for each number (Table 4.4).

23
Table 4.4. Logistical Services Being Offered by Trucking Firms(Actual question: What percentage of your customers are currently
using the following services, if offered by your firm?)
Percentages
NotOffered
Under25% 25-50% 51-75%
Over75%
Item Mean 1 2 3 4 5
1. Routing and scheduling (n=107) 2.22 47.7 15.0 15.9 10.3 11.2
2. Carrier selection (n=104) 1.97 56.7 15.4 12.5 4.8 10.6
3. Determine least cost mode(n=102)
1.83 62.7 12.7 11.8 3.9 8.8
4. Palletization (n=105) 1.63 65.7 21.0 2.9 5.7 4.8
5. Warehousing (n=105) 1.62 63.8 22.9 5.7 2.9 4.8
6. Inventory management (n=104) 1.50 76.0 9.6 7.7 1.9 4.8
7. Demand forecasting (n=101) 1.27 88.1 5.0 2.0 2.0 3.0
8. Packaging (n=103) 1.21 88.3 5.8 2.9 1.9 1.0
9. Supply chain management(n=102)
1.17 90.2 5.9 1.0 2.9 0.0
10. Light subassembly (n=103) 1.16 86.4 11.7 1.9 0.0 0.0
11. Process reengineering (n=102) 1.08 95.1 2.9 1.0 1.0 0.0
The results show that routing and scheduling is the most popular logistical service offered by
responding firms. This was the only service that was offered by more than 50 percent of firms.
Additional services offered by close to 50 percent of firms included carrier selection, determination of
least cost mode, palletization, and warehousing. The other services listed in the question, including
inventory management, demand forecasting, packaging, supply chain management, light subassembly,
and process reengineering, were offered by a small minority of trucking firms.

24
The second question in the survey asked firms to add any other services they may be offering.
Some of these services include cross-docking, consolidation and distribution functions, contract
warehousing, and traffic management activities.
Approximately 50 percent of responding firms indicated offering logistics services. The average
number of logistics customers these firms have is nearly 20. However, almost 80 percent indicated
having 10 or fewer customers. The average revenue contribution of logistics for these firms was more
than 18 percent of their total revenue. In fact, nearly 30 percent of firms that reported logistics revenues
indicated it accounted for more than 25 percent of their total revenue.
Close partnerships, or preferred transportation provider programs, with carriers and shippers
were common among respondents. Approximately 64 percent of firms indicated they are involved with
close partnerships with their shipping customers. In addition, the trucking firms involved with these
programs are doing so with more than 50 percent of their customers on average.
More than 75 percent of firms currently offering logistics services indicated they began offering
these services after 1980. This indicates that offering logistics services is a relatively new concept for
most firms in the industry. It also indicates that many firms are looking toward logistics to give them a
competitive advantage and add value for their customers. In addition, more than 30 percent of firms
indicated offering these services to clients other than their trucking customers. Finally, approximately 24
percent of respondents indicated that they consider their logistics operations to be a separate
department or business unit from their regular trucking business.

25
Technology Characteristics
Nearly 25 percent of respondents are currently using Electronic Data Interchange (EDI). This is
comparable to the findings of other recent studies of the trucking industry (Crum, Premkumar, and
Ramamurthy, 1996). However, most trucking firms (80 percent) in this sample indicated using EDI with
less than 25 percent of their customers. This can be explained by the fact that currently, EDI usage is
most prominent among larger shippers.
Question nine in the survey examined how trucking firms and their customers are using EDI
data. Six common EDI features were listed and respondents were asked to identify the percent usage
for each feature. A response of “1” indicated the feature was not in use, while a response of “5”
indicated the feature was used by more than 75 percent of customers (Table 4.5). Information in Table
4.2 is only from those firms who indicated using EDI. Therefore, the “Not in use” column reflects firms
who have EDI but are not using that particular feature.
Currently, invoices and freight bills are the most popular EDI features being used by trucking
firms and their customers (Table 4.5). This is not surprising as invoices are typically one of the first
items used by EDI in other industries. However, a surprising result is the low usage of purchase orders
because purchase orders are the most common type of EDI transaction for all industries (Petrosky,
1997). This result may be due to variable demand for many trucking firms with their customers. EDI
works best for high volume, low variation type transactions (Petrosky, 1997). The other features listed
were used by approximately 50 percent of respondents.

26
Table 4.5. Overall Ranking of Features for Firms Using EDI(Actual question: What percentage of your customers are currently
using the following services, if offered by your firm?)
Percentages
NotIn Use
Under25% 25-50% 51-75%
Over75%
Item Mean 1 2 3 4 5
1. Invoices (n=23) 2.48 26.1 43.5 4.3 8.7 17.4
2. Freight Bills (n=24) 2.46 25.0 41.7 12.5 4.2 16.7
3. Purchase Orders (n=23) 2.09 43.5 30.4 13.0 0.0 13.0
4. Quick Response Initiatives orJIT (n=23)
2.09 47.8 26.1 8.7 4.3 13.0
5. Forecasts (n=20) 1.75 55.0 30.0 5.0 5.0 5.0
6. Production Schedules (n=22) 1.73 54.5 27.3 13.6 0.0 4.5
Some of the EDI software packages used by firms in the industry include Harbinger,
Kleinschmidt, and Sterling. Also, a number of firms indicated they have developed their own EDI
software. Most firms appear to be using EDI on a mainframe or minicomputer with a network.
Question 11 in the survey queried firms about their use of satellite tracking and communication
systems. Approximately 15 percent of responding firms indicated using satellite systems. However, of
those firms using satellite technology, 75 percent also indicated using EDI. This indicates that those
firms who are integrating technology are doing so throughout their entire operation.
Opinions on Current Policies and Trends
The third section in the survey contained six questions that measured opinions about the
influences of technology and logistics on the trucking industry. Each question used a five-point scale to

27
measure the relative importance of the question being asked. In each case, a response of “1” indicated
strong disagreement or unimportance while a response of “5” indicated strong agreement or
importance. A mean value was generated for each question, along with a summary of responses (Table
4.6).
Most of the respondents believed EDI will continue to become a greater influence in the
industry (Table 4.6). In fact, less than 10 percent indicated a response of “1” or “2,” which represent
decreased influence. This is an interesting result in that many smaller trucking firms were included in the
study that may not yet have considered implementing EDI due to cost considerations. While larger firms
may be more proactive in implementing EDI, most firms in the industry are aware of the future
importance of EDI. Respondents also thought that close relationships between themselves and their
shipping customers will increase in the future.
The remaining four questions in this section concerned logistics services in the industry.
Interestingly, most respondents thought that providing logistical services adds value to customers, but
were undecided if providing logistical services is necessary to remaining competitive. However, there
appeared to some agreement that firms offering logistical services will become more prevalent in the
future. Finally, most respondents do not consider themselves to be a third-party logistics company
(Table 4.6). Only approximately 15 percent indicated that they consider themselves a third-party
provider.

28
Table 4.6. Responses to Opinion Questions Concerning Industry Trends
Percentages
Decrease Influence Increase Influence
Question Mean 1 2 3 4 5
Do you feel EDI will become a greater orlesser influence in the future? (n=112)
3.80 5.4 3.6 26.8 33.9 30.4
Less Firms More Firms
Do you think more or less firms willestablish closer relationships betweenshippers and carriers in the future? (n=111)
3.75 3.6 6.3 28.8 34.2 27.0
Does not Add Value Does Add Value
Do you feel providing logistical servicesadds value or does not add value tocustomers of the trucking industry? (n=111)
3.45 7.2 9.0 29.7 39.6 14.4
Less Prevalent More Prevalent
Do you feel firms providing logisticalservices will become more or less prevalentin the trucking industry? (n=110)
3.41 6.4 7.3 36.4 39.1 10.9
Strongly Disagree Strongly Agree
Do you feel providing logistical services isnecessary to remaining competitive in thetrucking industry? (n=113)
3.09 13.3 14.2 33.6 28.3 10.6
Strongly Disagree Strongly Agree
Do you consider yourself a third-partylogistics company? (n=111)
2.25 36.0 20.7 29.7 9.0 4.5
Survey Results Based on Company Size
In this section, comparisons are made based on the number of power units a firm operates to
determine if a firm’s size impacts its use of technology and logistical capabilities. Statistical differences in
29
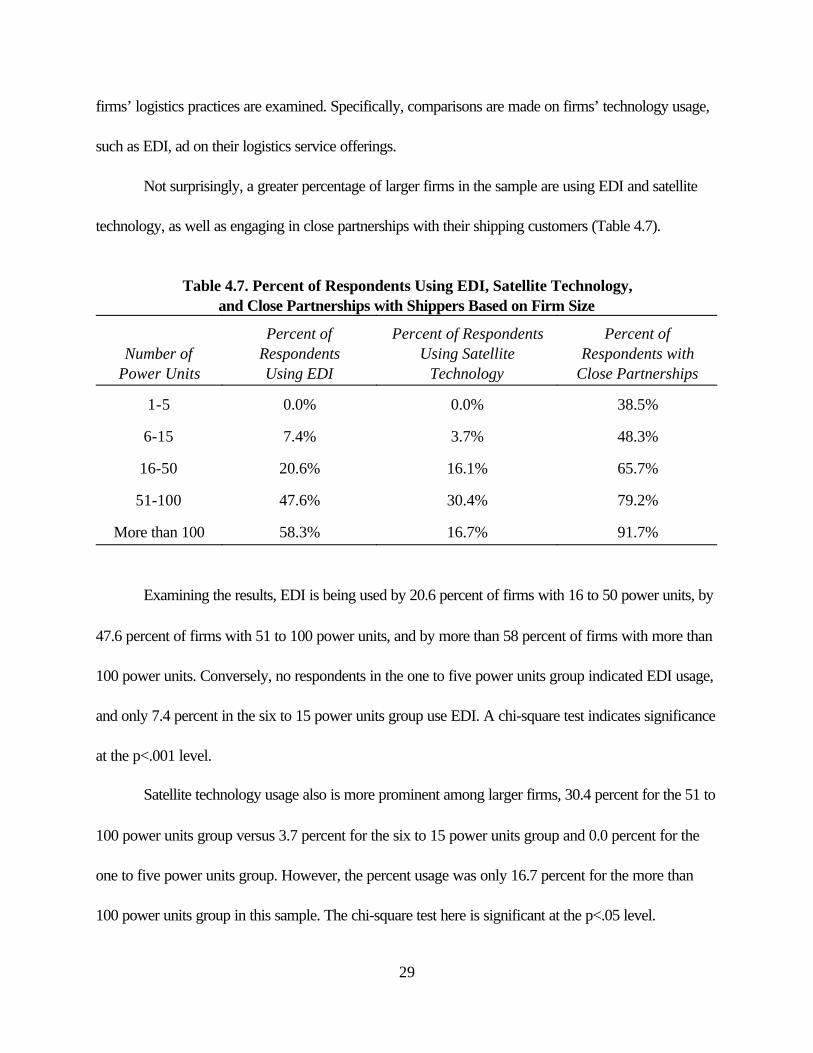
firms’ logistics practices are examined. Specifically, comparisons are made on firms’ technology usage,
such as EDI, ad on their logistics service offerings.
Not surprisingly, a greater percentage of larger firms in the sample are using EDI and satellite
technology, as well as engaging in close partnerships with their shipping customers (Table 4.7).
Table 4.7. Percent of Respondents Using EDI, Satellite Technology,and Close Partnerships with Shippers Based on Firm Size
Number ofPower Units
Percent ofRespondentsUsing EDI
Percent of RespondentsUsing Satellite
Technology
Percent ofRespondents with
Close Partnerships
1-5 0.0% 0.0% 38.5%
6-15 7.4% 3.7% 48.3%
16-50 20.6% 16.1% 65.7%
51-100 47.6% 30.4% 79.2%
More than 100 58.3% 16.7% 91.7%
Examining the results, EDI is being used by 20.6 percent of firms with 16 to 50 power units, by
47.6 percent of firms with 51 to 100 power units, and by more than 58 percent of firms with more than
100 power units. Conversely, no respondents in the one to five power units group indicated EDI usage,
and only 7.4 percent in the six to 15 power units group use EDI. A chi-square test indicates significance
at the p<.001 level.
Satellite technology usage also is more prominent among larger firms, 30.4 percent for the 51 to
100 power units group versus 3.7 percent for the six to 15 power units group and 0.0 percent for the
one to five power units group. However, the percent usage was only 16.7 percent for the more than
100 power units group in this sample. The chi-square test here is significant at the p<.05 level.

30
In addition, a significant number of the companies in the more than 100 power units group (91.7
percent) are engaging in close partnerships with their shipping customers. This compares to about 38.5
percent in the one to five power units group that do so. The chi-square test reveals significance at the
p<.01 level.
Questions from the section concerning opinions on current policies and trends were also
examined based on firm size (Table 4.8). For all six questions in this section, a mean value was
computed for the five firm size categories as defined in Table 4.1. A larger mean value indicates
stronger agreement to the question (the actual scales for each question were given in Table 4.6).
Performing an ANOVA analysis reveals that only in the first and fourth questions, regarding the
future influence of EDI and closer relationships between shippers and carriers, were there any
statistically significant differences at the p<.05 level (Table 4.8). Duncan’s Multiple Range Test was
used to determine whether or not mean differences existed.
However, for each question, the mid- to large-sized firms agreed more strongly than did the
smaller firms. These are expected results because larger firms are undoubtedly more pro active in
implementing new technologies due to cost considerations. In addition, larger trucking firms appear to
be more involved in providing logistical services to their customers than smaller trucking firms. Most of
the smaller trucking firms may be providing niche transportation services, which do not require
additional logistical services. However, it is still necessary for firms in the trucking industry, regardless
of size, to keep abreast of changes in technologies and services.

31
Table 4.8. Opinion Question Results Based on Number of Power Units
Mean Values by Power Unit Group
Question 1-5 6-15 16-50 51-100More
than 100
1. Do you feel EDI will become a greater orlesser influence in the future?
3.17b 3.61a,b 3.80a,b 4.33a 3.92a
2. Do you feel firms providing logisticalservices will become more or less prevalent inthe future?
3.17 3.25 3.51 3.54 3.50
3. Do you feel providing logistical servicesadds value or does not add value to customersof the trucking industry?
3.08 3.21 3.57 3.75 3.50
4. Do you think more or less firms willestablish closer relationships between shippersand carriers in the future?
3.92a,b 3.41b 3.57a,b 4.09a,b 4.18a
5. Do you feel providing logistical services isnecessary to remaining competitive in thetrucking industry?
2.83 2.97 3.26 3.13 3.08
6. Do you consider yourself a third-partylogistics provider?
1.82 2.28 2.29 2.22 2.50
a,b Significant differences present where letters are shown. Means with the same letter are not significantly different.
In this chapter, results of the survey were presented. These included overall results and results
based on firm size (number of power units). In the next chapter, conclusions are drawn from these
results, in addition to conclusions to the study.

32

33
CHAPTER 5. SUMMARY AND CONCLUSIONS
This study examined logistical policies and related trends that are occurring in the trucking
industry. Logistics is becoming increasingly important in the trucking industry for many reasons. Many
carriers are looking for ways to add value to their customers, such as offering logistical services
(Bigness, 1995). Also, many shippers are looking to outsource logistics activities to reduce costs and
focus on their core competencies.
Factors that contributed to the trucking industry’s ability to offer logistical services to better
serve their customers were examined. Deregulation of the trucking industry allowed close relationships
and long-term contracts to develop between carriers and shippers, which in turn create better service
and efficiency. Indeed, the need to maintain competitiveness and perhaps gain a competitive advantage
has encouraged companies to look toward logistical services.
Several types of logistical information systems and technology were explored. These included
EDI, various computer software packages, barcoding, and satellite tracking systems. These
technologies are primarily used to improve information flow through the supply chain and thus increase
tracking ability and decrease the amount of inventory needed.
A survey was introduced to better understand how well trucking companies are responding to
the demand for logistical services. The survey group selection, mailings, survey design, and data analysis
techniques were described.
Chapter 4 presented the overall results of the survey in addition to analyses based on company
size. Some of the findings and conclusions of the survey included the following.

34
Respondents were approximately evenly distributed across five different size categories and
operated a broad range of equipment including dry and refrigerated vans, flatbeds, tankers, hoppers,
car and livestock carriers, as well as intermodal. Respondents served every region of the country with
the most common regions in the upper Midwest.
Approximately 50 percent of responding firms indicated offering logistical services. The average
revenue contribution of logistics for these companies was more than 18 percent of their total revenue,
with nearly 30 percent indicating logistics accounted for more than 25 percent of their total revenue.
Out of 11 services listed, routing and scheduling was the only one offered by more than 50
percent of the responding companies. The other most common services offered were carrier selection,
determination of least cost mode, palletization, and warehousing.
About 64 percent of the respondents are involved with close partnerships with their shipping
customers, and more than 75 percent of companies that offer logistic services began offering them after
1980.
Almost 25 percent of respondents are using EDI; invoices and freight bills are the most
common feature followed by purchase orders. Approximately 15 percent of the respondents indicated
using satellite systems.
The majority of the respondents believed EDI would continue to become a greater influence in
the industry, that more firms will develop closer relationships between shippers and carriers, and that
firms providing logistical services will become more prevalent.
Respondents also believed strongly that providing logistical services adds value to their
customers, but were undecided if providing logistical services is necessary to remain competitive.

35
Significantly greater percentages of larger firms (based on number of power units) are using
EDI and satellite technology, and are engaging in close partnerships with their shipping customers.
Companies of all sizes tended to agree that providing logistical services will become more
prevalent and that logistical services add value to customers.
Larger firms tended to agree more with the statements that EDI will become a greater influence
and that more firms will establish close relationships between shippers and carriers, although smaller
companies also agreed somewhat.
Companies of all sizes were undecided if logistical services were necessary to remain
competitive, with larger firms agreeing slightly more than smaller ones.
Discussion
This study helped to determine how trucking companies are responding to current trends and
the demand for logistical services. The results showed that many companies are responding to the
demand in a variety of areas, and are realizing the value both to themselves and to their customers.
Larger companies are developing their logistical services more extensively than smaller companies.
However, there is evidence that smaller companies are starting to progress and see the value of doing
so.
From the survey, it is clear that technology and changes in business are driving the trucking
industry into the 21st century. Survey comments clearly demonstrate some firms are on a more
progressive path with their customers in order to add logistical value. This evolution is leading to a small
number of larger trucking firms, which handle the bulk of the cross country freight market, while smaller
firms remain in the regional and city-to-city markets. A lesson in why this may occur can be taken from
36
the other industries where firms are actively attempting to reduce the number of suppliers they work
with. The same can be said in the trucking industry.
Companies are moving towards preferred provider programs. This is evident by the response in
Question 18, where even the smallest of firms are involved in preferred provider programs. Not
surprisingly, 91 percent of the largest firms in terms of power units (100 or more) are involved in some
type of preferred provider program. In terms of technology, 58 percent of these same firms also are
using EDI. It is this combination of technology and partnering that will drive the trucking industry into
the 21st century.

37
BIBLIOGRAPHY
Aaron, Todd S. “Providing North American Logistics Services.” Frozen Food Digest. April-May1994, 10-12.
Ballou, Ronald H. Business Logistics Management. 3rd ed. Englewood Cliffs, New Jersey: PrenticeHall, 1992.
Barber, Jason T. and Frank J. Dooley. “Inventory Practices of Flour Milling Firms.” MPC Report No.96-62A. The Upper Great Plains Transportation Institute, North Dakota State University,Fargo, June 1996.
Bigness, Jon. “In Today’s Economy there is Big Money to be Made in Logistics.” The Wall StreetJournal. September 6, 1995, A1.
Boyson, Sandor, Tom Mierzwa, Alan Salton, and John Thornton. “Logistics Challenges andOpportunities in the 1990s.” University of Maryland, February, 1995.
Bradley, Peter. “What Makes Carrier Quality.” Purchasing. January 12, 1995, 83-85.
Candler, Julie. “Hauling it for Less.” Nation’s Business. January 1994, 46-49.
Canna, Elizabeth, “Bilspedition Tests Satellite-Controlled Trucks in Europe.” American Shipper. June1995, 82.
“Competition in Manufacturing Leads to MRP II.” Industrial Engineering. July 1991, 10.
Coyle, John J., Edward J. Bardi, and Robert A. Novack. Transportation. 4th ed. St. Paul: West, 1994.
Crum, Michael R., G. Premkumar, and K. Ramamurthy. “An Assessment of Motor Carrier Adoption,Use, and Satisfaction with EDI.” Transportation Journal. Summer 1996, 44-57.
Cullen, David. “Point of Intersection.” Fleet Owner. November 1994, 96.
Cullen, David. “Trucking’s New Frontier.” Fleet Owner. January 1996, 42-45.
Delaney, Robert V. “Sixth Annual State of Logistics Report.” Press Conference Remarks to theNational Press Club, Washington D.C., June 1995.
deRoulet, David G. “Logistics: Key Competitive Edge.” Transportation & Distribution. August 1993,53.

38
Elzinga, Kenneth G. “The Relevant Market for Less-Than-Truckload Freight: Deregulation’sConsequences.” Transportation Journal. Winter 1994, 29-36.
Felton, John Richard and Dale G. Anderson. Regulation and Deregulation of the Motor CarrierIndustry. Ames, IA: Iowa State University Press, 1989.
Glaskowsky, Nicholas A. Effects of Deregulation on Motor Carriers. Westport, CT: Eno Foundationfor Transportation, 1986.
Harper, Doug. “Two Top Logistics Firms Have Roots in Trucking.” The Journal of Commerce andCommercial. October 24, 1994, 7A.
Harrington, Lisa H. “Motor Carrier Productivity: Improvements Make a Difference.” Transportation &Distribution. September 1994, 30-34.
Petrosky, Dan, co-founder EDI Partners, Inc. “EDI 101.” February 13, 1997 training course, Fargo,North Dakota.
Richardson, Helen L. “Managing Inbound Logistics: When You Look Outside Your Company forResources to Manage the Inbound Leg of Your Supply Chain, be Sure Service Providers AddValue.” Transportation & Distribution. September 1996, 78-79.
Robeson, James F. and William C. Copacino. The Logistics Handbook. New York: The Free Press,1994.
Stevens, Tim. “Success Runs on Schedule: Finite-Capacity-Scheduling Software Complements MRPto Turn Scheduling into a Competitive Weapon.” Industry Week. August 15, 1994, v.243,n.15, 83-85.
Thomas, Jim. “How to Rev Up a Partnership.” Distribution. October 1994, 36-39.
Wilson, Wesley W. “The Motor Carrier Act of 1980: An Analysis of the Changes.” UGPTI StaffPaper No. 13. The Upper Great Plains Transportation Institute, North Dakota State University,Fargo, July 1981.

39
APPENDIX A
Actual Survey Sent to Trucking Firms


41
LOGISTICAL CAPABILITIES OF TRUCKING FIRMS
February 1997
The Upper Great Plains Transportation InstituteNorth Dakota State University
Fargo, North Dakota

42
Instructions
1. Please read and answer all questions carefully.
2. Select the response that best represents your feelings. There is no right or wronganswer.
3. When you have finished, place this survey in the business reply envelope. You donot need a stamp to mail this.
4. Please return this survey within one week.
5. Feel free to use any white space as well as the back of this survey for anycomments you may have.
ALL RESPONSES AND COMMENTS ARE ANONYMOUS
WE WILL NOT REPORT AN INDIVIDUAL FIRM’S RESPONSES
THANK YOU FOR YOUR HELP
If you have any questions or concerns regarding this survey, please call Jason Barberwith the Upper Great Plains Transportation Institute at NDSU, phone number (701) 231-1086. E-mail address [email protected] is checked daily.
43
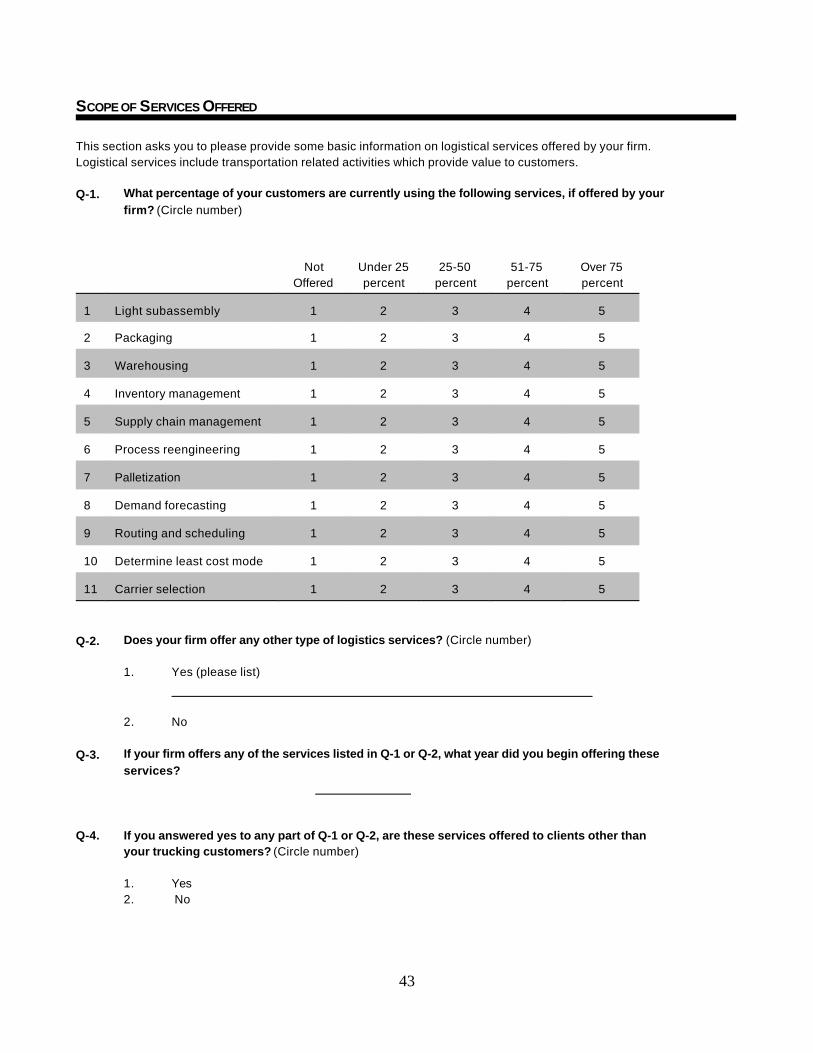
SCOPE OF SERVICES OFFERED
This section asks you to please provide some basic information on logistical services offered by your firm.Logistical services include transportation related activities which provide value to customers.
Q-1. What percentage of your customers are currently using the following services, if offered by yourfirm? (Circle number)
NotOffered
Under 25percent
25-50percent
51-75percent
Over 75percent
1 Light subassembly 1 2 3 4 5
2 Packaging 1 2 3 4 5
3 Warehousing 1 2 3 4 5
4 Inventory management 1 2 3 4 5
5 Supply chain management 1 2 3 4 5
6 Process reengineering 1 2 3 4 5
7 Palletization 1 2 3 4 5
8 Demand forecasting 1 2 3 4 5
9 Routing and scheduling 1 2 3 4 5
10 Determine least cost mode 1 2 3 4 5
11 Carrier selection 1 2 3 4 5
Q-2. Does your firm offer any other type of logistics services? (Circle number)
1. Yes (please list)
2. No
Q-3. If your firm offers any of the services listed in Q-1 or Q-2, what year did you begin offering theseservices?
Q-4. If you answered yes to any part of Q-1 or Q-2, are these services offered to clients other thanyour trucking customers? (Circle number)
1. Yes2. No

44
TECHNOLOGY CHARACTERISTICS
This section asks you to please provide some information on technology used by your firm.
Q-5. Do you use Electronic Data Interchange (EDI)? (Circle number)
1. Yes2. No
If you answered YES to Q-5, please continue to Q-6. If you answered NO toQ-5, please go on to Q-10 on page 3.
Q-6. With what percentage of your customers do you use EDI?
Percent
Q-7. What type of hardware are you using for your EDI system?(Circle all that apply)
1. Mainframe2. Minicomputer3. Microcomputer4. Network
Q-8. What software packages are you using for your EDI system?
Q-9. What percentage of your customers use the following features in their EDI data. (Circle number)
Not inuse
Under 25percent
25-50percent
51-75percent
Over 75percent
1 Forecasts 1 2 3 4 5
2 Invoices 1 2 3 4 5
3 Purchase Orders 1 2 3 4 5
4 Freight Bills 1 2 3 4 5
5 Production Schedules 1 2 3 4 5
6 Quick Response Initiatives orJIT
1 2 3 4 5

45
Q-10. Do you consider your logistics services to be a separate department or business unit from yourtrucking company? (Circle number)
1. Yes2. No
Q-11. Do you use satellite tracking and communication systems? (Circle number)
1. Yes2. No
OPINIONS ON CURRENT POLICIES AND FUTURE TRENDS
This section asks you to provide opinions about some trends affecting logistics and the trucking industry.
Q-12. Do you feel EDI will become a greater or lesser influence in the future? (Circle number)
Influence willDiminish
Influence willIncrease
1 2 3 4 5
Q-13. Do you feel firms providing logistical services will become more or less prevalent in the truckingindustry? (Circle number)
Will becomeless Prevalent
Will becomemore Prevalent
1 2 3 4 5
Q-14. Do you feel providing logistical services adds value or does not add value to customers of thetrucking industry? (Circle number)
Does notprovide Value
Does provideValue
1 2 3 4 5

46
Q-15. Do you think more or less firms will establish closer relationships between shippers and carriersin the future? (Circle number)
Less Firms More Firms
1 2 3 4 5
Q-16. Do you feel providing logistical services is necessary to remaining competitive in the truckingindustry? (Circle number)
StronglyDisagree
StronglyAgree
1 2 3 4 5
Q-17. Do you consider yourself a third-party logistics company? (Circle number)
StronglyDisagree
StronglyAgree
1 2 3 4 5
BUSINESS CHARACTERISTICS
This section asks you to provide some brief information to assist in categorizing your firm.
Q-18. Is your firm engaging in close partnerships (preferred transportation provider programs) withyour shipping customers? (Circle number)
1. YesWith what percentage? Percent
2. No
Q-19. Approximately how many power units (tractors and straight trucks) does your firm operate?
Power units
Q-20. What most characterizes your type of operation? (Circle all that apply)
1. Dry van2. Flatbed3. Refrigerated van4. Tanker5. Intermodal6. Other (specify):

47
Q-21. If you are currently providing logistics services for customers, approximately how many logisticscustomers do you currently have?
Customers
Q-22. Please indicate which regions of the country your firm regularly serves.(Circle numbers)
Q-23. Please indicate the relative percentages of logistics and trucking operations which contribute tototal revenue for your firm.
% Revenue contributed by logistics operations.% Revenue contributed by trucking operations.
= 100 % Total Revenue
Do you have any other comments?

48