jefferies 2014 global industrials conference august … · business overview insteel industries is...
TRANSCRIPT

Jefferies 2014 Global
Industrials Conference
August 12, 2014
Forward-Looking Statements
This presentation contains forward-looking statements within the meaning of the safeharbor provisions of the Private Securities Litigation Reform Act of 1995. When usedin this presentation, the words “believes,” “anticipates,” “expects,” “estimates,”“intends,” “may,” “should” and similar expressions are intended to identify forward-looking statements. Although we believe that our plans, intentions and expectationsreflected in or suggested by such forward-looking statements are reasonable, suchforward-looking statements are subject to a number of risks and uncertainties, and wecan provide no assurances that such plans, intentions or expectations will beimplemented or achieved. All forward-looking statements are based on informationthat is current as of the date of this presentation. Many of these risks and uncertaintiesare discussed in detail in our periodic and other reports and statements filed with theU.S. Securities and Exchange Commission, in particular our Annual Report on Form10-K for the year ended September 28, 2013. You should carefully read these risksand uncertainties.
All forward-looking statements attributable to us or persons acting on our behalf areexpressly qualified in their entirety by these cautionary statements. All forward-lookingstatements speak only to the respective dates on which such statements are madeand we do not undertake and specifically decline any obligation to publicly release theresults of any revisions to these forward-looking statements that may be made toreflect any future events or circumstances after the date of such statements or toreflect the occurrence of anticipated or unanticipated events.
2
Business Overview
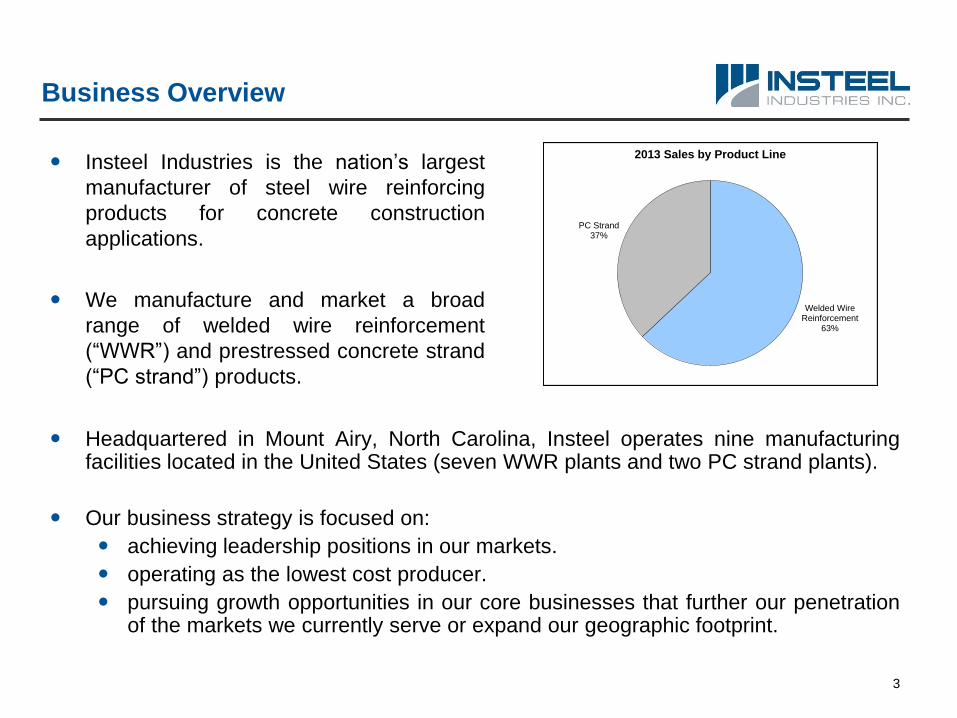
Insteel Industries is the nation’s largest
manufacturer of steel wire reinforcing
products for concrete construction
applications.
We manufacture and market a broad
range of welded wire reinforcement
(“WWR”) and prestressed concrete strand
(“PC strand”) products.
Headquartered in Mount Airy, North Carolina, Insteel operates nine manufacturingfacilities located in the United States (seven WWR plants and two PC strand plants).
Our business strategy is focused on:
achieving leadership positions in our markets.
operating as the lowest cost producer.
pursuing growth opportunities in our core businesses that further our penetrationof the markets we currently serve or expand our geographic footprint.
3
Welded Wire Reinforcement
63%
PC Strand37%
2013 Sales by Product Line
Business Overview
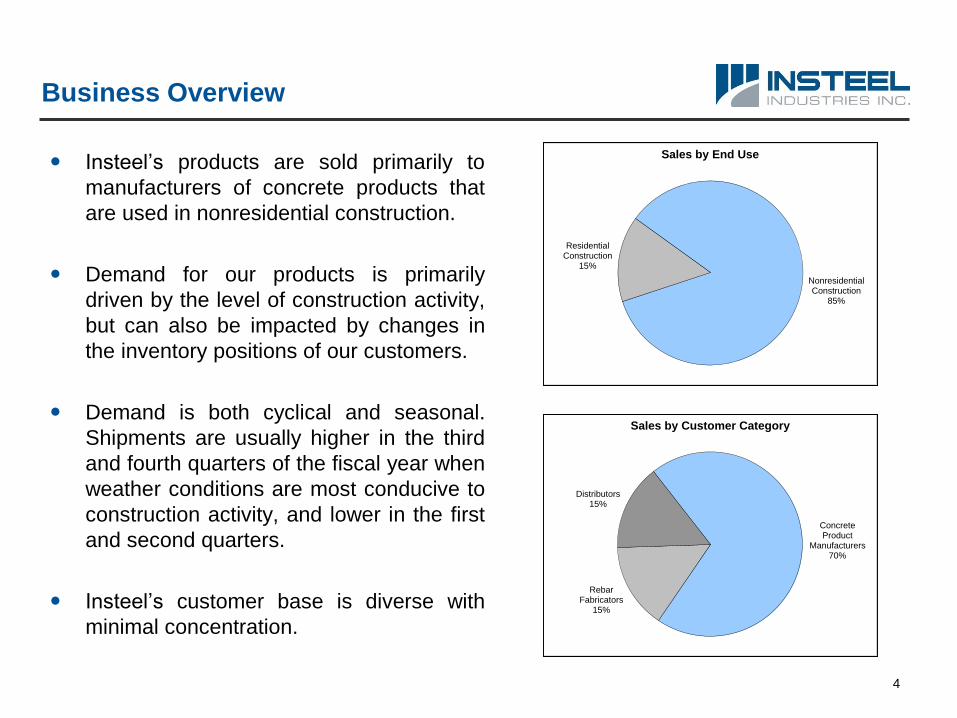
Insteel’s products are sold primarily to
manufacturers of concrete products that
are used in nonresidential construction.
Demand for our products is primarily
driven by the level of construction activity,
but can also be impacted by changes in
the inventory positions of our customers.
Demand is both cyclical and seasonal.
Shipments are usually higher in the third
and fourth quarters of the fiscal year when
weather conditions are most conducive to
construction activity, and lower in the first
and second quarters.
Insteel’s customer base is diverse with
minimal concentration.
Concrete Product
Manufacturers70%
Rebar Fabricators
15%
Distributors15%
Sales by Customer Category
4
Nonresidential Construction
85%
Residential Construction
15%
Sales by End Use

Welded Wire Reinforcement (“WWR”)
Produced as both standard and specially engineered reinforcing products for use in nonresidential andresidential construction. Our broad offering of WWR products includes:
Engineered Structural Mesh - Engineered made-to-order reinforcing products that are used as theprimary reinforcement in concrete elements or structures, frequently serving as a substitute for hot-rolled rebar.
Concrete Pipe Reinforcement - Engineered made-to-order reinforcing products that are used as theprimary reinforcement in concrete pipe and box culverts for drainage and sewage systems, watertreatment facilities and other related applications.
Standard Welded Wire Reinforcement - Secondary reinforcing products made-to-stock in standardstyles for crack control applications in residential and light nonresidential construction, includingdriveways, sidewalks and a wide range of slab-on-grade applications.
5

Engineered Structural Mesh (“ESM”)
For many applications, ESM can serve as a lower cost and higher strength concrete reinforcingsolution than hot-rolled rebar.
Eliminates the labor intensive process of placing and hand-tying required for rebar yieldingsignificant cost savings and shortening the construction timeline.
Fewer tons of steel are generally required when ESM is specified due to its superior yield strength(80,000 PSI for ESM versus 60,000 PSI for rebar).
Concrete barrier median project in Texas which required
38.4 tons of ESM per mile of barrier.
6

ESM Penetration of Rebar Market
Total domestic rebar usage for 2013was 7.5 million tons. Estimated 80% ofrebar market or 6.0 million tonsrepresent sizes 3 – 8 which couldpotentially be replaced by ESM.
Total domestic ESM productionestimated to be 0.2 million tons,representing only 3% of the rebarvolume it could potentially replace.
Continued conversion of rebar users toESM represents substantial growthopportunity.
As rebar users initially convert projectsto ESM and experience the advantagesthat it offers, they tend to becomerepeat customers.
(1)Company estimate based on SMA total consumption data for 2013.
(2)Company estimate.
7
Rebar (3 - 8)6.0mm Tons(1)
97%
ESM0.2mm Tons(2)
3%
Concrete Structural Reinforcement Usage(Tons in Millions)

Prestressed Concrete Strand (“PC Strand”)
Seven-wire strand used to impart compression forces into precast concrete elements and structures,providing reinforcement for bridges, parking decks, buildings and other concrete structures.
High tensile strength makes it possible to cast longer spans and thinner sections.
PC strand is used for both pretensioned and posttensioned reinforcing applications.
Pretensioned – Strands are tensioned and anchored at the ends of a form. Anchors arereleased after the concrete has been placed and cured, creating compression forces within theelement.
Posttensioned – Strands are tensioned after the concrete has been placed and cured.
8

Competitive Position
Welded Wire Reinforcement
Largest domestic producer of WWR and only
producer with national market presence.
Primary Competitors
Concrete Reinforcements Inc.
Davis Wire
Gerdau Ameristeel
Keystone/Engineered Wire Products
Nucor
Oklahoma/Iowa Steel and Wire
Wire Mesh Corp.
PC Strand
Largest domestic producer of PC strand with
more than double the market share of any
competitor (>40% among domestic producers).
Primary Competitors
American Spring Wire
Strand-Tech Martin
Sumiden Wire Products
Wire Mesh Corp.
Imports
Strong market leadership positions extending across all product lines/families.
One of two producers with capability of bundling WWR and PC strand products, which are used in
combination for many concrete reinforcing applications.
9

Growth Strategy
Organic
Existing facilities capable of generating over $700 million of annualized revenues (at current ASPs)
with minimal incremental capex required.
Continued expansion of ESM business through further penetration of rebar market.
Acquisitions
Strategic opportunities in core WWR and PC strand businesses or related products sold into same
markets.10
$364FY2013
> $700Capacity at
Current ASPs
$0
$150
$300
$450
$600
$750
($ Millions)

Ivy Acquisition
In November 2010, Insteel acquired certain of the assets of Ivy Steel & Wire, Inc. (“Ivy”) for $50.3million.
Ivy was previously the second largest producer of WWR in the U.S. behind Insteel and the largestproducer of ESM and concrete pipe reinforcement with September 2010 TTM sales of $105.0 millionvs. $229.8 million in CY 2008.
Assets acquired include Ivy’s facilities in Arizona, Florida, Missouri and Pennsylvania; equipment at aleased facility in Texas; and certain related inventories.
Insteel
Ivy
Houston Plant
Closed Dec 2010
Wilmington Plant
Closed May 2011
11
WWR Facilities

Ivy Acquisition
Broadened Insteel’s geographic footprint, moving us closer to both our customers andsuppliers, enhancing our competitive position in the Midwest, Northeast and Floridamarkets and providing us with better access to the west coast market.
Left Insteel as the only WWR producer with a national market presence - a significantcompetitive advantage for serving larger multi-location customers.
Enhanced Insteel’s product mix by increasing the proportion of ESM and CPR.
Accelerated Insteel’s initiatives to broaden the acceptance of ESM and furtherpenetrate the rebar market.
Offered substantial synergy potential: Plant consolidations (Texas and Northeast) and reconfiguration of manufacturing facilities.
Elimination of redundant selling and administration activities.
Improved manufacturing efficiencies.
Lower raw material costs through increased purchasing leverage.
Reduced freight expense to customers/from suppliers.
Represented minimal operational risk due to close fit with Insteel’s core WWR businessand high degree of familiarity.
12

American Spring Wire Acquisition
In August 2014, Insteel entered into a purchase agreement to acquire substantially all the assetsassociated with the PC strand business of American Spring Wire Corporation (“ASW”) for $36.0million, subject to certain post-closing adjustments.
ASW is the second largest producer of PC strand in the U.S. behind Insteel with June 2014 TTMsales of $67.8 million.
Assets to be acquired include working capital, equipment at a leased facility in Texas and a facility inGeorgia.
Insteel
ASW
PC Strand Facilities

Financials – Net Sales
14
$49.2$65.1
$75.6 $69.7 $66.0 $61.8$41.2
$52.3
$84.8 $85.9 $87.2
$66.5
$72.0
$79.8 $74.8 $77.3
$50.4
$52.3
$86.9
$87.0 $82.9 $91.4
$87.2
$85.6
$91.6
$79.0
$104.3
$57.0
$62.0
$98.6
$93.6 $96.9
$113.2
$95.9
$86.6
$82.5
$74.4
$106.3
$61.1
$56.2
$99.1
$97.9 $98.2
$0
$50
$100
$150
$200
$250
$300
$350
$400
2004 2005 2006 2007 2008 2009 2010 2011 2012 2013 2014
($ Millions)
Q1 Q2 Q3 Q4
$298.8$309.3
$329.5
$297.8
$353.9
$230.3
$211.6
$336.9
$363.3 $363.9
Q3 YTD$291.9

Financials – Shipments and Average Selling Prices
15
0
20
40
60
80
100
120
140
160
2004 2005 2006 2007 2008 2009 2010 2011 2012 2013
Inde
x (
200
4 =
100
)
Shipments (Tons) Average Selling Price Per Ton
Financials – Gross Profit Drivers
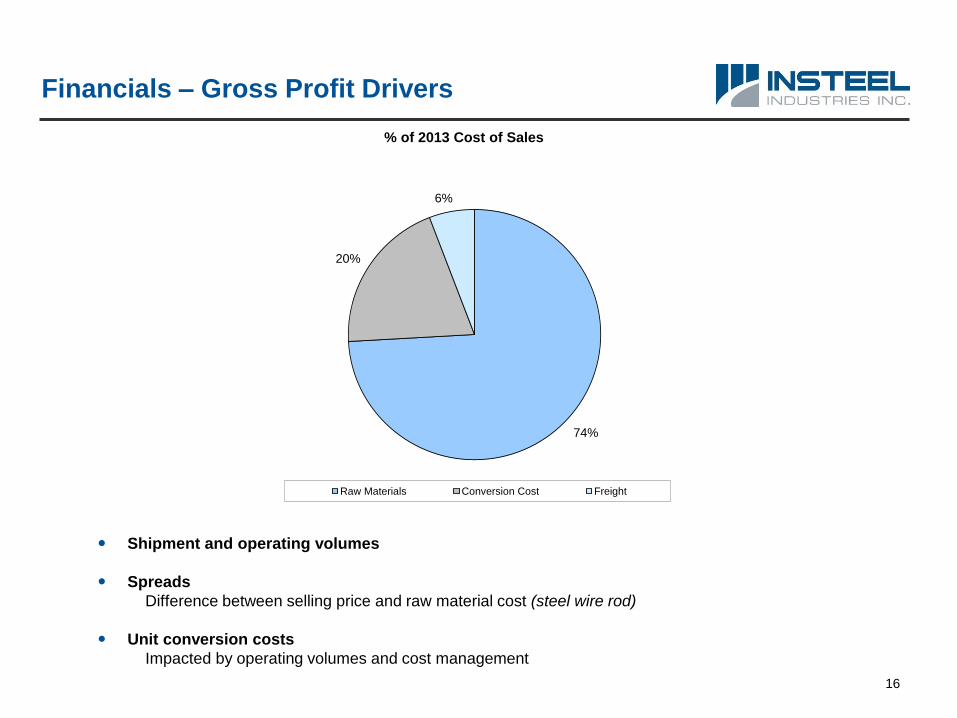
Shipment and operating volumes
Spreads
Difference between selling price and raw material cost (steel wire rod)
Unit conversion costs
Impacted by operating volumes and cost management
16
74%
20%
6%
% of 2013 Cost of Sales
Raw Materials Conversion Cost Freight

Financials – Gross Profit
(2009 – 2010 amounts are pro forma excluding inventory write-downs) 17
Q1 0
4
Q2 0
4
Q3
04
Q4
04
Q1 0
5
Q2 0
5
Q3 0
5
Q4 0
5 Q1 0
6
Q2 0
6
Q3 0
6
Q4 0
6
Q1 0
7
Q2 0
7
Q3 0
7
Q4
07
Q1 0
8
Q2 0
8
Q3 0
8
Q4 0
8
Q1 0
9
Q2 0
9
Q3 0
9
Q4 0
9
Q1 1
0
Q2 1
0
Q3
10
Q4 1
0
Q1 1
1
Q2 1
1
Q3 1
1
Q4 1
1
Q1 1
2
Q2 1
2
Q3 1
2
Q4 1
2
Q1 1
3
Q2 1
3
Q3 1
3
Q4
13
Q1 1
4
Q2 1
4
Q3 1
4
(12%)
(6%)
0%
6%
12%
18%
24%
30%
36%
42%
($10)
($5)
$0
$5
$10
$15
$20
$25
$30
$35
Gro
ss M
arg
in %
Gro
ss P
rofi
t ($
Millio
ns)
Gross Profit Gross Margin %
2004$79.026.4%
2005$57.918.7%
2006$70.921.5%
2007$56.118.8%
2008$86.824.5%
2010$20.39.6%
2011$31.79.4%
2009$10.84.7%
2012$22.56.2%
2013$39.210.8%
Q3 YTD2014$34.912.0%
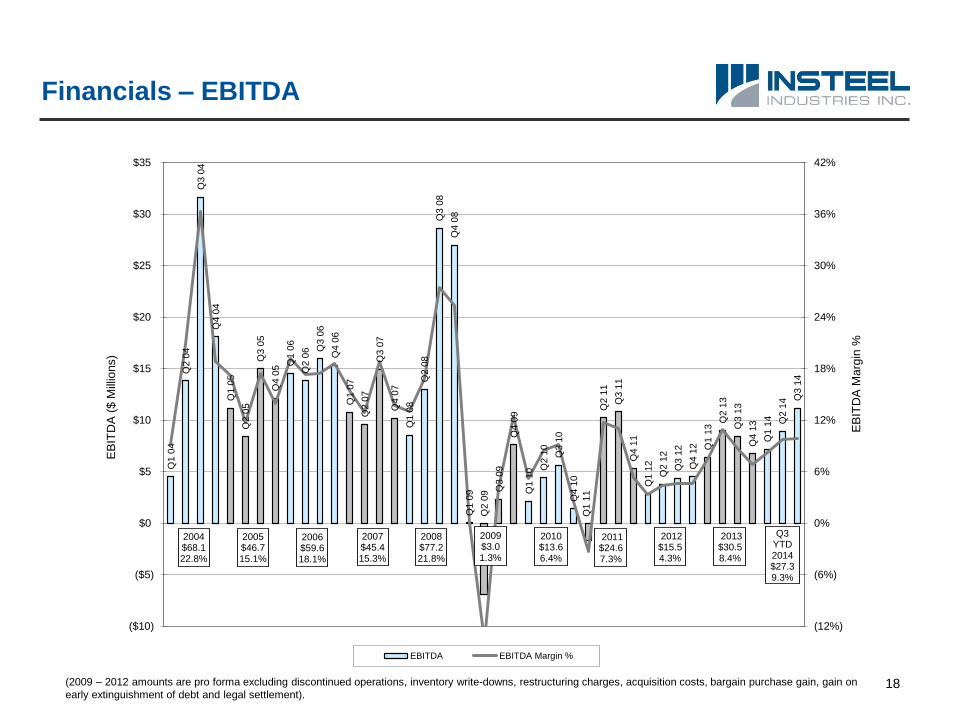
Financials – EBITDA
(2009 – 2012 amounts are pro forma excluding discontinued operations, inventory write-downs, restructuring charges, acquisition costs, bargain purchase gain, gain on
early extinguishment of debt and legal settlement).18
Q1 0
4
Q2 0
4
Q3 0
4
Q4 0
4
Q1 0
5
Q2 0
5
Q3 0
5
Q4 0
5 Q1 0
6
Q2 0
6 Q3 0
6
Q4 0
6
Q1 0
7
Q2 0
7
Q3 0
7
Q4 0
7
Q1 0
8
Q2 0
8
Q3 0
8
Q4 0
8
Q1 0
9
Q2 0
9 Q3 0
9
Q4 0
9
Q1 1
0 Q2 1
0
Q3 1
0
Q4 1
0
Q1 1
1
Q2 1
1
Q3 1
1
Q4 1
1
Q1 1
2
Q2 1
2
Q3 1
2
Q4 1
2 Q1 1
3
Q2 1
3
Q3 1
3
Q4 1
3
Q1 1
4 Q2 1
4 Q3 1
4
(12%)
(6%)
0%
6%
12%
18%
24%
30%
36%
42%
($10)
($5)
$0
$5
$10
$15
$20
$25
$30
$35
EB
ITD
A M
arg
in %
EB
ITD
A (
$ M
illio
ns)
EBITDA EBITDA Margin %
2004$68.122.8%
2005$46.715.1%
2006$59.618.1%
2007$45.415.3%
2008$77.221.8%
2009$3.01.3%
2010$13.66.4%
2011$24.67.3%
2012$15.54.3%
2013$30.58.4%
Q3 YTD2014$27.39.3%

Financials – EBITDA Reconciliation
Earnings before interest, taxes, depreciation and amortization (“EBITDA”) calculated as earnings from continuing
operations before interest expense and income, other income, depreciation and amortization, stock-based
compensation expense and income taxes, and excludes inventory write-downs, restructuring charges, acquisition
costs, bargain purchase gain, gain on early extinguishment of debt and legal settlement.
EBITDA (i) should not be considered as an alternative to net earnings (determined in accordance with GAAP) as an
indicator of our financial performance, (ii) is not an alternative to cash flow from operating activities (determined in
accordance with GAAP) as a measure of our liquidity, and (iii) is not indicative of funds available to fund the our cash
needs because of needed capital replacement or expansion, debt service obligations or other cash commitments and
uncertainties.
We have included EBITDA in the presentation because management believes that it provides investors with a
supplemental measure of cash flow and the ability to assess Insteel’s operating performance for the periods
presented on a comparable basis excluding changes in our capital structure and effective tax rates.
19
Nine Months
Ended (52 weeks) (52 weeks) (52 weeks) (52 weeks) (53 weeks) (52 weeks) (52 weeks) (52 weeks) (52 weeks) (53 weeks)
June 28, September 28, September 29, October 1, October 2, October 3, September 27, September 29, September 30, October 1, October 2,
($ in 000s) 2014 2013 2012 2011 2010 2009 2008 2007 2006 2005 2004
Earnings (Loss) from Continuing Ops $12,066 $11,735 $1,809 ($387) $458 ($20,940) $43,717 $24,284 $34,377 $24,499 $32,035
Interest Expense 169 235 623 958 453 641 594 592 669 3,427 5,832
Interest Income (10) (14) (21) (38) (102) (144) (721) (415) (255) - (1)
Other Expense (Income), Net (653) 333 (188) (222) (291) (135) 85 4 (446) (73) (1,549)
Inventory Write-Downs - - - - 2,333 25,941 - - - - -
Acquisition Costs - - - 3,518 - - - - - - -
Restructuring Charges - - 832 8,318 - - - - - - -
Bargain Purchase Gain - - - (500) - - - - - - -
Gain on Early Extinguishment of Debt - - (425) - - - - - - - -
Legal Settlement - - - - 1,487 - - - - - -
Depreciation and Amortization 7,481 9,833 9,762 9,573 7,009 7,377 7,271 5,711 4,578 4,139 4,153
Stock-Based Comp Expense 1,777 2,161 2,208 2,917 2,258 2,036 1,759 1,258 1,173 805 6,158
Income Taxes 6,444 6,262 917 488 (38) (11,758) 24,457 14,013 19,530 13,870 21,445
EBITDA $27,274 $30,545 $15,517 $24,625 $13,567 $3,018 $77,162 $45,447 $59,626 $46,667 $68,073
Fiscal Year Ended

20
Financials – Net Earnings
(2009 – 2012, 2014 amounts are pro forma excluding discontinued operations, inventory write-downs, restructuring charges, acquisition costs, bargain purchase gain,
gain on early extinguishment of debt, legal settlement and gain on insurance recoveries related to Gallatin fire).
$0.0
7
$0.2
7
$0.4
2
$0.3
2
$0.2
3
($0.0
9)
$0.0
0
($0.1
8)
$0.0
0
$0.1
3
$0.1
5
$0.3
7
$0.2
3
$0.4
2
$0.2
7
$0.3
9
($0.3
6) $
0.0
9
$0.2
3
$0.0
2
$0.2
0
$0.1
9
$0.9
1
$0.4
4
$0.5
0
$0.4
5
$0.9
6
$0.0
0 $
0.0
9
$0.2
7
$0.0
5
$0.1
8
$0.2
8
$0.4
2
$0.3
4
$0.5
1
$0.2
8
$0.8
8
$0.1
6
($0.0
3)
$0.0
4
$0.0
5 $0.1
3
($0.40)
($0.20)
$0.00
$0.20
$0.40
$0.60
$0.80
$1.00
$1.20
($ Per Diluted Share)
Q1 Q2 Q3 Q4
2004 $1.78 2005 $1.28 2006 $1.85 2007 $1.32 2008 $2.44
2009 ($0.24) 2010 $0.16 2011 $0.38 2012 $0.11 2013 $0.64
Q3 YTD 2014$0.64
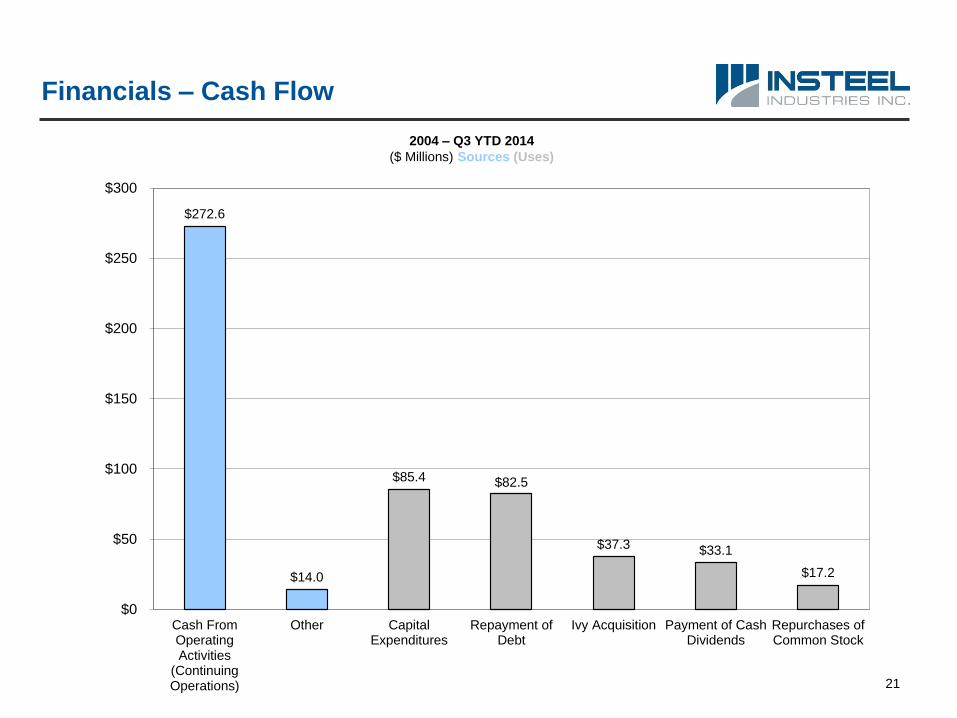
Financials – Cash Flow
2004 – Q3 YTD 2014
($ Millions) Sources (Uses)
21
$272.6
$14.0
$85.4 $82.5
$37.3 $33.1
$17.2
$0
$50
$100
$150
$200
$250
$300
Cash FromOperatingActivities
(ContinuingOperations)
Other CapitalExpenditures
Repayment ofDebt
Ivy Acquisition Payment of CashDividends
Repurchases ofCommon Stock

Financials – Capital Expenditures
Capex totaled $45.4 million during 2006 – 2008, primarily related to addition of two new ESMproduction lines, reconfiguration and expansion of PC strand facilities, and upgrading andexpansion of SWWR operations.
New ESM production lines started up during Q2 and Q4 2013 expected to provide combinedannual capacity of $15.0 - $20.0 million.
Capex not expected to exceed $5.0 million in 2014, excluding outlays related to Gallatin fire. 22
$2.9
$6.3
$19.0
$17.0
$9.5
$2.4
$1.5
$7.9 $8.1
$5.0 $5.0
$0
$5
$10
$15
$20
2004 2005 2006 2007 2008 2009 2010 2011 2012 2013 2014(E)
($ Millions)

Financials – Capital Structure
Execution of restructuring program, proceeds from divestitures and strong operating cash flowhave allowed for reduction in debt from quarter-end high of $124.5 million (Q2 2000).
As of June 28, 2014, Insteel was debt-free with no borrowings outstanding on $100.0 millionrevolving credit facility and $31.4 million of cash and cash equivalents.
23
0%
10%
20%
30%
40%
50%
60%
70%
80%
$0
$30
$60
$90
$120
$150
$180
$210
$240
Q4 99 Q4 00 Q4 01 Q4 02 Q4 03 Q4 04 Q4 05 Q4 06 Q4 07 Q4 08 Q4 09 Q4 10 Q4 11 Q4 12 Q4 13
To
tal D
eb
t to
To
tal C
ap
italizati
on
(%
)
To
tal D
eb
t an
d S
hare
ho
lders
' E
qu
ity (
$ M
illio
ns)
Total Debt Shareholders' Equity Total Debt to Total Capitalization

Dividend and Share Repurchase Programs
Currently paying regular quarterly cash dividend of $0.03 per share ($0.5 million).
Paid special cash dividends of $0.50 per share ($8.8 million) in October 2008 and
$0.25 per share ($4.5 million) in December 2012.
Current $25.0 million share repurchase program was authorized in November 2008.
During 2008, 913,000 shares were repurchased under previous authorizations for
$8.7 million - approximately 5% of total shares outstanding as of beginning of
year.
Two-for-one stock split distributed in June 2006.
Increase in number of shares outstanding has improved trading volume and
liquidity.
24
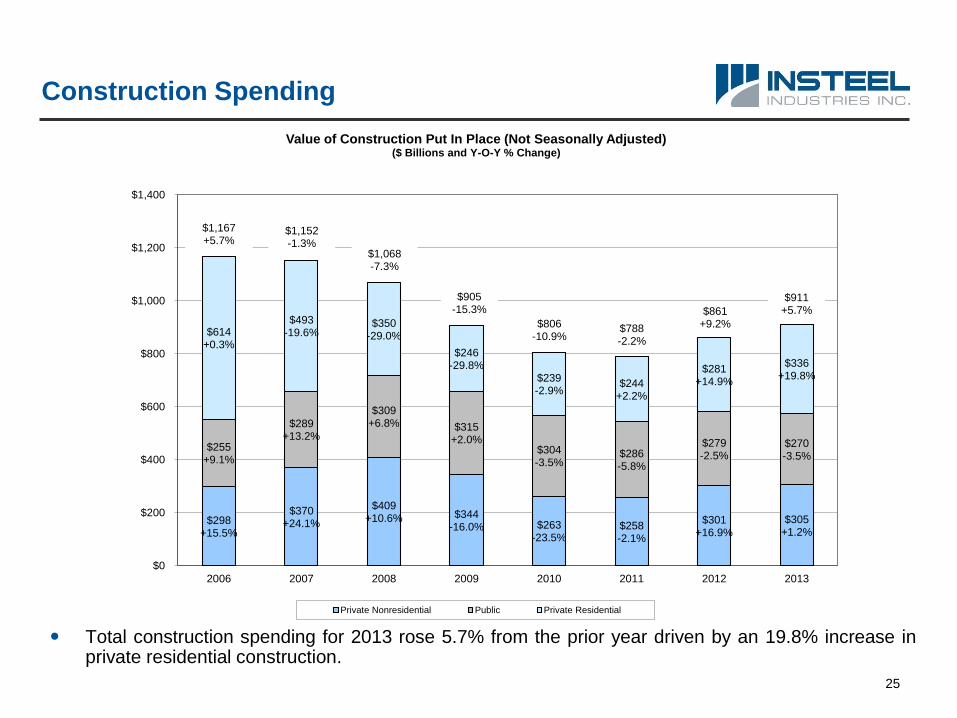
Construction Spending
Total construction spending for 2013 rose 5.7% from the prior year driven by an 19.8% increase inprivate residential construction.
25
$298+15.5%
$370+24.1%
$409+10.6% $344
-16.0% $263-23.5%
$258 -2.1%
$301+16.9%
$305+1.2%
$255+9.1%
$289+13.2%
$309+6.8% $315
+2.0% $304-3.5%
$286 -5.8%
$279-2.5%
$270-3.5%
$614+0.3%
$493-19.6%
$350-29.0%
$246-29.8%
$239-2.9%
$244+2.2%
$281+14.9%
$336+19.8%
$0
$200
$400
$600
$800
$1,000
$1,200
$1,400
2006 2007 2008 2009 2010 2011 2012 2013
Value of Construction Put In Place (Not Seasonally Adjusted)($ Billions and Y-O-Y % Change)
Private Nonresidential Public Private Residential
$1,167+5.7%
$1,152-1.3%
$1,068-7.3%
$905-15.3%
$806-10.9%
$788-2.2%
$861+9.2%
$911+5.7%

Construction Spending
Total construction spending for June YTD 2014 was up 7.8% from the prior year with privatenonresidential up 12.6%, public down 0.9% and private residential up 10.3%.
26
$128
$138
$115$116
$130
$112
$144
$129
$123
$140
$122
$151
$158
$120
$167
$0
$20
$40
$60
$80
$100
$120
$140
$160
$180
Private Nonresidential Public Private Residential
June YTD Value of Construction Put in Place (Not Seasonally Adjusted)($ Billions)
2010 2011 2012 2013 2014
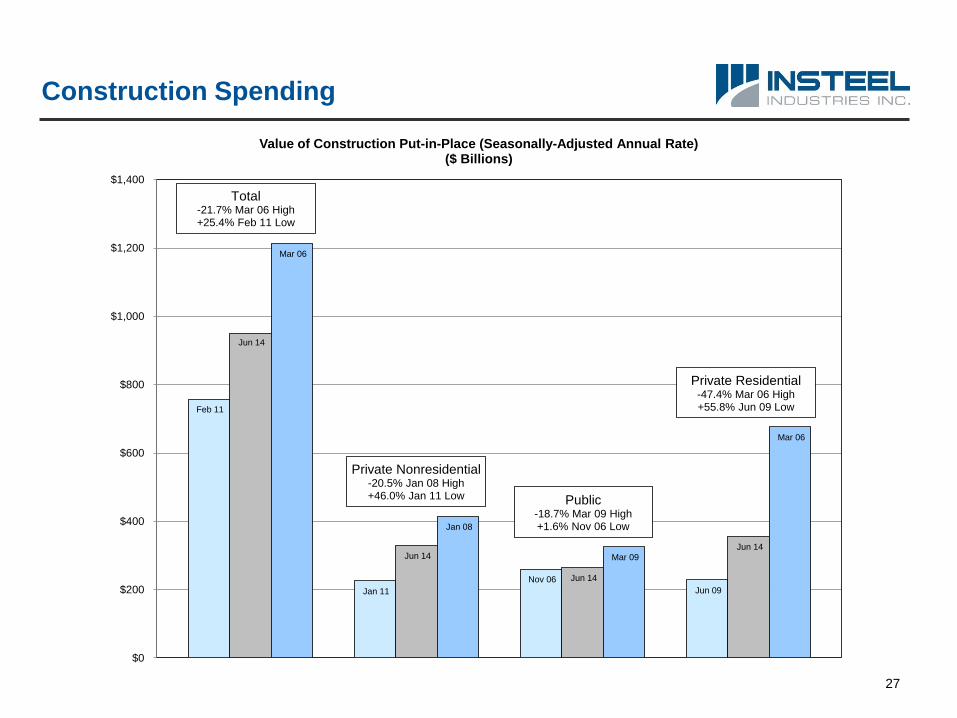
Construction Spending
27
Feb 11
Jun 14
Mar 06
Jan 11
Jun 14
Jan 08
Nov 06 Jun 14
Mar 09
Jun 09
Jun 14
Mar 06
$0
$200
$400
$600
$800
$1,000
$1,200
$1,400
Value of Construction Put-in-Place (Seasonally-Adjusted Annual Rate)($ Billions)
Private Nonresidential-20.5% Jan 08 High+46.0% Jan 11 Low
Private Residential-47.4% Mar 06 High+55.8% Jun 09 Low
Public-18.7% Mar 09 High+1.6% Nov 06 Low
Total-21.7% Mar 06 High+25.4% Feb 11 Low
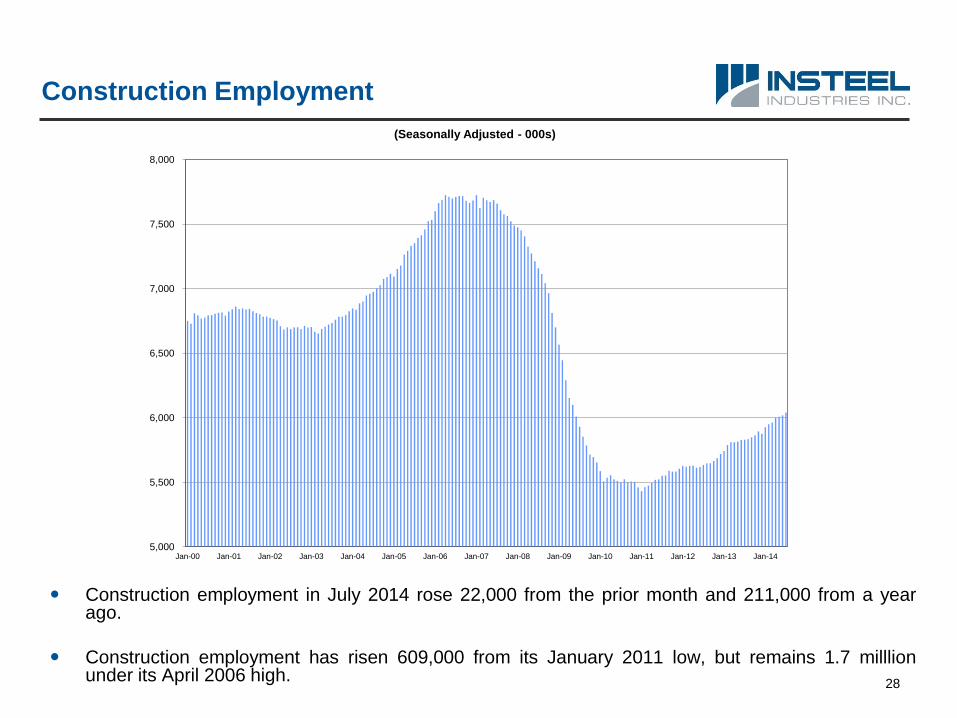
Construction Employment
Construction employment in July 2014 rose 22,000 from the prior month and 211,000 from a yearago.
Construction employment has risen 609,000 from its January 2011 low, but remains 1.7 milllionunder its April 2006 high.
.
28
5,000
5,500
6,000
6,500
7,000
7,500
8,000
Jan-00 Jan-01 Jan-02 Jan-03 Jan-04 Jan-05 Jan-06 Jan-07 Jan-08 Jan-09 Jan-10 Jan-11 Jan-12 Jan-13 Jan-14
(Seasonally Adjusted - 000s)
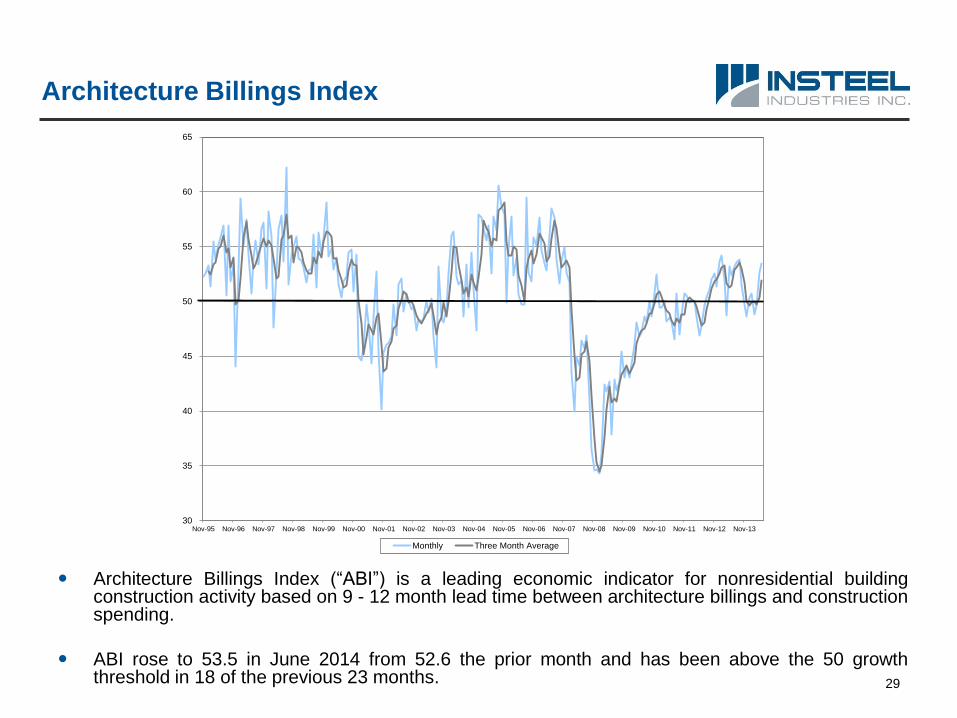
Architecture Billings Index
Architecture Billings Index (“ABI”) is a leading economic indicator for nonresidential buildingconstruction activity based on 9 - 12 month lead time between architecture billings and constructionspending.
ABI rose to 53.5 in June 2014 from 52.6 the prior month and has been above the 50 growththreshold in 18 of the previous 23 months. 29
30
35
40
45
50
55
60
65
Nov-95 Nov-96 Nov-97 Nov-98 Nov-99 Nov-00 Nov-01 Nov-02 Nov-03 Nov-04 Nov-05 Nov-06 Nov-07 Nov-08 Nov-09 Nov-10 Nov-11 Nov-12 Nov-13
Monthly Three Month Average

Outlook
Conditions in construction end-markets expected to improve over remainder of year.
Recent macro indicators reflect continued improvement in private nonresidential construction,which appears to be gaining momentum.
Continued recovery in housing market should favorably impact certain segments within privatenonresidential construction.
Outlook for infrastructure construction remains unclear pending passage of new long-term federalhighway funding authorization.
Expect increasing contribution from Ivy acquisition as anticipated synergies and benefits fromreconfiguration of WWR manufacturing facilities are realized.
Remainder of equipment relocations completed during 2012. Expect improved results at facilitiesimpacted as redeployed equipment is ramped up.
Recent capital investments should provide increasing contributions as market conditionsimprove and operating levels rise.
Addition of two new ESM production lines in 2013 supports continued penetration of rebar marketand allows for reduced manufacturing costs and enhanced customer service capabilities.
30
Summary – Investment Considerations
Strong positions in attractive fragmented markets.
Modern manufacturing facilities and highly competitive cost structure.
Significant growth potential of existing facilities through increased capacityutilization as market conditions improve.
Highly variable cost structure advantageous during business downturns.
Growth initiatives (organic and acquisitions).
National scope of facilities and markets served.
Financial strength and flexibility.
Experienced management team.
Import competition limited to PC strand business.
Diversified customer base.
Breadth of product lines and bundling capabilities.
Raw material purchasing leverage – volume and mix.
Lack of legacy issues – environmental, post-retirement obligations, minimaldefined benefit plan obligations.
31