john d. sterman - system design and management · 1 a banquet of consequences: systems thinking and...
TRANSCRIPT

1
A Banquet of Consequences:�
Systems Thinking and Modeling�
for Climate Change Policy�
John D. Sterman�
Jay W. Forrester Professor of Management�Professor of Engineering Systems�
Director MIT System Dynamics Group�MIT Sloan School of Management�
[email protected]�web.mit.edu/jsterman/www�
“Everybody, soon or late, sits down to a banquet of consequences.” �
–Robert Louis Stevenson�
2
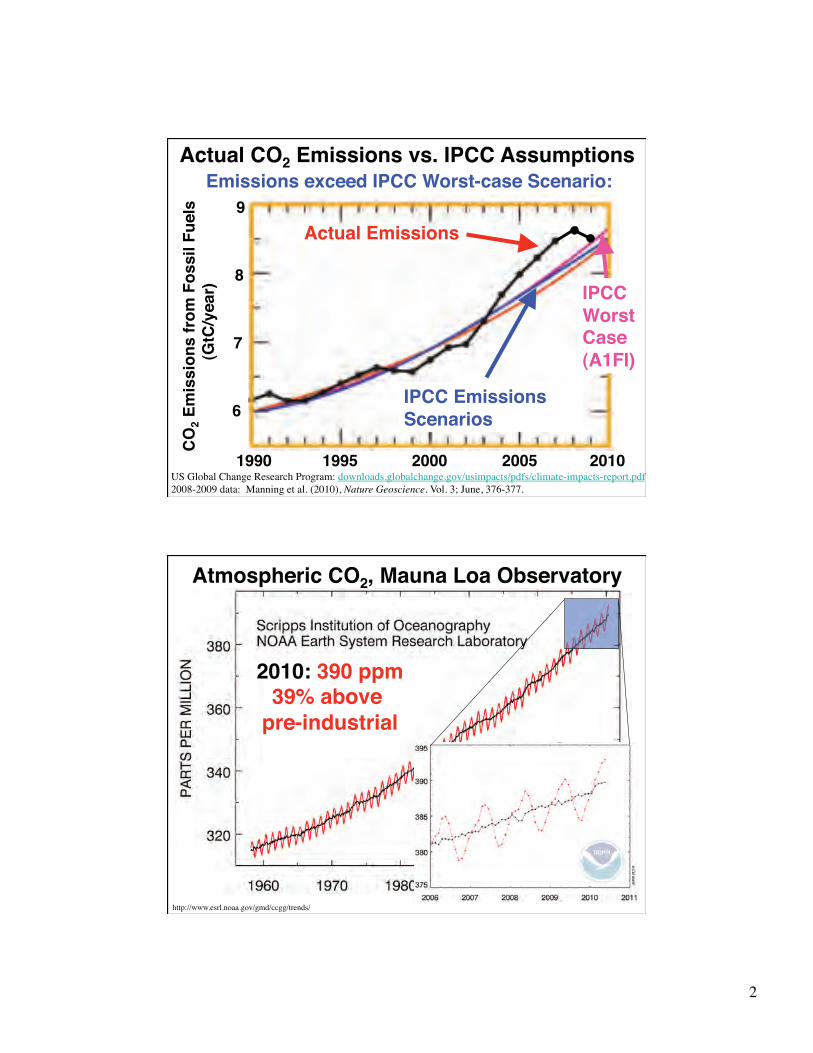
Emissions exceed IPCC Worst-case Scenario:�C
O2
Em
issi
on
s fr
om
Fo
ssil
Fu
els
� (
GtC
/yea
r)�
Actual CO2 Emissions vs. IPCC Assumptions�
US Global Change Research Program: downloads.globalchange.gov/usimpacts/pdfs/climate-impacts-report.pdf�2008-2009 data: Manning et al. (2010), Nature Geoscience. Vol. 3; June, 376-377.�
1990� 1995� 2000� 2005� 2010�
6�
7�
8�
9�
IPCC Emissions Scenarios�
IPCC WorstCase�(A1FI)�
Actual Emissions�
http://www.esrl.noaa.gov/gmd/ccgg/trends/�
Atmospheric CO2, Mauna Loa Observatory�
2010: 390 ppm�39% above �
pre-industrial�

3
0 °C� 1.0 °C� 2.0 °C� 3.0 °C� 4.0 °C� 5.0 °C�1.8 °F� 3.6 °F� 5.4 °F� 7.2 °F� 9.0 °F�0 °F�
IPC
C A
R4�
1.8 °F� 3.6 °F� 5.4 °F� 7.2 °F� 9.0 °F�0 °F�0 °C� 1.0 °C� 2.0 °C� 3.0 °C� 4.0 °C� 5.0 °C�
3.5 °C�6.3 ° F�
5.3 °C�9.5 °F�
7.4 °C�13.3 °F�
MIT Joint Program
on Global Change
(Sokolov et al. 2009, Journal of Climate)
Projected mean temp
increase by 2100
under BAU�
10.8 °F�6.0 °C�

4�
Why is Climate Change Policy Hard? �Problem�
•� Uncertainty about causes and impacts�
Solution�•� More scientific
research on climate�
•� Tragedy of the commons�
•� Capture externalities via global agreements & new markets (e.g. cap & trade, C prices)�
•� Alleged high costs of mitigation�
•� More R&D for alternative energy & energy efficiency�
Why is Climate Change Policy Hard? �
Problem�•� Misperceptions of
feedback among�–�Policymakers�–�Business Leaders�
–�Media�–�Educators�–�Public�
Solution�•� Develop systems
thinking capabilities of key stakeholders via models, metaphors, management flight simulators, role plays:���Fast & Interactive���Transparent & Rigorous���Learner directed���Grounded in science�

5
•� Dynamic�•� Tightly coupled�•� Governed by
Feedback�•� Nonlinear�•� Self-Organizing�•� Adaptive�•� Evolving�
Complex Systems Are�
But our mental models are characterized by:�
•� Short time horizons�•� Narrow boundaries �•� Poor understanding of risk, feedback,
time delays, stocks and flows, nonlinearities�
•� Unscientific reasoning and poor learning skills�
http://www.infomotions.com/gallery/uiuc/Pages/DSCN2390.shtml�

6
Sterman, J. (2008) Science 322: 532-533 (24 Oct).�
http://jsterman.scripts.mit.edu/Management_Flight_Simulators_(MFS).html�http://scripts.mit.edu/~jsterman/climate/master/�
Risk Communication on Climate: Mental Models and Mass Balance John D. Sterman
The strong scient ific consensus on the causes and risks of climate change stands in stark contrast to widespread
confusion and complacency among the public (J, 1). Why docs this gulf exist, and why docs it matter? Policies to manage comple.'I. natural lind technical systems should be based on the best available scientific knowledge, lind the Inter!,'(Ivcrnmcntlll Panel on Climate Change (lpeC) provides rigorously vetted information to policy-makers. In dctlJO(:rllcics, hov.'cvcr, the beliefs ur the public, not only those of experts, affect government policy
EfTective risk communication is grounded indeep understanding of the menial mooelsof policy-makers and citizens (3). What, then, are the principal menial mtxIels shaping pe0-
ple 's beliefs about climate change? Studies shO\',' an apparent contradiction: Majorities in the United States and other nations have heard of climate change and say they suppon action to address it , yet climate change ranks far behind the economy, war, and terrorism among people 's greatest concerns, and large majorities oppose policies that ,":ould cut greenhouse ga~ (G HG) emissions by raising fossil fuel prices (/ ,2)
More telling,a 2007 survey found a majority of U.S. respondents (54%) advocated a ··wait-and-see" or ··go slow" approach to emissions reductions. Larger majorities favored wait-and-see or go slCM' in Russia,
eon~ider a scenario in v.t1kh the concrotrat ion of CO2 in the atmosphere gradually rise<; to 400 ppm, about 8% higher than the levt'l in 2000, then stlb~ iles by the yt'ar 2100, as shown here:
j u o_
HE:~ ~ 110_ ~ JOO-
~ '~Wo 1'1S0 1000 I OSO 1100
Year The graph below shows anthropogenic (02 emissions from 1900-2000, and currrot net removal of CO 2 from the atmosphere by natural processes. Sketch:
a. Your estimate of ~kely future net CO 2 removal, givt'n the scenario abOvt'. b. Your est imate of likely future anthropogenic CO 2 emi~ ion~, givt'n the scenario abOvt'.
O~lI~ 5 10 -
.~~ ! : Eminion!
8-:5 . -.s:; 1- Net removal
.i ~ ~~ 19~0 10'00 «Iso 11'00
Year
The cl imate stabilizat ion task. Subjects were first given an excerpt from the lPee SPM explicitly describing the accumulation of COl in the atmosphere Isee (2)).
Publk confusion about the urgency of reductions in greenhouse gas emisslollS results from a bask misconception.
standing of stocks and I1ows--the concept of accumulation. Accumulation is pervasive in everyday ellperience: Our bathtubs accumulate the inl10w of water through the faucet less the outl1ow through the drain, our bank accounts accumulate deposits less withdrawals, and we all struggl~ to control our we ight by managing the inl1CM's and outflows of calories through diet and ellercise. Yet , despite their ubiquity, research shows that people have difficulty relating the I1CM's into and out of a stock to the level of the stock, even in simple, familiar contellts such a~ bank accounts and bathtubs. Instead, people often assess system dynamics using a pallernmatching heuristic, assuming that the output of a system should '"look like"--be positively correlated with-its inputs (12, 13)
Although sometimes useful , correlational reasoning fails in systems with important accumulations. Since 1950, the U.S. federal budget deficit and national debt have risen dramatically and are highly correlated (r = 0.84 , P < 0.0001). Correlational reasoning predicts that CUlling the deficit would also cut the debt HCM'ever, because the national debt isa stock that accumulates the deficit , it keeps rising even if the deficit falls; debt falls only if the government runs a surplus
Poor understanding of accumuntion leads to serious errors in reasoning about climate change (see chans, left , and on page 533)
~ ..., Greenhouse Gas EmISSIons Simulator MtT CI m~te 0,,1_ ~ prOI~ct of the M IT Systl'm Dyn "',"C5 Group
"" "'"
Wlat would l take to stabil lze CD2 concentration?
~ ""J-----------:=~--_I
O:L-_--~ 1900 1925 1B!50 1975 2(D) 2025 20&1 2075 2100
~ 10
1900 1925 1950 1975 2(D) 202S 20&1 2075 2100
J <8ack. SUbmit> L

7
280
300
320
340
360
380
400
420
440
1900 1950 2000 2050 2100
Atm
osp
her
ic C
O2
(pp
mv)
0
2
4
6
8
10
12
1900 1950 2000 2050 2100
An
thro
pog
enic
CO
2 E
mis
sion
s(G
tC/y
ear)
•� Rising [CO2] � Human Emissions > Net Removal�•� Removal in 2000 � half of emissions�
•� What is likely future removal path?�
•� What is likely future removal path?�
��Net removal likely to decline due to saturation of carbon sinks�
��For simplicity, consider constant net removal (commonly chosen by participants)�
Net Removal�
Typical Response�
8
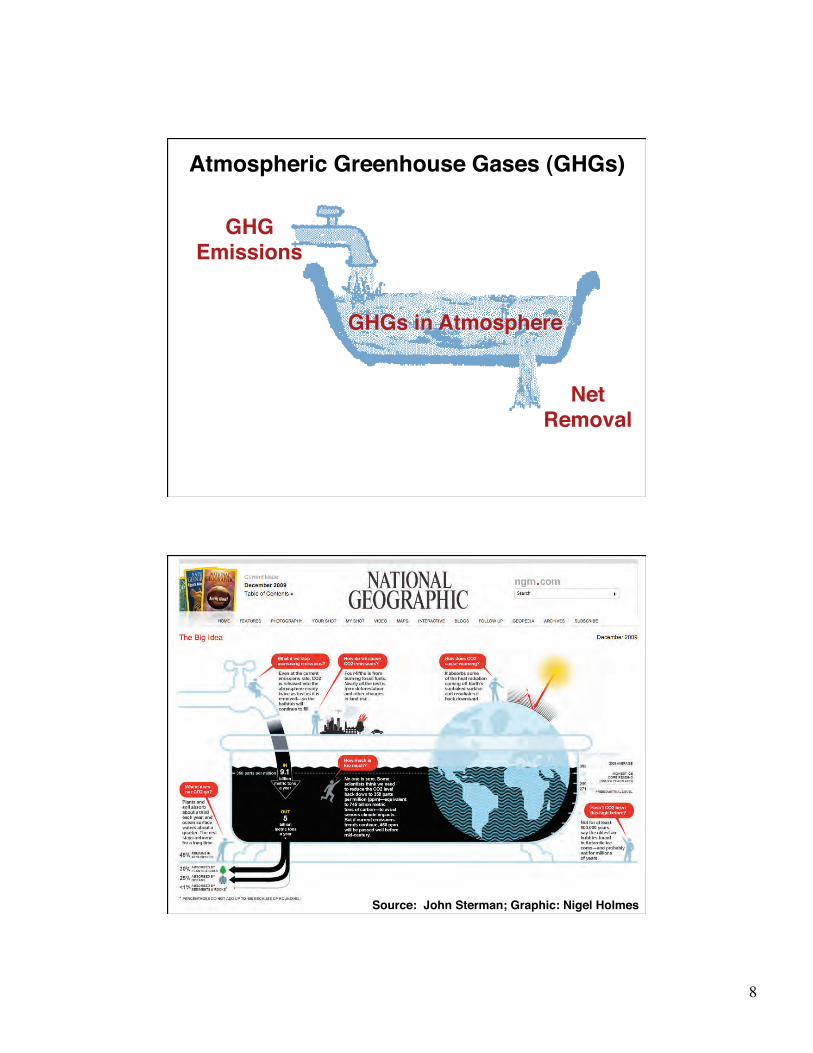
GHG�Emissions�
Net�Removal�
Atmospheric Greenhouse Gases (GHGs)�
Source: John Sterman; Graphic: Nigel Holmes�

9�
280
300
320
340
360
380
400
420
440
1900 1950 2000 2050 2100
Atm
osp
her
ic C
O2
(pp
mv)
0
2
4
6
8
10
12
1900 1950 2000 2050 2100
An
thro
pog
enic
CO
2 E
mis
sion
s(G
tC/y
ear)
•� Rising [CO2] � Human Emissions > Net Removal�•� Removal in 2000 � half of emissions�
•� What is likely future removal path?�
��Net removal likely to decline due to saturation of carbon sinks�
��For simplicity, consider constant net removal (commonly chosen by participants)�[CO2] Stabilization �
Emissions must fall to Removal�
Net Removal�
Mass Balance?�•�84% violate conservation of mass�
•�75% violate equilibrium condition that stable atmospheric CO2 � �Emissions = Removal�
•�63% assert atmospheric CO2 can be stabilized while E > R�
Subjects: MIT Graduate Students (n= 212)��Sterman, J. and L. Booth Sweeney (2007). Understanding Public Complacency About Climate Change: Adults' Mental Models of Climate Change Violate Conservation of Matter. Climatic Change 80(3-4): 213-238.�

10�
Balancing Feedback�
Atmospheric CO2Concentration
PhotosynthesisCO2 Removed
from Atmosphere
+
+
-
B
CO2Fertilization
Other Nutrient Limits�(N, P, K, Fe, H2O, �
Sunlight, �etc.)�
Reinforcing Feedback Example:�
Methane and
Average SurfaceTemperature
CO2 in theAtmosphere
+
CO2 Released fromSoil by Bacterial
Respiration
+
+
R
Respiration
Methane and
11
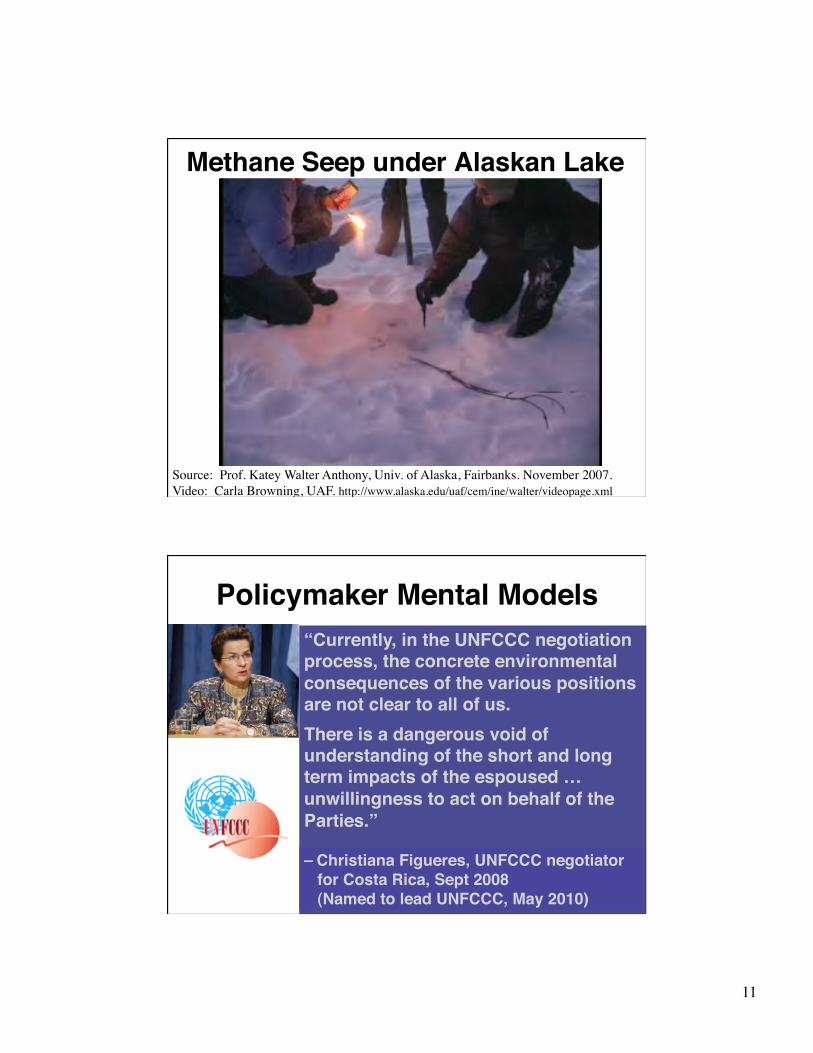
Methane Seep under Alaskan Lake�
Source: Prof. Katey Walter Anthony, Univ. of Alaska, Fairbanks. November 2007. Video: Carla Browning, UAF. http://www.alaska.edu/uaf/cem/ine/walter/videopage.xml�
Policymaker Mental Models�“Currently, in the UNFCCC negotiation process, the concrete environmental consequences of the various positions are not clear to all of us. �
There is a dangerous void of understanding of the short and long term impacts of the espoused …unwillingness to act on behalf of the Parties.”��
– Christiana Figueres, UNFCCC negotiator � for Costa Rica, Sept 2008� (Named to lead UNFCCC, May 2010)�
12
23�
(10 layers)
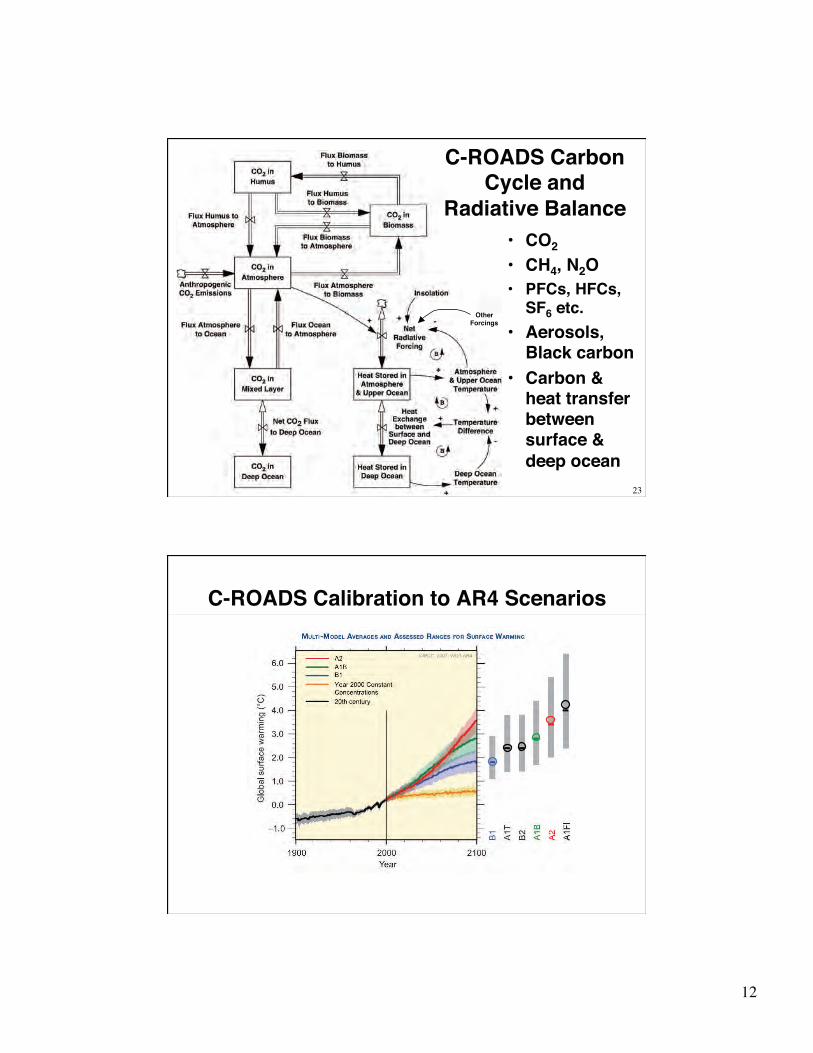
C-ROADS Carbon Cycle and
Radiative Balance�
Other�Forcings�
•� CO2�•� CH4, N2O�•� PFCs, HFCs,
SF6 etc.�
•� Aerosols, Black carbon�
•� Carbon & heat transfer between surface & deep ocean�
C-ROADS Calibration to AR4 Scenarios�

13�
Sea Level History�40
-70
-180
-290
-400
1850 1872 1894 1916 1938 1960 1982 2004
Time (Year)
mm
C-ROADS�
Tide Gauge�
Satellite�
mm �
1850 1900 1950 2004�
40�
-70�
-180�
-290�
-400�
C-ROADS Scientific Review Panel
•� Dr. Robert Watson Department for Environment, Food and Rural Affairs (DEFRA) and former chair, IPCC
•� Mr. Eric Beinhocker McKinsey Global Institute
•� Dr. Klaus Hasselmann Max-Planck Institut für Meteorologie
•� Dr. David Lane London School of Economics
•� Dr. Jørgen Randers Norwegian School of Management (BI)
•� Dr. Stephen Schneider Stanford University
•� Dr. Bert de Vries Netherlands Environmental Assessment Agency, RIVM
14
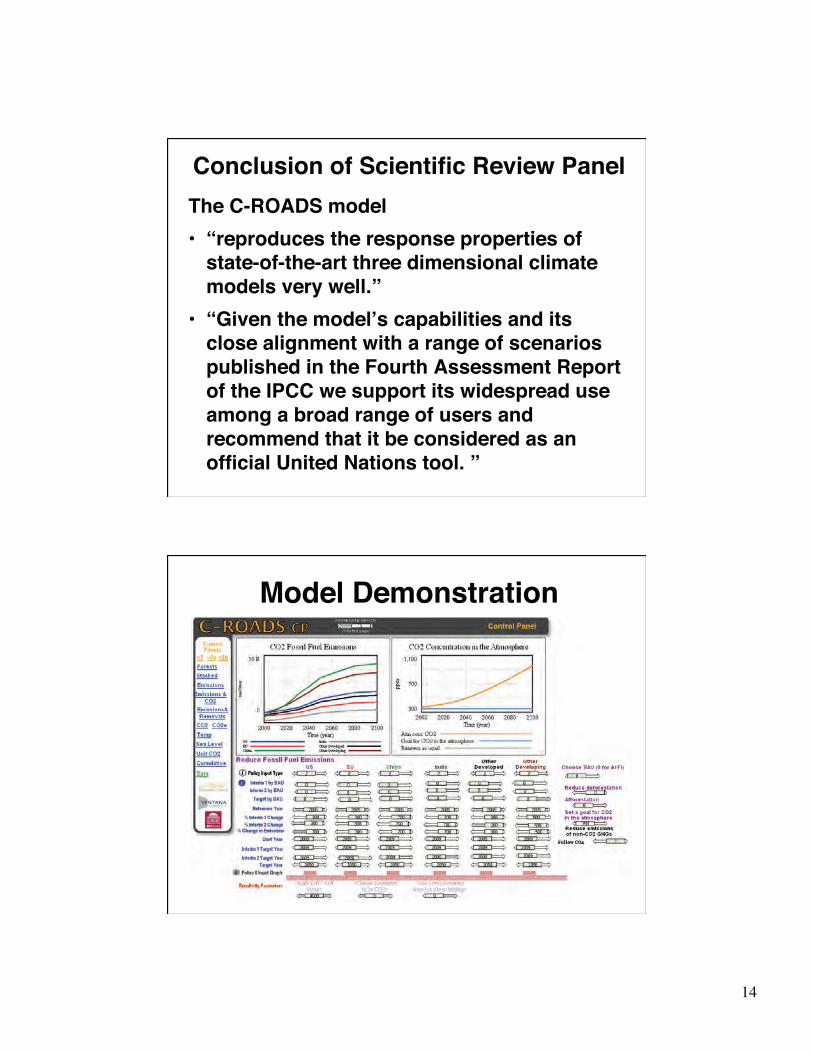
Conclusion of Scientific Review Panel�
The C-ROADS model �
•� “reproduces the response properties of state-of-the-art three dimensional climate models very well.” �
•� “Given the model�s capabilities and its close alignment with a range of scenarios published in the Fourth Assessment Report of the IPCC we support its widespread use among a broad range of users and recommend that it be considered as an official United Nations tool. ” �
Model Demonstration�

15
How is C-ROADS being used?�•�Policymakers and negotiators:�
–� Scenario and policy assessment�•� US, China�
–� Internal capability to use model�–�UNFCCC “Adding up” work for COP16�
•�Media and the public:�–� “State of the global deal” reported on
climateinteractive.org�
•�Educators, businesses, civil society:�–� Free web version: C-LEARN�–� “World Climate” Role-play simulation of UNFCCC
negotiations, available at climateinteractive.org�

16
•� Global emission reductions of about 80% by 2050, continuing thereafter, with substantial reductions in deforestation, could stabilize GHG concentrations, slow temperature increase and moderate sea level rise and other risks.�
What is required?�
•� Stabilizing atmospheric GHG levels requires a substantial drop in global emissions�
17�
But won�t it hurt the economy?�
•�“Responding to climate change is just too expensive”�
•�“It will slow economic growth and cost jobs”�
•�“It will put our country at a competitive disadvantage”�
The Climate Dividend�•� Cutting emissions puts $$ in our pockets�
–�Cuts oil imports (� $1 Billion/day)�
–�Reduces other harmful pollutants & their health costs ($120 Billion and 20,000 lives per year)�
–�Reduces need to defend insecure oil supplies��(Priceless)�
•� Investing in emissions reductions�–�Stimulates innovation and new businesses that
enhance competitiveness and create jobs�
–�Creates opportunity for global leadership in emerging critical technologies�
–�Getting cheaper every day �

18
Cost of Emissions Abatement �
Source: McKinsey�
Negawatts�(Negative Cost)�
Greensburg, Kansas, May 5, 2007�
http://upload.wikimedia.org/wikipedia/commons/e/e0/Greensburg_kansas_tornado.jpg�

19
http://www.nytimes.com/2009/09/23/realestate/commercial/23kansas.html�

20
LEED Platinum Deere Dealership�
New Home of MIT Sloan�

21
MIT Building 68 (Biology)�
140�
0�1990� 2010�
GW�
Global Wind Power�Capacity Installed�
40�
0�1980� 2020�
¢/kW
h� Wind Power�
Cost per kWh�

22
World Solar PV Output�
Average Growth Rate:�1990-2000: 18.1%/year�2000-2008: 39.8%/year�
Cumulative US solar energy production:�� 0.0004 of cumulative US fossil fuel production since 1950. �
Cumulative US solar energy production:
How much more can renewable costs fall?�
Source: �Steven Chu,�US DoE�

23
Over the Tipping Point�
Cost of RenewableEnergy
Demand forRenewable
Energy
R&D, Production Experience,Field Experience, Economiesof Scale, Public Acceptance
Price ofRenewable
Energy
+
+
-
-
R
Human Ingenuity
Carbon Tax,�Emissions Cap�
+�Price of�
Fossil Fuels�
+�
Government�Subsidies�
–�
24
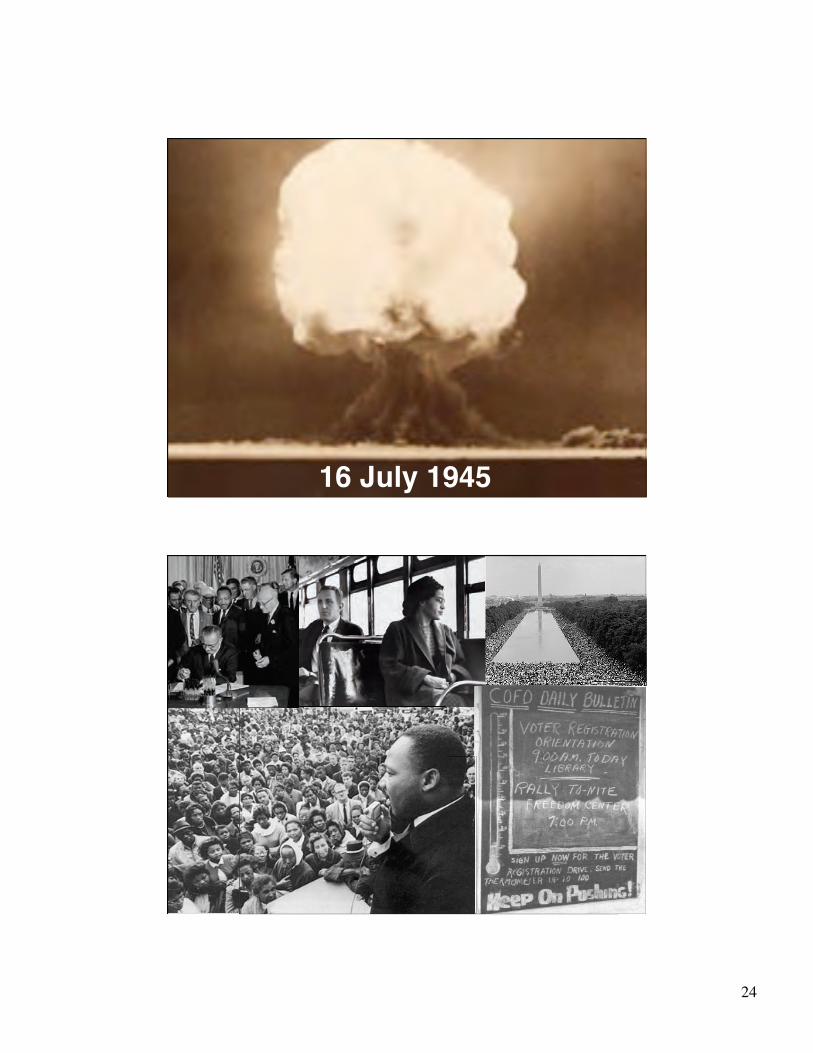
16 July 1945�
