john keells plc - cse
TRANSCRIPT
John Keells PLC
Interim Condensed Financial Statements
30th June 2019

CONSOLIDATED
INCOME STATEMENT
For the three months ended 30th June 2019 2018 Change %
Continuing Operations
Services transferred over time 170,216 206,826 (18)
Revenue from contracts with customers 170,216 206,826 (18)
Cost of sales (65,092) (69,541) 6
Gross profit 105,124 137,285 (23)
Other operating income 221 30 625
Distribution expenses (1,705) (3,371) (49)
Administrative expenses (59,433) (61,905) 4
Results from operating activities 44,207 72,039 (39)
Finance costs (32,064) (24,427) (31)
Finance income 13,180 16,420 (20)
Net finance (costs) / income (18,884) (8,007) (136)
Share of results of equity-accounted investee 600 485 (24)
Profit before tax 25,923 64,517 (60)
Tax expense (14,173) (20,058) 29
Profit for the period 11,750 44,459 (74)
Attributable to :
Equity holders of the parent 14,360 45,047 (68)
Non-controlling interests (2,610) (588) (344)
11,750 44,459 (74)
Earnings per share Rs. Rs.
Basic 0.24 0.74
Dividend per share 2.00 2.30
Note : All values are in Rupees '000s, unless otherwise stated.
Figures in brackets indicate deductions.
The above figures are not audited.
1
John Keells PLC

CONSOLIDATED STATEMENT OF
COMPREHENSIVE INCOME
For the three months ended 30th June 2019 2018
Profit for the period 11,750 44,459
Other comprehensive income
Other comprehensive income to be reclassified to income statement in subsequent periods
Net (Loss) on available for sale financial assets - 12,609 Net other comprehensive income to be reclassified to income statement in subsequent periods - 12,609
Other comprehensive income not to be reclassified to income statement in subsequent periods
Net (Loss)/gain on equity instrumnets at fair value through other comprehensive income (18,270) - Net other comprehensive income not to be reclassified to income statement in subsequent periods (18,270) -
Income tax on other comprehensive income 4,883 -
Other comprehensive income for the period, net of tax (13,387) 12,609
Total comprehensive income for the period, net of tax (1,637) 57,068
Attributable to :
Equity holders of the parent 973 57,656
Non-controlling interests (2,610) (588)
(1,637) 57,068
Note : All values are in Rupees '000s, unless otherwise stated.
Figures in brackets indicate deductions.
The above figures are not audited.
2
John Keells PLC
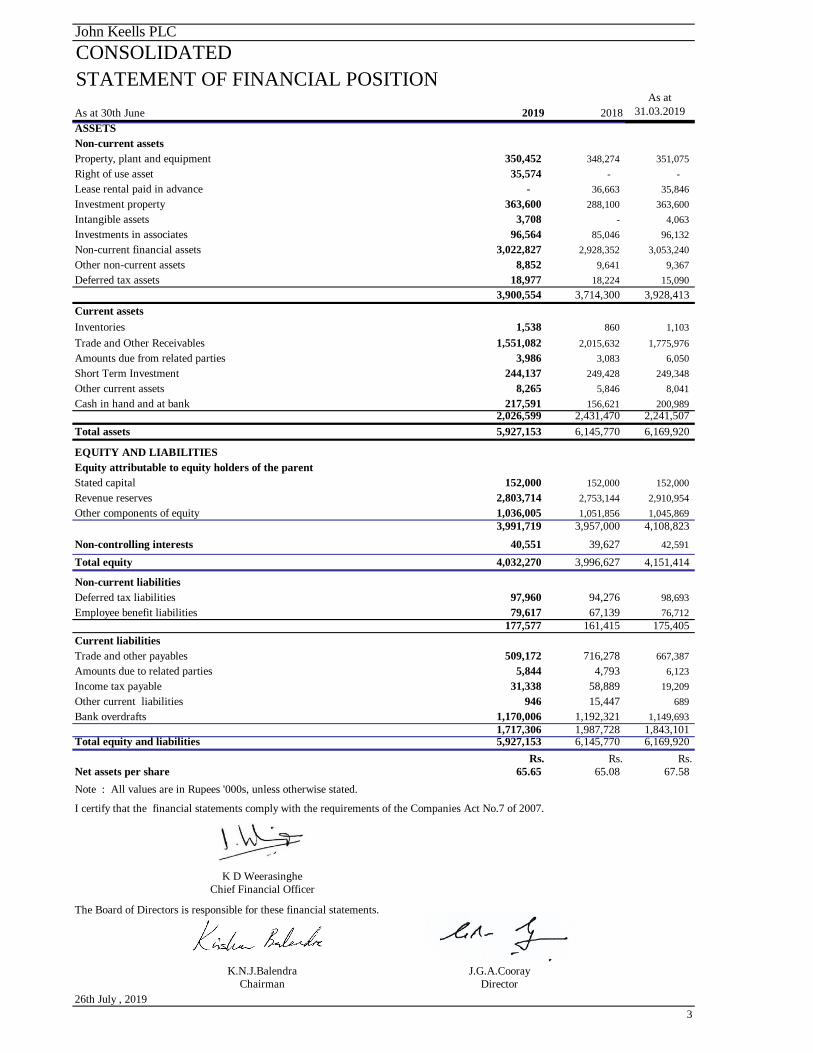
CONSOLIDATED
STATEMENT OF FINANCIAL POSITION
As at 30th June 2019 2018
As at
31.03.2019
ASSETS
Non-current assets
Property, plant and equipment 350,452 348,274 351,075
Right of use asset 35,574 - -
Lease rental paid in advance - 36,663 35,846
Investment property 363,600 288,100 363,600
Intangible assets 3,708 - 4,063
Investments in associates 96,564 85,046 96,132
Non-current financial assets 3,022,827 2,928,352 3,053,240
Other non-current assets 8,852 9,641 9,367
Deferred tax assets 18,977 18,224 15,090
3,900,554 3,714,300 3,928,413
Current assets
Inventories 1,538 860 1,103
Trade and Other Receivables 1,551,082 2,015,632 1,775,976
Amounts due from related parties 3,986 3,083 6,050
Short Term Investment 244,137 249,428 249,348
Other current assets 8,265 5,846 8,041
Cash in hand and at bank 217,591 156,621 200,989
2,026,599 2,431,470 2,241,507
Total assets 5,927,153 6,145,770 6,169,920
EQUITY AND LIABILITIES
Equity attributable to equity holders of the parent
Stated capital 152,000 152,000 152,000
Revenue reserves 2,803,714 2,753,144 2,910,954
Other components of equity 1,036,005 1,051,856 1,045,869
3,991,719 3,957,000 4,108,823
Non-controlling interests 40,551 39,627 42,591
Total equity 4,032,270 3,996,627 4,151,414
Non-current liabilities
Deferred tax liabilities 97,960 94,276 98,693
Employee benefit liabilities 79,617 67,139 76,712
177,577 161,415 175,405
Current liabilities
Trade and other payables 509,172 716,278 667,387
Amounts due to related parties 5,844 4,793 6,123
Income tax payable 31,338 58,889 19,209
Other current liabilities 946 15,447 689
Bank overdrafts 1,170,006 1,192,321 1,149,693
1,717,306 1,987,728 1,843,101 Total equity and liabilities 5,927,153 6,145,770 6,169,920
Rs. Rs. Rs.
Net assets per share 65.65 65.08 67.58
Note : All values are in Rupees '000s, unless otherwise stated.
I certify that the financial statements comply with the requirements of the Companies Act No.7 of 2007.
K D Weerasinghe
Chief Financial Officer
The Board of Directors is responsible for these financial statements.
K.N.J.Balendra J.G.A.Cooray
Chairman Director
26th July , 2019
3
John Keells PLC

John Keells PLC
CONSOLIDATED
CASH FLOW STATEMENT
For the three months ended 30th June Note 2019 2018
CASH FLOWS FROM OPERATING ACTIVITIES
Profit before working capital changes A 56,896 85,672
(Increase) / Decrease in inventories (435) (199)
(Increase) / Decrease in other non-current assets 12,827 (32,770)
(Increase) / Decrease in trade and other receivables 224,622 (472,181)
(Increase) / Decrease in amounts due from related parties 2,065 (1,280)
(Increase) / Decrease in other current assets (224) (1,879)
Increase / (Decrease) in other current liabilities 258 11,037
Increase / (Decrease) in amounts due to related parties (279) 1,240
Increase / (Decrease) in trade and other payables (158,215) 25,042
Cash generated from operations 137,515 (385,318)
Interest Received 8,754 7,568
Finance expenses paid (32,064) (24,427)
Income Tax Paid (1,605) (9,618)
Gratuity paid/Transfers (Net) - (15)
Net cash flow from (Used) in operating activities 112,600 (411,810)
INVESTING ACTIVITIES
Purchase and construction of property, plant and equipment (4,555) (560)
Dividend income - FVOCI Financial Assets 4,426 8,852
Proceeds from sale of Property Plant & Equipment 207 -
Net cash flow from/(used in) investing activities 78 8,292
FINANCING ACTIVITIES
Dividend paid to equity holders (121,600) (139,840)
Net cash flow used in financing activities (121,600) (139,840)
NET (DECREASE) IN CASH AND CASH EQUIVALENTS (8,922) (543,358)
CASH AND CASH EQUIVALENTS AT THE BEGINNING (699,356) (242,914)
CASH AND CASH EQUIVALENTS AT THE END (708,278) (786,272)
ANALYSIS OF CASH AND CASH EQUIVALENTS
Favourable balances
Short Term Investment 244,137 249,428
Cash in hand and at bank 217,591 156,621
Unfavourable balances
Bank overdrafts (1,170,006) (1,192,321)
Cash and cash equivalents (708,278) (786,272)
Note : All values are in Rupees '000s, unless otherwise stated.
Figures in brackets indicate deductions.
4

CONSOLIDATED
CASH FLOW STATEMENT
For the three months ended 30th June 2019 2018
A. Profit before working capital changes
Profit before tax 25,923 64,517
Adjustments for:
Share of results of equity-accounted investees (600) (485)
Interest Income (8,754) (7,568)
Dividend income - FVCOI Financial Assets (4,426) (8,852)
Finance Expenses 32,064 24,427
Depreciation of property, plant and equipment 5,270 5,753
Amortisation of intangible assets 355 -
Amortisation of right- of - use assets. 273 -
Amortisation of lease rentals paid in advance - 273
(Profit)/ Loss on Sale of Property, Plan & Equipment (207) (2)
Share base payment expenses 4,093 5,144
Gratuity provision and related costs 1,974 2,465
Other long term employee benefits 931 -
56,896 85,672
Note : All values are in Rupees '000s, unless otherwise stated.
Figures in brackets indicate deductions.
The above figures are subject to audit.
5
John Keells PLC
6
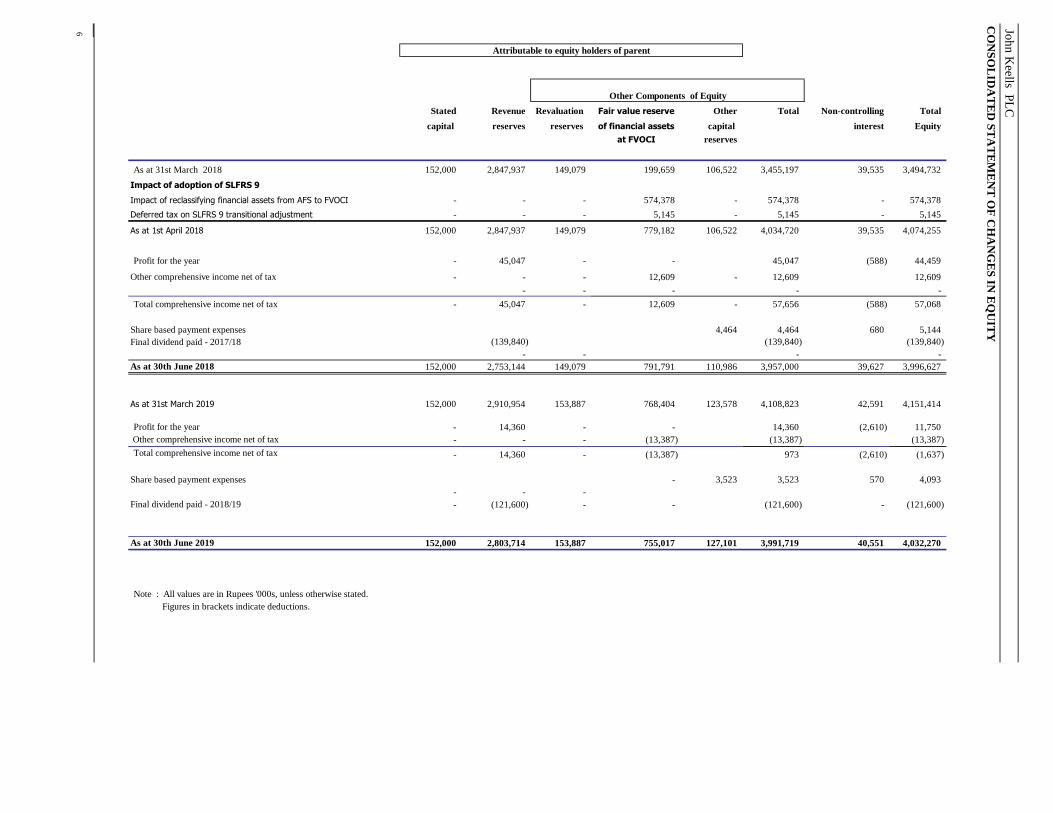
Stated Revenue Revaluation Fair value reserve Other Total Non-controlling Total
capital reserves reserves of financial assets capital interest Equity
at FVOCI reserves
As at 31st March 2018 152,000 2,847,937 149,079 199,659 106,522 3,455,197 39,535 3,494,732
Impact of adoption of SLFRS 9
Impact of reclassifying financial assets from AFS to FVOCI - - - 574,378 - 574,378 - 574,378
Deferred tax on SLFRS 9 transitional adjustment - - - 5,145 - 5,145 - 5,145
As at 1st April 2018 152,000 2,847,937 149,079 779,182 106,522 4,034,720 39,535 4,074,255
Profit for the year - 45,047 - - 45,047 (588) 44,459
Other comprehensive income net of tax - - - 12,609 - 12,609 12,609
- - - - -
Total comprehensive income net of tax - 45,047 - 12,609 - 57,656 (588) 57,068
Exercise of share option
- - - - - -
Share based payment expenses 4,464 4,464 680 5,144
Final dividend paid - 2017/18 (139,840) (139,840) (139,840)
- - - -
As at 30th June 2018 152,000 2,753,144 149,079 791,791 110,986 3,957,000 39,627 3,996,627
As at 31st March 2019 152,000 2,910,954 153,887 768,404 123,578 4,108,823 42,591 4,151,414
Profit for the year - 14,360 - - 14,360 (2,610) 11,750
Other comprehensive income net of tax - - - (13,387) (13,387) (13,387) Deferred tax on other comprehensive income - - - - -
Total comprehensive income net of tax - 14,360 - (13,387) 973 (2,610) (1,637)
Share based payment expenses - 3,523 3,523 570 4,093
- - -
Final dividend paid - 2018/19 - (121,600) - - (121,600) - (121,600)
Subsidiary dividend to non-controlling interest
- - - - -
As at 30th June 2019 152,000 2,803,714 153,887 755,017 127,101 3,991,719 40,551 4,032,270
Note : All values are in Rupees '000s, unless otherwise stated.
Figures in brackets indicate deductions.
Joh
n K
eells PL
C
CO
NS
OL
IDA
TE
D S
TA
TE
ME
NT
OF
CH
AN
GE
S IN
EQ
UIT
YAttributable to equity holders of parent
Other Components of Equity
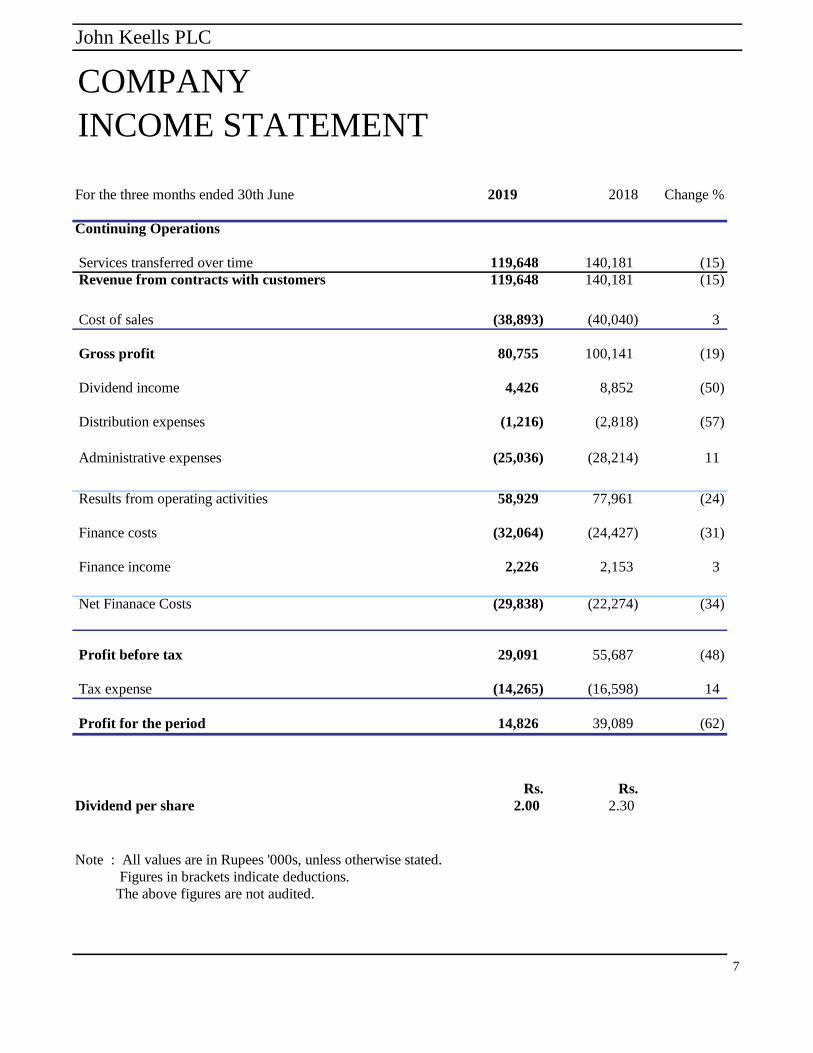
COMPANY
INCOME STATEMENT
For the three months ended 30th June 2019 2018 Change %
Continuing Operations
Services transferred over time 119,648 140,181 (15)
Revenue from contracts with customers 119,648 140,181 (15)
Cost of sales (38,893) (40,040) 3
Gross profit 80,755 100,141 (19)
Dividend income 4,426 8,852 (50)
Distribution expenses (1,216) (2,818) (57)
Administrative expenses (25,036) (28,214) 11
Results from operating activities 58,929 77,961 (24)
Finance costs (32,064) (24,427) (31)
Finance income 2,226 2,153 3
Net Finanace Costs (29,838) (22,274) (34)
Profit before tax 29,091 55,687 (48)
Tax expense (14,265) (16,598) 14
Profit for the period 14,826 39,089 (62)
Rs. Rs.
Dividend per share 2.00 2.30
Note : All values are in Rupees '000s, unless otherwise stated.
Figures in brackets indicate deductions.
The above figures are not audited.
7
John Keells PLC
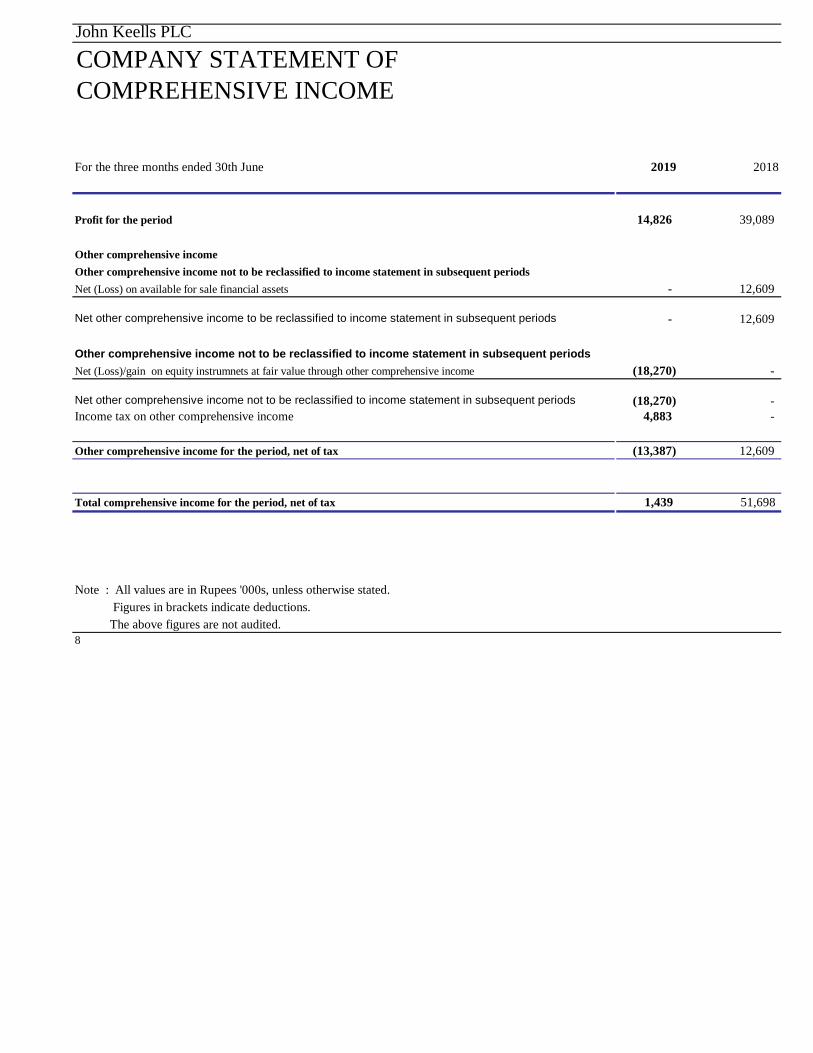
COMPANY STATEMENT OF
COMPREHENSIVE INCOME
For the three months ended 30th June 2019 2018
Profit for the period 14,826 39,089
Other comprehensive income
Other comprehensive income not to be reclassified to income statement in subsequent periods
Net (Loss) on available for sale financial assets - 12,609
Net other comprehensive income to be reclassified to income statement in subsequent periods - 12,609
Other comprehensive income not to be reclassified to income statement in subsequent periods
Net (Loss)/gain on equity instrumnets at fair value through other comprehensive income (18,270) -
Net other comprehensive income not to be reclassified to income statement in subsequent periods (18,270) -
Income tax on other comprehensive income 4,883 -
Other comprehensive income for the period, net of tax (13,387) 12,609
Total comprehensive income for the period, net of tax 1,439 51,698
Note : All values are in Rupees '000s, unless otherwise stated.
Figures in brackets indicate deductions.
The above figures are not audited.
8
John Keells PLC

John Keells PLC
COMPANY
STATEMENT OF FINANCIAL POSITION
As at 30th June 2019 2018
As at
31.03.2019
ASSETS
Non-current assets
Property, plant and equipment 15,770 20,770 16,905
Investment property 363,600 288,100 363,600
Intangible Assets 3,708 - 4,063
Investment In Subsidiaries 158,570 158,570 158,570
Investments in associates 24,000 24,000 24,000
Non-current financial assets 2,998,723 2,914,664 3,028,288
Other non-current assets 3,024 7,564 3,237
Deferred tax assets 6,806 8,655 6,249
3,574,201 3,422,324 3,604,912
Current assets
Inventories 1,121 571 778
Trade and Other Receivables 1,495,182 1,817,918 1,577,813
Amounts due from related parties 3,675 2,978 5,378
Other current assets 2,528 1,005 2,896
Cash in hand and at bank 209,025 141,606 178,349
1,711,531 1,964,078 1,765,214 Total assets 5,285,732 5,386,402 5,370,126
EQUITY AND LIABILITIES
Stated capital 152,000 152,000 152,000
Revenue reserves 2,650,700 2,596,623 2,757,474
Other components of equity 832,975 861,808 844,885
Total equity 3,635,675 3,610,431 3,754,359
Non-current liabilities
Employee benefit liabilities 41,940 38,525 40,205
41,940 38,525 40,205
Current liabilities
Trade and other payables 418,565 472,964 427,412
Amounts due to related parties 11,154 7,480 8,634
Income Tax Payable 13,215 53,617 3,924
Other current liabilities 176 14,454 486
Bank overdrafts 1,165,007 1,188,930 1,135,106
1,608,117 1,737,446 1,575,562
Total equity and liabilities 5,285,732 5,386,402 5,370,126
Rs. Rs. Rs.
Net assets per share 59.80 59.38 61.75
Note : All values are in Rupees '000s, unless otherwise stated.
I certify that the financial statements comply with the requirements of the Companies Act No.7 of 2007.
K D Weerasinghe
Chief Financial Officer
The Board of Directors is responsible for these financial statements.
K.N.J.Balendra J.G.A.Cooray
Chairman Director
26th July , 2019
9
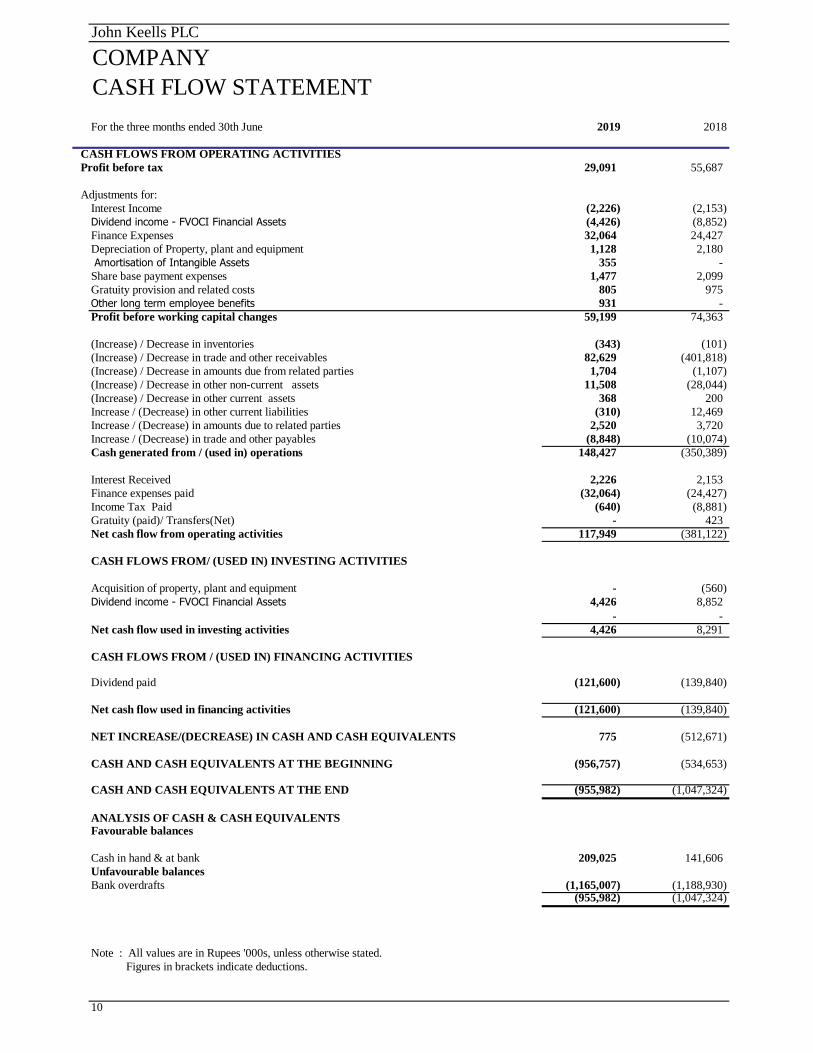
For the three months ended 30th June 2019 2018
CASH FLOWS FROM OPERATING ACTIVITIES
Profit before tax 29,091 55,687
Adjustments for:
Interest Income (2,226) (2,153)
Dividend income - FVOCI Financial Assets (4,426) (8,852)
Finance Expenses 32,064 24,427
Depreciation of Property, plant and equipment 1,128 2,180
Amortisation of Intangible Assets 355 -
Share base payment expenses 1,477 2,099
Gratuity provision and related costs 805 975
Other long term employee benefits 931 -
Profit before working capital changes 59,199 74,363
(Increase) / Decrease in inventories (343) (101)
(Increase) / Decrease in trade and other receivables 82,629 (401,818)
(Increase) / Decrease in amounts due from related parties 1,704 (1,107)
(Increase) / Decrease in other non-current assets 11,508 (28,044)
(Increase) / Decrease in other current assets 368 200
Increase / (Decrease) in other current liabilities (310) 12,469
Increase / (Decrease) in amounts due to related parties 2,520 3,720
Increase / (Decrease) in trade and other payables (8,848) (10,074)
Cash generated from / (used in) operations 148,427 (350,389)
Interest Received 2,226 2,153
Finance expenses paid (32,064) (24,427)
Income Tax Paid (640) (8,881)
Gratuity (paid)/ Transfers(Net) - 423
Net cash flow from operating activities 117,949 (381,122)
CASH FLOWS FROM/ (USED IN) INVESTING ACTIVITIES
Acquisition of property, plant and equipment - (560)
Dividend income - FVOCI Financial Assets 4,426 8,852
- -
Net cash flow used in investing activities 4,426 8,291
CASH FLOWS FROM / (USED IN) FINANCING ACTIVITIES
Dividend paid (121,600) (139,840)
Net cash flow used in financing activities (121,600) (139,840)
NET INCREASE/(DECREASE) IN CASH AND CASH EQUIVALENTS 775 (512,671)
CASH AND CASH EQUIVALENTS AT THE BEGINNING (956,757) (534,653)
CASH AND CASH EQUIVALENTS AT THE END (955,982) (1,047,324)
ANALYSIS OF CASH & CASH EQUIVALENTSFavourable balances
Cash in hand & at bank 209,025 141,606
Unfavourable balances
Bank overdrafts (1,165,007) (1,188,930) (955,982) (1,047,324)
Note : All values are in Rupees '000s, unless otherwise stated.
Figures in brackets indicate deductions.
The above figures are subject to audit.
10
John Keells PLC
COMPANY
CASH FLOW STATEMENT
11
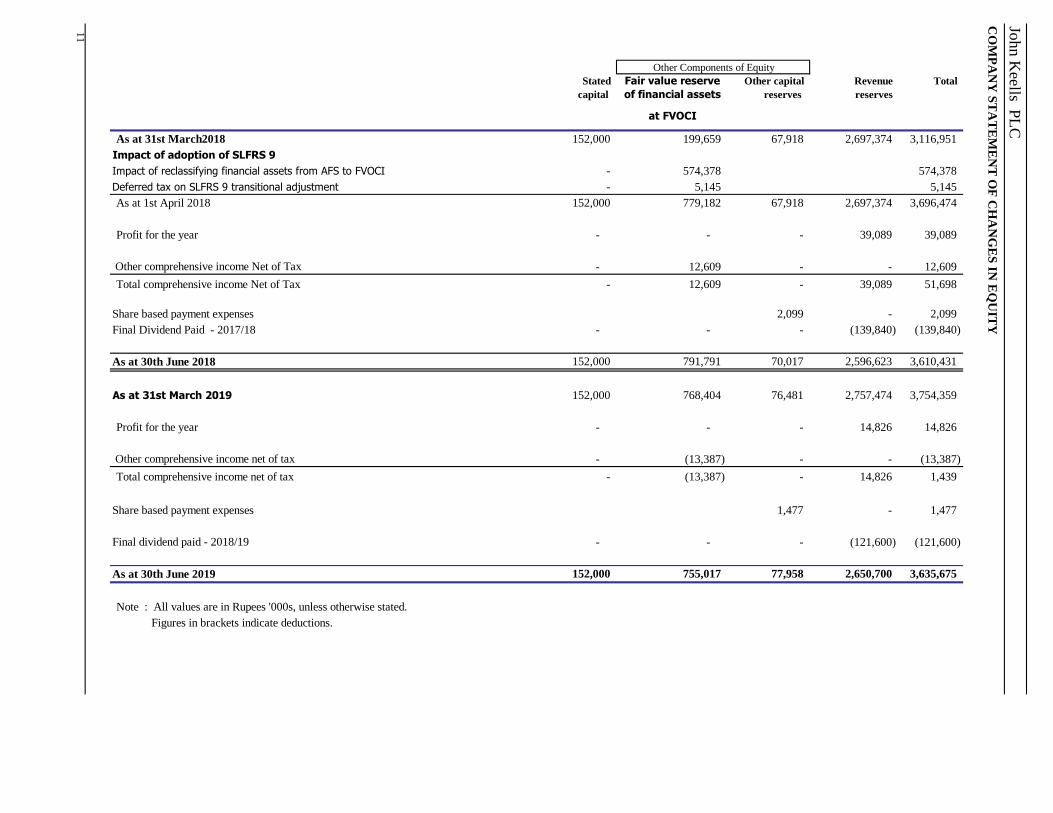
Stated Fair value reserve Other capital Revenue Total
capital of financial assets reserves reserves
at FVOCI
As at 31st March2018 152,000 199,659 67,918 2,697,374 3,116,951
Impact of adoption of SLFRS 9
Impact of reclassifying financial assets from AFS to FVOCI - 574,378 574,378
Deferred tax on SLFRS 9 transitional adjustment - 5,145 5,145
As at 1st April 2018 152,000 779,182 67,918 2,697,374 3,696,474
Profit for the year - - - 39,089 39,089
Other comprehensive income Net of Tax - 12,609 - - 12,609
Total comprehensive income Net of Tax - 12,609 - 39,089 51,698
Share based payment expenses 2,099 - 2,099
Final Dividend Paid - 2017/18 - - - (139,840) (139,840)
As at 30th June 2018 152,000 791,791 70,017 2,596,623 3,610,431
As at 31st March 2019 152,000 768,404 76,481 2,757,474 3,754,359
Profit for the year - - - 14,826 14,826
Other comprehensive income net of tax - (13,387) - - (13,387)
Total comprehensive income net of tax - (13,387) - 14,826 1,439
Share based payment expenses 1,477 - 1,477
Final dividend paid - 2018/19 - - - (121,600) (121,600)
As at 30th June 2019 152,000 755,017 77,958 2,650,700 3,635,675
Note : All values are in Rupees '000s, unless otherwise stated.
Figures in brackets indicate deductions.
CO
MP
AN
Y S
TA
TE
ME
NT
OF
CH
AN
GE
S IN
EQ
UIT
Y
John K
eells PL
C
Other Components of Equity
12
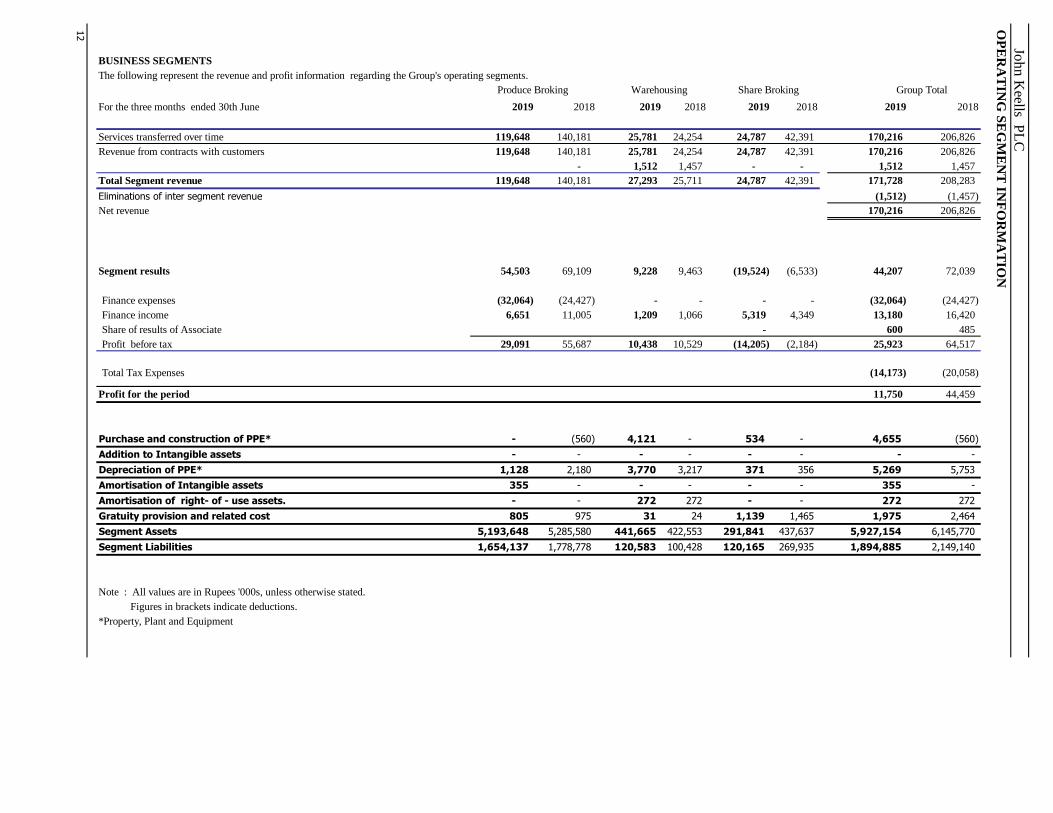
BUSINESS SEGMENTS
The following represent the revenue and profit information regarding the Group's operating segments.
For the three months ended 30th June 2019 2018 2019 2018 2019 2018 2019 2018
Services transferred over time 119,648 140,181 25,781 24,254 24,787 42,391 170,216 206,826
Revenue from contracts with customers 119,648 140,181 25,781 24,254 24,787 42,391 170,216 206,826
- 1,512 1,457 - - 1,512 1,457
Total Segment revenue 119,648 140,181 27,293 25,711 24,787 42,391 171,728 208,283
Eliminations of inter segment revenue (1,512) (1,457)
Net revenue 170,216 206,826
Segment results 54,503 69,109 9,228 9,463 (19,524) (6,533) 44,207 72,039
Finance expenses (32,064) (24,427) - - - - (32,064) (24,427)
Finance income 6,651 11,005 1,209 1,066 5,319 4,349 13,180 16,420
Share of results of Associate - 600 485
Profit before tax 29,091 55,687 10,438 10,529 (14,205) (2,184) 25,923 64,517
Total Tax Expenses (14,173) (20,058)
Profit for the period 11,750 44,459
Purchase and construction of PPE* - (560) 4,121 - 534 - 4,655 (560)
Addition to Intangible assets - - - - - - - -
Depreciation of PPE* 1,128 2,180 3,770 3,217 371 356 5,269 5,753
Amortisation of Intangible assets 355 - - - - - 355 -
Amortisation of right- of - use assets. - - 272 272 - - 272 272
Gratuity provision and related cost 805 975 31 24 1,139 1,465 1,975 2,464
Segment Assets 5,193,648 5,285,580 441,665 422,553 291,841 437,637 5,927,154 6,145,770
Segment Liabilities 1,654,137 1,778,778 120,583 100,428 120,165 269,935 1,894,885 2,149,140
Note : All values are in Rupees '000s, unless otherwise stated.
Figures in brackets indicate deductions.
*Property, Plant and Equipment
Joh
n K
eells PL
C
OP
ER
AT
ING
SE
GM
EN
T IN
FO
RM
AT
ION
Group TotalProduce Broking Warehousing Share Broking

John Keells PLC
NOTES TO THE INTERIM CONDENSED FINANCIAL STATEMENTS
1 CORPORATE INFORMATION
John Keells PLC, is a public limited company incorporated and domiciled in Sri Lanka and listed on the Colombo Stock Exchange.
2 INTERIM CONDENSED FINANCIAL STATEMENTS
3 APPROVAL OF FINANCIAL STATEMENTS
4 BASIS OF PREPARATION AND CHANGES TO THE GROUP'S ACCOUNTING POLICIES
4.1 BASIS OF PREPARATION
4.2 FAIR VALUE MEASUREMENT AND RELATED FAIR VALUE DISCLOSURES
4.3 NEW STANDARDS , INTERPRETATIONS AND AMENDMENTS ADOPTED BY THE GROUP
The effect of adoption of SLFRS 16 as at 1 April 2019 (increase/(decrease) is as follows:
Group
Assets Rs 000's
Property, plant and equipment 350,452
Right of use assets 35,574
Lease rentals paid in advance (35,574)
Total assets 5,927,153
b) Summary of new accounting policies
Right of use assets
b) Summary of new accounting policies (Continued)
Amounts recognised in the statement of financial position and profit or loss
Land and buildings Total
As at 1 April 2019 35,846 35,846
Amortisation expense (272) (272)
As at 30 June 2019 35,574 35,574
13
Set out below are the new accounting policies of the Company upon adoption of SLFRS 16, which have been applied from the date of initial application:
Fair valuation was done as of 30 June 2019 for all unquoted equity shares classified as Level 3 within the fair value hierarchy according to fair valuation
methodology. Fair value would not significantly vary if one or more of the inputs were changed.
The financial statements for the period ended 30th June 2019, includes “the Company” referring to John Keells PLC. as the holding company and “the
Group” referring to the companies whose accounts have been consolidated therein.
The interim condensed financial statements of the Group and the Company for the three months ended 30th June 2019 were authorised for issue by the Board
of Directors on 26th July 2019.
The interim condensed financial statements have been prepared in accordance with Sri Lanka Accounting Standard (SLAS) LKAS 34 - Interim Financial
Reporting. These interim condensed financial statements should be read in conjunction with the annual financial statements for the year ended 31 March
2019.
The presentation and classification of the financial statements of the previous year have been amended, where relevent, for better presentation and to be
comparable with those of the current year.
The interim condensed financial statements are presented in Sri Lankan Rupees and all values are rounded to the nearest thousand except when otherwise
indicated.
The fair values of all the financial assets and financial liabilities recognised during the period were not materially different from the transaction prices at the
date of initial recognition. There were no transfers between Level 1 and Level 2 and no transfers into or out of Level 3 categories as per the fair value
hierarchy, during the period. The fair value changes on financial instruments in Level 3 category was properly recorded in the statement of other
comprehensive income and there were no purchases and/or disposals during the period.
The accounting policies adopted in the preparation of the interim condensed consolidated financial statements are consistent with those followed in the
preparation of the Group’s annual consolidated financial statements for the year ended 31 March 2019, except for the adoption of new standards effective as
of 1 April 2019. The Group has not early adopted any other standard, interpretation or amendment that has been issued but is not yet effective.
Right of use assets
The Company has performed a detailed impact assessment of SLFRS 16 as at the reporting date.
Set out below, are the carrying amounts of the Company's right of use assets and the movements for the period ended 30 June
2019.
The company does not have a significant impact on it's statement of financial position or equity on applying the classification and mesurement requirments
of SLFRS 16 since the company does not have a lease liability as at 30th June 2019.
The Company recognises right of use assets when the underlying asset is available for use. Right of use assets are measured at cost, less any accumulated
depreciation and impairment losses, and adjusted for any remeasurement of lease liabilities. The cost of right of use assets includes the amount of lease
liabilities recognised, initial direct costs incurred, and lease payments made at or before the commencement date less any lease incentives received. Unless
the Company is reasonably certain to obtain ownership of the leased asset at the end of the lease term, the recognised right of use assets are depreciated
on a straight-line basis over the shorter of its estimated useful life or the lease term. Right of use assets are subject to impairment.
Lessor accounting under SLFRS 16 is substantially unchanged under LKAS 17. Lessors will continue to classify leases as either operating or finance leases
using similar principles as in LKAS 17. Therefore, SLFRS 16 do not have an impact for leases where the Group is the lessor.
SLFRS 16 supersedes LKAS 17 Leases, IFRIC 4 Determining whether an Arrangement contains a Lease, SIC-15 Operating Leases-Incentives and SIC-27
Evaluating the Substance of Transactions Involving the Legal Form of a Lease. The standard sets out the principles for the recognition, measurement,
presentation and disclosure of leases and requires lessees to account for all leases under a single on-balance sheet model. The Company has adopted SLFRS
16 using modified retrospective method from 1 April 2019, without restating comparatives for the 2018/19 reporting period, as permitted under the specific
transitional provisions in the standard.
a) Nature of the effect of adoption of SLFRS 16
John Keells PLC
NOTES TO THE INTERIM CONDENSED FINANCIAL STATEMENTS
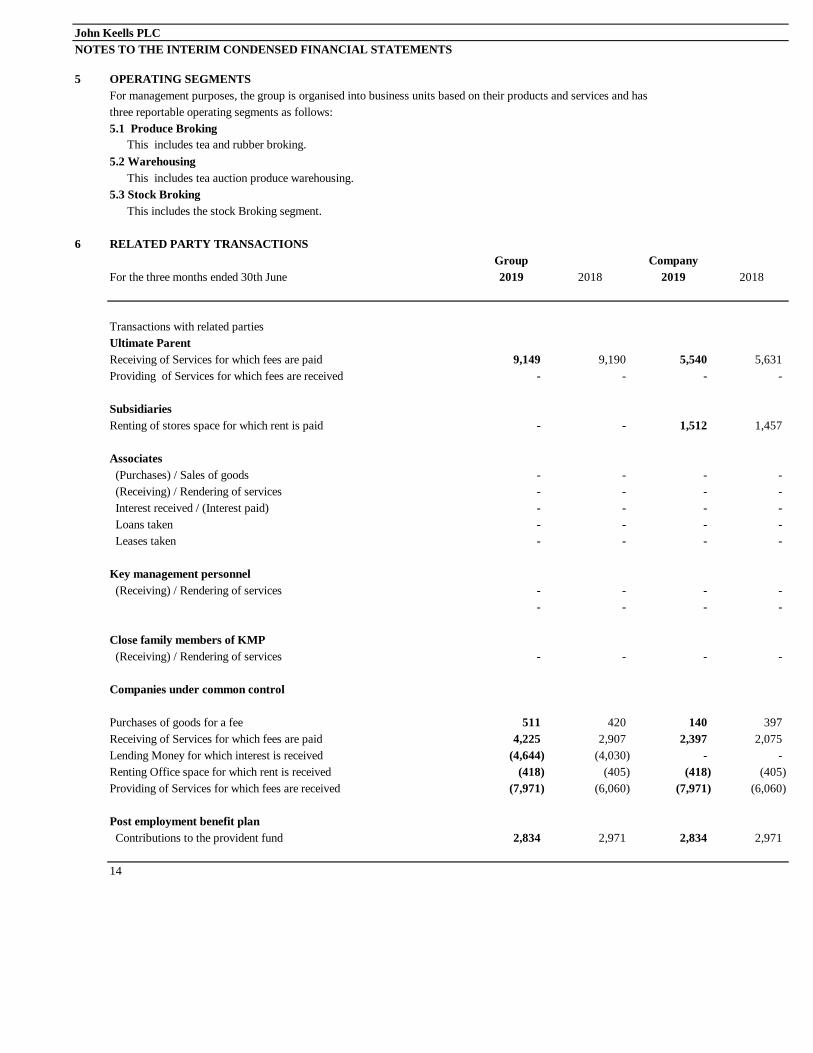
5 OPERATING SEGMENTS
For management purposes, the group is organised into business units based on their products and services and has
three reportable operating segments as follows:
5.1 Produce Broking
This includes tea and rubber broking.
5.2 Warehousing
This includes tea auction produce warehousing.
5.3 Stock Broking
This includes the stock Broking segment.
6 RELATED PARTY TRANSACTIONS
Group Company
For the three months ended 30th June 2019 2018 2019 2018
Transactions with related parties
Ultimate Parent
Receiving of Services for which fees are paid 9,149 9,190 5,540 5,631
Providing of Services for which fees are received - - - -
Subsidiaries
Renting of stores space for which rent is paid - - 1,512 1,457
Associates
(Purchases) / Sales of goods - - - -
(Receiving) / Rendering of services - - - -
Interest received / (Interest paid) - - - -
Loans taken - - - -
Leases taken - - - -
Key management personnel
(Receiving) / Rendering of services - - - -
- - - -
Close family members of KMP
(Receiving) / Rendering of services - - - -
Companies under common control
Purchases of goods for a fee 511 420 140 397
Receiving of Services for which fees are paid 4,225 2,907 2,397 2,075
Lending Money for which interest is received (4,644) (4,030) - -
Renting Office space for which rent is received (418) (405) (418) (405)
Providing of Services for which fees are received (7,971) (6,060) (7,971) (6,060)
Post employment benefit plan
Contributions to the provident fund 2,834 2,971 2,834 2,971
14
NOTES TO THE INTERIM CONDENSED FINANCIAL STATEMENTS
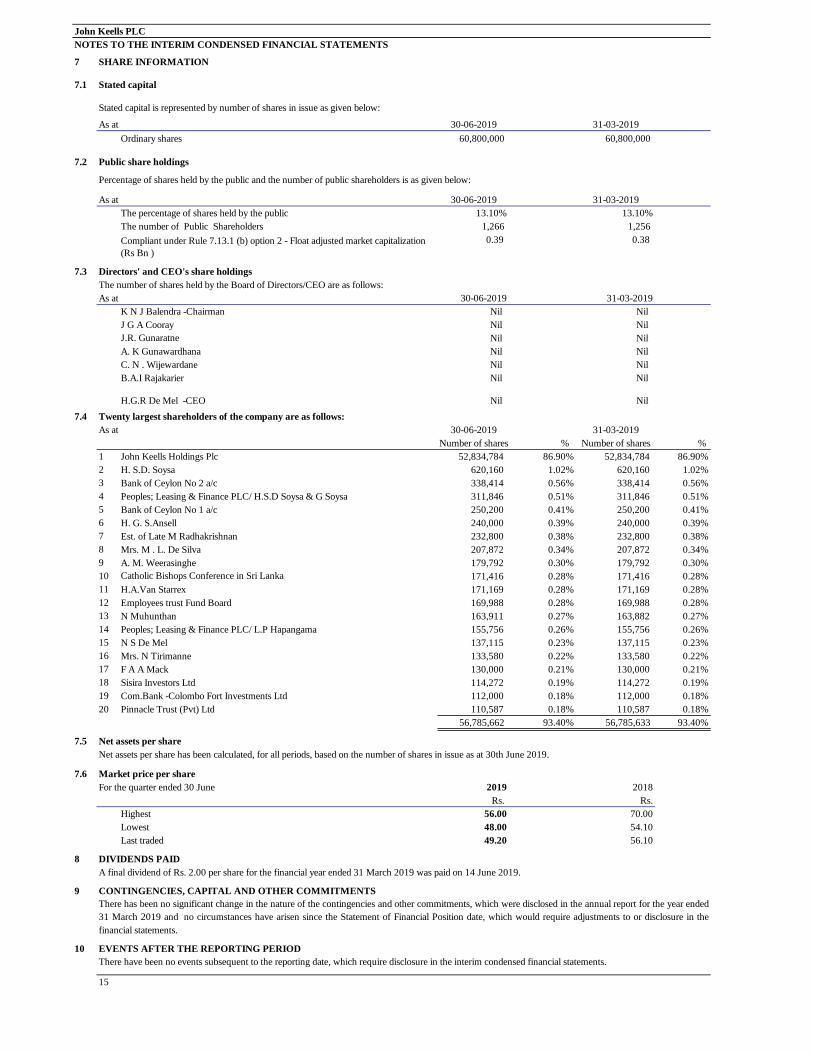
7 SHARE INFORMATION
7.1 Stated capital
Stated capital is represented by number of shares in issue as given below:
As at 30-06-2019 31-03-2019
Ordinary shares 60,800,000 60,800,000
7.2 Public share holdings
Percentage of shares held by the public and the number of public shareholders is as given below:
As at 30-06-2019 31-03-2019
The percentage of shares held by the public 13.10% 13.10%
The number of Public Shareholders 1,266 1,256
0.39 0.38
7.3 Directors' and CEO's share holdings
The number of shares held by the Board of Directors/CEO are as follows:
As at 30-06-2019 31-03-2019
K N J Balendra -Chairman Nil Nil
J G A Cooray Nil Nil
J.R. Gunaratne Nil Nil
A. K Gunawardhana Nil Nil
C. N . Wijewardane Nil Nil
B.A.I Rajakarier Nil Nil
H.G.R De Mel -CEO Nil Nil
7.4 Twenty largest shareholders of the company are as follows:
As at 30-06-2019 31-03-2019
Number of shares % Number of shares %
1 John Keells Holdings Plc 52,834,784 86.90% 52,834,784 86.90%
2 H. S.D. Soysa 620,160 1.02% 620,160 1.02%
3 Bank of Ceylon No 2 a/c 338,414 0.56% 338,414 0.56%
4 Peoples; Leasing & Finance PLC/ H.S.D Soysa & G Soysa 311,846 0.51% 311,846 0.51%
5 Bank of Ceylon No 1 a/c 250,200 0.41% 250,200 0.41%
6 H. G. S.Ansell 240,000 0.39% 240,000 0.39%
7 Est. of Late M Radhakrishnan 232,800 0.38% 232,800 0.38%
8 Mrs. M . L. De Silva 207,872 0.34% 207,872 0.34%
9 A. M. Weerasinghe 179,792 0.30% 179,792 0.30%
10 Catholic Bishops Conference in Sri Lanka 171,416 0.28% 171,416 0.28%
11 H.A.Van Starrex 171,169 0.28% 171,169 0.28%
12 Employees trust Fund Board 169,988 0.28% 169,988 0.28%
13 N Muhunthan 163,911 0.27% 163,882 0.27%
14 Peoples; Leasing & Finance PLC/ L.P Hapangama 155,756 0.26% 155,756 0.26%
15 N S De Mel 137,115 0.23% 137,115 0.23%
16 Mrs. N Tirimanne 133,580 0.22% 133,580 0.22%
17 F A A Mack 130,000 0.21% 130,000 0.21%
18 Sisira Investors Ltd 114,272 0.19% 114,272 0.19%
19 Com.Bank -Colombo Fort Investments Ltd 112,000 0.18% 112,000 0.18%
20 Pinnacle Trust (Pvt) Ltd 110,587 0.18% 110,587 0.18%
56,785,662 93.40% 56,785,633 93.40%
7.5 Net assets per share
Net assets per share has been calculated, for all periods, based on the number of shares in issue as at 30th June 2019.
7.6 Market price per share
For the quarter ended 30 June 2019 2018
Rs. Rs.
Highest 56.00 70.00
Lowest 48.00 54.10
Last traded 49.20 56.10
8 DIVIDENDS PAID
A final dividend of Rs. 2.00 per share for the financial year ended 31 March 2019 was paid on 14 June 2019.
9 CONTINGENCIES, CAPITAL AND OTHER COMMITMENTS
10 EVENTS AFTER THE REPORTING PERIOD
There have been no events subsequent to the reporting date, which require disclosure in the interim condensed financial statements.
15
John Keells PLC
There has been no significant change in the nature of the contingencies and other commitments, which were disclosed in the annual report for the year ended
31 March 2019 and no circumstances have arisen since the Statement of Financial Position date, which would require adjustments to or disclosure in the
financial statements.
Compliant under Rule 7.13.1 (b) option 2 - Float adjusted market capitalization
(Rs Bn )

CORPORATE INFORMATION
Name of Company Related Party Transaction Review
John Keells PLC Committee
M P Perera - Chairperson
Legal Form K N J Balendra
Public Limited Liability Company D A Cabraal
Incorporated in Sri Lanka in 1960 A N Fonseka
Ordinary Shares listed on the Colombo Stock
Exchange Registered Office of the Company
117 Sir Chittampalam A. Gardiner Mawatha,
Company Registration No. Colombo 2, Sri Lanka
PQ 11 Telephone : +94 11 230 6000
Email : [email protected]
Directors
K N J Balendra -Chairman
J G A Cooray Secretaries
J R Gunaratne Keells Consultants (Private) Limited
B A I Rajakarier 117 Sir Chittampalam A. Gardiner Mawatha,
C N Wijewardane Colombo 2, Sri Lanka
A K Gunawardhana Telephone : +94 11 230 6245
Facsimile : +94 11 243 9037
Auditors
Ernst & Young Business Address
Chartered Accountants John Keells PLC
P.O. Box 101 186, Vauxhall Street,
Colombo, Sri Lanka Colombo 2, Sri Lanka
Audit Committee Bankers for the Company
B A I Rajakarier Bank of Ceylon
C N Wijewardane Commercial Bank of Ceylon
A K Gunawardhana Deutsche Bank A.G.
DFCC Bank
Human Resources and Compensation Hatton National Bank
Committee Hongkong and Shanghai Banking Corporation
D A Cabraal - Chairman Nations Trust Bank
M A Omar NDB Bank
S S H Wijayasuriya People’s Bank
Sampath Bank
Nominations Committee Seylan Bank
M A Omar - Chairman Standard Chartered Bank
K N J Balendra
M P Perera
S S H Wijayasuriya
R Coomaraswamy

John Keells PLC
No. 117, Sir Chittampalam A. Gardiner Mawatha,
Colombo 2, Sri Lanka.
Tel: 0094 11 230 6000