tess agro plc - cse
TRANSCRIPT

Annual Report 2015 - 2016TESS AGRO PLC
Annual Report
Our Vision
Our Mission
To achieve the country's best practice in the efficient and effective provision of
service to Sri Lanka's Agricultural and Fisheries Sector.
To perform as a vital link to our rural economy and exploit state of the art
technology to ensure consistency and quality of products & services.

Annual ReportContents
Page
Corporate information 01
Notice of the Meeting 03
Chairperson’s Report 04
Board of Directors 05
Corporate Governance 06
Statements of Compliance 09
Directors' Report 11
Directors' Responsibility for Financial Reporting 13
Audit Committee Report 14
Independent Auditors' Report 15
Statement of Comprehensive Income 16
Statement of Financial Position 18
Statement of Cash Flow 19
Statement of Changes in Equity 20
Accounting Policies 21
Notes to the Accounts 32
Financial Review 54
Investor Information 58
Proxy Form 63

Annual Report
NAME OF COMPANY : TESS AGRO PLC
REGISTERED OFFICE : 87, New Nuge Road, Kelaniya.
TELEPHONE NO : 2910859
FAX NO. : 2910615
E.MAIL ADDRESS : [email protected]
WEB ADDRESS : www.tess.lk
thDATE, PLACE AND THE AUTHORITY : 20 May 1992, Colombo
OF INCORPORATION Companies Act. No. 07 of
2007 PB 689 PQ
BOARD OF DIRECTORS : Mrs. S.F. Fernando Prof. Arthur H.De O. Bamunuarachchi
Mr. Shiran Fernando
Mr. Roshan Fernando
Mr. Dilshan Fernando
Mr. A.R. Peiris
SECRETARIES TO THE COMPANY : United Corporate Consultants & Secretaries (Pvt) Limited 211, T.B. Jaya Mawatha,
Colombo 10.
AUDITORS : Sarma & Co., Chartered Accountants
60 2/2, Pradeepa Mawatha, Colombo 10.
1
Corporate Information
Annual Report
LAWYERS : F J & G De Saram
Corporate Law Office
210 De Saram Road
Colombo 10.
BANKERS TO THE COMPANY : Commercial Bank of Ceylon PLC
City Office
98, York Street
Colombo 01.
National Development Bank PLC
103 A, Dharmapala Mawatha,
Colombo 07.
Seylan Bank PLC
Fort Branch, Colombo 01.
Hatton National Bank PLC No. 479, T.B. Jaya Mawatha, P.O.Box 837. Colombo 10.
2
Corporate Information
Annual Report
Notice of Meeting
3
rd Notice is hereby given that the Twenty Third (23 ) Annual General Meeting of Tess Agro
PLC will be held at the Sri Lanka Foundation Institute, 100, Sri Lanka Padanam Mawatha, th
Independence Square Colombo 7, on Tuesday 11 October 2016 at 10.30 AM for the ,
following purposes.
Agenda:
1. To receive and consider the Annual Report of the Board of Director on the affairs of st
the Company and the Statements of Accounts for the year ended 31 March 2016
and the Report of the Auditors thereon.
2. To Re-elect Mrs. S.F. Fernando who is over 70 years of age as a Director, by passing the following resolution.
“The age limit stipulated in section 210 of the Companies Act no 07 of 2007 shall not apply to Mrs. S.F Fernando who has attained 74 years and that she be re-elected a Director of the company”
3. To reappoint M/S Sarma & Co, Chartered Accountant as auditors and authorize the
Directors to determine their remuneration.
4. To authorize the Directors to Determine payments for the year 2016/2017 for
charitable and other purposes as set out in the Companies Donations Act (Cap 147).
Note:
1. A member is entitled to appoint a proxy to attend and vote in his/her place.
2. A Proxy need not be a member of the Company.
3. A member wishing to vote by proxy at the meeting may use the proxy form
enclosed.
4. To be valid, the completed proxy form must be lodged at the registered office of
the Company not less than 48 hours before the time fixed for the meeting.
By Order of the Board of Directors
TESS AGRO PLC
United Corporate Consultants & Secretaries (Pvt) Limited,
Secretaries
Colombo st
31 August 2016
Annual ReportChairperson's Report
4
On behalf of the Board of Directors, I take pleasure rdin inviting you to the 23 Annual General Meeting
of your Company, and wish to present the annual
report and audited accounts of Tess Agro PLC for stthe year ended 31 March 2016.
The year under review was the second year running
when the company had to face its biggest
challenge, as the European Union, which was Sri
Lanka's most lucrative market decided to ban Sri
Lankan fish being imported into the EU.
Prior to the ban imposed in January 2015, the EU
accounted for nearly one-third of Sri Lanka's fish
exports in terms of volume and about 40 per cent of
the exports in terms of revenue.
The European Union (EU) has now completely
lifted the ban on fisheries exports from Sri Lanka,
from the beginning of July 2016.
Operations
During the year under review the company
continued to carry out its business with the help
of its Belgium branch by importing from other
neighbouring countries such as Maldives,
Philippines and Vietnam. When Sri Lanka is
back in business we would still hold on to our
market share.
Financial Performance
The company recorded a turnover of Rs. 377
million opposed to Rs. 444 million, the Gross
Profit grew from 10.8 million to 45 Million
which is drastic improvement in gross margins
despite the lower turnover. However due to bad
debts written off which resulted from the EU
ban and the drastic depreciation of the Rupee
from Rs 110 to Rs 145 resulting in exchange loss
on the foreign currency loans obtained by the
company resulted, in a loss of Rs 56.4 million.
Future Outlook
With the re-opening of the European markets,
and the new political climate in the country, the
possibility of obtaining GSP plus where all
marine products will receive duty free status,
will be a huge boost to the exports of the
company in the future. The company is
continuously striving to rebuild its lost market
despite the odds.
Charity & Donations
During the year under review The Company
spent Rs. 582,638/- on the Hope Children's
Home an approved Children's Home under the
National Child Protection and Child Probation
Services which was founded by our former
Chairman Late Mr. Oliver Fernando.
Appreciation
In conclusion I wish to express my sincere
gratitude and appreciation to the members of the
board, our staff and to the shareholders for their
loyalty and confidence placed in us.
S. Faika Fernando (Mrs.)Chairperson
st31 August 2016
Annual Report
5
Board of Directors
Mrs. S. F. Fernando
Mrs. Sithy Faika Fernando is Non-Executive chairperson of the company.
She also a Director of the Tess (Pvt) Ltd, Tropic Fishery (Pvt) Ltd and Tropic Frozen Foods (Pvt) Ltd.
Mr. S. Fernando
Mr.Shiran Fernando Director – Operations of the company who is having 26 years' experience in management and in the tea trade, and export marketing of agricultural produce.
He is also the CEO of Tess (Pvt) Ltd and Director of Tropic Fishery (Pvt) Ltd and Tropic Frozen Foods (Pvt) Ltd.
Prof. A. Bamunuarachchi
Prof. Arthur Bamunuarachchi Consultant to the Asian Development Bank. and the former head of Applied chemistry-at the University of Sri Jayewardenepura.
He holds a Masters degree in food science technology from the University of California Davis and a PHD form the University of New South Wales in Australia.
He is a Member of the Australian institute of food technologist, American institute of food technologist, American institute of Cereal chemists (Ex), Indian Association of food scientist and technologists (Ex), Pakistan Association of food scientist and technologists, Institute of Chemistry of Sri Lanka, Sri Lanka, Association of Fisheries and Agriculture,
Sri Lanka Association for the Advancement of Science, and a Fellow of the National Academy of Science, Sri Lanka.
Mr. D. Fernando. MBA, FCMI (UK)
Mr. Dilshan Fernando CEO of the company who is having 25 years' experience in engineering and management. Holds a Masters Degree in Business Administration and Fellow Member of the Chartered Management Institute of United Kingdom
He is also a Director of Tropic Fishery (Pvt) Ltd, Tropic Frozen Foods Ltd and Director of Tess (Pvt) Ltd as well as E-Global Services (Pvt) Ltd.
Mr. R. Fernando
Mr. Roshan Fernando who is having 25 years' experience in management specialized in fish processing and trained at the South Asian Fisheries Development Centre Singapore on standardization, processing, quality control and packaging of fishery products.
Currently serving as the President of the Seafood Exporters Association of Sri Lanka
He is the CEO of Tropic Fishery (Pvt) Ltd and Tropic Frozen Foods (Pvt) Ltd as well as Director of Tess (Pvt) Ltd.
Mr. A. R. Peiris. B.Sc. (Cey.), FCMA (UK) CGMA
Mr. Amaralal Peiris who is Independent Non-Executive Director on the Board.
He has served Petroleum Corporation for 10 years in Technical, Planning & Finance Divisions and at the time left the Corporation in 1979, was the head of the Refinery Finance Division.
Thereafter, he joined National Development Bank where he held several senior positions for 24 years. He has held Directorships in several reputed public listed and unlisted companies.
Mr. Peiris is an Executive Director of Lankem Ceylon PLC & holds Directorships in several companies within the Lankem Group.
Annual Report
Corporate Governance
6
Corporate Governance is understood as the system by which companies are directed, managed and controlled. The Board of Directors are responsible for the governance of the Company and maintaining a balance between the achievement of corporate objectives, the alignment of corporate behavior with the expectations of society and accountability to the share holders.
The Board of Directors are committed in
upholding the highest of standards integrity and
transparency in the governance company.of the
Shareholder Relations
The Annual General Meeting is the principal means of having a dia logue with the Shareholders. The Directors disclose and Shareholders are kept aware of any major transaction would have which a material implication to the Shareholders.
The Board of Directors
The Board meets frequently to review routine
activities and matters of significance. The board
reviews and directs the Company's performance
and strategies including of the maintenance
Companies internal controls and provides
leadership.
Reasonable steps are taken by the Directors to
safeguard the Company's assets all times. at
Proper internal controls in place detect are to
irregularities and prevent fraud.
Remuneration Policy
The Company believes that it should attract and
retain top proven business executives with
experience and appropriate qualifications.
Remuneration packages for senior executives are formulated with information obtained from other leading companies in the similar trade and from professional to surveys out by firms carried ensure that senior fairly the executives are well rewarded terms of in the of their contributions Company, their and qualifications experience and in line with industry standards.
Internal Control
The Board has the responsibility to design and
implement internal control systems and reviews
its effectiveness. Internal Controls are designed
to cover the risk arising errors omissions from
and mistakes, safeguarding the assets of the
company and to record and maintains proper
books, through proper procedures.
Going Concern
The the Board is of the reviewing opinion after
financial statements that of the Company, the
Company has to continue the adequate resources
business future.in the foreseeable
Audit Committee
The Audit Committee considers matters pertaining financial affairs. to the Company's Accounting and Internal Control policies and practices, all aspects of risk management, and legal Board has and financial compliance. The appointed an Audit Committee consisting of Two Non Directors.- Executive Independent
Mr. A.R. Peiris (Chairman) Prof. Bamunuarachchi A.H. De O.
The by fellow member of Committee is chaired a Chartered Institute of Accountants Management in this financial Committee held four year, the meetings during the year. The meetings are attended by Executive Director, Chief Financial Officer by invitation and and other Directors Executives it is required.when
Corporate Governance
7
Annual Report
Duties and Responsibilities
Audit
1. Recommend the Board of the appointment and removal of external auditors and review their terms of engagement.
2. Determine with the external auditors, the audit plan and scope and their authority and responsibilities.
3. Oversee and appraise the quality of audits conducted and monitor their effectiveness.
4. Review external audit reports and recommendations and ensure appropriate management response to recommendations.
5. Monitor the relationship between management and the external auditors.
6. Review and assess the independency of the external auditor.
Accounting
Monitor and review the adequacy of the Company's accounting system and internal control environment.
Review the annual and by annual Financial Statements of the Company, and make recommendations to the Board.
Determine Company - Specific accounting policies within the ambit of the Accounting Standards.
Review significant transactions which are not a normal part of the Company's business.
Risk Management
Identify and assess areas of risks which might impact on the Company and research appropriate mitigation.
Monitor, review and evaluates the adequacy and effectiveness of the Company's risk management controls, both internally and externally.
Evaluate the effectiveness of the Company's business continuity plans.
Evaluate the adequacy of the Company's insurance covers at least annually.
The Audit Committee recommended to the Board of Directors that M/S Sarma & Co., to re-
stappoint as the Auditors for the year ending 31 March 2017 subject to the approval of the shareholders at the next Annual General Meeting.
Remuneration Committee
The Remuneration Committee will be responsible for ensuring the company has and observes coherent remuneration policies and practices which enable it to attract and retain Executives, directors and employees who will create value for shareholders, generate sustained business performance and support Tess Agro PLCs objectives, goals and values.
The Tess Agro PLCs Remuneration Committee consists of Two Non-Executive Independent Directors as follows;
Mr. A.R. Peiris (Chairman) Prof. A.H.O. Bamunuarachchi
The by fellow member Committee is chaired a of Management Chartered Institute of Accountants in this financial year, the Committee held four during the year. meetings The meetings are by Executive attended Director, Chief Financial Officer by invitation and other Directors Executives it is and when required.
The core responsibilities of the Remuneration Committee is
1. To review and approve Remuneration policy of the Company.
2. To advice on structuring Remuneration packages that enable the Company to attract, retain and motivate high caliber individuals with the requisite skills.
3. To recommend to the Board of Directors the Remuneration to be paid to the Executive Directors, Non-Executive Directors, their pre-requisites and allowances.
Related Party Transaction Review Committee
As per Rule 9.2.3 of the Listing Rules of the Colombo Stock Exchange the Related Party Transactions Review Committee of Tess Agro
stPLC functions with effect from 1 March 2016.
The Tess Agro PLCs Related Party Transaction Review Committee consists of One Non-Executive Independent Director and One Executive Director as follows;
Mrs. S.F. Fernando - Member Prof. A.H.O. Bamunuarachchi – (Chairman)
8
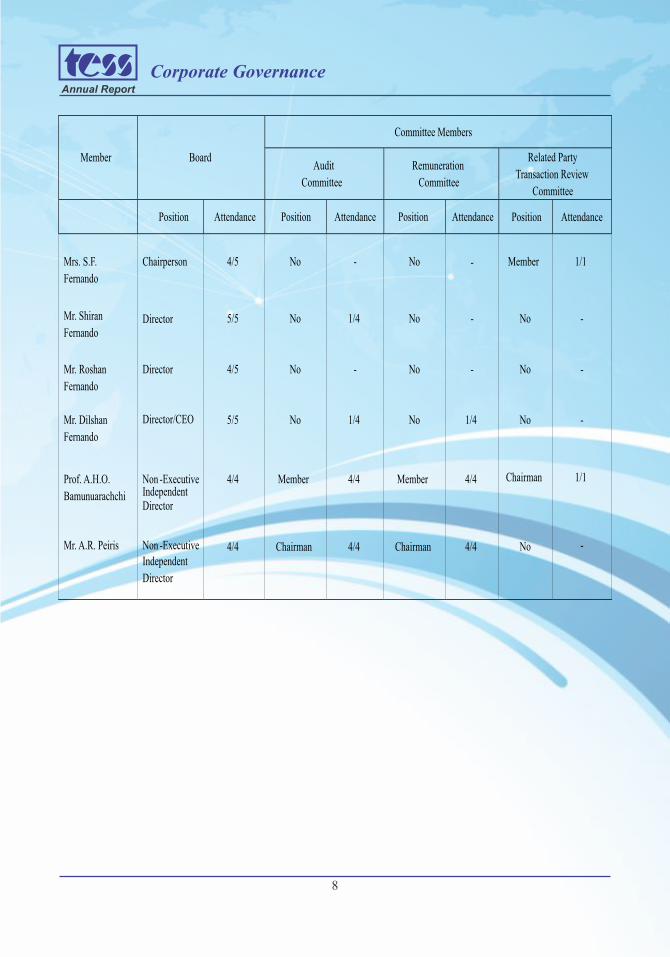
Member Board
Committee Members
Audit
Committee Remuneration
Committee
Related Party
Transaction Review
Committee
Position Attendance Position Attendance Position Attendance
Position Attendance
Mr. Shiran
Fernando
Mr. Roshan
Fernando
Mr. Dilshan
Fernando
Prof. A.H.O.
Bamunuarachchi
Mr. A.R. Peiris
Director
Director
Director/CEO
Non -Executive Independent Director
Non -Executive
Independent
Director
5/5
4/5
5/5
4/4
4/4
No
No
No
Member
Chairman
1/4
-
1/4
4/4
4/4
No
No
No
Member
Chairman
-
-
-
1/4
4/4
4/4
No
No
No
No
Chairman
-
-
-
-
1/1
Mrs. S.F.
Fernando
Chairperson 4/5 No - No Member 1/1
Corporate GovernanceAnnual Report
Annual Report
9
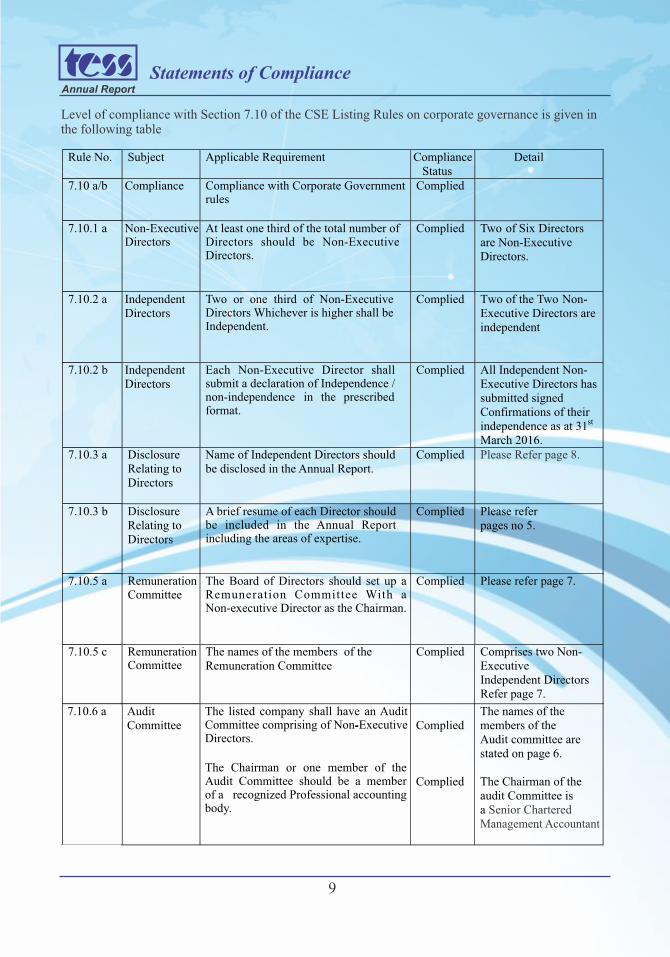
Statements of Compliance
Level of compliance with Section 7.10 of the CSE Listing Rules on corporate governance is given in the following table
Rule No. Subject Applicable Requirement Compliance Status
Detail
7.10 a/b Compliance Compliance with Corporate Government rules
Complied
7.10.1 a Non-ExecutiveDirectors
At least one third of the total number of Directors should be Non-Executive Directors.
Complied
Two of Six
Directors are Non-Executive Directors.
7.10.2 a Independent
Directors
Two or one third of Non-Executive Directors Whichever is higher shall be Independent.
Complied
Two
of the Two Non-Executive Directors are independent
7.10.2 b Independent
Directors
Each Non-Executive Director shall
submit a declaration of Independence / non-independence in the prescribed format.
Complied
All Independent Non-Executive Directors has submitted signed Confirmations of their independence as at 31st
March 2016.
7.10.3 a Disclosure Relating to
Directors
Name of Independent Directors should be disclosed in the Annual Report.
Complied
Please Refer page 8.
7.10.3 b Disclosure Relating to Directors
A brief resume of each Director should be included in the Annual Report including the areas of expertise.
Complied Please refer pages no 5.
7.10.5 a Remuneration
Committee
The Board of Directors should set up a Remuneration Committee With a Non-executive Director as the Chairman.
Complied
Please refer page 7.
7.10.5 c Remuneration Committee
The names of the members of the Remuneration Committee
Complied Comprises two Non-Executive Independent Directors Refer page 7.
7.10.6 a Audit Committee
The listed company shall have an Audit Committee comprising of Non-Executive Directors.
-
The Chairman or one member of the Audit Committee should be a member of a recognized Professional accounting body.
Complied
Complied
The names of the members of the Audit committee are stated on page 6.
The Chairman of the audit Committee is a Senior Chartered Management Accountant.
Annual Report
10
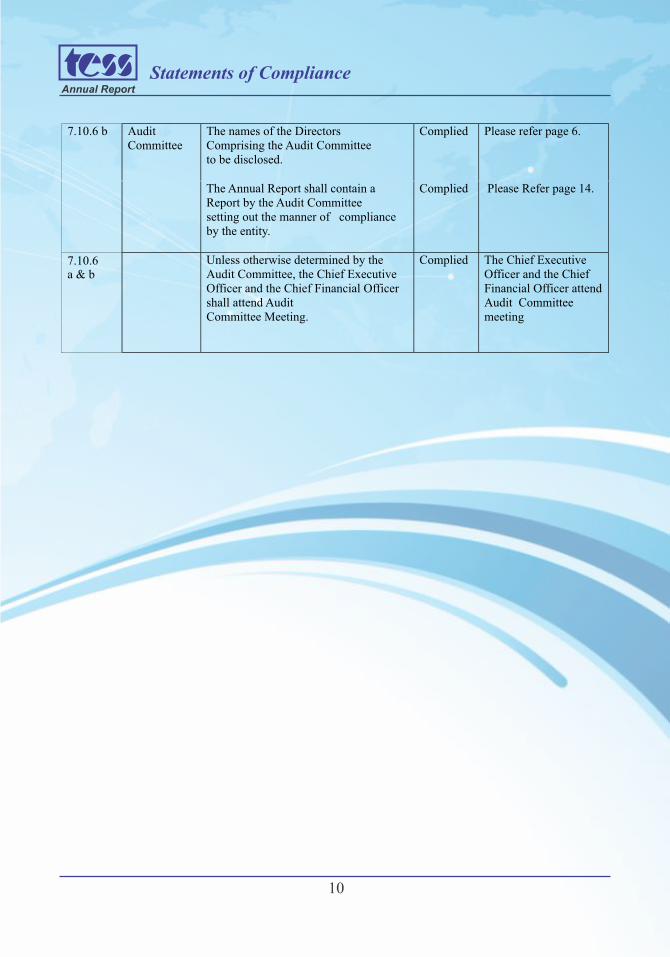
Statements of Compliance
7.10.6 b Audit
Committee
The names of the Directors Comprising the Audit Committee to be disclosed.
Complied
Please refer page 6.
The Annual Report shall contain a Report by the Audit Committee setting out the manner of compliance by the entity.
Complied Please Refer page 14.
Unless otherwise determined by the Audit Committee, the Chief Executive Officer and the Chief Financial Officer shall attend Audit Committee Meeting.
Complied
The Chief Executive Officer and the Chief Financial Officer attend Audit Committee meeting
7.10.6 a & b
Annual Report
11
The Directors’ Report
stThe Directors have pleasure in presenting herewith the Directors’ Report for the year ended 31 March 2016 and the Audited Financial Statements of the Company as at date.
Principal ActivitiesThe principal activities of the Company include the provision of Cold Chain Facility for perishables and export of fruits, vegetables & marine products.
Review of OperationsThe review of operations during the year is dealt with in the Chairperson’s Report.
Internal ControlsPlease refer to the Corporate Governance Practices Statement and the Statement of Directors' Responsibilities on pages respectively.06 & 13
Corporate GovernancePlease refer the Corporate Governance Practices on page 06 & 07.
Going ConcernPlease refer the Statement of Directors' Responsibilities on page 13.
Employment PolicyThe company's employment policy is non-discriminatory and practices equal opportunity for all employees irrespective of ethnic origin, religion, political opinion, gender and marital status.
The company is also committed to the development and utilization of skills of the local labour force.
Corporate DonationsThere were no political donations made, other donations granted during the year amounted Rs. 582,638/=
Financial ResultsstThe following is a summary of the financial results of the operations of the Company for the year ended 31
March 2016.
Company
2016 2015
377,775,995(56,855,691)
445,941(56,409,749)(44,000,405)
(103,633,763)
(103,633,763)
444,929,422(49,558,581)(1,240,058)
(50,798,639)14,646,397
(44,000,406)
(44,000,406)
Turnover Profit/(Loss)before TaxationProvision for TaxationProfit/ (Loss) After TaxationRetained Profit/ (Loss) B/FProfit Available for Appropriation
Retained Profit C/F
Annual Report
12
The Directors' Report
Directorate: Prof. Arthur BamunuarachchiMrs. S.F. Fernando Mr. Shiran FernandoMr. Roshan FernandoMr. Dilshan FernandoMr. A.R.Peiris
Capital Expenditure
The total expenditure incurred on the acquisition of Property, plant and equipment of the Company during the year amounted to The Rs. 69,186/-.amount incurred on capital work in progress is Rs. 412,540/-
Property, Plant and Equipment
The details of Property Plant and equipment acquired the year are given in note 12 to the Accounts.
Directors' Shareholdings – Voting 2015/16 2014/15 Mrs. S. F. Fernando 482,865 482,865Mr. Shiran Fernando 400,028 400,028 Mr. Roshan Fernando 400,028 400,028Mr. Dilshan Fernando 633,895 633,895Prof. A. Bamunuarachchi - -Mr. A. R. Peiris - -
Directors' Shareholdings – Non Voting 2015/16 2014/15 Mrs. S. F. Fernando 54,926 54,926Mr. Shiran Fernando 33,708 33,708 Mr. Roshan Fernando 33,708 33,708Mr. Dilshan Fernando 62,941 62,941Prof. A. Bamunuarachchi - -Mr. A. R. Peiris - -
Directors' Interest in Contracts
The Directors of the Company have no direct or indirect interest in any contract or proposed contracts of the Company, except those disclosed in the Note to the Accounts which have been 30.2disclosed and declared at the Meetings of the Directors
Share Capital
stAs at 31 March 2016 the company had issued 280,000,000 ordinary shares and 40,000,000 Ordinary Non-Voting Shares and the stated capital of the company was Rs. 356,967,698/-. The total
st Company reserves as at 31 March 2016 was Rs.-97,772,627/= (2015 – Rs. -34,908,379/-) this consists of capital reserves of Rs. 5,861,135/- (2015- Rs. 9,092,027/-) and revenue reserve of Rs. -103,633,763/-. (2015 – Rs. -44,000,406) The movement in these reserves is shown in the statement of changes in equity in page no. 20.
The Financial Statements for the year have been audited by M/S SARMA & CO., Chartered Accountants who are being eligible offer themselves for re-appointment.
By order of the Board.United Corporate Consultants & Secretaries (Pvt) Limited,Secretaries to the Company Colombo
st31 August 2016
Annual ReportDirectors' Responsibility for Financial Reporting
13
The responsibility of the Directors in relation to the financial Statements is set out in Auditors report in page under the capt ion “Respect ive 15Responsibilities of Directors and Auditors.”
As per the provisions of the Companies Act No 07, 2007, the Directors are required to prepare financial statements for each financial year giving a true and fair view of the state of affairs of the company as at the end of the financial year.
The Directors are of the view that is preparing these financial statements;
a) Appropriate accounting policies have been selected and applied in a consistent manner and supported by reasonable and prudent judgments and estimates are used, and that all Sri Lankan Accounting standards which they consider applicable are followed.
b) That the company maintains Accounting records which disclose reasonable accuracy of the financial position of the Company.
c) The Financial Statements comply with the Companies Act No. 07 of 2007 and the Sri Lanka Accounting standards.
The Directors are also of the view that the company has adequate resources to continue in operation and have applied the going concern basis in preparing these financial statements.
The Directors have provided the Auditors with every opportunity to take whatever steps and undertake whatever inspections they consider appropriate to express their opinion on the financial statements.
The Directors are of the opinion that the Financial Statements of the Company set out in Pages 15 to 53 have been prepared in accordance with the above requirements and that they have appropriately discharged their responsibilities as set out in this statement.
The Directors also confirm that to the best of their knowledge all taxes and duties payable by the Company and all contributions, levies and taxes payable on behalf of and in respect of the
employees of the Company, and all other known statutory obligations including retiring gratuities, as were due as the Balance Sheet date have been paid or provided for in the Financial Statements.
By Order of the Board of DirectorsTESS AGRO PLC.United Corporate Consultants & Secretaries (Pvt) Limited.
st31 August 2016.
Annual ReportAudit Committee Report
14
Composition of the Committee
In accordance with the Corporate Governance
Guidelines, the Board appointed Audit Committee
comprises Two Independent Non-Executive
Directors namely Mr. A.R. Peiris, who functions in
the capacity of Chairman, and Prof. Arthur
Bamunuarachchi. The Financial knowledge and
the business acumen and the independence of the
members are brought to bear on the deliberation
and judgments on matters that come within their
purview.
Role of the Committee
The role and the responsibility of the committee are
defined in the Audit Committee Charter, which is
r ev i ewed annua l ly t o ensu re t ha t new
developments and other issues are properly
addressed. The responsibilities of Committee are –
● Review the financial reporting process of the
Tess Agro PLC to ensure accurate and
effective financial reporting process is in
place
● Review the operation and effectiveness of
Internal Control Systems.
● Review the adequacy of disclosures in the
Financial Statements in accordance with Sri
Lanka Accounting Standards (IFRS),
Companies Act and other relevant financial
reporting regulations.
● The committee monitors the external audit
functions. The internal controls within the
company are designed to provide reasonable
but not absolute assurance to the Directors
and assist them to monitor the financial
position of the company.
Appointment of External Auditors
The audit committee makes recommendations to
the Board on appointment, reappointment and
removal of External Auditors and approvals of
terms of engagement and remuneration.
Meetings
The Committee held four meetings during the
financial year.
Conclusion
The audit committee is satisfied that the Company
accounting policies, operational controls and risk
management process provide reasonable assurance
that the affairs of the Company is managed in
accordance with company policies and that
company assets are properly accounted for and
adequately safeguarded.
A.R. Peiris Chairman – Audit Committee
st31 August 2016
Annual Report
Independent Auditors’ Report
15
Annual Report
16
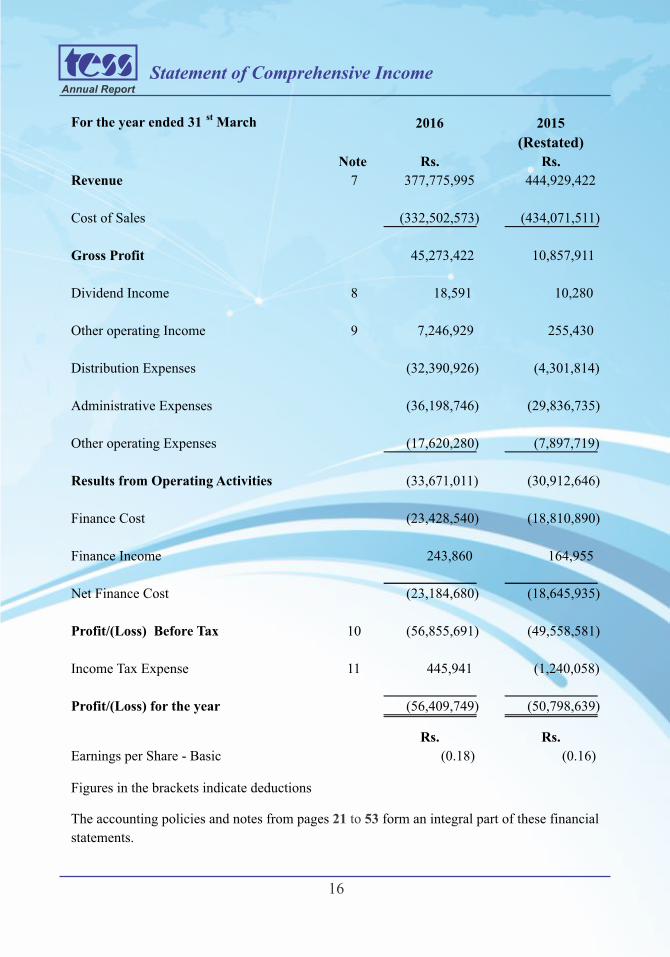
Statement of Comprehensive Income
For the year ended 31 st March 2016 2015
(Restated)
Note Rs. Rs.
Revenue 7 377,775,995
444,929,422
Cost of Sales (332,502,573)
(434,071,511)
Gross Profit 45,273,422
10,857,911
Dividend Income 8 18,591
10,280
Other operating Income 9 7,246,929
255,430
Distribution Expenses (32,390,926) (4,301,814)
Administrative Expenses (36,198,746) (29,836,735)
Other operating Expenses (17,620,280) (7,897,719)
Results from Operating Activities (33,671,011) (30,912,646)
Finance Cost (23,428,540) (18,810,890)
Finance Income 243,860 164,955
Net Finance Cost (23,184,680) (18,645,935)
Profit/(Loss) Before Tax 10 (56,855,691)
(49,558,581)
Income Tax Expense 11 445,941
(1,240,058)
Profit/(Loss) for the year (56,409,749)
(50,798,639)
Rs. Rs.
Earnings per Share - Basic (0.18)
(0.16)
Figures in the brackets indicate deductions
The accounting policies and notes from pages form an integral part of these financial 21 to 53
statements.
Annual Report
17
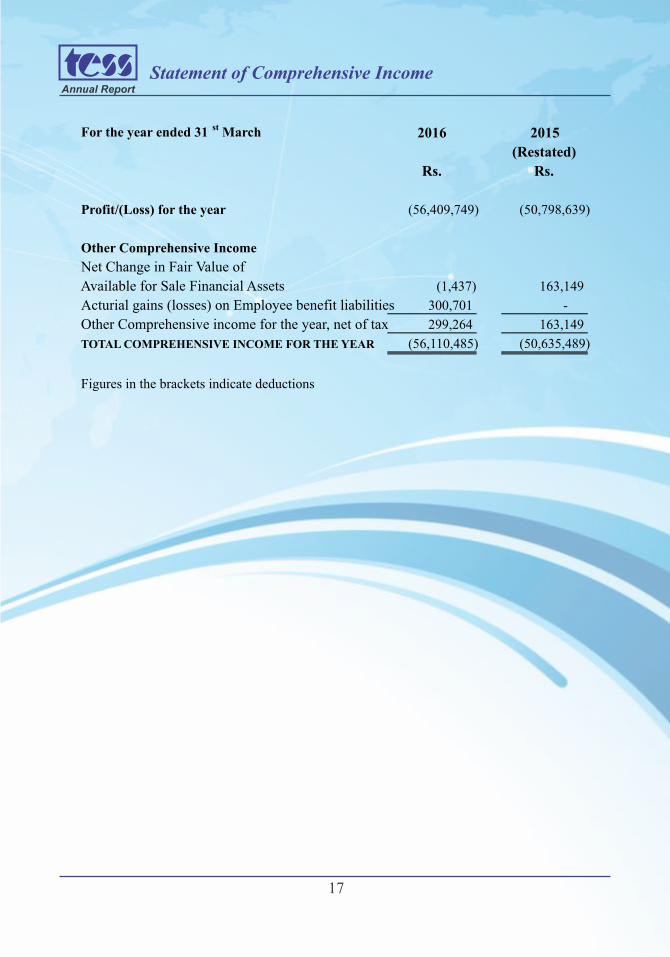
Statement of Comprehensive Income
For the year ended 31 st March 2016 2015
(Restated)
Rs. Rs.
Profit/(Loss) for the year (56,409,749) (50,798,639)
Other Comprehensive Income
Net Change in Fair Value of
Available for Sale Financial Assets (1,437) 163,149 Acturial gains (losses) on Employee benefit liabilities 300,701 - Other Comprehensive income for the year, net of tax 299,264 163,149 TOTAL COMPREHENSIVE INCOME FOR THE YEAR (56,110,485)
(50,635,489)
Figures in the brackets indicate deductions
18
Annual Report
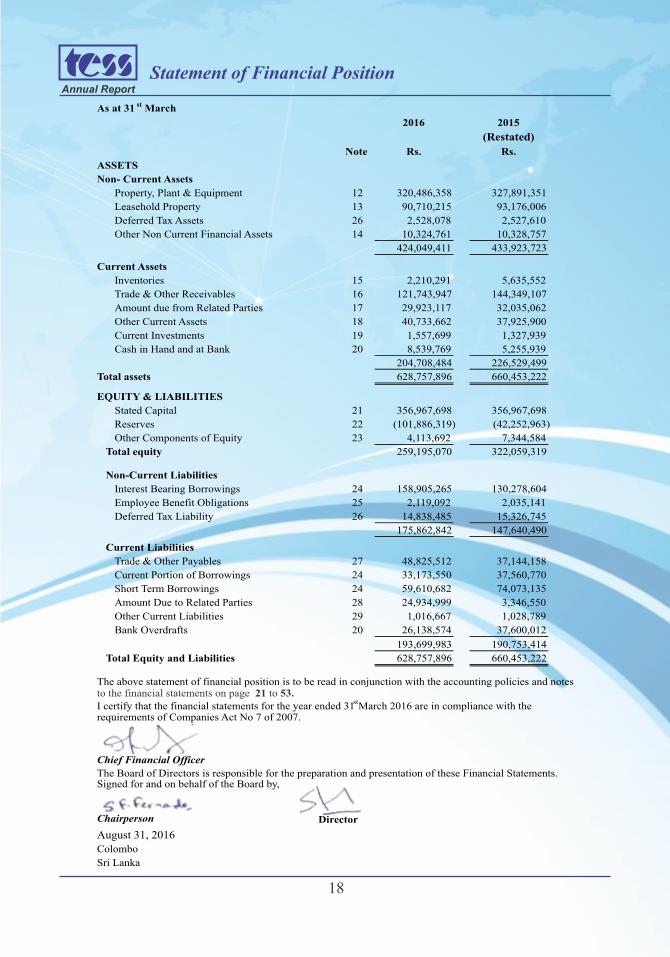
Statement of Financial Position
As at 31 st March
2016 2015
(Restated)
Note Rs. Rs.
ASSETS
Non- Current Assets
Property, Plant & Equipment 12 320,486,358 327,891,351
Leasehold Property 13 90,710,215 93,176,006
Deferred Tax Assets 26 2,528,078
2,527,610
Other Non Current Financial Assets 14 10,324,761
10,328,757
424,049,411
433,923,723
Current Assets
Inventories 15 2,210,291
5,635,552
Trade & Other Receivables 16 121,743,947
144,349,107
Amount due from Related Parties 17 29,923,117
32,035,062
Other Current Assets 18 40,733,662
37,925,900
Current Investments 19 1,557,699
1,327,939
Cash in Hand and at Bank 20 8,539,769
5,255,939
204,708,484
226,529,499
Total assets 628,757,896
660,453,222
EQUITY & LIABILITIES
Stated Capital 21 356,967,698
356,967,698
Reserves 22 (101,886,319)
(42,252,963)
Other Components of Equity 23 4,113,692
7,344,584
Total equity 259,195,070
322,059,319
Non-Current Liabilities
Interest Bearing Borrowings 24 158,905,265 130,278,604 Employee Benefit Obligations 25 2,119,092 2,035,141 Deferred Tax Liability 26 14,838,485
15,326,745
175,862,842
147,640,490
Current Liabilities
Trade & Other Payables 27 48,825,512
37,144,158
Current Portion of Borrowings 24 33,173,550
37,560,770
Short Term Borrowings 24 59,610,682
74,073,135
Amount Due to Related Parties 28 24,934,999
3,346,550
Other Current Liabilities 29 1,016,667
1,028,789
Bank Overdrafts 20 26,138,574
37,600,012
193,699,983
190,753,414
Total Equity and Liabilities 628,757,896
660,453,222
The above statement of financial position is to be read in conjunction with the accounting policies and notes to the financial statements on page 21 to 53.I certify that the financial statements for the year ended 31
st March 2016 are in compliance with the
requirements of Companies Act No 7 of 2007.
Chief Financial Officer
The Board of Directors is responsible for the preparation and presentation of these Financial Statements.Signed for and on behalf of the Board by,
Chairperson Director
August 31, 2016
Colombo
Sri Lanka
Annual Report
19
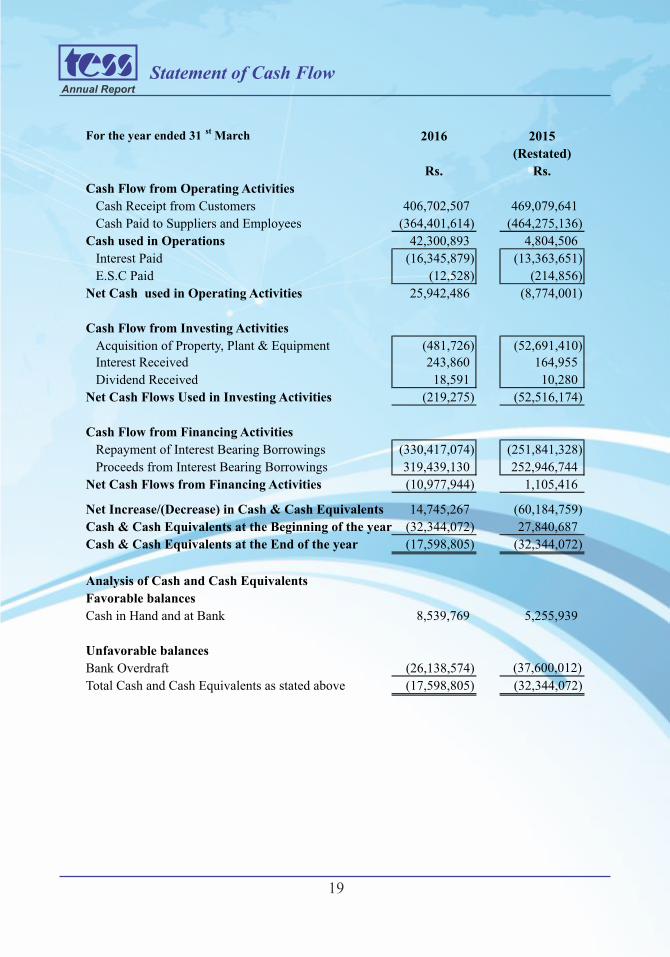
Statement of Cash Flow
For the year ended 31 st March 2016 2015
(Restated)
Rs. Rs.
Cash Flow from Operating Activities
Cash Receipt from Customers 406,702,507
469,079,641
Cash Paid to Suppliers and Employees (364,401,614)
(464,275,136)
Cash used in Operations 42,300,893
4,804,506
Interest Paid (16,345,879)
(13,363,651)
E.S.C Paid (12,528)
(214,856)
Net Cash used in Operating Activities 25,942,486
(8,774,001)
Cash Flow from Investing Activities
Acquisition of Property, Plant & Equipment (481,726)
(52,691,410)
Interest Received 243,860
164,955
Dividend Received 18,591
10,280
Net Cash Flows Used in Investing Activities (219,275) (52,516,174)
Cash Flow from Financing Activities
Repayment of Interest Bearing Borrowings (330,417,074) (251,841,328) Proceeds from Interest Bearing Borrowings 319,439,130
252,946,744
Net Cash Flows from Financing Activities (10,977,944)
1,105,416
Net Increase/(Decrease) in Cash & Cash Equivalents 14,745,267
(60,184,759)
Cash & Cash Equivalents at the Beginning of the year (32,344,072)
27,840,687
Cash & Cash Equivalents at the End of the year (17,598,805)
(32,344,072)
Analysis of Cash and Cash Equivalents
Favorable balances
Cash in Hand and at Bank 8,539,769
5,255,939
Unfavorable balances
Bank Overdraft (26,138,574)
(37,600,012)
Total Cash and Cash Equivalents as stated above (17,598,805)
(32,344,072)
An
nu
al R
ep
ort
20
Statem
ent of C
han
ges in E
quity
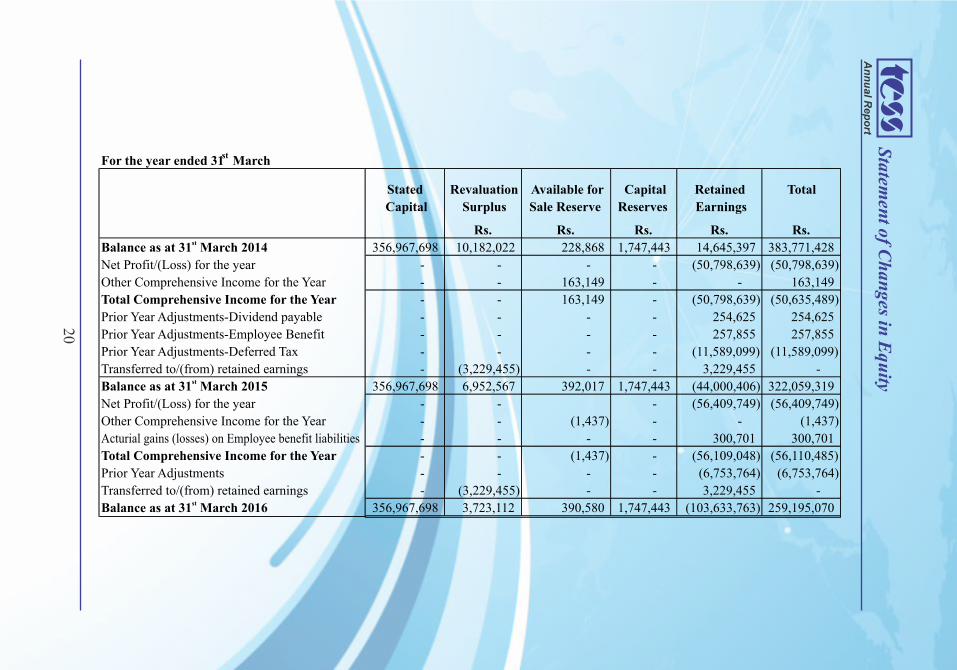
For the year ended 31st
March
Stated Revaluation Available for Capital Retained Total
Capital Surplus Sale Reserve Reserves Earnings
Rs. Rs. Rs. Rs. Rs.stBalance as at 31 March 2014 356,967,698
10,182,022
228,868
1,747,443
14,645,397
383,771,428
Net Profit/(Loss) for the year -
-
-
-
(50,798,639)
(50,798,639)
Other Comprehensive Income for the Year -
-
163,149
-
-
163,149
Total Comprehensive Income for the Year -
-
163,149
-
(50,798,639)
(50,635,489)
Prior Year Adjustments-Dividend payable - - - - 254,625 254,625
Prior Year Adjustments-Employee Benefit - - - - 257,855 257,855 Prior Year Adjustments-Deferred Tax - - - - (11,589,099) (11,589,099) Transferred to/(from) retained earnings - (3,229,455) - - 3,229,455 -
stBalance as at 31 March 2015 356,967,698
6,952,567
392,017
1,747,443
(44,000,406)
322,059,319 Net Profit/(Loss) for the year -
-
-
(56,409,749)
(56,409,749)
Other Comprehensive Income for the Year -
-
(1,437)
-
-
(1,437)
Acturial gains (losses) on Employee benefit liabilities -
-
-
-
300,701
300,701
Total Comprehensive Income for the Year -
-
(1,437)
-
(56,109,048)
(56,110,485)
Prior Year Adjustments -
-
-
-
(6,753,764)
(6,753,764)
Transferred to/(from) retained earnings -
(3,229,455)
-
-
3,229,455
-
stBalance as at 31 March 2016 356,967,698
3,723,112
390,580
1,747,443
(103,633,763)
259,195,070
Annual Report
21
Accounting Policies
1. REPORTING ENTITY
Tess Agro PLC is a public limited liability company incorporated and domiciled in Sri Lanka and listed on the Colombo Stock Exchange. The Registered Office and principal place of business of the company is located at 87, New Nuge Road, Peliyagoda, Kelaniya.
The principal activities of the company are export of marine products and provision of Cold Chain facility for perishables.
Tess Agro PLC does not have an identifiable parent.
The notes to the financial statements on pages 21 to 53 form an integral part of the financial statements. The significant accounting policies have been explained below.
2. BASIS OF PREPARATION2.1 Statement of Compliance
The financial statements which comprise the income statement, statement of comprehensive income, statement of financial position, statement of changes in equity and the cash flow statement together with the accounting policies and notes have been prepared in accordance with Sri Lanka Accounting Standards (SLFRS/LKAS) as issued by the Institute of Chartered Accountants of Sri Lanka and the requirement of the Companies Act No 7 of 2007.
2.2 Responsibility for financial statements
The Board of Directors of the Company is responsible for the preparation and fair presentation of these financial statements.
2.3 Reporting Date
The financial statements of the company are prepared for each financial year, which ends on 31st March.
2.4 Approval of Financial Statements by Directors
st The financial statements for the year ended 31 March 2016 are authorized for issue by the stdirectors on 31 August 2016.
2.5 Basis of Measurement
The Financial Statements are prepared in Sri Lankan rupees, which is the company's functional currency.
The financial statements referred to are based on historical cost convention, except for property, plant & equipment which has been revalued as explained in accounting policies 3.4.1.1 below.
Financial assets classified as Available for Sale & Held to Maturity are measured at fair value are mentioned in note 14 and 19 to the accounts respectively.
The Company uses the following hierarchy for determining and disclosing the fair value of assets and liabilities by valuation techniques.
Annual Report
22
Accounting Policies
Level 1: Quoted (unadjusted) price in active market for identical assets or liabilities Level 2: Directly or indirectly observable prices in active market for similar assets or liabilities Level 3: Inputs that are unobservable that reflect management own assumptions
2.6 Functional and presentation currency These financial statements are presented in Sri Lankan rupees, which is the Companies'
functional currency.
2.7 Going concern
The Directors have made an assessment as to the company's ability to continue as a going concern and are of the view that the company possess resources to continue in business for the foreseeable future. They further express that there is no intention to liquidate or cease operations of the business. Therefore the financial statements are prepared on the going concern basis.
3. SIGNIFICANT ACCOUNTING POLICIES
3.1. Comparative Information
The presentation and classification of the financial statements of the previous years have been amended, where relevant for better presentation and to comparable with those of the current year.
The accounting policies set out below have been applied consistently for all periods presented in the financial statements by the Company.
3.2 Foreign currency transactions 3.2.1 Foreign currency transactions and balances
All transactions involving foreign exchange are translated at the rate of exchange prevailing at the time the transactions are affected. All monetary assets and liabilities in foreign currency at the year-end are translated at the rate prevailing on the reporting date. The resulting Gains or Losses are dealt with in the statement of comprehensive income.
Non – monetary assets and liabilities that are measured in terms of historical cost in a foreign currency are translated using the exchange rates as at the dates of the initial transactions.
Foreign currency gains and losses are reported on a net basis in the statement of comprehensive income.
3.2.2 Foreign operations
The operations with the branch office in the overseas are translated in to functional currency at the rate of exchange prevailing at the transaction date and the year end balances are translated at the rate prevailing at the reporting date.
The assets and liabilities of foreign operations are translated to the reporting currency at the rate of exchange prevailing on the reporting date. Income and expenses of the foreign entities are translated at exchange rate approximating to the actual rate at the dates of the transactions.
23
Accouning PoliciesAnnual Report
3.3 Share capital
Ordinary shares are classified as equity. Incremental costs directly attributable to the issue of ordinary shares are recognized as a deduction from equity.
3.4 Assets and bases of their Valuation
3.4.1 Property, Plant and Equipment
3.4.1.1 Recognition and Measurement
Property plant and equipment are recognized if it is probable that future economic benefits associated with the asset will flow to the company and the cost of the asset can be reliably measured.
Property, plant and equipment are stated at cost or valuation less aggregate depreciation. The cost of self- constructed assets includes the cost of materials, direct labor and any other costs directly attributable to brining the assets to the working condition for its intended use, and borrowing cost if the recognition criteria are met
Capital work in progress represents the accumulated construction cost of the new office premises and the cold room complex at Muthurajawela. Any Items of property, plant and equipment are recognized initially at cost.
The following classes of property, plant & equipment of the company was revalued on st31 March 2013.
Leasehold Land Building Constructed Machinery Cool Room Equipment Motor Vehicles.
The revaluation of land and building were carried out by an independent valuer Mr. Arthur Perera a Graduate member of the Institute of Valuers (Sri Lanka).
The revaluation of other assets were carried out by an independent valuer Mr. R.G. Wijesinghe a Graduate Member of the Institute of Valuers (Sri Lanka).
Any revaluation surplus is recognized in other comprehensive income and accumulated in equity in the asset revaluation reserve, except to the extent that it reverses a revaluation decrease of the same asset previously recognized in the income statement, in which case the increase is recognized in the income statement. A revaluation deficit is recognized in the income statement, except to the extent that it offsets an existing surplus on the same asset recognized in the asset revaluation reserve.
Accumulated depreciation as at the revaluation date is eliminated against the gross carrying amount of the asset and the net amount is restated to the revalued amount of the asset. Upon disposal, any revaluation reserve relating to the particular asset being sold is transferred to retained earnings.
When an item of property, plant and equipment are revalued, the entire class of such asset is revalued at fair value on the date of revaluation. The company has adopted a policy of revaluing assets by professional valuers at least every 5 years.
Annual Report
24
Accounting Policies
Borrowing cost that are directly attributable to the acquisition and construction of Muthurajawela project has been capitalized as per LKAS 23.
3.4.1.2 Subsequent cost
The company recognizes in the property, plant and equipment the cost of replacing a part of an item, if it is probable that the future economic benefits embodied in the item will flow to the company and the cost of the items can be measured reliably. The carrying amounts of the parts that are replaced are derecognized from the cost of the asset. The cost of day to day servicing of property, plant and equipment are recognized in the income statement as and when incurred.
Items of property, plant and equipment are derecognized upon replacement, disposal or when no future economic benefit is expected from its use. Any gain or loss arising on derecognizing of the asset is included in the income statement in the year the asset is derecognized.
Upon disposal, any related revaluation reserve is transferred from the revaluation reserve to retained earnings and is not taken in to account in arriving at the gain or loss on disposal.
The carrying values of the property, plant and equipment are reviewed for impairment when events or changes in circumstances indicate that the carrying values may not be recoverable.
3.4.1.3 Depreciation
Provision for depreciation is calculated by using a straight line method on the cost or valuation of all property, plant and equipment, in order to write off such amounts over the estimated useful economic life of such assets.
The estimate useful lives of assets are as follows.
Assets Years Leasehold Premises 99 & 30 years Buildings 50 years
Plant & Machinery 10 – 20 years Office Equipment 05 – 10 years
Factory Equipment 10 years Electrical Equipment 05 years
Tools 03 years Furniture & Fittings 05 years Motor Vehicles 05 years Factory Utensils 10 years Lab Equipment 10 years Depreciation is provided on the assets when they become available for use.
Annual Report
25
Accounting Policies
3.5 Leases
3.5.1 Finance Leases
Leases in items of which the group assumes substantially all the risks and rewards of ownership are classified as finance leases and capitalized & disclosed under property, plant and equipment at their revalued amount & depreciated over the period the company is expected to benefit from them.
The corresponding principal amount payable to the lessor is shown as a liability. Lease
payments are apportioned between the finance charges and reduction of the lease liability so as to achieve a constant rate of interest on the outstanding balance of the liability. The interest payable over the period of the lease is transferred to an interest in suspense account. The interest element of the rental obligations pertaining to each financial year is charged to the income statement over the period of lease.
3.5.2 Lease Hold Property - Land
Lease rentals paid with regards to land usage rights are amortized over the lease term in accordance with the pattern of benefits provided.
Details of such lease rentals are given in note 13 to the Financial Statements.
3.6 Financial Instruments Financial Instruments are recognized when the company becomes a party to the contractual provisions of the instrument.
Financial Instruments are initially measured at fair value.
3.6.1 Non- Derivative Financial Assets
3.6.1.1 Initial recognition and measurement
Financial assets are classified at their fair value through profit or loss, loans and receivables, held to maturity financial assets and available for sale financial assets.
The company recognizes loans and receivables and deposits on the day the transaction is originated. All other financial assets are recognized initially on the trade date at which the company becomes a party to the contractual provision of the instrument.
3.6.1.2 Financial assets at fair value through profit or loss
Financial assets are recognized at fair value through profit or loss, if it is classified as held for trading in the near future or is designated as such upon initial recognition.
3.6.1.3 Loans and Receivables
Loans and Receivables are initially recognized at fair value plus any directly attributable transaction cost.
Loans and receivables include cash and cash equivalents and trade and other receivables.
Annual Report
26
Accounting Policies
3.6.1.4 Held -to - maturity financial assets
Held to maturity financial assets are recognized initially at fair value plus any directly attributable significant transaction costs.
During the year the company has designated Fixed deposits as held to maturity investments.
3.6.1.5 Available for sale financial assets
Available for sale financial assets are non- derivative financial assets that are designated as available for sale or are not classified in any of the previous categories. Available sale financial assets are recognized initially at fair value plus any directly attributable transaction costs.
3.6.2 Impairment of financial assets
A financial asset not carried at fair value through profit or loss is assessed at each reporting date to determine whether there is objective evidence that is impaired. A financial asset is impaired if, there is objective evidence as a result of one or more events that has occurred after the initial recognition of the financial asset (an incurred 'loss event') and the estimated future cash flows of the investment have been affected.
3.6.3 Financial liabilities at fair value through profit or loss
Financial liabilities at fair value through profit or loss include financial liabilities held for trading and financial liabilities designated upon initial recognition as at fair value through profit or loss. Gains or losses on liabilities held for trading are recognized in the income statement. The Company has not designated any financial liabilities upon initial recognition as at fair value through profit or loss.
3.6.4 Other financial liabilities
All financial liabilities other than those at fair value through profit and loss are classified as other financial liabilities.
3.6.5 Derecognition of financial assets
The Company derecognizes a financial asset when;
The right to receive cash flows from the asset have expired or the entity has transferred its rights to receive cash flows from the asset or has assumed an obligation to pay the received cash flows in full without material delay to a third party under a pass-through arrangement and either.
The entity has transferred substantially all the risks and rewards of the asset, or
All other financial liabilities are recognized initially at fair value plus directly attributable transaction costs. Subsequent to initial recognition these financial liabilities are measured at amortized cost using the effective interest rate method. The financial liabilities include trade and other payables, bank overdrafts, loans and borrowings and financial guarantee contracts.
Annual Report
27
Accounting Policies
3.6.7 Derecognition of financial liabilities
The Company derecognizes a financial liability when its contractual obligations are discharged, cancelled or expired.
3.7 Investments
Investment in Non-Quoted equity shares are treated as other investment and measured at cost less impairment and treated as other investments in the company's financial statement.
3.8 Inventories
Inventories are stated at lower of cost and net realizable value. Net realizable value is the estimated selling price in the ordinary course of business, less the estimated cost of completion and selling expenses. The inventories are valued on a first in first out basis. The cost of inventories included cost of acquiring and brining inventories to their present location and condition. Where production is involved cost of inventories included and appropriate proportion of production overheads based on normal based operating capacity.
3.9 Cash and Cash Equivalents
Cash & cash equivalents in the cash flow statement comprise cash at bank and in hand net of outstanding bank overdrafts.
3.10 Impairment
3.10.1 Non Financial Assets
The carrying amounts of the company's non-financial assets other than inventories and deferred tax are reviewed at each reporting date to determine whether there is any indication of impairment. If any such indication exists, the assets recoverable amounts are estimated.
An impairment loss is recognized if the carrying amount of an asset or its cash generating unit exceeds its recoverable amount. A cash generating unit is the smallest identifiable asset group that generates cash flows that largely are independent from other assets. Impairment losses are recognized in the income statement.
3.11 Income Tax Expenses
3.11.1 Current Taxes
Provision for income tax is based on the elements of income and expenditure as reported in the financial statements and is computed in accordance with the provision of the relevant tax statutes.
As per section 16A of Inland Revenue Act No. of 2006 the operating profit of the 10 company is exempt from income tax till year of assessment 2015/16.
Annual Report
28
Accounting Policies
3.11.2 Deferred Tax
Deferred taxation is the tax attributable to the temporary differences that arise when taxation authorities recognize and measure assets and liabilities with rules that differ from those of the financial statements of the company.
Deferred tax is recognized in respect of temporary differences between the carrying
amounts of assets and liabilities for financial reporting purposes and the amounts used for taxation purposes.
Deferred tax is measured at the tax rate that are expected to be applied to temporary differences when they reverse, based on the laws that have been enacted by the reporting date.
Deferred tax assets and liabilities recognized by the individual companies are disclosed separately as assets and liabilities in the company statement of financial position and are not offset against each other.
3.12 Economic Service Charge
As per the provision of the Economic Service Charge Act No.13 of 2006, economic service charge is payable on the liable turnover at the rate of 0.25%. Economic Service Charge is deductible from the income tax liability. Any unclaimed liability is carried forward and set off against the income tax payable subject to provision of the Act.
3.13 Provisions and Liabilities
Liabilities are recognized in the statement of financial position when there is a present obligation arising from a past event, the settlement of which is expected to result in an out flow of resources embodying economic benefits. Obligations payable at the demand of the creditor or within one year of the statement of financial position date are treated as current liabilities in the statement of financial position. Liabilities payable after one year from the reporting date are treated as non -current liabilities in the statement of financial position.
All known liabilities have been accounted for in preparing the financial statements.
3.14 Employee Benefits
3.14.1 Short Term Employee Benefits
Short-term employee benefit obligations are measured on an undiscounted basis and are expensed as the related service is provided. A liability is recognized for the amount expected to be paid under short-term cash bonus if the Company has a present legal or constructive obligation to pay this amount as a result of past service rendered by the employee and the obligation can be measured reliably.
3.14.2 Post Employee Benefits
3.14.2.1 Defined Benefit Plan – Retiring Gratuity
A defined benefit plan is a post- employment benefit plan other than a Defined contribution plan.
Annual Report
29
Accounting Policies
The defined benefit obligation has been calculated based on the gratuity formula in Appendix E of LKAS 19 employee benefits. All assumptions are reviewed at each reporting date. Details of the key assumptions used in the estimates are contained in Note 25 in the Financial Statements.
Provision has been made in the financial statements for retiring gratuities from the first year of service for all employees in conformity with LKAS 19 on Retirement Benefit Costs.
However, according to the payment of Gratuity Act No 12 of 1983, the liability for payment to an employee arises only after the completion of 5 years continued service.
The liability is not externally funded.
3.14.2.2 Defined Contribution Plans – Employees' Provident Fund and Employees' Trust Fund All the employees are eligible for Employees' Provident Fund and Employees' Trust Fund Contributions. The Company contributes the defined percentages of earnings of the employees to Employees' Provident Fund managed by Central Bank of Sri Lank and Employees' Trust Fund managed by Employees' Trust Fund Board respectively.
3.14.2.2.1 Employee Provident Fund and Employee Trust Fund
The company contributes a sum equivalent to 12% of the gross emoluments of employees employed in Sri Lanka as provident fund benefit and 3% as trust fund benefit.
3.15 Events after the reporting date
No circumstances have arisen since the reporting date, which would require adjustments to, or disclosure in the accounts.
4. INCOME STATEMENT
4.1 Revenue Recognition
Revenue is recognized to the extent that it is probable that the economic benefits will flow to the company and the revenue and associated costs incurred or to be incurred can be reliably measured. Revenue is measured on accrual basis net of trade discounts and value added taxes.
4.2 Loss
The Loss incurred by the company as shown in the income statement is after making provision for impairment, all known liabilities and depreciation of property, plant & equipment.
4.3 Dividend
Dividend income is recognized on cash basis.
Annual Report
30
Accounting Policies
4.4 Other Income
Other income is recognized on an accrual basis.
4.5 Finance Income and Expenses
Finance income comprises interest income of funds invested in fixed deposits. Finance expenses comprised of interest expenses on borrowing and leases. Borrowing costs that are not directly attributable to the acquisition, construction or production of qualifying assets are recognized in the income statement.
4.6 Borrowing Cost
Borrowing cost that is not directly attributable to the acquisition, construction or production of qualifying assets are recognized as an expense.
4.7 Expenditure Recognition
Expenses are recognized in the income statement on the basis of a direct association between the cost incurred and the earning of specific items of income. All expenditure incurred in the running of the business and in maintaining the property, plant and equipment to keep them in good condition has been charged to the income statement.
For the purpose of presentation of the income statement, the “expenses by function” method has been adopted, on the basis that it presents fairly the elements of the company performance.
4.8 Turnover Based Taxes
Turnover based taxes include Value Added Tax, Economic Service Charge and Nation Building Tax.
4.9 Movement of reserves
Movements of reserves are disclosed in the Statement of Changes in Equity.
4.10 Cash Flow
The cash flow of the Company has been presented using the direct method in accordance with LKAS 7 – Statement of Cash Flow.
4.11 Earnings per Share
Basic Earnings per Share is calculated by dividing the net profit for the year attributable to ordinary shareholders of the Company by the weighted average number of ordinary shares in issue during the year. The weighted average number of ordinary shares in issue during the previous year is adjusted for events that changed the number of ordinary shares in issue without a corresponding change in the resources.
The following data has been used in the computation of the Basic Earnings per share:
Annual Report
31
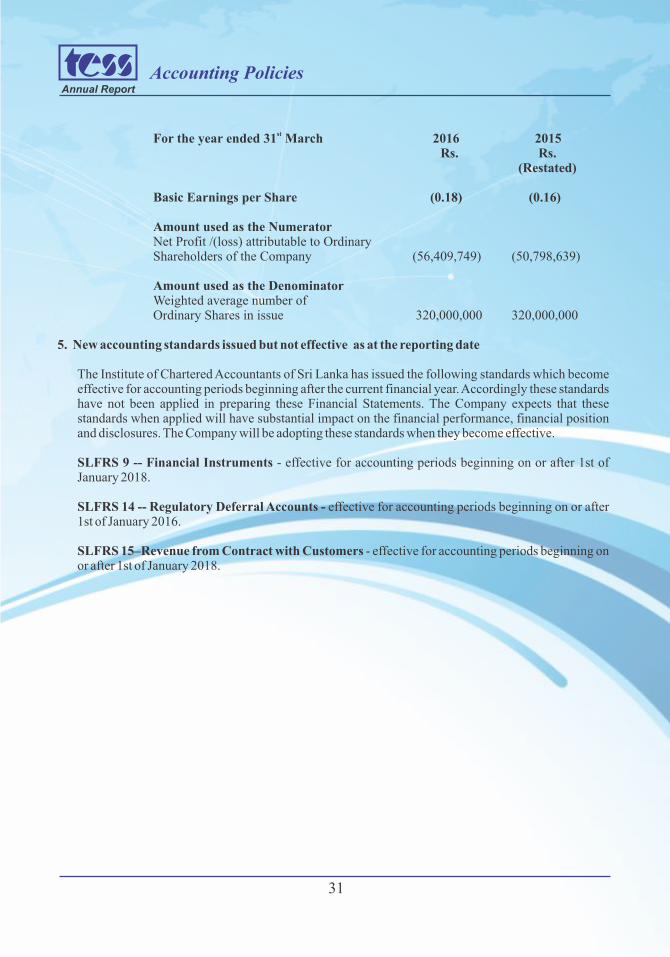
Accounting Policies
st For the year ended 31 March 2016 2015 Rs. Rs. (Restated) Basic Earnings per Share (0.18) (0.16) Amount used as the Numerator Net Profit /(loss) attributable to Ordinary Shareholders of the Company (56,409,749) (50,798,639)
Amount used as the Denominator Weighted average number of Ordinary Shares in issue 320,000,000 320,000,000
5. New accounting standards issued but not effective as at the reporting date
The Institute of Chartered Accountants of Sri Lanka has issued the following standards which become effective for accounting periods beginning after the current financial year. Accordingly these standards have not been applied in preparing these Financial Statements. The Company expects that these standards when applied will have substantial impact on the financial performance, financial position and disclosures. The Company will be adopting these standards when they become effective.
SLFRS 9 -- Financial Instruments - effective for accounting periods beginning on or after 1st of January 2018.
SLFRS 14 -- Regulatory Deferral Accounts - effective for accounting periods beginning on or after 1st of January 2016.
SLFRS 15–Revenue from Contract with Customers - effective for accounting periods beginning on or after 1st of January 2018.
Annual Report
32
Notes to the Accounts
For the year ended 31st
March 2016 2015
Rs. Rs.
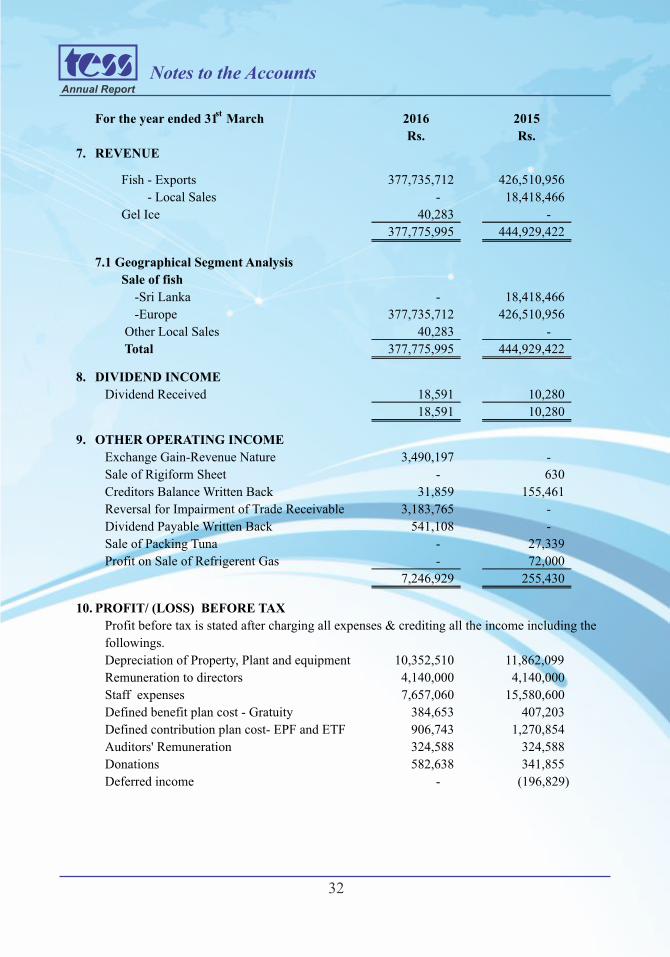
7. REVENUE
Fish - Exports 377,735,712
426,510,956
- Local Sales -
18,418,466
Gel Ice 40,283
-
377,775,995
444,929,422
7.1 Geographical Segment Analysis
Sale of fish
-Sri Lanka -
18,418,466
-Europe 377,735,712
426,510,956
Other Local Sales 40,283
-
Total 377,775,995
444,929,422
8. DIVIDEND INCOME
Dividend Received 18,591
10,280
18,591
10,280
9. OTHER OPERATING INCOME
Exchange Gain-Revenue Nature 3,490,197 - Sale of Rigiform Sheet - 630 Creditors Balance Written Back 31,859
155,461
Reversal for Impairment of Trade Receivable 3,183,765
- Dividend Payable Written Back 541,108
-
Sale of Packing Tuna -
27,339
Profit on Sale of Refrigerent Gas -
72,000
7,246,929
255,430
10. PROFIT/ (LOSS) BEFORE TAX
Profit before tax is stated after charging all expenses & crediting all the income including the
followings.
Depreciation of Property, Plant and equipment 10,352,510
11,862,099
Remuneration to directors 4,140,000
4,140,000
Staff expenses 7,657,060
15,580,600
Defined benefit plan cost - Gratuity 384,653
407,203
Defined contribution plan cost- EPF and ETF 906,743
1,270,854
Auditors' Remuneration 324,588
324,588
Donations 582,638
341,855
Deferred income -
(196,829)
Annual Report
33
Notes to the Accounts
For the year ended 31 st March 2016 2015
Rs. Rs.
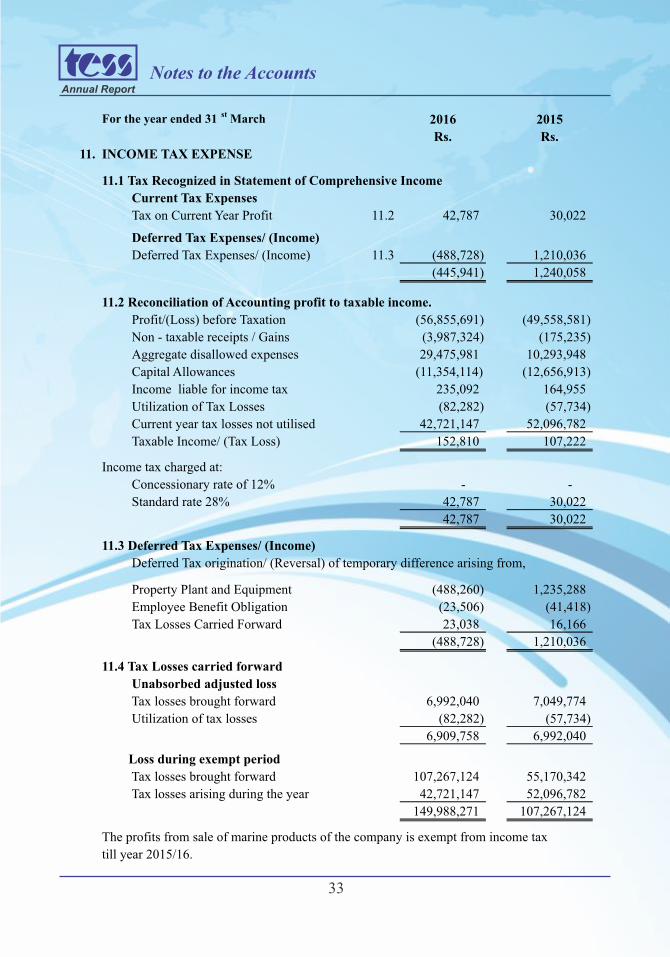
11. INCOME TAX EXPENSE
11.1 Tax Recognized in Statement of Comprehensive Income
Current Tax Expenses
Tax on Current Year Profit 11.2 42,787
30,022
Deferred Tax Expenses/ (Income)
Deferred Tax Expenses/ (Income) 11.3 (488,728)
1,210,036
(445,941)
1,240,058
11.2 Reconciliation of Accounting profit to taxable income.
Profit/(Loss) before Taxation (56,855,691)
(49,558,581)
Non - taxable receipts / Gains (3,987,324)
(175,235)
Aggregate disallowed expenses 29,475,981
10,293,948
Capital Allowances (11,354,114)
(12,656,913)
Income liable for income tax 235,092
164,955
Utilization of Tax Losses (82,282)
(57,734)
Current year tax losses not utilised 42,721,147
52,096,782
Taxable Income/ (Tax Loss) 152,810
107,222
Income tax charged at:
Concessionary rate of 12% - - Standard rate 28% 42,787 30,022
42,787 30,022 11.3 Deferred Tax Expenses/ (Income)
Deferred Tax origination/ (Reversal) of temporary difference arising from,
Property Plant and Equipment (488,260)
1,235,288
Employee Benefit Obligation (23,506)
(41,418)
Tax Losses Carried Forward 23,038
16,166
(488,728)
1,210,036
11.4 Tax Losses carried forward
Unabsorbed adjusted loss
Tax losses brought forward 6,992,040
7,049,774
Utilization of tax losses (82,282)
(57,734)
6,909,758
6,992,040
Loss during exempt period
Tax losses brought forward 107,267,124
55,170,342
Tax losses arising during the year 42,721,147
52,096,782
149,988,271 107,267,124
The profits from sale of marine products of the company is exempt from income tax
till year 2015/16.
Annual Report
34
Notes to the Accounts
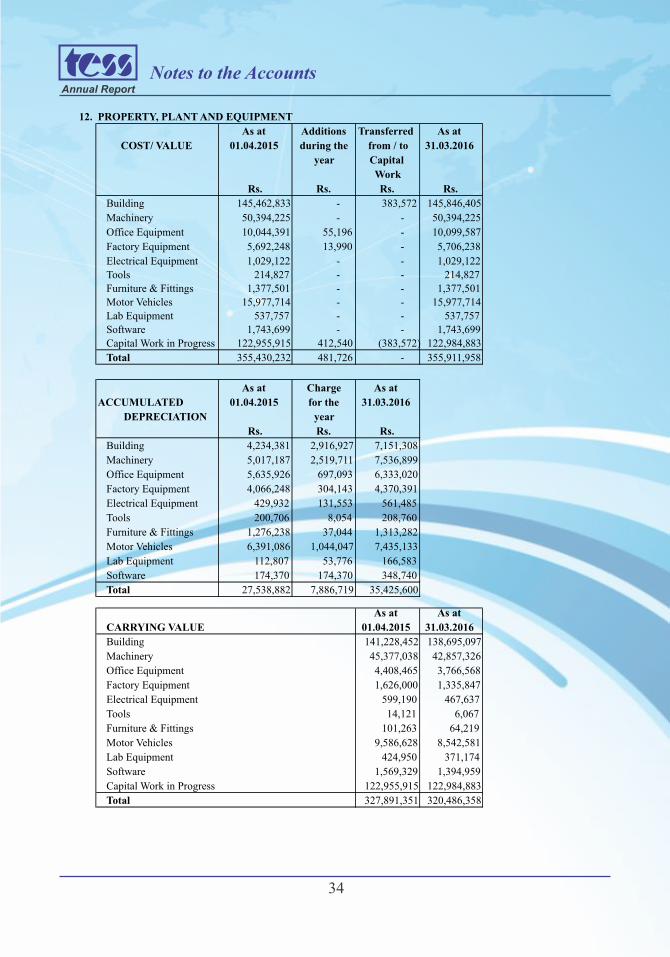
12. PROPERTY, PLANT AND EQUIPMENT
As at Additions Transferred As at
COST/ VALUE 01.04.2015 during the from / to 31.03.2016
year Capital
Work
Rs. Rs. Rs. Rs.
Building 145,462,833
-
383,572
145,846,405
Machinery 50,394,225
-
-
50,394,225
Office Equipment 10,044,391
55,196
-
10,099,587
Factory Equipment 5,692,248
13,990
-
5,706,238
Electrical Equipment 1,029,122
-
-
1,029,122
Tools 214,827
-
-
214,827
Furniture & Fittings 1,377,501
-
-
1,377,501
Motor Vehicles 15,977,714
-
-
15,977,714
Lab Equipment 537,757
-
-
537,757
Software 1,743,699
-
-
1,743,699
Capital Work in Progress 122,955,915
412,540
(383,572)
122,984,883
Total 355,430,232
481,726
-
355,911,958
As at Charge As at
ACCUMULATED 01.04.2015 for the 31.03.2016
DEPRECIATION year
Rs. Rs. Rs.
Building 4,234,381 2,916,927 7,151,308 Machinery 5,017,187 2,519,711 7,536,899 Office Equipment 5,635,926 697,093 6,333,020 Factory Equipment 4,066,248
304,143
4,370,391
Electrical Equipment 429,932
131,553
561,485
Tools 200,706
8,054
208,760
Furniture & Fittings 1,276,238
37,044
1,313,282
Motor Vehicles 6,391,086
1,044,047
7,435,133
Lab Equipment 112,807
53,776
166,583
Software 174,370
174,370
348,740
Total 27,538,882
7,886,719
35,425,600
As at As at
CARRYING VALUE 01.04.2015 31.03.2016
Building 141,228,452
138,695,097
Machinery 45,377,038
42,857,326
Office Equipment 4,408,465
3,766,568
Factory Equipment 1,626,000
1,335,847
Electrical Equipment 599,190
467,637
Tools 14,121
6,067
Furniture & Fittings 101,263
64,219
Motor Vehicles 9,586,628 8,542,581
Lab Equipment 424,950 371,174
Software 1,569,329 1,394,959
Capital Work in Progress 122,955,915 122,984,883
Total 327,891,351 320,486,358
Annual Report
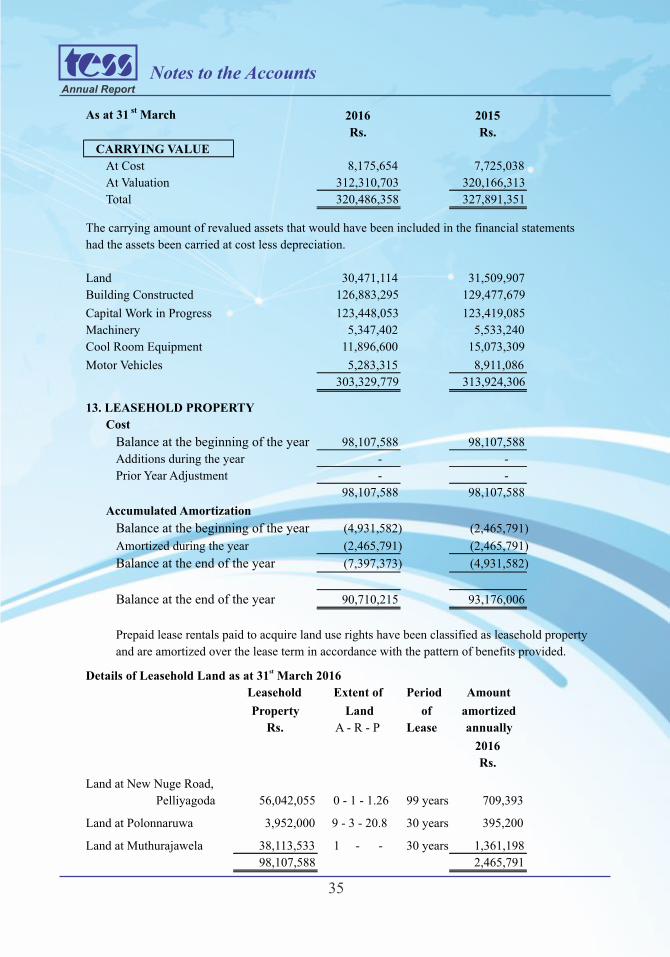
35
Notes to the Accounts
As at 31 st March 2016 2015
Rs. Rs.
CARRYING VALUE
At Cost 8,175,654
7,725,038
At Valuation 312,310,703
320,166,313
Total 320,486,358
327,891,351
The carrying amount of revalued assets that would have been included in the financial statements
had the assets been carried at cost less depreciation.
Land 30,471,114
31,509,907
Building Constructed 126,883,295
129,477,679
Capital Work in Progress 123,448,053
123,419,085
Machinery 5,347,402
5,533,240
Cool Room Equipment 11,896,600
15,073,309
Motor Vehicles 5,283,315
8,911,086
303,329,779
313,924,306
13. LEASEHOLD PROPERTY
Cost
Balance at the beginning of the year 98,107,588
98,107,588
Additions during the year - -
Prior Year Adjustment - -
98,107,588 98,107,588 Accumulated Amortization
Balance at the beginning of the year (4,931,582)
(2,465,791)
Amortized during the year (2,465,791)
(2,465,791) Balance at the end of the year (7,397,373)
(4,931,582)
Balance at the end of the year 90,710,215
93,176,006
Prepaid lease rentals paid to acquire land use rights have been classified as leasehold property
and are amortized over the lease term in accordance with the pattern of benefits provided.
stDetails of Leasehold Land as at 31 March 2016
Leasehold Extent of Period Amount
Property Land of amortized
Rs. A - R - P Lease annually
2016
Rs.
Land at New Nuge Road,
Pelliyagoda 56,042,055
0 - 1 - 1.26 99 years 709,393
Land at Polonnaruwa 3,952,000
9 - 3 - 20.8 30 years 395,200
Land at Muthurajawela 38,113,533
1 - - 30 years 1,361,198
98,107,588
2,465,791
Annual Report
36
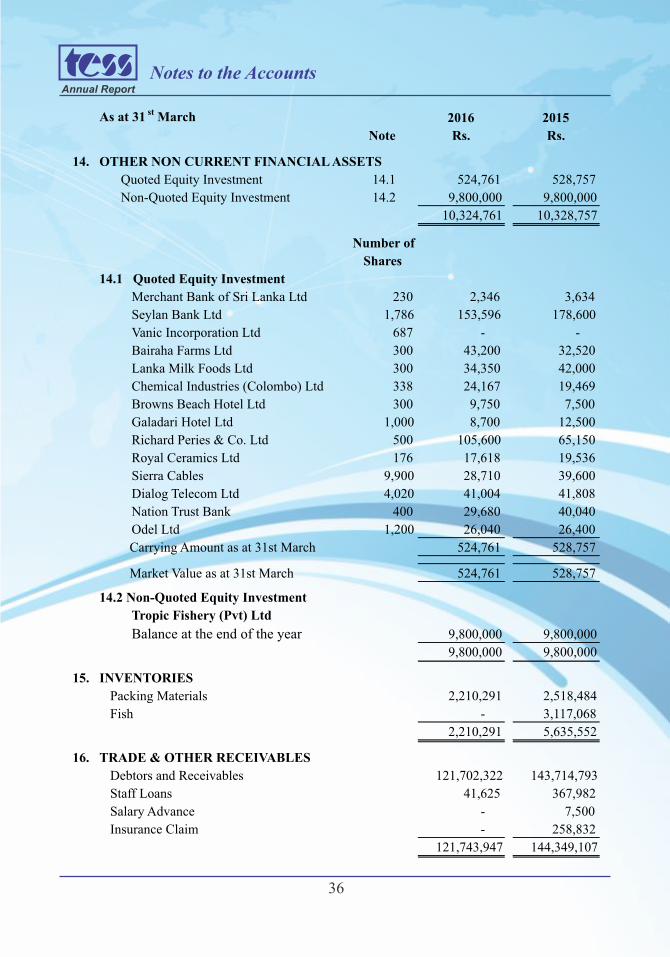
Notes to the Accounts
As at 31 st March 2016 2015
Note Rs. Rs.
14. OTHER NON CURRENT FINANCIAL ASSETS
Quoted Equity Investment 14.1 524,761
528,757
Non-Quoted Equity Investment 14.2 9,800,000
9,800,000
10,324,761
10,328,757
Number of
Shares
14.1 Quoted Equity Investment
Merchant Bank of Sri Lanka Ltd 230
2,346
3,634
Seylan Bank Ltd 1,786
153,596
178,600
Vanic Incorporation Ltd 687
-
-
Bairaha Farms Ltd 300
43,200
32,520
Lanka Milk Foods Ltd 300
34,350
42,000
Chemical Industries (Colombo) Ltd 338
24,167
19,469
Browns Beach Hotel Ltd 300
9,750
7,500
Galadari Hotel Ltd 1,000 8,700 12,500
Richard Peries & Co. Ltd 500 105,600 65,150
Royal Ceramics Ltd 176 17,618 19,536
Sierra Cables 9,900 28,710 39,600 Dialog Telecom Ltd 4,020 41,004 41,808 Nation Trust Bank 400 29,680 40,040 Odel Ltd 1,200 26,040 26,400
Carrying Amount as at 31st March 524,761
528,757
Market Value as at 31st March 524,761
528,757
14.2 Non-Quoted Equity Investment
Tropic Fishery (Pvt) Ltd
Balance at the end of the year 9,800,000
9,800,000
9,800,000
9,800,000
15. INVENTORIES
Packing Materials 2,210,291
2,518,484
Fish -
3,117,068
2,210,291
5,635,552
16. TRADE & OTHER RECEIVABLES
Debtors and Receivables 121,702,322
143,714,793
Staff Loans 41,625
367,982
Salary Advance -
7,500
Insurance Claim -
258,832
121,743,947
144,349,107
Annual Report
37
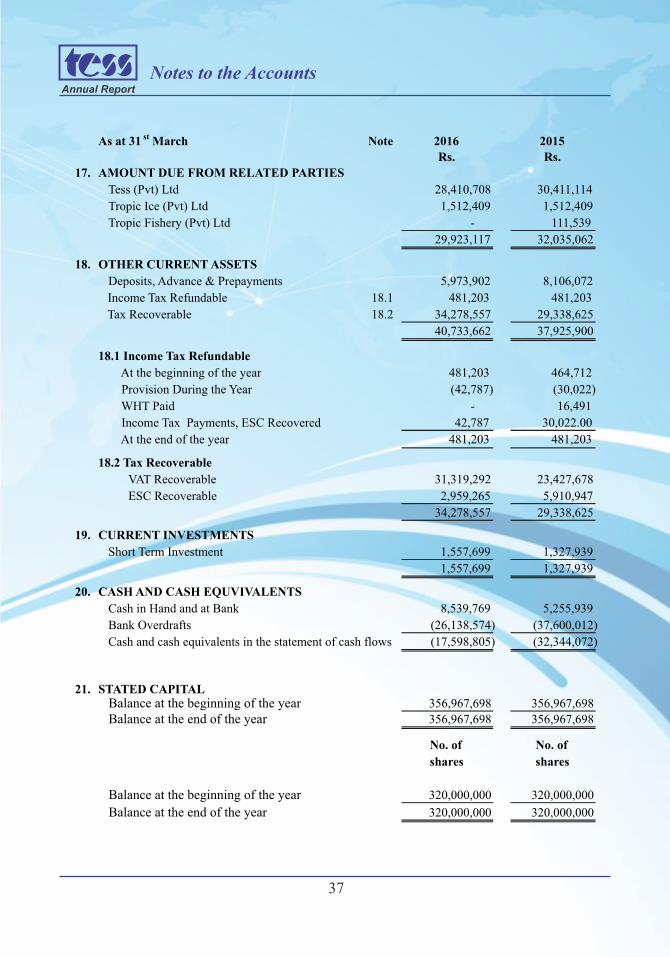
Notes to the Accounts
As at 31 st March Note 2016 2015
Rs. Rs.
17. AMOUNT DUE FROM RELATED PARTIES
Tess (Pvt) Ltd 28,410,708
30,411,114
Tropic Ice (Pvt) Ltd 1,512,409
1,512,409
Tropic Fishery (Pvt) Ltd -
111,539
29,923,117
32,035,062
18. OTHER CURRENT ASSETS
Deposits, Advance & Prepayments 5,973,902
8,106,072
Income Tax Refundable 18.1 481,203
481,203
Tax Recoverable 18.2 34,278,557
29,338,625
40,733,662
37,925,900
18.1 Income Tax Refundable
At the beginning of the year 481,203
464,712
Provision During the Year (42,787)
(30,022)
WHT Paid -
16,491
Income Tax Payments, ESC Recovered 42,787
30,022.00
At the end of the year 481,203
481,203
18.2 Tax Recoverable
VAT Recoverable 31,319,292 23,427,678 ESC Recoverable 2,959,265 5,910,947
34,278,557
29,338,625
19. CURRENT INVESTMENTS
Short Term Investment 1,557,699
1,327,939 1,557,699
1,327,939
20. CASH AND CASH EQUVIVALENTS
Cash in Hand and at Bank 8,539,769
5,255,939
Bank Overdrafts (26,138,574)
(37,600,012)
Cash and cash equivalents in the statement of cash flows (17,598,805)
(32,344,072)
STATED CAPITAL21.
Balance at the end of the year356,967,698
356,967,698
356,967,698
356,967,698
No. of No. of
shares shares
Balance at the beginning of the year 320,000,000
320,000,000
320,000,000
320,000,000
Balance at the beginning of the year
Balance at the end of the year
Annual Report
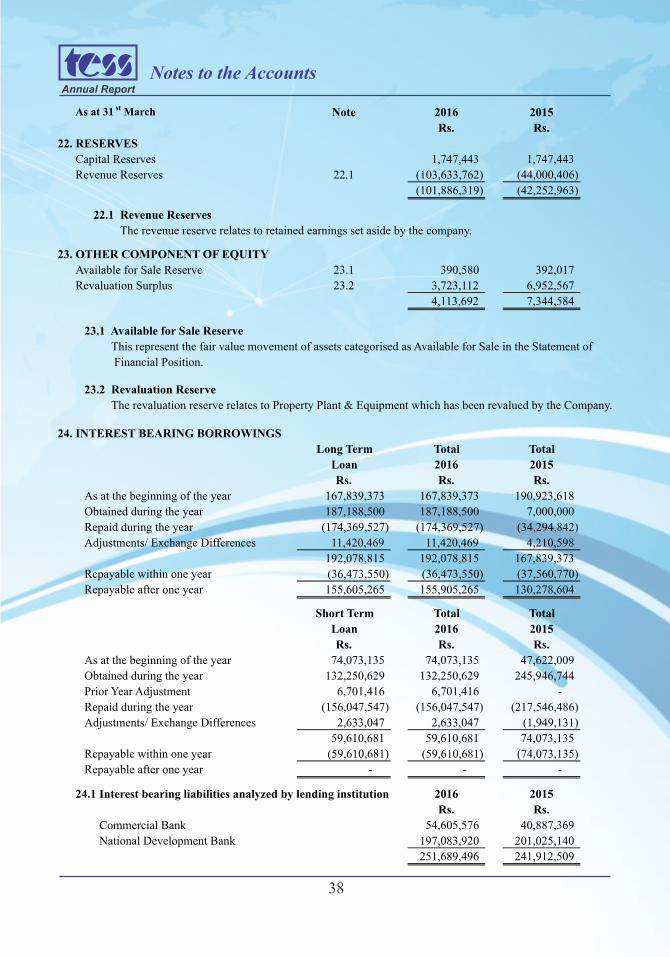
38
Notes to the Accounts
As at 31 st March Note 2016 2015
Rs. Rs.
22. RESERVES
Capital Reserves 1,747,443 1,747,443
Revenue Reserves 22.1 (103,633,762) (44,000,406)
(101,886,319)
(42,252,963)
22.1 Revenue Reserves
The revenue reserve relates to retained earnings set aside by the company.
23. OTHER COMPONENT OF EQUITY
Available for Sale Reserve 23.1 390,580
392,017
Revaluation Surplus 23.2 3,723,112
6,952,567
4,113,692
7,344,584
23.1 Available for Sale Reserve
This represent the fair value movement of assets categorised as Available for Sale in the Statement of
Financial Position.
23.2 Revaluation Reserve
The revaluation reserve relates to Property Plant & Equipment which has been revalued by the Company.
24. INTEREST BEARING BORROWINGS
Long Term Total Total
Loan 2016 2015
Rs. Rs. Rs.
As at the beginning of the year 167,839,373 167,839,373 190,923,618 Obtained during the year 187,188,500
187,188,500
7,000,000
Repaid during the year (174,369,527)
(174,369,527)
(34,294,842)
Adjustments/ Exchange Differences 11,420,469
11,420,469
4,210,598
192,078,815
192,078,815
167,839,373
Repayable within one year (36,473,550)
(36,473,550)
(37,560,770)
Repayable after one year 155,605,265
155,905,265
130,278,604
Short Term Total Total
Loan 2016 2015
Rs. Rs. Rs.
As at the beginning of the year 74,073,135
74,073,135
47,622,009
Obtained during the year 132,250,629
132,250,629
245,946,744
Prior Year Adjustment 6,701,416
6,701,416
-
Repaid during the year (156,047,547)
(156,047,547)
(217,546,486)
Adjustments/ Exchange Differences 2,633,047
2,633,047
(1,949,131)
59,610,681
59,610,681
74,073,135
Repayable within one year (59,610,681)
(59,610,681)
(74,073,135)
Repayable after one year -
-
-
24.1 Interest bearing liabilities analyzed by lending institution 2016 2015
Rs. Rs.
Commercial Bank 54,605,576 40,887,369
National Development Bank 197,083,920 201,025,140
251,689,496 241,912,509
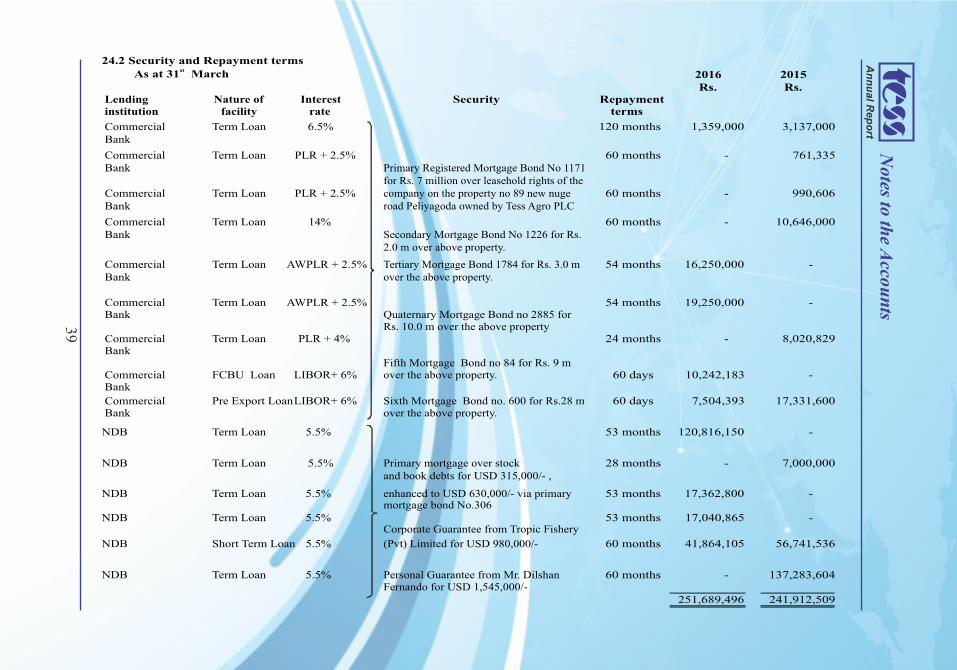
24.2 Security and Repayment termsst As at 31 March 2016 2015
Rs. Rs.Lending Nature of Interest Repaymentinstitution facility rate terms
Commercial Term Loan 6.5% 120 months 1,359,000 3,137,000Bank
Commercial Term Loan PLR + 2.5% 60 months -
761,335
Bank Primary Registered Mortgage Bond No 1171for Rs. 7 million over leasehold rights of the
Commercial Term Loan PLR + 2.5% company on the property no 89 new nuge 60 months -
990,606
Bank road Peliyagoda owned by Tess Agro PLC
Commercial Term Loan 14% 60 months -
10,646,000
Bank Secondary Mortgage Bond No 1226 for Rs. 2.0 m over above property.
Commercial Term Loan AWPLR + 2.5% Tertiary Mortgage Bond 1784 for Rs. 3.0 m 54 months 16,250,000
-
Bank over the above property.
Commercial Term Loan AWPLR + 2.5% 54 months 19,250,000
-
Bank Quaternary Mortgage Bond no 2885 for Rs. 10.0 m over the above property
Commercial Term Loan PLR + 4% 24 months - 8,020,829
BankFifth Mortgage Bond no 84 for Rs. 9 m
Commercial FCBU Loan LIBOR+ 6% over the above property. 60 days 10,242,183
-
Bank
Commercial Pre Export LoanLIBOR+ 6% Sixth Mortgage Bond no. 600 for Rs.28 m 60 days 7,504,393
17,331,600
Bank over the above property.
NDB Term Loan 5.5% 53 months 120,816,150
-
NDB Term Loan 5.5% Primary mortgage over stock 28 months -
7,000,000
and book debts for USD 315,000/- ,
NDB Term Loan 5.5% enhanced to USD 630,000/- via primary 53 months 17,362,800
-
mortgage bond No.306NDB Term Loan 5.5% 53 months 17,040,865
-
Corporate Guarantee from Tropic Fishery
NDB Short Term Loan 5.5% (Pvt) Limited for USD 980,000/- 60 months 41,864,105 56,741,536
NDB Term Loan 5.5% Personal Guarantee from Mr. Dilshan 60 months - 137,283,604Fernando for USD 1,545,000/-
251,689,496 241,912,509
Security
39
An
nu
al R
ep
ort
Notes to th
e Accou
nts
Annual Report
40
Notes to the Accounts
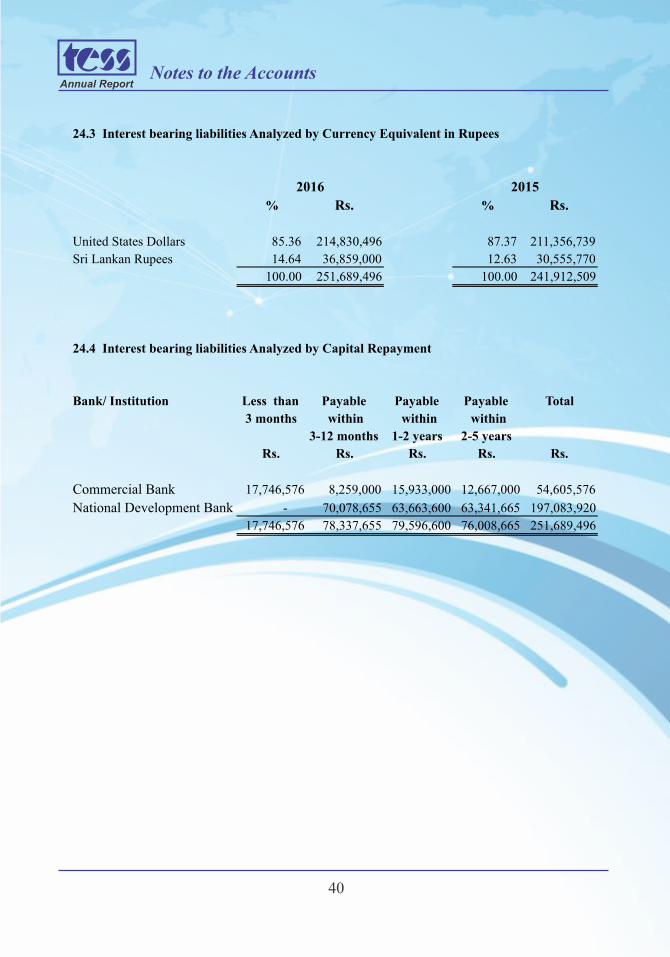
24.3 Interest bearing liabilities Analyzed by Currency Equivalent in Rupees
% Rs. % Rs.
United States Dollars 85.36
214,830,496
87.37
211,356,739
Sri Lankan Rupees 14.64
36,859,000
12.63
30,555,770
100.00
251,689,496
100.00
241,912,509
24.4 Interest bearing liabilities Analyzed by Capital Repayment
Bank/ Institution Less than Payable Payable Payable Total
3 months within within within
3-12 months 1-2 years 2-5 years
Rs. Rs. Rs. Rs. Rs.
Commercial Bank 17,746,576
8,259,000
15,933,000
12,667,000
54,605,576
National Development Bank -
70,078,655
63,663,600
63,341,665
197,083,920
17,746,576
78,337,655
79,596,600
76,008,665
251,689,496
2016 2015
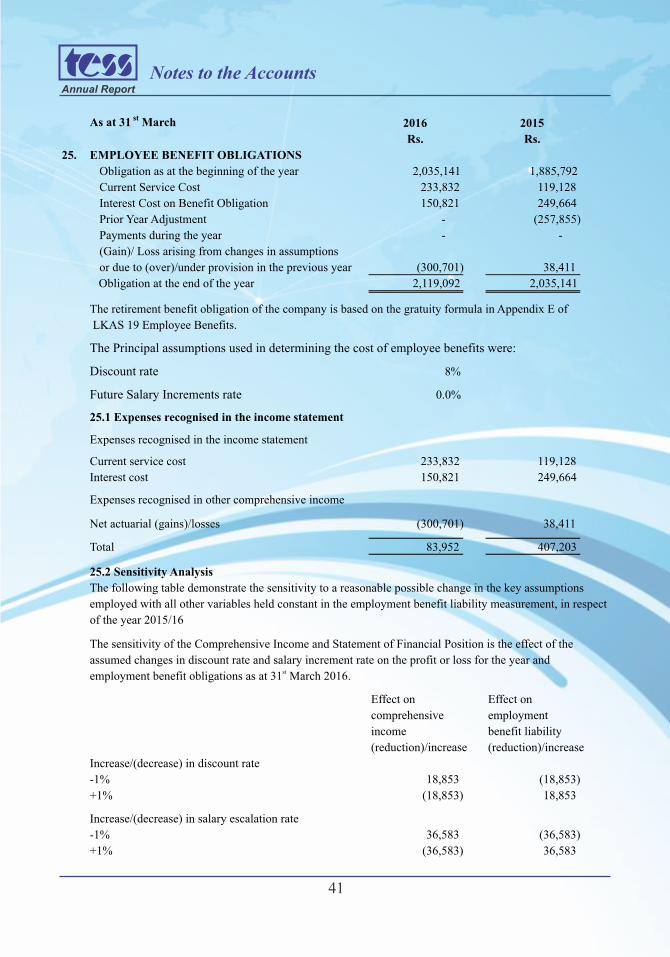
Annual Report
41
Notes to the Accounts
As at 31 st March 2016 2015
Rs. Rs.
25. EMPLOYEE BENEFIT OBLIGATIONS
Obligation as at the beginning of the year 2,035,141
1,885,792
Current Service Cost 233,832
119,128
Interest Cost on Benefit Obligation 150,821
249,664
Prior Year Adjustment -
(257,855)
Payments during the year -
-
(Gain)/ Loss arising from changes in assumptions
or due to (over)/under provision in the previous year (300,701)
38,411
Obligation at the end of the year 2,119,092
2,035,141
The retirement benefit obligation of the company is based on the gratuity formula in Appendix E of
LKAS 19 Employee Benefits.
The Principal assumptions used in determining the cost of employee benefits were:
Discount rate 8%
Future Salary Increments rate 0.0%
25.1 Expenses recognised in the income statement
Expenses recognised in the income statement
Current service cost 233,832 119,128
Interest cost 150,821 249,664
Expenses recognised in other comprehensive income
Net actuarial (gains)/losses (300,701)
38,411
Total 83,952
407,203
25.2 Sensitivity Analysis
The following table demonstrate the sensitivity to a reasonable possible change in the key assumptions
employed with all other variables held constant in the employment benefit liability measurement, in respect
of the year 2015/16
The sensitivity of the Comprehensive Income and Statement of Financial Position is the effect of the
assumed changes in discount rate and salary increment rate on the profit or loss for the year and stemployment benefit obligations as at 31 March 2016.
Effect on Effect on
comprehensive employment
income benefit liability
(reduction)/increase (reduction)/increase
Increase/(decrease) in discount rate
-1% 18,853
(18,853)
+1% (18,853) 18,853
Increase/(decrease) in salary escalation rate
-1% 36,583 (36,583)
+1% (36,583) 36,583
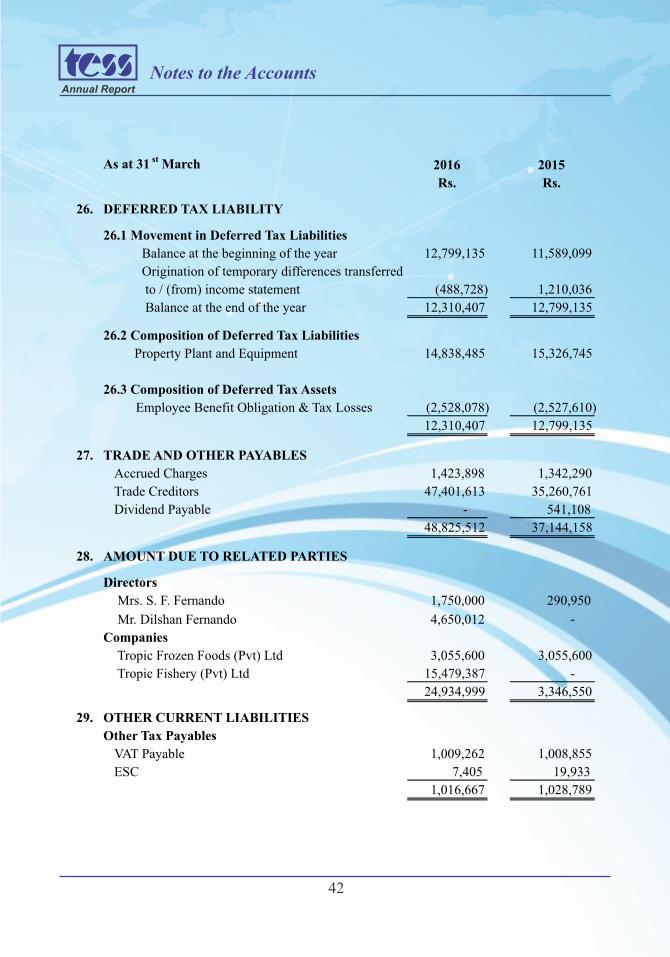
Annual Report
42
Notes to the Accounts
As at 31 st March 2016 2015
Rs. Rs.
26. DEFERRED TAX LIABILITY
26.1 Movement in Deferred Tax Liabilities
Balance at the beginning of the year 12,799,135
11,589,099
Origination of temporary differences transferred
to / (from) income statement (488,728)
1,210,036
Balance at the end of the year 12,310,407
12,799,135
26.2 Composition of Deferred Tax Liabilities
Property Plant and Equipment 14,838,485
15,326,745
26.3 Composition of Deferred Tax Assets
Employee Benefit Obligation & Tax Losses (2,528,078)
(2,527,610)
12,310,407 12,799,135
27. TRADE AND OTHER PAYABLES
Accrued Charges 1,423,898 1,342,290 Trade Creditors 47,401,613 35,260,761 Dividend Payable - 541,108
48,825,512 37,144,158
28. AMOUNT DUE TO RELATED PARTIES
Directors
Mrs. S. F. Fernando 1,750,000
290,950 Mr. Dilshan Fernando 4,650,012
Companies
Tropic Frozen Foods (Pvt) Ltd 3,055,600
3,055,600
Tropic Fishery (Pvt) Ltd 15,479,387
-
-
24,934,999
3,346,550
29. OTHER CURRENT LIABILITIES
Other Tax Payables
VAT Payable 1,009,262
1,008,855
ESC 7,405
19,933
1,016,667
1,028,789
Annual Report
43
Notes to the Accounts
30. RELATED PARTY TRANSACTIONS
The company carries out transaction in the ordinary course of business with parties who are
defined as related parties as per Sri Lanka Accounting Standard LKAS 24 – Related Party Disclosures.
30.1 Parent and ultimate controlling party
Company does not have an identifiable parent of its own.
30.2 Transaction with key management personnel
The company considers its board of directors as the key management personnel.
There were no loans given to directors of the company during the financial year or
as at the year end.
Compensation paid to/ on behalf of key management personnel of the company as follows.
Rs.
Short term employee benefits 4,140,000
No post employment benefits were paid to key management personnel of the company during the
year. The company did not have any material transactions with its key management personnel or the
close family members during the year.
Mrs. S.F. Frenando Chairperson of the company is also Director of the Tess (Pvt) Ltd,
Tropic Fishery (Pvt) Ltd & Tropic Frozen Foods (Pvt) Ltd.
Mr. S. Fernando a Director of company is also a Director of the Tess (Pvt) Ltd,
Tropic Fishery (Pvt) Ltd & Tropic Frozen Foods (Pvt) Ltd.
Mr. D. Fernando a Director / CEO of the company is also a Director of the Tess (Pvt) Ltd,
Tropic Fishery (Pvt) Ltd & Tropic Frozen Foods (Pvt) Ltd.
Mr. R. Fernando a Director of the company is also a Director of the Tess (Pvt) Ltd,
Tropic Fishery (Pvt) Ltd & Tropic Frozen Foods (Pvt) Ltd.
Transaction carried out by the company with those companies which mentioned above are
disclosed in note no. 17 & 28.
Details of transaction carried out by the company with related parties & outstanding balances
with the related parties are given in note no. 30.3.
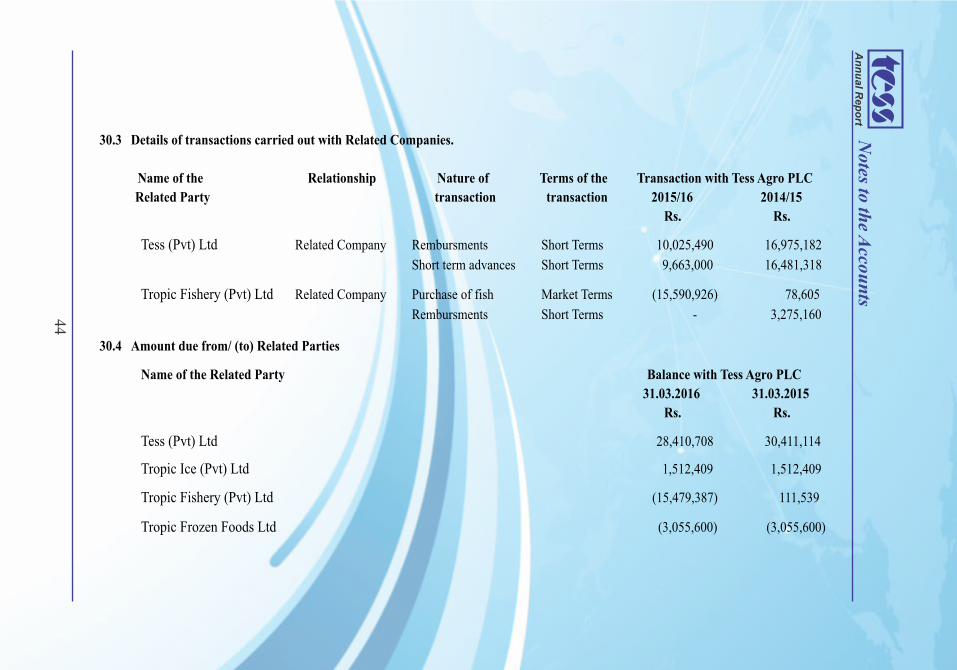
An
nu
al R
ep
ort
44
Notes to th
e Accou
nts
30.3 Details of transactions carried out with Related Companies.
Name of the Relationship Nature of Terms of the
Related Party transaction transaction 2015/16 2014/15
Rs. Rs.
Tess (Pvt) Ltd Related Company Rembursments Short Terms 10,025,490 16,975,182
Short term advances Short Terms 9,663,000 16,481,318
Tropic Fishery (Pvt) Ltd Related Company Purchase of fish Market Terms (15,590,926) 78,605
Rembursments Short Terms - 3,275,160
30.4 Amount due from/ (to) Related Parties
Name of the Related Party
31.03.2016 31.03.2015
Rs. Rs.
Tess (Pvt) Ltd 28,410,708 30,411,114
Tropic Ice (Pvt) Ltd 1,512,409 1,512,409
Tropic Fishery (Pvt) Ltd (15,479,387) 111,539
Tropic Frozen Foods Ltd (3,055,600)
(3,055,600)
Transaction with Tess Agro PLC
Balance with Tess Agro PLC
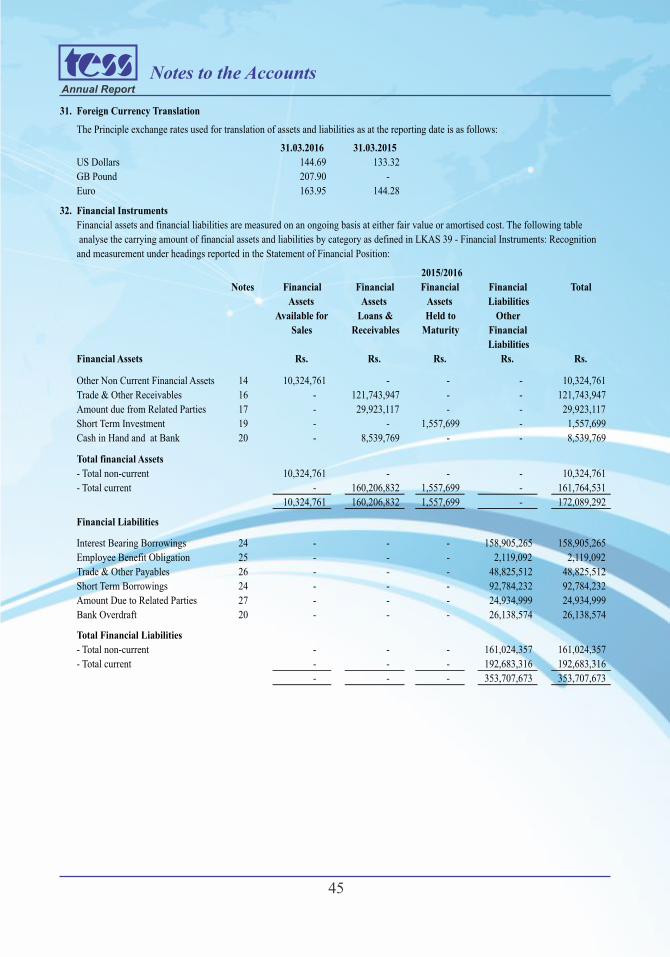
Annual Report
45
Notes to the Accounts
31. Foreign Currency Translation
The Principle exchange rates used for translation of assets and liabilities as at the reporting date is as follows:
31.03.2016 31.03.2015
US Dollars 144.69
133.32
GB Pound 207.90
-
Euro 163.95
144.28
32. Financial Instruments
Financial assets and financial liabilities are measured on an ongoing basis at either fair value or amortised cost. The following table
analyse the carrying amount of financial assets and liabilities by category as defined in LKAS 39 - Financial Instruments: Recognition
and measurement under headings reported in the Statement of Financial Position:
Notes Financial Financial Financial Financial Total
Assets Assets Assets Liabilities
Available for Loans & Held to Other
Sales Receivables Maturity Financial
Liabilities
Financial Assets Rs. Rs. Rs. Rs. Rs.
Other Non Current Financial Assets 14 10,324,761
-
-
-
10,324,761
Trade & Other Receivables 16 -
121,743,947
-
-
121,743,947
Amount due from Related Parties 17 -
29,923,117
-
-
29,923,117
Short Term Investment 19 -
-
1,557,699
-
1,557,699
Cash in Hand and at Bank 20 -
8,539,769
-
-
8,539,769
Total financial Assets
- Total non-current 10,324,761
-
-
-
10,324,761
- Total current -
160,206,832
1,557,699
-
161,764,531
10,324,761
160,206,832
1,557,699
-
172,089,292
Financial Liabilities
Interest Bearing Borrowings 24 -
-
-
158,905,265
158,905,265
Employee Benefit Obligation 25 -
-
-
2,119,092
2,119,092
Trade & Other Payables 26 -
-
-
48,825,512
48,825,512
Short Term Borrowings 24 -
-
-
92,784,232
92,784,232
Amount Due to Related Parties 27 -
-
-
24,934,999
24,934,999
Bank Overdraft 20 -
-
-
26,138,574
26,138,574
Total Financial Liabilities
- Total non-current -
-
-
161,024,357
161,024,357
- Total current - - - 192,683,316 192,683,316
- - - 353,707,673 353,707,673
2015/2016
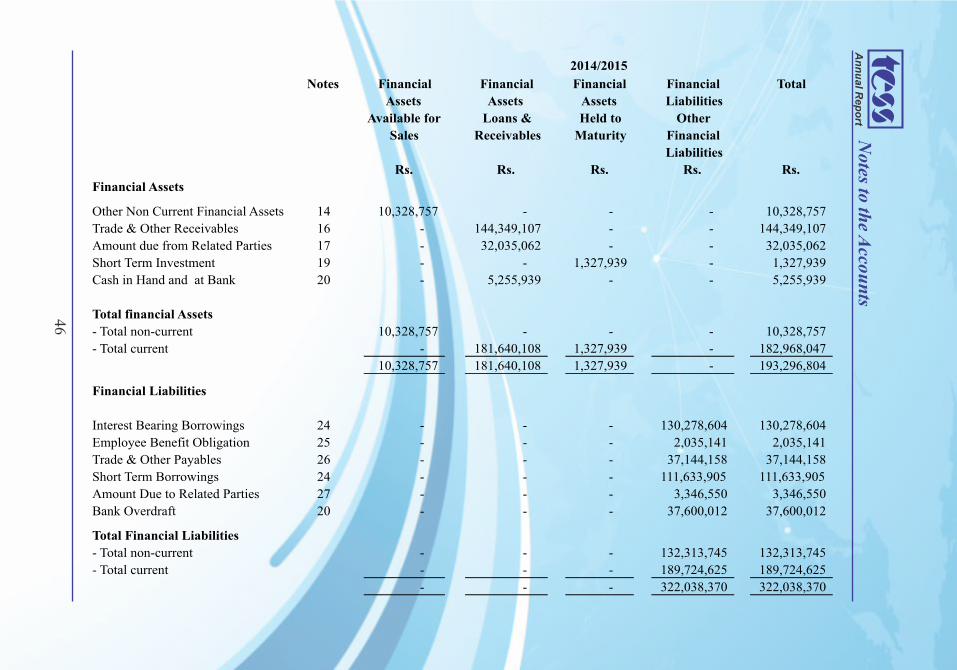
An
nu
al R
ep
ort
46
Notes to th
e Accou
nts
Notes Financial Financial Financial Financial Total
Assets Assets Assets Liabilities
Available for Loans & Held to Other
Sales Receivables Maturity Financial
Liabilities
Rs. Rs. Rs. Rs. Rs.
Financial Assets
Other Non Current Financial Assets 14 10,328,757
-
-
-
10,328,757
Trade & Other Receivables 16 -
144,349,107
-
-
144,349,107
Amount due from Related Parties 17 -
32,035,062
-
-
32,035,062
Short Term Investment 19 -
-
1,327,939
-
1,327,939
Cash in Hand and at Bank 20 -
5,255,939
-
-
5,255,939
Total financial Assets
- Total non-current 10,328,757 - - - 10,328,757 - Total current - 181,640,108 1,327,939 - 182,968,047
10,328,757
181,640,108
1,327,939
-
193,296,804
Financial Liabilities
Interest Bearing Borrowings 24 -
-
-
130,278,604
130,278,604
Employee Benefit Obligation 25 -
-
-
2,035,141
2,035,141
Trade & Other Payables 26 -
-
-
37,144,158
37,144,158
Short Term Borrowings 24 -
-
-
111,633,905
111,633,905
Amount Due to Related Parties 27 -
-
-
3,346,550
3,346,550
Bank Overdraft 20 -
-
-
37,600,012
37,600,012
Total Financial Liabilities
- Total non-current - - - 132,313,745 132,313,745
- Total current - - - 189,724,625 189,724,625
- - - 322,038,370 322,038,370
2014/2015
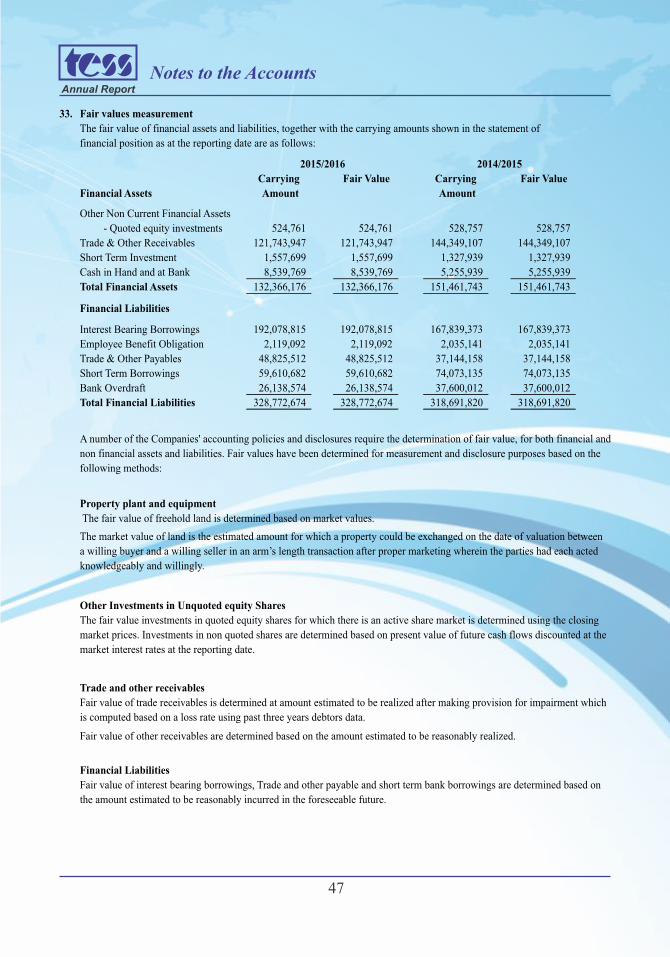
Annual Report
47
Notes to the Accounts
33. Fair values measurement
The fair value of financial assets and liabilities, together with the carrying amounts shown in the statement of
financial position as at the reporting date are as follows:
Carrying Fair Value Carrying Fair Value
Financial Assets Amount Amount
Other Non Current Financial Assets
- Quoted equity investments 524,761
524,761
528,757
528,757
Trade & Other Receivables 121,743,947
121,743,947
144,349,107
144,349,107
Short Term Investment 1,557,699 1,557,699 1,327,939 1,327,939
Cash in Hand and at Bank 8,539,769 8,539,769 5,255,939 5,255,939
Total Financial Assets 132,366,176
132,366,176
151,461,743
151,461,743
Financial Liabilities
Interest Bearing Borrowings 192,078,815
192,078,815
167,839,373
167,839,373
Employee Benefit Obligation 2,119,092
2,119,092
2,035,141
2,035,141
Trade & Other Payables 48,825,512
48,825,512
37,144,158
37,144,158
Short Term Borrowings 59,610,682
59,610,682
74,073,135
74,073,135
Bank Overdraft 26,138,574
26,138,574
37,600,012
37,600,012
Total Financial Liabilities 328,772,674
328,772,674
318,691,820
318,691,820
A number of the Companies' accounting policies and disclosures require the determination of fair value, for both financial and
non financial assets and liabilities. Fair values have been determined for measurement and disclosure purposes based on the
following methods:
Property plant and equipment
The fair value of freehold land is determined based on market values.
The market value of land is the estimated amount for which a property could be exchanged on the date of valuation between
a willing buyer and a willing seller in an arm’s length transaction after proper marketing wherein the parties had each acted
knowledgeably and willingly.
Other Investments in Unquoted equity Shares
The fair value investments in quoted equity shares for which there is an active share market is determined using the closing
market prices. Investments in non quoted shares are determined based on present value of future cash flows discounted at the
market interest rates at the reporting date.
Trade and other receivables
Fair value of trade receivables is determined at amount estimated to be realized after making provision for impairment which
is computed based on a loss rate using past three years debtors data.
Fair value of other receivables are determined based on the amount estimated to be reasonably realized.
Financial Liabilities
Fair value of interest bearing borrowings, Trade and other payable and short term bank borrowings are determined based on
the amount estimated to be reasonably incurred in the foreseeable future.
2015/2016 2014/2015
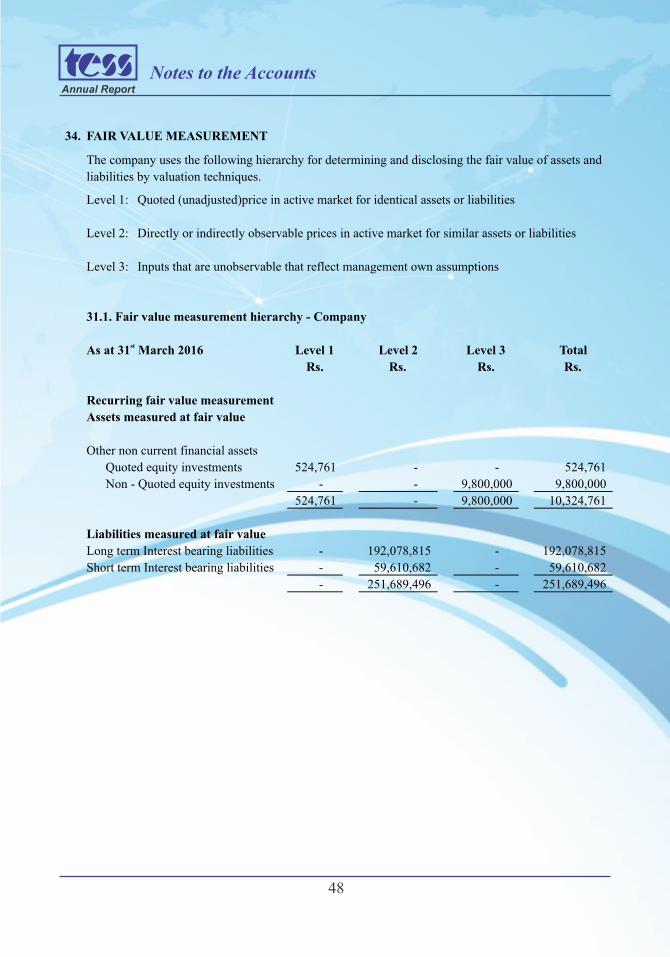
Annual Report
48
Notes to the Accounts
34. FAIR VALUE MEASUREMENT
The company uses the following hierarchy for determining and disclosing the fair value of assets and
liabilities by valuation techniques.
Level 1: Quoted (unadjusted)price in active market for identical assets or liabilities
Level 2: Directly or indirectly observable prices in active market for similar assets or liabilities
Level 3: Inputs that are unobservable that reflect management own assumptions
31.1. Fair value measurement hierarchy - Company
stAs at 31 March 2016 Level 1 Level 2 Level 3 Total
Rs. Rs. Rs. Rs.
Recurring fair value measurement
Assets measured at fair value
Other non current financial assets
Quoted equity investments 524,761
-
-
524,761
Non - Quoted equity investments -
-
9,800,000
9,800,000
524,761
-
9,800,000
10,324,761
Liabilities measured at fair value
Long term Interest bearing liabilities - -
192,078,815
192,078,815
Short term Interest bearing liabilities - -
59,610,682
59,610,682
-
251,689,496
-
251,689,496
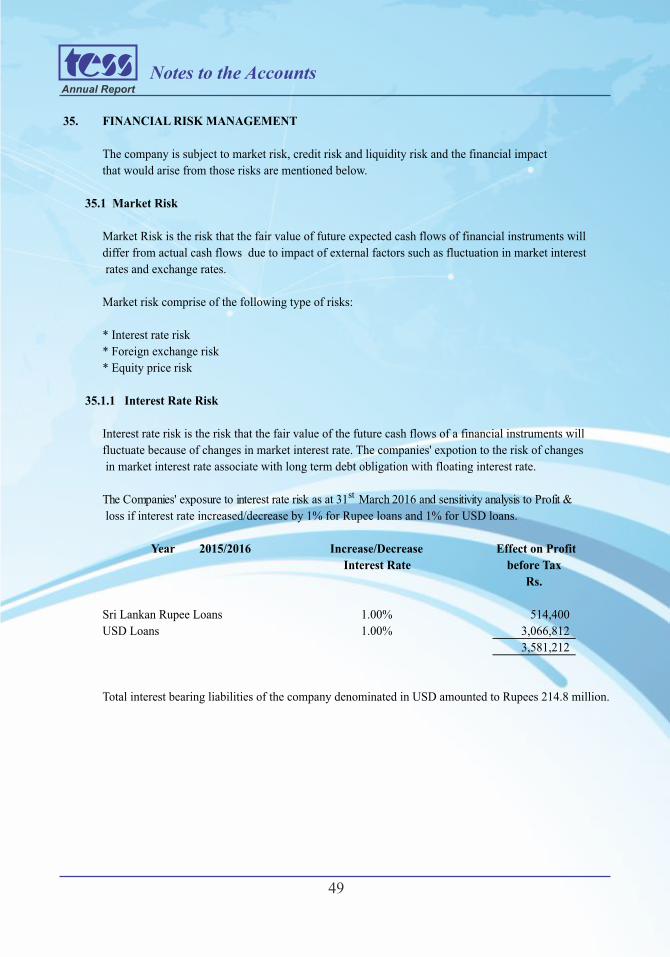
Annual Report
49
Notes to the Accounts
35. FINANCIAL RISK MANAGEMENT
The company is subject to market risk, credit risk and liquidity risk and the financial impact
that would arise from those risks are mentioned below.
35.1 Market Risk
Market Risk is the risk that the fair value of future expected cash flows of financial instruments will
differ from actual cash flows due to impact of external factors such as fluctuation in market interest
rates and exchange rates.
Market risk comprise of the following type of risks:
* Interest rate risk
* Foreign exchange risk
* Equity price risk
35.1.1 Interest Rate Risk
Interest rate risk is the risk that the fair value of the future cash flows of a financial instruments will
fluctuate because of changes in market interest rate. The companies' expotion to the risk of changes
in market interest rate associate with long term debt obligation with floating interest rate.
loss if interest rate increased/decrease by 1% for Rupee loans and 1% for USD loans.
Year 2015/2016 Increase/Decrease Effect on Profit
Interest Rate before Tax
Rs.
Sri Lankan Rupee Loans 1.00% 514,400
USD Loans 1.00% 3,066,812
3,581,212
Total interest bearing liabilities of the company denominated in USD amounted to Rupees 214.8 million.
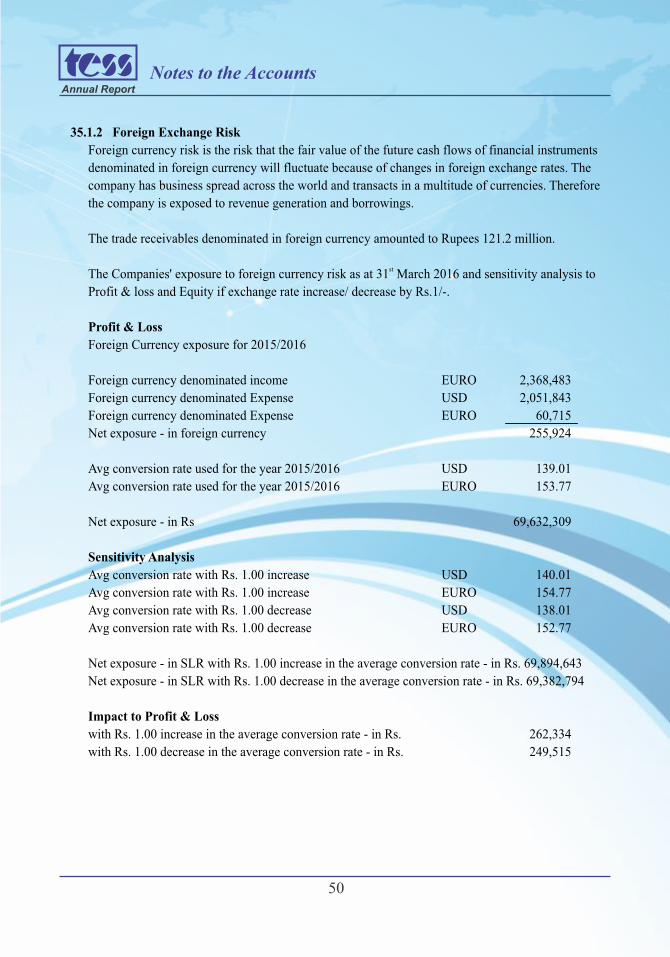
Annual Report
50
Notes to the Accounts
35.1.2 Foreign Exchange Risk
Foreign currency risk is the risk that the fair value of the future cash flows of financial instruments
denominated in foreign currency will fluctuate because of changes in foreign exchange rates. The
company has business spread across the world and transacts in a multitude of currencies. Therefore
the company is exposed to revenue generation and borrowings.
The trade receivables denominated in foreign currency amounted to Rupees 121.2 million.
stThe Companies' exposure to foreign currency risk as at 31 March 2016 and sensitivity analysis to
Profit & loss and Equity if exchange rate increase/ decrease by Rs.1/-.
Profit & Loss
Foreign Currency exposure for 2015/2016
Foreign currency denominated income EURO 2,368,483
Foreign currency denominated Expense USD 2,051,843
Foreign currency denominated Expense EURO 60,715
Net exposure - in foreign currency 255,924
Avg conversion rate used for the year 2015/2016 USD 139.01 Avg conversion rate used for the year 2015/2016 EURO 153.77
Net exposure - in Rs 69,632,309
Sensitivity Analysis
Avg conversion rate with Rs. 1.00 increase USD 140.01
Avg conversion rate with Rs. 1.00 increase EURO 154.77
Avg conversion rate with Rs. 1.00 decrease USD 138.01
Avg conversion rate with Rs. 1.00 decrease EURO 152.77
Net exposure - in SLR with Rs. 1.00 increase in the average conversion rate - in Rs. 69,894,643
Net exposure - in SLR with Rs. 1.00 decrease in the average conversion rate - in Rs. 69,382,794
Impact to Profit & Loss
with Rs. 1.00 increase in the average conversion rate - in Rs. 262,334
with Rs. 1.00 decrease in the average conversion rate - in Rs. 249,515
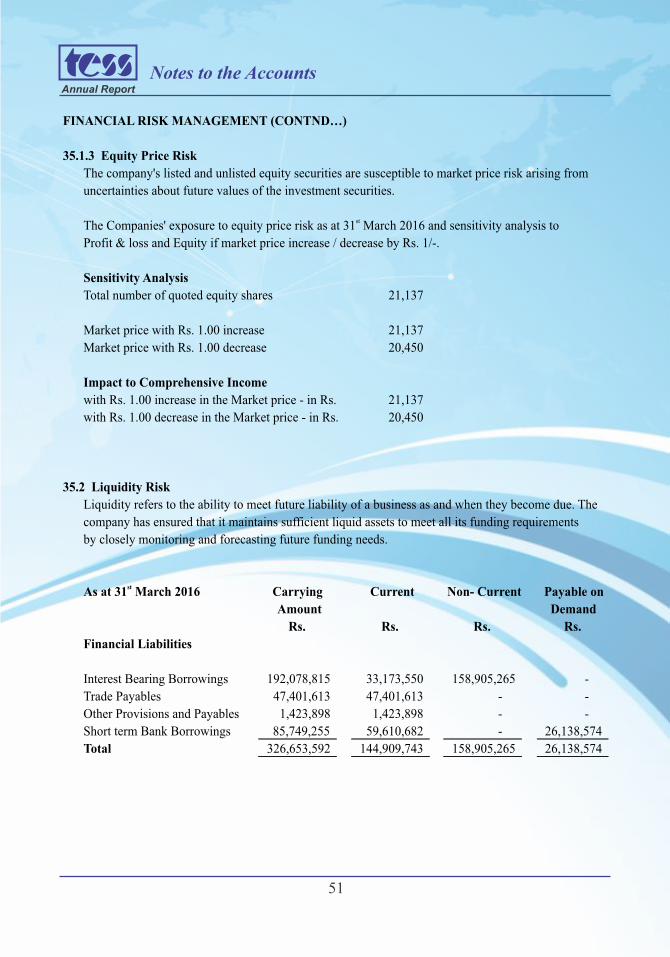
Annual Report
51
Notes to the Accounts
FINANCIAL RISK MANAGEMENT (CONTND…)
35.1.3 Equity Price Risk
The company's listed and unlisted equity securities are susceptible to market price risk arising from
uncertainties about future values of the investment securities.
stThe Companies' exposure to equity price risk as at 31 March 2016 and sensitivity analysis to
Profit & loss and Equity if market price increase / decrease by Rs. 1/-.
Sensitivity Analysis
Total number of quoted equity shares 21,137
Market price with Rs. 1.00 increase 21,137
Market price with Rs. 1.00 decrease 20,450
Impact to Comprehensive Income
with Rs. 1.00 increase in the Market price - in Rs. 21,137
with Rs. 1.00 decrease in the Market price - in Rs. 20,450
35.2 Liquidity Risk
Liquidity refers to the ability to meet future liability of a business as and when they become due. The
company has ensured that it maintains sufficient liquid assets to meet all its funding requirements
by closely monitoring and forecasting future funding needs.
stAs at 31 March 2016 Carrying Current Non- Current Payable on
Amount Demand
Rs. Rs. Rs. Rs.
Financial Liabilities
Interest Bearing Borrowings 192,078,815
33,173,550
158,905,265
-
Trade Payables 47,401,613
47,401,613
-
-
Other Provisions and Payables 1,423,898
1,423,898
-
-
Short term Bank Borrowings 85,749,255
59,610,682
-
26,138,574
Total 326,653,592
144,909,743
158,905,265
26,138,574
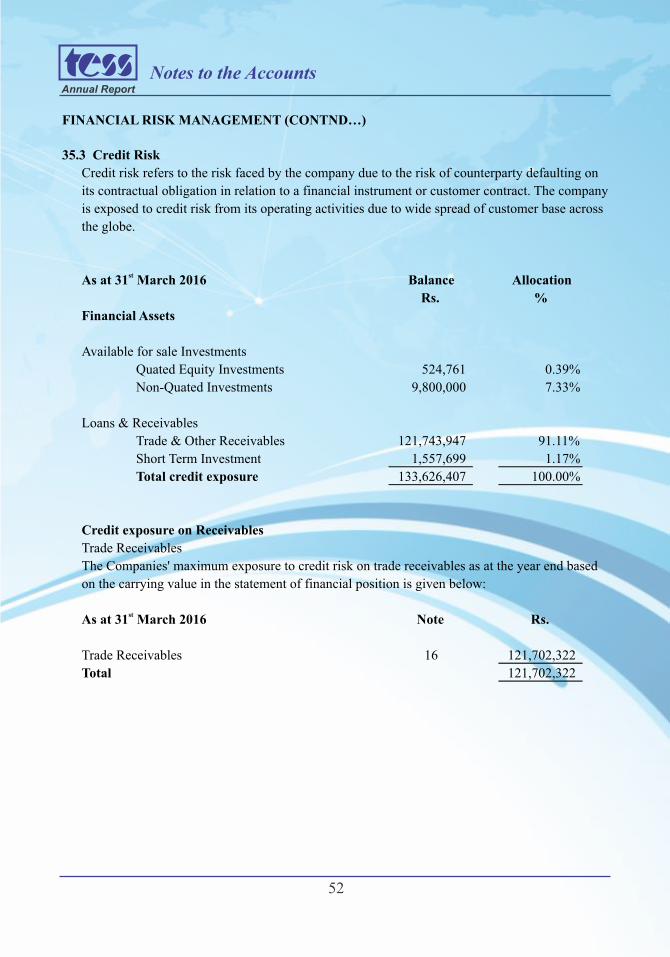
Annual Report
52
Notes to the Accounts
FINANCIAL RISK MANAGEMENT (CONTND…)
35.3 Credit Risk
Credit risk refers to the risk faced by the company due to the risk of counterparty defaulting on
its contractual obligation in relation to a financial instrument or customer contract. The company
is exposed to credit risk from its operating activities due to wide spread of customer base across
the globe.
stAs at 31 March 2016 Balance Allocation
Rs. %
Financial Assets
Available for sale Investments
Quated Equity Investments 524,761 0.39%
Non-Quated Investments 9,800,000 7.33%
Loans & Receivables
Trade & Other Receivables 121,743,947
91.11%
Short Term Investment 1,557,699
1.17%
Total credit exposure 133,626,407
100.00%
Credit exposure on Receivables
Trade Receivables
The Companies' maximum exposure to credit risk on trade receivables as at the year end based
on the carrying value in the statement of financial position is given below:
stAs at 31 March 2016 Note Rs.
Trade Receivables 16 121,702,322
Total 121,702,322
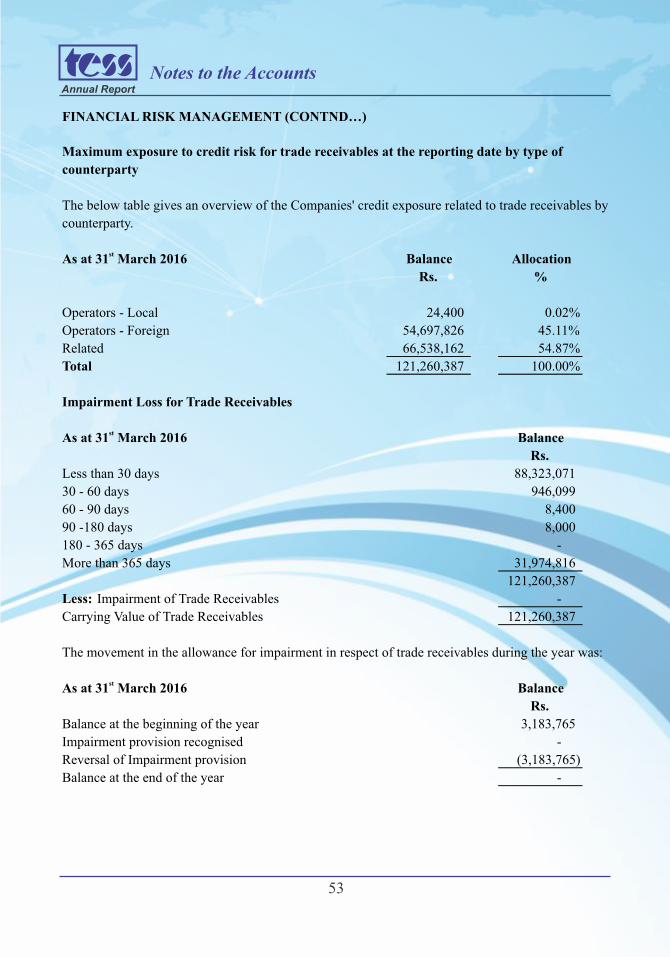
Annual Report
53
Notes to the Accounts
FINANCIAL RISK MANAGEMENT (CONTND…)
Maximum exposure to credit risk for trade receivables at the reporting date by type of
counterparty
The below table gives an overview of the Companies' credit exposure related to trade receivables by
counterparty.
stAs at 31 March 2016 Balance Allocation
Rs. %
Operators - Local 24,400
0.02%
Operators - Foreign 54,697,826
45.11%
Related 66,538,162
54.87%
Total 121,260,387
100.00%
Impairment Loss for Trade Receivables
stAs at 31 March 2016 Balance
Rs.
Less than 30 days 88,323,071 30 - 60 days 946,099 60 - 90 days 8,400
90 -180 days 8,000
180 - 365 days - More than 365 days 31,974,816
121,260,387
Less: Impairment of Trade Receivables -
Carrying Value of Trade Receivables 121,260,387
The movement in the allowance for impairment in respect of trade receivables during the year was:
stAs at 31 March 2016 Balance
Rs.
Balance at the beginning of the year 3,183,765
Impairment provision recognised -
Reversal of Impairment provision (3,183,765)
Balance at the end of the year -
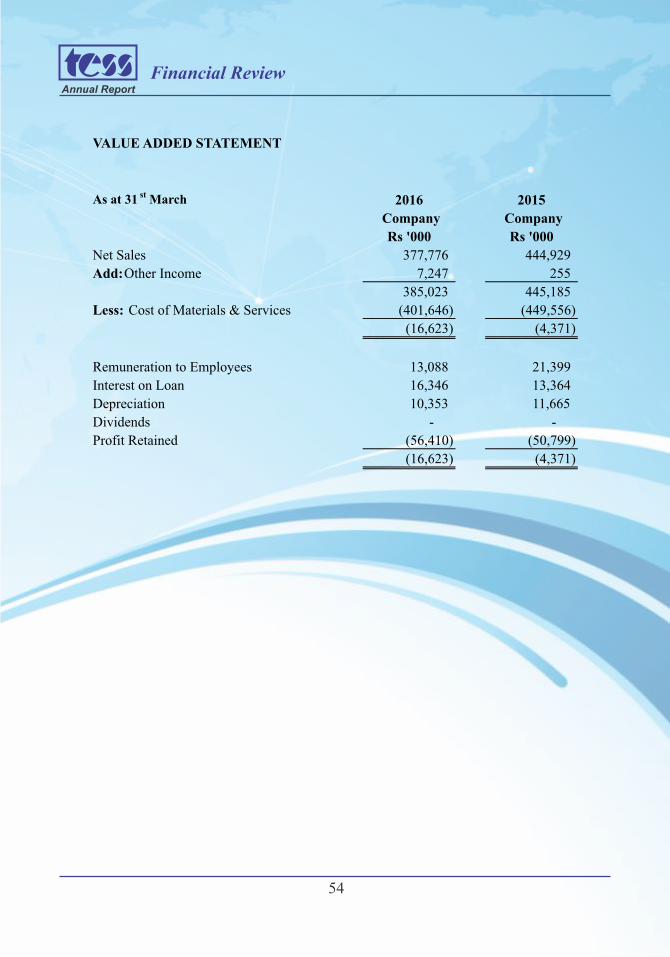
Annual Report
54
Financial Review
VALUE ADDED STATEMENT
As at 31 st March 2016 2015
Company Company
Rs '000 Rs '000
Net Sales 377,776 444,929
Add: Other Income 7,247 255
385,023 445,185 Less: Cost of Materials & Services (401,646) (449,556)
(16,623) (4,371)
Remuneration to Employees 13,088
21,399
Interest on Loan 16,346
13,364 Depreciation 10,353
11,665
Dividends -
- Profit Retained (56,410)
(50,799)
(16,623)
(4,371)
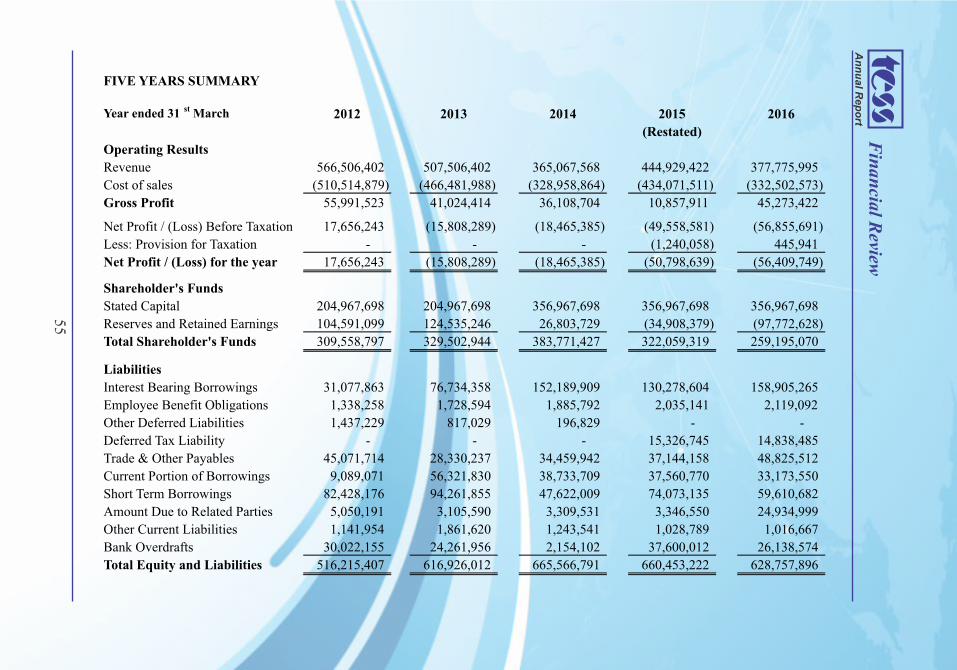
An
nu
al R
ep
ort
55
Fin
ancial R
eview
FIVE YEARS SUMMARY
Year ended 31 st March 2012 2013 2014 2015 2016
(Restated)
Operating Results
Revenue 566,506,402
507,506,402
365,067,568
444,929,422
377,775,995
Cost of sales (510,514,879)
(466,481,988)
(328,958,864)
(434,071,511)
(332,502,573)
Gross Profit 55,991,523
41,024,414
36,108,704
10,857,911
45,273,422
Net Profit / (Loss) Before Taxation 17,656,243
(15,808,289)
(18,465,385)
(49,558,581)
(56,855,691)
Less: Provision for Taxation - - - (1,240,058) 445,941
Net Profit / (Loss) for the year 17,656,243 (15,808,289) (18,465,385) (50,798,639) (56,409,749)
Shareholder's Funds
Stated Capital 204,967,698 204,967,698 356,967,698 356,967,698 356,967,698 Reserves and Retained Earnings 104,591,099
124,535,246
26,803,729
(34,908,379)
(97,772,628)
Total Shareholder's Funds 309,558,797
329,502,944
383,771,427
322,059,319
259,195,070
Liabilities
Interest Bearing Borrowings 31,077,863
76,734,358
152,189,909
130,278,604
158,905,265
Employee Benefit Obligations 1,338,258
1,728,594
1,885,792
2,035,141
2,119,092
Other Deferred Liabilities 1,437,229
817,029
196,829
-
-
Deferred Tax Liability -
-
-
15,326,745
14,838,485
Trade & Other Payables 45,071,714
28,330,237
34,459,942
37,144,158
48,825,512
Current Portion of Borrowings 9,089,071
56,321,830
38,733,709
37,560,770
33,173,550
Short Term Borrowings 82,428,176
94,261,855
47,622,009
74,073,135
59,610,682
Amount Due to Related Parties 5,050,191
3,105,590
3,309,531
3,346,550
24,934,999
Other Current Liabilities 1,141,954
1,861,620
1,243,541
1,028,789
1,016,667
Bank Overdrafts 30,022,155
24,261,956
2,154,102
37,600,012
26,138,574
Total Equity and Liabilities 516,215,407
616,926,012
665,566,791
660,453,222
628,757,896
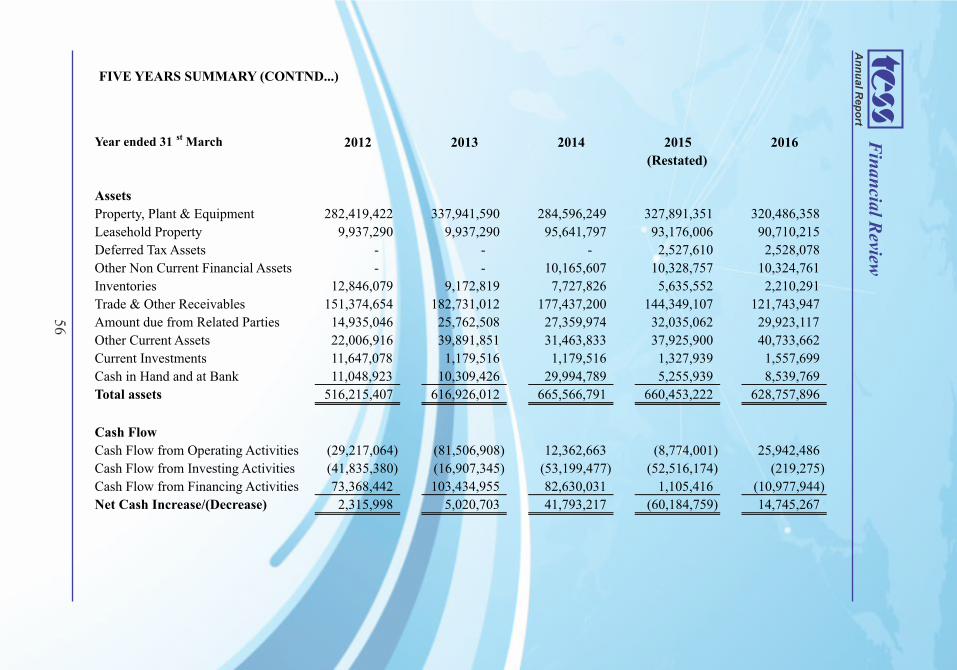
An
nu
al R
ep
ort
56
Fin
ancial R
eview
Year ended 31 st March 2012 2013 2014 2015 2016
(Restated)
Assets
Property, Plant & Equipment 282,419,422 337,941,590 284,596,249 327,891,351 320,486,358
Leasehold Property 9,937,290 9,937,290 95,641,797 93,176,006 90,710,215
Deferred Tax Assets - - - 2,527,610 2,528,078 Other Non Current Financial Assets - - 10,165,607 10,328,757 10,324,761 Inventories 12,846,079 9,172,819 7,727,826 5,635,552 2,210,291 Trade & Other Receivables 151,374,654 182,731,012 177,437,200 144,349,107 121,743,947 Amount due from Related Parties 14,935,046
25,762,508
27,359,974
32,035,062
29,923,117
Other Current Assets 22,006,916
39,891,851
31,463,833
37,925,900
40,733,662 Current Investments 11,647,078
1,179,516
1,179,516
1,327,939
1,557,699 Cash in Hand and at Bank 11,048,923
10,309,426
29,994,789
5,255,939
8,539,769
Total assets 516,215,407
616,926,012
665,566,791
660,453,222
628,757,896
Cash Flow
Cash Flow from Operating Activities (29,217,064)
(81,506,908)
12,362,663
(8,774,001)
25,942,486
Cash Flow from Investing Activities (41,835,380)
(16,907,345)
(53,199,477)
(52,516,174)
(219,275)
Cash Flow from Financing Activities 73,368,442
103,434,955
82,630,031
1,105,416
(10,977,944)
Net Cash Increase/(Decrease) 2,315,998
5,020,703
41,793,217
(60,184,759)
14,745,267
FIVE YEARS SUMMARY (CONTND...)
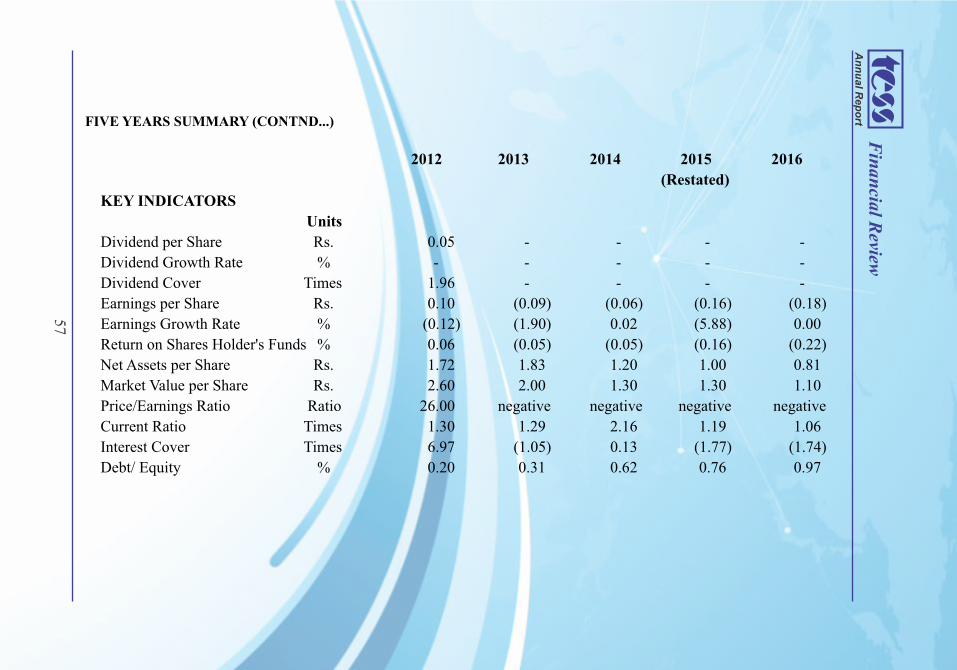
An
nu
al R
ep
ort
57
Fin
ancial R
eview
2012 2013 2014 2015 2016
(Restated)
KEY INDICATORS
Units
Dividend per Share Rs. 0.05 - - - -
Dividend Growth Rate % - - - - -
Dividend Cover Times 1.96 - - - -
Earnings per Share Rs. 0.10 (0.09) (0.06) (0.16) (0.18)
Earnings Growth Rate % (0.12) (1.90) 0.02 (5.88) 0.00 Return on Shares Holder's Funds % 0.06 (0.05) (0.05) (0.16) (0.22) Net Assets per Share Rs. 1.72 1.83 1.20 1.00 0.81 Market Value per Share Rs. 2.60 2.00 1.30 1.30 1.10 Price/Earnings Ratio Ratio 26.00 negative negative negative negative
Current Ratio Times 1.30 1.29 2.16 1.19 1.06 Interest Cover Times 6.97 (1.05) 0.13 (1.77) (1.74) Debt/ Equity % 0.20 0.31 0.62 0.76 0.97
FIVE YEARS SUMMARY (CONTND...)
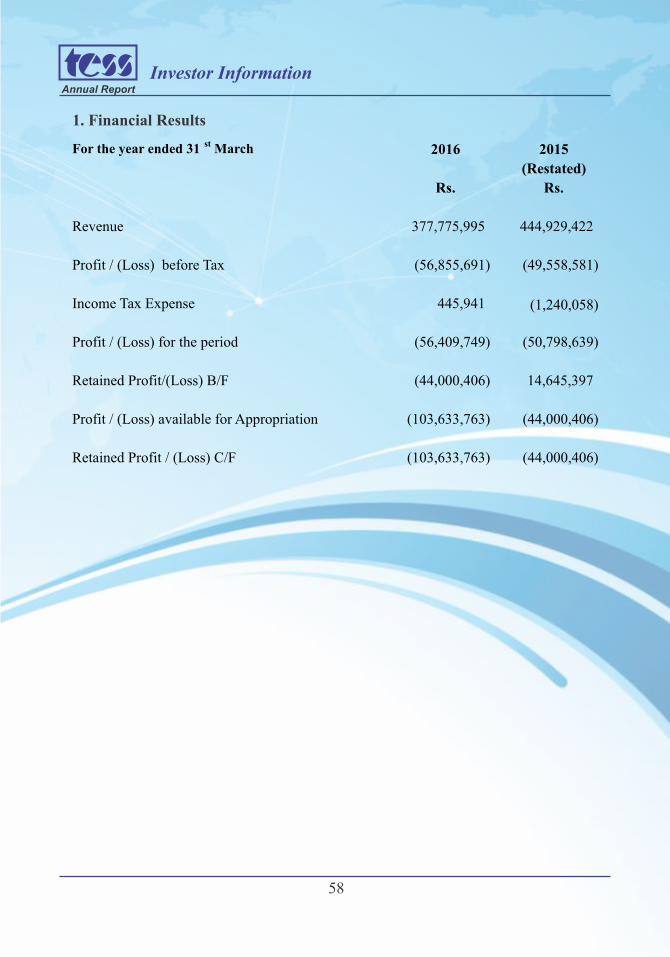
Annual Report
58
For the year ended 31 st March 2016 2015
(Restated)
Rs. Rs.
Revenue 377,775,995 444,929,422
Profit / (Loss) before Tax (56,855,691) (49,558,581)
Income Tax Expense 445,941 (1,240,058)
Profit / (Loss) for the period (56,409,749) (50,798,639)
Retained Profit/(Loss) B/F (44,000,406) 14,645,397
Profit / (Loss) available for Appropriation (103,633,763)
(44,000,406)
Retained Profit / (Loss) C/F (103,633,763)
(44,000,406)
Investor Information
1. Financial Results
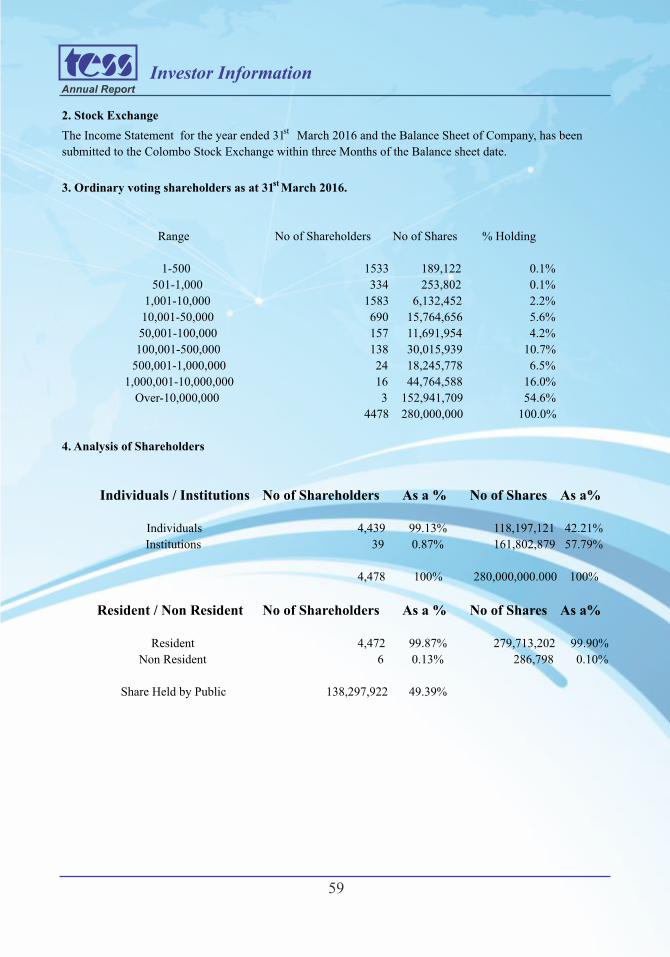
Annual Report
59
Investor Information
2. Stock Exchange
The Income Statement for the year ended 31st March 2016 and the Balance Sheet of Company, has been
submitted to the Colombo Stock Exchange within three Months of the Balance sheet date.
3. Ordinary voting shareholders as at 31st March 2016.
Range No of Shareholders No of Shares % Holding
1-500 1533 189,122
0.1%
501-1,000 334 253,802 0.1%
1,001-10,000 1583 6,132,452 2.2%
10,001-50,000 690 15,764,656 5.6%
50,001-100,000 157 11,691,954 4.2%
100,001-500,000 138 30,015,939 10.7%
500,001-1,000,000 24 18,245,778 6.5%
1,000,001-10,000,000 16 44,764,588 16.0%
Over-10,000,000 3 152,941,709 54.6%
4478 280,000,000 100.0%
4. Analysis of Shareholders
Individuals / Institutions No of Shareholders As a % No of Shares As a%
Individuals 4,439 99.13% 118,197,121 42.21%
Institutions 39
0.87% 161,802,879
57.79%
4,478
100% 280,000,000.000
100%
Resident / Non Resident No of Shareholders As a % No of Shares As a%
Resident 4,472
99.87% 279,713,202
99.90%
Non Resident 6
0.13% 286,798
0.10%
Share Held by Public 138,297,922
49.39%
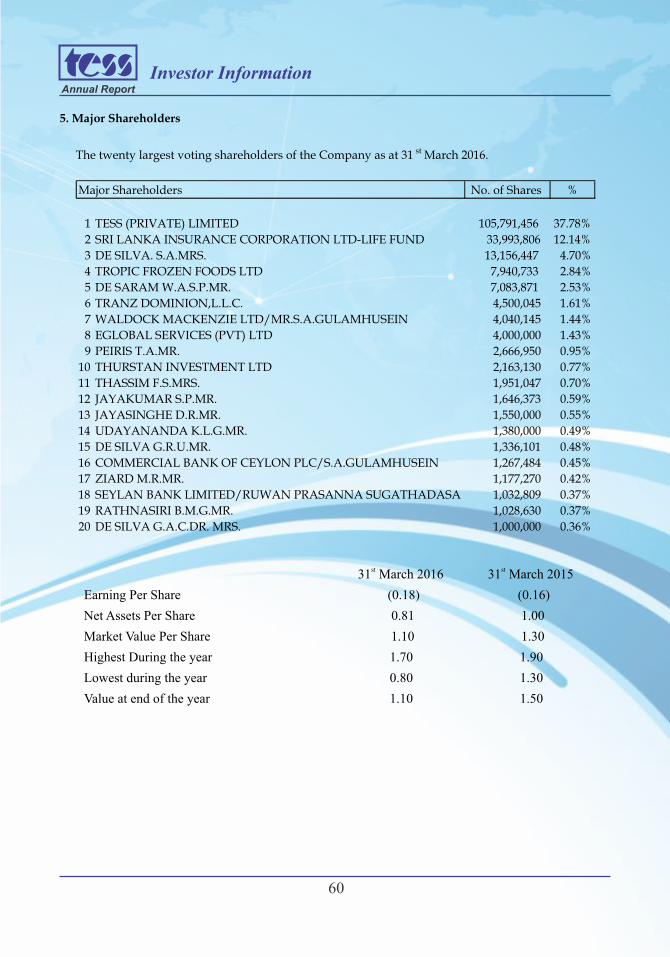
Annual Report
60
Investor Information
5. Major Shareholders
The twenty largest voting shareholders of the Company as at 31 st March 2016.
st31 March 2016 st31 March 2015
Earning Per Share (0.18)
(0.16)
Net Assets Per Share 0.81
1.00
Market Value Per Share 1.10
1.30
Highest During the year 1.70
1.90
Lowest during the year 0.80
1.30
Value at end of the year 1.10
1.50
Major Shareholders No. of Shares %
1 TESS (PRIVATE) LIMITED 105,791,456 37.78%
2 SRI LANKA INSURANCE CORPORATION LTD-LIFE FUND 33,993,806
12.14%
3 DE SILVA. S.A.MRS. 13,156,447 4.70%
4 TROPIC FROZEN FOODS LTD 7,940,733 2.84%
5 DE SARAM W.A.S.P.MR. 7,083,871 2.53%
6 TRANZ DOMINION,L.L.C. 4,500,045
1.61%
7 WALDOCK MACKENZIE LTD/MR.S.A.GULAMHUSEIN 4,040,145
1.44%
8 EGLOBAL SERVICES (PVT) LTD 4,000,000
1.43%
9 PEIRIS T.A.MR. 2,666,950
0.95%
10 THURSTAN INVESTMENT LTD 2,163,130
0.77%
11 THASSIM F.S.MRS. 1,951,047 0.70%
12 JAYAKUMAR S.P.MR. 1,646,373 0.59%
13 JAYASINGHE D.R.MR. 1,550,000 0.55%
14 UDAYANANDA K.L.G.MR. 1,380,000 0.49%
15 DE SILVA G.R.U.MR. 1,336,101
0.48%
16 COMMERCIAL BANK OF CEYLON PLC/S.A.GULAMHUSEIN 1,267,484
0.45%
17 ZIARD M.R.MR. 1,177,270
0.42%
18 SEYLAN BANK LIMITED/RUWAN PRASANNA SUGATHADASA 1,032,809
0.37%
19 RATHNASIRI B.M.G.MR. 1,028,630
0.37%
20 DE SILVA G.A.C.DR. MRS. 1,000,000 0.36%
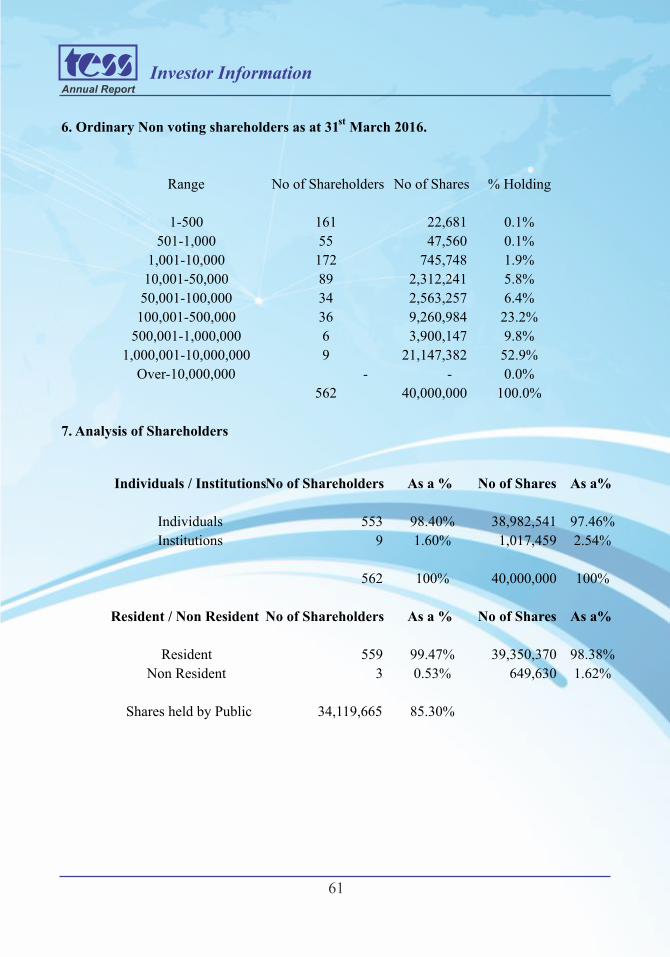
Annual Report
61
Investor Information
6. Ordinary Non voting shareholders as at 31st March 2016.
Range No of Shareholders No of Shares % Holding
1-500 161 22,681
0.1%
501-1,000 55 47,560
0.1%
1,001-10,000 172 745,748
1.9%
10,001-50,000 89 2,312,241
5.8%
50,001-100,000 34 2,563,257
6.4%
100,001-500,000 36 9,260,984
23.2%
500,001-1,000,000 6 3,900,147
9.8%
1,000,001-10,000,000 9 21,147,382 52.9%
Over-10,000,000 - - 0.0%
562 40,000,000 100.0%
7. Analysis of Shareholders
Individuals / InstitutionsNo of Shareholders As a % No of Shares As a%
Individuals 553
98.40% 38,982,541
97.46%
Institutions 9
1.60% 1,017,459
2.54%
562
100% 40,000,000
100%
Resident / Non Resident No of Shareholders As a % No of Shares As a%
Resident 559
99.47% 39,350,370
98.38%
Non Resident 3
0.53% 649,630
1.62%
Shares held by Public 34,119,665
85.30%
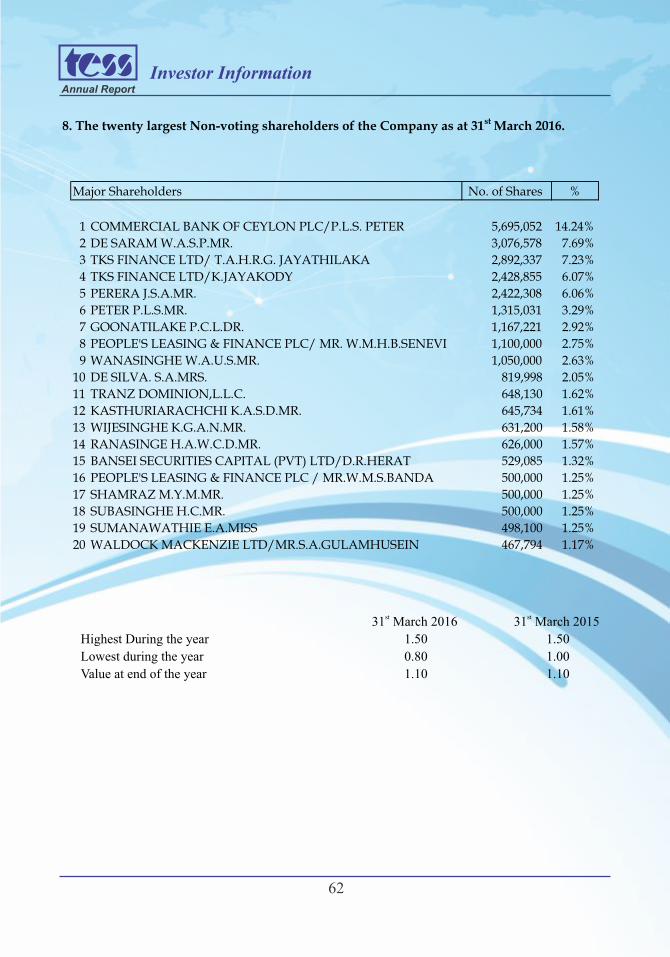
Annual Report
62
Investor Information
8. The twenty largest Non-voting shareholders of the Company as at 31st March 2016.
Major Shareholders No. of Shares %
1 COMMERCIAL BANK OF CEYLON PLC/P.L.S. PETER 5,695,052
14.24%
2 DE SARAM W.A.S.P.MR. 3,076,578
7.69%
3 TKS FINANCE LTD/ T.A.H.R.G. JAYATHILAKA 2,892,337
7.23%
4 TKS FINANCE LTD/K.JAYAKODY 2,428,855
6.07%
5 PERERA J.S.A.MR. 2,422,308
6.06%
6 PETER P.L.S.MR. 1,315,031
3.29%
7 GOONATILAKE P.C.L.DR. 1,167,221
2.92%
8 PEOPLE'S LEASING & FINANCE PLC/ MR. W.M.H.B.SENEVI 1,100,000
2.75%
9 WANASINGHE W.A.U.S.MR. 1,050,000
2.63%
10 DE SILVA. S.A.MRS. 819,998
2.05%
11 TRANZ DOMINION,L.L.C. 648,130
1.62%
12 KASTHURIARACHCHI K.A.S.D.MR. 645,734
1.61%
13 WIJESINGHE K.G.A.N.MR. 631,200
1.58%
14 RANASINGE H.A.W.C.D.MR. 626,000 1.57%
15 BANSEI SECURITIES CAPITAL (PVT) LTD/D.R.HERAT 529,085 1.32%
16 PEOPLE'S LEASING & FINANCE PLC / MR.W.M.S.BANDA 500,000 1.25%
17 SHAMRAZ M.Y.M.MR. 500,000 1.25%
18 SUBASINGHE H.C.MR. 500,000
1.25%
19 SUMANAWATHIE E.A.MISS 498,100
1.25%
20 WALDOCK MACKENZIE LTD/MR.S.A.GULAMHUSEIN 467,794
1.17%
st31 March 2016 st31 March 2015
Highest During the year 1.50
1.50
Lowest during the year 0.80
1.00
Value at end of the year 1.10
1.10
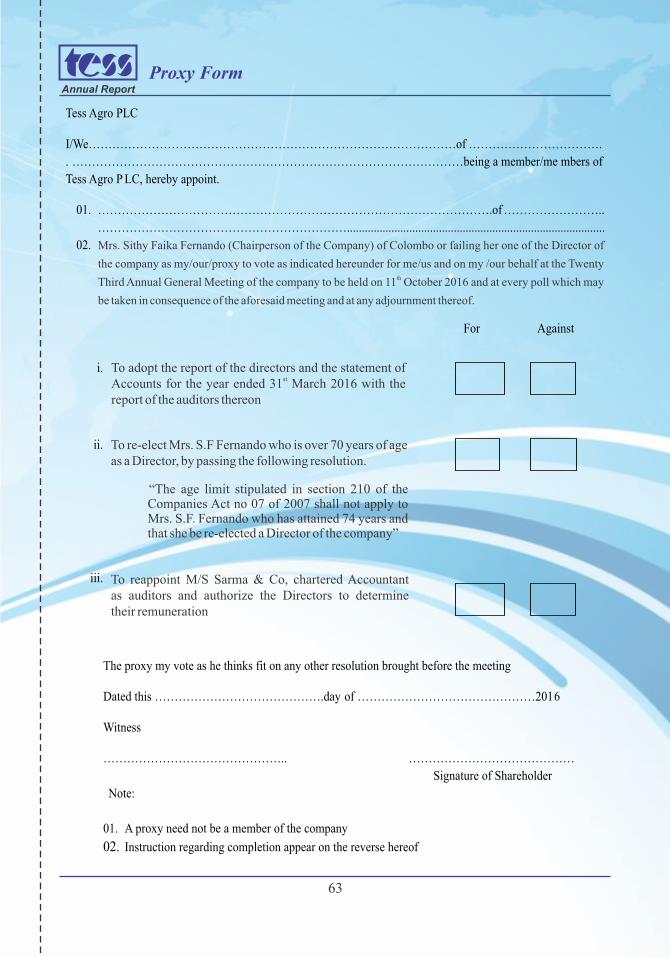
Annual Report
63
Proxy Form
Tess Agro PLC
I/We…………………………………………………………………………………of …………………………….
. ………………………………………………………………………………………being a member/me mbers of
Tess Agro P LC, hereby appoint.
01. ……………………………………………………………………………………….of ……………………..
……………………………………………………….......................................................................................
02.
For Against
i.
ii.
iii.
The proxy my vote as he thinks fit on any other resolution brought before the meeting
Dated this …………………………………….day of ………………………………………2016
Witness
……………………………………….. ……………………………………
Signature of Shareholder
Note:
01. A proxy need not be a member of the company
02. Instruction regarding completion appear on the reverse hereof
Mrs. Sithy Faika Fernando (Chairperson of the Company) of Colombo or failing her one of the Director of
the company as my/our/proxy to vote as indicated hereunder for me/us and on my /our behalf at the Twenty thThird Annual General Meeting of the company to be held on 11 October 2016 and at every poll which may
be taken in consequence of the aforesaid meeting and at any adjournment thereof.
To adopt the report of the directors and the statement of stAccounts for the year ended 31 March 2016 with the
report of the auditors thereon
To re-elect Mrs. S.F Fernando who is over 70 years of age as a Director, by passing the following resolution.
“The age limit stipulated in section 210 of the Companies Act no 07 of 2007 shall not apply to Mrs. S.F. Fernando who has attained 74 years and that she be re-elected a Director of the company”
To reappoint M/S Sarma & Co, chartered Accountant as auditors and authorize the Directors to determine their remuneration
Annual Report
64
Proxy Form
Instruction as to Completion:
● To be valid this form of proxy must be deposited at the Registered Office of the Company No
87, New Nuge Road, Keleniya not later than forty eight (48) hours prior or the time appointed
for the holding of the meeting.
● In perfecting the form please ensure that all details are legible.
● Please indicate with an X in the space provided how your proxy is to vote on each resolution. If
no indication given or the indication in not clear, the proxy in his discretion, will vote as he
thinks fit. Please delete (') if you do not wish your proxy to vote as he think fit on any other
resolution brought before the meeting.
● In the case of Company/Corporation, the proxy must be under its common seal which should
be affixed and attested in the manner prescribed in the Article of Association.
● On the case of a proxy signed by an attorney, the power of attorney must be deposited at the
Registered Office for registration.

TESS AGRO PLCNo. 87, New Nuge Road, Kelaniya, Sri Lanka.
Phone : +94 11 2910859 (10 Auto Lines) Fax : +94 11 2910615E-mail : [email protected] Website : www.tess.lk