john nerbonne, sandrien van ommen, charlotte gooskens and
TRANSCRIPT

Measuring Socially Motivated Pronunciation Differences
John Nerbonne, Sandrien van Ommen, Charlotte Gooskens and Martijn
Wieling
1. Introduction1
This paper applies a measure of linguistic distance to differences in pro-
nunciation which have been observed as a consequence of modern speakers
orienting themselves to standard languages and larger regions rather than
local towns and villages, resulting in what we shall call REGIONAL SPEECH.
We examine regional speech, other local “varieties” in the Dutch of the
Netherlands and Flanders, and also standard Netherlandic Dutch and Bel-
gian Dutch.2 Because regional speech is difficult to study, as it may not
constitute a linguistic variety in the usual sense of the word, we focus on
the speech of professional announcers employed by regional radio stations.
We examine their speech in light of Auer and Hinskens’ (1996) cone-
shaped model of the speech continuum, which includes REGIOLECTS, which
they define as a sort of comprise between standard languages and local
dialects (more below). In this examination we use a measure of pronuncia-
tion difference which has been successful in dialectology (see Nerbonne &
Heeringa 2009 for an overview) and which has been demonstrated to be
valid both for measuring dialect differences and also for measuring speech
differences due to limited auditory acuity (cochlear implants). We thereby
introduce a technique into sociolinguistics to measure the difference be-
tween regional speech and standard Dutch as well as the difference between
regional speech and the local speech of towns and villages, providing a
perspective on the issue of whether regional speech functions as “standard”
within more restricted areas or whether it serves rather to mark regional
identity.
1.1. Sociolinguistic Background
In the Netherlands and Flanders, Dutch is said to have reached an advanced
stage of linguistic standardization (Smakman 2006). As Haugen (1966)
states, the last stages of standardization are an elaboration of the function of

a language and the acceptance of this language by the community.3 This
elaboration of function means the standard language is used in contexts in
which once a prestigious foreign language was used (an exoglossic stand-
ard (Auer 2005), i.e. Latin in medieval Europe or French in the era of en-
lightenment in most of Europe). Importantly, virtually all speakers have at
least a passive mastery of the standard language, which is used in the man-
datory educational system, in a large number of national and bi-national
radio and television broadcasts, and in many civic and governmental func-
tions. The local dialects of individual towns and villages (hence: BASE
DIALECTS or BASILECTS) are used in fewer and fewer situations, and their
distinctive properties are therefore being lost or LEVELED extensively. Base
dialects, in this stage, may be reminiscent of old forms of dress (see Smak-
man 2006, for an overview and references), which are protected as a kind
of cultural heritage. There is ample evidence that dialects are “leveling” to
become more like standard languages (Hinskens 1998, to appear; Kerswill
2003; Streck 2012).
New regional forms are nonetheless springing up (Hinskens, Auer &
Kerswill 2005), namely REGIOLECTS, regionally flavored speech, which
may also serve new sociolinguistic functions (the concept is due to Hop-
penbrouwers 1983, Hoppenbrouwers1990). In general a regiolect is not
identical to any single basilect, but is easily understood within its region
and is identifiable as originating from that region. Regiolects are considered
to involve forms intermediate between basilects and standard language, an
assumption we will examine in the current paper. We cannot be sure that
the speech of the announcers in the regional radio broadcasts qualifies as
regiolectal in Auer and Hinskens’ sense (see below), but we shall nonethe-
less examine it from the perspective of their model.
The last formulation prompts a remark about terminology. We shall ex-
amine some instances of distinctly REGIONAL SPEECH in this paper and also
show that it does not conform to the predictions made in Auer and
Hinskens’ model. We shall not refer to the samples we collect as ‘regio-
lects’ simply because we are not confident that they qualify as such. We
shall elaborate on this below.
In this paper regional speech is examined phonetically. We wish to lo-
cate regional speech in the speech continuum, in particular with respect to
the base dialects and the standard. We investigate how regional speech
relates to base dialects and the standard, and how well it represents its re-
gion. In our examination we proceed from Auer and Hinskens’ (1996) con-
ical model, shown in figure 1 (which they attribute to Chambers and Trudg-

ill 1980: 10—11). This figure shows the language situation which is as-
sumed to exist in the Netherlands and Flanders. There is a layer of base
dialects at the base of the cone (where the horizontal plane represents
regional heterogeneity); there is a standard at the top of the cone (the verti-
cal axis represents types of speech differentiation with respect to social
status and context); and there are intermediate varieties within a three-
dimensional socio-geographic continuum, where we explicitly do not at-
tempt to identify a specific height or even potentially inclined plane that
must contain regiolects. The variability of these intermediate forms is
meant to be suggested by the arrows.
Our primary descriptive goal in this paper is to examine the speech of
some professional representatives of regional speech, namely the announc-
ers at regional radio stations. Since they are paid professional speakers of
regionally colored speech, it is interesting to ask where their speech falls in
Auer and Hinskens’ conical model.
A second goal is to suggest how sociolinguistic discussions of the sort
Auer and Hinskens (1996) and Auer (2005) exemplify might benefit from
quantitative assessments of sociolinguistic conjectures and postulates. This
should be a natural step given the geometric nature of the model, and also
given discussions about it, which abound in references to one form of
Figure 1. Model from Auer (2005), cone-shaped speech continuum reflecting dia-
glossic situations. The convergence of base dialects to each other and to-
ward the standard leads to intermediate, regional, varieties.

speech being “closer” to another, in references to the “space” between vari-
eties, and in discussions of how a given speech form must be understood as
the “convergence” of one form toward another. A great deal of this discus-
sion appeals to an intuitive notion of linguistic distance which is advanta-
geous to operationalize. We return to this in section 5 below.
2. Regiolects and speakers
In this section we first review the literature on regiolects to compile expec-
tations on the linguistic qualities regional speech should have and then se-
cond, consider how one is to study regiolects – i.e. how to obtain samples
of regiolectal speech. While we do not wish to insist that broadcasters’
speech be regarded as regiolectal in Auer and Hinskens’ sense, it is accept-
ed within a sizable region as representative. It may be different in being
more consciously controlled, however.
2.1. The sociolinguistics of regiolectal formation
As can be seen in figure 1, we use the notion of ‘dialect’ for a language
variety bounded above by a related (ENDOGLOSSIC, see Auer 2005) stand-
ard. Between the dialectal level and the standard in the top of the cone, a
continuum is imagined, representing other regional varieties.
A diaglossic repertoire is characterized by intermediate variants between stand-
ard and (base) dialect. The term regiolect (or regional dialect) is often used to
refer to these intermediate forms, although the implication that we are dealing
with a separate variety is not necessarily justified. (Auer 2005: 22)
We shall return below to Auer’s important qualification that regiolects
may not be true varieties,4 and our examination will show that the regional
speech we have sampled is not intermediate between the standard and base
dialects. For this reason we shall refer to our samples as regional speech
and not as regiolects. We return to this in the discussion (below).

But we first wish to collect some thoughts on regiolects. What Auer calls
intermediate forms (regiolects) are presumed to be more standard than dia-
lects, but more regionally colored than the standard. Regiolects may arise
due to various social forces, especially through a process of dialect leveling
(koineization) and standardization. Sobrero (1996), analyzing the modern
Italian situation, distinguishes three types of koineization (see also
Hinskens, Auer, and Kerswill 2005):
1. Active koineization: The spread of a koiné of a strong urban center
into the neighboring territory (e.g. Milanese and Neapolitan).
2. Passive koineization: Dialectal diversity is leveled under the influence
of the standard.
3. Reinforcement and expansion: Horizontal leveling decreases distinc-
tiveness on a local level in favor of distinctiveness on a regional level,
which means the leveled regional varieties are more distinctive from
each other than the original transition zone dialects.
In figure 2 these three types of koineization are visualized. Hinskens,
Auer, and Kerswill (2005) describe the formation of koiné as “structural
convergence between closely related linguistic systems, eventually leading
to the stabilization of some compromise variety.” According to Trudgill
(1986), this koineization does not remove all variation and the remaining
variation is assigned new functions. Thus, koineization results in a reallo-
cation of linguistic and extra-linguistic functions to different variants.
Figure 2. Three types of koineization, after Sobrero (1996). The dashed-line
circles represent the result of the koineization.

In figure 2a the active spread of an urban center increases the homoge-
neity of regional speech, because a single variety is used in a larger geo-
graphical region. In figure 2b, the standard influences the dialectal varie-
ties. Because all the base dialects are influenced by the same standard,
dialectal variation becomes smaller. The situation in figure 2c is compara-
ble to the situation in figure 2b, in the sense that dialects converge, but in
this situation the leveling results from their converging to each other and is
not imposed by the standard or by a dominant (metropolitan) center. The
result is that the homogeneity within a region increases, which at the same
time results in more distinctiveness between (some) varieties on an inter-
regional level. The figure suggests that dialect convergence and divergence
take place simultaneously. Howell (2006) gives a concise overview of the
literature on the influence of some migration processes on urban Dutch
koineization and advocates a bottom-up view. He shows that a wide variety
of Dutch dialects, through immigration, influenced the urban Dutch ver-
naculars, which contrasts with the view that prestigious dialects expanded.
In sum, dialect convergence is the result of complicated interactions, nor-
mally leading to an increase in homogeneity on the regional level.
Following Auer (2005), we may assume regiolects are not merely a
product of koineization, but also of standardization (although these influ-
ences may be intertwined, see figure 2b, where koineization is influenced
by the standard). In the stage of standardization that Netherlandic and Bel-
gian Dutch have reached, the influence of the standard is of great im-
portance.
Van Coetsem (1988) describes four sorts of unidirectional interactions
(ADVERGENCE, as posited by Mattheier 1996) which result in dialects be-
coming more like the standard. Van Coetsem focuses on the situation of
language users, in particular whether a situation primarily involves speak-
ers of base dialects who adopt standard forms while maintaining their own
dialect. In this sort of situation the dialect speaker actively borrows from
the standard. On the other hand, Van Coetsem also observed speakers of
the standard language (or other dialects) who shift to a local dialect, e.g., as
a consequence of moving to the dialect area. In this situation the immigrant
speaker typically imposes other features onto (his rendering of) the dialect,
which, however, is unlikely to change unless there is a substantial number
of immigrants. Van Coetsem recognized that the processes were only sepa-
rate in the ideal case, and that concrete contact situations often involve
several factors. Van Coetsem (1988) conjectured that regional varieties

typically evolve in situations in which the dialect is the active recipient,
taking up (lexical) items from the standard.
If we summarize the descriptions of the regiolect we have noted thus
far, we can state that regiolects are varieties on a continuum between dia-
lects and standard, resulting from a process of koineization and standardiza-
tion, including an imposition of the standard on dialects. Regiolects are thus
(inter alia) phonetically distinct from the standard, but, through leveling,
representative of a larger region than a base dialect. What, then, is the soci-
olinguistic role of this regiolect in the region?
Since a regiolect is a more standard-like variety of a dialect, and the
standard is universally intelligible, a regiolect should be intelligible in a
larger region than a base dialect would be. The regiolect, seen from this
perspective, fulfills a communicative function. But dialects within one re-
gion are closely related and mostly mutually intelligible, which obviates the
(communicative) need for a regiolect in intra-regional communication. On
the other hand, a regiolect, as a regionally colored variety of the standard
allows speakers to display their regional loyalty and regional identity with-
out risking ineffective communication. This may be comparable to a situa-
tion Van Coetsem (1988) describes, where the standard absorbs phonetic
features of the regional variety. One envisages a dynamic in which a regio-
lect is intelligible in a larger area than a base dialect, and where regional
color in pronunciation allows the speaker to express affiliation with the
region. Auer (2005) describes regiolects as a sociolinguistic tool in a simi-
lar way:
The intermediate forms often fulfill a sociolinguistic function by enabling their
users to act out, in the appropriate contexts, an identity which could not be
symbolized through the base dialects (which may have rural, backwardish or
non-educated connotations) nor through the national standard (which may
smack of formality and unnaturalness and/or be unable to express regional affil-
iation). (Auer 2005: 23)
The two views differ in the function they attribute to regiolects. A regio-
lect produced by koineization, i.e. the convergence of dialects toward each
other and toward the standard may facilitate communication, while on the
other hand a regiolect as a means of expressing solidarity with a region,
even regional identity, functions primarily as means of regional identifica-
tion (social marking). Note that these two functions correspond to different
directions from which regiolects arise in the cone of linguistic variation.
The first, communicatively motivated force is attracted by the standard and
represents an upward dynamic within the cone of variation, while the se-

cond, socially motivated force, reacts to the standard and ought to be seen
as proceeding downwardly in the cone, from the standard to the regional
varieties. A regiolect may well have both functions, and which function is
most important may depend on the level of standardization of a language. If
the standard language is accepted for all usage contexts (Smakman 2006;
Haugen 1966), then the regiolect has no communicative function at all and
may be used only to express regional affiliation. In a situation where re-
gional (dialectal) speech is still the language of first language acquisition,
there is no reason to see the use of regiolects as a reaction to standardiza-
tion, but rather as a means of communication that is less formal than the
standard.
2.2. Regional Speech
If we wish to study regiolects, we need to obtain samples of them, concrete,
representative examples. The task is not as straightforward in the study of
regiolects as it is in other branches of variationist linguistics, which fa-
mously have their own challenges with respect to data collection, as wit-
nessed by Labov’s (1972) discussion of the paradox of the observer. The
reason for our added caution is hinted at in a qualifying clause in Auer’s
definition, which we repeat for convenience:
A diaglossic repertoire is characterized by intermediate variants between stand-
ard and (base) dialect […] although the implication that we are dealing with a
separate variety is not necessarily justified. (Auer 2005: 22, emphasis added by
the authors)
If regiolects are indeed not varieties, that is, relatively stable collections
of speech habits that serve as a means of communication in a well-defined
community, then regiolects are more ephemeral manners of speaking that
are intermediate between base dialect and standard. Auer’s admonishing
clause suggests that regiolectal speech manners might be a sort of compro-
mise between base dialects and standard that is within the competence of
most diaglossic (standard-dialect) speakers. If this is correct, then we shall
never encounter monolingual speakers of regiolect, nor, indeed, native
speakers. The challenge is to find authentic and commensurable samples of
regiolectal speech.
In light of these potential problems the existence of regional radio sta-
tions and regional programs is a most fortunate circumstance. These sta-
tions aim to serve areas much larger than single towns or villages, and they

regularly transmit entire programs in regionally colored speech with the
aim of reaching audiences throughout entire regions. They have existed for
several decades now, and therefore appear to satisfy a need, which, moreo-
ver, is recognized commercially. While it may be true, as Auer tangentially
suggests, that it would be incorrect to view regiolects as varieties, there are
nonetheless professional speakers of locally colored language who aim to
reach wide ranges of dialect speakers in a given region. Our strategy in
probing the regiolectal landscape will therefore be to seek out such speak-
ers and to investigate their speech as regiolectally representative.
It would of course be preferable to record more such professional regio-
lectal speakers for each region, but there are not many, and they are profes-
sionals who expect compensation for their speech. We are fortunate in hav-
ing one per region, but we concede that more would be beneficial.
We shall examine the speech of regional radio announcers from the per-
spective of Auer and Hinskens’s model of regiolects, and we shall examine
the questions of where their regional speech fits within Auer’s cone of vari-
ation, whether it faithfully represents the speech of its region, and whether
it appears to be motivated more by a need to facilitate communication or by
a wish to express regional identity. Even if it turns out that the speech of
the broadcasters should not be regarded as regiolectal sensu stricto, the
analysis below will be interesting if it shows the range that is possible for
“professional” regional speakers, since their speech is accepted by many as
representative of the region.
2.3. The Netherlands and Flanders
In both the Netherlands and in Flanders, Dutch is the standard language,
but Standard Netherlandic Dutch is not the exact same language as
Standard Belgian Dutch (see endnote 1). Even though the formal (written)
standard does not differ much between Belgian and Netherlandic Dutch, the
spoken standards have phonetically diverged (van de Velde 1996), resulting
in two separate (but closely related) standard varieties. These varieties may
be very similar, but they have evolved separately. The Eighty Years’ War
(1558—1648) politically isolated Flanders from the Netherlands, stalling
the standardization of Dutch in Flanders, where French assumed many
supra-regional communicative functions (Grondelaers et al. 2001). In the
19th and 20
th centuries Dutch was again installed as the official standard in
Flanders, leading to a new impulse to standardization. There was no
Belgian Dutch standard, so the Netherlandic Dutch standard was accepted

as the norm (Geeraerts 2001). Grondelaers et al. (2001) refer to one
consequence of this interrupted standardization as SYNCHRONIC
STRATIFICATION, i.e. a larger distance between regional and supra-regional
speech.
We shall not examine in detail whether the Belgian differentiation is
larger than the Dutch but we shall pay attention to the issue below, and we
shall check for differences between the two Dutch speech continua.
We focus on the role of the regional speech – whether it functions pri-
marily as koiné or as an expression of regional identity. We develop these
hypotheses in section 3 (below).
3. The role of regiolects: Hypotheses
In the current paper, the phonetic proximity of regional speech to standard
and dialect is used to investigate the function of regional speech. We expect
pronunciation dissimilarities to be an important difference between regional
and standard speech. This is irrespective of whether one proceeds from the
assumption that the regional speech arises from a local variety which ab-
sorbs lexical items from the standard, whose pronunciation then “pulls” the
local variety toward the standard, or from the assumption that regional
speech is a variety of the standard which has absorbed local phonetic color-
ation. The latter likewise contributes to pronunciation differences. We
compute pronunciation dissimilarities by the use of the Levenshtein dis-
tance (see below). Pronunciation differences between words are expressed
in a distance, and distances between the many words in a sample together
constitute the so-called dialect distance between two varieties.
For the current study these distances may be analyzed to reveal more
about the role of regional speech in the Netherlands and Flanders. We dis-
till our interests in the function of regional speech to the three questions
below. We begin by noting that the conical model predicts an intermediate
position for regional speech, which we shall, of necessity, test in two parts.
Thinking geometrically, we view the position of the regional speech first
from the perspective of the base dialects, and then from that of the standard.
1. Are the base dialects in the region really closer to the regional speech
than they are to the standard, so that the regional speech might be easier
to use (than the standard) and thus offer benefits in communication in
the region? And how different are the standard and regional manners of
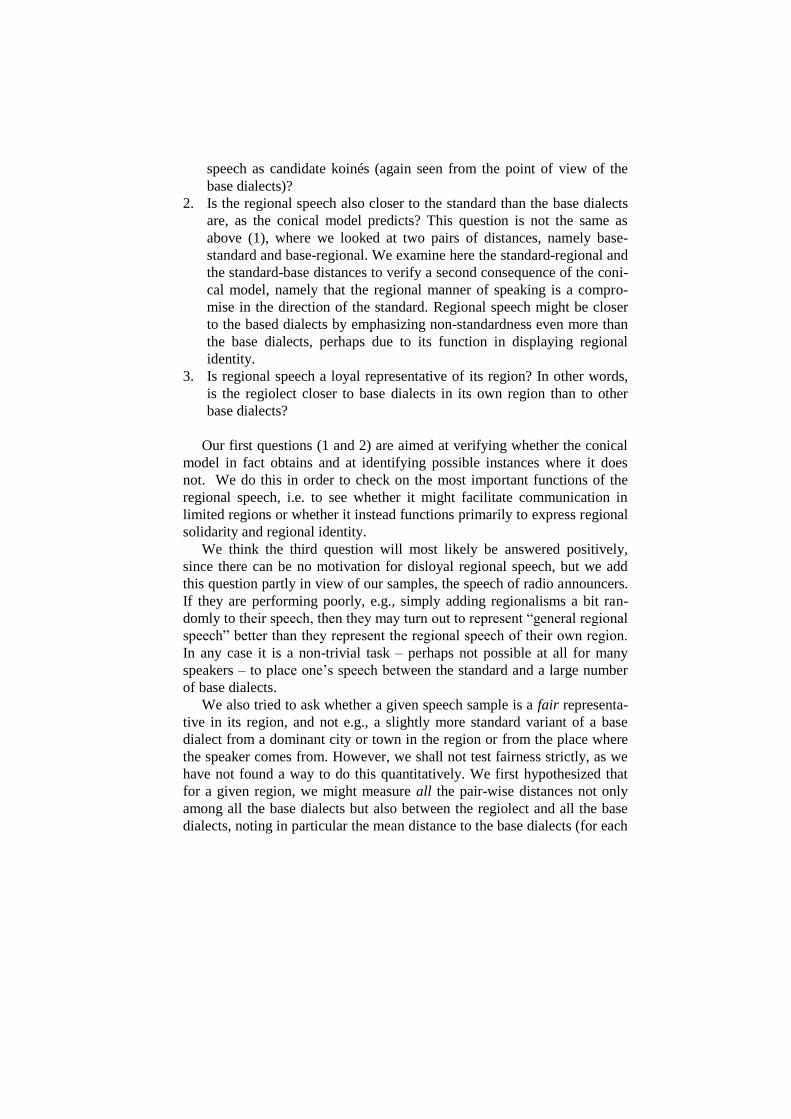
speech as candidate koinés (again seen from the point of view of the
base dialects)?
2. Is the regional speech also closer to the standard than the base dialects
are, as the conical model predicts? This question is not the same as
above (1), where we looked at two pairs of distances, namely base-
standard and base-regional. We examine here the standard-regional and
the standard-base distances to verify a second consequence of the coni-
cal model, namely that the regional manner of speaking is a compro-
mise in the direction of the standard. Regional speech might be closer
to the based dialects by emphasizing non-standardness even more than
the base dialects, perhaps due to its function in displaying regional
identity.
3. Is regional speech a loyal representative of its region? In other words,
is the regiolect closer to base dialects in its own region than to other
base dialects?
Our first questions (1 and 2) are aimed at verifying whether the conical
model in fact obtains and at identifying possible instances where it does
not. We do this in order to check on the most important functions of the
regional speech, i.e. to see whether it might facilitate communication in
limited regions or whether it instead functions primarily to express regional
solidarity and regional identity.
We think the third question will most likely be answered positively,
since there can be no motivation for disloyal regional speech, but we add
this question partly in view of our samples, the speech of radio announcers.
If they are performing poorly, e.g., simply adding regionalisms a bit ran-
domly to their speech, then they may turn out to represent “general regional
speech” better than they represent the regional speech of their own region.
In any case it is a non-trivial task – perhaps not possible at all for many
speakers – to place one’s speech between the standard and a large number
of base dialects.
We also tried to ask whether a given speech sample is a fair representa-
tive in its region, and not e.g., a slightly more standard variant of a base
dialect from a dominant city or town in the region or from the place where
the speaker comes from. However, we shall not test fairness strictly, as we
have not found a way to do this quantitatively. We first hypothesized that
for a given region, we might measure all the pair-wise distances not only
among all the base dialects but also between the regiolect and all the base
dialects, noting in particular the mean distance to the base dialects (for each

base dialect and for the regiolect). If we then compared, for each base dia-
lect and for the regional speaker’s speech, its mean distance to the other
base dialects, we might see where the regional speech lies in the distribu-
tion of mean differences. But we abandoned this idea due to the problem
that various regiolects might fairly represent a region at different average
distances from the base dialects (as the imaginary regiolect gets closer to
the standard).
As noted in section 2.3 (above), the role of regiolects in Flanders and
the Netherlands may differ, so we shall likewise pay attention to differ-
ences in the countries which might be due to the late standardization of
Belgian Dutch, or to the very dominant position of the standard language in
the Netherlands. We expect base dialects in the Netherlands to be more
similar linguistically to the standard and to their regiolects (less vertical
variation than in Flanders), which might in turn mean that regiolects in the
Netherlands will also differ less from the standard (than those in Flanders).
This is not a focus of our study, but we shall not neglect it.
Figure 3. Map of the Netherlands and Flanders, indicating the regions.

4. Material
4.1. Geographic Regions
In this study regions are mainly defined by provinces, which are govern-
mental entities (Impe et al. 2008). We focus on the regions of the provinces
Antwerp (FL), Brabant (FL), Belgian Limburg (FL), West Flanders (FL),
North Brabant (NL), Netherlandic Limburg (NL) and Groningen (NL) and
the agglomeration Randstad (NL) shown in figure 3. The reader might wish
to note that the province name ‘Brabant’ is used both for a province in the
Netherlands and for one in Belgium. We shall refer to these respectively as
‘North Brabant’ or ‘Brabant (NL)’, and ‘Brabant (FL)’.
The areas chosen differ with respect to their political and economic im-
portance in their respective countries. The regions Brabant and Randstad
are the most central areas (both containing the capital city5) in Flanders and
the Netherlands, respectively. Besides the regions’ economic and cultural
importance both regions have dominant positions in the media in their re-
spective countries. The regions West Flanders, Belgian Limburg, Groning-
en and Dutch Limburg, on the other hand, are peripheral areas, where dia-
lectal language use is better preserved than in the other areas. The regions
Antwerp and North Brabant are considered intermediate areas: they are
closer to the central region than the peripheral areas.
The Randstad in reality is a region consisting of two provinces (Utrecht
and South Holland) and a part of the province of North Holland. Since the
Randstad is an agglomeration of cities in the Netherlands, crossing borders
of provinces, these provinces cannot, for the purpose of this study, be taken
apart as separate regions. Because the regions mentioned above are defined
by province borders (not dialectal areas), the borders of the Randstad are
defined by state conventions as well, following VROM (ministry of hous-
ing, spatial planning and the environment, Randstadmonitor 2006).
4.2. Pronunciation data
We wish to compute the phonetic distance between dialectal, regional and
standard speech, which makes it necessary to use pronunciations from sev-
eral sources. Regional pronunciations were selected from a project on mu-
tual intelligibility in the Netherlands and Flanders where eight male region-
al radio commentators (four from each country) pronounced 300 words as

they would as professional regional speakers (Impe et al. 2008). Every an-
nouncer was between the age of 27 and 34 at the time of testing, and born,
raised and still living in the region they represent. The speakers reported
using both regionally colored and standard speech regularly for personal
and professional ends. The announcers were asked to pronounce the words
in isolation, without making lexical changes to the words. This allows us to
compare the pronunciations with the pronunciations of the base dialect
respondents, who had the same task (see below). The instruction given to
the speakers was to use “informal regionally accented speech, comprehen-
sible in the speaker’s entire region”. All pronunciations were transcribed by
the same person (the second author, whose native language is Netherlandic
Dutch). The transcriptions were discussed with a second transcriber at an
early stage, to ensure consistency and correctness. For the purpose of the
current study the Belgian Dutch transcriptions were checked by a transcrib-
er whose first language is Belgian Dutch.
Dialectal pronunciations in 318 places located in the eight regions were
taken from a 562-word subset of the Goeman-Taeldeman-Van Reenen-
Project (GTRP; Goeman & Taeldeman 1996). The words were selected by
Wieling et al. (2007) for a computational analysis of Dutch dialect pronun-
ciation, where words that were spoken in isolation were favored in order to
facilitate the identification and extraction of the necessary material. We
used the overlapping words in the two data sets for the comparison in this
study (37 words: 2 nouns, 17 adjectives and 18 verbs). We transcribed the
standard pronunciation of these 37 words ourselves according to
Gussenhoven (2007; Dutch) and Verhoeven (2005; Belgian Dutch). The list
of words used in the analysis can be found in the appendix.
The regional, standard and Belgian dialect transcriptions were all based
on the same subset of IPA sound segments consisting of 55 sounds. As
reported by Wieling et al. (2007), the dialect transcriptions in the Nether-
lands in the GTRP were transcribed using a much larger set of about 80
sounds. To make these transcriptions more comparable we automatically
merged the sounds occurring only in the Netherlandic transcriptions with
the most similar sounds occurring in the smaller set. This approach was
proposed and discussed in detail by Wieling and Nerbonne (2011). The
procedure of automatically determining sound distances (needed to deter-
mine the most similar sounds) is also discussed in the next section.

5. Method
As we noted in the introduction, we suggest as well that this paper may
contribute a quantitative perspective to this sociolinguistic discussion. We
noted further in the discussion of the literature on regiolects that the socio-
linguistic discussion concerning regiolects repeatedly refers to the “distanc-
es” between varieties without actually attempting to define that notion pre-
cisely. We suggest in this paper that a dialectometric technique for
assessing the differences between varieties quantitatively may serve to de-
fine one aspect of linguistic distance, i.e. pronunciation distance. Other
work has shown that pronunciation distance correlates strongly with lexical
and syntactic distances (Spruit, Heeringa, and Nerbonne 2009). Since it is
also readily implemented, the Levenshtein distance effectively measures
‘pronunciation distances’ for sociolinguistic purposes. Our contention is
thus that we are now in a position to operationalize the notion ‘linguistic
distance’ effectively. We first explain how this is done and note work that
has been done to validate the measure.
To determine the phonetic distance between dialects, regiolects and
standard, we used a modified version of the Levenshtein distance (Le-
venshtein 1965). The regular Levenshtein distance counts the minimum
number of insertions, deletions and substitutions to transform one string
into the other. For example, the Levenshtein distance of two Dutch dialectal
pronunciations of the word ‘to bind’, [] and [], is 3:
insert 1
substitute 1
delete 1
3
The corresponding alignment is:
1 1 1

The regular Levenshtein distance does not distinguish vowels and con-
sonants and may well align a vowel with a consonant. To enforce linguisti-
cally sensible alignments (and distances), we added a syllabicity constraint
to the Levenshtein distance so that it does not align vowels with (non-
sonorant) consonants. In addition, in the standard Levenshtein procedures,
if one sound is replaced by another in the alignment, the Levenshtein dis-
tance is always increased by one. Intuitively this does not always make
sense. A substitution of [i] for [y] should have a smaller effect on the pro-
nunciation distance than a substitution of [i] for [] as the former sounds
are much more similar than the latter. To reflect this, we modified the Le-
venshtein distance to use more sensitive sound distances. We automatically
determined the sound distances based on the relative frequency with which
they align using Levenshtein distance. Pairs of sounds co-occurring rela-
tively frequently are assigned relatively low costs and sounds occurring
relatively infrequently are assigned high costs. This method was introduced
and found to be superior over the Levenshtein distance with syllabicity
constraint by Wieling et al. (2009). Furthermore Wieling et al. (2012) show
that the automatically derived sound distances are linguistically sensible
(showing a substantial correlation with acoustic distances (0.6 < r < 0.8).
It is important that measures not only be well defined, but also that they
be shown valid for the task to which they are employed, i.e. that they meas-
ure what one intends to measure (Howitt and Cramer, 2008:265—271).
Levenshtein distance has indeed been shown valid for measuring pronunci-
ation dissimilarity by Gooskens and Heeringa (2004), who showed that
aggregate Levenshtein distance correlated well with Norwegian dialect
speakers’ perceptions of dialect dissimilarity. Similarly, Sanders and Chin
(2009) have verified that Levenshtein distance is a valid measure of pro-
nunciation difference when used to measure the degree to which the speech
of cochlear implant patients differs from that of healthy controls, which we
regard as further confirmation of validity (of Levenshtein distance as a
measure of pronunciation difference). We postulate that no independent
validation is needed for the application to the social differences we are
concerned with, i.e. the differences between the speech of the radio broad-
casters and that of the local dialects. The perceptual situation is similar, as
is the measurement task. Naturally, this postulate could be in error, and we
are interested in criticism of other researchers and in empirical testing.
We are also aware of Greenhill’s (2011) criticism of the use of Le-
venshtein distance in order to detect genealogical relations among lan-
guages, but we suspect that the difficulty lies not in the capability of the

Levenshtein algorithm to measure string dissimilarity but rather in using a
good measure of string dissimilarity to ascertain genealogical
(un)relatedness. In fact, historical linguists have always emphasized that it
is not superficial similarity which is interpreted as evidence of genealogical
relatedness, but rather shared innovations, normally realized as regular
sound correspondences (Campbell 2004: 197).
After determining the distance between each pair of pronunciations
(transcriptions) of each word, the distance between every pair of varieties
(e.g., standard and regional, or standard and a dialect) is calculated by aver-
aging all 37 word distances. This means we have a mean phonetic distance
between every pair of varieties, based on the difference between these vari-
eties in each pair of pronunciations.
Finally we should not conclude this section without noting that it is unu-
sual in sociolinguistic research to pay attention to aggregate differences of
any sort (phonetic, morphological, etc.). Sociolinguists have largely fo-
cused on the analysis of single variables such as the allophonic variation of
a single phoneme, e.g., //, and the social meaning attached to different
allophones (Chambers, 2003). This has led to progress in understanding the
motivation for individual sound changes. We do not presume to suggest
replacing the usual focus on single features with aggregate analyses, but we
do suggest including aggregate analyses in the set of methods available to
sociolinguistics. The single-feature perspective risks becoming myopic
when used to study the broad range of changes typically introduced by
koneization, standardization, or the formation of regional varieties. We
present an analysis of the aggregate differences below, and we claim that it
provides a more insightful perspective of the sweeping changes brought
about as standards influence dialects.
6. Results
6.1. Tests of hypotheses
We asked several questions pertaining to the structure and function of re-
gional speech, trying to test whether the conical model was right in always
placing the regional speech between the standard and the base dialects, and
whether the regional speech is a loyal representative of the region. The
conical model postulates that regional speech should be intermediate be-
tween base dialects and the standard, but we can only test relative distanc-

es. For this reason we separately test two consequences of the hypothesis
that regional speech is intermediate.
1. From the point of view of the base dialects, which is closer, the
regional or the standard speech?
It is a consequence of the conical model that all varieties are roofed by
the standard. If regional speech takes a position between the base dialects
and the standard (see figure 1), then the base dialects have to be closer to
regional than to standard speech.
2. From the point of view of the standard, is the regional speech pho-
netically closer than the base dialects are?
This is also clearly a consequence of the conical model, which, howev-
er, we need to test separately because we are using distances to test the
hypothesis that regional speech is intermediate. Note that we might have a
positive answer to the question in (1) even where the regional speech is less
standard than the base dialects. We therefore additionally check whether
the regional speech is indeed more standard-like than the base dialects,
ruling out cases where base dialects are closer to regional speech (than to
the standard) only because the regional speech is actually less like the
standard (than the base dialects are). The latter would be the case if the
regional speech emphasized non-standardness even more than the base
dialects, perhaps due to its function in displaying regional identity. If the
regional speech is to function as a koiné, facilitating communication out-
side its region, then it must also be closer to the standard than (most) ba-
silects.
3. Is the regional speech more similar to base dialects in its own region
than to other base dialects?
We answer these questions by computing the pronunciation differences,
using Levenshtein distance, as explained above. figure 4 displays the dis-
tances of base dialects within each region to (left) the standard and (right)
the regional speech of the same region. The box-and-whisker plots in figure
4 show the median (dark central horizontal line) and central 50% of distri-
bution (within the boxes) of the distances. The lowest and highest quartiles
of the distribution are shown in the “whiskers” of the graphs. We have add-

ed a dashed line to each graph showing the difference between the regional
speech and the standard. The regions are ordered by country, with the
Netherlands above and Belgian Flanders below. Each row is then ordered
by centrality, where the region on the left is the most central and the region
on the right the most peripheral.
We first examine the data graphic in figure 4 (below) in light of the first
question, adopting the perspective of the base dialects and asking whether
they are indeed closer to the regional speech than to the standard, as Auer
and Hinskens’ (1996) model predicts. In terms of box-and-whisker plots,
we expect to see the plot of distances with respect to the standard (the left
box-and-whiskers plot in each of the eight charts) to be above the plot of
distances with respect to the regional speech (the box-and-whiskers plot on
the right). As figure 4 shows, several samples of regional speech indeed
conform to the predictions of the conical model: the base dialects in Dutch
Limburg, Groningen and West Flanders are significantly closer to their
regional speech of their regions than to the standard (p<0.001 in all cases).
On the other hand, the pattern is not general. In Antwerp, there is no signif-
icant difference between the standard and the regional speech in their prox-
imity to the base dialects, and in the four other regions, i.e., the Randstad,
North Brabant, Belgian Brabant and Belgian Limburg, where the base dia-
lects are actually closer to the standard than they are to the regional
speech!6 This result is surprising given the theoretical discussion about
regiolects above, which has emphasized their potentially facilitating role in
multi-varietal situations. It turns out that the standard language is usually
better suited for this role than the regional speech we examine, which, in
turn suggests that this regional speech is not primarily used to facilitate
communication within their regions, a task to which the standard language
is better suited. Their attractiveness must lie elsewhere.
We next ask examine regional speech from the perspective of the stand-
ard, asking whether it is indeed closer to the standard than the base dialects
are. It is also a consequence of the conical model that the regional speech of
the radio announcers should be closer to the standard than the base dialects
are. That is, regional speech should be properly intermediate between the
standard and the base dialects. So we shall compare the distance of the base
dialects to the standard against the distance between the regional speech
and the standard. Linguistically, we are cautiously checking whether the
regional speech might be emphasizing non-standardness even more than the
base dialects, perhaps due to its function in displaying regional identity.

Figure 4. Phonetic distances (y-axis) between the dialects in a region and the
standard, and the regional speech of each region (x-axis) in the
Netherlands and Flanders. The dashed horizontal line is the dis-
tance between regional speech and standard. See text for further
explanation.

So we check further whether the regional speech is genuinely intermedi-
ate between the basilects and the standard by checking whether the horizon-
tal dashed line – showing the distance between the regional speech and the
standard – is below most of the basilects in the box-and-whisker plot on the
left. Only in this case have we encountered a situation compatible with the
predictions of the conical model. In case the dashed line is below most of
the base dialects’ distances to the regional speech, then the base dialect
speakers might reasonably adopt the regional speech as means of accom-
modating speakers from outside the region (and even speakers within it). In
this case the regional speech may be facilitating communication.
We turn then to an examination of the charts in figure 4. The distance
between the standard and the regional speech is shown by the dashed hori-
zontal lines in the eight charts, which we now compare to the box plots on
the left side of each chart showing the distribution of distances from the
different base dialects to the standard. Wherever we find the dashed line
below most of the basilectal distances to the standard (considerably below
the box in the box plots on the left side in each pair, say above the 95th per-
centile in proximity), we find it plausible that the regional speech may be
facilitating communication between dialectal speakers in the region and
speakers from outside, including standard speakers (assuming a positive
answer to question one above). The regional speech in North Brabant (NL)
and in Belgian Brabant are indeed substantially closer to the standard than
the base dialects in their regions are (top 95th percentile or closer), and the
regional speech in West Flanders is closer to the standard than 90% of the
base dialects are. This circumstance is favorable to the putative function of
these regional speech forms as facilitating communication – both between
dialect speakers in the region and speakers from other regions or speakers
of standard Dutch, in accordance with the views implicit in the conical
model. The regional speech in the (Dutch) Randstad, Dutch Limburg and
Belgian Limburg is closer to the standard when compared to the base dia-
lects (64th to 80
th percentiles), but only at a level we might attribute to
chance.
But two samples of regional speech are particularly extreme, those in
Groningen and Antwerp, which are further from the standard than most of
the base dialects in their respective regions are. For these regional forms, it
is implausible to attribute a facilitating, primarily communicative function
as they would need to be closer to the standard to serve that function.
We asked the second question because the conical model predicts that
regiolects should be closer to the standard than the base dialects are (and

not merely that base dialects are closer to the regiolect than they are to the
standard). The conical model of regiolect functioning does not foresee the
chance of a speech form functioning regionally that is actually less like the
standard than the base dialects are. But this is what we see in Groningen
and Antwerp. In terms of Auer and Hinskens’ (1996) cone, this regional
speech has dropped below the base formed by the basilects. We return to
this in the discussion.
The case of Groningen is particularly interesting with respect to the se-
cond question. As figure 4 shows (top right graph), it turns out that more
than 75% of the base dialects are closer to the standard than the regional
speech is. This means that most base dialects would be better candidates for
facilitating communication. This, we submit, is a clear case of regional
speech which serves more as a vehicle of identification than as a means of
coordinating communication.
Tying the first two questions together, we note that only one case (in
eight) satisfies the conditions set out in the conical model, namely West
Flanders. This regional speaker succeeds in producing speech which is
closer to the base dialects than the standard is and which occupies an inter-
mediate position (at the 90th percentile) in proximity to the standard (i.e.
only about 10 percent of the dialects in West-Flanders are closer to the
standard language than to the regional speech). All of the other seven cases
violate one of the two predictions of the conical model.
The third question was included as a check on our regional speakers,
and it is reassuring to note that they virtually all succeeded in using a ver-
sion of regional speech that was closer to the base dialects of their own
region than to the base dialects of any other. The Randstad speaker was the
only exception. In his case, the base dialects of North Brabant turned out to
be marginally better represented by his speech than those of the Randstad
itself. This is shown in figure 5. For all the other seven regions the base
dialects of the region in question were much closer to the regiolect than any
others (not shown graphically). Given that the Dutch Randstad and North
Brabant variants are quite similar to each other, we are willing to conclude
that the regional speakers faithfully represent the speech of their own re-
gion. They are not merely adding dialectal coloring from various areas to
their speech.

Before closing this presentation of results we would like to present some
general observations. First, the distance from the regional speech to the
standard increases in more peripheral regions. Thus the distance between
standard Dutch and the regional speech of Groningen is larger than the
distance between the standard and the regional speech of the Randstad. The
height of the dashed lines rises from left to right in both rows of figure 4,
which are ordered from central to peripheral areas. Interestingly, the same
cannot be said about the distance between the dialects and the standard
(leftmost box in each graph). The mean distance in the Netherlandic Dutch
dialects does increase, but there is no simple rise in Belgian Dutch dialects.
An alternative view of the regional speech we examined as a general in-
termediate variety would be that the regiolect might be a personal interme-
diate variety between the standard and the dialect of each particular speak-
er. To assess this, we took a closer look at the data, asking whether the
regional speech is more similar to the dialect of the place the speaker origi-
nates from (when available), than to other dialects. This was not the case,
which suggests that the regional speech as used in this study is not merely a
standardized form of each particular speaker’s own dialect. The regional
speech might also be conjectured to be an intermediate form between the
Figure 5. Phonetic distances (y-axis) between the Randstad dialects and the stand-
ard (NL), and the regional speech of each region (x-axis) in the Nether-
lands, viz. Randstad (RS), North Brabant (NB), Limburg (LB) and Gro-
ningen (GN). The dashed horizontal line indicates the distance between
the Randstad regional speaker and standard Dutch. See text for further
explanation.

variety of a large urban center and the standard, but the distances between
the dialects of larger cities and the regional speech and standard also did
not reveal an influence of this kind.
Figure 6 summarizes the relations between the regional speech samples,
the basilects in the various regions and the standard languages. In fact only
one sample may be positioned within the Auer-Hinskens cone of regiolects.
We discuss this result in the final section.
6.2. Some further observations
We may also compare Belgium and the Netherlands using these measure-
ments. For historical reasons, we expected the Belgian Dutch speech to be
more diverse, both socially and geographically, than the Dutch of the Neth-
erlands. In other words we expected the differences between the regional
Figure 6. Samples of regional speech with respect to the regiolectal cone. Five
of the eight samples were more different from the basilects of their region than
the standard, and two differed more from the standard than the basilects did.
Only the regional speech of West Flanders succeeded in striking a compromise
between its standard language (Belgian Dutch) and its base dialects.
speech and the dialects and the standard language to be larger in Belgium
than in the Netherlands, and indeed the mean distance of the Belgian dia-
lects from the Belgian standard is significantly larger than the distance of
the Dutch dialects from the Dutch standard (p < 0.001), where we add that
we did not weight these averages by the populations in the different re-
gions, which we suspect would magnify the difference, since a very large
proportion of the Dutch population lives in or near the Randstad. Although
we did not develop a hypothesis about the relation of the regional speech to
the standard, it also turns out that the Dutch regional speech is a bit further
from the (Dutch) standard than the Belgian regional speech is (from the
Belgian standard), but the sample is too small for significance to be
reached. We might conjecture that the function of social identification is
more important to the regiolects in the Netherlands than in Belgium, at least
in the case of the peripheral regiolects of Groningen and Limburg where
the differences are largest. Again, within Belgium the two peripheral re-
gions of Limburg and West Flanders show the largest distances between
regional speech and standard. Speakers who live in areas far away from the
political and economic centers may feel a greater need to manifest their
regional identity than speakers who live closer to these centers.
7. Conclusions, discussion and prospects
In this paper we introduced a formal measure of pronunciation distance to
study a sociolinguistic question, viz. the relation of regional speech to
standards on the one hand and base dialects on the other. As far as we know
this is the first focused sociolinguistic study using a formal measure of
pronunciation distance, even though there have been studies which includ-
ed both social and geographical variables (Leinonen 2010: 7.2, Wieling et
al. 2011). Rather than examine a small number of linguistic variables in
depth, as is customary in sociolinguistics, we applied an aggregate measure
of pronunciation distance, arguing that the strategy of taking a broad view
is more appropriate when studying the effects of standardization or “re-
gionalization,” where we have good reason to suspect that many changes
are occurring at the same time.
We have quantitatively examined the speech of professional regional
speakers from the perspective of Auer and Hinskens’ (1996) conical model
in order to better understand the communicative and social function of re-
giolects. The conical model predicts that regiolects take an intermediate

linguistic position between base dialects and the standard language. By
measuring the phonetic distances between local dialects, regional speech
and the standard language in Belgium and the Netherlands we hoped to be
able to draw conclusions about the relative position of the eight Dutch and
Belgian regional forms of speech in relation to the base dialects and stand-
ard languages in the same region.
We approached the question from two perspectives. First, we looked at
the mean phonetic distances between the base dialects of each area and the
corresponding regional speech on the one hand and standard languages on
the other. The conical model predicts that the base dialects should be closer
to their regional speech than they are to the standard language. However,
this prediction was completely incorrect in half of the cases. In four regions
the base dialects were closer to the standard than to the regional speech (i.e.
the Randstad, North Brabant, Belgian Brabant and Belgian Limburg). In a
fifth case, Antwerp, there was no significant difference.
This result shows that regional speech of the sort heard on regional radio
stations does not always facilitate communication between speakers within
a given region, since the speakers might better have used the standard lan-
guage for this purpose. Regional speech of this sort is also unlikely to facil-
itate communication between speakers of different regions, as the standard
is in general quite sufficient. We interpret this result, therefore, to indicate
that regional speech functions at least some of the time to allow speakers to
show identification and solidarity with their regions.
Next, we checked the prediction of the model that regional speech is
linguistically a step toward the standard, i.e. in an intermediate position
between the base dialects and the standard. Given our answer to the first
question above, it only makes sense to ask this second question of those
varieties where the base dialects are closer to regional speech (than to the
standard), i.e. Groningen, Limburg and West Flanders. We had found that
the regional speakers in Groningen and in Antwerp used speech closer to
the base dialects (than the standard would be), but we observed that the
speech of the regional speakers is actually further from the standard. In
terms of the conical model, their speech drops below the base of the cone.
The main function of this regional speech therefore cannot be extra-
regional communication; the function must presumably revolve around
social identification.
The position of West Flanders should also be emphasized, as the only
region in which the configuration of basilects to regiolect and standard
conforms to the conical model.

With respect to the examination of the conical model, we are cautious
and do not suggest that it be discarded. Many modern speakers of Dutch
have little facility with local dialects but do adopt some local vocabulary
and some local coloring in their pronunciation, making their speech indeed
intermediate between the standard and local dialects. Acknowledging that
one might wish to reserve the term regiolect for this sort of speech, we
nonetheless conclude that the dynamics of regional speech are more com-
plex than the conical model foresees. After all the speech of the regional
broadcasters is regional speech and is widely recognized as such (even to
the point of remuneration). Perhaps it should not be regarded as regiolectal,
and in fact it does not satisfy Auer and Hinskens’ definition (above), since
it is not “intermediate”, but it certainly is regional.
We have presented a method to test the relationship between the dialec-
tal, regional and standard forms of a language area quantitatively. We are
aware of the fact that a single regional speaker cannot be regarded as repre-
sentative, in spite of the mitigating circumstance that these are people with
professional functions involving regional speech. We anticipate the objec-
tion that our examination justifies only conclusions about these radio an-
nouncers and how they fulfill their professional role as regional speakers. It
is possible that each speaker has his own way of manifesting regional affin-
ity linguistically. We add, however, that we sought, but found no indica-
tions that our speakers based their regional speech on their own dialect in
particular, nor on the dialect of a major town or city in the vicinity. Nor did
we find indications that the speakers use a speech form which could be
characterized as “general regional speech” with characteristics from other
regions. It is possible that speakers tend to base their choice of speech
forms on stereotypes and shibboleths when signaling their regional identity
rather than on one particular dialect from the region. Furthermore, it is un-
certain how stable the regional speech forms of different speakers from the
same region would be in this respect and how stably the various manifesta-
tions of a regiolect vary with respect to the standard and to the base dia-
lects, both in individual speakers but especially across speakers.
Auer’s (2005) caution that one perhaps should not regard regiolects as
varieties was perhaps prescient in view of the results here. Perhaps we
should rather regard regional speech as the (situated) varietal performance
of a regional identity rather than as a natural koiné. Auer and Hinskens
(1996: 6) compare some regional speech to “learner varieties” because of
their occasionally “makeshift” nature. Eckert (2001) reminds us how lin-

guistically systematic such matters may be, but in resolutely referring to
some linguistic variation as style, she reminds us how personal it also is.
Our discussion would not be complete without some mention of Cou-
pland’s (2001) characterization of Welsh-English accents in radio broad-
casts as “stylized dialect performances”, which is in keeping with our own
conclusions. We base our study on measurements involving eight radio
broadcasters and more than 300 dialect speakers, while Coupland analyzed
a single broadcast involving two speakers, so we extend his work in that
respect, and naturally, we focus on a different dialect area. We further add
to Coupland’s analysis that the pronunciations produced reflect dialect
speech rather poorly, tending to exaggerate. Since our data comes from
elicited word lists, we do not interpret the exaggerations as part of a per-
formance “ ‘put on for show’ ” in a way that listeners would perceive as
intended (Coupland 2001: 347, scare quotes in original). We suggest in-
stead that it is simply difficult to adopt generic regional pronunciations, and
that listeners appreciate being able to recognize the more exaggerated ver-
sions.7
Future research should include more speakers in order to be able to draw
conclusions about the variability of regiolects. To shed more light on ques-
tions of regional speech, we should examine the speech of a number of
speakers in each region accompanied by detailed information about the
speakers’ linguistic backgrounds and their choices of linguistic forms. In
view of the possibility that we are dealing here with a matter of situated
style, it will be important to set the stage carefully when collecting data.
The naturalistic data collection might be accompanied by perception exper-
iments presenting the speech of different regiolect speakers to listeners
from the region. The aim of such experiments would be to get an idea of
what listeners regard as representative speech for their region, what the
linguistic characteristics are of these regiolects, and which attitudes listen-
ers have towards them. In our investigation we have used professional
speakers from regional radio stations. Since such speakers are likely to be
more aware of how to switch between dialect, regiolect and standard, we
collected our data by asking them to read a list of words in the style of
speech they used as professional speakers in the region. In future research it
is important to find ways to include the regiolectal speech forms of other
groups of speakers as well.

Appendix. List of 37 Dutch words used for the pronunciation analysis
GTRP
reference nr. Dutch word English gloss Part of speech
379 meid girl noun
723 zakken bags noun
748 aardig nice adjective
784 droog dry adjective
791 duur expensive adjective
806 goed good adjective
816 groot big adjective
819 haastig hasty adjective
821 hard hard adjective
830 hoog high adjective
836 juist correct adjective
842 kort short adjective
881 proper clean adjective
898 schoon clean adjective
905 simpel simple adjective
906 slecht bad adjective
935 vreemd strange adjective
954 ziek ill adjective
965 zwaar heavy adjective
1194 gebruiken use verb
1267 kopen buy verb
1300 lachen laugh verb
1313 leunen lean verb
1318 liggen lie verb
1329 maken make verb
1340 mogen may verb
1344 noemen call verb
1357 rijden drive verb
1373 scheren shave verb
1381 schrijven write verb
1426 spreken speak verb

1446 stampen pound verb
1473 vallen fall verb
1509 vrijen make love verb
1527 weten know verb
1549 wrijven rub verb
1553 zeggen say verb
Notes
1 We are grateful to Peter Auer and Frans Hinskens for discussion of this work,
also to the Göteborg audience at the workshop (Comparing) Approaches to
Measuring Linguistic Differences, Oct. 2011. We are further indebted to our
partners in the Dutch-Flemish cooperative project “Mutual Comprehensibility
of Dutch Dialects”, namely Renée van Bezooijen, Dirk Geeraersts, Stef
Grondelaers, Roeland van Hout, Leen Impe, Sebastian Kürschner and Dirk
Speelman,. We also thank Lotte Thissen for an important reference and finally
two anonymous referees. 2 In deference to its speakers’ wishes we refer to the language spoken in Flanders
as BELGIAN DUTCH. See nl.wikipedia.org/wiki/Nederlands_in_België It is
spoken primarily by the Flemish. 3 Haugen (1966) defines four stages of standardization: (1) selection of form, (2)
codification of form, (3) elaboration of function and (4) acceptance by the
community. 4 Auer’s (2005) remark is anticipated by Auer and Hinskens’ (1996: 6) observation
that “dialectologists and linguists tend to be somewhat rash in assigning the sta-
tus of a ‘variety’ to a certain way of speaking”. 5 The working assumption is that the prestige of a region increases when the capital
city of a country is situated in or near the region. 6 In the case of Brabant the difference is barely significant (p = 0.016), and in all
other cases the differences are highly significant (p < 0.001). 7 Coupland’s detailed analysis is to be recommended for its sensitive attention to
how subtly Welsh English accent is used in the radio dialogues he examines, in
a way that engages issues of regional identity in an entertaining way, and with-
out slipping into an apparent denial of the legitimacy of non-dialectal, unac-
cented speech.

8. References
Auer, Peter.
2005 Europe’s sociolinguistic unity, or: A typology of European dia-
lect/standard constellations. In Perspectives on Variation. Socio-
linguistic, Historical, Comparative, Nicole Delbecque, Johan
Van der Auwera and Dirk Geeraerts (eds.), 7—42. Berlin/New
York: Mouton de Gruyter.
Auer, Peter and Frans Hinskens.
1996 The convergence and divergence of dialects in Europe. New and
not so new developments in an old area. Sociolinguistica 10: 1—
30.
Campbell, Lyle
2004 Historical Linguistics: An Introduction. Edinburgh: Edinburgh
University Press.
Chambers, J.K.
2003 Sociolinguistic Theory. Cambridge: Blackwell.
Chambers, J.K. and Peter Trudgill
1998 (11980) Dialectology. Cambridge: Cambridge University Press.
Coetsem, Frans van
1988 Loan Phonology and the Two Transfer Types in Language Con-
tact. Dordrecht: Foris.
Coupland, Nikolas
2001 Dialect stylization in radio talk. Language in Society 30: 345—
375.
Eckert, Penelope
2001 Style and social meaning. In Style and Sociolinguistic Variation,
Penelope Eckert and John R. Rickford (eds.), 119—126. Cam-
bridge: Cambridge University Press.
Geeraerts, Dirk
2001 Een zondagspak? Het Nederlands in Vlaanderen: Gedrag, beleid,
Attitudes. Ons Erfdeel 44: 337—343.
Goeman, Ton and Johan Taeldeman
1996 Fonologie en morfologie van de Nederlandse dialecten. Een
nieuwe materiaalverzameling en twee nieuwe atlasprojecten.
Taal en Tongval 48 (1): 38—59.
Gooskens, Charlotte and Wilbert Heeringa

2004 Perceptive evaluation of Levenshtein dialect distance measure-
ments using Norwegian dialect data. Language Variation and
Change 16 (3): 189—207.
Greenhill, Simon J.
2011 Levenshtein distances fail to identify language relationships ac-
curately. Computational Linguistics 37 (4): 689—698.
Grondelaers, Stefan, Hilde van Aken, Dirk Speelman, and Dirk Geeraerts
2001 Inhoudswoorden en preposities als standaardiseringsindicatoren.
De diachrone en synchrone status van het Belgische Nederlands.
Nederlandse Taalkunde 6: 179—202.
Gussenhoven, Carlos
2007 Wat is de beste transcriptie voor het Nederlands? Nederlandse
Taalkunde 12: 331—350 .
Haugen, Einar
1966 Dialect, language, nation. American Anthropologist 68: 922—
935 .
Hinskens, Frans
1998 Dialect levelling: a two-dimensional process, Folia Linguistica,
XXII (1—2) (Peter Auer, guest editor), 35—51.
Hinskens, Frans
to appear Koineization in the present-day Dutch dialect landscape:
postvocalic /r/ and more. InThe Formation of Regiolects in the
Low Countries (special issue of Taal en tongval), : Wilbert
Heeringa and Gunther de Vogelaer (eds).
Hinskens, Frans, Peter Auer, and Paul Kerswill
2005 The study of dialect convergence and divergence. Conceptual
and methodological considerations. In Dialect Change: Conver-
gence and Divergence in European Languages, Peter Auer, Frans
Hinskens, and Paul Kerswill (eds.), 1—50. Cambridge: Cam-
bridge University Press.
Hoppenbrouwers, Cor
1983 Het genus in een Brabants regiolect. TABU, Bulletin voor Neder-
landse Taalkunde 13: 1—25.
Hoppenbrouwers, Cor
1990 Het regiolect: van dialect tot algemeen Nederlands. Muiderberg:
Coutinho.
Howell, Robert B.

2006 Immigration and koineization: the formation of Early Modern
Dutch urban vernaculars. Transactions of the Philological Socie-
ty 104: 207—227.
Howitt, Dennis and Duncan Cramer
2008 Introduction to Research Methods in Psychology. Edinburgh
Gate: Prentice Hall.
Impe, Leen, Dirk Geeraerts, and Dirk Speelman
2008 Mutual intelligibility of standard and regional Dutch language
varieties. International Journal of Humanities and Arts Compu-
ting 2 (1–2): 101—117.
Kerswill, Paul
2003 Dialect levelling and geographical diffusion in British English. In
Social Dialectology. In Honour of Peter Trudgill, David Britain
and Jenny Cheshire (eds.), 223–243. Amsterdam: Benjamins.
Labov, William
1972 Sociolinguistic Patterns. Philadelphia: University of Pennsylva-
nia Press.
Leinonen, Therese
2010 An acoustic analysis of vowel pronunciation in Swedish dialects.
Ph.D. Diss., University of Groningen.
Levenshtein, Vladimir
1965 Binary codes capable of correcting deletions, insertions and re-
versals. Cybernetics and Control Theory 10 (8): 707—710.
(translation of Левенштейн, В. И.. Двоичные коды с
исправлением выпадений, вставок и замещений символов.
Доклады Академий Наук СССР 163 (4): 845–848.). Mattheier, Klaus
1996 Varietätenkonvergenz: Überlegungen zu einem Baustein einer
Theorie der Sprachvariation. Sociolinguistica 10: 1—31.
Nerbonne, John and Wilbert Heeringa
2009 Measuring dialect differences. In Language and Space: Theories
and Methods, in series Handbooks of Linguistics and Communi-
cation Science, Jürgen Erich Schmidt and Peter Auer (eds.),
550—567. De Gruyter, Berlin.
Randstadmonitor 2006
2006 Utrecht: Regio Randstad.
http://www.rijksoverheid.nl/onderwerpen/randstad/documenten-
en-publicaties/brochures/2007/12/01/randstadmonitor-2006.html
Sanders, Nathan and Steven B. Chin

2009 Phonological distance measures. Journal of Quantitative Linguis-
tics 16 (1): 96—114.
Smakman, Dick.
2006 Standard Dutch in the Netherlands. A sociolinguistic and phonet-
ic description. Ph.D. dissertation, Radboud University..
Sobrero, Alberto A.
1996 Italianization and variations in the repertoire: the Koinai. Socio-
linguistica 10: 105—111.
Spruit, Marco René, Wilbert Heeringa, and John Nerbonne
2009 Associations among Linguistic Levels Lingua 119 (11). Spec. is-
sue The Forests behind the Trees, John Nerbonne and Franz
Manni (eds.).1624—1642.
Streck, Tobias
2012 Phonologischer Wandel im Konsonantismus der alemannischen
Dialekte Baden-Württembergs. Sprachatlasvergleich, Spontan-
sprache und dialektometrische Studien. Stuttgart: Steiner (Zeit-
schrift für Dialektologie und Linguistik - Beihefte, Band 148).
Trudgill, Peter
1986 Dialects in Contact. Oxford: Blackwell.
Velde, Hans van de
1996 Variatie en verandering in het gesproken Standaard-Nederlands
(1935—1993). Ph.D. Diss., University of Nijmegen.
Verhoeven, Jo
2005 Belgian Standard Dutch. Journal of the International Phonetic
Association 35: 243—247.
Wieling, Martijn, Wilbert Heeringa, and John Nerbonne
2007 An aggregate analysis of pronunciation in the Goeman-
Taeldeman-van Reenen-Project. Taal en Tongval 59: 84—116.
Wieling, Martijn, Eliza Margaretha, and John Nerbonne
2012 Inducing a measure of phonetic similarity from pronunciation
variation. Journal of Phonetics 40 (2): 307—314 .
Wieling, Martijn and John Nerbonne
2011 Measuring Linguistic Variation Commensurably. Dialectologia,
Special Issue II. 141—162.
Wieling, Martijn, John Nerbonne, and Harald Baayen
2011 Quantitative Social Dialectology: Explaining Linguistic Variation
Geographically and Socially. PLoS ONE, 6 (9): e23613.
doi:10.1371/journal.pone.0023613
Wieling, Martijn, Jelena Prokić, and John Nerbonne

2009 Evaluating the pairwise string alignment of pronunciations. In
Language Technology and Resources for Cultural Heritage, So-
cial Sciences, Humanities, and Education (LaTeCH - SHELT&R
2009) Workshop at the 12th EACL, Lars Borin and Piroska
Lendvai (eds.), 26—34. Athens, 30 Mar. 2009.
7