johnson tj, o'rourke d, burris j and owens l (2002) culture and survey nonresponse. pp
TRANSCRIPT

Warning Concerning Copyright Restrictions
The Copyright law of the United States (Title 17, United States Code) governs themaking of photocopies or other reproductions of copyright material. Under certainconditions specified in the law, libraries and archives are authorized to furnish aphotocopy or other reproduction. One of these specified conditions is that the photocopyor reproduction not be "used for any purposes other than private study, scholarship, orresearch." If a user makes a request for, or later uses, a photocopy or reproduction forpurposes in excess of "fair use," that user may be liable for copyright infringement.

I I
I I 1
CHAPTER 4
Culture and Survey Nonresponse Timothy P. Johnson, Diane O'Rourke, Jane Burris, and Linda Owens, Survey Research Laboratory, University of Illinois at Chicago
4.] INTRODUCTION
Surveys are an inherently social activity. Survey respondents are not merely autonomous information processors, rather, they all exist within complex social matrices that influence their thoughts, feelings, and behaviors. There is now a developing body of evidence regarding avenues by which cultural conditioning may influence the cognitions of survey respondents. Johnson et al. (1997), for example, have reported evidence suggesting cultural variability in survey question comprehension, memory retrieval, judgment formation, and response editing processes in a sample of African American, Mexican American, Puerto Rican, and non-Hispanic White respondents in the United States. Less is known, however, regarding how respondent culture influences survey nonresponse. In this chapter, we review the available empirical literature and discuss theoretical approaches that may be useful in understanding pat1ems of survey nonresponse across cultures.
1n conducting this review, we acknowledge that there are hundreds of definitions of "culture." Hofstede (1980a, p. 21) has defined culture as "the collective programming of the mind which distinguishes the members of one group from another." Triandis (1996, p. 408) defines culture as consisting of "shared elements that provide the standards for perceiving, believing, evaluating, communicating. and acting among those who share a language, a historic period, and a geographic location." Smith and Bond (1998, p. 69) define it more simply as "systems of shared meanings." In our previous work, we have interpreted culture as representing a social group with "a shared language and set of norms, values, beliefs, expectations and life experiences" (Johnson et aI., 1997, p. 87). We retain that definition here in modified form that acknowledges Triandis' concern with the temporal boundaries of culture.
55

S6 CULTURE AND SURVEY NON RESPONSE
4.2 EMPIRICAL EVIDENCE
While there may be hundreds of approaches to conceptualizing culture, measuring it is more problematic. In our review of the available literature, we have identified two forms of empirical measurement that permit some cross-cultural comparisons. Neither of these approaches is completely satisfactory. Each, nonetheless, provides an opportunity to explore the potential effects of culture on nonresponse.
The first approach comes from studies conducted in the United States, where considerable research is available that examines nonresponse behavior across selfidentified racial and/or ethnic subgroups within that country. Our review identified 26 comparisons of race and/or ethnic differences in survey nonresponse indicators in U.S. studies conducted since 1975. These studies examined differences in nomesponse to cross-sectional surveys, differences in attrition from panel surveys, and differences in nonresponse to the U.S. Census. Tables 4.1-4.2 summarize this research. In reviewing this information, it is important to note that the outcomes being assessed are not consistent across studies. Some examine respondent refusals only, others assess inability to track or locate respondents, and some examine the resistance of respondents to survey participation. Also, examining nonresponse within a single nation, even one as pluralistic as the United States, will almost certainly find only attenuated cultural effects. The fact that much of the U.S. research is limited to White-Black differences, and that many of that country's ethnic groups are not represented at all, only adds to this problem. We nonetheless treat these empirical studies as an imperfect, but available, data source that is useful in evaluating potential cultural influences on survey nonresponse.
A second, smaller body of research is also available that compares elements of survey nonresponse across nations, permitting cultural comparisons at this broader level of analysis. Unlike the U.S. studies, this approach offers the promise of exploring a wider range of cultural orientations than may be possible within a single country. In doing so, though, it risks masking over subcultural variability, particularly within heterogeneous societies. Variations in the specific survey methodologies used in each country also pose a significant challenge to cross-national nonresponse comparisons.
4.2.1 Studies of Survey Nonresponse in the United States
In Table 4.1, six examinations ofnonresponse from cross-sectional U.S surveys are summarized. No differences in nonresponse were found by race in four of them. However, in their assessment of six government-sponsored surveys, Groves and Couper (1998) found that Hispanics were more likely to cooperate than other racial/ethnic groups, even after adjusting for differences in the age and socioeconomic compositions of the groups. Another study that focused on Hispanic groups only found lower response rates among Cubans, relative to Mexican American and Puerto Rican respondents (Rowland and Forthofer, 1993). With the exception of Groves and Couper (1998), these studies in general make few distinctions between ,."fnc'> 1 !>nil nl'm('nnt~('t rMp.!:
I )
u; (!)
'§ c:: .g ~ (!) 0.. o o '.)
.5

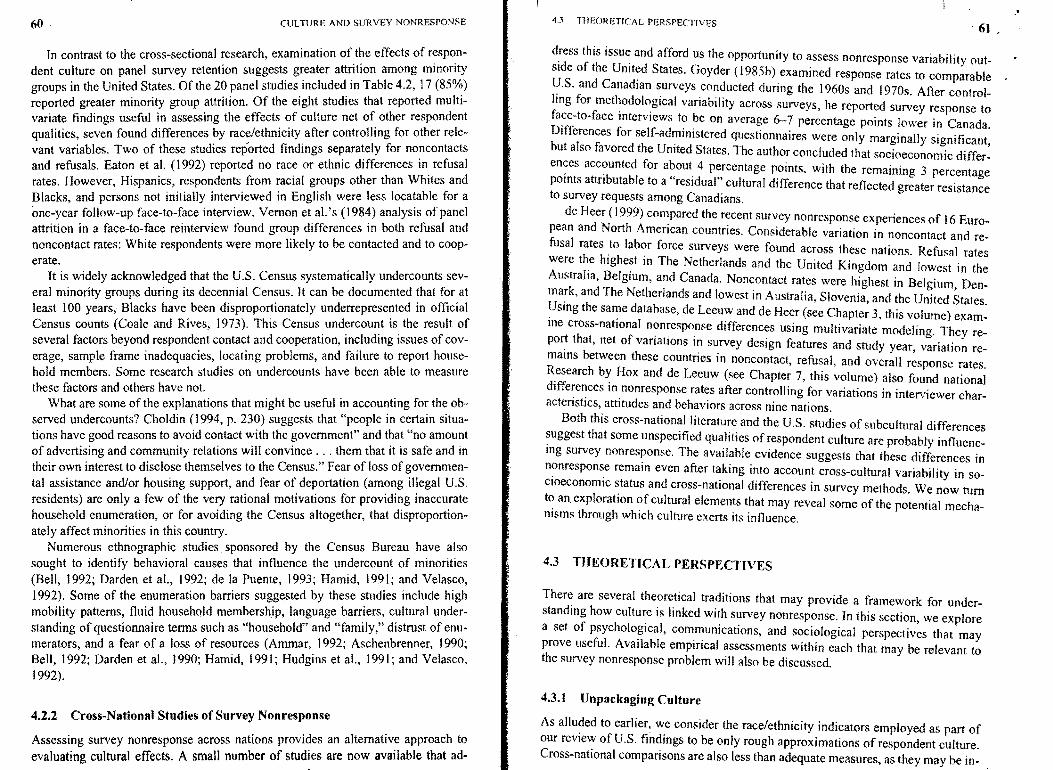
~able 4.2. Findings from studies of cultural differences in follow-up nonresponse to panel surveys
:tudy Population (follow-up year) Follow-up method Analysis type Findings
I.neshensel et at. (1987) Los Angeles adults (1983) 4 year telephone Bivariate Minorities higher attrition
I.neshensel et at. (1989) Los Angeles adolescent females 2 year face-to- face Multivariate Mexican-born higher attrition
iroman et at. (1994) Michigan autoworkers (1989) -2 year telephone Bivariate Blacks less likely to be reinterviewed
~hen and Kandel (1995) NY state high school students (1990) 19 year reinterview Bivariate Minorities less likely to be reinterviewed
)avidson et at. (1997) Women from family planning One year telephone Bivariate No race differences in attrition. clinics in NY, Dallas, and reinterview Pittsburgh (1994-1995)
~aton et aL (1992) Adults 18-64 in Baltimore, L.A., 1 year face-to-face Multivariate Hispanics less likely to be located St. Louis, and Durham, NC, ECA reinterview for a reinterview (1979-1983)
~inkelhor et at. (1995) Nationwide sample of young -15 month Bivariate Black and Hispanic households people and their caretakers (1993) telephone follow-up less likely to be reinterviewed
~Iay et at. (1993) Adult smokers in Chicago (1989) Four month Bivariate "Negligible" effects of race on attrition telephone
-Iarris-Kojetin and Tucker Nationwide adults, CPS (1995) 8 interviews over a Multivariate Nonwhites and Hispanics less likely to 1998) 16 month period have completed all eight interviews
-lowell and Frese (1983) Southern U.S. high school 13 year fact -to- face Bivariate Blacks "somewhat" less likely to be students (1979) reinterview reinterviewed
rohnson (1988) Nationwide adults, NSPHPC (1980) One year telephone Multivariate Nonwhites more attrition
«laMUR :s iiJi ji Xii::: ttl .iL .141$ X4:;S a. Q lUI $ au ; .
Lavrakas et at. (1991) Two samplcs of Chicago adults # I: 12 month phone Bivariate #1: Blacks less likely to be (1984 and 1985) remterview reinterviewed
#2: 16 month phone #2: Asians and Blacks less likely reinterview to be reinterviewed
Lepkowski and Couper I. Nationwide adults, ACL (1986) #1: 2.5 & 7.5 years! Multivariate # I: Blacks more difficult to (this volume) 2. Nationwide adults, NES (1990) face-to-face recontact. Race not associated
reinterviews with cooperation #2: 2 year telephone #2: Race not associated with reinterview recontact. Blacks and Hispanics
higher refusal rates Madans et al. (1986) Nationwide adults, NHANES Face-to-face/phone Bivariate Blacks higher attrition
(1982-1984 )
Marcus and Telesky (1983) Los Angeles adults (1976) 8 telephone Multivariate No race differences
interviews in I year Menaghan and Merves Chicago adults ages 22-69 (1976) 4 year face- to-face Bivariate Nonwhites had greater attrition :1984)
['atterson et al. ( 1996) Washington state adults (1992-1993) 3 year telephone Bivariate Nonwhites more attrition ~hettle and Mooney (1999) College graduates, retired CPS 3 year maill Multivariate Asian, Black, and Hispanic Whites less
Sample (1992) telephone reinterview likely to respond to follow-up survey )inger et a!. (1999) Detroit adults, DAS (1996) I year mail Multivariate Blacks higher nonresponse Vernon et at. (1984) Alameda County, CA adults 3-4 year face-to- face Bivariate Mexican Americans and Blacks more
(1978) reinterview likely to refuse; Mexican Americans
60 . CULTURE AND SURVEY NONRESPONSE
In contrast to the cross-sectional research, examination of the effects of respondent culture on panel survey retention suggests greater attrition among minority groups in the United States. Of the 20 panel studies included in Table 4.2, 17 (85~) reported greater minority group attrition. Of the eight studies that reported multIvariate findings useful in assessing the effects of culture net of other respondent qualities, seven found differences by race/ethnicity after controlling for other relevant variables. Two of these studies reported findings separately for noncontacts and refusals. Eaton et al. (1992) reported no race or ethnic differences in refusal rates. However, Hispanics, respondents from racial groups other than Whites and Blacks, and persons not initially interviewed in English were less locatable for a one-year follow-up face-to-face interview. Vernon et al.'s (1984) analysis of panel attrition in a face-to-face reinterview found group differences in both refusal and noncontact rates: White respondents were more likely to be contacted and to cooperate.
It is widely acknowledged that the U.S. Census systematically undercounts several minority groups during its decennial Census. It can be documented that for at least 100 years, Blacks have been disproportionately underrepresented in official Census counts (Coale and Rives, 1973). This Census undercount is the result of several factors beyond respondent contact and cooperation, including issues of coverage, sample frame inadequacies, locating problems, and failure to report household members. Some research studies on undercounts have been ahle to measure these factors and others have not.
What are some of the explanations that might be useful in accounting for the observed undercounts? Choldin (1994, p. 230) suggests that "people in certain situations have good reasons to avoid contact with the government" and that "no amount of advertising and community relations will convince ... them that it is safe and in their own interest to disclose themselves to the Census." Fear of loss of governmental assistance and/or housing support, and fear of deportation (among illegal U.S. residents) are only a few of the very rational motivations for providing inaccurate household enumeration, or for avoiding the Census altogether, that disproportionately affect minorities in this country.
Numerous ethnographic studies. sponsored by the Census Bureau have also sought to identify behavioral causes that influence the undercount of minorities (Bell, 1992; Darden et aI., 1992; de la Puente, 1993; Hamid, 1991; and Velasco, 1992). Some of the enumeration barriers suggested by these studies include high mobility patterns, fluid househQld membership, language barriers, cultural understanding of questionnaire terms such as "household" and "family," distrust of enumerators, and a fear of a loss of resources (Ammar, 1992; Aschenbrenner, 1990; Bell, 1992; Darden et aI., 1990; Hamid, 1991; Hudgins et aI., 1991; and Velasco, 1992).
4.2.2 Cross-National Studies of Survey Nonresponse
Assessing survey nonresponse across nations provides an alternative approach to evaluating cultural effects. A small number of studies are now available that ad-
4.3 THEORETICAL PERSPECTIVES 61 .
d:ess this issu~ and afford us the opportunity to assess nonresponse variability outSide of the UDlt~d States. Goyder (1985b) examined response rates to comparable l!.S. and Canadian surveys conducted during the 1960s and I 970s. After controlhng for met~odological variability across surveys, he reported survey response to fa~e-to-face interviews to be on average 6-7 percentage points lower in Canada. Differences for self-administered questionnaires were only marginally significant but also favored the United States. The author concluded that socioeconomic differ~ en~es acc?unted for about 4 percentage points, with the remaining 3 percentage pOints attnbutable to a "residual" cultural difference that reflected greater resistance to survey requests among Canadians.
de Heer (1999) compared the recent survey nonresponse experiences of 16 European and North American countries. Considerable variation in noncontact and refusal rates to labor force surveys were found across these nations. Refusal rates were the highest in The Netherlands and the United Kingdom and lowest in the Australia, Belgium, and Canada. Noncontact rates were highest in Belgium, Denmark, and The Netherlands and lowest in Australia, Slovenia, and the United States. ~slng the sa~e database, deLeeuw and de Heer (see Chapter 3, this volume) examme cross-national n?nrespo.nse differences using multivariate modeling. They report that, net of vanatlOns In survey design features and study year, variation remams between these countries in noncontact, refusal, and overall response rates. R.esearch b~ Hox and de Leeuw (see Chapter 7, this volume) also found national differences In nonresponse rates after controlling for variations in interviewer characteristics, attitudes and behaviors across nine nations.
Both this cross-national literature and the U.S. studies of subcultural differences ~uggest that some unspecified qualities of respondent culture are probably influencIng survey nonresponse. The available evidence suggests that these differences in n?nrespon~e remain even after taking into account cross-cultural variability in socioeconomic status and cross-national differences in survey methods. We now turn t~ an exploration ~f cultural elements that may reveal some of the potential mechamsms through which culture exerts its influence.
4.3 THEORETICAL PERSPECTIVES
There are several theoretical traditions that may provide a framework for understanding how culture is linked with survey nonresponse. In this section, we explore a set of psycholo~ical, com.~unications. and sociological perspectives that may prove useful. Available empIrIcal assessments within each that may be relevant to the survey nonresponse problem will also be discussed.
4.3.1 Unpackaging Culture
As allu?ed to earlier~ we consider the race/ethnicity indicators employed as part of our review of U.S. findings to be only rough approximations of respondent culture. Cross-national comparisons are also less than adequate measures, as they may be in-
.'

62 CULTURE AND SURVEY NONRESPONSE
sensitive to subcultural differences. To understand how and why culture influences social behavior, it is necessary to "unpackage" this concept by identifying the specific values and orientations through which it operates. Several dimensions, commonly referred to as cultural "layers" or "orientations," have in fact been identified that have proven useful in developing theories regarding social behav.ior aC.ross ~road cultural groups. Researchers have identified a variety of cultural onentatlons, Includmg uncertainty avoidance, masculine versus feminine orientation, and long- versus shortterm time orientations (Hofstede, I 980a; 1991). In this section, we consider three orientations that may be useful in understanding nonresponse differences. Of primary interest will be (1) individualist versus collectivist orientations, (2) power distance, and (3) emphasis on vertical versus horizontal relationships.
Individualist Versus Collectivist Orientation. Cultures vary in the amount of emphasis they place on personal versus group interests or individualism versus collectivism. Self-identity and personal goals are inseparable from, and independent of, the larger social group in collectivist and individualist cultures, respectively. In collectivist cultures, norms, obligations, and duties tend to guide social behavior, whereas personal needs, rights, and contracts guide behavior in individualist cultures. Another important distinction is that collectivist cultures place great emphasis on ingroups versus out groups. Ingroups are those social groups "about whose welfare one is concerned, and with whom one is willing to cooperate without demanding equitable returns, and separation from whom leads to discomfort or even pain" (Triandis et aI., 1984, p. 75).
In general, homogeneous and less complex cultures are more likely to be collectivist and cultures that are more complex and heterogeneous tend to be individualist rfriandis, 1994). The cultures of Western European nations, and those with strong ties to this region, are generally classified as having strong individualistic orientations. Third World nations and cultures, in contrast, tend to be more collectivistic (Gudykunst and Kim, 1997; Hofstede, 1991). Within the individualistically oriented United States, several minority groups, including those with roots in Latino and Asian cultures, nonetheless tend to be more collectivistic in their outlook
(Triandis et aI., 1984). What implications might these cultural qualities hold for survey nonresponse?
Gudykunst (1997) argues that collectivists are more likely to view outgroups with suspicion. We believe that survey organizations are more likely to be viewed as outgroups within minority communities. Recognition of this fact ~as ~ro~pted many researchers to employ "local talent" when conducting surveys In mInonty communities (see Gwiasda et aI., 1997; Weinberg, 197 I). Persons with individual.ist. ori~ntations, in contrast, would be less likely to make an ingroup-outgroup .dlstInctIon when evaluating a survey request. Instead, they might be expected to vIew the request using a simple cost-benefit evaluation, social exchange, or calculus (Groves
and Couper, 1998).
Power Distance. Power distance is concerned with social inequality and the degree to which individuals hold power over one another. Hofstede and Bond (1984,
I )
4.1 THEORETICAL PERSPECTIVES 63
p. 419) define this as "the extent to which the less powerful members of institu- • tions and organizations accept that power is distributed unequally." Its relevance to survey nonresponse is its potential usefulness in interpreting the behavior of strangers during encounters with one another, especially those that may involve varying degrees of power or authority. Persons in low power distance cultures do not accept authority uncritically; they expect it to be legitimated. In cultures with high degrees of power distance, individuals are less likely to question authority, and as Gudykunst (1997, p. 333) points out, "they expect to be told what to do." At first glance, one might expect that such forms of cultural coercion would make it easier to collect survey data from respondents within cultures high in power distance. However, power distance is also strongly correlated with collectivism: that is, cultures high in collectivism also tend to have a great deal of power distance (Smith and Bond, 199R). Conformity and obedience to authority are also strongly associated with power distance and collectivism (Bond and Smith, 1996; Mann, 19RO).
Collectivistic cultures treat ingroups and outgroups very differently, and this distinction likely applies to respect for power as well. Consequently, power distance in practice might be expected to improve compliance only to ingroup survey requests in collectivist cultures. Requests from outgroups would likely be met with greater opposition within collectivistic cultures, regardless of the power distance involved. One might also expect less pressure to comply with survey requests in low power distance cultures and this is probably correct. Because low power distance cultures, also tend to be individualistic in orientation, however, outgroup survey requests would also be less likely to be treated differently from in group requests. We might thus hypothesize that survey requests would be greeted with: (a) the most compliance within low power distancelhigh collectivism cultures when the request is made on behalf of an ingroup; (n) the least compliance within low power distancelhigh collectivism cultures when the request is made on behalf of an outgroup; and (c) intermediate levels of cflmpliance within cultures low on power distance and high on individualism.
Vertical Versus Horizontal Relationship .... A third cultural orientation that we briefly examine is concerned with societal emphasis on vertical versus horizontal social relationships. As Triandis (1996) has observed, hierarchy is very important to some cultural groups that place a high emphasis on authority and are willing to accept social inequality. Other societies place less emphasis on hierarchical systems of authority and may be considered more egalitarian in nature. Examples of vertical societies include India and the United States. Horizontal societies include Sweden and Australia. It seems likely that survey nonresponse would be less of a problem among cultural groups with hierarchical orientations, so long as those requesting cooperation are perceived as having legitimate authority to do so. This relationship might be further conditioned by ingroup versus outgroup interaction, however, in that perceived outgroup requests for survey participation may be less respected in vertical societies. Horizontal cultures, in contrast, may make fewer distinctions between ingrollp and outgroup requests for survey participation.

64 I I I I
CULTURE AND SURVEY NONRESPONSE
4.3.2 Culture and Communication Styles
Communication is perhaps the most fundamental element of the survey process. It has been described as a self-corrective mechanism whereby participants continually check their environment to assure that others have sufficient prior knowledge to reach a mutual understanding (Much, 1991). Effective communication between survey respondents and researchers requires the establishment of a level of intersubjectivity that reflects mutual understanding. Intersubjectivity may be defined as implicit agreement to share the same understanding. The establishment of intersubjectivity allows the formation of a common conceptual framework that permits the respondent to interact within the survey environment without feeling threatened or exposed. This communicative interaction, if established, represents a "partially shared social world" in which each participant implicitly understands the role of the other and cultural differences may be circumvented by the willingness of each to see the other's point of view (Rommetveit, 1974). The extent to which interSUbjectivity can be established between the respondent and researcher may influence the respondent's willingness to participate in research and the infonnation they disclose.
Cultures are known to vary along several dimensions of communicative style and several of these have implications for survey nonresponse. Among the communicative norms we explore in this regard are (I) contextual requirements, (2) nonverbal behaviors, and (3) self-disclosure patterns.
Cultural Differences in Context Requirements. Cultures are believed to vary in their reliance on high- versus low-context communication processes. In cultures with low-context requirements, a message's meaning is inferred directly from its content with little regard for context. According to Hecht et al. (1989, p. 176), low context messages require "clear description, unambiguous communication, and a high degree of specificity." Messages ofthis fonn are commonly used in situations where precision and clarity are essential, and where double meanings cannot be tolerated, such as in legal communications and computer programming. High-context . cultures, by way of comparison, place greater emphasis on the message's context. Thus, messages are interpreted not only from their explicit content but also as a function of nonverbal environmental cues and inferred meanings. Gudykunst (1998) suggests that individualistic cultures rely primarily on low-context communication styles, while collectivistic cultures have higher context requirements. Perhaps not surprising, then, are the findings that North American and North European. cultures are classified as low-context whereas East Asian and Latin American cultures are considered to be high-context societies (Hecht et al., 1989).
How might contextual needs influence survey nonresponse? Persons enmeshed in high-context environments may be more cautious in their first interactions with new acquaintances and develop more assumptions about them based upon contextual information (Gudykunst, 1983). Consequently, we speculate that environmental cues may be more likely to influence decisions regarding survey participation among potential respondents with high-context communication styles. In such encounters, interviewers may also be less likely to be taken at "face value" and their
, I I I 13 THEORETICAL PERSPECTIVES I
"real" motives perhaps more likely to be questioned. Because persons in high·. context cultures are also more likely to form assumptions about persons based on their racial or ethnic background (Gudykunst and Kim, 1997), one might also expect to find greater effects of respondent-interviewer social distance on survey nonresponse when surveying persons possessing high-context communication styles. This tnric wi II he explored further in the next section.
Nonverbal Behavior. Nonverbal communication has been referred to as the "hidden dimension" of culture (Hall, 1966). Although more so in high-context cultures, all social groups employ some fonns of nonverbal communication. Cross-cultural variability in expectations regarding the appropriateness of eye contact, expressions of emotion, various degrees of interpersonal distance, and sensory involvement during initial encounters may be exrected to lead to higher rates of misunderstanding and survey nonresponse.
Self-Disclosure. Revelation of personal infonnation, or self-disclosure, is critical to communication and obviously necessary for survcy participation. Research conducted in the United States suggests that Whites disclose information at higher rates than do Blacks (Gudykunst and Kim, 1997). Kochman (1981) has presented considerable information on differences in the communication styles of Blacks and Whites in the United States. These include the acceptability of direct questions, acceptable fonns of disagreement, rules for taking turns in conversations, and the importance of various forms of nonverbal communication. Each of these variations in communicative styles may be expected to influence patterns of self-disclosure. Blacks have also been shown to self-disclose more infonnation than do Mexican Americans (Littlefield, 1974). Self-disclosure is most frequently associated with the types of direct, low-context communication patterns observed in individualistic social systems, as opposed to the less direct styles seen in collectivist cultures (Gudykunst, 1998). In our earlier discussion, it was observed that ingroup versus outgrollP interactions arc qualitatively different in collectivist, but not necessarily within individualistic, cultures. Available evidence suggests that variations in selfdisclosure follow a similar pattern. Gudykunst et aI. (1992) have observed greater self-disclosure among ingroup members in samples of presumably collectivist Chinese respondents. In contrast, they found few differences in ingroup versus outgroup self-disclosure among individualistic U.S. and Australian samples. Another comparative analysis found similar differences in patterns between respondents in the United States and Poland, a more collectivist country, where a greater distinction was made between willingness to disclose to friends and neighbors, compared to the United States (Derlegh and Stelien, 1977). We suspect that resistance to selfdisclosure may be correlated with nonresponse. Although it has not been demonstrated, it seems intuitive that less intention to self-disclose when invited to interact with a stranger should also be predictive of less willingness to engage in any interaction with that individual. It also seems likely that perceptions of the group or institution represented by an interviewer may moderate respondent willingness to participate (Groves and Couper, 1998).
I.

CULTURE AND SURVEY NONRESPONSE
4.3.3 Culture and Social Participation
Patterns of social participation may also be influenced via culture and cultural experiences. In this section, we review three culturally mediated social processes that may influence survey nonresponse: (I) minority group oppression and opposition, (2) social distance perceptions, and (3) helping behavior.
Minority Oppression and Opposition. Interethnic misunderstanding and animosity are unfortunate realities of which we are reminded on an all-too-regular basis. Ethnic minorities in many nations face discrimination, religious and cultural repression, and barriers to social and economic advancement. Alienation from and flPpOsition to the dominant culture are perhaps inevitable consequences of these experiences. A contemporary example is the generalized suspicion and mistrust of Whites by many Black Americans after centuries of race-related mistreatment (Massey and Denton, 1993; Ogbu, 1990; Terrell and Terrell, 1981). There are also multiple historical examples of medical research exploiting Black Americans in the name of scientific advancement dating back centuries (Fry, 1984; Gray, 1998; Humphrey, 1973).
Some survey evidence is available documenting greater levels of mistrust in general among Blacks, compared to other survey respondent~. Singer et al. (1993) found that Blacks, but not Hispanics, had higher scores on measures of concern with the privacy and confidentiality of the 1990 U.S. Census when contrasted with non-Hispanic Whites. Aquilino (1994) reported similar findings suggesting that Blacks were less likely than Whites to believe that most people can be trusted. In addition, an experimental assessment of three alternative household rostering methods discovered that an anonymous version added about 30% more Black male residents, on average, per enumerated dwelling (Tourangeau et aI., 1997). This finding suggests that deliberate concealment may be a significant reason for the Census undercounts of Blacks described earlier.
Finally, many Black communities resent the intrusion of outside researchers who they believe often benefit professionally by revealing neighborhood problems (Brazziel, 1973; Josephson, 1970; Myers, 1979). Representatives of other minority groups in the United States (Weiss, 1977; Yu, 1982) have expressed similar feelings. These circumstances suggest that many of the same factors that serve as barriers to the socioeconomic advancement of minority populations, such ~s poor education, poverty, and discrimination, may also serve as barriers to survey participation. We believe the U.S. Black-White experience serves as a useful example of how unique, historical patterns of intercultural relations may influence survey nonresponse patterns worldwide.
Social Distance. Bogardus (1925, p. 299) defined "social distance" as "the degrees and grades of understanding and feeling that persons experience regarding each other." Perceptions of social distance are thought to be influenced by personal similarities in demographics, attitudes and abilities, power differences, and predictability (Triandis, 1994). Interviewers are often demographically "matched" with the
1.4 SUMMARY 67
race or ethnic composition of neighborhoods where fieldwork is to be done in hopes of minimizing social distance and increasing response rates (Nandi 1982' Hurh and Kim, 1982). Concern has also been expressed that, because of cultural difference~ in the social status of women and normative expectations regarding appropriate forms of cross-gender communication, male respondents may be less inclined to comply with an interview request in some cultures when the interviewer is female (Johnson et aI., I 997). In other cultures, male interviewers, particularly of different cultural backgrounds, might not be considered appropriate for interviewing female respondents. So confident are researchers of the wisdom of this social distance strategy that virtually nfl empirical studies have been conducted to confirm its efficacy.
Helping Behavior. Potential cultural differences in willingness to assist a stranger, often referred to as "helping behavior," may also be relevant to survey non response. Variations in helping behavior have been more commonly associated with urbanicity and used to understand nonresponse in that context (Groves and Couper. 1998). A review of the helping literature in the United States by Crosby et al. (1980) found, perhaps not surprisingly, that intraracial helping was more common than intcrracial helping. Of J:l experiments examined, Whites were significantly more likely to help Whites in 6 (46.1 %), Blacks were more likely to be helped by Whites in 2 (15.4%), and 5 differences were not significant (38.5%). Similarly, Blacks wcre somewhat more likely to help Blacks under identical circumstances (in 7 of 13 experimcnts; 53.8%). Whites were more likely to be helped by Blacks in 2 experiments (15.4%), and differences were not significant in 4 others (30.8%).
These findings are consistent with Triandis' (1994, p. 221) observation that "in all cultures people are more likely to help an ingroup member than an outgroup memher" (although the probabilities may vary between individualist and collectivist cultures). No differences in helping behavior were found by Hedge and Yousif (1992), who reported highly similar rates between England and the Sudan. Miller et al. (1990), in contrast, found considerably greater levels of self-reported helping behavior among respondents in India compared to the United States. A major difficulty in evaluating this body of literature is the wide variety of methods employed to measure helping behavior. Nonetheless, general trends such as the consistent relationship between varied measures of helping behavior and urbanicity indicate that this general construct is robust and may be applicable to the survey nonresponse process, particularly considering the degree to which altruistic motives are commonly cited as a reason for survey participation.
4.4 SUMMARY
Our goal in conducting this review has been to investigate the seldom-studied but very important role that culture may play in the survey rcsponse process. In doing so, we have examined the available empirical research literature relevant to the topic. This research suggests cross-cultural variability at both the national and subna-
1

I
tional levels. Interpretations of this literature, of course, are complicated by large variations in research context and design, the forms of nonresponse examined, and populations included. It also remains unclear whether the cross-group differences identified might be more appropriately interpreted as being the consequence of racial, ethnic, and national differences in the various socioeconomic status indicators that have been repeatedly linked with survey nonresponse (Groves and Couper, 1998). Of the subset of studies reviewed that introduced multivariate controls, however, most found independent effects of the cultural indicators after holding education and/or income measures constant. The findings support the notion that there are qualitative differences across cultures and subcultures that are influencing nonresponse patterns.
A number of conceptual schemes were presented that may provide a useful framework for interpreting cultural variability in survey nonresponse. In Figure 4.1, we have integrated these into a conceptual model that shows the means by which a respondent's cultural and social characteristics may influence and interact with survey process to influence nonresponse. Recognizing the complexity and pervasiveness of culture and the processes through which it influences human cognition and behavior, we make no claims regarding the adequacy of this model. We nonetheless believe that the mechanisms identified represent a useful first step toward understanding these processes.
As can be seen in Figure 4.1, we believe that cultural values such as those reviewed in Section 4.3.1 influence both respondent accessibility and cooperation indirectly through their effects on patterns of social participation, preferred styles of communication, and socioeconomic opportunities (note that each of these processes may also influence cultural values). Social participation patterns, communication styles, and socioeconomic status, in tum, likely influence and reinforce one another and also directly influence survey nonresponse. Currently, we believe there is very little evidence available with which to directly test this conceptual model.
Perhaps the greatest weakness of the available empirical literature is its reliance on measures of country of residence and racial or ethnic status that at hest can only
Social Participation .....
1 Patterns 1 ! Respondent
Respondent Socioeconomic ~ Accessibility/
Culture Opportunities Cooperation 1 j 1 ~ Communication Styles
Figure 4.1. Proposed conceptual model of cultural influences on survey nonresponse.
I I
69
roughly approximate culture. We must investigate the limits of these measures and. develop a more sophisticated understanding of those dimensions of culture that are most critical to the conduct of survey research. Determining how these various dimensions map onto the commonly used racial, ethnic, and national indicators will also provide valuable information with which to more precisely interpret the empirical data reviewed in this chapter. Identifying cultural orientations, such as the degree to which a respondent considers him/herself an individualist or part of a collective, have the potential of he Iring us better understand survey nonresponse.

Culture and Survey Nonresponse Timothy Johnson, Diane O'Rourke, Jane Burris and Linda Owens
1111100
References
Ammar, N. (1992). Coverage Differences in a Mixed Neighborhood in Hartford Connecticut. Ethnographic Evaluation of the 1990 Census, Report #21. Prepared under Joint Statistical Agreement 89-35 with the Bureau of the Census. Washington, DC: Bureau of the Census. (http://www.census.gov/srdlpapers/pdf/ev92-2I.pdf).
Aneshense1, C.S., Becerra, R.M., Fielder, E.P. and Schuler, R.H. (1989). Participation of Mexican American Female Adolescents in a Longitudinal Panel Survey. Public Opinion Quarterly, 53, 548-562.
Aneshensel, C.S., Estrada, A.L., Hansell, M.J. and Clark, V.A. (1987). Social Psychological Aspects of Reporting Behavior: Lifetime Depressive Episode Reports. Journal of Health and Social Behavior, 28, 232-246.
Aquilino, W.S. (1994). Interview Modes Effects in Surveys of Drug and A1cohol Use: A Field Experiment. Public Opinion Quarterly, 58, 210-240.
Aschenbrenner, J. (1990). A Community-Based Study of the Census Undercount in a Racially Mixed Area. Ethnographic Evaluation of the 1990 Census, Report # 1. Prepared under Joint Statistical Agreement 89-44 with the Bureau of the Census. Washington, DC: Bureau of the Census (http://www.census.gov/srdlpapers/pdf/ev9I-OI.pdf).
Bell, P.A. (1992). RaciallEthnic Homogeneity of Neighborhoods and Variation in Census Coverage of African Americans. Washington, DC: Bureau of the Census (http://www.census.gov/srdlpapers/pdf/ev93-39.pdf).
Bogardus, E.S. (1925). Measuring Social Distance. Journal of Applied Sociology, 9, 299-308.

Bond, R. and Smith, P.B. (1996). Culture and Conformity: A MetaAnalysis of Studies Using Asch's (1952b, 1956) Line Judgment Task. Psychological Bulletin, 119, 111-137.
Bowman, P.J. (1991). Race, Class and Etmcs in Research: Belmont Principles to Functional Relevance. In Black Psychology, ed. R.L. Jones, Berkeley, CA: Cobbs and Henry.
Brazziel, W.F. (1973). White Research in Black Conununities: When Solutions Become a Part of the Problem. Journal of Social Issues, 29, 41-44.
Broman, e.L., Hoffinan, W.S., and Hamilton, V.L. (1994). Impact of Mental Health Services Use on Subsequent Mental Health of Autoworkers. Journal of Health and Social Behavior, 35, 80-94.
Caldwell, J.G. et al. (1973). Aortic Regurgitation in the Tuskegee Study of Untreated Syphilis. Journal of Chronic Diseases, 26, 187-194.
Casper, R.A (1992). FoJlow-up ofNonrespondents in 1990. In Survey Measurement of Drug Use: Methodological Studies, eds. e.F. Turner, J.T. Lessler and J.e. Gfroerer, Rockville, MD: National Institute on Drug Abuse.
Chen, K. and Kandel, D.B. (1995). The Natural History of Drug Use from Adolescence to the Mid-Thirties in a General Population Sample. American Journal of Public Health, 85,41-57.
ChoJdin, H.M. (1994). Looking for the Last Percent: The Controversy over Census Undercounts. New Brunswick, NJ: Rutgers University Press.
Coale, AJ. and Rives, N.W. (1973). A Statistical Reconstruction of the Black Population of the United States, 1880·]970: Estimates of True Numbers by Age and Sex, Birth Rates, and Total FeJtility. Population Index, 39, 3-36.
?

CottIer, L.B., Zipp, J .F., Robins, L.N. and Spitznagel, E.L. (1987). Difficult-to-Recruit Respondents and Their Effect on Preva1ence Estimates in an Epidemiological Survey. American Journal of Epidemiology, 125, 329-339.
Crosby, F., Bromley, S. and Saxe, L. (1980). Recent Unobtrusive Studies of Black and White Discrimination and Prejudice: A Literature Review. Psychological Bul1etin, 87, 546-563.
Darden, 1., .lones, L. and Price, J. (1992). Ethnographic Evaluation of the Behavioral Causes of Under count in a Black Ghetto of Flint, Michigan. Ethnographic Evaluation of the 1990 Census, Report #24. Prepared under Joint Statistical Agreement with the Bureau of the Census. Washington, DC: Bureau of the Census (bttp://www.census.gov/srdlpapers/pd£'ev92-24.pdf).
Darity, W.A and Turner, c.B. (1972). Family Planning, Race Consciousness and the Fear of Genocide. American Journal of Public HeaJth, 62, 1454-1459.
Davidson, AR., Kalmuss, D.,Cushman, L.F., Romero, D., Heartwell, S. and Rulin, M. (1997). Injectable Contraceptive Discontinuation and Subsequent Unintended Pregnancy Among Low-Income Women. American Journal of Public Health, 87, 1532-1534.
De la Puente, M. (1993). A Multivariate Analysis of the Census Omission of Hispanics and Non-Hispanic Whites, Blacks, Asians and American Indians: Evidence from Small Area Ethnographic Studies. Washington, DC: Bureau of the Census (http://www.census.gov/srdlpapers/pdfJev93-38.pdf).
DeMaio, T.J. (1980). Refusals: Who, Where and Why. Public Opinion Quarterly, 44, 223-233.
Derlega, V.l and Stelien, E.G. (1977). Norms RegUlating SelfDisclosure Among Polish University Students. Journal of Cross-Cultural Psychology, 8, 369-376.

Durant, T. and Jack, L. (1993). Undercount of Black Inner City Residents of New Orleans, Louisiana. Ethnographic Evaluation of the 1990 Census, Report #27. Prepared under Joint Statistical Agreement with the Bureau of the Census. Washington, DC: Bureau of the Census (http://www.census.gov/srdlpaperslpdf/ev93-27.pdf).
Eaton, W.W., Anthony, J.e., Tepper, S. and Dlyman, A. (1992). Psychopathology and Attrition in the Epidemiologic Catchment Area Surveys. American Journal of Epidemiology, 135, 1051-1059.
Fay, RE., Bates, N. and Moore, J. (1993). Lower Mail Response in the 1990 Census: A Preliminary Interpretation. In Proceedings from the 1991 Annual Research Conference, Washington, DC: Bureau of the Census.
Fein, DJ. (1990). Racial and Ethnic Differences in U.S. Census Omission Rates. Demography, 27, 285-302.
Finkelhor, D., Asdigian, N. and Dziuba-Leathennan, J. (1995). Victimization Prevention Programs for Children: A Fol1ow-Up. American Journal of Public Health, 85, 1684-1689.
Flay, B.R, McFall, S., Burton, D., Cook, T.D. and Warnecke, RB. (1993). Health Behavior Changes Through Television: The Roles of De Facto and Motivated Selection Processes. Journal ofHeaIth and Social Behavior, 34, 322-335.
Fry, G.M. (1984). Night Riders in Black Folk History. Knoxville: University of Tennessee Press.
Gamble, V.N. (1997). Under the Shadow of Tuskegee: African Americans and Health Care. American Journal of Public Health, 87, 1773-1778.
Goyder, J. (1985). Nonresponse on Surveys: A Canada-United States Comparison. Canadian Journal of Sociology, 10, 231-251.
Gray, F.D. (1998). The Tuskegee Syphilis Study. Montgomery, AL: Black Belt Press.
4

Groves, RM. (1989). Survey Errors and Survey Costs. New York: John Wiley & Sons.
Groves, RM. and Couper, M.P. (1998). Nonresponse in Household Interview Surveys. New York: John Wiley & Sons.
Gudykunst, W.B. (1983). Uncertainty Reduction and Predictability of Behavior in Low and High Context Cultures. Communication Quarterly, 31,49-55.
Gudykunst, W.B. (1997). Cultural Variability in Communication: An Introduction. Communication Research, 24, 327-348.
Gudykunst, W.B. (1998). Individualistic and Co11ectivistic Perspectives on Communication: An Introduction. International Journal of Intercultural Relations, 22, 107·134.
GudyJ..'Unst, W.B., Gao, G., Schmidt, K.L., Nishida, T., Bond, M.H., Leung, K., Wang, G., and Barraclough, R (1992). The Influence of Individualism-Collectivism on Communication in lngroup and Outgroup Relationships. Jouma] of Cross-Cultural Psychology, 23, 196-213.
Gudykunst, W.B. and Kim, y.y. (1997). Communicating with Strangers: An Approach to Intercultural Communication, Third Edition. New York: McGraw-Hill.
Gwiasda, V., Taluc, N. and Popkin, S.J. (1997). Data ColJection in Dangerous Neighborhoods: Lessons from a Survey of Public Housing in Chicago. Evaluation Review, 21, 77·93.
Hall, E.T. (1966). The Hidden Dimension. New York: Doubleday.
Hamid, A. (1991). Ethnographic Follow-Up ofa Predominantly Afiican American Population in a Sample Area in Central Harlem, New York City: Behavioral Causes of the Undercount of the 1990 Census. Ethnographic Evaluation of the 1990 Census, Report #11. Prepared under Joint Statistical Agreement with the Bureau of the Census. Washington, DC: Bureau of the Census (http://v.-ww.census.gov/srdlpapers/pdflev91-11.pdf).

Hanis-Kojetin, B.A. and Tucker, C. (1998). Longitudinal Nonresponse in the Current Population Survey (CPS). ZUMA Nachtrichten Spezial, 4, 263-272.
Hecht, M.L., Anderson, P.A. and Ribeau, S.A. (1989). The Cultural Dimensions of Nonverbal Behavior. In Handbook oflnternational and Intercultural Communication, eds. M.K. Asante and W.B. Gudykunst, Newbury Park, CA: Sage.
Hedge, A. and Yousif, Y.H. (1992). Effects of Urban Size, Urgency, and Cost on Helpfulness: A Cross-Cultural Comparison Between the United Kingdom and the Sudan. Journal of Cross-Cultural Psychology, 23, 107-115.
Hofstede, G. (1980). Culture's Consequences: International Differences in Work-Related Values. Beverly Hills, CA: Sage.
Hofstede, G. (199]). Cultures and Organizations: Software of the Mind. London: McGraw-Hill.
Hofstede, O. (1998). Masculinity and Femininity: The Taboo Dimension of National Cultures. Thousand Oaks, CA: Sage.
Hofstede, O. and Bond, M.H. (1984). Hofstede's Culture Ddimensions: An Independent Validation Using Rokeach's Value Survey. Journal of Cross-Cultural Psychology, 15,417-433.
Hogan, H. (1993). The 1990 Post-enumeration Survey: Operations and Results. Journal of the American Statistical Association, 88, 1047-1060.
Howell, F.M. and Frese, W. (1983). Size of Place, Residential Preferences and the Life Cycle: How People Come to Like Where They Live. American Sociological Review, 48, 569-580.
Hox, J. and de Leeuw, E. (]999). The Influence ofInterviewers' Attitude and Behavior on Household Survey Nonresponse: An International Comparison. Paper presented at the International Conference on Survey Nonresponse, Portland, OR.

Hudgins, J.L., Holmes, BJ. and Locke, M.E. (1991). The Impact of Family Structure Variations Among Black Families on the Underemuneration of Black Males, Part Two: Focus Group Research. Ethnographlc Evaluation of the 1990 Census, Report #14. Prepared under Joint Statistical Agreement with the Bureau of the Census. Washington, DC: Bureau of the Census (http://www .census.gov /srdlpapers/pdf/ex90-14. pdf).
Hump}uey, D.C. (1973). Dissection and Discrimination: The Social Origins of Cadavers in America, ] 760-1915. Bulletin of the New York Academy of Medicine, 49, 819-827.
Hurh, W.M. and Kim, KC. (1982). Methodological Problems in the Study of Korean Immigrants: Conceptual, Interactional, Sampling, and Interviewer Training Difficulties. In Methodological Problems in Minority Research, ed. W.T. Lin, Chicago: Pacific/Asian American Mental Health Research Center.
Jackson, c., Henriksen, L., Dickinson, D. and Levine, D.W. (1997). The Early Use of Alcohol and Tobacco: Its Relation to Children's Competence and Parents' Behavior. AmeJican Journal of Public Health, 87,359-364.
Johnson, T.P. (1988). The Social Environment and Health. Unpublished Ph.D. dissertation. Lexington: University of Kentucky.
Johnson, T.P., O'Rourke, D., Chavez, N., Sudman, S., Wamecke, R, Lacey, L. and Horm, J. (1996). Social Cognition and Responses to Survey Questions Among Culturally Diverse Populations. In Survey Measurement and Process Quality, eds. L. Lyberg, P. Biemer, M. Collins, E. de Leeuw, C. Dippo, N. Schwarz and D. Trewin, New York: John Wiley & Sons.
Jones, E.L. (1963). The Courtesy Bias in South-East Asian Surveys. International Social Science Journal., 25, 70-75.
Jones, J.H. (1993). Bad Blood: The Tuskegee Syphilis Experiment. New York: Free Press.
7

Josephson, (1970). Resistance to Conununity Surveys. Social Problems, 18, 1 ]6-129.
Koclunan, T. (1981). Black and White: Styles in Conflict. Chicago: University of Chicago Press.
Lavrakas, PJ., Settersten, R.A and Maier, RA (1991). RDD Panel Attrition in Two Local Area Surveys. Survey Methodology, 17, 143-1 52.
Lepkowski, J.M. and Couper, M.P. (1999). Nonresponse in Longitudinal Household Surveys. Paper presented at the International Conference on Survey Nonresponse, Portland, OR.
Littlefield, R (1974). Self-Disclosure Among Negro, White and Mexican-Amelican Adolescents. Journal of Counseling Psychology, 21, 133-136.
Madans, J.H., Kleinman, J.e., Cox, e.S., Barbano, H.E., Feldman, J.J., Cohen, B., Finucane, F.F. and Cornoni-Huntley, J. (1986). 10 Years After NHANES I: Rep011 ofInitial Followup, 1982-84. Public Health Reports, 101,465-473.
Mann, L. (1980). Cross-Cultural Studies of Small Groups. In Handbook of Cross-Cultural Psychology, VoImne 5, eds. H.c. Triandis and RW. Brislin, Boston: Allyn & Bacon.
Marcus, Ae. and Telesky C.W. (1983). Non-Participation in Telephone Follow-Up Interviews. American Journal of Public Health, 73, 72-77.
Massey, D.S. and Denton, N.A (1993). American Apartheid: Segregation and the Making of the Underclass. Camblidge: Harvard University Press.
Menaghan, E.G. and Merves, E.S. (1984). Coping with Occupational Problems: The Limits oflndividual Efforts. Journal of Health and Social Behavior, 25, 406-423.

MiJler, J.G., Bersoff, D.M. and Harwood, RL. (1990). Perceptions of Social Responsibilities in India and the United States: Moral Imperatives or Personal Decisions? Joumal of Personality and Social Psychology, 58, 33-47.
Much, N.C. (1991). Determinations of Meaning: Discourse and Moral Socialization. In Thinking Through CuJtures, ed. RA Shweder, Cambridge: Harvard University Press.
Myers, V. (1979). Survey Methods and Socially Distant Respondents. Social Work Research and Abstracts, 15,3-9.
Nandi, P.K. (1982). Surveying Asian Minorities in the Middle-Sized City. In Methodological Problems in Minority Research, ed. WT Liu, Chicago: Pacific/Asian American Mental Health Research Center.
New York Times (1992). The AIDS 'Plot" Against Blacks." May 12, Pp. A22.
Ogbu, J.u. (1990). Minority Status and Literacy in Comparative Perspective. Daedalus, 119, 141-168.
Patterson, RE., Kristal, AR, White E. (1996). Do Beliefs, Knowledge, and Perceived Nonns About Diet and Cancer Predict Dietary Change? American Joumal of Public Health, 86, 1394-1400.
Robinson, J.G., Ahmed, R, Das Gupta and Woodrow, K.A (1993). Estimation of Population Coverage in the 1990 United States Census Based on Demographic Analysis. Journal of the American Statistical Association, 88, 1061-1071.
Rockwell, D.H. et al. (1 % 1). The Tuskegee Study of Untreated Syphilis: The 30th Year of Observation. Archives of Intemal Medicine, 114, 792-798.
Rommetveit, R. (1974). On Message Structure: A Framework for the Study of Language and Communication. London: John Wiley & Sons.
Q

Rowland, M.L. and Forthofer, R.N. (1993). lnvestigation ofNonresponse Bias: Hispanic Health and Nutrition Examination Survey. National Center for Health Statistics. Vital and Health Statistics 2(119).
Shettle, C. and Mooney, G. (1999). Monetary Incentives in U.S. Govemment Surveys. Joumal of Official Statistics, 15,231-250.
Singer, E., Groves, R.M. and Coming, A.D. (1999). Differential Incentives: Beliefs About Practices, Perceptions of Equity, and Effects on Survey Participation. Public Opinion Quarterly, 63, 251-260.
Singer, E., Mathiowetz, N.A. and Couper, M.P. (1993). The Impact Of Privacy and Confidentiality Concerns on Survey Participation: The Case of the 1990 U.S. Census. Public Opinion Quarterly, 57,465-482.
Smith, P.B. and Bond, M.H. (1998). Social Psychology Across Cultures, Second Edition. London: Prentice Hall Europe.
Smith, T.W. (1983). The Hidden 25 Percent: An Analysis of Nonresponse on the 1980 General Social Survey. Public Opinion Quarterly, 47, 386-404.
Stevenson, H.c. (1994). The Psychology of Sexual Racism and AIDS: An Ongoing Saga of Distrust and the "Sexual Other." Journal of Black Studies, 25, 62-80.
Sudman, S., Bradburn, N. and Schwarz, N. (1996). Thinking About Answers: TIle Application of Cognitive Processes to Survey Methodology. San Francisco: Jossey-Bass.
Terrell, F. and TeITell, S.L. (198]). An Inventory to Measure Cultural Mistrust Among Blacks. Western Joumal of Black Studies, 3, 180-185.
Thomas, S.B. and Quinn, S.c. (1991). The Tuskegee Syphilis Study, 1932-1972: Implications for HIV Education and AIDS Risk Education Programs in the Black Conununity. American Journal of Public Health, 81, 1498-1504.
10

Tourangeau, R, Shapiro, G., Kearney, A. and Ernst, L. (1997). Who Lives Here? Survey Undercoverage and Household Roster Questions. Journal of Official Statistics, 13, 1-18.
Triandis, H.C. (1994). Culture and Social Behavior. New York: McGraw-Hill.
Triandis, H.c. (1995). Individua1ism & Collectivism. Boulder, CO: Westview Press.
Triandis, H.C. (1996). The Psychological Measurement of Cultural Syndromes. American Psychologist, 51,407-415.
Tliandis, H.c., Marin, G., Hui, C.H., Lisansky, J. and Ottati, V. (1984). Role Perceptions of Hispanic Young Adults. Journal of Personality and Social Psychology, 47, 1363-1374.
Turner, P.A. (1993). I Heard it Through the Grapevine. Berkeley: University of California Press.
Van Leeuwen, R and de Leeuw, E. (1999) I Am Not Selling Anything: Experiments in Telephone Introductions. Paper presented at the International Conference on Survey Nonresponse, Portland, OR
Velasco, A. (1992). Ethnographic Evaluation of the Behavioral Causes of Undercount in the Community of Shennan Heights, San Diego, Ca1ifornia. Ethnographic Evaluation of the 1990 Census, Report #22. Prepared under Joint Statistical Agreement 89·42 with the Bureau of the Census. Washington, DC: Bureau of the Census (http://www.census.gov/srd/paperslpdfJev92·22.pdf).
Vernon, S.W., Roberts, RE. and Lee, E.S. (1984). Ethnic Status and Participation in Longitudinal Hea1th Surveys. American Journal of Epidemiology, 119,99·113.
Weisbord, RG. (1973). Birth Control and the Black American: A Matter of Genocide? Demography, 10,571-590.
11

Weinberg, E. (1971). Community Surveys with Local Talent: A Handbook. Chicago: National Opinion Research Center.
Weiss, M.S. (1977). The Research Experience in a Chinese-American Community. Journal of Social Issues, 33, 120-132.
Yu, E. (1982). Problems in Pacific/Asian American COlmnunity Research. In Methodological Problems in MinOlity Research, ed. WT Liu, Chicago: Pacific/Asian American Mental Health Research Center.
I?